Article

Performance-Based Optimization of Asphalt Mixtures for Tropical Pavement Structures: A Mechanistic and Fatigue Life Approach


by
Premier Niga Notchi Nogima
1,2,*,
Jiangmiao Yu
1,2,*,
Shadrih Charthe Jores Moya
3,
Zhi Yang
1 and
Yunan Lin
2
1
School of Civil Engineering and Transportation, South China University of Technology, Guangzhou 510641, China
2
Central Fortune Creation Technology Group Co., Ltd., Foshan 528313, China
3
School of Highway, Chang’an University, Xi’an 710064, China
*
Authors to whom correspondence should be addressed.
Buildings 2026, 16(15), 3004; https://doi.org/10.3390/buildings16153004
Submission received: 3 July 2026 / Revised: 24 July 2026 / Accepted: 25 July 2026 / Published: 29 July 2026
(This article belongs to the Section Building Materials, and Repair & Renovation)

Abstract

Durable road infrastructure in tropical regions is challenged by severe climatic conditions and heavy traffic loads. This study investigates the influence of two high-performance binders and aggregate structure on the fatigue resistance of two asphalt concrete (AC) mixtures and examines their relationship with pavement mechanical response. The experimental program includes uniaxial compression and four-point bending fatigue tests to determine dynamic modulus and fatigue performance. A predictive model for constant-strain fatigue life was developed based on fatigue test results. Mechanistic analysis was conducted for different asphalt layer thicknesses to estimate internal strains used in fatigue life prediction. The results show that the high-toughness mixture (GT-13) exhibits a 12% to 14% higher dynamic modulus at high temperatures. The maximum tensile strain occurs at the bottom of the AC layer for a thickness of 7 cm. Compared to Beton bitumineux Semi-Grenu (BBSG 0/14), GT-13 improves fatigue life by over 5.4 times and reduces damage by about 87%, extending the equivalent theoretical design life beyond 28 years, achieving the lowest composite-index-based pavement evaluation.

1. Introduction

Sub-Saharan Africa has experienced rapid population growth and urbanization over recent decades, leading to increased demand for reliable transportation infrastructure. In countries such as the Republic of the Congo, road transport dominates, accounting for over 80% of freight and passenger movement [1]. Despite significant investments in road construction, pavement durability remains a major challenge. Premature failures, including cracking, potholes, and rutting, are frequently observed within a few years after construction, leading to increased maintenance costs and reduced serviceability. One of the primary causes of early pavement deterioration is the direct application of design methods and materials developed for temperate climates, particularly those from the French SETRA (Service d’etudes techniques des routes et autoroutes) and LCPC (Laboratoire Central des Ponts et Chaussées) [2], without adaptation [3,4]. However, tropical climates differ significantly due to severe environmental conditions, including higher average temperatures, accelerating oxidative aging of binders, elevated humidity, and alternations between intense rainfall and dry periods.
Beton bitumineux Semi-Grenu (BBSG 0/14) remains one of the most widely used surface courses, and has shown limited performance, under tropical conditions. Field observations indicate that pavements designed for 20 years often fail within 3 years [5]. This performance deficit is largely attributed to increasing traffic volumes combined with environmental effects exceeding the design assumptions of standard formulations [6,7]. This discrepancy raises a key scientific issue: the mismatch between material design assumptions and actual climatic and loading conditions.
The recent literature highlights that the lack of locally calibrated models, limited long-term performance data, and insufficient pavement temperature mapping represent major barriers to optimizing asphalt mixtures for sub-Saharan climates [4,8]. In addition, studies conducted in West Africa and analogous tropical regions have shown that high temperatures and humidity variations significantly affect mixture stability, resilience, and fatigue life [4,9]. To address these challenges, several strategies have been proposed, including enhanced pavement design methods, improved construction techniques, and binder modification [10,11,12,13]. Asphalt binder modification has been demonstrated to improve viscoelastic behavior [14,15,16,17], rutting resistance [18,19,20,21], moisture susceptibility [4,22], and fatigue resistance [23,24,25,26]. Previous studies [27,28] highlight that both binder properties and aggregate structure play a crucial role in asphalt performance. However, limited research has addressed this interaction under tropical conditions.
In sub-Saharan Africa, and particularly in the Republic of the Congo, pavement design and material selection are closely influenced by the public procurement system for road infrastructure projects. Public works contracts are mainly awarded through competitive bidding procedures, where initial construction cost remains a major evaluation criterion. This cost-driven decision process encourages the selection of lower-cost and locally available materials, which may not always provide optimal performance under severe tropical climatic conditions. The limited consideration of lifecycle cost analysis and long-term pavement performance further restricts the adoption of high-performance materials with potential durability benefits.
To address these limitations, this study adopts a performance-based, mechanistic pavement evaluation framework that incorporates key phases, including fatigue life estimation and composite index, integrating both economic and technical factors into a single metric, to assess the long-term behavior of two mixtures. A conventional BBSG 0/14 and a high-toughness (GT-13) asphalt mixture were evaluated using an SBS-modified PG76-22 and a high-viscosity and high-elasticity PG94 modified binder.
The experimental program included determination of the optimum binder content (OBC), dynamic modulus testing, and four-point bending fatigue testing. In addition to experimental characterization, fatigue performance was further analyzed through predictive modeling. Based on the results obtained from four-point bending fatigue results, a fatigue life prediction model was developed by modifying the constant-strain fatigue model originally proposed by the Road Engineering Research Institute of South China University of Technology using conventional bitumen. To link laboratory results to field performance, the mechanical properties were incorporated into pavement simulations using the multilayer elastic program Alizé-LCPC (Laboratoire Central des Ponts et Chaussées). A case-study analysis was conducted on the RN2 national road in the Republic of the Congo, a critical piece of infrastructure supporting domestic freight logistics and regional economic integration. The pavement structure analysis incorporated variations in key input parameters, including real traffic, climatic conditions, pavement composition, and material properties. Finally, the fatigue life performance was predicted based on the critical horizontal strain at the bottom of the bituminous layer.
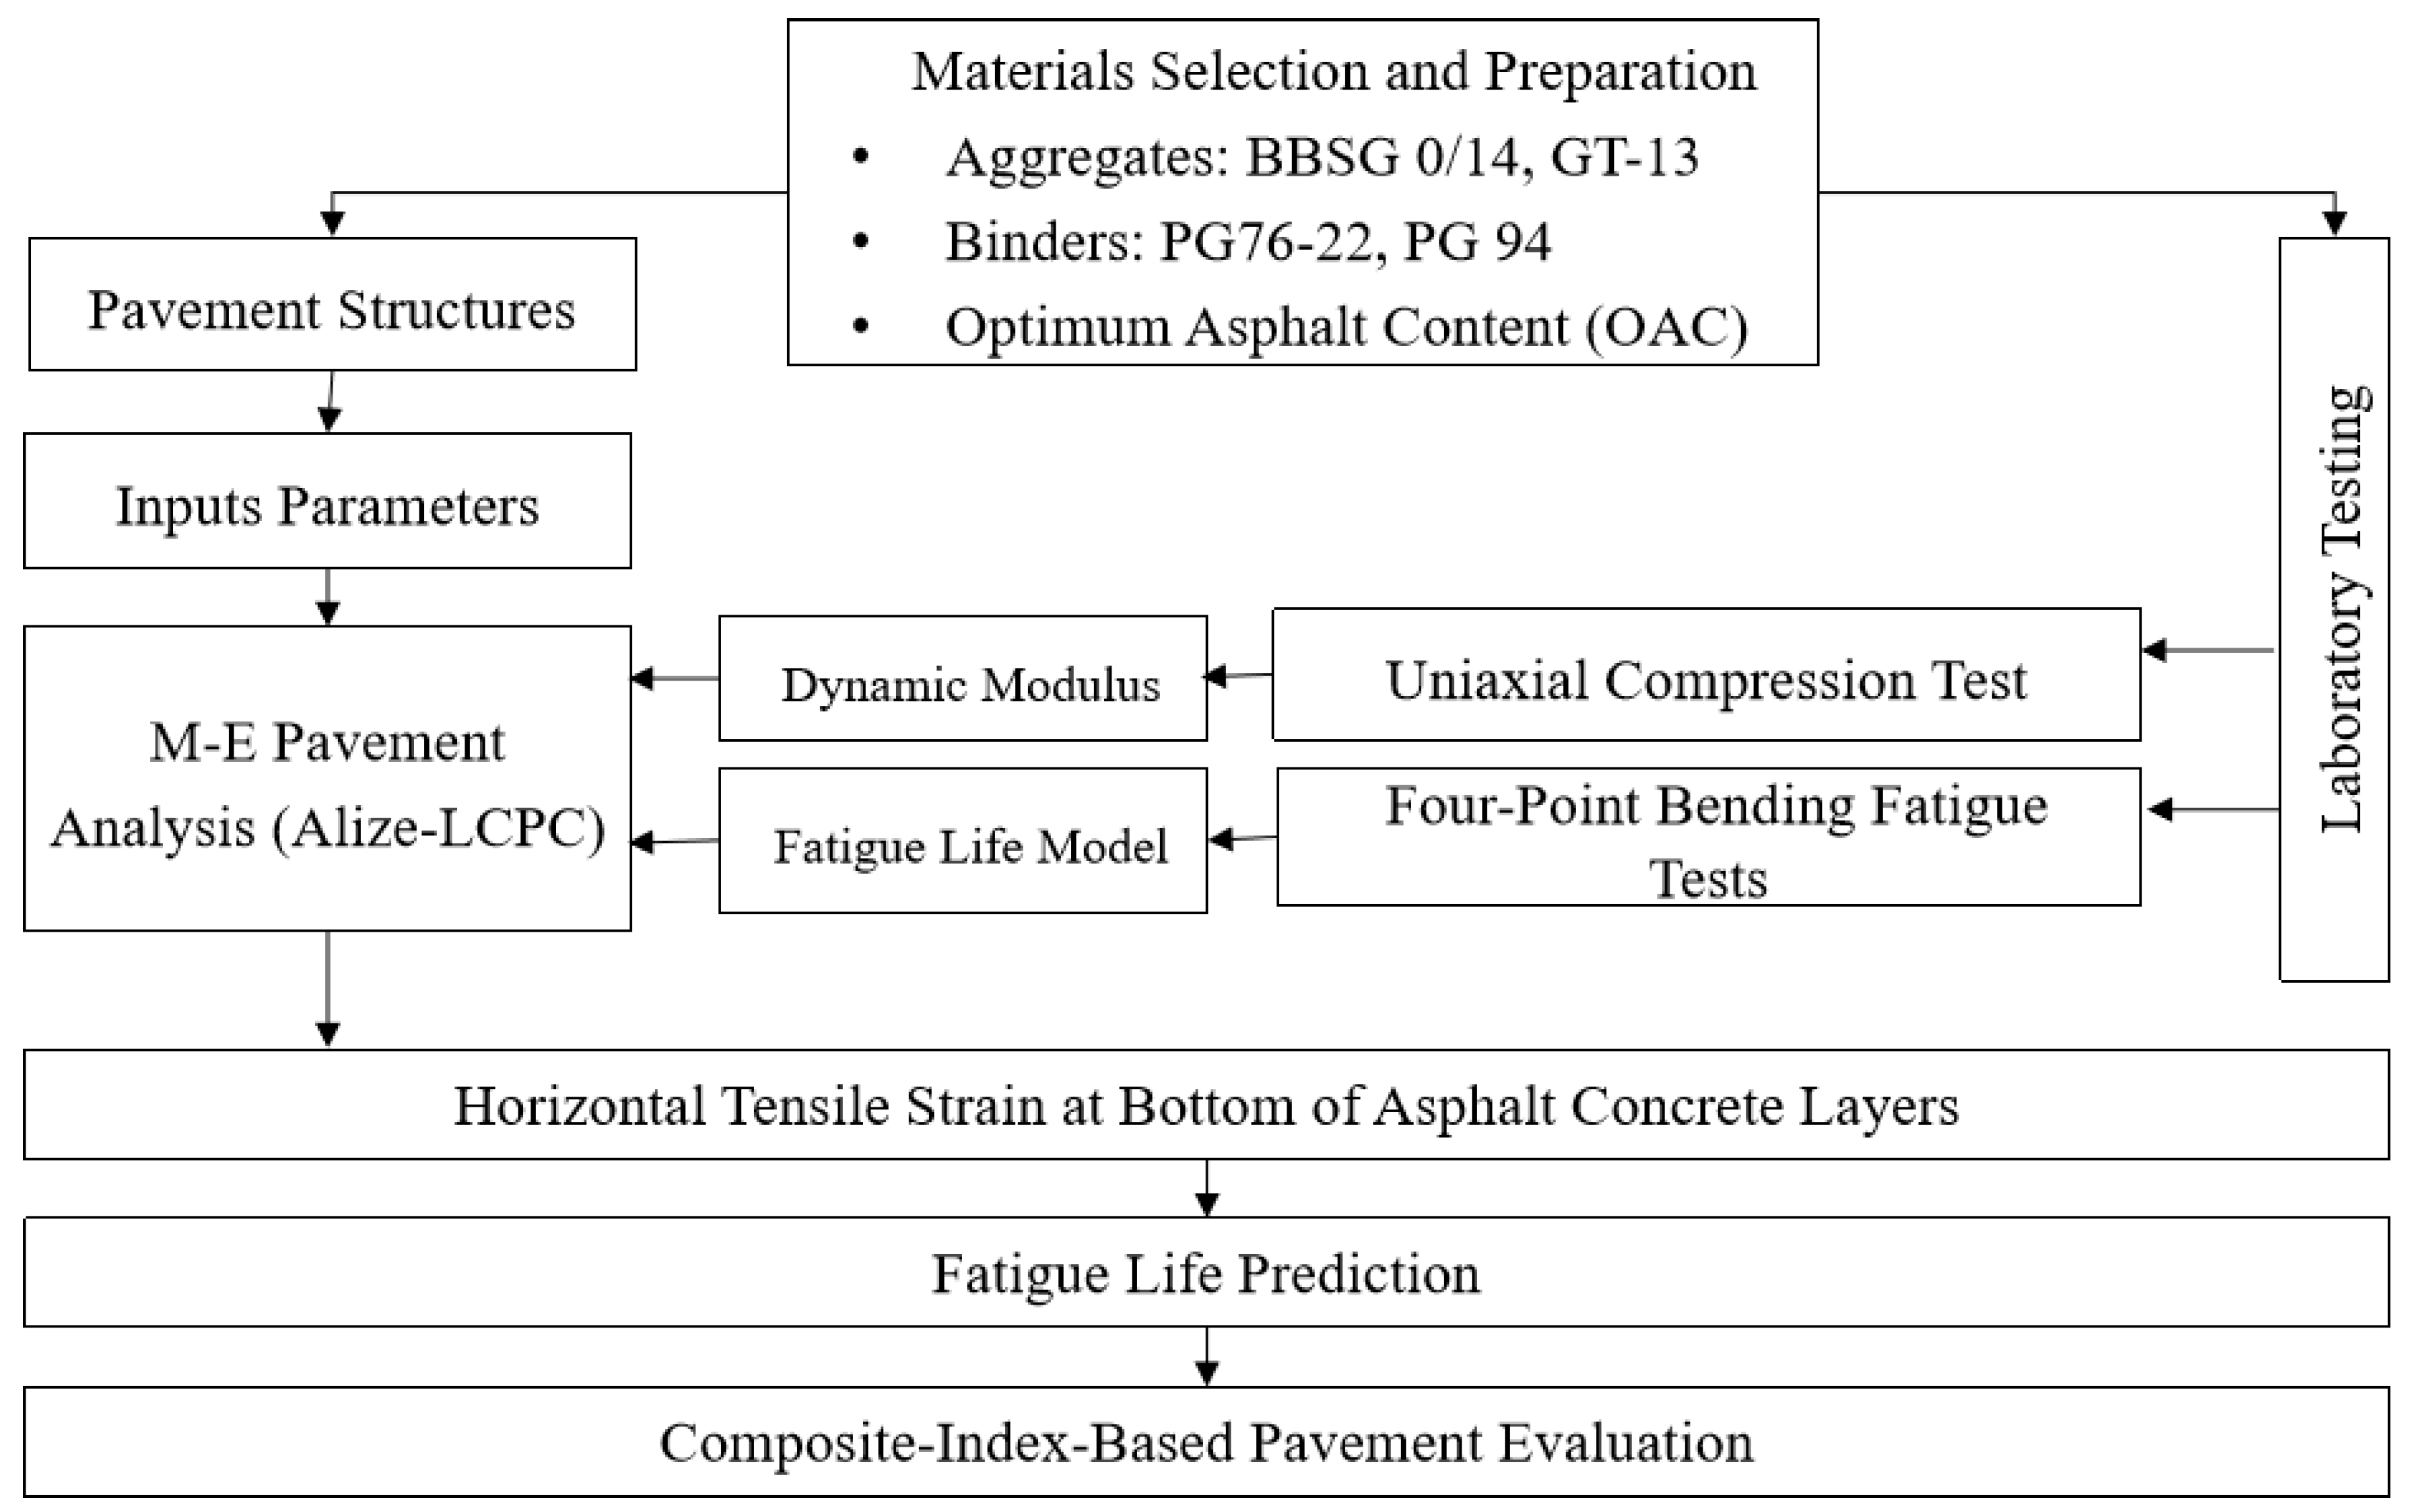
Therefore, the main objective of this study is to optimize asphalt surface courses for tropical climates based on performance criteria. Specifically, it aims to (1) compare BBSG 0/14 and GT-13 mixtures; (2) evaluate the effects of PG76-22, PG94, and aggregate structure in the performance of asphalt mixtures; (3) establish relationships between mechanical properties and pavement response with respect to fatigue life performance; and (4) consider economic aspects, including the use of composite indices (CLR—Cost-Life Ratio; MEI—Material Efficiency Index) for pavement performance evaluation. Figure 1 illustrates the methodology algorithm. The results are intended to support the adaptation and optimization of asphalt mixtures for sustainable road infrastructure in the Republic of the Congo and similar regions.

2. Materials and Methods

2.1. Row Materials and Gradation Design

2.1.1. Aggregates and Mineral Fillers

The aggregate gradation comprised limestone fractions of 0–3 mm, 5–10 mm, and 10–15 mm sourced from Qisheng Quarry (Wuzhou, Guangxi, China). The filler was limestone powder produced by Quanfa Stone Factory (Foshan, Guangdong, China). The limestone materials demonstrated stable physical properties and superior asphalt adhesion characteristics, contributing to enhanced performance of the asphalt mixtures. Notably, similar limestone resources are abundantly available in the Republic of the Congo, suggesting excellent suitability for local pavement applications with significant economic advantages. The technical properties of the aggregates and powder are shown in Table 1, Table 2 and Table 3. The specifications were met for all data [29].

2.1.2. Modified Asphalt Binders

The Shell SBS (Styrene-Butadiene-Styrene)-modified asphalt PG76-22 binder was supplied by Guangdong Xinyue Asphalt Co., Ltd. (Guangzhou, China), while the PG94 high-viscosity and high-elasticity modified asphalt binder was provided by Central Fortune Creation Technology Group Co., Ltd. (Foshan, China). The technical properties of both asphalt binders are presented in Table 4. The specifications for pavement asphalt binders were met for all data [30,31].

2.1.3. GT-13 Gradation Design

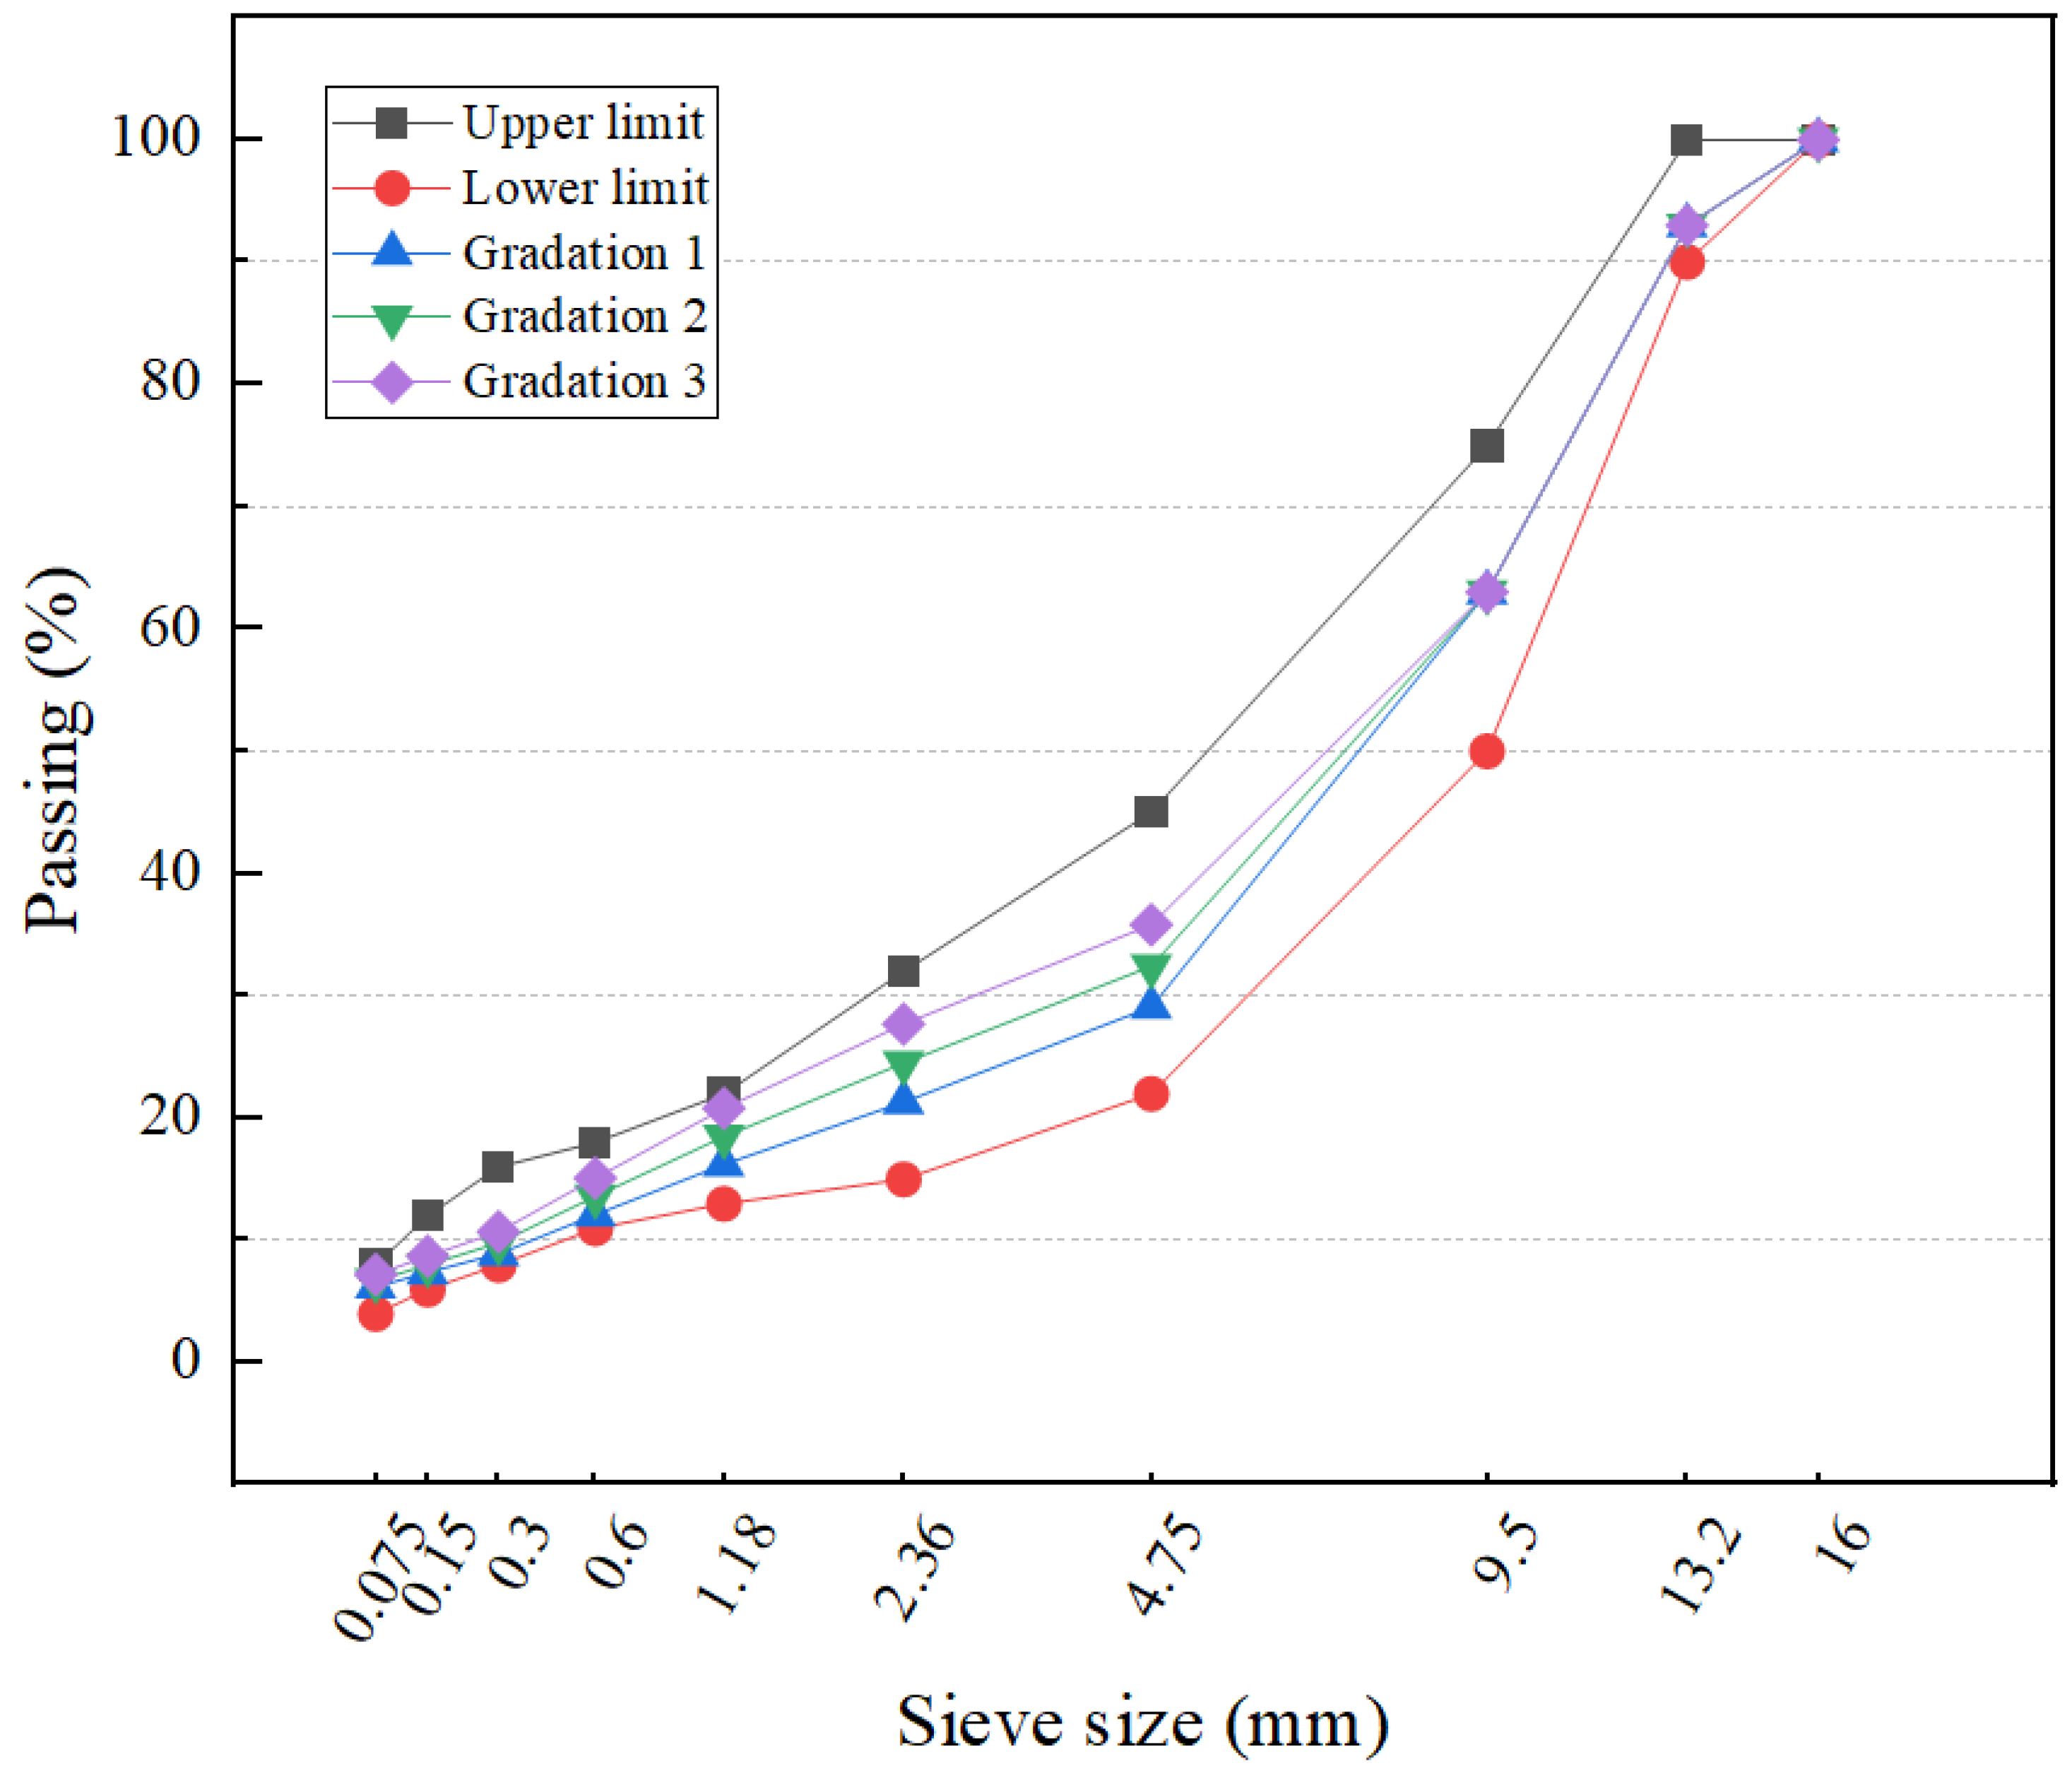
According to the GT-13 gradation limits specified for high-toughness asphalt wearing courses [31,32], with 4.75 mm selected as the key sieve for coarse aggregate skeleton structure, three initial gradation variants with varying coarseness were designed by adjusting the mineral aggregate proportions. The passing rates of the key sieve for all three gradations were controlled within ±3% of the median value in the specification range. Through computational analysis and gradation curve optimization, the blended gradations and individual fraction contents of coarse/fine aggregates were determined as shown in Figure 2.
The percentage voids in the coarse aggregate skeleton (VCADRC) of each gradation were measured according to the rodded bulk density test [29]. A cylindrical measure was horizontally positioned on a laboratory bench. Samples were introduced in three equal layers, each rodded 25 times from edges to center. The percentage voids in the coarse aggregate of asphalt mixture (VCAmix) were measured as described in [30]. Four Marshall specimens were prepared for each gradation, as described in [33]. The PG94 asphalt binder was preheated to 185–195 °C for 3–5 h, while aggregates were heated to 195 °C for 4 h or more prior to mixing. The mixture was prepared at 195 ± 5 °C and compacted with 75 blows on each side, with an initial asphalt binder content of 6.0%. Specimens’ bulk specific gravity (BSG) and theoretical maximum specific gravity [33] were used to derive volumetric parameters, such as air voids (AV), voids in mineral aggregate (VMA), and voids filled with asphalt (VFA). Marshall Stability (MS) and flow value (FV) were determined as described in [33]. The test results are detailed in Table 5.
As shown in Table 5, Gradations 1 and 2 satisfied the VCAmix < VCADRC criterion [30], while Gradation 3 failed (VCAmix > VCADRC). Gradation 1 and Gradation 2 exhibited acceptable aggregate skeleton characteristics, with VCAmix values of 40.1% and 42.2%, respectively. However, Gradation 1 presented a lower VCAmix and a higher VCADRC (43.03%) compared with Gradation 2 (42.68%), indicating a more favorable aggregate skeleton. In addition, Gradation 1 achieved an appropriate air void content (AV = 3.5%) and a higher VMA (15.4%), compared with Gradation 2 (AV = 2.1% and VMA = 14.2%). The higher VMA of Gradation 1 provides more available space for binder accommodation, which is beneficial for maintaining adequate binder coverage and mixture durability under hot tropical conditions. Meanwhile, the slightly higher air void content ensures sufficient internal structure without excessive densification. Therefore, considering the combined effects of aggregate skeleton characteristics and volumetric properties, Gradation 1 was selected as the final GT-13 gradation design. Aggregate fractions and gradation limits are provided in Table 6.

2.1.4. BBSG 0/14 Gradation Design

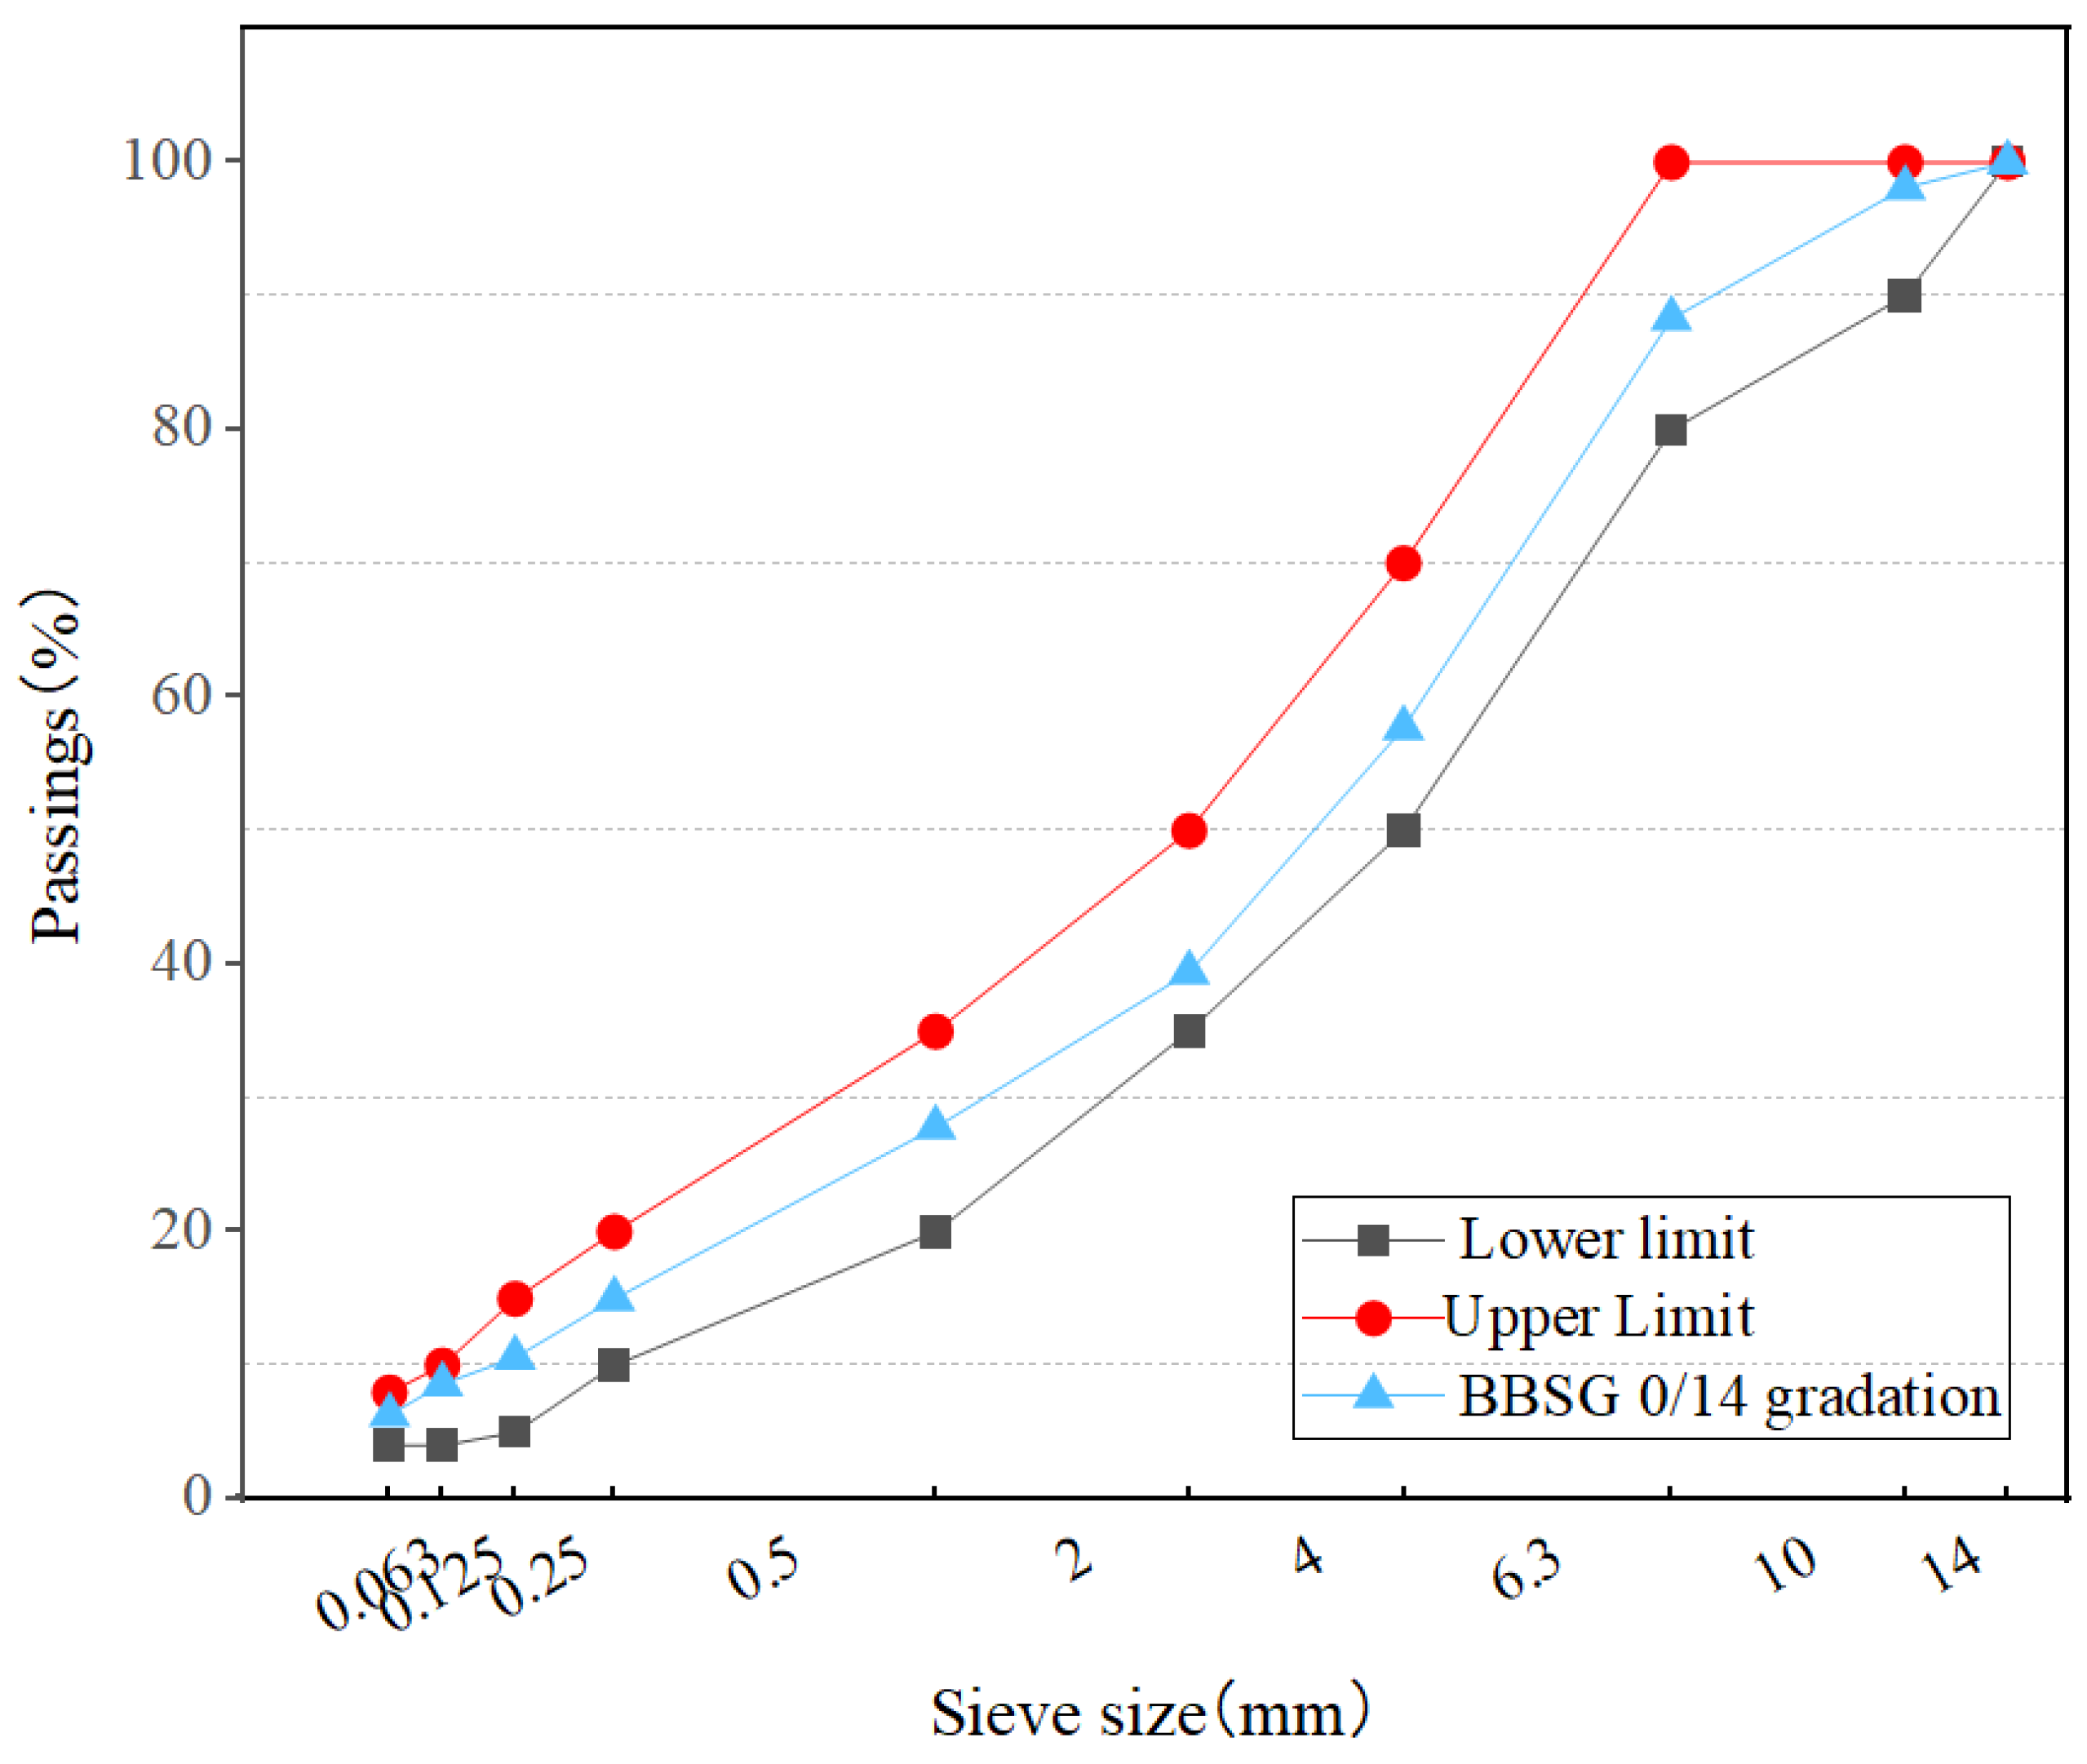
The BBSG 0/14 mixture was designed in compliance with [34,35], with target stiffness values of E ≥ 7000 MPa (15 °C, 10 Hz) and E ≥ 2400 MPa (28 °C, 10 Hz) [36]. The blended aggregate gradation conformed to the sieve limits specified in [34]. The grading curve and envelope are presented in Figure 3, while the proportions of aggregate fractions and the corresponding gradation limits are detailed in Table 7.

2.1.5. Optimum Binder Content

The optimum binder content (OBC) for GT-13 was determined using Marshall testing, while the BBSG 0/14 mix employed the richness coefficient method.
  • Marshall Test Method
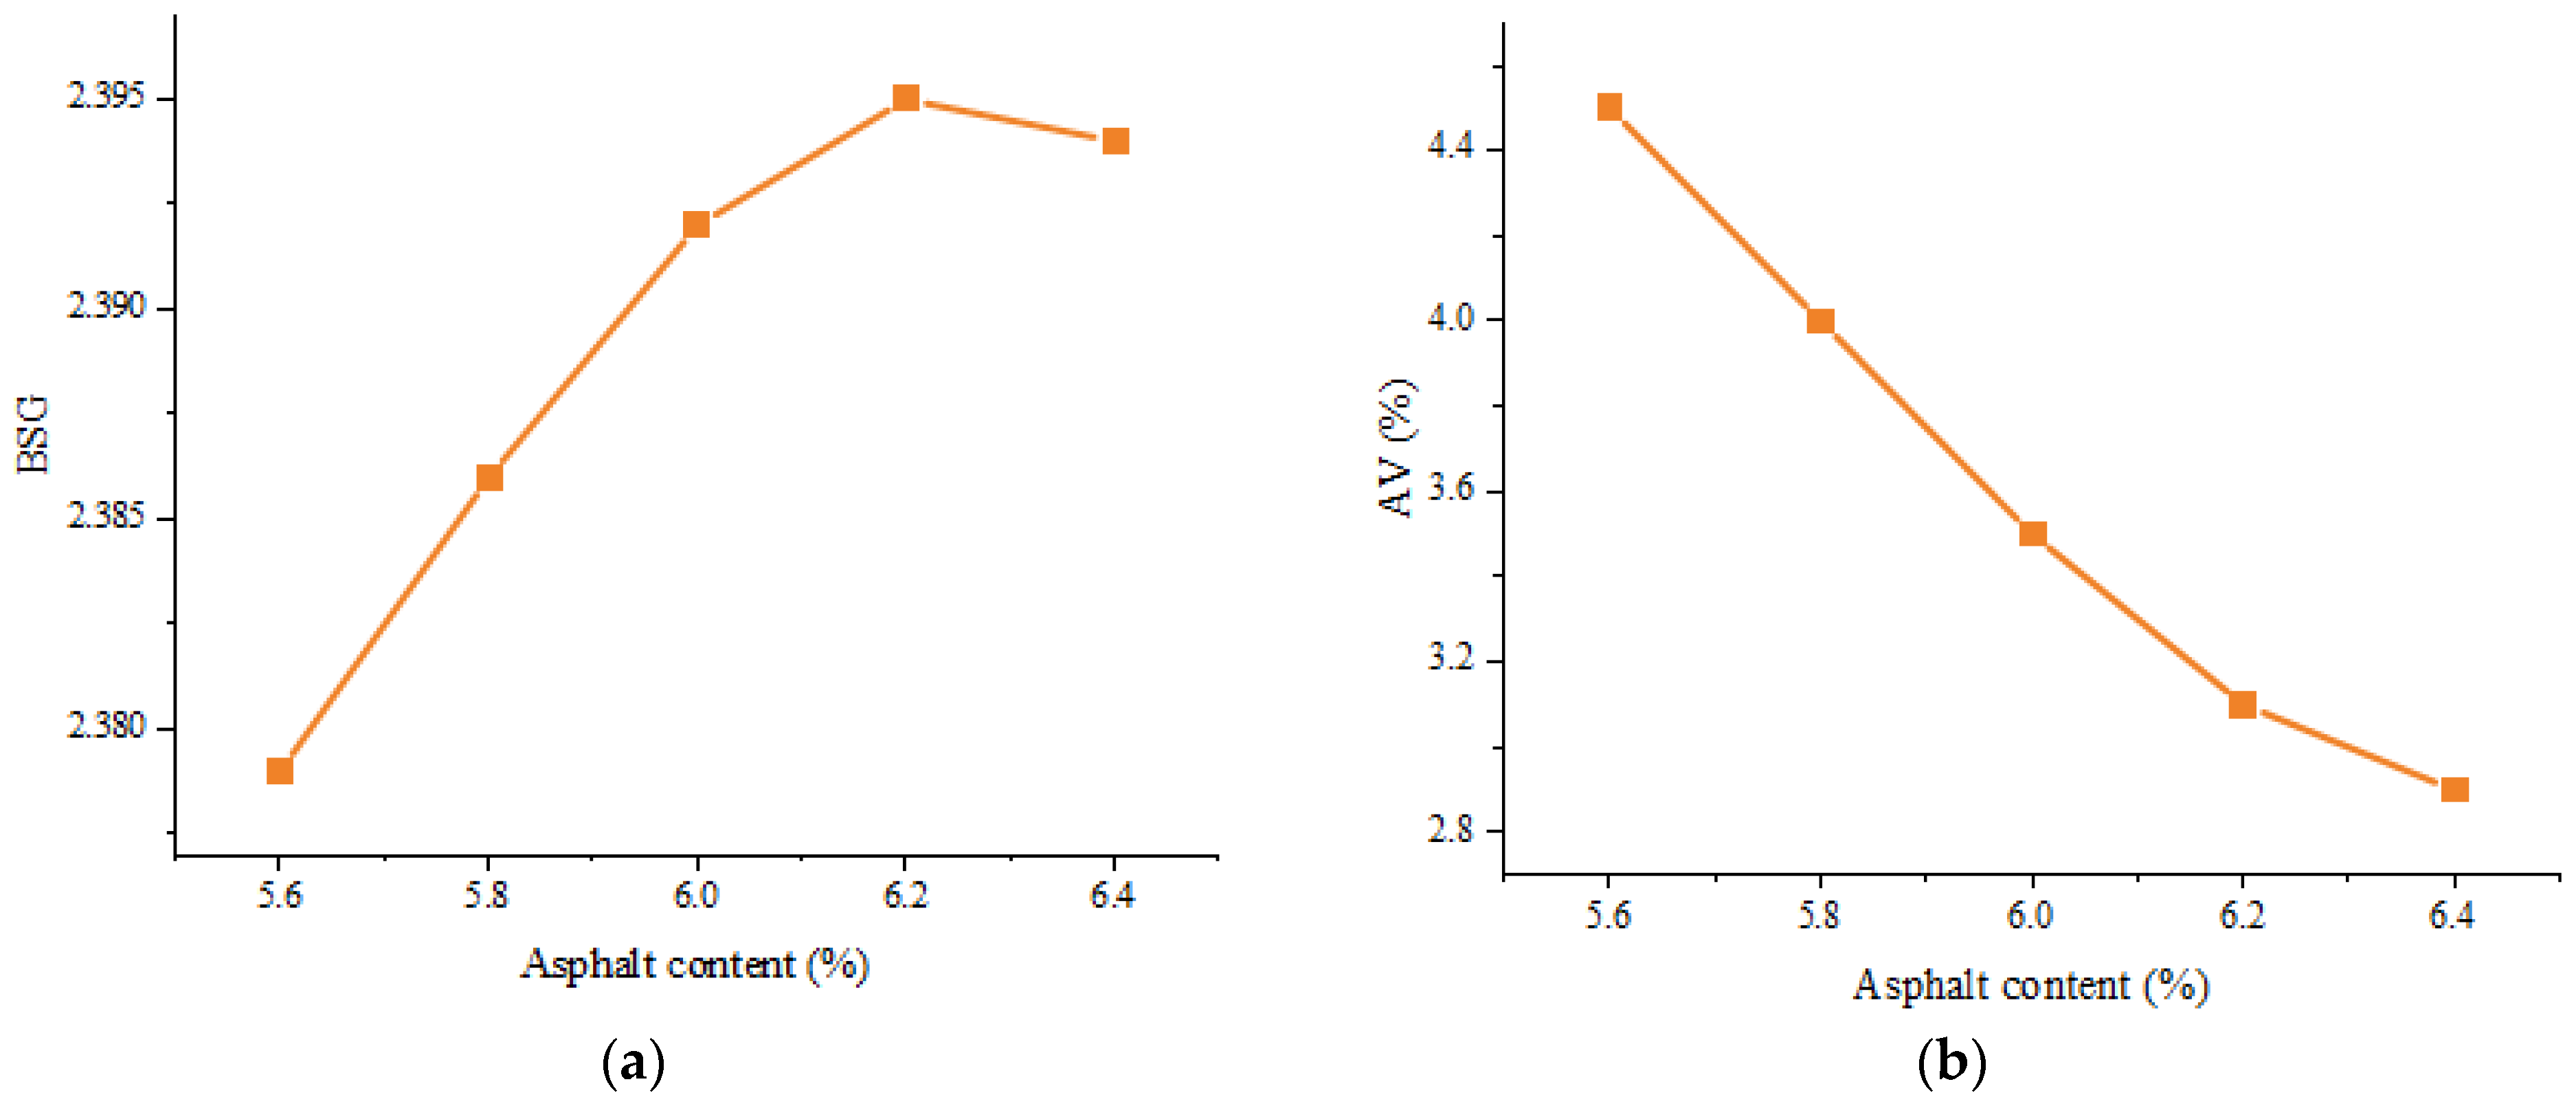
Following the GT-13 gradation design, four replicate Marshall specimens were fabricated at each of five asphalt content (PG94) levels, which were varied at increments of 0.2%. The PG94 was preheated to 185–195 °C for 3–5 h, while aggregates were heated to 195 °C for 4 h or more prior to mixing. The mixture was prepared at 195 ± 5 °C, and a total of 20 Marshall specimens were compacted with 75 blows on each side. The BSG of the specimens was determined by using the saturated-surface-dry (SSD) method [33], while the theoretical maximum specific gravity was empirically calculated. The experimental results are summarized in Table 8.
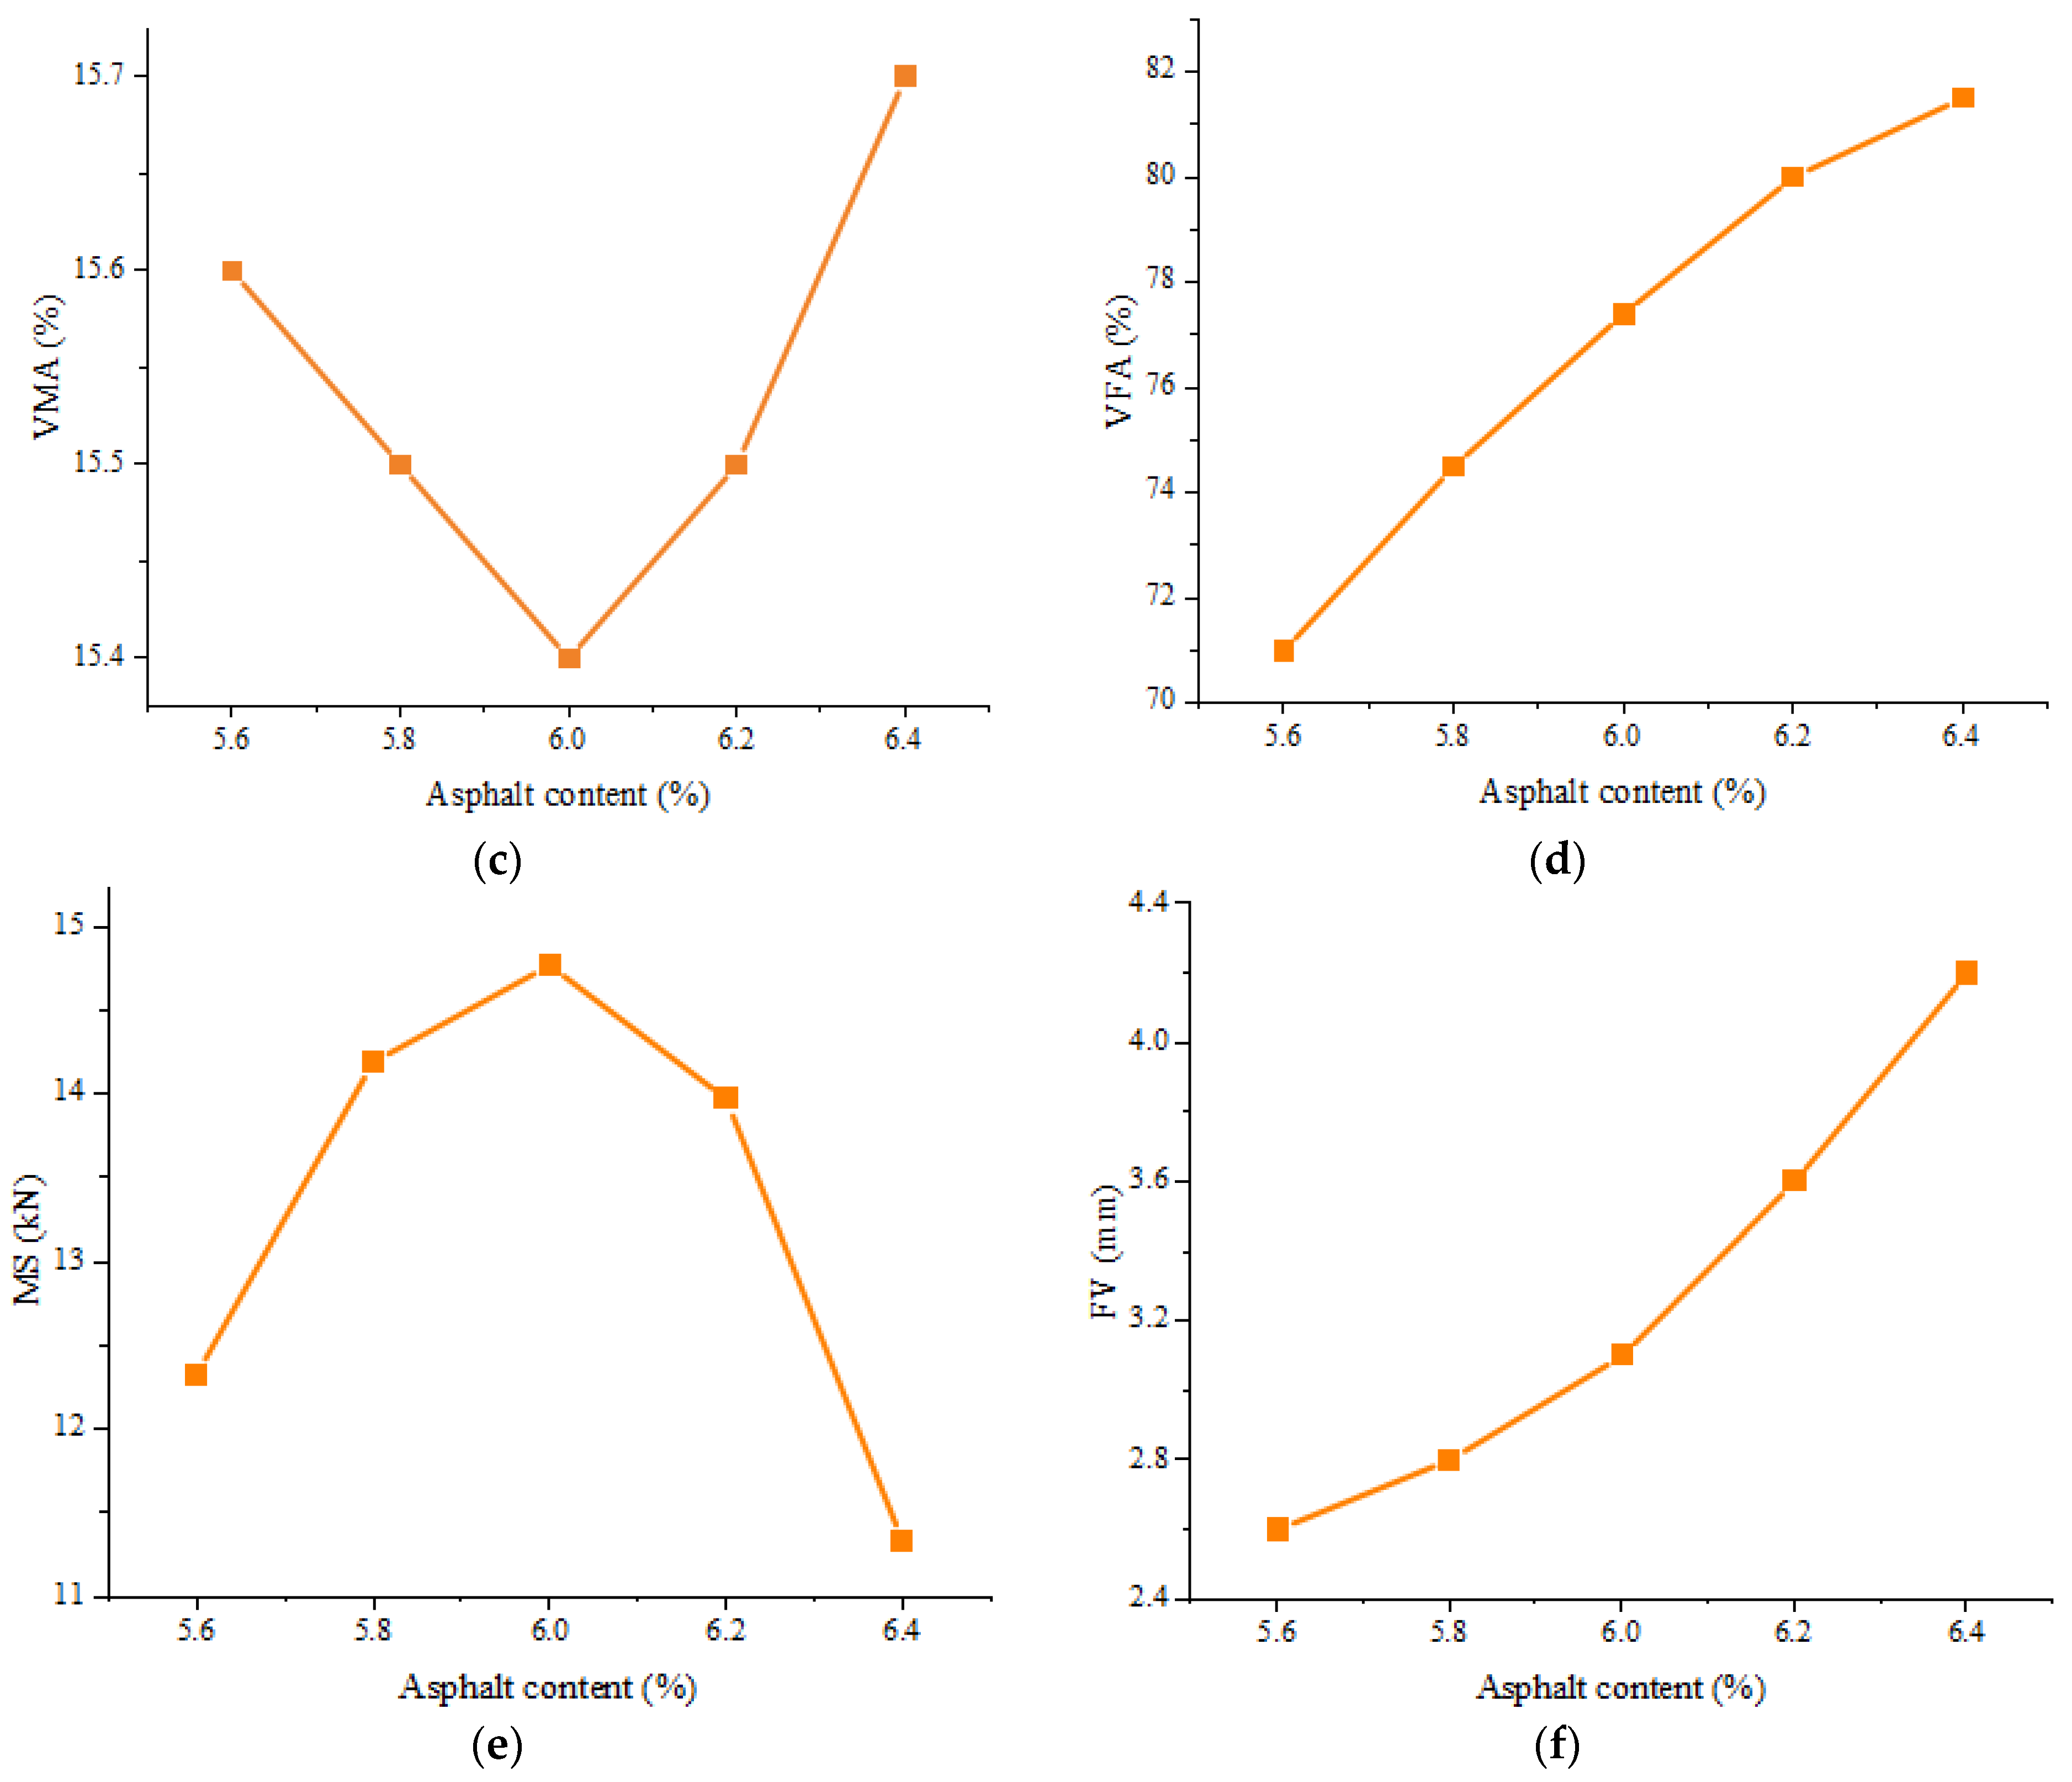
The Marshall test parameters were analyzed as functions of asphalt content, with their respective values plotted on the ordinate against the asphalt content on the abscissa, as presented in Figure 4.
Based on the curve trends and comprehensive analysis of characteristic parameter values against technical specifications [30], the OBC for the PG94 + GT-13 mixture was determined to be 5.9%.
2.
Richness coefficient method
The blended gradation curve of BBSG 0/14 was used to determine the key sieve-passing rates required by the richness coefficient method (Equation (1)), with the minimum richness coefficient value then applied to calculate the initial asphalt content.
K = T L e x t α 5
= 0.25 G + 2.3 S + 12 s + 150 f 100
where K is the richness coefficient; TLext is the asphalt content; α = 2.65 ρ G is the aggregate density correlation factor; Σ is the specific surface area, expressed in square meters per kilogram, determined by Equation (2); G = 42.3% is the coarse aggregate proportion (>6.3 mm); S = 47.1% is intermediate aggregate proportion (6.3–0.25 mm); s = 4.3% is the fine aggregate proportion (0.25–0.063 mm); f = 6.3% is the filler proportion (<0.063 mm); and ρ G is the specific gravity of the aggregate.
The initial target asphalt content of 5.29% was calculated using the richness coefficient (K = 3.3), as described in [34]. This standard requires validating this content with a Superpave Gyratory Compactor (SGC) at 80 gyrations to achieve a mix with 4–9% air voids. The OBC is defined as the value that best satisfies these air void requirements. The BBSG 0/14 was produced with three different bitumen contents: 5.3%, 5.6%, and 5.9%. The PG94 asphalt binder was preheated to 185–195 °C for 3–5 h, while aggregates were heated to 195 °C for 4 h or more prior to mixing. The specimens of 150 mm × 60 mm were prepared at 195 ± 5 °C and compacted with 80 gyrations. The mixture’s maximum density and air void content were determined as described in [37,38], respectively. A linear regression analysis of the relationship between asphalt content and air voids was performed to determine the OBC. The obtained OBC was 5.57%, corresponding to the target air void content of 5% for the BBSG 0/14 mixture.

2.2. Methods

2.2.1. Uniaxial Compression Testing

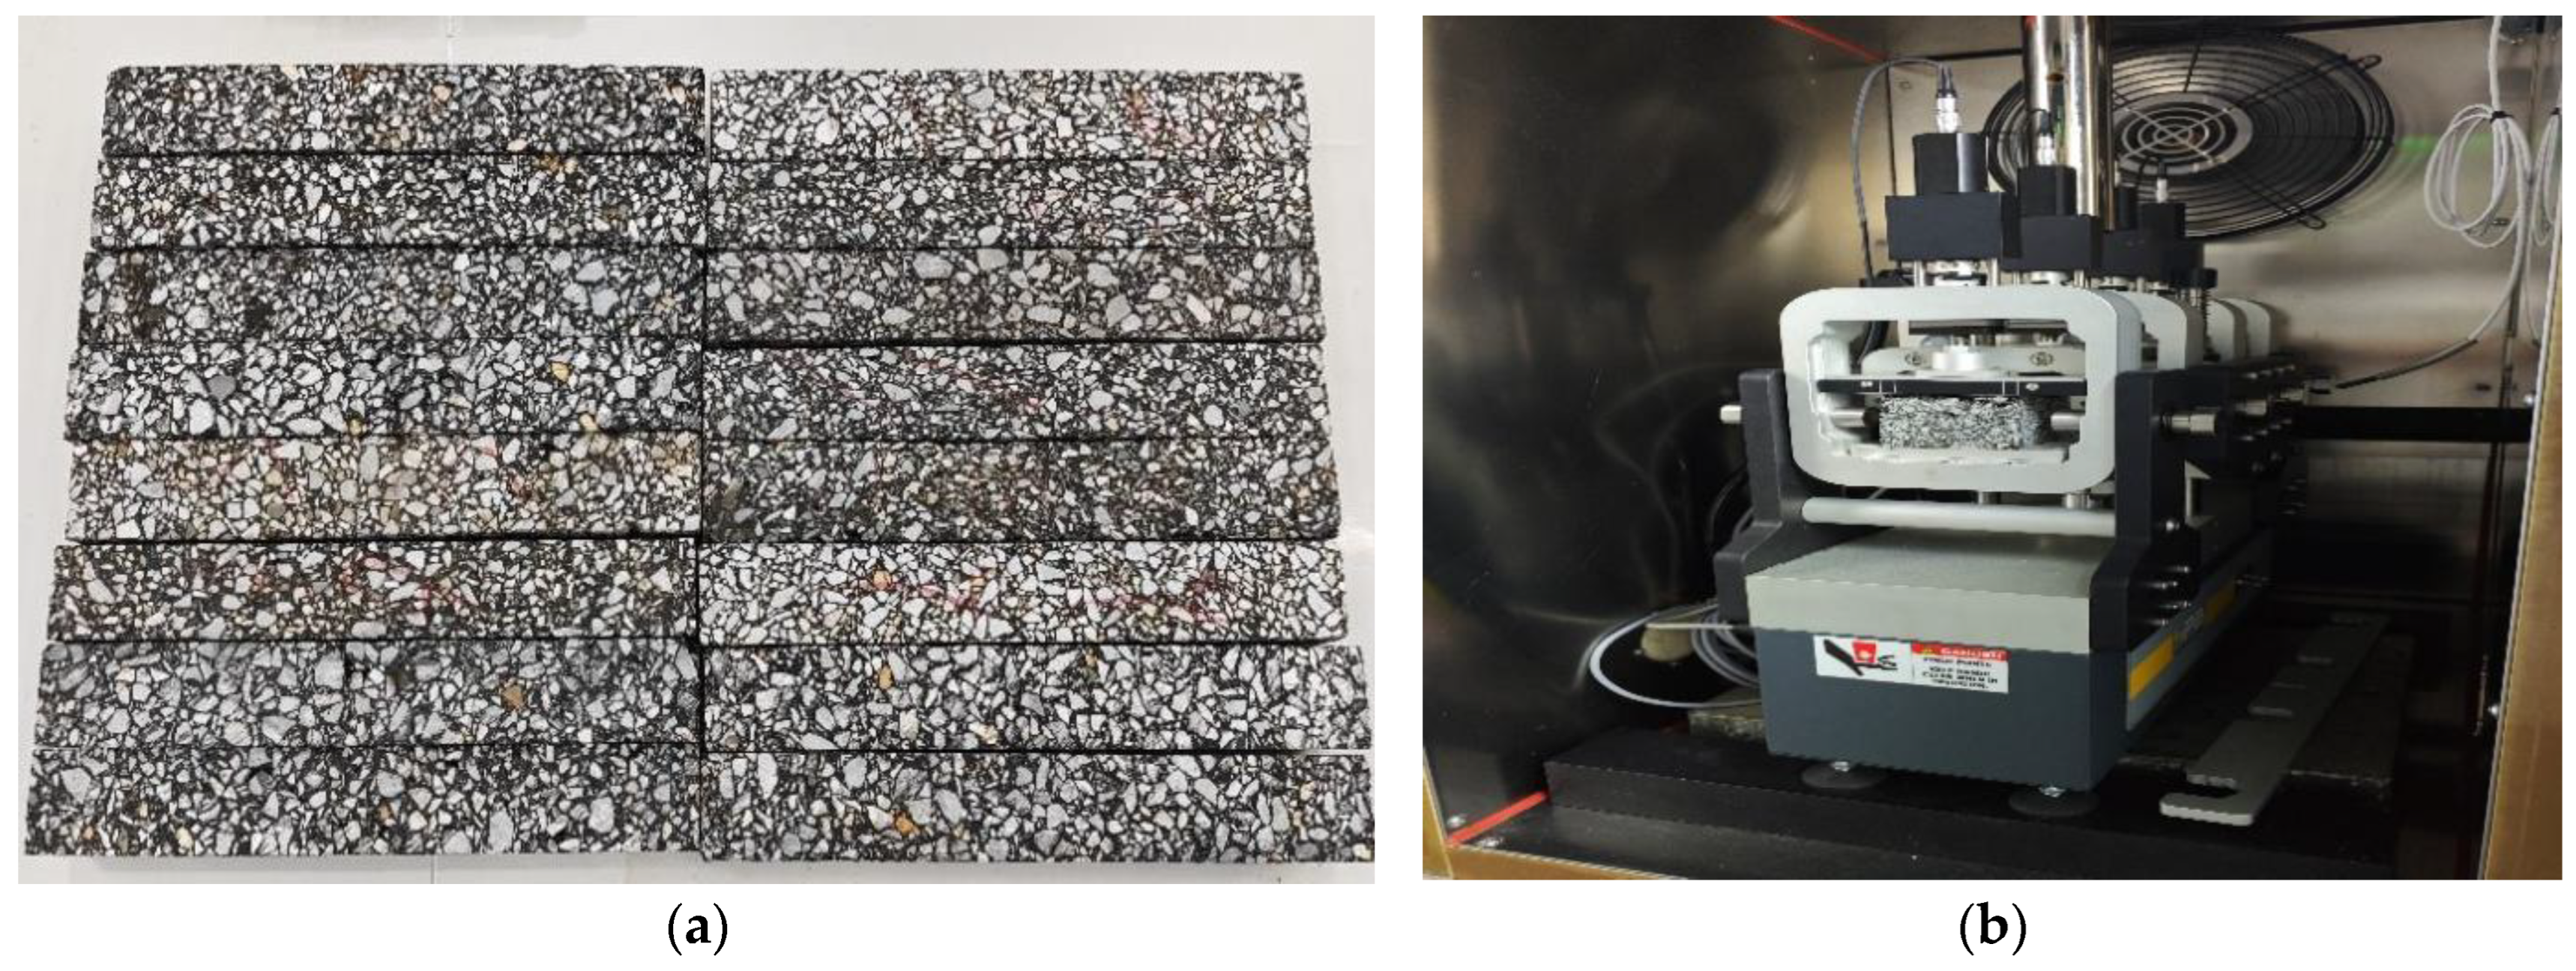
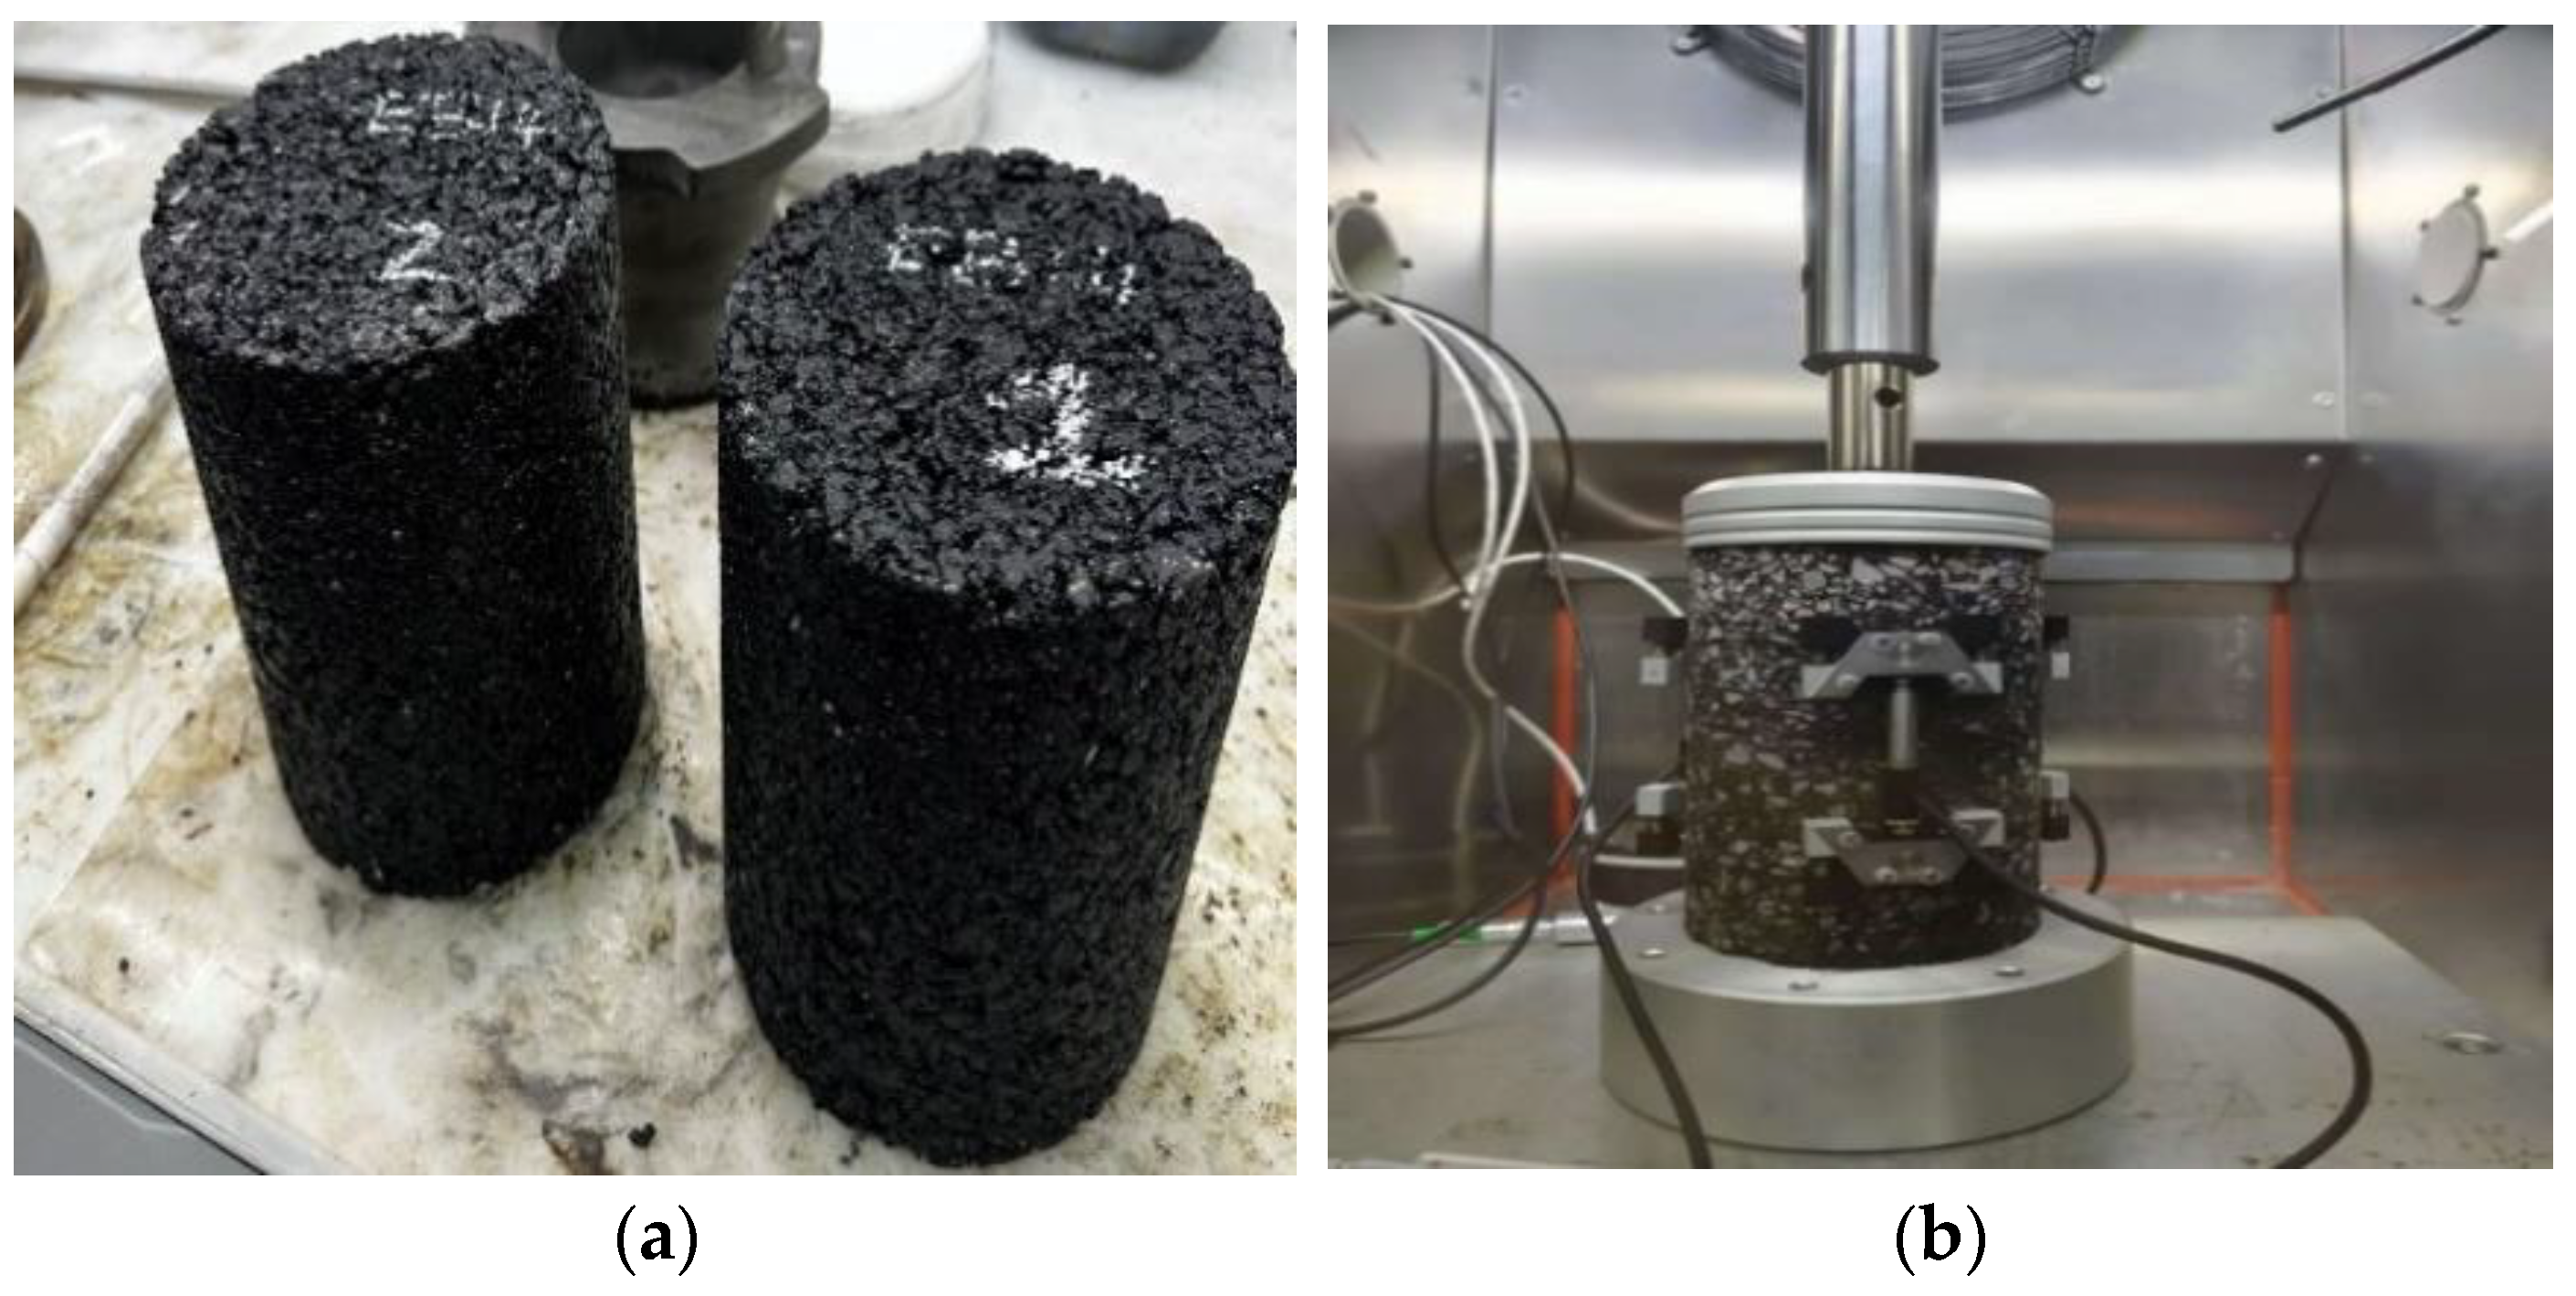
The dynamic modulus (E) was determined in accordance with [39], using uniaxial compression testing on cylindrical specimens with OBC. Initial 150 × 170 mm specimens were compacted via SGC and cored to 100 × 150 mm dimensions for subsequent testing. Twelve (12) specimens were tested under the same previous conditions: three specimens per mixture and temperature were tested using the Universal Testing Machine (UTM-130). The average of the three results was used as the final value. The tests were conducted at three temperatures (15 °C, 20 °C, and 28 °C) under 10 Hz and 25 Hz loading frequencies. The dynamic modulus of all specimens was determined according to Equation (3). Figure 5 shows the compacted specimens during the uniaxial compression test.
E * ω = σ * ε *
where
E * ω is the dynamic modulus for frequency ω (MPa);
σ * is the stress magnitude (kPa);
ε * is the average strain magnitude.

2.2.2. Four-Point Bending Fatigue Tests

This study employed four-point bending fatigue tests [40] conducted on precisely dimensioned asphalt beams (380 × 50 × 63 mm) to determine fatigue life (Nf50) under simulated service conditions. Seventy-two (72) valid beams were tested under the fatigue loading conditions. Three replicate beams were prepared for each combination of mixture type, binder type, strain level, and temperature condition, and the average value of the three replicates was used as the representative fatigue life. The fatigue tests were conducted at five strain levels (300, 400, 500, 800, and 1000 με), with temperature conditions selected according to the loading severity: 300 με and 400 με were tested at 10 °C and 15 °C, respectively; 500 με was evaluated at both 20 °C and 28 °C; 800 με and 1000 με were tested at 28 °C. All fatigue tests were performed at a loading frequency of 25 Hz. This frequency, although higher than typical traffic-induced loading frequencies, was selected according to the standardized testing procedures specified in [35,36]. The use of this standardized frequency ensures consistency with pavement material characterization procedures, improves test reproducibility, and enables direct comparison of fatigue performance between the two mixtures under identical laboratory conditions. Figure 6 shows the beam specimens and the four-point bending fatigue test.

2.2.3. Fatigue Life Prediction Approach

The fatigue life (Nf) was predicted using constant-strain fatigue models established from the experimental results of high-performance asphalt mixtures. The following calculation was used to evaluate the fatigue damage (D) sustained by the surface layer. In this approach, the cumulative number of heavy goods vehicles (NPL) over the design life was converted into an equivalent number of reference axle loads (NE) using the average traffic aggressiveness coefficient (CAM), according to Equation (4) [35]. The fatigue damage was then calculated as the ratio between NE and Nf, as expressed in Equation (5).
N E = N P L × C A M
For this case, the CAM for bituminous materials is equal to 0.8, while for subgrade it is equal to 1 [35].
D = N E N f

2.2.4. Composite-Index-Based Pavement Evaluation

Beyond technical considerations, economic factors are equally critical to the comprehensive assessment. The evaluation employed two composite indices to integrate economic and technical factors into a single metric: The first is the Cost-Life Ratio (CLR), relating construction cost to service life (Equation (6)). The second is the Material Efficiency Index (MEI), which incorporates service life, construction cost, and the volume of imported material via layer thickness (Hm) (Equation (7)) [41].
C L R = C o n s t r u c t i o n   C o s t X A F / m 2 S e r v i c e   L i f e N f
Here, XAF (ISO 4217) denotes the Franc of Financial Cooperation in Central Africa.
A lower CLR points to a more cost-effective pavement option. This indicator reflects material usage indirectly, since the cost of materials is a component of the total construction cost.
M E I = C o n s t r u c t i o n   C o s t X A F / m 2 × L a y e r   T h i c k n e s s m S e r v i c e   L i f e N f
The MEI unit is XAF/m2/Nf, representing the combined cost and material requirements of each Nf. A lower MEI value signifies a more favorable balance among cost, material use, and lifetime for a given pavement configuration.
To fulfill the objectives of this study, the cost information from the Congolese Road Maintenance Authority (DGER) was utilized.

3. Results and Discussion

3.1. Dynamic Modulus

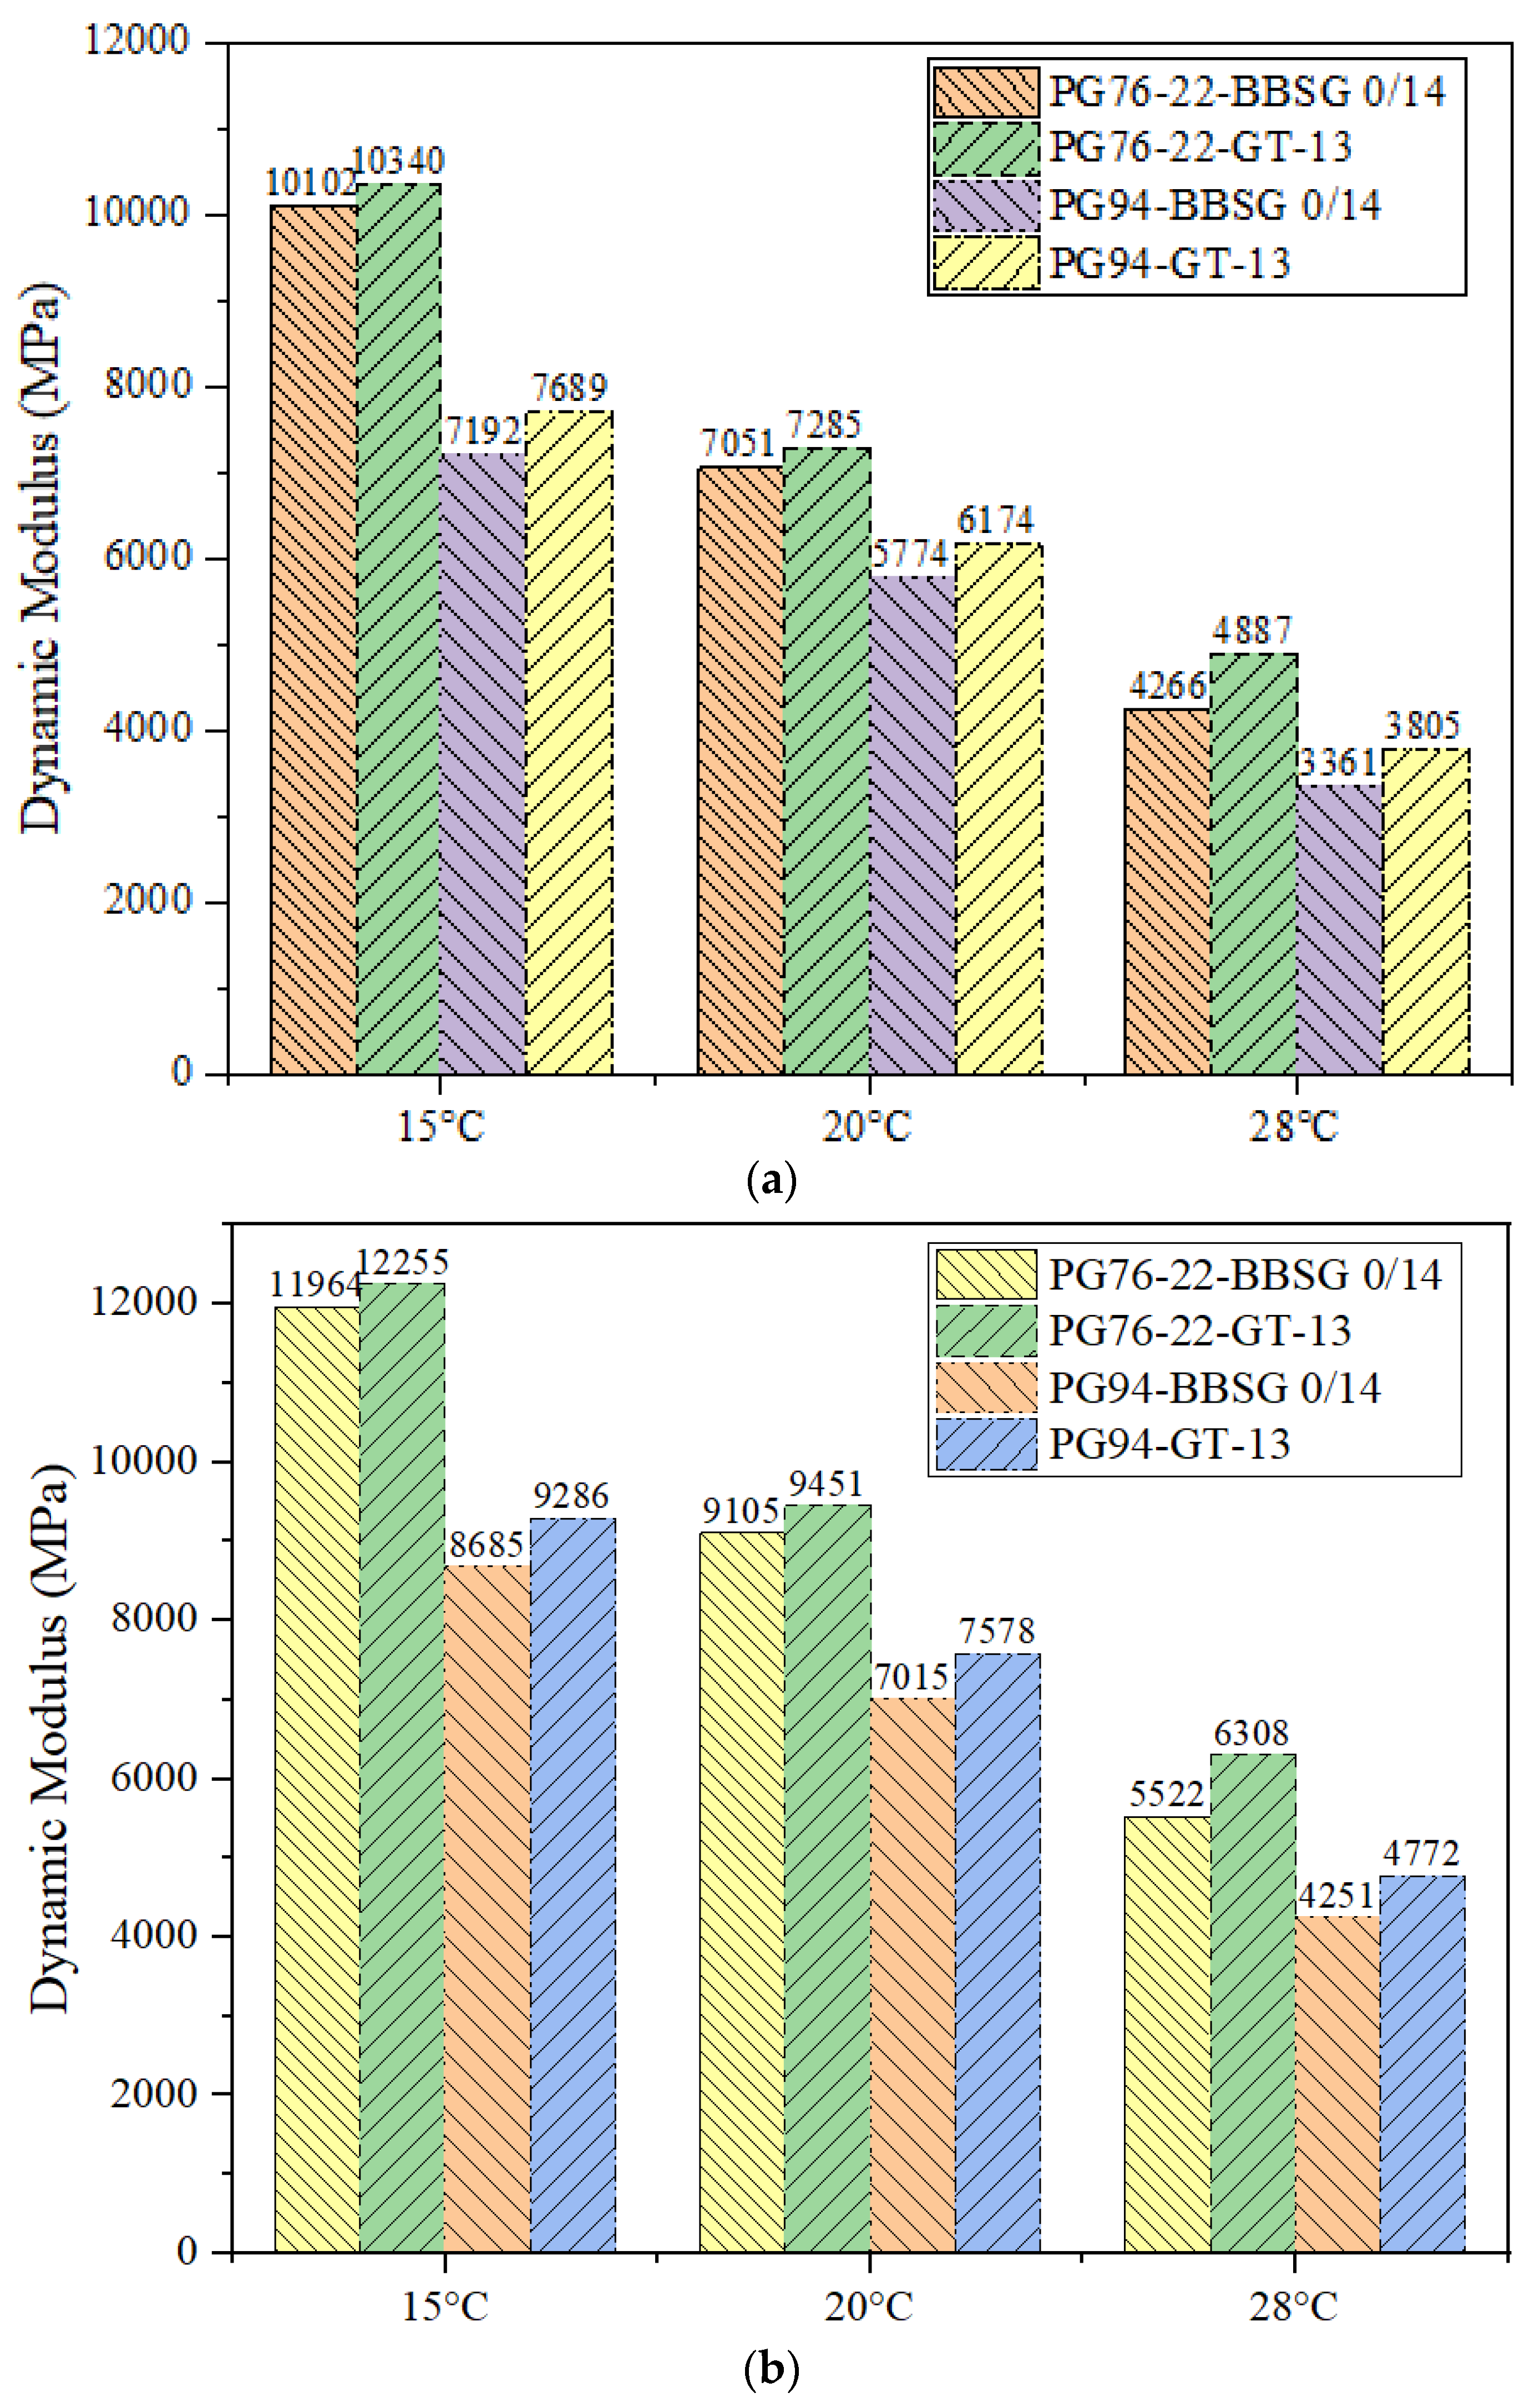
Dynamic modulus (E) test results are presented in Table 9. The comparison of E values at three testing temperatures for all of the mixes is also presented in Figure 7. The dynamic modulus of the four asphalt concrete (AC) mixtures significantly reduced with increasing temperature. This indicates the adverse effects of temperature on AC mixtures. As the temperature increases, the asphalt binder softens, resulting in a decrease in the E values of the mixtures. Compared to mixtures made with PG76-22, the mixture with PG94 had the lowest stiffness value across all testing temperatures. At each test temperature and loading frequency, GT-13 had the highest elastic modulus value among the two asphalt binders compared to BBSG 0/14. When formulated with PG76-22, GT-13 showed dynamic modulus increases of 2.4%, 3.3%, and 14.6% at 15 °C, 20 °C, and 28 °C, respectively, at 10 Hz; at 25 Hz, the increases were 2.43%, 3.8%, and 14.23% for the same temperatures. With PG94, the corresponding increases at 10 Hz were 6.91%, 6.93%, and 13.21%, while at 25 Hz they were 6.92%, 8.03%, and 12.3%, respectively. Specifically, at high temperatures, the dynamic modulus of the GT-13 mixture exceeds that of the BBSG 0/14 mixture by approximately 14%, indicating the potential of GT-13 to improve rutting resistance in asphalt pavements. The thermal susceptibility analysis indicates that GT-13 exhibits better modulus retention, with a reduction of 50.5–52.7% between 15 °C and 28 °C, compared with 53.3–57.8% for BBSG 0/14. The improved thermomechanical stability of GT-13 can be attributed to the combined effects of aggregate gradation and binder content, which contribute to its suitability for high-temperature service conditions. In addition, the variability in the dynamic modulus results was evaluated using the coefficient of variation (CV). The CV values ranged from 0.55% to 2.68% for BBSG 0/14 mixtures and from 0.69% to 1.93% for GT-13 mixtures, indicating limited dispersion among the measured values.

3.2. Fatigue Resistance

Table 10 presents the fatigue life test results for BBSG 0/14 and GT-13 mixtures, each formulated with both PG76-22 and PG94, under identical testing conditions employing a constant strain level, controlled temperature, and a loading frequency of 25 Hz. Fatigue resistance can be observed to decrease as both temperature and deformation are increased. The results demonstrate that the PG94 improves fatigue resistance by 28–39% compared to PG76-22 for both asphalt types. Under moderate conditions (300–400 με strain, 10–15 °C), both mixtures exhibit comparable fatigue resistance, sustaining approximately 2–3 million load cycles. However, GT-13 demonstrates higher performance under severe loading conditions (500–1000 με strain and 28 °C), displaying 11.63 times greater fatigue resistance at 500 με, 5.45 times at 800 με, and 4.19-fold enhanced durability at 1000 με. Notably, GT-13 maintains higher thermal stability, showing only a 6–17% reduction in fatigue resistance between 20 and 28 °C, compared to the 56–59% degradation observed in BBSG 0/14. These results indicate fundamentally different damage tolerance mechanisms, with GT-13 exhibiting high resistance to micro-crack propagation and enhanced energy dissipation capabilities under combined thermal–mechanical stresses.
A two-way ANOVA considering binder type and mixture type as factors, followed by post hoc comparisons, was performed to statistically evaluate the effects of these variables on fatigue performance. The results showed that, at the 0.05 significance level, both binder type and mixture type had statistically significant effects on the overall mean fatigue life, with p-values of 0.01066 and 3.99 × 10−109, respectively. Furthermore, the effect sizes (η2) were calculated as 0.63 for binder type and 0.99 for mixture type, both exceeding the threshold of 0.14 for a large effect size. These results indicate that binder type and mixture type explain approximately 63% and 99% of the variance in fatigue life, respectively. The statistical analysis confirms that both binder type and mixture type significantly affect fatigue performance, with mixture type exhibiting a substantially greater influence than binder type. In addition, the CV values ranged from 0.06% to 9.97% for BBSG 0/14 mixtures and from 0.05% to 2.19% for GT-13 mixtures, indicating limited dispersion among the measured values.

3.2.1. Fatigue Life–Strain Relationship

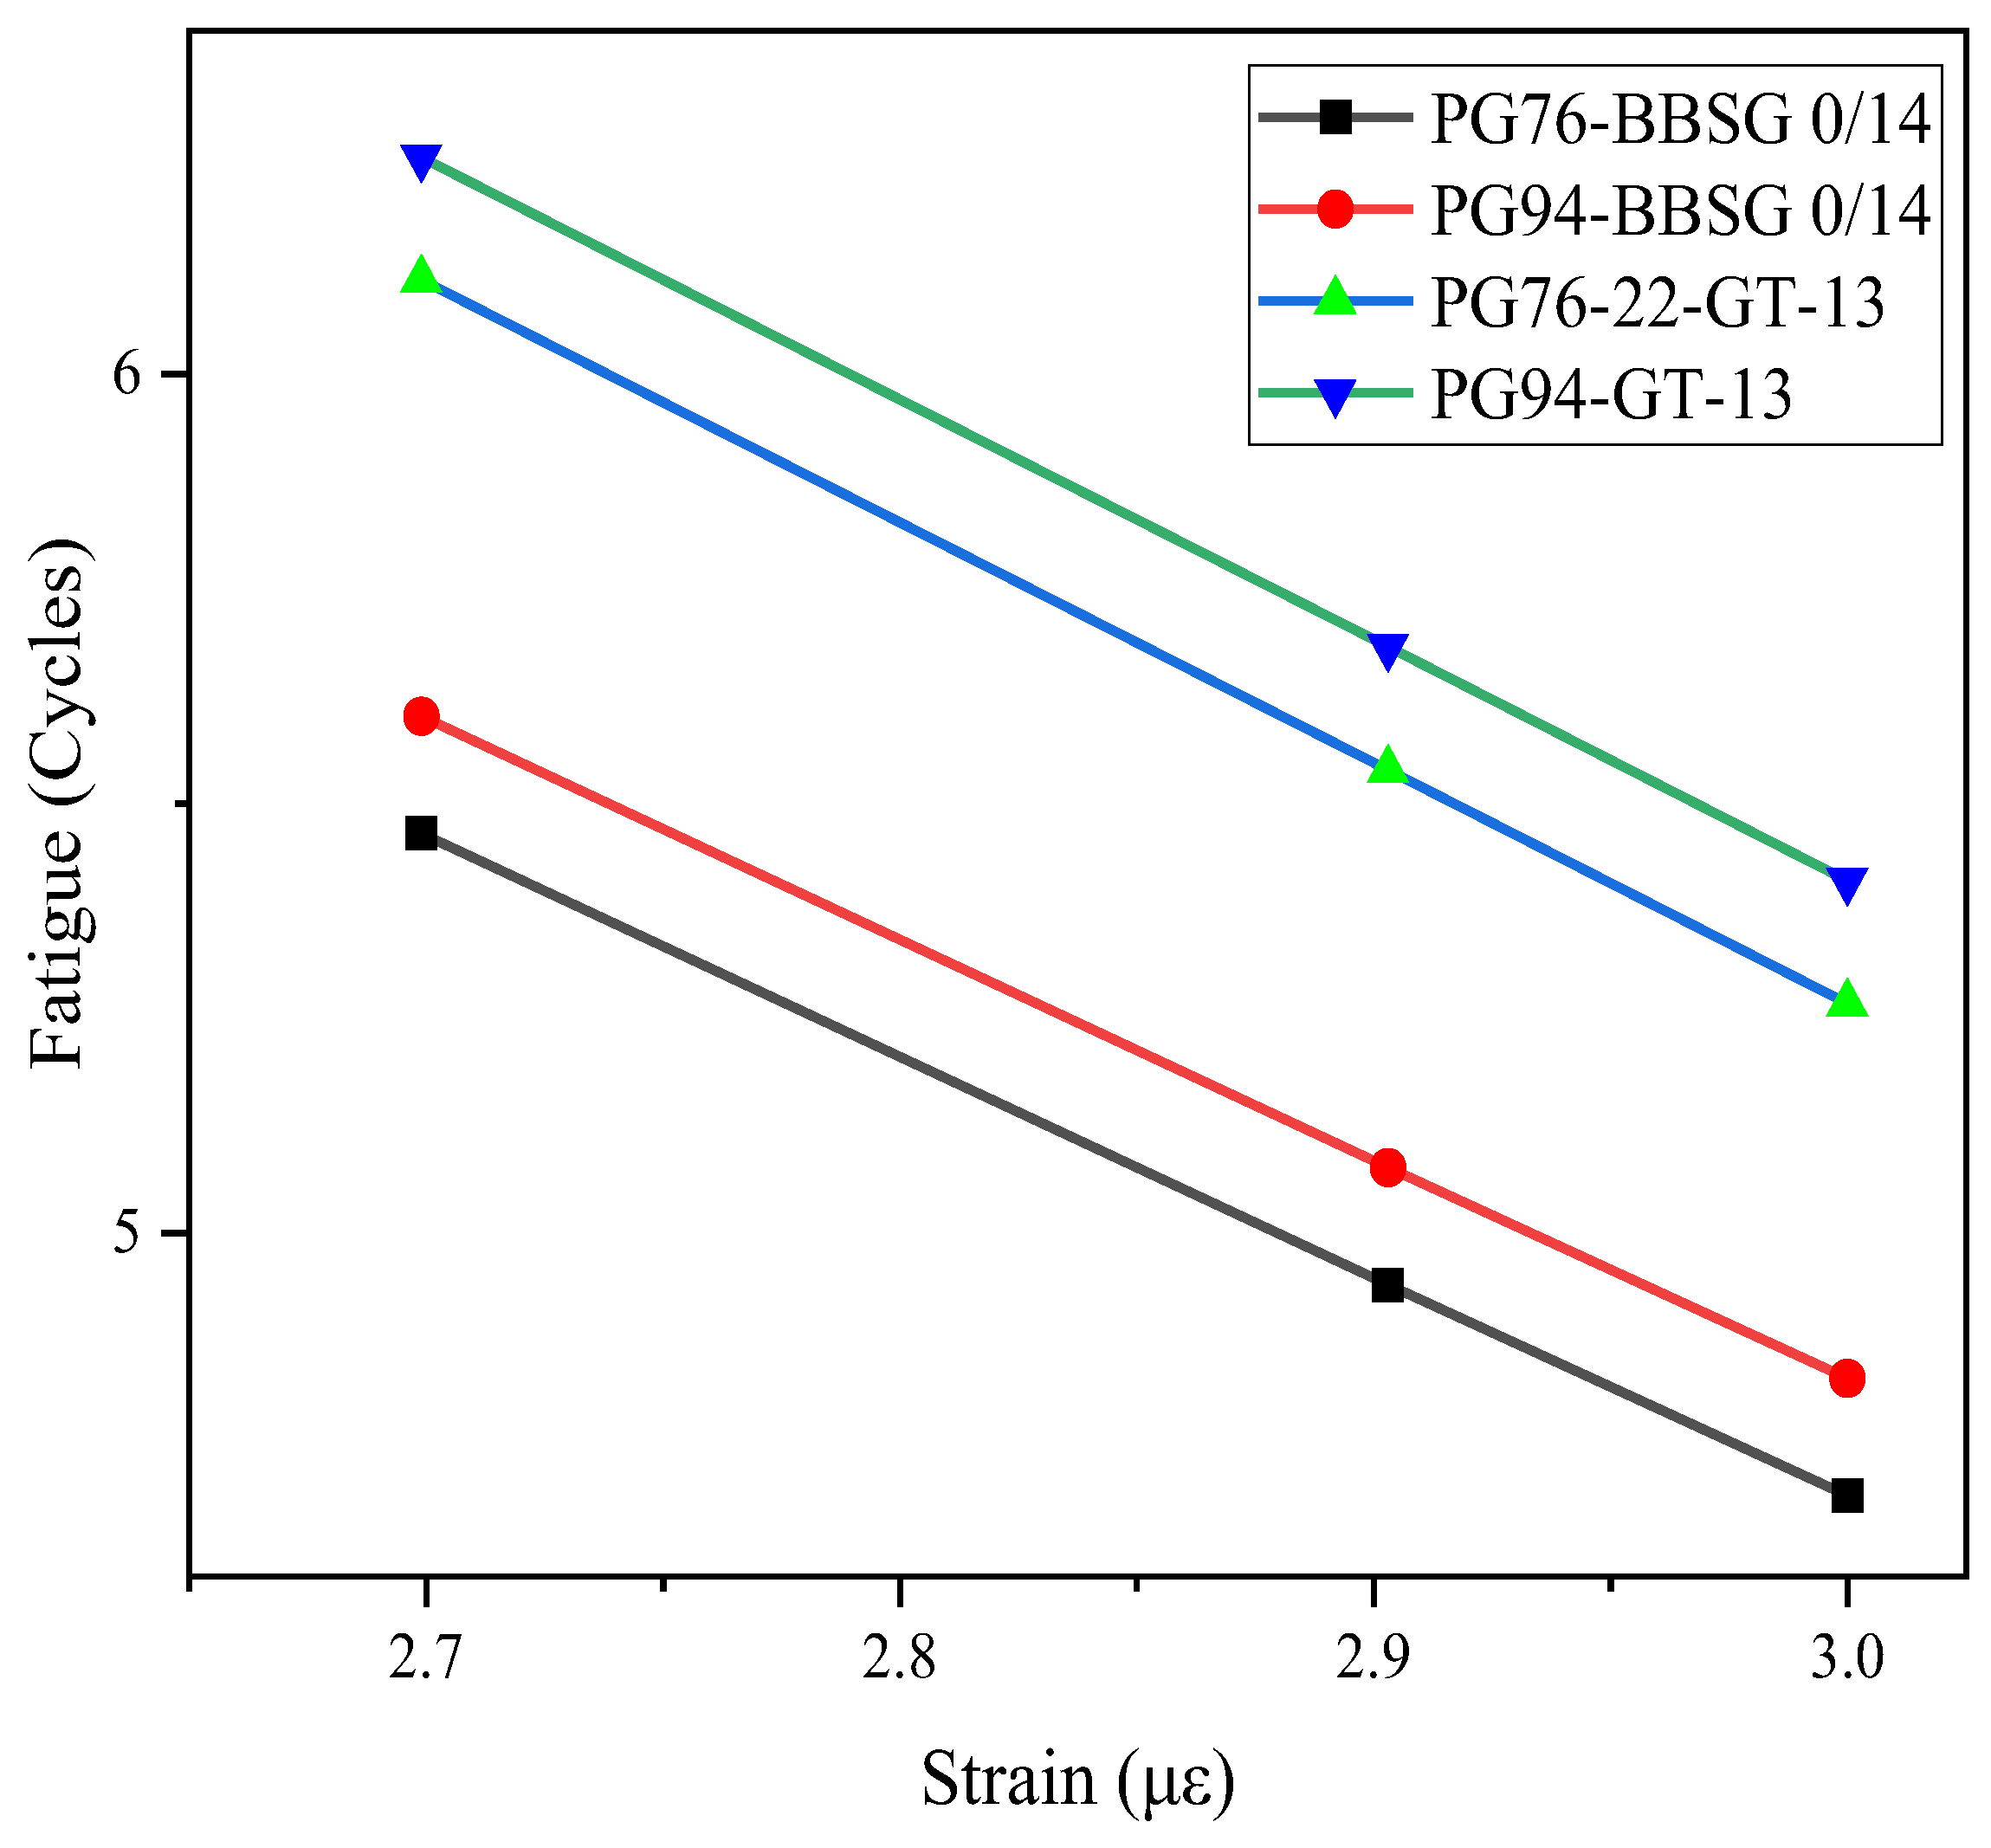
In this experimental study, fatigue failure was defined as the point at which the stiffness modulus decreased to 50% of its initial value (Nf50), which is consistent with the criterion adopted in AASHTO T321-07 [39] and the French fatigue design approach implemented in Alizé-LCPC [42]. The corresponding number of load cycles was considered as fatigue life. A generalized linear regression model was fitted to the data presented in Table 10 at 28 °C, which was adopted as the equivalent pavement design temperature for the Republic of the Congo, to characterize the fatigue performance of the asphalt mixtures under this failure criterion. As illustrated in Figure 8, the fatigue curves for the BBSG 0/14 and GT-13 mixtures are described by Equations (8) and (9) for PG94, and by Equations (10) and (11) for PG76-22, respectively. The perfect fitting performance (R2 = 1) obtained from Equations (8)–(11) may be attributed to the limited number of experimental data points. The fatigue models were established using three strain levels (500, 800, and 1000 με) at 28 °C, with three fitting parameters. Therefore, the regression had zero degrees of freedom, leading inevitably to an R2 value of 1.0. These relationships should be regarded as empirical models applicable within the range investigated.
N f 1 = 8.100 × 10 12 1 ε t 2.587 1 S 0 0.095 ( R 2 = 1 )
N f 2 = 9.594 × 10 14 1 ε t 2.836 1 S 0 0.320 ( R 2 = 1 )
N f 3 = 6.096 × 10 12 1 ε t 2.587 1 S 0 0.096 ( R 2 = 1 )
N f 4 = 9.016 × 10 13 1 ε t 2.810 1 S 0 0.076 ( R 2 = 1 )

3.2.2. Predictive Model for Constant-Strain Fatigue Life of High-Performance Asphalt Mixtures

In the study conducted by the Road Engineering Research Institute of South China University of Technology, 2011 [43] on “Fatigue Cracking of Asphalt Layers”, a multi-variable regression analysis was performed on 618 sets of domestic and international strain-controlled four-point bending fatigue test results. Based on these strain-controlled fatigue test outcomes, a laboratory fatigue life prediction model for asphalt mixtures was developed, as illustrated in Equation (12). The fatigue life ( N f ) of asphalt mixtures under laboratory constant-strain tests was expressed as a function of applied tensile strain ( ε ), initial flexural stiffness modulus ( S 0 ), and asphalt voids filled percentage (VFA). This generalized laboratory fatigue model was originally developed based on neat (unmodified) binders and the fatigue life–strain term calibrated under standard laboratory conditions (15 °C and 10 Hz).
N f = 1.509 × 10 16 1 ε t 3.973 1 S 0 1.589 V F A 2.720
High-performance modified asphalts were employed in this study. The original model established using conventional bitumen under standard conditions may lead to significant bias when applied to tropical climates, highlighting the need for binder-, temperature-, and frequency-adapted predictive formulations. Based on four-point bending fatigue tests conducted at 28 °C and a loading frequency of 25 Hz, fatigue models were developed for BBSG 0/14 and GT-13 asphalt mixtures produced with PG76 and PG94 modified binders. The VFA values remained nearly constant within each mixture type, with a value of 72% for the BBSG 0/14 mixtures regardless of binder grade, and values of 75.9% and 76.0% for the GT-13 mixtures prepared with PG76-22 and PG94, respectively. Due to the limited variation in VFA within the experimental dataset, the VFA exponent could not be independently recalibrated without introducing additional uncertainty or overfitting. Therefore, the VFA exponent (2.720) from the reference fatigue model was retained to preserve the original model structure, while the coefficients associated with tensile strain and initial flexural stiffness were recalibrated based on the fatigue test results obtained in this study. To evaluate the influence of the adopted VFA exponent on fatigue predictions, a sensitivity analysis was conducted by varying the VFA exponent by ±20% (i.e., from 2.176 to 3.264). The results showed that the predicted fatigue life varied by approximately 13–19% within the investigated VFA range (72–76%), indicating that the fixed VFA exponent had a limited influence on the fatigue prediction results. By substituting Equations (8)–(11) into Equation (12), the recalibrated fatigue models for high-performance asphalt mixtures were established. The resulting models, presented in Equations (13)–(16), correspond to mixtures incorporating PG94 high-viscosity and high-elasticity modified binder and PG76-22 SBS-modified binder, respectively.
N f   P G 94 B B S G   0 / 14 = 1.980 × 10 13 1 ε t 2.587 1 S 0 0.096 V F A 2.720
N f   P G 94 G T 13 = 2.024 × 10 15 1 ε t 2.836 1 S 0 0.320 V F A 2.720
N f   P G 76 22 B B S G   0 / 14 = 1.490 × 10 13 1 ε t 2.587 1 S 0 0.096 V F A 2.720
N f P G 76 22 G T 13 = 1.909 × 10 14 1 ε t 2.810 1 S 0 0.076 V F A 2.720
Donald Christensen established a relationship between the dynamic compressive modulus (E) and the dynamic flexural stiffness modulus ( S 0 ) of asphalt mixtures, as shown in Equation (18) (Road Engineering Research Institute of South China University of Technology, 2011) [43].
S 0 = 0.66 E 0.994
When the dynamic modulus ranges from 3000 MPa to 15,000 MPa, the term E 0.994 E is approximately equal to 0.95. Accordingly, the relationship between the dynamic compressive modulus and the dynamic flexural modulus of asphalt mixtures can be considered to remain at approximately a factor of 1.6. That is, the dynamic compressive modulus is about 1.6 times the dynamic flexural modulus under the same temperature and loading frequency conditions. Similarly, Adhikari et al. (2009) [44], based on experimental comparisons between the dynamic compressive modulus and dynamic flexural modulus of asphalt mixtures, reported that the ratio between the two is approximately 1.3. The Road Engineering Institute of South China University of Technology (2011) [43] experimentally validated the relationship between the dynamic compressive modulus and the dynamic flexural modulus. A dataset of 31 paired measurements was used to assess Equation (17). The results showed an average error of 16.8% between the predicted and measured dynamic flexural stiffness modulus, while the mean ratio between the measured dynamic compressive and flexural moduli was approximately 1.6. Although deviations exist at the individual data level, Equation (18) adequately represents the overall relationship between the two moduli. It should be noted that the conversion factor of 1.6 is an empirical relationship from previous experimental studies and may introduce uncertainty when applied to high-performance asphalt mixtures. However, this relationship was adopted in this study for model validation purposes based on previous experimental validation. Accordingly, Equation (17) was adopted to approximate the conversion between the dynamic compressive modulus and the dynamic flexural modulus. Substituting this relationship into Equations (13)–(16) yields predictive models expressed in terms of dynamic compressive modulus, as given in Equations (18)–(21):
N f   P G 94 B B S G   0 / 14 = 2.061 × 10 13 1 ε t 2.587 1 E 0.0954 V F A 2.720
N f   P G 94 G T 13 = 2.312 × 10 15 1 ε t 2.836 1 E 0.318 V F A 2.720
N f   P G 76 22 B B S G   0 / 14 = 1.551 × 10 13 1 ε t 2.587 1 E 0.0954 V F A 2.720
N f   P G 76 22 G T 13 = 1.970 × 10 14 1 ε t 2.810 1 E 0.076 V F A 2.720

3.2.3. Validation of the Predictive Model

The verification procedure for the proposed constant-strain fatigue life prediction model comprises the following sequential steps:
(1)
Experimental determination of the measured fatigue life ( N f M ) under four-point bending test conditions;
(2)
Estimation of the predicted fatigue life ( N f P ) using the constant-strain fatigue life prediction model for high-performance asphalt mixtures (Equations (18)–(21));
(3)
Evaluation of the model’s predictive accuracy by comparing N f E with N f P , with a relative deviation (RD) threshold of 20% adopted as the criterion for acceptable precision.
The model was validated using experimental data obtained from the laboratory tests described above. The validation results are summarized in Table 11. For the four mixture types investigated, the fatigue lives predicted by Equations (18)–(21) showed only slight deviations from the measured values, with a maximum relative deviation of 10.3%, which remains within the 20% tolerance threshold. Furthermore, a strong correlation was observed between the N f P and N f M , yielding a coefficient of determination ( R 2 ) of approximately 99.99%. This finding indicates that the refined model offers a notable enhancement in prediction accuracy relative to the original model.
The applicability of the proposed fatigue model should be considered within the climatic conditions investigated in this study. The model was developed and validated under hot and humid tropical conditions representative of the Republic of the Congo, using an equivalent design temperature of 28 °C. Therefore, its application to other climatic regions with different temperature conditions requires further validation and possible recalibration of the temperature-related parameters.

3.3. Case Study

3.3.1. Structure and Parameters of Pavement

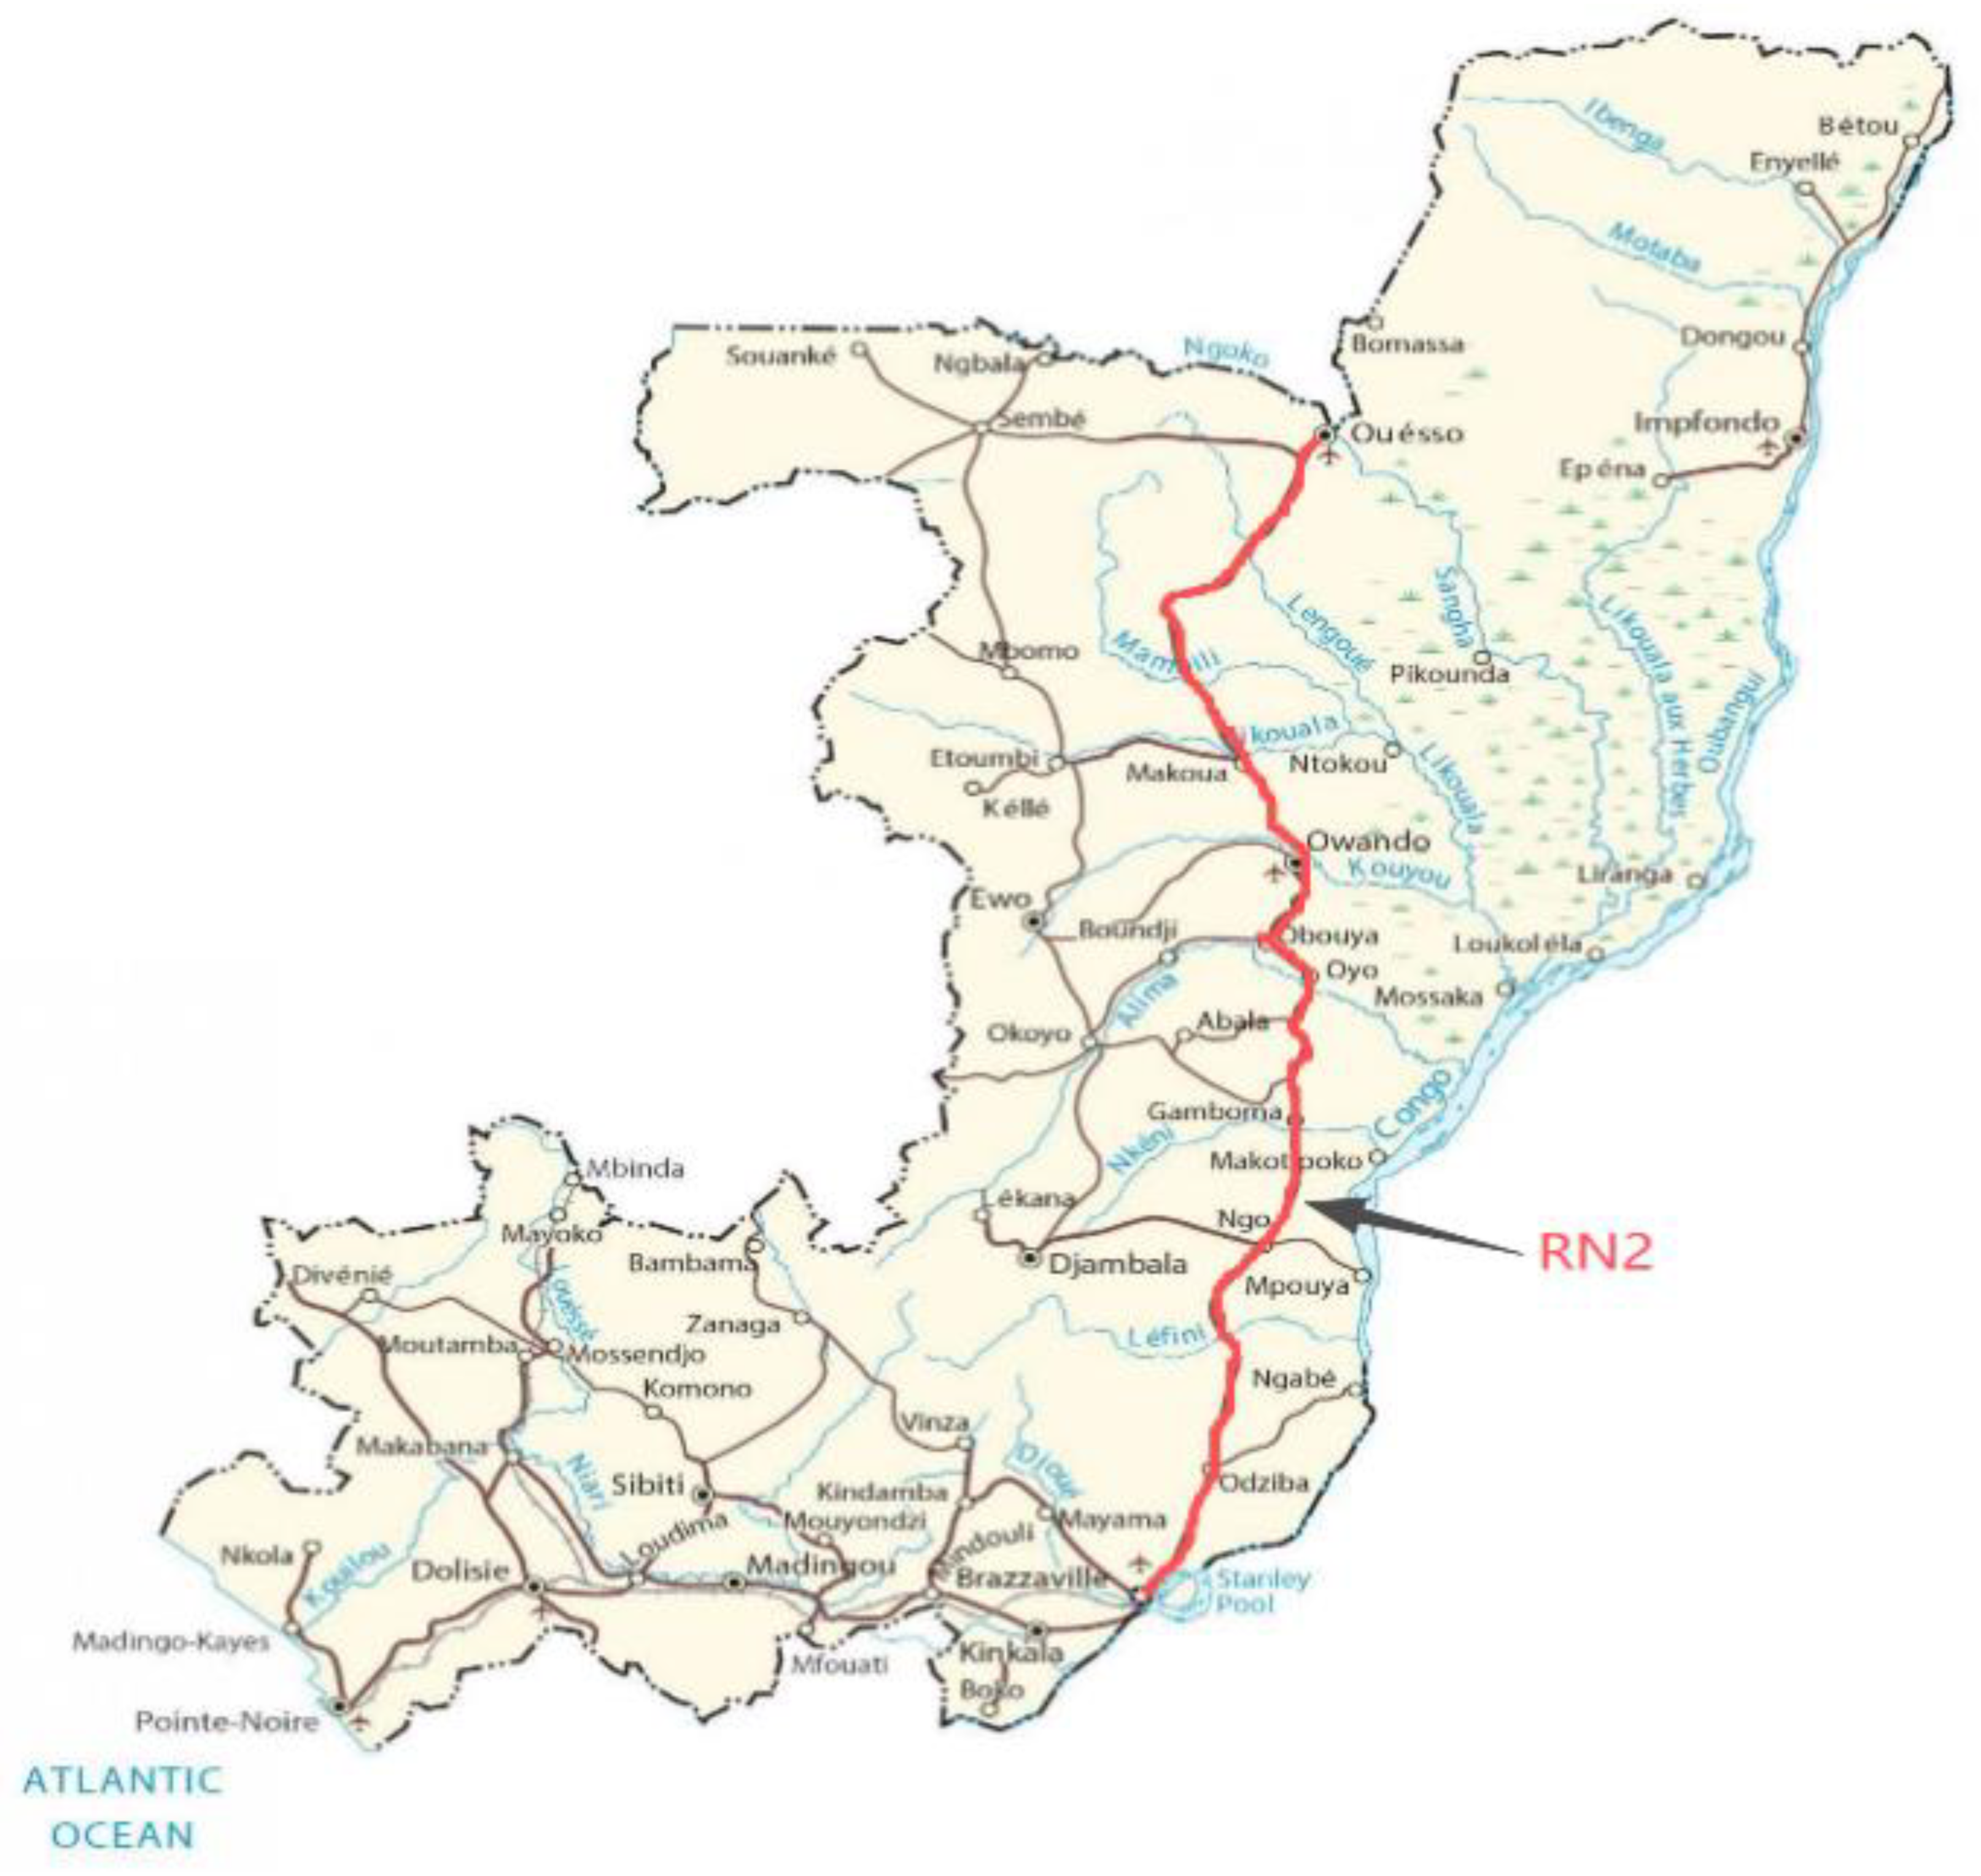
For the current study, the RN2 national road (Figure 9), serving as critical infrastructure for both domestic freight logistics and regional economic integration within the Congo’s infrastructure network, was considered. This strategic corridor connects the country’s key economic and political centers across its southern and northern regions, including Brazzaville, the political capital and administrative heart of the country, and Ouesso, a secondary economic pole. The study area exhibits mean annual precipitation ranging from 1400 mm to 1700 mm, coupled with average annual temperatures fluctuating between 27.6 and 28.8 °C. Pavement structures were designed in compliance with French specifications. The pavement design life was set at 20 years for a heavy goods vehicle traffic class of T3+. Based on this traffic classification, the cumulative number of equivalent standard axle loads (NPL) over the design period was estimated at 1.6151 × 10⁶. According to the LCPC-SETRA pavement design approach [42] and NF P98-086 [35], a risk level of 18% was adopted for this traffic category to account for uncertainties related to traffic loading, material characteristics, and pavement performance prediction. This design approach ensures adequate pavement reliability while optimizing the overall cost over the infrastructure service life. A temperature of 28 °C was adopted as the equivalent pavement design temperature for fatigue analysis, consistent with mechanistic–empirical pavement design principles, where calculations are performed at a reference temperature representative of cumulative long-term damage. This ensures that the calculated strains and fatigue life are representative of in-service conditions, avoiding overestimation of pavement performance.
To estimate the fatigue life of the four asphalt mixtures, dynamic modulus values measured at 25 Hz and 28 °C were used as inputs in the French Alizé-LCPC pavement analysis program. These conditions were selected to be consistent with those adopted in the four-point bending fatigue tests, ensuring that the stiffness and fatigue parameters were determined under the same laboratory loading frequency and temperature conditions, thereby reducing the potential influence of differences in testing conditions on fatigue life estimation. The use of 28 °C corresponds to the equivalent design temperature adopted for pavement analysis in tropical conditions such as the Republic of the Congo. However, it should be noted that a single dynamic modulus value cannot fully represent the variations in temperature and loading frequency experienced in actual pavement structures, and the 25 Hz laboratory frequency does not directly represent the actual loading frequency associated with field traffic conditions. This standardized frequency was adopted according to the French pavement material characterization procedures and provides a consistent basis for comparing the fatigue performance of different asphalt mixtures. Alize-LCPC is one of the most used applications for analyzing flexible pavement systems in tropical countries such as the Republic of the Congo. It focuses on the elastic homogeneous isotropic multilayer theory model to predict stresses and strains in pavement structures induced by the reference standard dual wheel loaded at 130 kN, which has wheel spacing of 0.375 m, a radius of 0.125 m, and 0.662 MPa of pressure [36]. The pavement structure and material parameters are listed in Table 12 and Table 13. The single variable considered in this analysis was the material of the surface layer, i.e., the pavement structures differed exclusively in the asphalt concrete (AC) layer material. Meanwhile, the remaining layer was constant for all cases. The AC layer thickness ranged from 50 to 100 mm, with specific thicknesses of 50, 60, 70, 80, 90, and 100 mm.
The Nf of each experimental pavement structure were predicted in terms of the allowable number of reference loads.

3.3.2. Allowable Strain

According to the French design method [2,36], the maximum allowable tensile strain at the bottom of a bituminous layer (εt-adm) is calculated to be
ε t a d m = ε 6 28   ° C ; 25   H z × N E 10 6 b × k c × k r × k s × k θ
Here, ε 6 28   ° C ; 25   H z represents the mean strain amplitude that results in the fatigue curve after 106 loading cycles; b represents the slope of the fatigue law of the material layer; NE is the equivalent number of reference axles; kc and ks are the adjustment coefficients; kr represents the risk coefficient; and is the temperature effect coefficient on the fatigue of bituminous materials.
The allowable strain in the top surface of untreated gravels and subgrade layers (Ɛz-adm) is calculated using Equation (23):
ε z a d m = 12000 × N E 0.222
Fatigue cracking parameters and design constants for each asphalt concrete and granular layers are listed in Table 14.

3.3.3. Pavement Response Results

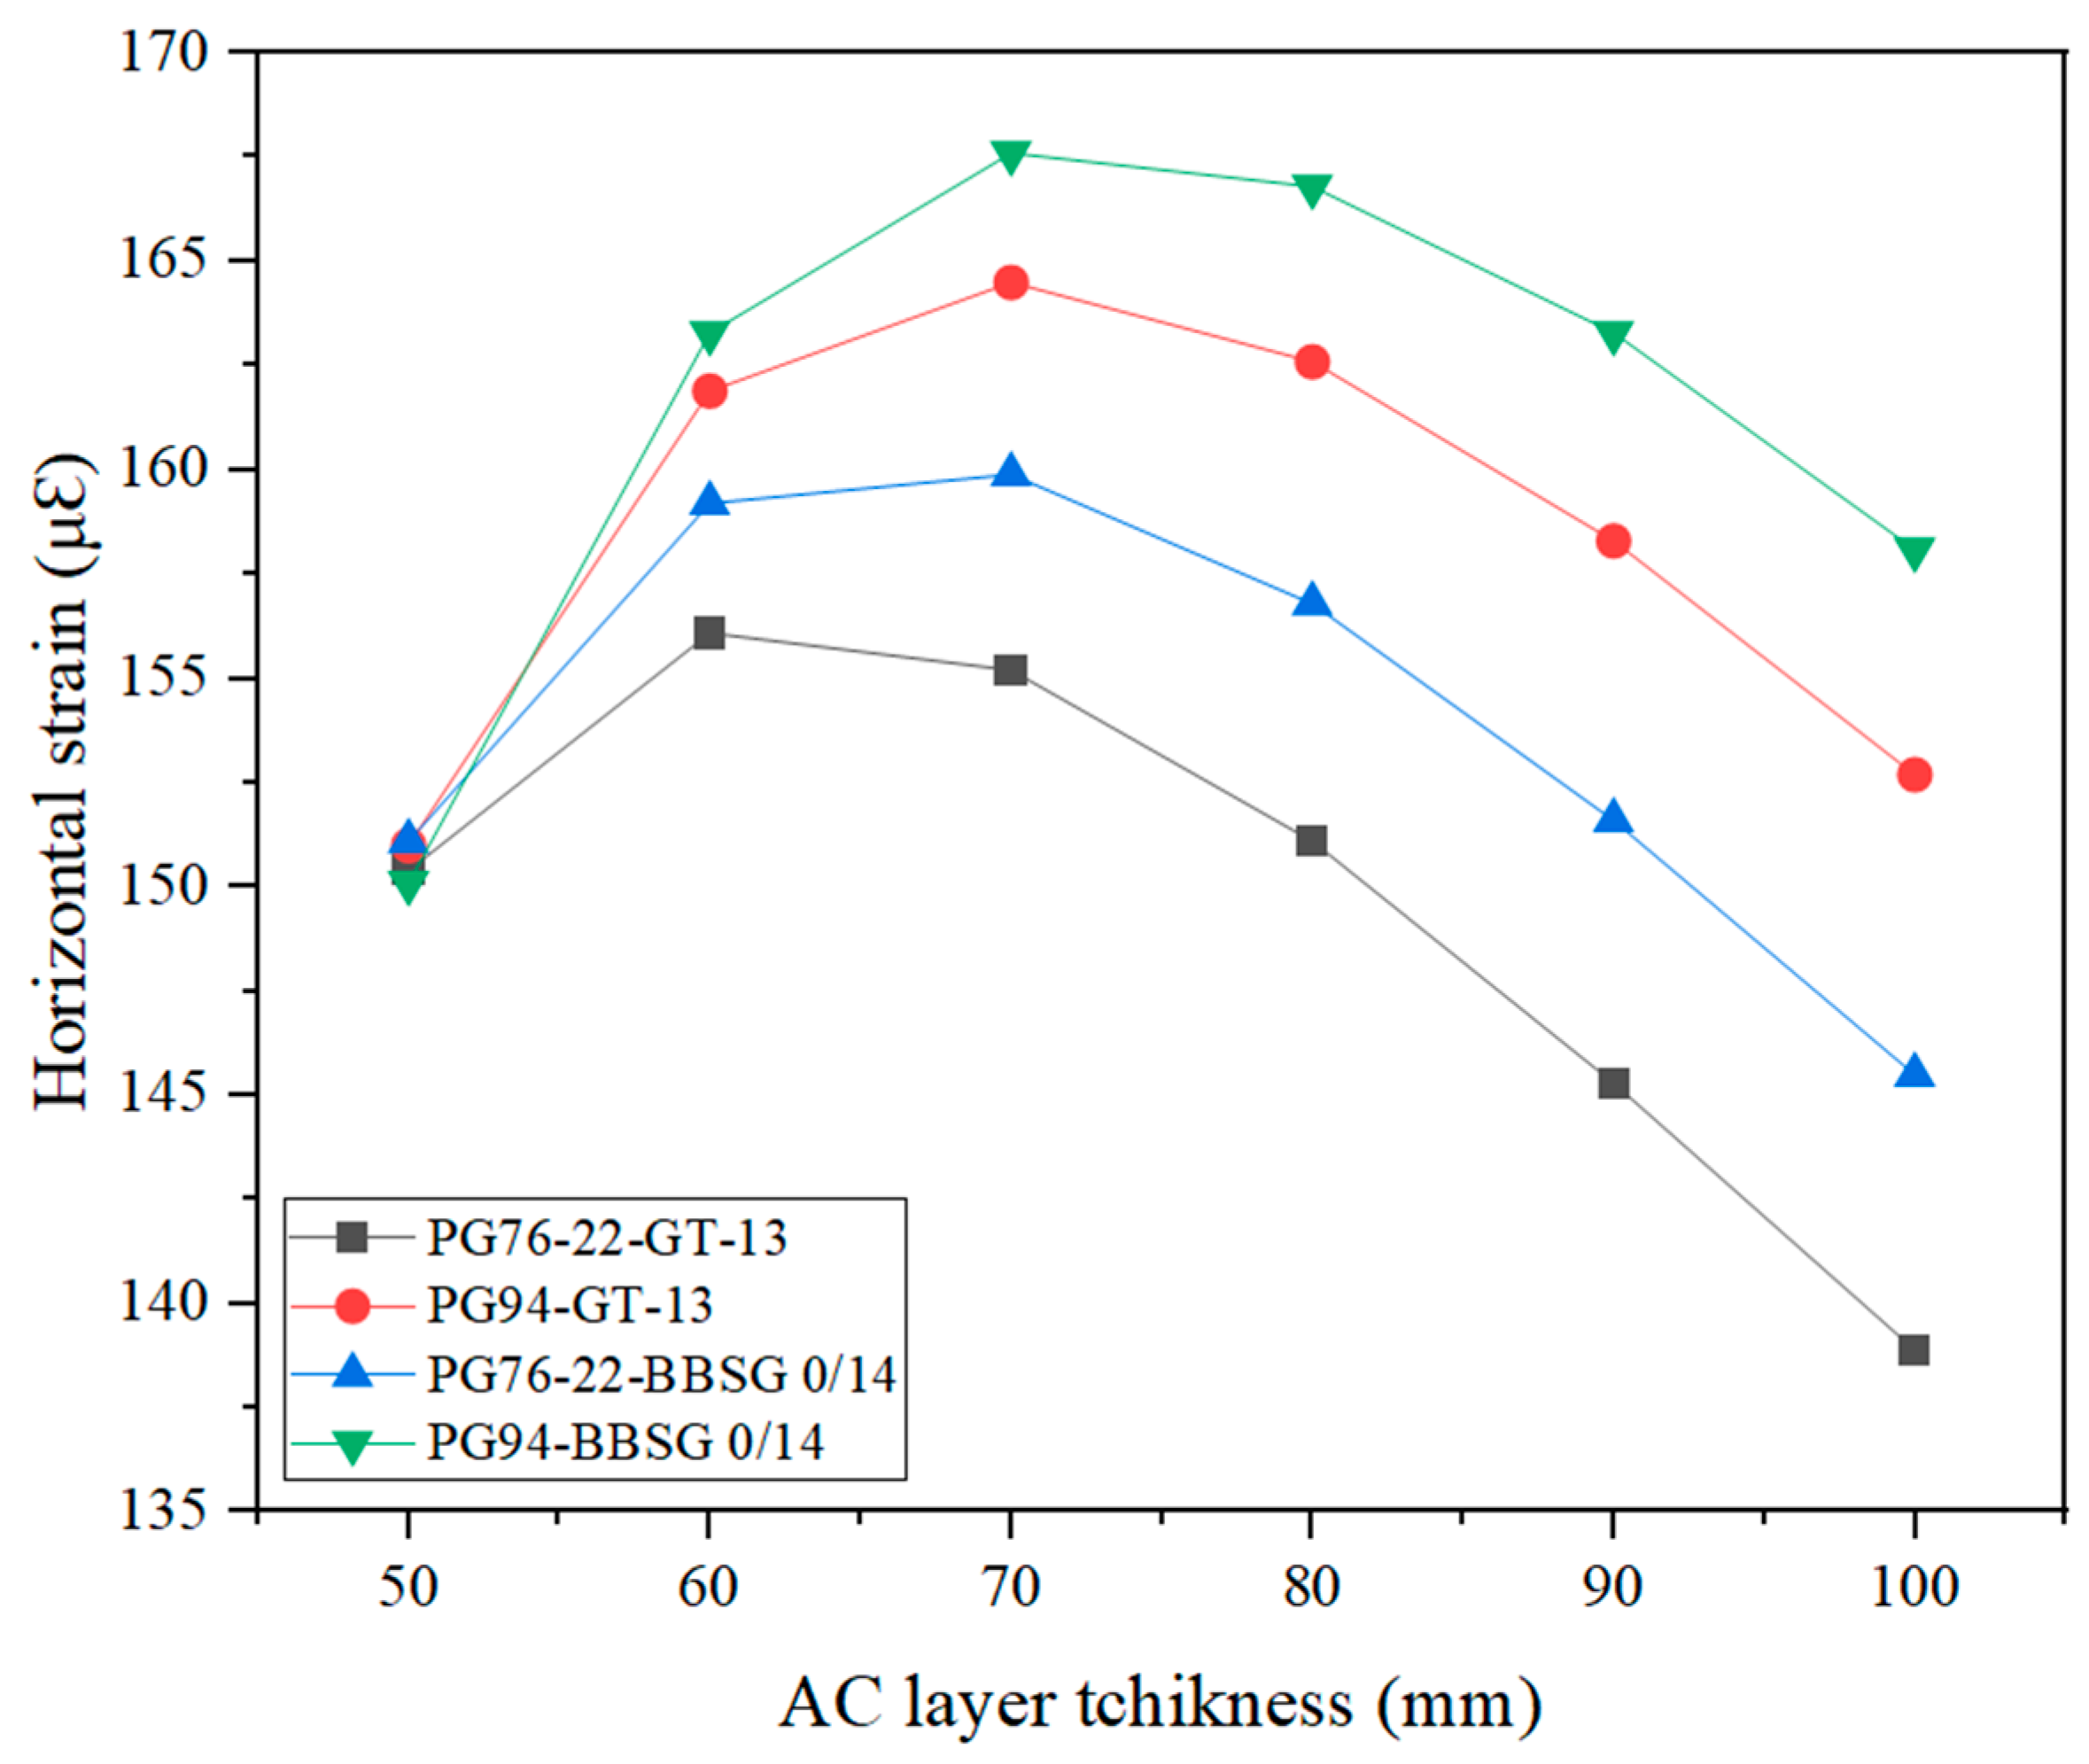
According to the NE and risk value, the horizontal strain at the bottom of the AC layer and vertical strain on the top surface of the subgrade were calculated using Alize-LCPC v2.3.1 software. Figure 10 shows the comparison of horizontal strain distribution. It is evident that the tensile strain in the AC layer is highest for the pavement incorporating the PG94-BBSG 0/14 mixture, followed in decreasing order by the PG94-GT-13, PG76-22-BBSG 0/14, and PG76-22-GT-13 mixtures. This is because the PG94-BBSG 0/14 mixture exhibits the lowest dynamic modulus value (Table 12), leading to the highest strain value. Furthermore, regardless of the asphalt mixture, the maximum tensile strain in the AC layer occurs at the bottom when the layer thickness is 70 mm, whereas it remains approximately the same at 50 mm.
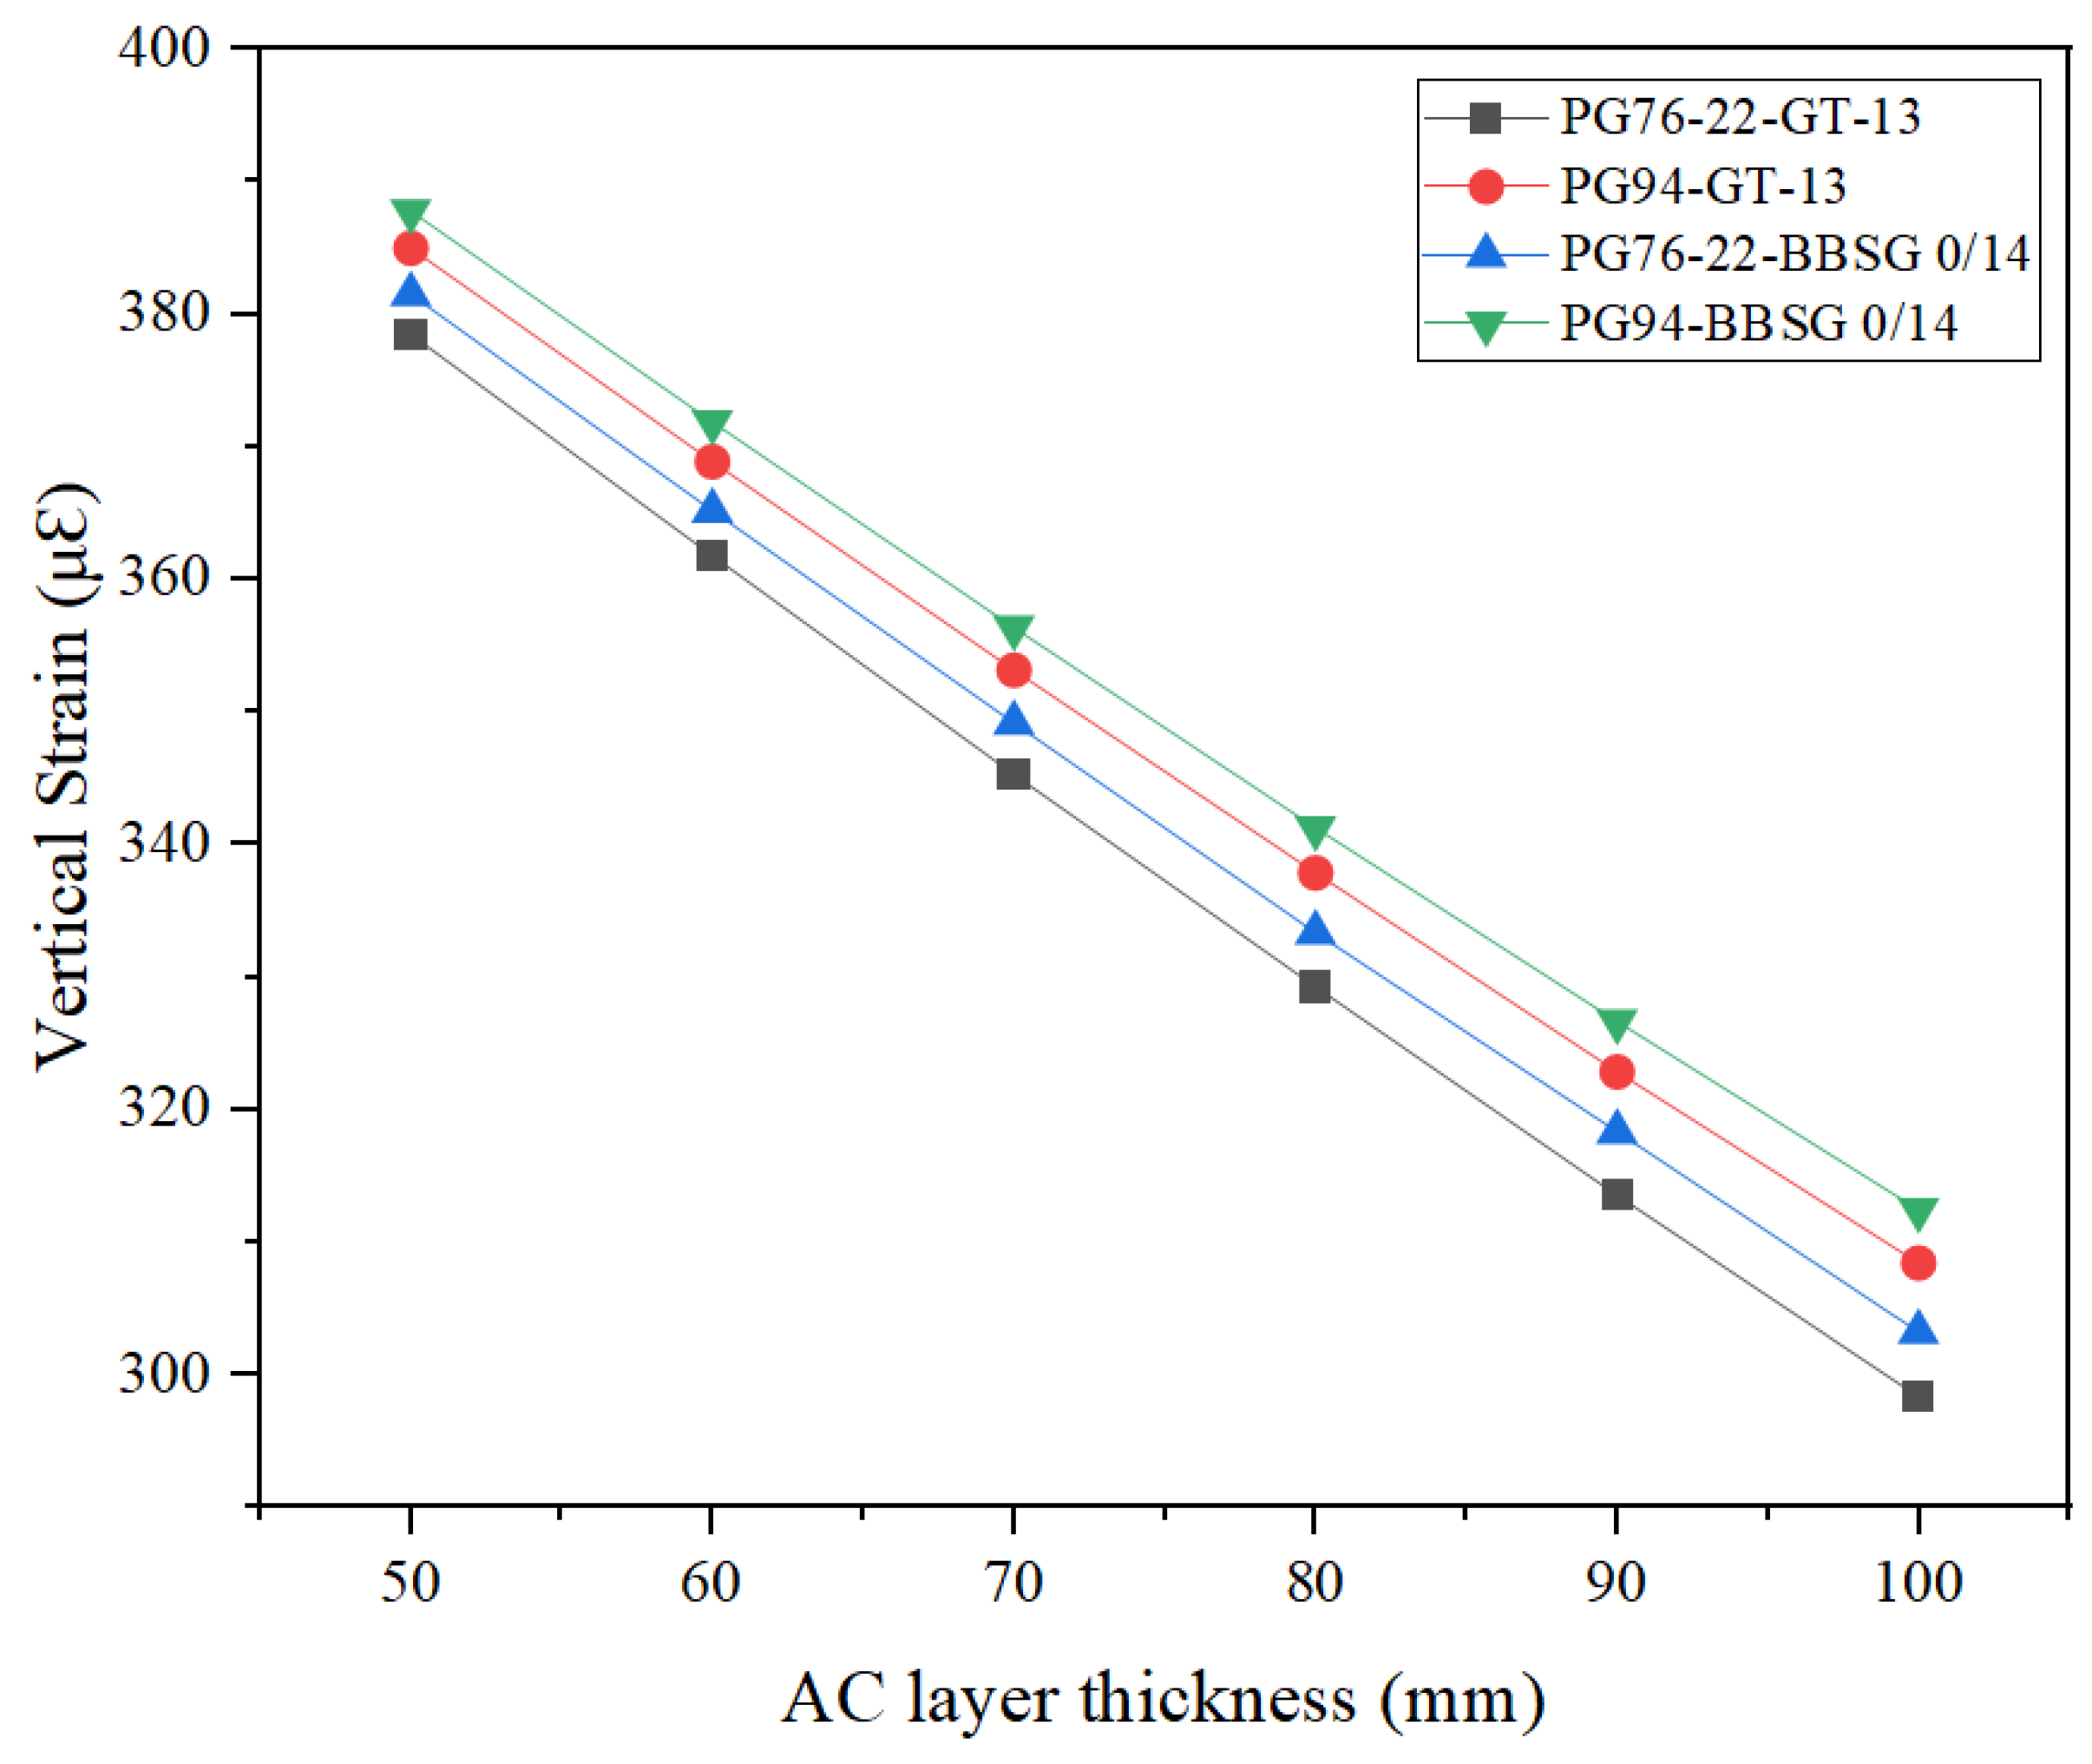
Moreover, the effect of asphalt layer thickness on the vertical compressive strain at the top of the subgrade is presented in Figure 11. As shown in the figure, the vertical compressive strain decreases dramatically as the asphalt thickness increases for all AC mixtures. This is because a greater asphalt thickness enhances the overall stiffness of the pavement structure, thereby reducing the vertical compressive stress and, consequently, the corresponding strain at the top of the subgrade. This indicates that the asphalt layer thickness plays a critical role in mitigating permanent deformation at the top of the subgrade, as well as rutting on the pavement surface. Among the mixtures, the pavement structure with the PG94-BBSG 0/14 mix exhibited the highest vertical strain value, followed in decreasing order by the PG94-GT-13 mix, PG76-22-BBSG 0/14, and finally the PG76-22-GT-13 mix. The PG76-22-GT-13 mix has a higher dynamic modulus (E) compared to PG94-BBSG 0/14, resulting in a lower vertical strain value at the top of the subgrade. Furthermore, among the two mixtures prepared with PG76-22, the PG76-22-GT-13 mix exhibits higher E values than the PG76-22-BBSG 0/14 mix. This difference may be attributed to the influence of aggregate gradation and binder content. These findings further confirm the importance of selecting appropriate aggregate gradation and binder type to prevent fatigue cracking and rutting distress in the pavement. Comparable findings were observed in the study of Do et al. (2025) [18].

3.3.4. Fatigue Life Prediction

Since the pavement structural response results related to the effect of asphalt thickness exhibited a similar trend, only those for the structure with a 50 mm surface course were selected for comparison (see Table 15).
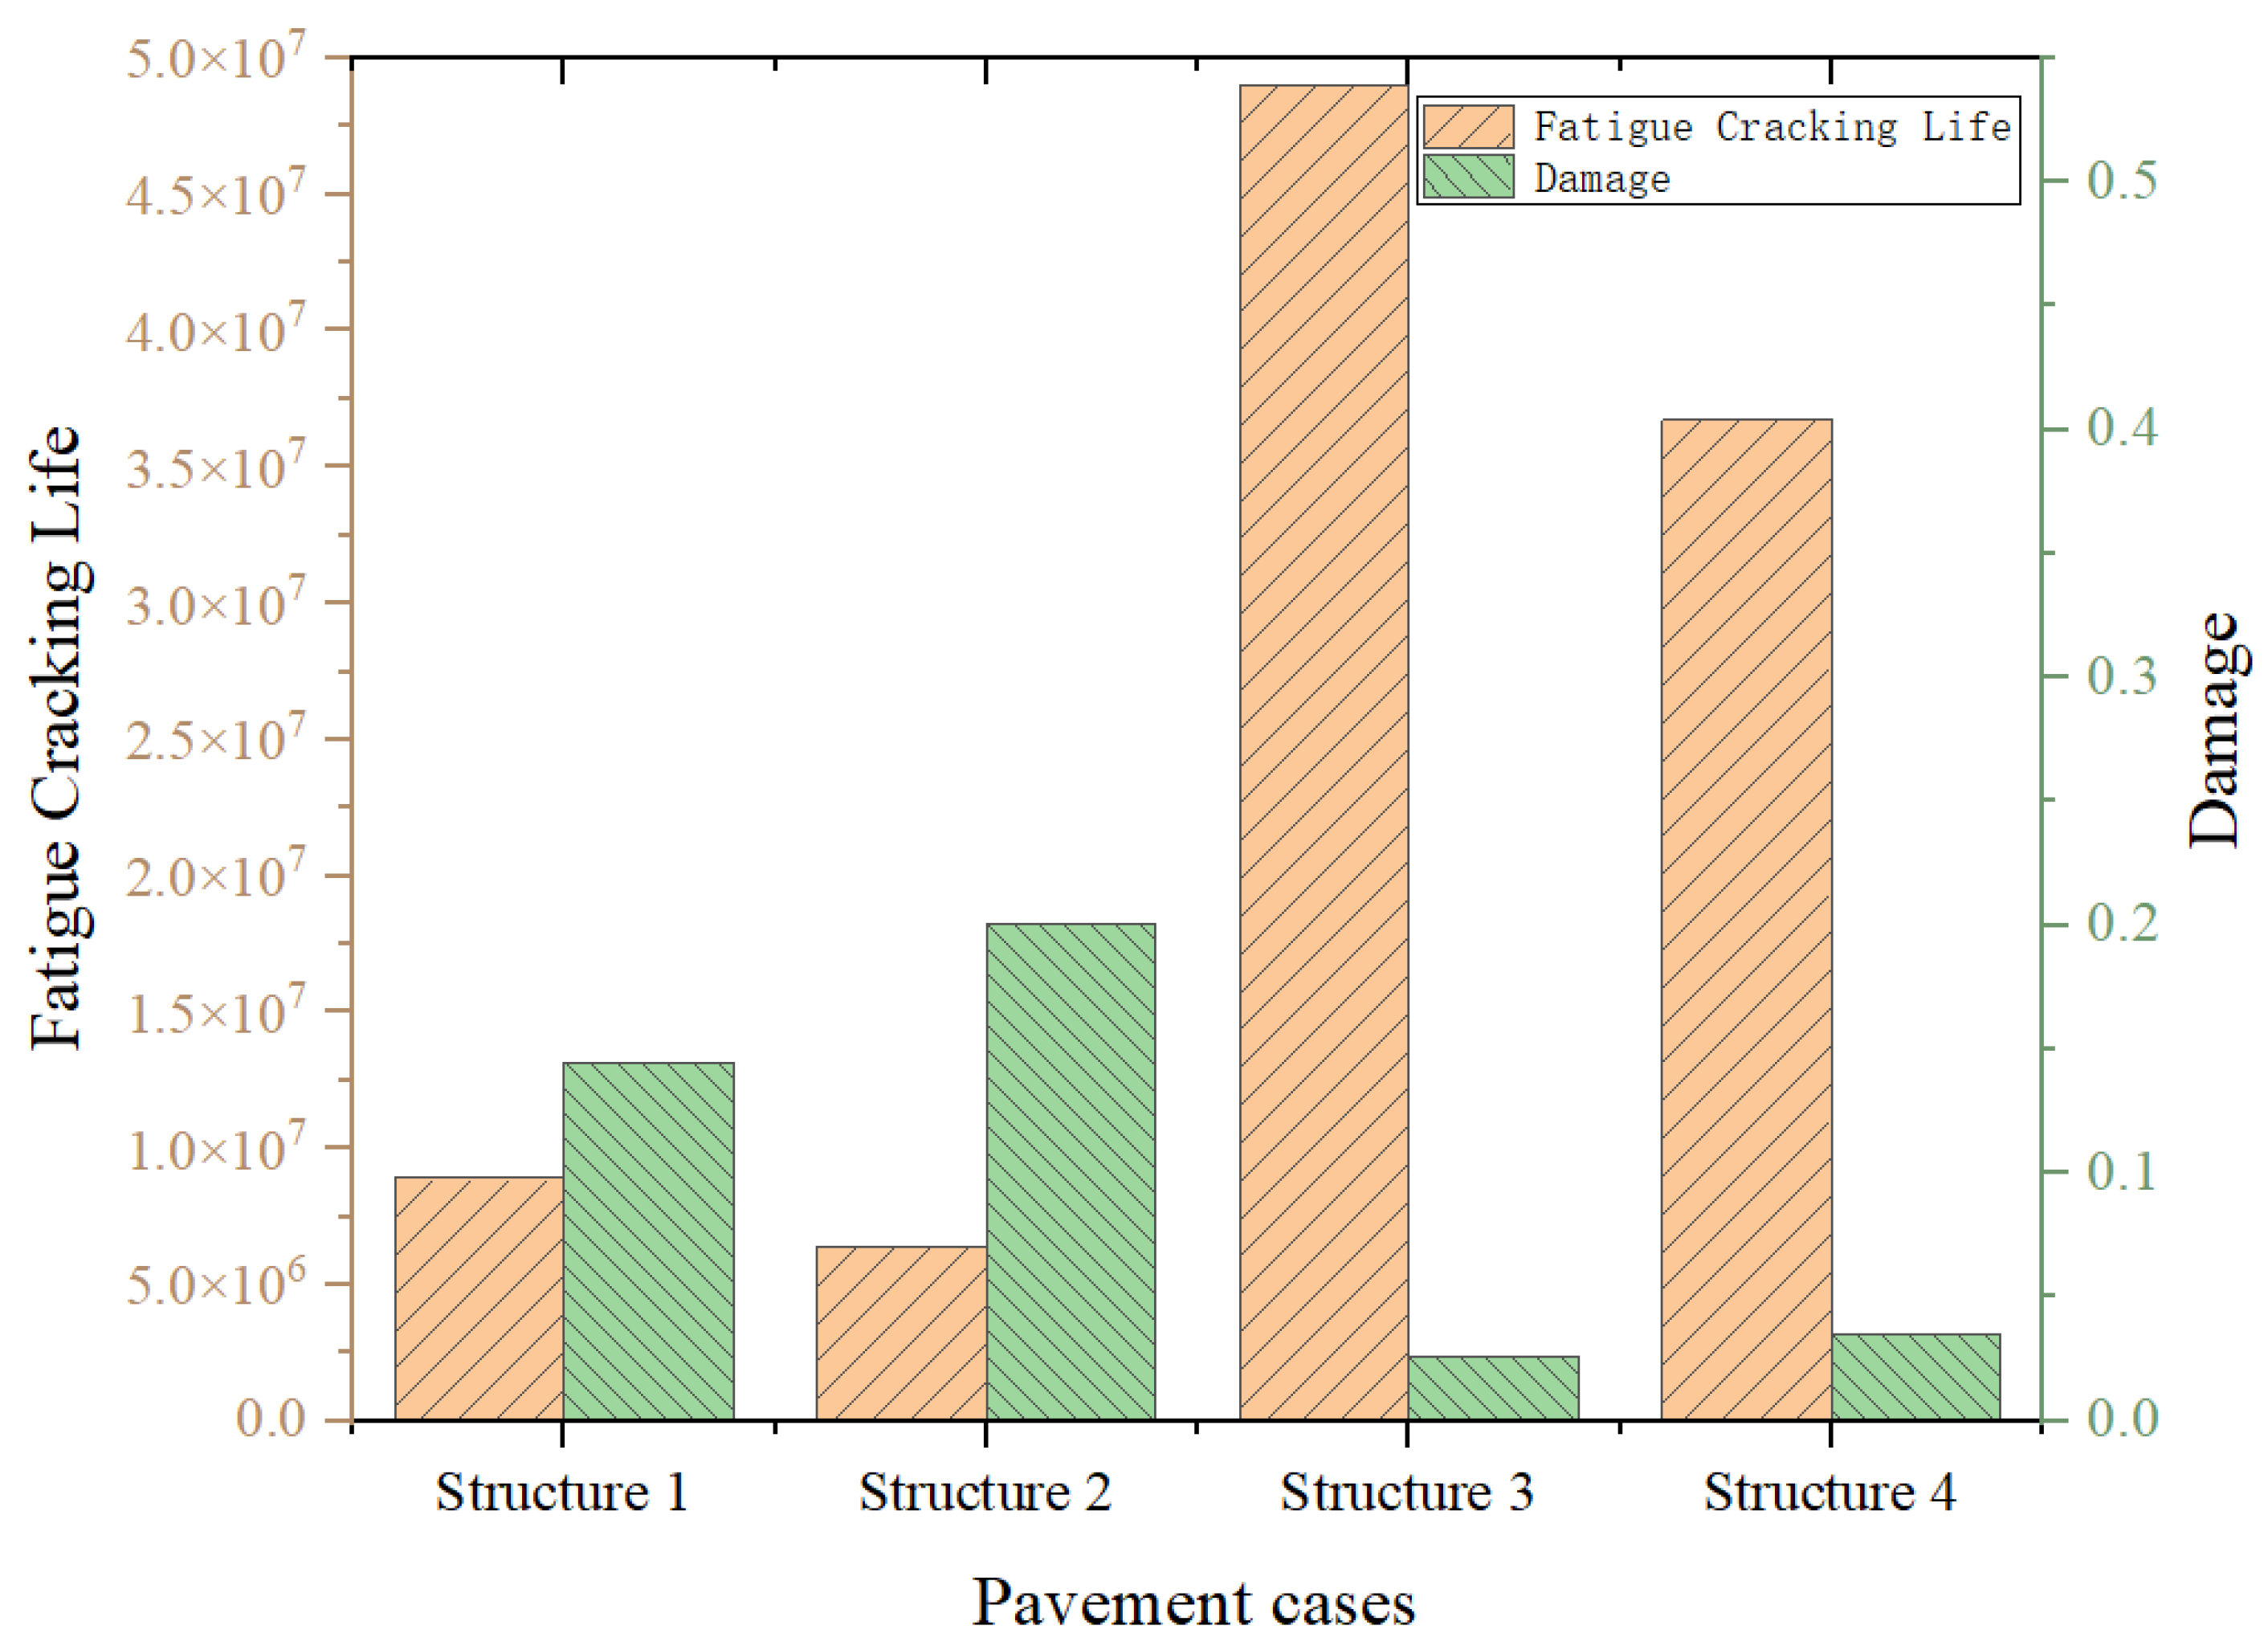
Based on the results of the horizontal strain at the bottom of the AC layer, the equivalent number of reference axles to failure due to fatigue was calculated for all cases of pavement structure by using Equations (18)–(21). The predicted fatigue cracking life and associated damage for all pavement structures are shown in Table 16 and Figure 12.
Table 15 reveals a significant correlation between mechanical performance and the type of asphalt and binder grade used. A clear performance hierarchy is observed: the PG94-GT-13 mix provides the greatest resistance to fatigue, followed in descending order by PG76-22-GT-13, PG94-BBSG 0/14, and finally PG76-22-BBSG 0/14.
When BBSG 0/14 is used as the asphalt surface layer, the fatigue life of the pavement for Structure 1, with PG94-BBSG as the surface layer, is 1.39 times longer than that of Structure 2 with PG76-22 as the surface layer. The cumulative fatigue damage decreases from 0.201 to 0.145, with corresponding inverse values between 4.98 and 6.90. These results indicate that, when different asphalt binders are used, the pavement structure is susceptible to early failure, and fatigue cracking of the asphalt wearing course may occur within approximately 5 years. This finding is consistent with field investigations conducted in the Republic of the Congo, where some sections of the roadway exhibited surface cracking within 5 years of service. This agreement suggests that the proposed fatigue prediction model is representative and reliable.
Compared with BBSG 0/14, GT-13 demonstrates significant advantages in pavement structural performance. The fatigue life of the pavement increases substantially, reaching more than 5.74 times that of BBSG 0/14, while the cumulative fatigue damage decreases to a range of 0.201 to 0.026, corresponding to a reduction of approximately 87%. Consequently, the equivalent theoretical fatigue design life estimated for the asphalt layer exceeds 28 years for Structure 4. Furthermore, the equivalent fatigue life of Structure 3, with PG94-GT-13 as the surface layer, is 1.35 times higher than that of PG76-22-GT-13 (Structure 4). This enhanced performance is mainly related to the internal structural characteristics of GT-13. Compared with the more continuous aggregate structure of BBSG 0/14, GT-13 exhibits a stone-on-stone skeleton, where coarse aggregates form a stable load-bearing framework through direct contact. This structure improves stress distribution within the mixture and contributes to lower tensile strain levels in the pavement structure. Moreover, the appropriate binder content and volumetric properties of GT-13, including VMA, provide favorable conditions for binder accommodation and aggregate coating, contributing to mixture durability. The thermodynamic adhesion energy between binder and aggregate, which may affect interfacial bonding, was not evaluated in this study and requires further investigation. These results are consistent with those of previous studies conducted on asphalt mixtures incorporating modified binders [43,44,45]. However, the estimated fatigue lives should be interpreted as equivalent theoretical design values obtained from laboratory characterization and mechanistic analysis, assuming consistent material properties, construction quality, and environmental conditions. Overall, the combination of a stable aggregate skeleton in GT-13 and high-performance binders provides a promising solution for improving fatigue resistance and rutting stability in high-traffic pavement applications under tropical conditions, such as those encountered in the Republic of the Congo and other regions with similar climatic and traffic conditions. It should be noted that the BBSG 0/14 mixtures were evaluated with modified binders only; thus, the contribution of binder modification relative to conventional solutions remains to be quantified.

3.4. Composite-Index

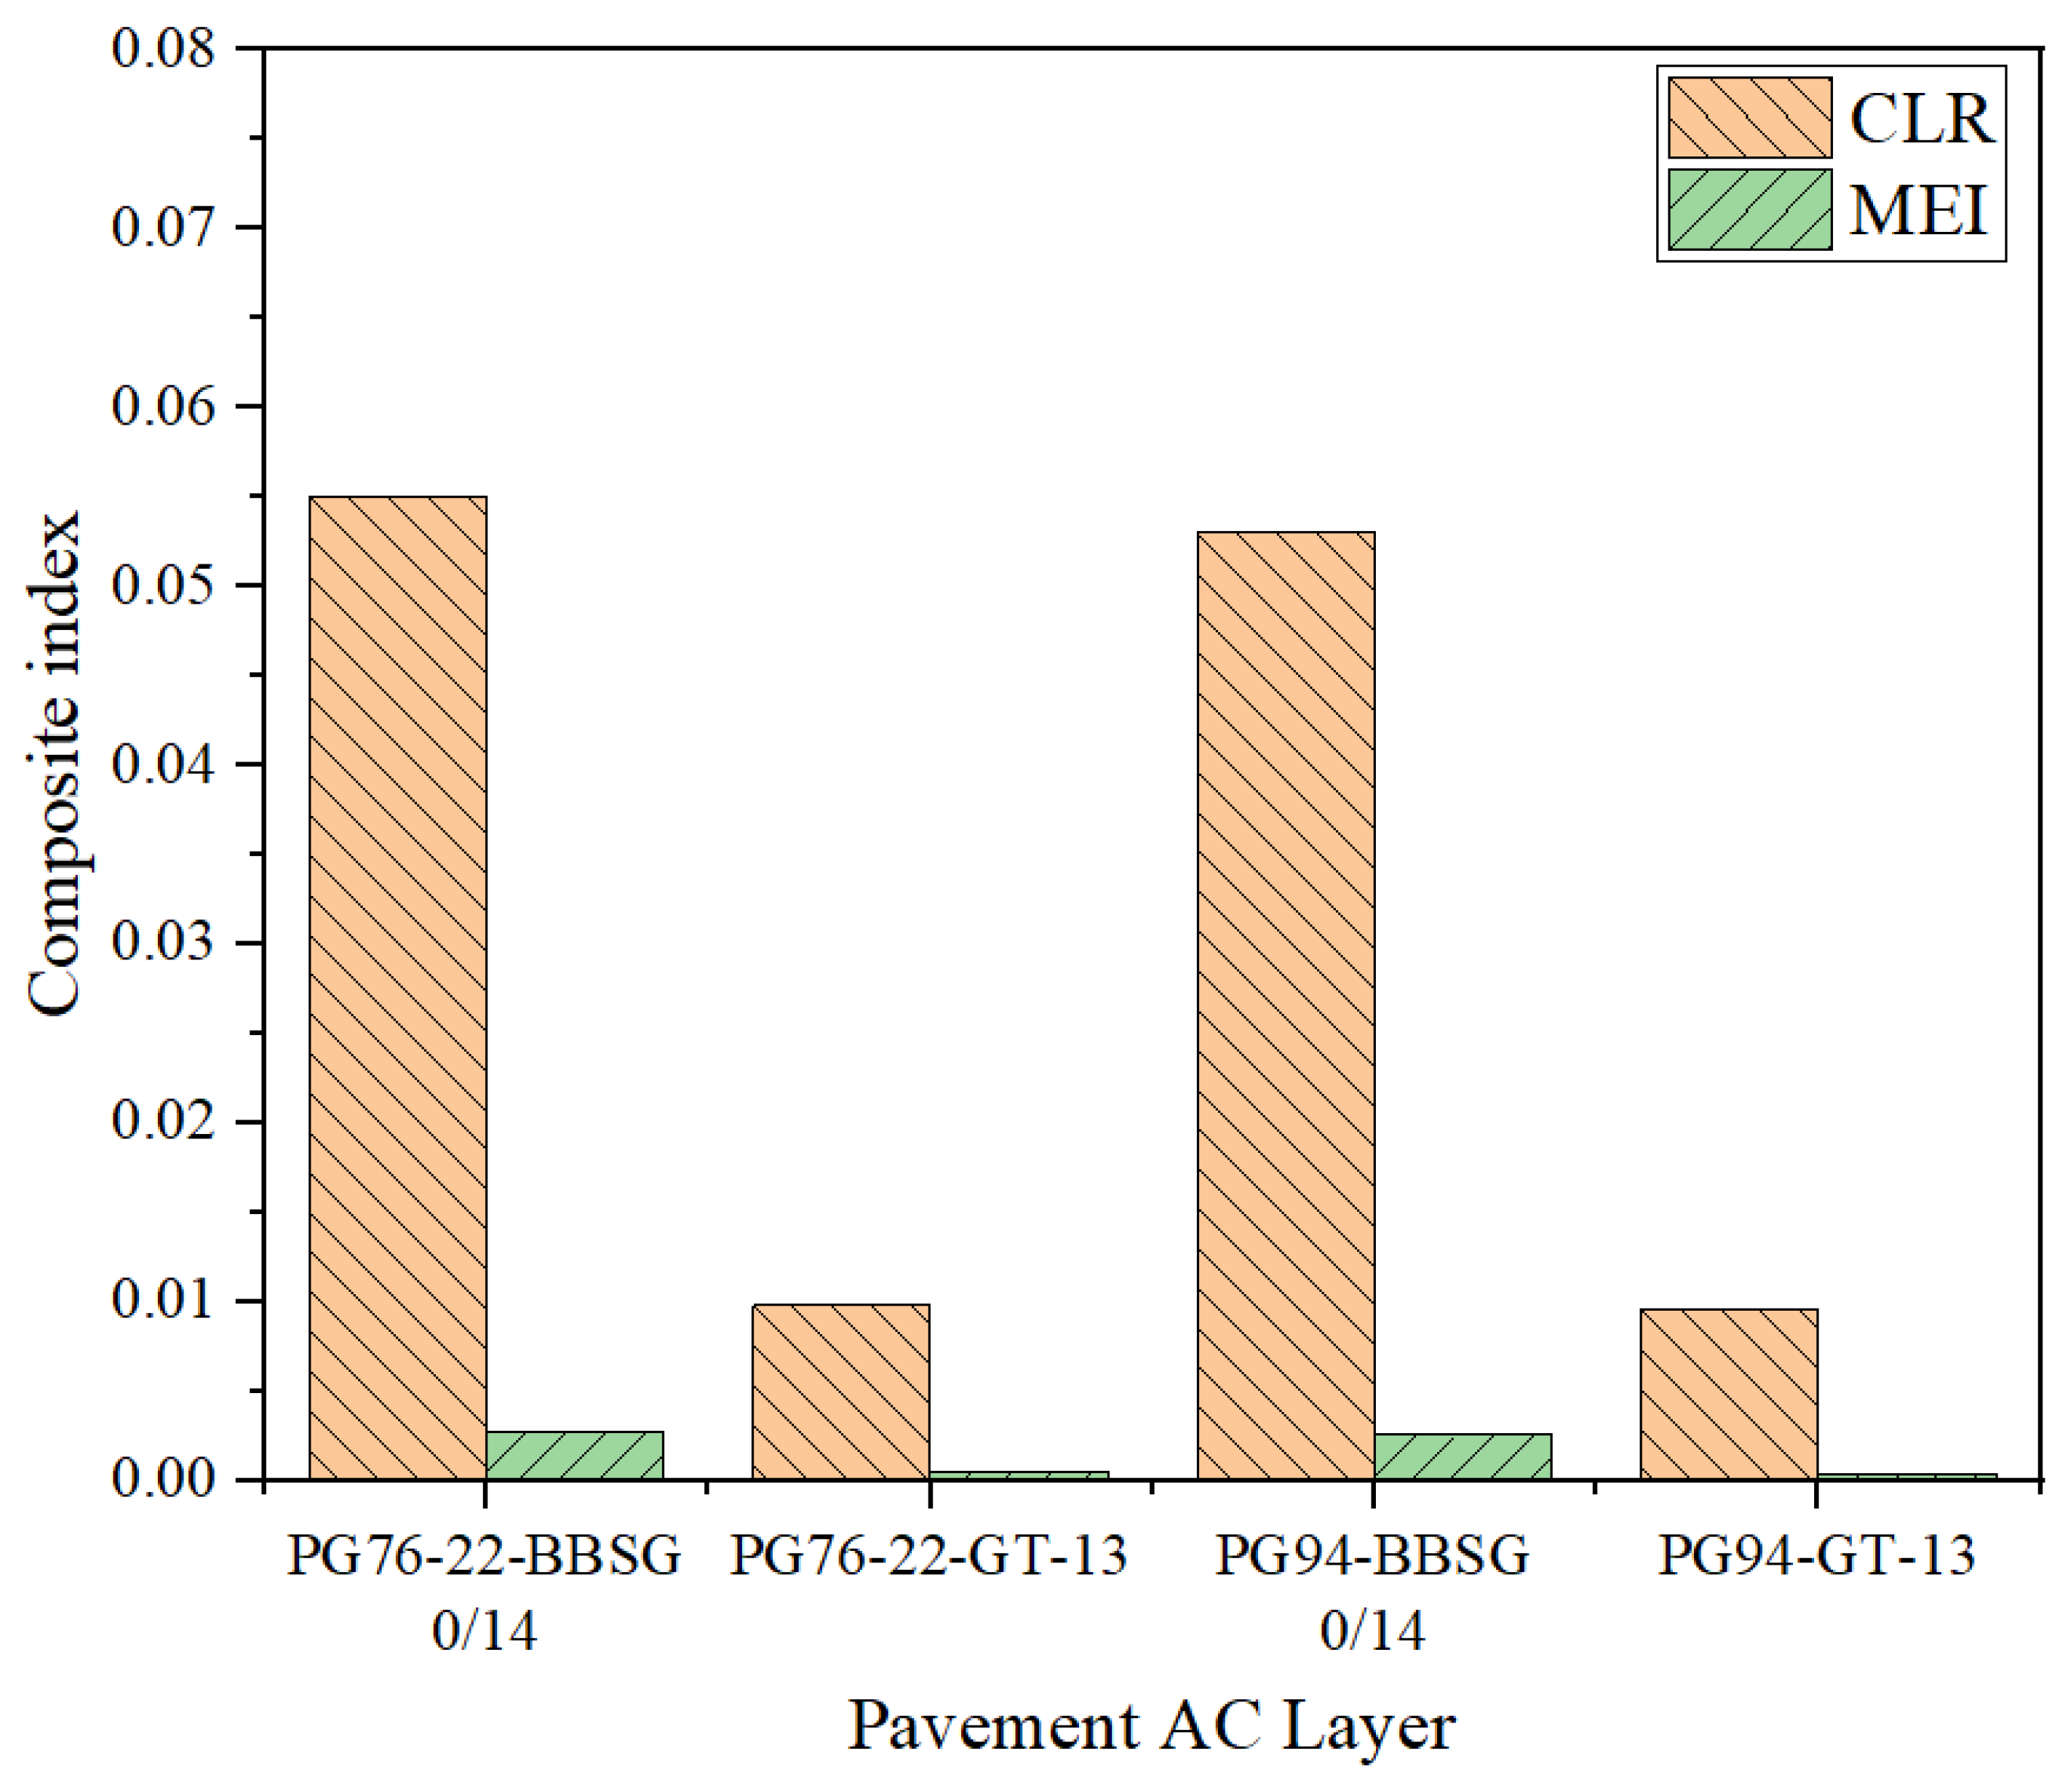
The 2026 cost breakdown from the Congolese Road Maintenance Authority (DGER) is presented in Table 17. The techno-economic evaluation based on the composite indices highlights the combined influence of binder grade and mixture type on the overall cost-effectiveness of pavement structures. The results presented in Table 18 and Figure 13 show that Structure 2 with PG76-22-BBSG 0/14 as the surface layer exhibits higher composite indices (CLR = 0.055 XAF/m2/Nf and MEI = 0.0028 XAF/m/Nf), indicating lower economic efficiency compared with the other evaluated structures. In contrast, the PG94-BBSG 0/14 mixture achieves a CLR of 0.0523 XAF/m2/Nf and an MEI of 0.0026 XAF/m/Nf, showing improved indicators compared with Structure 2. The GT-13 mixtures exhibit lower values, with PG76-22-GT-13 recording a CLR of 0.0098 XAF/m2/Nf and an MEI of 0.0005 XAF/m/Nf, while PG94-GT-13 achieves the lowest values (CLR = 0.0096 XAF/m2/Nf and MEI = 0.0004 XAF/m/Nf). These results indicate differences in the balance between cost, durability, and material efficiency among the evaluated mixtures. A sensitivity analysis was subsequently conducted by varying the PG94/PG76-22 price ratio from 1.5 to 3.0. The results indicate that GT-13 mixtures maintain lower CLR and MEI values than BBSG mixtures throughout the range investigated. At the current price ratio (~2.0), PG94-GT-13 presents the lowest indicators; however, this difference decreases as the PG94 price increases, and PG76-22-GT-13 becomes more favorable when the ratio exceeds approximately 2.1. The ranking between GT-13 and BBSG mixtures remains unchanged, indicating that binder price variations have a limited effect on the overall economic ranking.
Therefore, from a long-term performance and economic sustainability perspective, GT-13 demonstrates enhanced durability and cost-effectiveness as a surface course material for the Republic of the Congo.
The symbols used in this article and their meanings are summarized in Table 19.

4. Conclusions

This research highlights the decisive influence of binder grade and aggregate structure on the performance of asphalt mixtures under tropical conditions. Conventional BBSG 0/14, though widely used, shows limited durability in the tropical climate, whereas the denser GT-13 mixture demonstrates higher mechanical behavior and economic sustainability.
Compared to mixtures made with PG76-22, the mixture with PG94 had the lowest stiffness value across all testing temperatures and frequencies. At each test temperature and frequency, GT-13 had the highest elastic modulus value among the two asphalt binders compared to BBSG 0/14. When formulated with PG76-22 binder, GT-13 exhibited a 2.4%, 3.3%, and 14.6% higher dynamic modulus at 15 °C, 20 °C, and 28 °C, respectively. With PG94, the corresponding increases were 6.91%, 6.93%, and 13.21% at the same temperatures, respectively. At high temperatures, the dynamic modulus of the GT-13 mixture exceeded that of the BBSG 0/14 mixture by approximately 12% to 14%, depending on frequency and binder type, illustrating the enhanced efficacy of the GT-13 mixture in reducing tensile strains at the bottom of the asphalt layer.
High-performance binder significantly improves fatigue resistance, while the GT-13 gradation enhances internal cohesion and load distribution. Together, these properties produce a synergistic effect, extending the pavement life by more than 5.7 times compared with conventional BBSG 0/14. The equivalent theoretical design life of the asphalt wearing course may occur within approximately 6 years for the conventional BBSG 0/14, whereas it is extended to more than 28 years with GT-13. The result of BBSG 0/14 is consistent with field investigations conducted in the Republic of the Congo, where some sections of the roadway exhibited surface cracking within 5 years of service. This agreement suggests that the proposed fatigue prediction model is representative and reliable.
Techno-economic indicators further confirm that PG94-GT-13 offers the optimal balance among initial cost, performance, and maintenance frequency, making it the optimal design choice for major highways’ and freight corridors’ surface course material for the Republic of the Congo. Future work should focus on validating these laboratory findings through field studies, developing localized specifications for modified binders adapted to African tropical climates, and evaluating the proposed model using additional fatigue test results obtained under a wider range of strain levels and temperatures.

Author Contributions

Conceptualization, J.Y. and P.N.N.N.; methodology, P.N.N.N. and S.C.J.M.; validation, P.N.N.N., Z.Y., and Y.L.; data curation, P.N.N.N., Z.Y., and Y.L.; writing—original draft preparation, P.N.N.N. and S.C.J.M.; writing—review and editing, J.Y., Z.Y., and S.C.J.M.; visualization, S.C.J.M. and Y.L.; funding acquisition, J.Y. All authors have read and agreed to the published version of the manuscript.

Funding

The authors gratefully acknowledge financial support from the Special Project of Foshan Science and Technology Innovation Team [Grant No. 2120001010776], and the Shenzhen Science and Technology Program [Grant No. ZDCYKCX20250901092303004].

Data Availability Statement

The original contributions presented in this study are included in the article. Further inquiries can be directed to the corresponding authors.

Acknowledgments

The authors acknowledge the South China University of Technology and Central Fortune Creation Technology Group Co., Ltd. for their financial support through the Asphalt Laboratory Open Access and Funding Programs. The authors used https://quillbot.com (accessed on 22 July 2026) for language refinement purposes, specifically to check grammar and improve sentence clarity during manuscript preparation. The tool did not generate any original content or perform data analysis. All modifications were carefully reviewed and validated by the authors to ensure accuracy and integrity.

Conflicts of Interest

The authors Premier Niga Notchi Nogima, Jiangmiao Yu and Yunan Lin were employed by the company Central Fortune Creation Technology Group Co., Ltd. The remaining authors declare that this research was conducted in the absence of any commercial or financial relationships that could be construed as potential conflicts of interest.

References

  1. World Bank. World Bank Transport Report; World Bank: Washington, DC, USA, 2019. [Google Scholar]
  2. Service D’etudes Techniques des Routes et Autoroutes (SETRA). Laboratoire Central des Ponts et Chaussées (LCPC): Conception et Dimensionnement des Structures de Chaussée, Guide Technique; SETRA/LCPC: Paris, France, 1994. [Google Scholar]
  3. Mokoena, R.M.; Mturi, G.; Maritz, J.; Mateyisi, M.; Klein, P. African case studies: Developing pavement temperature maps for performance-graded asphalt bitumen selection. Sustainability 2022, 14, 1048. [Google Scholar] [CrossRef]
  4. Diouf, B.; Dione, A.; Faye, P.S.; Cissé, K. Influence of temperature on coated bituminous road structures in Senegal (West Africa). Open J. Civ. Eng. 2020, 10, 321–336. [Google Scholar] [CrossRef]
  5. 5. MATIER. Inventaire du Reseau Routier Bitume du Congo. Ministere de L’amenagement du Territoire, des Infrastructures et de L’entretien Routier; MATIER: Brazzaville, Congo, 2023. [Google Scholar]
  6. Li, W.; Cao, W.; Ren, X.; Lou, S.; Liu, S.; Zhang, J. Impacts of aggregate gradation on the volumetric parameters and rutting performance of asphalt concrete mixtures. Materials 2022, 15, 4866. [Google Scholar] [CrossRef] [PubMed]
  7. Zou, Y.; Xu, H.; Xu, S.; Chen, A.; Wu, S.; Amirkhanian, S.; Wan, P.; Gao, X. Investigation of the moisture damage and the erosion depth on asphalt. Constr. Build. Mater. 2023, 369, 130503. [Google Scholar] [CrossRef]
  8. Sidibé, D.; Lecomte, A.; Somparé, M.; Loua, H. Asphalt roadholding in a tropical climate: The example of Guinea. Trends Civ. Eng. Its Archit. 2021, 4. Available online: https://lupinepublishers.com/civil-engineering-journal/fulltext/asphalt-roadholding-in-a-tropical-climate.ID.000186.php (accessed on 17 July 2026).
  9. Wei, J.; Li, Y.; Ju, H.; Liu, Y.; Peng, W.; Huang, M.; Xiao, X.; Zhou, Y. Performance damage evolution of asphalt mixture under large/quick humidity–temperature fluctuations cycles. Case Stud. Constr. Mater. 2025, 23, e05079. [Google Scholar] [CrossRef]
  10. Cui, P.; Ma, T.; Wu, S.; Xu, G.; Wang, F. Texture characteristic and its enhancement mechanism in stone mastic asphalt incorporating steel slag. Constr. Build. Mater. 2023, 369, 130440. [Google Scholar] [CrossRef]
  11. Kozel, M.; Remek, Ľ.; Mikolaj, J.; Mušuta, J.; Šrámek, J.; Mazurek, G. Performance and lifecycle of hot asphalt Mix modified with low-percentage polystyrene and polybutadiene compounds. Buildings 2024, 14, 389. [Google Scholar] [CrossRef]
  12. Chen, S.; Pan, Y.; Zhang, B.; He, X.; Su, Y.; Liu, Q.; Wang, Y.; Wang, W.; Chen, J.; Zhu, Y.; et al. Preparation and properties of pre-treated nano-bentonite incorporated styrene-butadiene-styrene (SBS) modified asphalt. Case Stud. Constr. Mater. 2023, 19, e02505. [Google Scholar] [CrossRef]
  13. Chen, Z.; Huang, W.; Wu, K.; Nie, G.; Zheng, Y.; Song, J.; Cai, X.; Wu, J.; Huang, J. Performance degradation of styrene-butadiene-styrene modified asphalt binder at ultra-high temperature: Process of construction in fluid mastic asphalt. Case Stud. Constr. Mater. 2023, 19, e02490. [Google Scholar] [CrossRef]
  14. Bańkowski, W.; Gajewski, M.; Horodecka, R.; Mirski, K.; Targowska-Lech, E.; Jasiński, D. Assessment of the effect of the use of highly-modified binder on the viscoelastic and functional properties of bituminous mixtures illustrated with the example of asphalt concrete for the binder course. Constr. Build. Mater. 2021, 296, 123412. [Google Scholar] [CrossRef]
  15. He, X.; Tan, M.; Yang, D.; Zhu, X.; Tan, S.; Yang, X. Rheological properties of SBS-modified asphalt containing aluminum hydroxide and organic montmorillonite. Case Stud. Constr. Mater. 2023, 19, e02491. [Google Scholar] [CrossRef]
  16. Lee, S.Y.; Yun, Y.M.; Minh Le, T.H. Influence of performance-graded binders on enhancing asphalt mixture performance with epoxy resin and crumb rubber powder. Case Stud. Constr. Mater. 2023, 19, e02628. [Google Scholar] [CrossRef]
  17. Sengul, C.E.; Oruc, S.; Iskender, E.; Aksoy, A. Evaluation of SBS modified stone mastic asphalt pavement performance. Constr. Build. Mater. 2013, 41, 777–783. [Google Scholar] [CrossRef]
  18. Do, T.C.; Nguyen, T.H.; Nguyen, V.L. Experimental study on the resistance of asphalt mixtures to permanent deformation and its relation to mechanical behavior of pavement structures. Case Stud. Constr. Mater. 2025, 22, e04248. [Google Scholar] [CrossRef]
  19. Du, Y.; Chen, J.; Han, Z.; Liu, W. A review on solutions for improving rutting resistance of asphalt pavement and test methods. Constr. Build. Mater. 2018, 168, 893–905. [Google Scholar] [CrossRef]
  20. Pan, Y.; Guo, H.; Guan, W.; Zhao, Y. A Laboratory evaluation of factors affecting rutting resistance of asphalt mixtures using wheel tracking test. Case Stud. Constr. Mater. 2023, 18, e02148. [Google Scholar] [CrossRef]
  21. Zhang, C.; Tan, Y.; Gao, Y.; Fu, Y.; Li, J.; Li, S.; Zhou, X. Resilience assessment of asphalt pavement rutting under climate change. Transp. Res. Part D 2022, 109, 103395. [Google Scholar] [CrossRef]
  22. Partl, M.N.; Pasquini, E.; Canestrari, F.; Virgili, A. Analysis of water and thermal sensitivity of open graded asphalt rubber mixtures. Constr. Build. Mater. 2010, 24, 283–291. [Google Scholar] [CrossRef]
  23. Hefer, A.; O’Connell, L. HMA performance data compilation in South Africa: Calibration of fatigue and rutting models. In Proceedings of the 11th Conference on Asphalt Pavements for Southern Africa: CAPSA15, Sun City, South Africa, 16–19 August 2015; TRID Transportation Research Database. Available online: https://trid.trb.org/View/1404816 (accessed on 17 July 2026).
  24. Xie, N.; Peng, X.; He, Y.; Lei, W.; Pu, C.; Meng, H.; Ma, H.; Tan, L.; Zhao, P. Investigation on performance and durability of bone glue and crumb rubber compound modified asphalt and its mixture. Case Stud. Constr. Mater. 2023, 19, e02437. [Google Scholar] [CrossRef]
  25. Zhi, S.; Gun, W.W.; Hui, L.X.; Bo, T. Evaluation of fatigue crack behavior in asphalt concrete pavements with different polymer modifiers. Constr. Build. Mater. 2012, 27, 117–125. [Google Scholar] [CrossRef]
  26. Sadeghian, M.; Latifi Namin, M.; Goli, H. Evaluation of the fatigue failure and recovery of SMA mixtures with cellulose fiber and with SBS modifier. Constr. Build. Mater. 2019, 226, 818–826. [Google Scholar] [CrossRef]
  27. Airey, G.D. Rheological properties of Styrene butadiene styrene polymer modified road bitumens. Fuel 2003, 82, 1709–1720. [Google Scholar] [CrossRef]
  28. Hunter, R.N.; Self, A.; Read, J. Shell. In Shell Bitumen Handbook, 6th ed.; ICE Publishing: London, UK, 2015. [Google Scholar]
  29. JTG 3432-2024; Test Methods of Aggregates for Highway Engineering. Ministry of Transport of the People’s Republic of China: Beijing, China, 2024.
  30. JTG F40-2004; Technical Specifications for Construction of Highway Asphalt Pavements. Ministry of Transport of the People’s Republic of China: Beijing, China, 2004.
  31. ARP/DG/23; High-Toughness Asphalt Wearing Course. Geotechnical Engineering Department, Civil Engineering Laboratory of Macao: Macao, China, 2023.
  32. DB44/T 2623-2025; Technical Specifications for High-Toughness Ultra-Thin Friction Course in Road Engineering. Guangdong Provincial Administration for Market Regulation: Guangzhou, China, 2025.
  33. JTG E20-2011; Standards Test Methods of Bitumen and Bituminous Mixture for Highway Engineering. Ministry of Transport of the People’s Republic of China: Beijing, China, 2011.
  34. NF EN 13108-1; Mélange Bitumineux-Spécifications des Matériaux Partie 1: Enrobes Bitumineux à Chauds. AFNOR: La Plaine Saint-Denis, France, 2017.
  35. NF P98-130; Couches de Roulement et Couches de Liaison: Béton Bitumineux Semi-Grenus (BBSG 0/14). AFNOR: La Plaine Saint-Denis, France, 1999.
  36. NF P98-086; Dimensionnement Structurel des Chaussées Routières—Application aux Chaussées Neuves. AFNOR: La Plaine Saint-Denis, France, 2019.
  37. NF EN 12697-5; Mélange Bitumineux-Méthodes d’essai—Partie 5: Masse Volumique Réelle (MVR). AFNOR: La Plaine Saint-Denis, France, 2018.
  38. NF EN 12697-31; Mélange Bitumineux-Méthodes d’essai Pour Mélange Hydrocarboné à Chaud. Partie 31: Confection D’éprouvettes à la Presse a Compactage Giratoire. AFNOR: La Plaine Saint-Denis, France, 2004.
  39. AASHTO T342-11; Standard Method of Test for Determining Dynamic Modulus of Hot Mix Asphalt (HMA). AASHTO: Washington, DC, USA, 2014.
  40. AASHTO T321-07; Standard Method of Test for Determining the Fatigue Life of Compacted Hot Mix Asphalt (HMA) Subjected to Repeated Flexural Bending. AASHTO: Washington, DC, USA, 2014.
  41. Primusz, P.; Kisfaludi, B.; Tóth, C.; Péterfalvi, J. Comparing load-bearing capacity and cost of lime-stabilized and granular road bases for rural road pavements. Constr. Mater. 2025, 5, 74. [Google Scholar] [CrossRef]
  42. LCPC–SETRA. Catalogue des structures types de chaussées neuves. In Laboratoire Central des Ponts et Chaussées (LCPC)–Service d’Études Techniques des Routes et Autoroutes; SETRA: Paris, France, 1998. [Google Scholar]
  43. Road Engineering Research Institute of South China University of Technology. Fatigue Prediction Model for Asphalt Layer; Road Engineering Research Institute of South China University of Technology: Guangzhou, China, 2011. [Google Scholar]
  44. Adhikari, S.; Shen, S.; You, Z. Evaluation of fatigue models of hot-mix asphalt through laboratory testing. Transp. Res. Rec. 2009, 2127, 36–42. [Google Scholar] [CrossRef]
  45. Mulian, Z.; Peng, L.; Jiangang, Y.; Hongyin, L.; Yangyang, Q.; Zhengliang, Z. Fatigue Life Prediction of High Modulus Asphalt Concrete Based on the Local Stress-Strain Method. Appl. Sci. 2017, 7, 305. [Google Scholar] [CrossRef]
Figure 1. The research methodology algorithm.
Buildings 16 03004 g001
Figure 2. GT-13 gradation curves and grading envelope.
Buildings 16 03004 g002
Figure 3. BBSG 0/14 gradation curves and grading envelope.
Buildings 16 03004 g003
Figure 4. Relationships between asphalt content and volumetric/Marshall parameters. (a) BSG (bulk specific gravity); (b) AV (air voids); (c) VMA (voids in mineral aggregate); (d) VFA (voids filled with asphalt); (e) MS (Marshall Stability); (f) FV (flow value).
Buildings 16 03004 g004aBuildings 16 03004 g004b
Figure 5. Uniaxial compression testing: (a) specimens after compaction; (b) specimen during testing.
Buildings 16 03004 g005
Figure 6. Four-point bending fatigue tests: (a) beam specimens; (b) specimen during testing.
Buildings 16 03004 g006
Figure 7. Dynamic modulus: (a) at 10 Hz; (b) at 25 Hz.
Buildings 16 03004 g007
Figure 8. Fatigue resistance curves.
Buildings 16 03004 g008
Figure 9. Location of RN2. Source: cityvistion.cn.
Buildings 16 03004 g009
Figure 10. Comparison of horizontal strain at the bottom of the AC layer.
Buildings 16 03004 g010
Figure 11. Comparison of vertical strain on top of the subgrade.
Buildings 16 03004 g011
Figure 12. Predicted fatigue cracking life and associated damage for all pavement structures.
Buildings 16 03004 g012
Figure 13. Composite indices.
Buildings 16 03004 g013
Table 1. Technical properties of coarse aggregate.
Test ItemsRequirementsResultsTest Method
Crushing value (%)≤2623.1JTG 3432 T0316
LA abrasion loss value (%)≤2822.3JTG 3432 T0317
Apparent relative density≥2.62.728JTG 3432 T0304
Water absorption (%)≤20.391JTG 3432 T0304
Flat/elongated particles content (%)≤126.1JTG 3432 T0312
Table 2. Technical properties of fine aggregate.
Test ItemsRequirementsResultsTest Method
Apparent relative density≥2.52.700JTG 3432 T0328
Soundness (>0.3 mm) (%)≤128JTG 3432 T0340
Sand equivalent (%)≥6065JTG 3432 T0334
Table 3. Technical properties of powder.
Test ItemsRequirementsResultsTest Method
Apparent specific gravity≥2.52.672JTG 3432 T0352
Moisture content (%)≤10.2JTG 3432 T0359
Hydrophilic coefficient<10.7JTG 3432 T0353
Plasticity index (%)<42.8JTG 3432 T0354
Table 4. Technical properties of modified asphalt binders.
Test ItemsPG76-22PG94Test Method
RequirementsResultsRequirementsResults
25 °C Penetration (0.1 mm)40~805430~6041T0604
Softening point (°C)≥7679≥9293.5T0606
Solubility in trichloroethylene (%)≥9999.8≥9999.5T0607
Flash point (°C)≥230337≥260318T0611
60 °C Dynamic viscosity (Pa°s)>30,00065,462>580,000>580,000T0620
25 °C Elastic recovery (%)≥9096≥9699T0662
Properties of the RTFOT residue (%)
Mass change±1−0.023±1−0.048T0609
Residual penetration ratio (25 °C)≥6578.4≥7082.9T0604
Table 5. GT-13: each gradation group’s design Marshall test results.
Gradations
Design
BSGAV
(%)
VMA
(%)
VFA
(%)
MS
(kN)
FV
(0.1 mm)
VCAmix
(%)
VCADRC
(%)
Gradation12.3923.515.477.414.773.140.143.03
Gradation 22.4252.114.285.113.954.942.242.68
Gradation 32.4311.914.086.815.256.744.843.71
Notes: BSG (bulk specific gravity), AV (air voids), VMA (voids in mineral aggregate), VFA (voids filled with asphalt), MS (Marshall Stability) and FV (flow value), VCADRC (voids in the coarse aggregate skeleton), VCAmix (voids in the coarse aggregate of asphalt mixture).
Table 6. GT-13 gradation limits.
Cumulative Passing (%)
Sieve size (mm)1613.29.54.752.361.180.60.30.150.075
Upper limit100100754532221816128
Lower limit100905022151311864
Blended Gradation 1100936329.121.316.212.18.97.46.2
Blended Gradation 2100936332.424.518.513.69.88.06.7
Blended Gradation 3100936335.727.720.815.110.78.77.2
Table 7. BBSG 0/14 gradation limits.
Cumulative Passing (%)
Sieve size (mm)1614106.3420.50.250.1250.063
Upper limit1001001007050352015108
Lower limit100908050352010544
Blended gradation10098.188.357.739.427.81510.68.66.3
Table 8. Experimental results of Marshall test method (average of 4 specimens by mixture).
Asphalt Content (%)BSGAV
(%)
VMA
(%)
VFA
(%)
MS
(KN)
FV
(0.1 mm)
5.62.3794.515.671.012.332.6
5.82.3864.015.574.514.192.8
6.02.3923.515.477.414.773.1
6.22.3953.115.580.013.973.6
6.42.3942.915.681.511.334.2
Notes: BSG (bulk specific gravity), AV (air voids), VMA (voids in mineral aggregate), VFA (voids filled with asphalt), MS (Marshall Stability), and FV (flow value).
Table 9. Dynamic modulus test results.
AC MixturesFrequencies
Hz
E (15 °C)
MPa
E (20 °C)
MPa
E (28 °C)
MPa
PG94BBSG 0/14107192 ± 725774 ± 553361 ± 90
GT-137689 ± 836174 ± 913805 ± 68
BBSG 0/14258685 ± 957015 ± 894251 ± 80
GT-139286 ± 877578 ± 784772 ± 92
PG76-22BBSG 0/141010,102 ± 667051 ± 484266 ± 81
GT-1310,340 ± 717285 ± 594887 ± 76
BBSG 0/142511,964 ± 669105 ± 745522 ± 95
GT-1312,255 ± 859451 ± 816308 ± 54
Table 10. Fatigue life test results.
Binder TypeStrain Levels
(με)
Temp.
(°C)
BBSG 0/14
Nf (106 Cycles)
Flexural Stiffness (S0) (104 MPa)GT-13
Nf (106 Cycles)
Flexural Stiffness (S0) (104 MPa)
PG94300103.19 ± 0.00181.20 ± 0.0133.22 ± 0.00161.48 ± 0.012
400153.05 ± 0.00200.90 ± 0.0103.16 ± 0.00171.06 ± 0.014
500200.91 ± 0.00210.61 ± 0.0091.90 ± 0.00190.77 ± 0.010
280.40 ± 0.00300.26 ± 0.0101.79 ± 0.00280.24 ± 0.010
800280.12 ± 0.00430.24 ± 0.0110.48 ± 0.00300.22 ± 0.009
1000280.07 ± 0.00680.22 ± 0.0080.26 ± 0.00560.22 ± 0.010
PG76-22300102.33 ± 0.00151.57 ± 0.0132.51 ± 0.00131.65 ± 0.016
400152.23 ± 0.00151.17 ± 0.0012.43 ± 0.00141.41 ± 0.013
500200.71 ± 0.00160.80 ± 0.0081.56 ± 0.00161.02 ± 0.011
280.29 ± 0.00220.34 ± 0.0101.29 ± 0.00210.31 ± 0.008
800280.09 ± 0.00310.32 ± 0.0100.35 ± 0.00220.29 ± 0.008
1000280.05 ± 0.00490.28 ± 0.0090.18 ± 0.00410.29 ± 0.008
Table 11. Validation results.
Mix TypeStrain Levels
(με)
Predicted Value
N f P
Measured Value
N f M
Relative Deviation
RD (%)
PG94BBSG 0/14500396,093399,4000.83
800117,419119,1151.42
100065,92267,6752.59
GT-135001,643,2181,788,5258.12
800433,322481,3059.97
1000230,130256,80010.39
PG76-22BBSG 0/14500290,620291,5620.32
80086,15286,9500.92
100048,36849,4002.09
GT-135001,246,8851,287,7383.17
800332,851345,6503.70
1000177,800184,9003.84
Table 12. Structure and pavement parameters.
Pavement LayerMaterial TypeThickness/mmModulus/MPa (28 °C)Poisson’s Ratio
SurfaceAC50–100Vary depending on mix type0.40
BaseGNT12506000.35
SubbaseGNT22004000.35
SubgradePF3-1200.35
Notes: AC (asphalt concrete); GNT 1 (Grave Non Traité); PF3 (Plate-Forme).
Table 13. Modulus and Poisson’s ratio for each layer.
Mix TypeModulus/MPa (28 °C, 25 Hz)Poisson’s Ratio
PG76-22-BBSG 0/1459940.4
PG94-BBSG 0/1442510.4
PG76-22-GT-1363080.4
PG94-GT-1347720.4
Table 14. Material parameters.
AC MixturePG94-
BBSG 0/14
PG76-22-BBSG 0/14PG94-
GT-13
PG76-22-
GT-13
ε 6   28   ° C ; 25   H z (μƐ)348308548616
B   28   ° C ; 25   H z −0.391−0.391−0.257−0.257
E   10   ° C ; 25   H z 11,60120,90813,15916,214
k θ 1.651.871.661.60
k r 0.7230.7230.7220.722
k c 1.11.11.11.1
k s 1111
Table 15. Internal strain results (μƐ).
Pavement CasesAC LayerAC Bottom Lay.PF 3
ƐfƐt-admƐrƐz-adm
Structure 1PG94-BBSG 0/14150.1413.7387.8502.3
Structure 2PG76-22-BBSG 0/14151.1431.2381.5502.3
Structure 3PG94-GT-13151.0741.3385.0502.3
Structure 4PG76-22-GT-13150.0636.7378.4502.3
Table 16. Fatigue life prediction results.
Pavement CasesStructure 1Structure 2Structure 3Structure 4
Nf8,907,0946,423,96349,022,49836,738,012
NE1,293,2001,293,2001,293,2001,293,200
D0.1450.2010.0260.035
1/D6.904.9838.4628.57
Table 17. Cost breakdown of materials in 2026.
S.№Material TypeUnitCost (XAF)
1PG76-22Ton737,100
2PG94Ton1,458,360
3PG76-22-BBSG 0/14 (5 cm)m2353,662
4PG94-BBSG 0/14 (5 cm)m2469,026
5PG76-22-GT-13 (5 cm)m2357,914
6PG94-GT-13 (5 cm)m2473,278
7GNT 0/31 (25 cm)m2110,875
8GNT 0/25 (20 cm)m278,272
Table 18. Composite indices’ results.
Asphalt MixtureLife (Nf)Coast
X A F m 2
Hm
(m)
CLR
X A F m 2 × N f
MEI
X A F m × N f
PG76-22-BBSG 0/146,423,963353,6620.050.0550.0028
PG94-BBSG 0/148,907,094469,0260.050.0530.0026
PG76-22-GT-1336,738,012357,9140.050.00980.0005
PG94-GT-1349,022,498473,2780.050.00960.0004
Table 19. Symbol index.
SymbolMeaning
VCADRCPercentage voids in the coarse aggregate skeleton
BSGSpecimens’ bulk specific gravity
AVAir voids
VMAVoids in mineral aggregate
VFAVoids filled with asphalt
E * Dynamic modulus for frequency
ε * Average strain magnitude
S 0 Dynamic flexural stiffness modulus
NfThe fatigue life
DFatigue damage
NPLHeavy goods vehicles
NEReference axle loads
CAMThe average traffic aggressiveness coefficient
CLRCost-Life Ratio
MEIMaterial Efficiency Index
Disclaimer/Publisher’s Note: The statements, opinions and data contained in all publications are solely those of the individual author(s) and contributor(s) and not of MDPI and/or the editor(s). MDPI and/or the editor(s) disclaim responsibility for any injury to people or property resulting from any ideas, methods, instructions or products referred to in the content.