


Abstract
Rapid and accurate building damage assessment is essential for effective post-disaster response, yet the development of reliable artificial intelligence (AI) models remains constrained by the limited availability of high-quality, operationally relevant benchmark datasets. To address this gap, this paper presents AFTERMAP (Aerial FEMA-Aligned Targeted Extraction and Reconstruction Mapping for Post-Disaster Building Damage), a benchmark UAV imagery dataset for instance segmentation of post-disaster building damage. The dataset contains 1926 high-resolution UAV images with pixel-level annotations for five building damage categories, following FEMA Preliminary Damage Assessment (PDA) guidelines where applicable: Destroyed, Major Damage, Minor Damage, Tarp, and No Damage. Using AFTERMAP, we benchmarked recent YOLO-based instance segmentation models and evaluated their performance using mAP50 and mAP50-95. Among the evaluated models, YOLO26-L achieved the best performance, obtaining a test mAP50 of 0.600 and outperforming both Mask R-CNN (0.524) and Mask2Former (0.368) in cross-architecture comparisons. Model generalization was further demonstrated through an independent case study using UAV imagery collected after the 2025 Somerset–London tornado in Kentucky, where the trained model successfully identified building-level damage patterns under real-world field conditions. The results demonstrate that AFTERMAP provides a challenging and realistic benchmark for UAV-based post-disaster building damage assessment. By combining FEMA-aligned annotations with high-resolution UAV imagery, the dataset establishes a standardized resource for developing and evaluating instance segmentation models that can support rapid post-disaster damage assessment and emergency response.
1. Introduction
Natural hazards such as hurricanes and tornadoes become disasters when they intersect with exposed and vulnerable communities, resulting in significant human, physical, and economic consequences. When the broader impacts on health, education, livelihoods, ecosystems, and supply chains are also taken into account, the total global economic burden of disasters rises sharply to nearly USD 2.3 trillion per year [1]. Within this global context, the United States represents a striking example of the escalating consequences of natural hazards. The country has incurred an enormous financial burden, with cumulative disaster-related costs exceeding USD 2 trillion between 1980 and 2021. Beyond the economic toll, these events have also resulted in significant human losses, with 15,347 fatalities recorded over the same period [2]. These impacts highlight not only the increasing frequency and intensity of natural hazards but also the growing vulnerability of communities and infrastructure. With the rise of frequency and intensity of such events, a growing burden on emergency management agencies who are responsible for rapid and accurate damage characterization are also growing.
Although advances in satellite technology have made it increasingly conceivable to predict the trajectory and timing of natural disasters, accurately estimating how many buildings or structures within a community may ultimately be affected remains a significant challenge. Therefore, preparing for post-disaster rescue operations is also an important and essential part of any disaster management process, especially for wind-based disasters, as the intensity of such events may increase or decrease at the very last moment before they hit a community. Given this uncertainty, together with constraints such as personnel shortages and variability in the expertise of first responders in post-disaster environments, the integration of advanced technologies to support and streamline response operations has become increasingly important. While the first responders follow certain protocols and guidelines during the post disaster situation, one of the common methods is following the Preliminary Damage Assessment (PDA) guidelines which is an important part of the U.S. federal disaster response framework [3]. The PDA guideline is a structured process defined by the Federal Emergency Management Agency (FEMA) that determines the scale of infrastructure damage, informs Presidential disaster declaration requests, and guides the allocation of recovery resources [4]. The PDA categorizes manufactured and conventionally built residential structures into five primary damage states: Affected, Minor, Major, Destroyed, and Inaccessible, all of which are operationally significant for emergency management personnel.
Traditional PDA methods involve door-to-door or windshield surveys conducted by trained assessors, a process that is inherently slow, personnel-intensive, and potentially dangerous when access to affected areas is restricted by debris, flooding, or structural instability. The 2017 Atlantic hurricane season, which comprised Hurricanes Harvey, Irma, and Maria, collectively caused approximately USD 265 billion in damage and produced thousands of damaged housing units across Texas, Florida, and Puerto Rico, overwhelming the capacity of conventional assessment workflows and underscoring the urgent need for scalable, automated damage mapping tools [2,5]. Given the critical 72 h post-disaster response window and the inherent uncertainty regarding the extent of the affected area, the number of buildings impacted, and the nature of the resulting damage, the need for efficient post-disaster assessment remains critical [6].
Nowadays, emergency management personnel and first responders are adopting the latest technologies, such as small Unmanned Aerial Vehicles (UAVs), which have emerged as a transformative tool for post-disaster reconnaissance by offering low-altitude, high-resolution imagery that captures fine-grained structural detail inaccessible from satellite platforms [7]. Unlike spaceborne imagery, UAV imagery achieves sub-decimeter ground sampling distances (GSD), allowing inspectors and algorithms alike to observe roof integrity, wall collapse, debris scattering, and the installation of emergency roof tarpaulins, all features directly relevant to PDA classification. However, to automate the understanding of damage levels from UAV footage, researchers are adopting various techniques and algorithms to improve and automate damage assessment from UAV images. Thus, the integration of deep learning-based instance segmentation with UAV imagery presents a compelling pathway to automate damage mapping at scale. Consequently, there is a need for a proper dataset to further train deep learning algorithms and improve efficiency in the field.
Despite this promise, a critical gap remains in the field. Many existing disaster datasets are limited to satellite-scale resolution, which restricts their ability to capture fine-grained, building-level damage. In addition, a substantial number of these datasets do not provide pixel-level annotations necessary for detailed segmentation tasks. Also, some available datasets adopt damage taxonomies that do not align with operationally recognized frameworks, such as FEMA’s Preliminary Damage Assessment (PDA) damage levels.
To address this challenge, we introduce AFTERMAP, a novel FEMA-aligned UAV image dataset specifically engineered to bridge the gap between computer vision research and operational disaster response practice. The main contributions of this research are:
First, we developed a comprehensive dataset comprising 1926 high-resolution post-disaster UAV images collected from multiple wind-induced disaster events across the United States. The dataset captures a diverse range of damaged intensities and geographic locations, enhancing its representativeness and facilitating its broad applicability for research and practical implementation.
Secondly, we provide pixel-wise instance annotations spanning five classes: three FEMA PDA-aligned building damage levels (Minor Damage, Major Damage, Destroyed), along with Tarp and No Damage classes.
Thirdly, we present a comprehensive performance evaluation of YOLO (You Only Look Once) segmentation architectures for post-disaster damage assessment.
Finally, we establish a structured data collection and annotation protocol designed with FEMA PDA criteria as the guiding taxonomy, ensuring that model outputs are structured according to operationally recognized damage categories and can support integration with existing emergency management workflows.
The research is organized as follows: Section 2 reviews related work on disaster dataset construction and instance segmentation for damage assessment. Section 3 describes the AFTERMAP dataset, including data collection, annotation methodology, and class distribution. Section 4 presents the experimental framework and results of baseline segmentation models. Section 5 discusses findings, limitations, and directions for future research. Section 6 concludes the paper.
2. Literature Review
2.1. Datasets for Post-Disaster Building Damage Assessments
The development of data-driven disaster response tools is fundamentally constrained by the availability of high-quality, labeled imagery. Early remote-sensing efforts relied heavily on publicly available satellite imagery and CNN-based change detection to identify disaster-affected areas, often using pre and post-disaster imagery to detect changes in man-made features such as roads and buildings rather than detailed multi-class damage labels [8]. A landmark contribution to the field was the xBD dataset [9], which contains 850,736 building annotations across 45,362 km2 of satellite imagery, spanning 15 disaster types and four distinct damage levels: No Damage, Minor Damage, Major Damage, and Destroyed. The accompanying xView2 challenge catalyzed substantial algorithmic innovation, yielding a range of deep learning approaches for joint building localization and damage classification [10,11].
For UAV-based assessment, RescueNet [12] represents a seminal benchmark. Comprising post-disaster images from Hurricane Michael collected by UAVs across multiple impacted regions, RescueNet provides pixel-level annotations for a comprehensive set of scene classes, enabling full-scene understanding rather than building-only analysis. Experiments on the RescueNet dataset showed that SegFormer achieved a mean Intersection over Union (mIoU) of 96%, substantially outperforming conventional CNN-based segmentation models such as U-Net, SegNet, PSPNet, and DeepLabV3+ in quantitative evaluations [13]. The FloodNet dataset [14] similarly provides high-resolution UAV imagery annotated for flood inundation and structural damage assessment, with real-time segmentation benchmarks establishing that SegFormer achieves superior accuracy, while lightweight encoder–decoder architectures offer competitive performance under computational constraints [15]. Other notable datasets include LADI v2 [16], a multi-label low-altitude disaster imagery dataset collected by the Civil Air Patrol, and the 3DAeroRelief dataset [17], which extends UAV-based damage assessment into 3D point cloud semantics using Structure-from-Motion reconstruction. However, none of these resources directly address FEMA PDA taxonomy or the operational workflows of first responders, creating a persistent gap between research benchmarks and field practice. Singh et al. presented a semi-supervised PDA framework that leverages ultra-high-resolution aerial imagery and transformer-based models for building-level damage prediction [18]. Their study emphasizes that automated PDA tools must achieve performance comparable to human assessments before they can be adopted in practice. Building on this line of research, AFTERMAP directly contributes to this emerging research area by providing a standardized pixel-level training resource aligned with FEMA’s PDA taxonomy.
2.2. Segmentation Architectures
Image segmentation for post-disaster damage assessment encompasses two distinct paradigms: semantic segmentation, which assigns a class label to each pixel without differentiating between individual object instances, and instance segmentation, which generates a separate mask for each detected object instance. Early breakthroughs in semantic segmentation were driven by Fully Convolutional Networks (FCNs), which introduced an end-to-end framework for dense, pixel-wise prediction by replacing fully connected layers with convolutional operations [19]. Building upon this foundation, subsequent architectures adopted encoder–decoder designs to better recover spatial resolution through learned upsampling mechanisms, improving segmentation accuracy in complex scenes. Among these, U-Net, originally proposed for biomedical image segmentation, introduces skip connections between corresponding encoder and decoder layers, enabling the preservation of fine-grained spatial details and improved boundary localization [20]. This architecture has since been widely adopted across domains, including remote sensing and aerial imagery analysis [21,22,23].
Building on these foundational encoder–decoder frameworks, later research increasingly focused on improving multi-scale contextual representation and feature aggregation to better capture the complexity of real-world scenes. PSPNet addressed this challenge by introducing Pyramid Pooling Modules, which aggregate global contextual information at multiple spatial scales, making it particularly effective for large-area imagery where semantic information is distributed across wide receptive fields [24,25]. DeepLabV3+ [26] further advanced this direction by combining Atrous Spatial Pyramid Pooling (ASPP) with an encoder–decoder architecture, enabling the extraction of multi-scale contextual features while simultaneously improving boundary localization. Evaluated on benchmark datasets such as Cityscapes and PASCAL VOC 2012, DeepLabV3+ achieved mean Intersection-over-Union (mIoU) scores of 82.1% and 89.0%, respectively, establishing a strong baseline for general-purpose semantic segmentation.
More recently, the introduction of vision Transformers (ViTs) has opened a new paradigm for semantic segmentation by enabling the modeling of long-range dependencies and global context. SegFormer represents a notable advancement in this direction, employing a hierarchically structured Transformer encoder to generate multi-scale features without relying on positional encoding, coupled with a lightweight multilayer perceptron (MLP) decoder [27]. This architecture demonstrates strong performance across multiple model scales (SegFormer-B0 to B5) and exhibits robustness to domain shifts. In disaster assessment applications, SegFormer has shown superior performance compared to convolutional neural network (CNN)-based counterparts; for instance, Asad et al. reported an mIoU of 82.22% on the FloodNet dataset, compared to 75.4% achieved by DeepLabV3+ [13]. While semantic segmentation architectures can provide strong pixel-level classification performance, the standard semantic segmentation formulation does not explicitly separate individual building instances within the same damage class. This is a limitation for fine-grained, per-structure FEMA PDA-aligned assessment in densely built post-disaster environments, where adjacent buildings may share similar damage labels but must be evaluated as separate structures.
Instance segmentation directly addresses this limitation by generating per-instance masks alongside class predictions. Approaches such as Mask R-CNN and its improved variants have been explored to address scenarios where multiple objects and damage levels coexist within a single image. These methods enable the detection and segmentation of individual buildings, making them particularly suitable for densely built environments where distinguishing between different damage states at the object level is critical [28]. Mask R-CNN established a foundational two-stage instance segmentation paradigm by extending Faster R-CNN with a parallel mask prediction branch for instance-level object segmentation [29]. In building damage assessment, Zhan et al. modified Mask R-CNN using an improved feature pyramid network, online hard example mining, and multi-class non-maximum suppression to extract residential buildings and estimate damage levels from post-earthquake aerial imagery of the 2016 Kumamoto earthquake [30]. Their model achieved approximately 95% accuracy for building extraction, over 92% accuracy for severely damaged building detection, and approximately 88% overall classification accuracy across four damage classes, demonstrating the suitability of instance segmentation for per-building damage assessment. Zou et al. proposed an improved YOLOv5s-Seg instance segmentation model for rapid assessment of earthquake-damaged buildings from UAV imagery by incorporating a Mixed Local Channel Attention (MLCA) mechanism in the backbone and modifying the neck component to improve small-object segmentation [28]. Their modified model improved and by 1.07 and 1.11 percentage points, respectively, relative to the original YOLOv5s-Seg model, while demonstrating a favorable accuracy–efficiency trade-off compared with other instance segmentation baselines, including Mask R-CNN and YOLO-family segmentation models. Recently, Gu et al. proposed UEBNet, a compact instance segmentation architecture for post-earthquake UAV imagery that integrates a Depthwise Separable Convolutional Block Attention Module (DSCBAM), a Multi-feature Fusion Module (MFT), and an Adaptive Multi-Scale Interaction Module (AMSI) to improve segmentation of irregular and multi-scale damaged building contours [31]. Their results showed improvements of 3.09 percentage points in and 2.20 percentage points in , demonstrating the continued development of instance segmentation architectures for fine-grained post-earthquake building assessment. These developments collectively demonstrate that instance segmentation is the preferred paradigm for fine-grained, per-structure damage classification from UAV imagery, the precise task addressed by AFTERMAP.
2.3. Transfer Learning and Domain Generalization
A persistent challenge in disaster assessment is domain shift, where models trained on one disaster type or geographic region may struggle to generalize to unseen events. For instance, models trained on the xBD dataset have been shown to exhibit performance degradation in out-of-distribution scenarios, although the extent of this limitation remains dependent on data quality and evaluation conditions [32]. Approaches to mitigate this include self-supervised pre-training, which was explored by Xia et al. [33]. Their method learns transferable features from unlabeled pre- and post-disaster imagery which reduces the need for manual labels. It also improves performance when labeled data are limited. In their experiments, the method achieved a damage F1-score of 0.390 with only 1% labeled data and 0.636 with 20% labeled data. However, beyond these approaches, our FEMA-aligned taxonomy adopted in this research provides a principled basis for improving generalization by standardizing labels across geographically and temporally diverse disaster events.
3. AFTERMAP Dataset
3.1. Motivation
The pivotal design principle of AFTERMAP is operational alignment, meaning that every annotation decision follows the FEMA Preliminary Damage Assessment Guide, which is used as the standard for damage categorization during post disaster condition assessment. This alignment ensures that a model trained on AFTERMAP can produce outputs structured according to FEMA PDA damage categories, without requiring post hoc translation between research-oriented and operationally recognized damage categories. Table 1 provides a detailed description of the damage categories according to the FEMA PDA guidelines.
Table 1.
FEMA PDA Damage Classification.
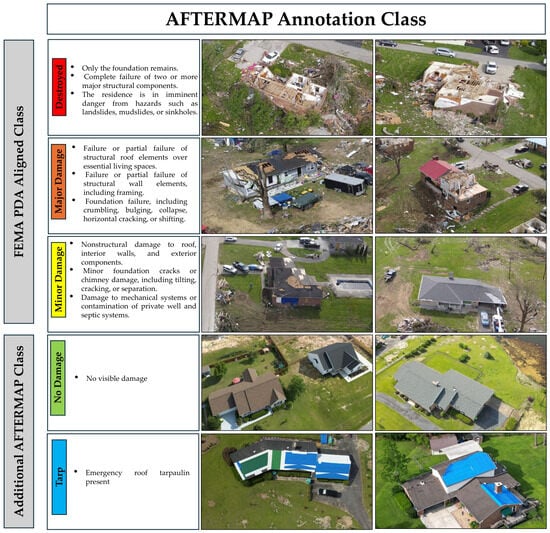
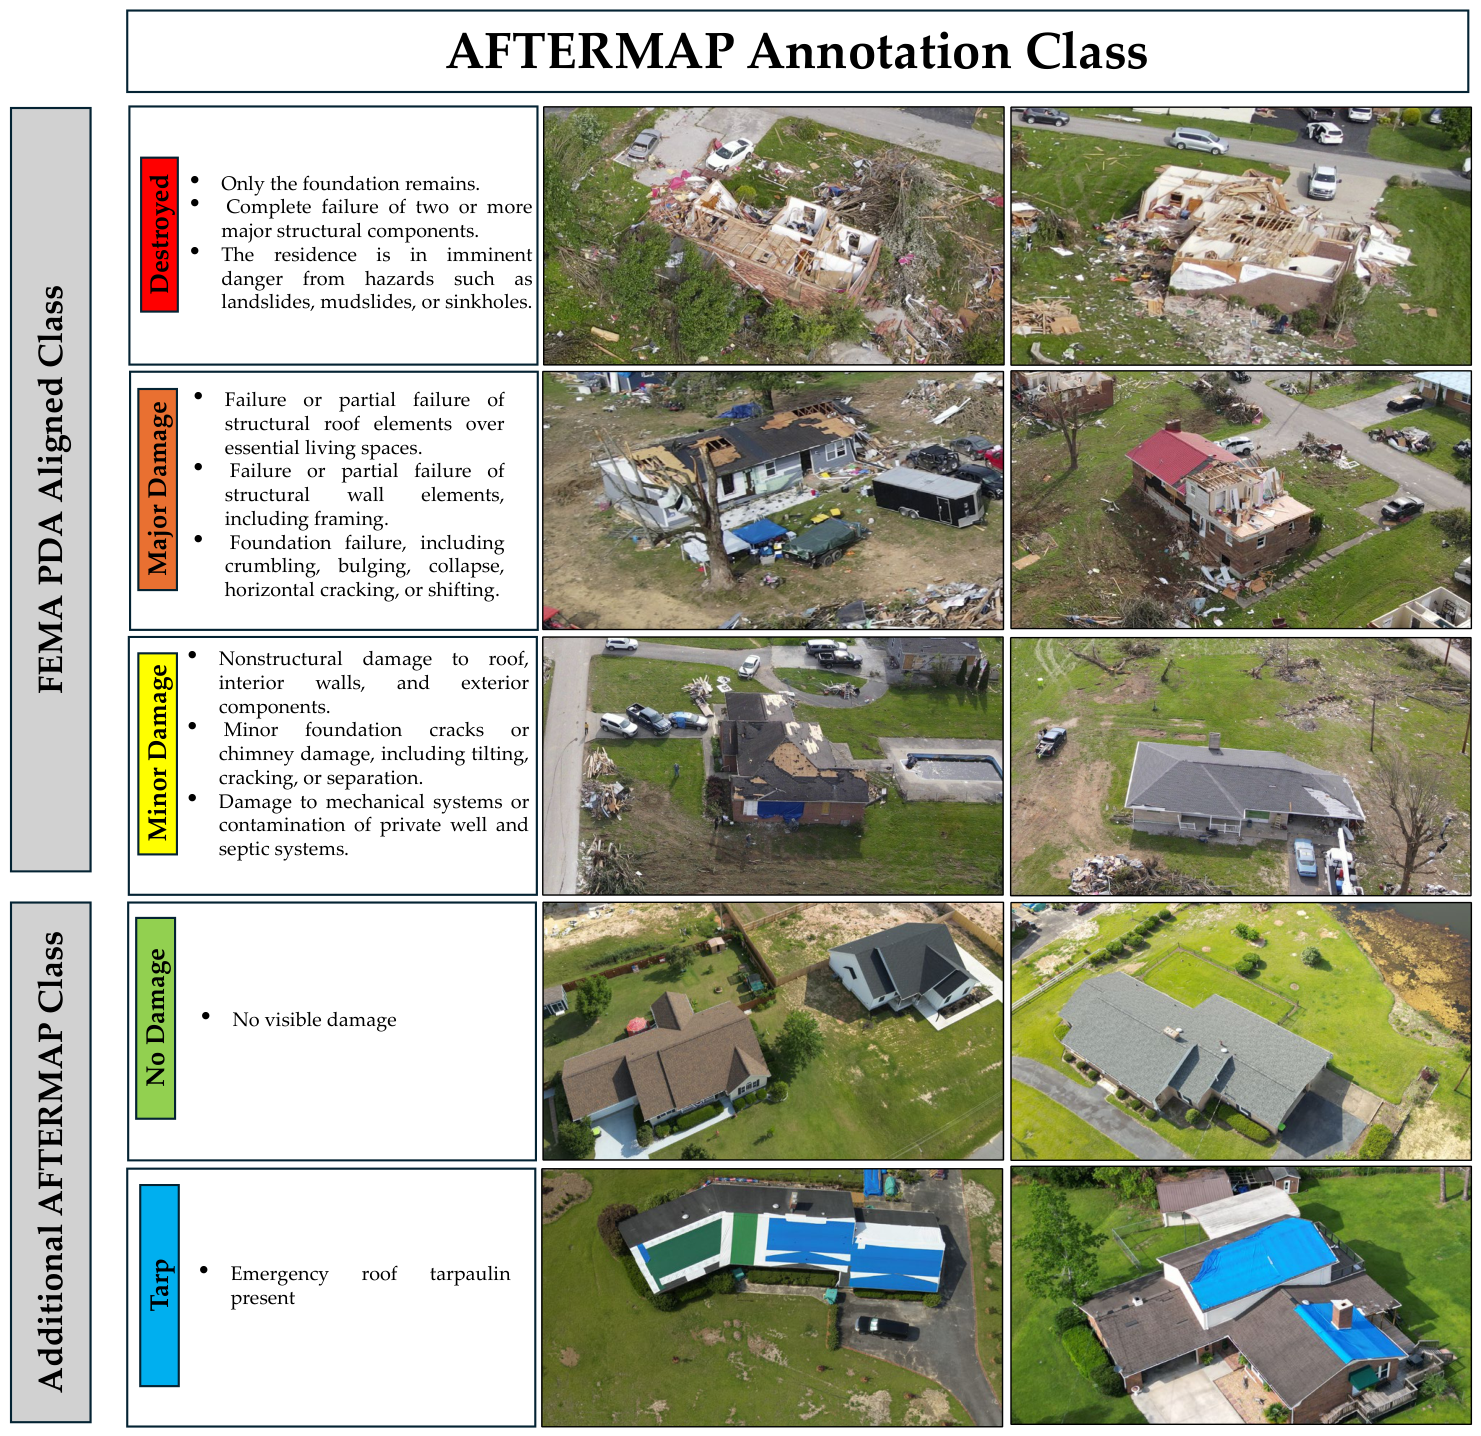
In our dataset, we annotated the damaged structures as Minor, Major, Destroyed. The Inaccessible and Affected categories were excluded from the annotation taxonomy. Because Inaccessible depends on access-related and contextual conditions beyond visible structural damage, making it difficult to annotate reliably from UAV imagery alone. The Affected category was also excluded because its visual indicators are often minimal and difficult to distinguish from Minor Damage, particularly when assessment is limited to a single nadir-view UAV image. Along with these three categories, we extend this core taxonomy with additional No Damage category as well as Tarp (blue or white emergency tarps indicating active repair or roof protection). The tarp class is particularly valuable operationally, as its presence on a structure indicates a post-disaster intervention stage that affects eligibility for certain FEMA recovery programs. Figure 1 provides the visual examples of the damaged structures in our AFTERMAP dataset.
Figure 1.
Representative visual examples of different levels of damaged structures in the AFTERMAP dataset based on FEMA PDA guidelines [3].
The specific methodological innovations of AFTERMAP relative to prior disaster imaging datasets are threefold. First, the data collection workflow leverages publicly available UAV video footage from online platforms, enabling rapid and scalable post-disaster imagery acquisition without requiring dedicated field missions or institutional access to restricted aerial surveys. This approach substantially reduces the time and cost barrier to large-scale disaster dataset construction. Second, the annotation protocol uniquely operationalizes the FEMA Preliminary Damage Assessment (PDA) taxonomy at the pixel-level instance segmentation granularity, translating an established field inspection framework into a computer vision labeling schema and providing civil engineering-grounded interpretation to each damage class that is absent from all prior UAV disaster datasets. Third, the damage-level definitions extend the three FEMA PDA-aligned damage classes adopted in this study (Destroyed, Major Damage, and Minor Damage) with two operationally relevant additions: the Tarp class, which captures the presence of protective roof tarpaulin as a proxy indicator of confirmed structural breach and active homeowner mitigation, providing actionable evidence for post-disaster recovery prioritization and FEMA Individual Assistance program eligibility assessment; and the No Damage class, which enables the model to explicitly discriminate structurally intact buildings from damaged neighboring structures within mixed-condition aerial scenes, reducing false positive damage detections in operational deployment contexts.
3.2. Data Collection
The AFTERMAP dataset was constructed from publicly available UAV footage of post-disaster environments sourced from online video platforms such as YouTube and online news portals. Following major disaster events, primarily hurricanes and tornadoes in the continental United States, a substantial volume of UAV video footage is uploaded by news organizations, emergency responders, local government agencies, citizen journalists, and affected residents to publicly accessible online platforms. This publicly shared footage constitutes a valuable and largely untapped data source for disaster assessment research for several reasons. Firstly, it is collected close in time to the disaster event. Secondly, it captures diverse geographic areas and damage severities. Thirdly, it is available without the logistical overhead and safety risks associated with fielding dedicated UAV survey missions in actively hazardous environments. However, because the frames were extracted from publicly available online UAV videos, key acquisition metadata such as GPS coordinates, flight altitude, and camera intrinsic parameters are generally unavailable, limiting the dataset’s direct use for geospatial mapping or photogrammetric reconstruction.
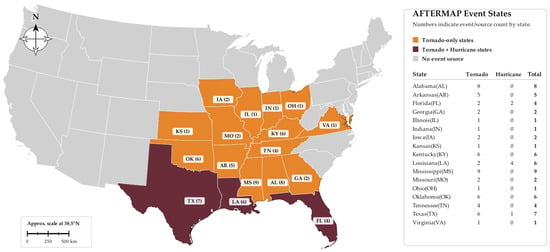
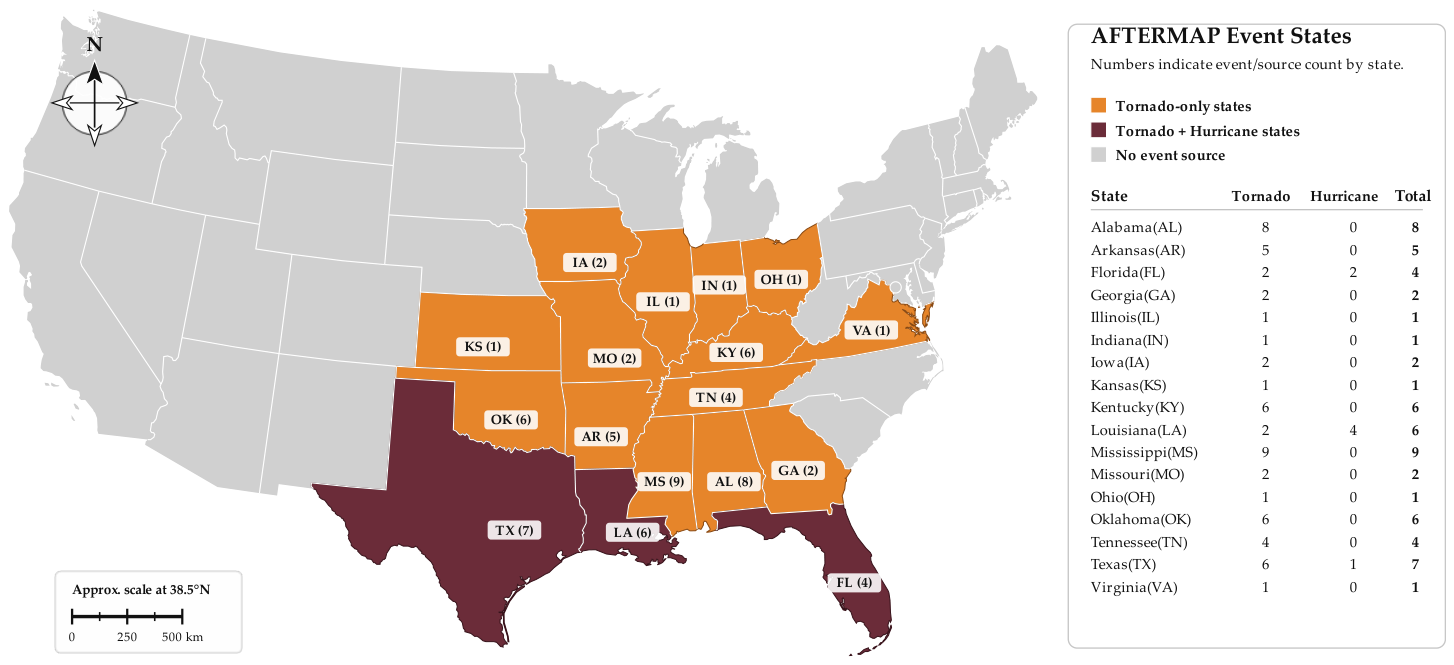
Prior to data collection, we identified the most severe wind-based events, including hurricanes and tornadoes, that occurred in the United States since 2018. We then searched publicly available video platforms for high-quality footage of these events. From the selected videos, high-quality image frames were extracted and compiled for annotation. Following the review and compilation process, the AFTERMAP dataset was assembled from 66 distinct disaster footage sources, including 59 tornado-related sources representing different EF-scale intensity levels and 7 hurricane-related sources associated with major hurricane events. Collectively, these sources span 17 states and seven event years within the 2018–2025 period, capturing substantial variability in post-disaster building damage appearance due to differences in storm intensity, geographic location, construction typology, and vegetation environment. In Figure 2, the geographic footprint of AFTERMAP events spans from the Atlantic Coast (Virginia Beach, Virginia) to the southern Great Plains (Andover, Kansas; Barnsdall–Bartlesville, Oklahoma), and from the upper Midwest (Greenfield, Iowa; Lakeview, Ohio; Wapakoneta, Indiana) to the Gulf Coast (Mexico Beach, Florida; Grand Isle, Louisiana).
Figure 2.
Geographic distribution of wind-induced disaster events used in AFTERMAP. (The scale bar represents an approximate ground distance calibrated near 38.5° N. Minor scale variation may occur across the national extent because of the Albers map projection and the simplified source geometry.).
Images span diverse urban and suburban environments, including dense residential neighborhoods, manufactured home communities, rural farmsteads, and mixed-use commercial-residential zones, providing the geographic and morphological diversity necessary for robust model generalization. Table 2 further summarizes the distribution of disaster source locations by event type and intensity, showing that the dataset includes tornado events ranging from EF2 to EF4 and hurricane events ranging from Category 4 to Category 5 across multiple affected states.
Table 2.
Distribution of tornado and hurricane source locations by intensity level.
Beyond identifying relevant footage sources, a formal curation protocol was followed to ensure data quality, legal compliance, and the integrity of the train, validation and test splits. The protocol addressed four key aspects of dataset construction, including source eligibility, video licensing, frame extraction, and scene selection and was applied consistently across all collected footage. The specific curation steps are described as follows:
- Videos were identified through structured keyword searches (e.g., “hurricane damage drone footage,” “EF4 tornado aftermath aerial view”, “post-disaster damage UAV footage”, etc.) targeting post-disaster UAV footage. Inclusion criteria required footage captured from UAV or drone platforms with nadir or near-nadir viewing angles, showing residential or mixed-use built environments with visible structural damage, having a minimum resolution of 720p (1280 × 720 pixels), and providing verifiable post-disaster timing through upload dates and contextual indicators.
- All source videos were publicly accessible through YouTube or online news platforms. Extracted frames were used internally for non-commercial academic research, including annotation, model training, and evaluation. Public accessibility was not interpreted as a transfer of copyright ownership or permission for redistribution. Accordingly, raw third-party videos and frames extracted from them will not be publicly distributed. Copyright in the original footage remains with the respective rights holders. Where permissible, only a limited sample of images collected directly by the authors, together with their corresponding annotation masks, may be shared.
- Frames were sampled at a fixed interval of one frame every two seconds. After frame extraction, visually redundant frames were manually excluded when consecutive frames showed duplicate or near-duplicate scene content, particularly in cases where the UAV moved slowly or remained nearly stationary.
Together, these steps ensured that the curated dataset was visually diverse, legally sourced, and free from direct scene overlap across the training, validation, and test subsets. This curation process improves the reliability of the dataset for evaluating post-disaster building damage segmentation models.
3.3. Annotation
Pixel-level annotations were produced using the CVAT (Computer Vision Annotation Tool) platform [34], an open-source annotation environment supporting polygon-based instance segmentation that has been widely adopted in computer vision dataset construction for aerial and remote sensing imagery. The annotation taxonomy was derived directly from the FEMA Preliminary Damage Assessment (PDA) guide [3], which served as the primary reference documents throughout the annotation process. To ensure annotation consistency, only conventionally constructed residential buildings commonly found in the United States were included in the dataset. Detached garages, sheds, commercial buildings, mobile homes, and debris-only areas were excluded from annotation. In cases where a building exhibited both emergency roof tarps and visible structural damage, the annotation followed a worst-case damage principle, whereby the building was assigned the highest observable FEMA PDA damage category (e.g., Minor or Major Damage) rather than the Tarp class. Such mixed cases were uncommon within the dataset. The Tarp class was therefore reserved for buildings in which emergency roof tarpaulins constituted the primary observable feature and no higher damage category could be reliably assigned from the aerial imagery. These guidelines were adopted to maintain a consistent and reproducible annotation protocol across all images.
Prior to beginning independent labeling, all annotators participated in structured orientation sessions covering a systematic review of the FEMA PDA guide, with particular attention to the visual distinguishing features associated with each damage category. Each extracted frame underwent a two-stage quality assurance process. In the first stage, each image was independently annotated by one team member and subsequently reviewed by a second, who verified class assignments against the FEMA PDA reference materials and flagged any boundary polygons that were ambiguous, incomplete, or inconsistent with the established taxonomy. In the second stage, all annotations were subject to a final consistency review to confirm that color-coded class masks were correctly generated, that no class had been systematically over- or under-applied across the image set, and that boundary polygons accurately traced structure outlines rather than extending into adjacent scene elements. However, formal cross-validation of AFTERMAP annotations against official FEMA PDA field records was not conducted and represents a necessary step for future operational validation. The resulting annotation database contains pixel-wise segmentation masks for all 1926 images, with class masks stored in JPEG format using a standardized color-coding scheme compatible with standard segmentation training pipeline.
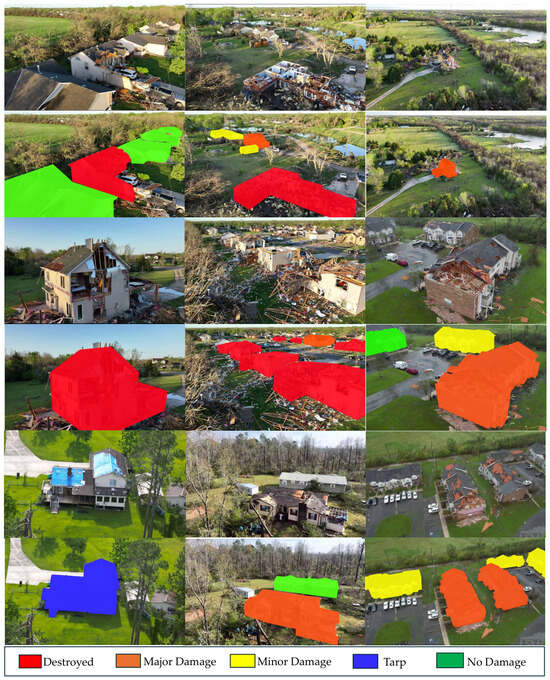
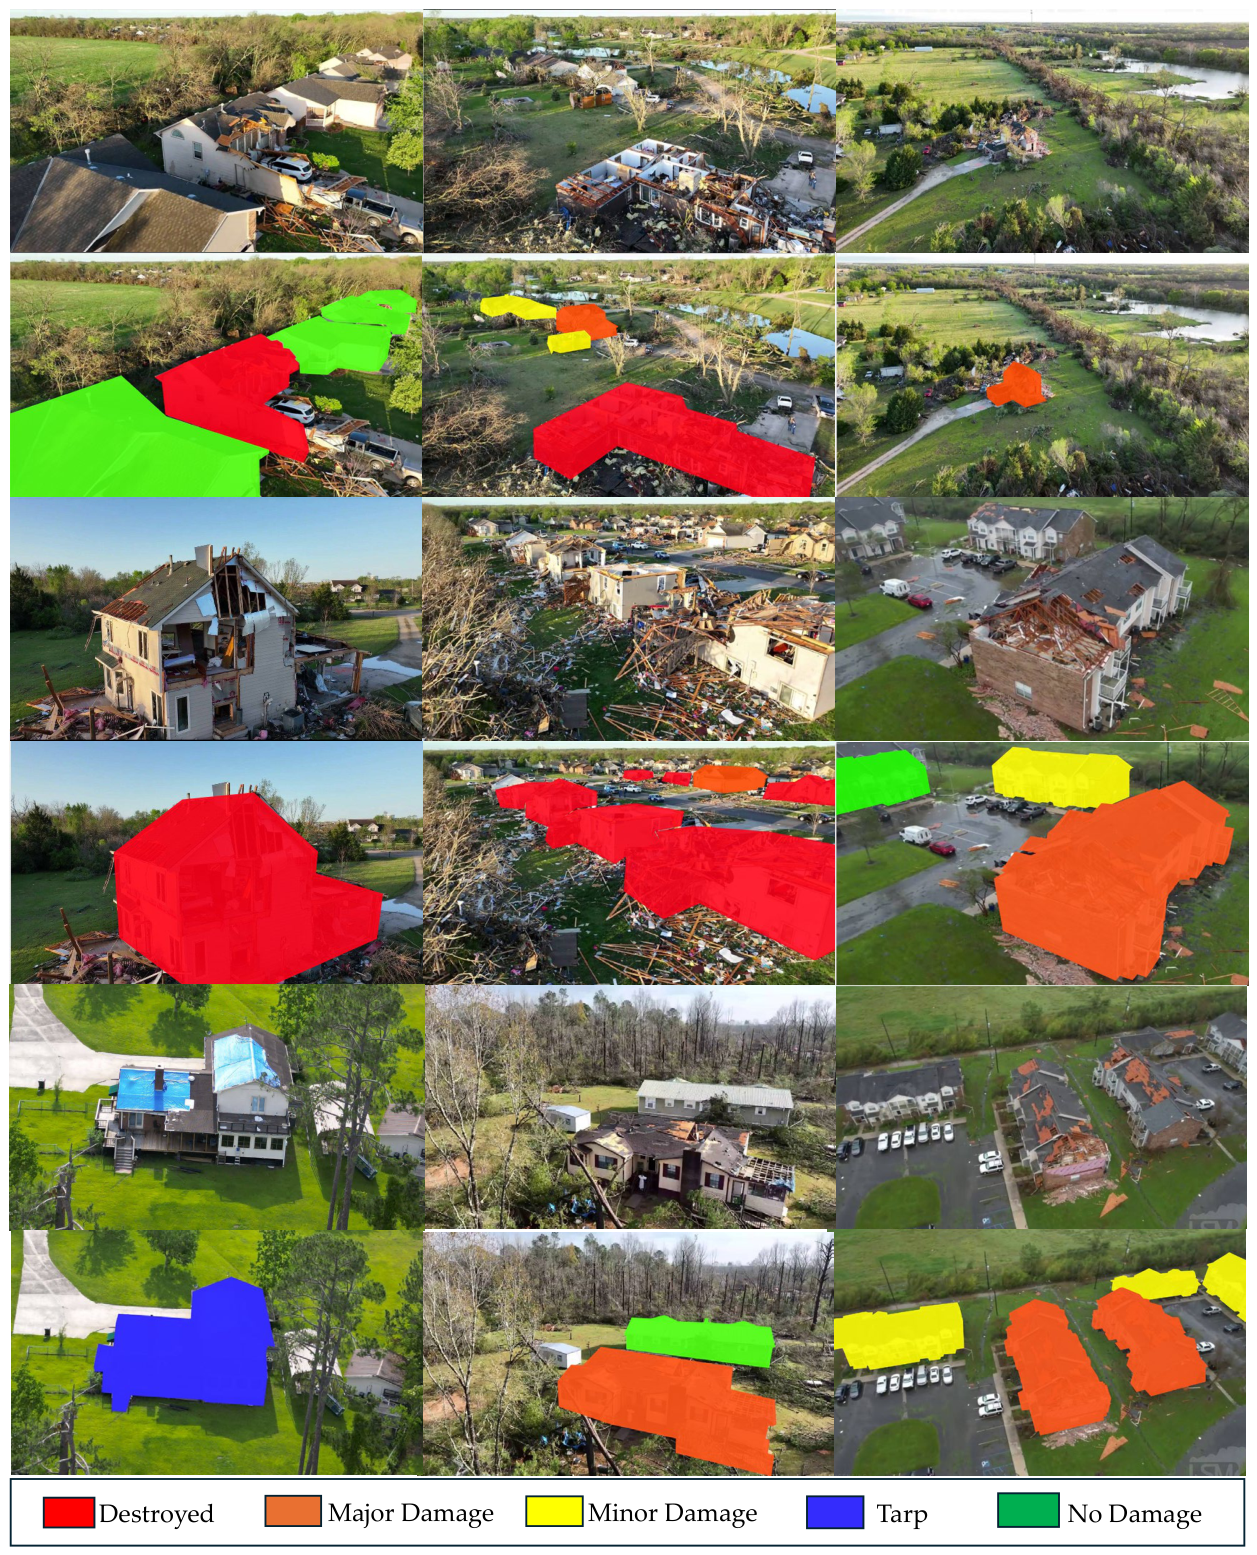
To assess annotation reliability, a calibration exercise was conducted prior to full-scale labeling in which two researchers independently annotated a shared set of 500 pilot images drawn proportionally from all five damage classes, encompassing a total of 873 polygon instances. Class-label agreement between the two annotators was evaluated using Cohen’s kappa (κ) at the instance class level. The resulting κ = 0.71 indicated substantial agreement under the Landis and Koch (1977) interpretation framework [35]. Observed overall class-level agreement was 83%, with highest agreement on visually unambiguous categories such as Destroyed, Tarp, and No Damage, and lowest agreement on the Major Damage and Minor Damage classes, where disagreements were concentrated at visually adjacent damage boundaries, reflecting the inherent difficulty of interpreting subtle structural damage levels from nadir UAV imagery. All disputed cases were resolved through structured consensus review sessions referencing the FEMA PDA guide, and adjudicated labels were incorporated into the final dataset. It is acknowledged that annotation from aerial UAV imagery cannot fully replicate the habitability determinations made during physical FEMA PDA field inspection; labels reflect the best-available visual interpretation of aerial evidence by trained civil engineering researchers. Figure 3 illustrates example of annotated images from our dataset.
Figure 3.
Representative samples of different damage-level classes from the AFTERMAP dataset, with the top row showing the raw images and the corresponding rows showing their annotations.
3.4. Dataset Statistics and Class Distribution
The AFTERMAP dataset comprises 1926 images and 8363 annotated polygon instances; on average, each image contains approximately 4.34 annotated instances, with a median of 3 instances per image, underscoring that it does not conform to a simple single-image, single-label classification paradigm, but instead consists of images that frequently contain multiple buildings or damage regions, making it particularly suitable for multi-object and multi-class segmentation tasks. The dataset was divided into training, validation, and test sets, with the splits stratified by disaster event to prevent overlap between events, resulting in 1557 training images, 178 validation images, and 191 test images. The training set contains 7114 annotated instances, while the validation and testing sets contain 409 and 840 annotated instances, respectively. The mean number of instances per image remains relatively consistent across the splits, ranging from 4.57 in training to 2.3 in validation and 4.4 in testing, suggesting that the annotation density is reasonably balanced across the experimental subsets. Table 3 provides the dataset distribution in detail.
Table 3.
Image-level distribution of damage categories in the AFTERMAP dataset.
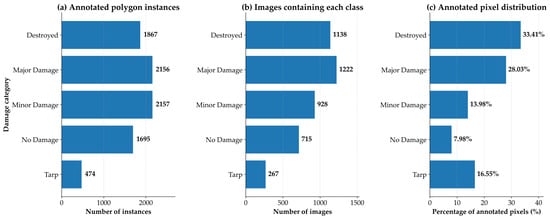
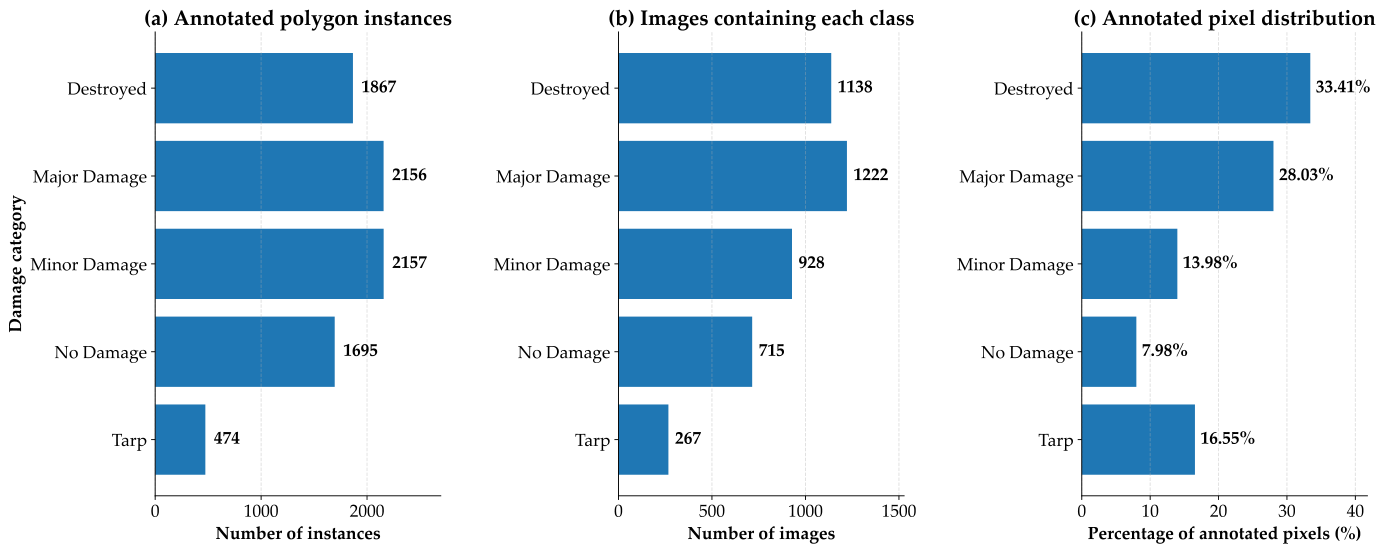
Figure 4 presents the class-wise distribution of AFTERMAP annotations at three levels: annotated polygon instances, image-level class occurrence, and annotated pixel percentage. The image-level class occurrence represents the number of images containing at least one instance of each class and is non-exclusive, since a single UAV image may contain multiple damage categories. The instance-level distribution shows that Minor Damage has the largest number of annotated polygons, followed by Major Damage, Destroyed, No Damage and Tarp. However, the pixel-level distribution shows a different pattern, with Destroyed occupying the largest proportion of annotated pixels, followed by Major Damage. This difference highlights the importance of reporting dataset statistics at multiple levels, since polygon counts, image-level occurrence, and pixel-level spatial coverage describe different characteristics of a multi-object segmentation dataset.
Figure 4.
Class-wise distribution of AFTERMAP annotations at three complementary levels: (a) annotated polygon instance count, (b) image-level class occurrence, and (c) percentage of annotated pixels occupied by each class. The image-level counts in panel (b) are non-exclusive because one image may contain multiple damage categories.
This distribution indicates that severe damage categories occupy a substantially larger portion of the annotated regions, whereas Tarp represents a smaller but operationally important category with limited pixel coverage. Such imbalance reflects the real statistical characteristics of post-disaster imagery, where heavily damaged structures are often more visible and occupy larger spatial regions, while tarp-covered or lightly affected areas tend to be smaller, less frequent, or more difficult to delineate. From a modeling perspective, this pixel-level variation provides a valuable opportunity to evaluate how effectively segmentation models learn across both dominant and less frequent damage categories. The presence of categories with smaller spatial coverage, such as Tarp, makes AFTERMAP a more realistic and challenging validation setting for post-disaster damage assessment rather than an artificially balanced dataset. As a result, the dataset supports a more rigorous assessment of model robustness, class sensitivity, and generalization capability.
To prevent spatial and temporal data leakage, the dataset split was stratified at the disaster event level. All frames extracted from a given disaster event are assigned exclusively to either the training, validation, or test set. As each disaster event occurred at a geographically distinct location on a distinct date, this protocol ensures that no building, neighborhood, or geographic area appears across multiple splits, and all frames from the same source video are contained within a single subset. Table 4 lists the disaster events assigned to the validation and test sets and training set to ensure that frames from the same video or neighborhood did not appear across multiple subsets.
Table 4.
Event-level train, validation and test split used in the AFTERMAP dataset.
3.5. Ethical, Legal, and Privacy Considerations
Prior to constructing the AFTERMAP dataset, ethical, legal, and privacy considerations were taken into account throughout the dataset development process. Source videos were obtained from publicly accessible online platforms documenting real disaster events, including YouTube and publicly available news media. Relevant licensing, copyright, and applicable platform terms of use were considered during dataset development. To respect intellectual property rights, the public release of AFTERMAP does not include third-party source videos or extracted image frames. Instead, the public repository provides dataset documentation, annotations, metadata, and other materials necessary to support reproducible academic research. Where appropriate, the repository may include a limited number of images collected directly by the authors together with their corresponding annotations. The dataset primarily consists of aerial imagery acquired at altitudes suitable for building-level damage assessment. At the spatial resolution used in this study, individuals and other personally identifiable information are not discernible. No personal information was intentionally collected, retained, or annotated during dataset construction. Users of the publicly released dataset are expected to comply with applicable laws, platform terms of use, and the accompanying dataset license.
4. Experimental Frameworks and Results
4.1. Baseline Models
To establish comprehensive baseline evaluation on AFTERMAP, multiple configurations of the YOLO (You Only Look Once) architecture were evaluated, reflecting recent advancements in real-time object detection and segmentation frameworks. We implemented baseline models from different YOLO generations and model scales, specifically YOLOv8-seg, YOLOv11-seg, and YOLOv26-seg, using size variants such as nano (n), small (s), medium (m), large (l), and extra-large (x) to examine the trade-offs between computational efficiency and predictive performance. All models were initialized using the official pre-trained weights from the Ultralytics implementation and fine-tuned on the AFTERMAP dataset without any modification to the underlying architectures. A consistent training configuration was maintained across all experiments to ensure comparability. Table 5 lists all key hyperparameters and settings used for the YOLO instance segmentation model training:
Table 5.
YOLO model training configuration and hyperparameters.
4.2. Evaluation Metrics
For building instance-level damage segmentation on the AFTERMAP dataset, we adopt standard instance segmentation metrics that quantify both classification accuracy and spatial overlap. For each class , predicted building instance masks are compared with the corresponding ground truth building instance masks based on the specified IoU threshold. True positives are predicted building instances that correctly match ground truth building instances of class , false positives are predicted building instances assigned to class but do not correctly match any ground truth instances while false negatives are ground truth building instances belonging to class that are missed by the model. Precision and recall for class are defined as:
where measures the reliability of predicted building instances for class , while measures the completeness of detecting ground-truth building instances of class i. In addition, the F1 score was calculated to provide a balanced evaluation of precision and recall. As the harmonic mean of these two metrics, the F1 score captures both the model’s ability to correctly identify building instances and the reliability of its positive predictions. The score ranges from 0 to 1, where 0 denotes the poorest performance and 1 indicates perfect agreement. For class i, the F1 score is defined as follows:
For multi-class evaluation, covering damage categories from No Damage to Destroyed, the macro-average F1 score is computed as the arithmetic mean of the class-wise F1 scores. This metric provides a balanced assessment of overall model performance by assigning equal weight to each class, which is particularly useful when class distributions are imbalanced. The macro-average F1 score is defined as:
In addition to the pixel-level metrics described above, instance-level evaluation is performed using Mean Average Precision (mAP), which is the standard evaluation metric for object detection and instance segmentation tasks and is natively adopted by the YOLO model family evaluated in this study. The foundational component of mAP is the Intersection over Union (IoU), defined for a predicted mask and a ground-truth mask as:
IoU quantifies the spatial overlap between a predicted instance mask and its corresponding ground-truth annotation, with values ranging from 0 (no overlap) to 1 (perfect agreement). A prediction is considered a true positive if its IoU with the ground-truth exceeds a defined threshold; otherwise, it is counted as a false positive.
Average Precision (AP) for a given class is computed as the area under the Precision-Recall curve, which is constructed by varying the confidence score threshold across all predictions for that class:
where is the precision at recall level for class . Mean Average Precision (mAP) is then defined as the arithmetic mean of per-class AP values across all damage categories:
In this study, the IoU threshold is fixed at 0.5 when computing mAP50, meaning that a predicted segmentation mask is considered correct if it overlaps the corresponding ground-truth mask by at least 50%. In addition to mAP50, we also report mAP50-95, which averages AP over IoU thresholds ranging from 0.50 to 0.95 in increments of 0.05. Compared with mAP50, mAP50-95 provides a more stringent assessment of segmentation quality by rewarding more precise mask localization and boundary delineation. All evaluation metrics are computed on predicted segmentation masks rather than bounding boxes, consistent with the mask prediction head of the YOLO instance segmentation models. Throughout this paper, mAP50 is used as the primary evaluation metric because it is widely adopted in the instance segmentation literature and facilitates comparison with prior YOLO-based studies, while mAP50-95 is reported as a complementary metric to provide a more comprehensive evaluation of segmentation accuracy.
4.3. Results
4.3.1. Evaluation of YOLO Segmentation Performance Across Variable Input Resolutions
The comprehensive baseline evaluation results for the evaluated YOLO models are summarized in Table 6. Three state-of-the-art YOLO instance-segmentation models (Ultralytics YOLOv8, YOLO11, and YOLO26) were evaluated across five model scales (nano ‘n’, small ‘s’, medium ‘m’, large ‘l’, and x-large ‘x’), using three input resolutions (640 × 640, 960 × 960, and 1280 × 1280). Performance is reported as mask mAP at an IoU threshold of 0.5 (mAP50) and as mean mask mAP over IoU thresholds 0.5–0.95 (mAP50–95) on both validation and test splits. Overall, the results show that model performance varies across architecture families, input resolutions, and model scales. While larger input resolutions and higher-capacity variants often improve performance, the trend is not strictly monotonic for every architecture and split. The validation and test values are generally comparable across most configurations, although noticeable gaps appear for some higher-performing models, particularly under the stricter mAP50–95 metric.
Table 6.
Validation and test mAP performance of YOLOV8, YOLO11, and YOLO26 segmentation models across model sizes and input resolutions.
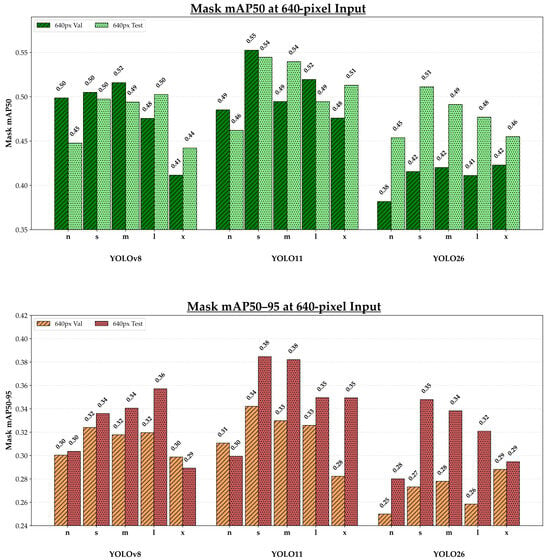
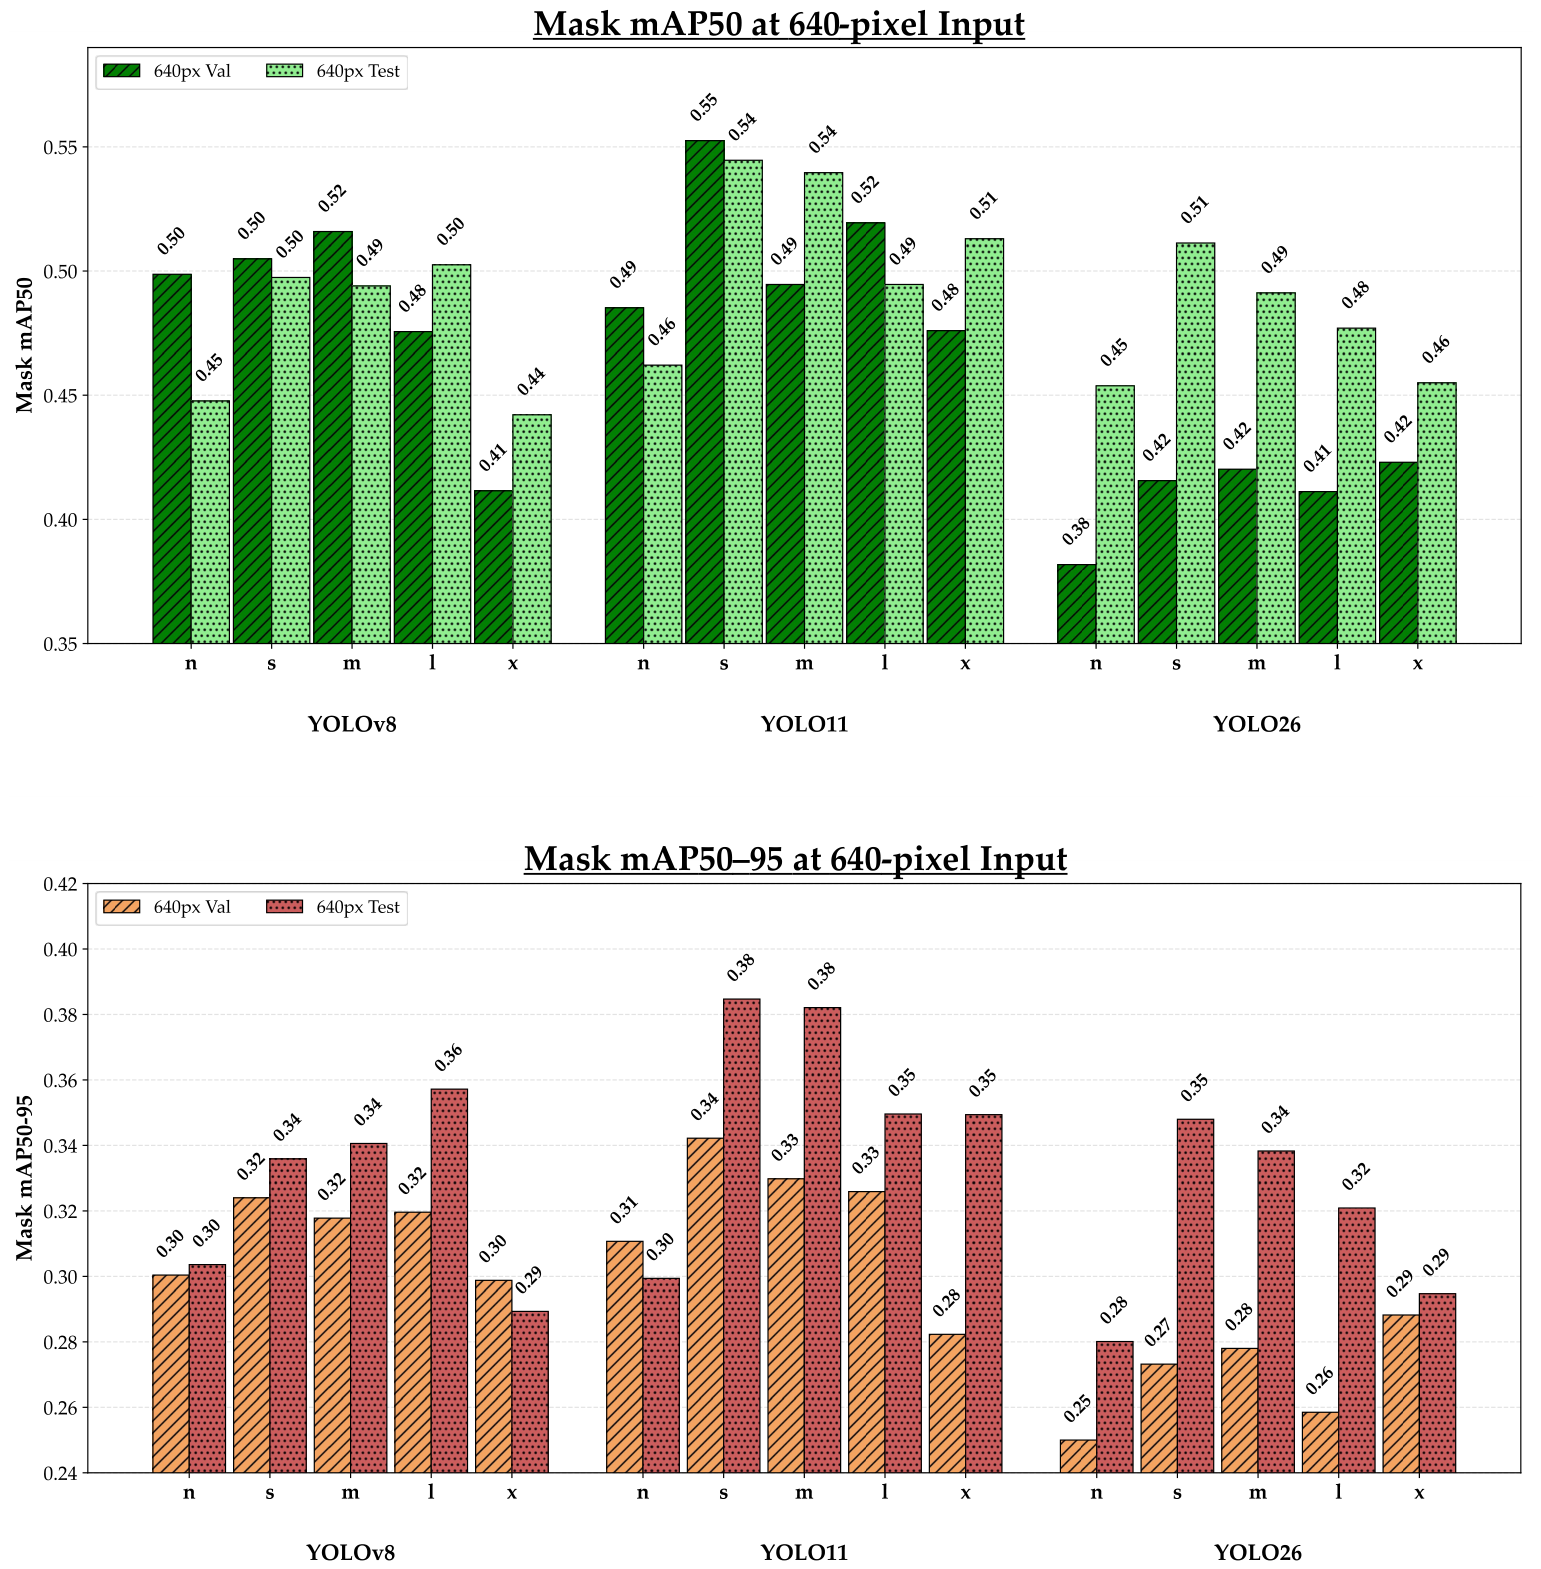
At 640 × 640 input resolution, the YOLO11 family achieves the highest mask mAP50 and mAP50–95 values, with YOLO11s-seg producing the best validation and test performance at this resolution. Specifically, YOLO11s-seg achieves a validation mAP50 of 0.552 and a test mAP50 of 0.545, while also obtaining the highest mAP50–95 values of 0.342 on validation and 0.385 on test. The YOLOv8 family forms a close second tier, with competitive performance from its medium and large variants, while YOLO26 shows lower validation performance but remains competitive on the test split for selected configurations. This pattern suggests that, for moderate-resolution inputs, YOLO11 provides the strongest balance of segmentation accuracy and stability on the AFTERMAP dataset. To provide a direct comparison under a common input setting, Figure 5 presents the validation and test mask mAP50 and mAP50–95 values obtained by the nano, small, medium, large, and extra-large variants of YOLOv8, YOLO11, and YOLO26 at a 640-pixel input resolution, which represents the standard default input size for YOLO architectures and provides a consistent baseline for isolating the effects of model family and scale on segmentation performance independently of resolution-driven variation. Complete numerical results for all evaluated resolutions, including 960 and 1280 pixels, are reported in full in Table 6 to understand resolution-specific comparisons.
Figure 5.
Validation and test mask mAP50 and mAP50–95 performance of YOLOv8, YOLO11, and YOLO26 model variants at a 640-pixel input resolution.
Increasing the input resolution to 960 and 1280 pixels generally leads to improved mask mAP50 and mAP50–95 for the best-performing variants in each family, although the magnitude of gains varies and is not strictly monotonic across all splits. For mAP50, the best validation performance is obtained by the YOLOv8-seg m variant at 1280 × 1280, with mask mAP50 values of 0.543 on the validation set and 0.561 on the test set, while the YOLO26-L variant at 960 × 960 achieves the highest test set mask mAP50 of 0.60, slightly exceeding the top YOLOv8 and YOLO11 models. For the stricter mask mAP50–95 metric, the highest test set value of 0.452 is obtained by YOLO26-L at 960 × 960, followed closely by YOLOv8-seg m at the same resolution with 0.438. In summary, YOLO11, particularly its small-scale and nano variants at 640 × 640 and 960 × 960, achieved the strongest validation mask mAP50 (0.553 and 0.554, respectively), while YOLOv8-m at 1280 × 1280 achieved the strongest validation mask mAP50-95 (0.400). On the test split, however, YOLO26-L at 960 × 960 achieved the highest scores for both metrics (mAP50 = 0.600, mAP50-95 = 0.453), suggesting that higher-resolution inputs and larger model capacity can improve damage-segmentation accuracy and generalization, even though the trend is not strictly monotonic for every architecture. The gap between mask mAP50 and mask mAP50–95 across all families, together with the remaining errors, may reflect the need for greater attention to complex damage boundaries, occlusions, and strict FEMA-based label definitions in the AFTERMAP task, where multiple damage categories are interpreted from aerial imagery. The complete validation and test results for all YOLO families, model-size variants, input resolutions, and evaluation metrics are provided in Table 6.
Based on the overall test set results, YOLO26-L at 960 × 960 was selected for the subsequent case study and additional model comparison. This selection was made because YOLO26-L achieved the highest test mAP50 and the highest test mAP50–95 among all evaluated configurations, indicating strong generalization on the held-out AFTERMAP test split. In addition, achieving the best test performance at 960 × 960 rather than 1280 × 1280 suggests a favorable balance between segmentation accuracy and computational efficiency. Therefore, YOLO26-L provides a practical and robust baseline for further evaluation of FEMA-aligned post-disaster building damage segmentation. The remaining gap between mAP50 and mAP50–95 across all model families reflects the difficulty of precisely segmenting complex damage boundaries, occlusions, debris fields, roof tarpaulins, and visually subtle damage categories in UAV imagery.
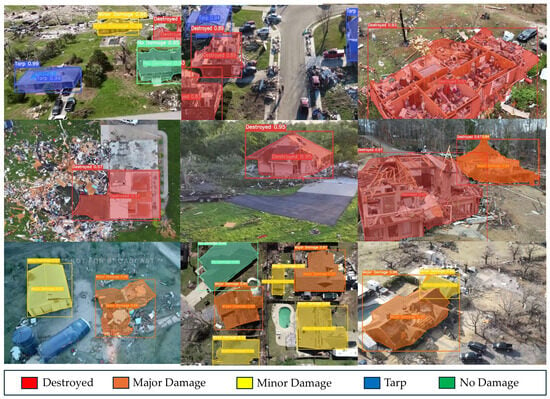
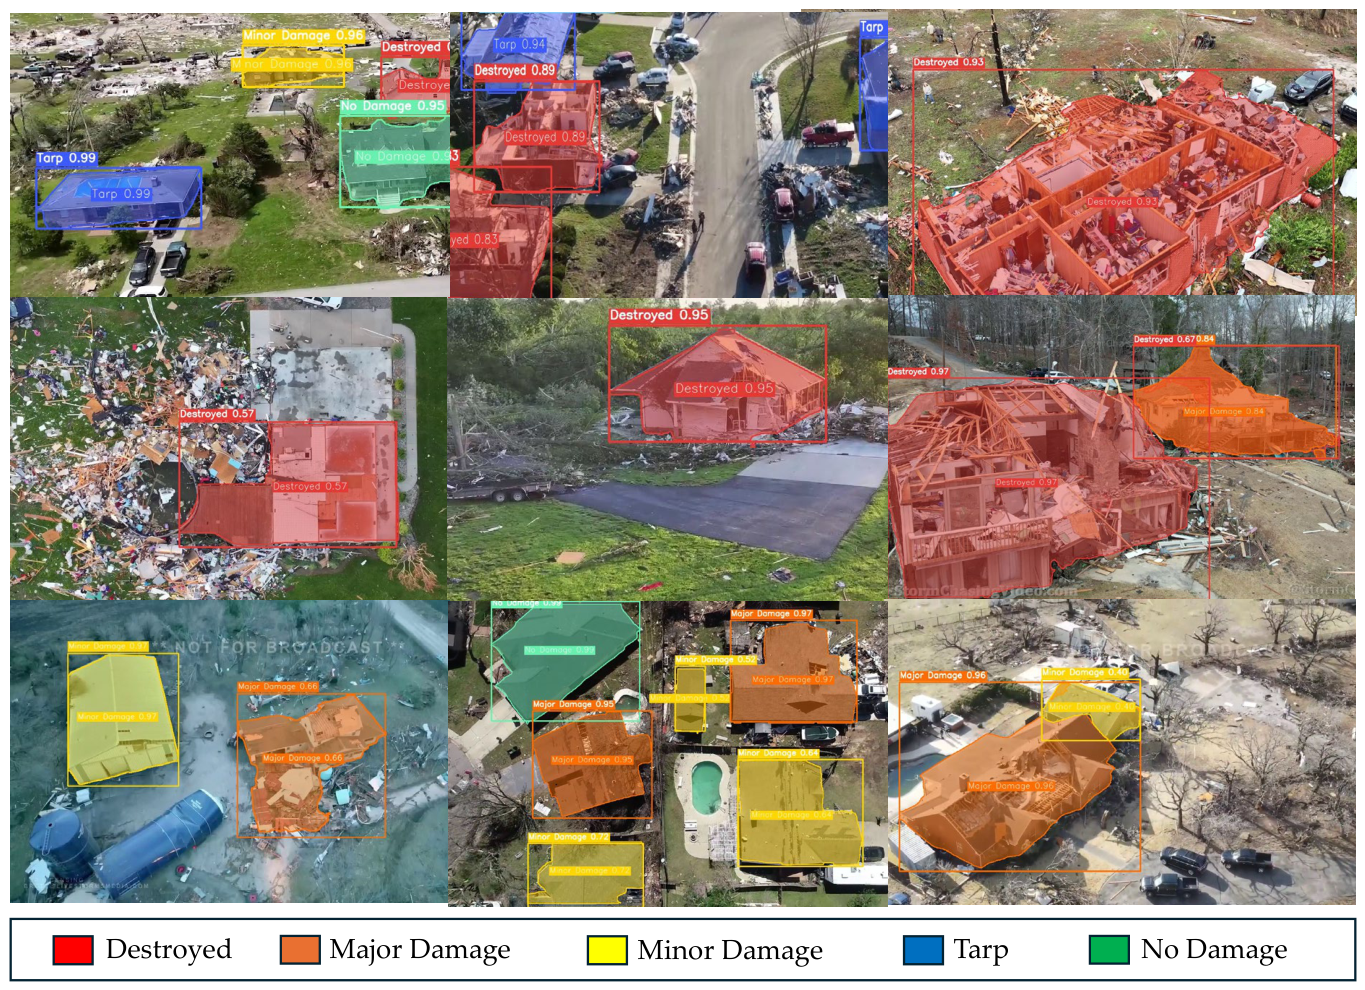
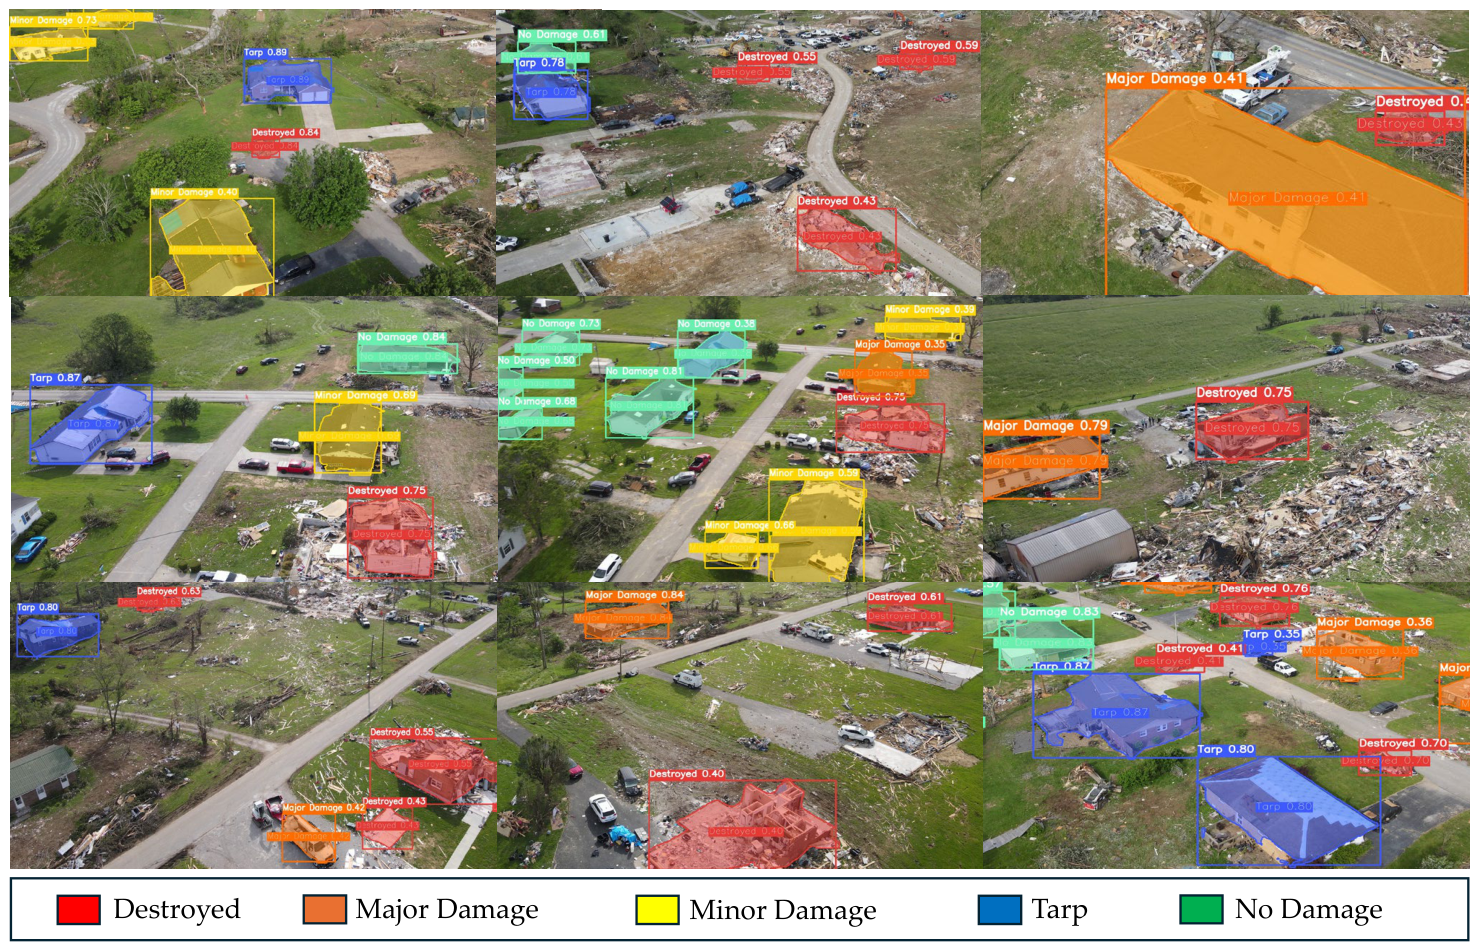
Figure 6 shows representative test set predictions generated by the selected YOLO26-L model on AFTERMAP imagery. The predicted masks and confidence scores demonstrate that the model can identify and delineate multiple damage states within the same UAV frame, including destroyed buildings, major and minor damage, tarp-covered roofs, and undamaged structures. These examples highlight the practical utility of the trained model for instance-level post-disaster damage segmentation, particularly in scenes containing multiple buildings, partial roof failures, debris fields, and heterogeneous background conditions. Therefore, the qualitative outputs complement the numerical evaluation by showing how the model performs spatially across visually diverse disaster scenarios.
Figure 6.
Qualitative results of building-damage segmentation on test UAV imagery using the YOLO26-L architecture.
4.3.2. Per-Class Analysis
Table 7 summarizes the per-class performance of YOLO26-L at an input resolution of 960 × 960 pixels. The model achieved an overall test mAP50 of 0.600, with a precision of 0.578, recall of 0.561, and F1-score of 0.568. Compared with the validation set (mAP50 = 0.510), the higher test performance indicates moderate variation in scene difficulty across the dataset. Among the five classes, Tarp achieved the highest performance (mAP50 = 0.753, F1 = 0.715), likely because emergency roof tarps exhibit distinctive color and texture that clearly differentiate them from surrounding roofs and debris. Destroyed and Minor Damage also achieved strong performance (mAP50 = 0.648 and 0.642, respectively), suggesting that the model effectively captures both severe structural failure and visible surface damage. Major Damage was the most difficult class (mAP50 = 0.460, F1 = 0.470), reflecting the gradual transition between minor and catastrophic structural damage. No Damage also showed relatively lower performance (mAP50 = 0.498), as intact buildings often appear within scenes containing nearby damaged structures, increasing contextual ambiguity.
Table 7.
Quantitative evaluation of the YOLO26-L model on the AFTERMAP validation and test sets at 960 × 960 input resolution.
Overall, the results indicate that segmentation performance is strongly influenced by the visual separability of each damage category. Classes with distinctive appearance are segmented more accurately, whereas intermediate damage levels remain challenging because damage severity forms a visual continuum rather than discrete categories.
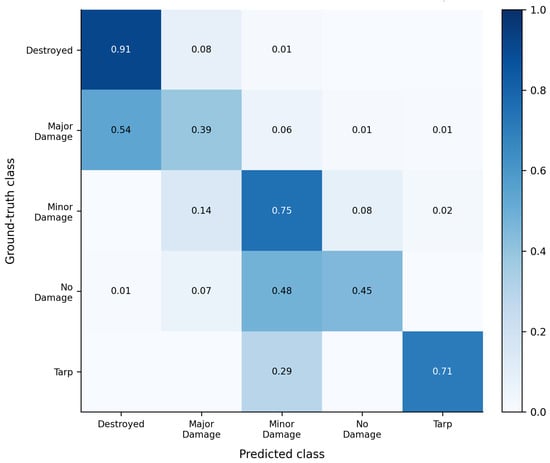
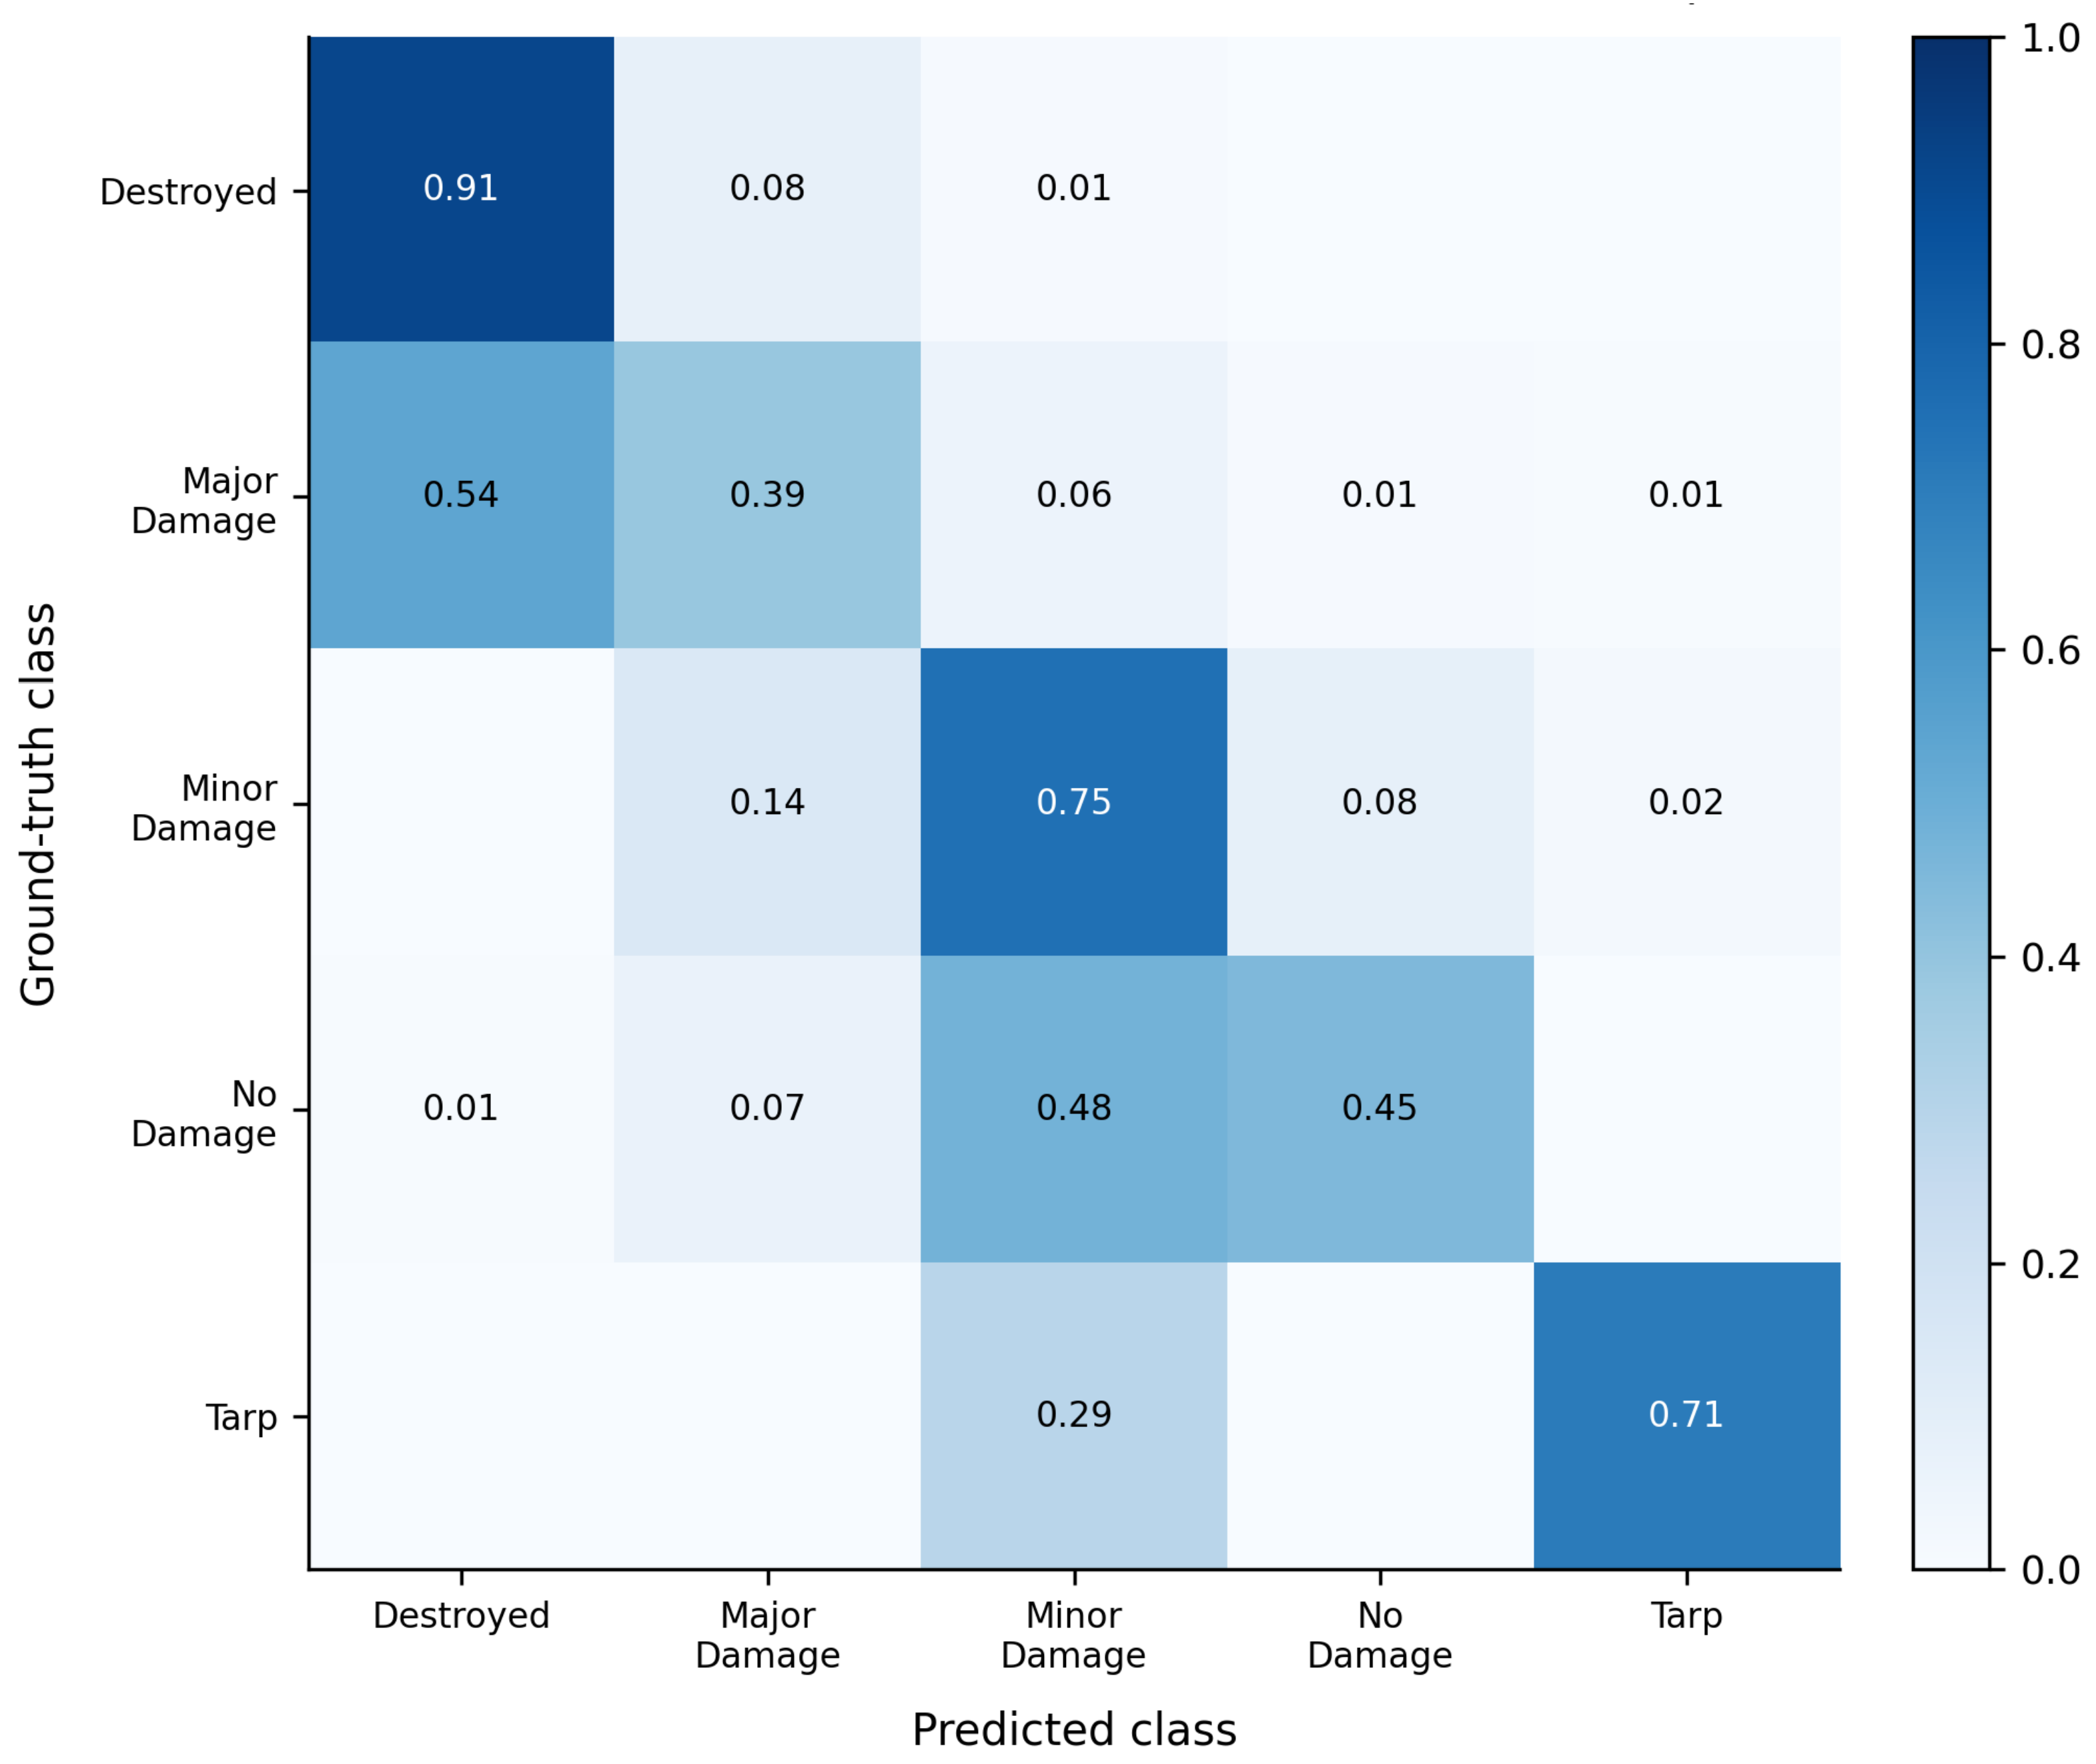
To further examine these class-level error mechanisms, Figure 7 presents the row-normalized pixel-level confusion matrix for the YOLO26-L model on the AFTERMAP test split. While Table 6 summarizes class-wise detection and segmentation performance using mAP50, precision, recall, and F1-score, the confusion matrix provides additional insight into the dominant misclassification pathways among visually adjacent damage categories. As shown in Figure 7, Destroyed, Minor Damage, and Tarp exhibit the strongest class agreement, with correct classification rates of 91%, 75%, and 71%, respectively. In contrast, Major Damage and No Damage achieve lower correct classification rates of 39% and 45%, indicating greater classification difficulty. The most significant confusion occurs between Major Damage and Destroyed, where 54% of Major Damage pixels are predicted as Destroyed, reflecting the visual similarity between severe structural damage and complete collapse. Another notable confusion occurs between No Damage and Minor Damage, with 48% of No Damage pixels misclassified as Minor Damage. This behavior suggests that roof texture, shadows, debris, and the presence of nearby damaged buildings can obscure the distinction between intact and lightly damaged structures. Overall, the confusion matrix complements the per-class performance metrics by showing that most prediction errors occur between visually adjacent damage categories rather than between structurally distinct classes.
Figure 7.
Row-normalized pixel-level confusion matrix of the best-performing model on the AFTERMAP test split. Diagonal values represent correct class predictions, while off-diagonal values indicate class-level confusion.
5. Discussion
5.1. Generalization to an Independent Disaster Event
To further evaluate the applicability of the AFTERMAP dataset and the generalization capability of the trained model, the best-performing YOLO26-L model was applied to an independent post-disaster UAV dataset collected following the 2025 Somerset–London tornado in southeastern Kentucky. The tornado occurred on 16–17 May 2025, producing EF4 damage across Russell, Pulaski, and Laurel counties. With a path length of nearly 60 miles, 19 fatalities, and extensive destruction of residential structures, it ranks among the most destructive tornadoes in Kentucky in recent decades [36]. Importantly, the imagery used in this case study was collected independently of AFTERMAP and was not included in the training, validation, or test sets, providing an opportunity to evaluate the model under unseen real-world conditions.
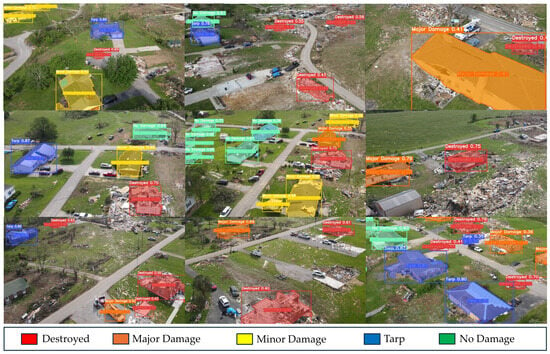
Following the event, our research team conducted an on-site field survey and collected high-definition UAV imagery using a DJI Air 2S. The use of a consumer-grade UAV also demonstrates that the proposed framework does not rely on specialized or survey-grade aerial platforms for data acquisition. The trained YOLO26-L model was then applied directly to the collected imagery without additional fine-tuning. Figure 8 presents representative prediction results, where the five damage categories are visualized using instance segmentation masks and confidence scores.
Figure 8.
Predicted damage classes from YOLO segmentation for the Somerset–London tornado case study site.
The qualitative results demonstrate that the model successfully identifies individual damaged structures and produces spatially consistent damage predictions across diverse post-disaster scenes. Buildings classified as Destroyed are generally well localized and exhibit high-confidence predictions, indicating that the model effectively captures the large-scale structural failures associated with complete collapse. The model also identifies Tarp and No Damage when their visual characteristics are sufficiently distinct, such as emergency roof coverings or intact roof surfaces. These observations suggest that the features learned from the AFTERMAP dataset transfer well to imagery collected during an independent disaster event.
Most prediction uncertainty occurs between neighboring damage categories, particularly Destroyed and Major Damage, and between Major Damage and Minor Damage. This behavior is expected because post-disaster structural damage exists on a continuum rather than as discrete visual states. Partial roof failure, debris accumulation, occlusion by vegetation, and irregular building geometries often obscure the visual cues required to distinguish adjacent FEMA damage categories from aerial imagery alone. Nevertheless, the model consistently captures the most operationally significant damage patterns, particularly buildings exhibiting severe structural failure that require immediate attention during post-disaster response. Overall, the Somerset–London case study demonstrates that the AFTERMAP-trained YOLO26-L model generalizes well to unseen UAV imagery and provides reliable building-level damage predictions under realistic field conditions, highlighting its potential to support rapid post-disaster damage assessment.
5.2. Evaluation of Model Inference Efficiency
In addition to segmentation accuracy, inference efficiency was evaluated to assess the suitability of YOLO26-L for rapid post-disaster UAV image analysis. Fast processing is essential in disaster response, where large numbers of aerial images must be analyzed within a limited time. Increasing the input resolution preserves finer spatial details that may improve segmentation of small objects and complex damage boundaries, but it also increases computational cost. Table 8 summarizes the inference performance of YOLO26-L using input resolutions of 640 × 640, 960 × 960, and 1280 × 1280, with all experiments conducted on a workstation equipped with an NVIDIA RTX PRO 6000 Blackwell Max-Q GPU. As expected, computational cost increased with image resolution. The total latency rose from 16.60 ms/image at 640 pixels to 20.61 ms/image at 1280 pixels, while the processing speed decreased from 60.2 FPS to 48.5 FPS. Despite this trade-off, all three configurations maintained real-time inference performance. The 960 × 960 configuration, which achieved the highest segmentation accuracy, processed images at 57.2 FPS, indicating that improved accuracy can be obtained without sacrificing real-time capability. These results demonstrate that YOLO26-L provides an effective balance between segmentation accuracy and computational efficiency, making it well suited for rapid UAV-based post-disaster damage assessment.
Table 8.
Inference latency and FPS comparison of YOLO26-L across image sizes.
5.3. Cross-Architecture Baseline Comparison
To benchmark YOLO26-L against representative instance segmentation methods, Mask R-CNN and Mask2Former were evaluated on the AFTERMAP test set. YOLO26-L was trained and evaluated using an input size of 960 × 960, while Mask R-CNN and Mask2Former used their default input settings. Table 9 summarizes the mAP50 results.
Table 9.
Cross-architecture instance segmentation performance comparison on the AFTERMAP test set (mAP50).
YOLO26-L achieves the highest overall mAP50 of 0.600, outperforming Mask R-CNN (0.524) and Mask2Former (0.368). It also achieves the best performance across all five damage categories, with particularly strong results for Destroyed (0.648), Minor Damage (0.642), and Tarp (0.753). Despite the relatively small AFTERMAP training set (1557 images), YOLO26-L demonstrates that a modern single-stage detector with strong pretraining can outperform both a traditional two-stage detector and a transformer-based segmentation model. Mask R-CNN remains competitive, particularly for the Tarp class, while Mask2Former consistently underperforms, likely due to the larger training data requirements of transformer-based architectures. Overall, the results indicate that YOLO26-L provides the most effective balance of detection and segmentation performance for post-disaster building damage assessment on the AFTERMAP dataset.
5.4. Limitation and Future Study
5.4.1. Data Source and Geospatial Grounding
AFTERMAP was constructed from publicly available UAV footage sourced from online video platforms, which provides scale and geographic diversity but introduces limitations not present in datasets collected under structured field survey protocols. In particular, GPS coordinate metadata, flight altitude, camera intrinsic parameters, and gimbal orientation are generally unknown for publicly available online UAV footage. This limits AFTERMAP’s direct utility for applications requiring pixel-to-ground coordinate mapping, photogrammetric reconstruction, or georeferenced damage mapping, use cases that are important for advanced FEMA PDA workflows involving GIS integration. Future extensions of AFTERMAP would prioritize incorporating imagery collected under structured survey protocols with complete metadata, enabling geospatially referenced damage mapping.
5.4.2. Annotation Source and Label Uncertainty
All annotations were produced by the research team following the FEMA PDA taxonomy, without cross-validation against official FEMA PDA field assessment records for the same structures. While this is consistent with practice in the broader disaster segmentation literature, it introduces the possibility of systematic labeling bias, particularly for boundary categories such as Major Damage versus Minor Damage, where the distinction is subtler from the aerial perspective than from ground-level inspection. Some misclassifications between adjacent damage categories may therefore reflect genuine label ambiguity inherited from the annotation process rather than purely a model capacity issue. Cross-validation with official FEMA experts would enhance the reliability of the dataset.
5.4.3. Class Imbalance and Minority Category Performance
The relative underrepresentation of Tarp (16.55% of annotated pixels) compared with Destroyed (33.41%) and Major Damage (28.03%) reflects the real statistical distribution of post-disaster damage but creates a training challenge. No class weighting or oversampling was applied during training; therefore, the reported results reflect the natural class imbalance present in the AFTERMAP dataset. The YOLO architecture’s anchor-free detection head is sensitive to object frequency during training, and extremely rare categories benefit disproportionately from targeted data augmentation or synthetic sample generation. For further extension of the dataset, augmentation methods can be used to increase the number and diversity of Tarp examples during training, such as class-aware copy-paste augmentation with higher sampling priority for Tarp regions and diffusion-based synthetic images guided by FEMA damage descriptions.
5.4.4. Domain-Specific Limitations of YOLO26 on AFTERMAP
Although YOLO26-L achieved the best performance among the evaluated models, its overall accuracy remains below that commonly reported on large-scale benchmarks such as COCO. This difference is likely attributable to the characteristics of the AFTERMAP dataset rather than the model architecture alone. Unlike general-purpose datasets, AFTERMAP is a relatively small, domain-specific UAV dataset containing nadir-view imagery, irregular building boundaries, debris, and subtle visual differences between adjacent damage categories. These characteristics make damage classification substantially more challenging, particularly for intermediate damage levels such as Major Damage, which exhibit considerable visual overlap with neighboring classes. The results suggest that general-purpose instance segmentation models can benefit from further adaptation to post-disaster UAV imagery. Future research may investigate domain-specific pretraining, improved strategies for handling class imbalance, and loss functions that better preserve complex object boundaries. In addition, expanding AFTERMAP with more disaster events, greater geographic diversity, and paired pre- and post-disaster imagery would provide a broader benchmark for evaluating model generalization and change-aware damage assessment.
5.4.5. Practical Engineering Applicability
The results demonstrate the potential of AFTERMAP-trained models to support rapid post-disaster damage assessment using readily available UAV imagery. First, YOLO26-L achieved real-time inference speeds of 48.5–60.2 FPS across the evaluated input resolutions (Table 8), indicating that large collections of UAV images can be processed efficiently to assist rapid damage assessment during the early stages of disaster response. Second, the Somerset–London case study shows that imagery collected using a low-cost consumer UAV is sufficient for accurate model inference, suggesting that specialized survey-grade platforms are not essential for initial building damage assessment. Finally, when integrated with UAV positioning information, the predicted building-level damage categories can be georeferenced to produce spatial damage maps that support situational awareness and help prioritize field inspections. These capabilities suggest that AFTERMAP provides a practical benchmark for developing AI-assisted tools to complement, rather than replace, existing post-disaster damage assessment workflows.
6. Conclusions
This paper introduced AFTERMAP, a FEMA-aligned benchmark dataset for instance segmentation of post-disaster building damage from UAV imagery. The dataset contains 1926 annotated UAV images with pixel-level instance masks representing five operationally relevant classes: Destroyed, Major Damage, Minor Damage, Tarp, and No Damage. By aligning the annotation taxonomy with FEMA Preliminary Damage Assessment (PDA) guidelines, AFTERMAP provides a standardized resource for developing and evaluating computer vision models for post-disaster damage assessment. Benchmark experiments demonstrated that recent YOLO instance segmentation models provide strong performance on this dataset. Among the evaluated models, YOLO26-L, trained using a 960 × 960 input resolution, achieved the best overall performance with a test mAP50 of 0.600, outperforming both Mask R-CNN (0.524) and Mask2Former (0.368) in the cross-architecture comparison. The model performed particularly well on the Destroyed, Minor Damage, and Tarp classes, while Major Damage remained the most challenging category because of its visual similarity to adjacent damage levels. These results demonstrate that AFTERMAP is a valuable resource for developing and benchmarking AI methods for UAV-based building damage assessment. By providing a publicly documented benchmark aligned with FEMA damage categories, AFTERMAP helps bridge the gap between computer vision research and practical disaster response applications.
Author Contributions
Conceptualization, D.H.; methodology, D.H. and K.O.; software, C.H. and S.A.S.; validation, D.H.; formal analysis, S.A.S. and C.H.; data curation, S.A.S.; writing—original draft preparation, S.A.S. and C.H.; writing—review and editing, D.H., H.X. and A.K.; visualization, S.A.S. and C.H.; supervision, D.H., H.X. and A.K.; project administration, D.H., H.X. and A.K.; funding acquisition, D.H. All authors have read and agreed to the published version of the manuscript.
Funding
This research was funded by the National Science Foundation, grant number 2346936, and by the Kennesaw State University Grand Challenges Seed Grants.
Data Availability Statement
The data presented in this study are available upon reasonable request from the corresponding author for non-commercial academic research purposes. Due to privacy considerations associated with post-disaster residential imagery, direct redistribution of the full dataset is restricted during the review process. Upon acceptance of the manuscript, the project repository, dataset documentation, and supporting information will be made available at: https://github.com/sultankennesaw-Civil/AFTERMAP-Dataset.git (accessed on 16 July 2026). Where permissible, a limited sample dataset comprising images collected directly by the authors and their corresponding annotation masks may also be shared through the repository.
Acknowledgments
The authors gratefully acknowledge the support from NSF and Kennesaw State University. The authors also thank undergraduate students Seth Silvey, Joel Karu, Justin Corder, Yiting He and Rishabh Kumar Singh for their assistance with data annotation. Any opinions, findings, recommendations, and conclusions in this paper are those of the authors and do not necessarily reflect the views of NSF and Kennesaw State University.
Conflicts of Interest
The authors declare no conflicts of interest.
References
- United Nations Office for Disaster Risk Reduction. Global Assessment Report on Disaster Risk Reduction 2025: Resilience Pays—Financing and Investing for Our Future; United Nations Office for Disaster Risk Reduction (UNDRR): Geneva, Switzerland, 2025. [Google Scholar]
- Smith, A.B. U.S. Billion-Dollar Weather and Climate Disasters, 1980—Present (NCEI Accession 0209268). NOAA National Centers for Environmental Information. Dataset. 2020. Available online: https://www.ncei.noaa.gov/access/metadata/landing-page/bin/iso?id=gov.noaa.nodc:0209268 (accessed on 1 May 2026).
- Federal Emergency Management Agency (FEMA). FEMA Preliminary Damage Assessment Guide; FEMA: Washington, DC, USA, 2025; p. 116.
- Federal Emergency Management Agency (FEMA). National Disaster Recovery Framework; FEMA: Washington, DC, USA, 2024.
- Al Shafian, S.; Hu, D. Integrating Machine Learning and Remote Sensing in Disaster Management: A Decadal Review of Post-Disaster Building Damage Assessment. Buildings 2024, 14, 2344. [Google Scholar] [CrossRef] [Scilit]
- Liang, J.; Zeng, Z.; Wang, P.; Wang, Z.; Wen, S.; Zhou, Y.; Zhou, C. Emergency Response Mobile 3D Printing System: A Case Study in Rapid Manufacturing of Polyurethane Foam Bridges. Case Stud. Constr. Mater. 2025, 23, e05051. [Google Scholar] [CrossRef] [Scilit]
- Hatić, D.; Polushko, V.; Rauhut, M.; Hagen, H. Post-Disaster Building Damage Assessment: Multi-Class Object Detection vs. Object Localization and Classification. Remote Sens. 2025, 17, 3957. [Google Scholar] [CrossRef] [Scilit]
- Doshi, J.; Basu, S.; Pang, G. From Satellite Imagery to Disaster Insights. arXiv 2018, arXiv:1812.07033. [Google Scholar] [CrossRef] [Scilit]
- Gupta, R.; Hosfelt, R.; Sajeev, S.; Patel, N.; Goodman, B.; Doshi, J.; Heim, E.; Choset, H.; Gaston, M. xBD: A Dataset for Assessing Building Damage from Satellite Imagery. arXiv 2019, arXiv:1911.09296. [Google Scholar] [CrossRef] [Scilit]
- Alisjahbana, I.; Li, J.; Ben, S.; Zhang, Y. DeepDamageNet: A Two-Step Deep-Learning Model for Multi-Disaster Building Damage Segmentation and Classification Using Satellite Imagery. arXiv 2024, arXiv:2405.04800. [Google Scholar] [CrossRef] [Scilit]
- Shen, Y.; Zhu, S.; Yang, T.; Chen, C. Cross-Directional Feature Fusion Network for Building Damage Assessment from Satellite Imagery. arXiv 2020, arXiv:2010.14014. [Google Scholar] [CrossRef] [Scilit]
- Rahnemoonfar, M.; Chowdhury, T.; Murphy, R. RescueNet: A High Resolution UAV Semantic Segmentation Dataset for Natural Disaster Damage Assessment. Sci. Data 2023, 10, 913. [Google Scholar] [CrossRef] [Scilit] [PubMed]
- Asad, M.H.; Asim, M.M.; Awan, M.N.M.; Yousaf, M.H. Natural Disaster Damage Assessment Using Semantic Segmentation of UAV Imagery. In Proceedings of the 2023 International Conference on Robotics and Automation in Industry (ICRAI), Peshawar, Pakistan, 3–5 March 2023; IEEE: Peshawar, Pakistan, 2023; pp. 1–7. [Google Scholar]
- Rahnemoonfar, M.; Chowdhury, T.; Sarkar, A.; Varshney, D.; Yari, M.; Murphy, R.R. FloodNet: A High Resolution Aerial Imagery Dataset for Post Flood Scene Understanding. IEEE Access 2021, 9, 89644–89654. [Google Scholar] [CrossRef] [Scilit]
- Safavi, F.; Rahnemoonfar, M. Comparative Study of Real-Time Semantic Segmentation Networks in Aerial Images During Flooding Events. IEEE J. Sel. Top. Appl. Earth Obs. Remote Sens. 2023, 16, 4–20. [Google Scholar] [CrossRef] [Scilit]
- Scheele, S.; Picchione, K.; Liu, J. LADI v2: Multi-Label Dataset and Classifiers for Low-Altitude Disaster Imagery. arXiv 2024, arXiv:2406.02780. [Google Scholar] [CrossRef] [Scilit]
- Le, N.; Karimi, E.; Rahnemoonfar, M. 3DAeroRelief: The First 3D Benchmark UAV Dataset for Post-Disaster Assessment. arXiv 2025, arXiv:2509.11097. [Google Scholar] [CrossRef] [Scilit]
- Singh, D.K.; Hoskere, V. Post Disaster Damage Assessment Using Ultra-High-Resolution Aerial Imagery with Semi-Supervised Transformers. Sensors 2023, 23, 8235. [Google Scholar] [CrossRef] [Scilit] [PubMed]
- Long, J.; Shelhamer, E.; Darrell, T. Fully Convolutional Networks for Semantic Segmentation. In Proceedings of the 2015 IEEE Conference on Computer Vision and Pattern Recognition (CVPR), Boston, MA, USA, 7–12 June 2015; IEEE: Boston, MA, USA, 2015; pp. 3431–3440. [Google Scholar]
- Ronneberger, O.; Fischer, P.; Brox, T. U-Net: Convolutional Networks for Biomedical Image Segmentation. arXiv 2015, arXiv:1505.04597. [Google Scholar] [CrossRef] [Scilit]
- Zou, K.; Chen, X.; Zhang, F.; Zhou, H.; Zhang, C. A Field Weed Density Evaluation Method Based on UAV Imaging and Modified U-Net. Remote Sens. 2021, 13, 310. [Google Scholar] [CrossRef] [Scilit]
- Wu, C.; Zhang, F.; Xia, J.; Xu, Y.; Li, G.; Xie, J.; Du, Z.; Liu, R. Building Damage Detection Using U-Net with Attention Mechanism from Pre- and Post-Disaster Remote Sensing Datasets. Remote Sens. 2021, 13, 905. [Google Scholar] [CrossRef] [Scilit]
- Deng, L.; Wang, Y. Post-Disaster Building Damage Assessment Based on Improved U-Net. Sci. Rep. 2022, 12, 15862. [Google Scholar] [CrossRef] [Scilit] [PubMed]
- Zhao, H.; Shi, J.; Qi, X.; Wang, X.; Jia, J. Pyramid Scene Parsing Network. arXiv 2016, arXiv:1612.01105. [Google Scholar] [CrossRef] [Scilit]
- Kang, S.; Jiao, M.; Wan, H.; Yu, Y.; Yin, J.; Zhao, T. Building Damage Assessment Based on an Enhanced PSPNet Network and UAV Images. Constr. Build. Mater. 2025, 495, 143613. [Google Scholar] [CrossRef] [Scilit]
- Chen, L.-C.; Zhu, Y.; Papandreou, G.; Schroff, F.; Adam, H. Encoder-Decoder with Atrous Separable Convolution for Semantic Image Segmentation 2018. In Proceedings of the European Conference on Computer Vision (ECCV), Munich, Germany, 8–14 September 2018. [Google Scholar]
- Xie, E.; Wang, W.; Yu, Z.; Anandkumar, A.; Alvarez, J.M.; Luo, P. SegFormer: Simple and Efficient Design for Semantic Segmentation with Transformers. arXiv 2021, arXiv:2105.15203. [Google Scholar] [CrossRef] [Scilit]
- Zou, R.; Liu, J.; Pan, H.; Tang, D.; Zhou, R. An Improved Instance Segmentation Method for Fast Assessment of Damaged Buildings Based on Post-Earthquake UAV Images. Sensors 2024, 24, 4371. [Google Scholar] [CrossRef] [Scilit] [PubMed]
- He, K.; Gkioxari, G.; Dollar, P.; Girshick, R. Mask R-CNN. In Proceedings of the 2017 IEEE International Conference on Computer Vision (ICCV), Venice, Italy, 22–29 October 2017; IEEE: Venice, Italy, 2017; pp. 2980–2988. [Google Scholar]
- Zhan, Y.; Liu, W.; Maruyama, Y. Damaged Building Extraction Using Modified Mask R-CNN Model Using Post-Event Aerial Images of the 2016 Kumamoto Earthquake. Remote Sens. 2022, 14, 1002. [Google Scholar] [CrossRef] [Scilit]
- Gu, Z.; Wang, S.; Yu, K.; Wang, Y.; Zhang, X. UEBNet: A Novel and Compact Instance Segmentation Network for Post-Earthquake Building Assessment Using UAV Imagery. Remote Sens. 2025, 17, 3530. [Google Scholar] [CrossRef] [Scilit]
- Nitsche, M.; Mukkavilli, S.K.; Kühl, N.; Brunschwiler, T. AB2CD: AI for Building Climate Damage Classification and Detection. arXiv 2023, arXiv:2309.01066. [Google Scholar] [CrossRef] [Scilit]
- Xia, Z.; Li, Z.; Bai, Y.; Yu, J.; Adriano, B. Self-Supervised Learning for Building Damage Assessment from Large-Scale xBD Satellite Imagery Benchmark Datasets. In Proceedings of the Renmin University of China; Strauss, C., Cuzzocrea, A., Kotsis, G., Tjoa, A., Khalil, I., Eds.; Springer: Berlin/Heidelberg, Germany, 2022; Volume 13426, pp. 373–386. [Google Scholar]
- CVAT. AI Corporation Computer Vision Annotation Tool (CVAT) 2026. Available online: https://www.cvat.ai/ (accessed on 17 May 2026).
- Landis, J.R.; Koch, G.G. The Measurement of Observer Agreement for Categorical Data. Biometrics 1977, 33, 159–174. [Google Scholar] [CrossRef] [Scilit]
- National Oceanic and Atmospheric Administration; National Centers for Environmental Information. Storm Events Database: Event Details; National Centers for Environmental Information: Asheville, NC, USA, 2025.

Disclaimer/Publisher’s Note: The statements, opinions and data contained in all publications are solely those of the individual author(s) and contributor(s) and not of MDPI and/or the editor(s). MDPI and/or the editor(s) disclaim responsibility for any injury to people or property resulting from any ideas, methods, instructions or products referred to in the content. |
© 2026 by the authors. Licensee MDPI, Basel, Switzerland. This article is an open access article distributed under the terms and conditions of the Creative Commons Attribution (CC BY) license.