


Abstract
Public building retrofit is an important pathway for reducing operational carbon emissions, but evidence-based technology prioritisation remains limited under real-world multi-technology retrofit conditions. This study develops an interpretable data-driven framework to identify priority technologies and technology co-adoption patterns for public buildings in China’s Hot Summer and Cold Winter (HSCW) region. Based on 218 completed retrofit projects, the carbon reduction rate (CRR) was used as the performance indicator, and 15 retrofit technologies were analysed using FDR-adjusted Mann–Whitney U tests, repeated-validation XGBoost–SHAP analysis, and Apriori association-rule mining. The projects showed substantial variation in CRR, with a mean of 24.98% and a median of 21.70%. Across five repeated 5-fold cross-validations, the predictive XGBoost model achieved a mean R2 of 0.417 and a mean RMSE of 0.127. Roof insulation, external wall insulation, and ventilation system retrofit showed the strongest combined evidence and were classified as core technologies. Apriori analysis further revealed three empirical co-adoption patterns: integrated passive-envelope retrofit, solar-control and renewable-energy integration, and operational-management improvement. The findings suggest that retrofit planning in the HSCW region should prioritise envelope insulation and ventilation performance, while selecting shading, system, renewable-energy, and operational-control measures according to project-specific conditions.
1. Introduction
The building sector is one of the largest contributors to global energy use and carbon emissions. According to the International Energy Agency (IEA), building operations account for approximately 30% of global final energy consumption and 26% of global energy-related emissions [1]. As countries continue to advance carbon neutrality strategies under the Paris Agreement, improving the energy and environmental performance of existing buildings has become an important pathway toward achieving long-term decarbonization goals [2]. Compared with demolition and reconstruction, building retrofit can substantially reduce embodied carbon associated with new construction while improving operational energy efficiency. Previous studies have shown that green retrofit strategies can significantly decrease life-cycle carbon emissions and often provide a more cost-effective solution for carbon mitigation in the building sector [3,4].
China possesses one of the world’s largest existing building stocks, with public buildings representing a considerable share of national energy consumption [5,6]. According to data from the China Building Energy Efficiency Association and the Building Energy Research Center of Tsinghua University, as of the end of 2024, the total floor area of existing urban buildings had exceeded 70 billion m2, of which public buildings accounted for more than 15 billion m2 [7,8,9]. A large proportion of these buildings were constructed before the implementation of China’s modern energy-efficiency standards and therefore suffer from poor thermal performance, inefficient HVAC systems, and outdated energy management practices. These characteristics create substantial opportunities for carbon emission reduction through retrofit interventions [4,10].
China’s Hot Summer and Cold Winter (HSCW) region provides a particularly important context for public building retrofit. Buildings in this region require both substantial cooling in summer and heating in winter [11]. Retrofit strategies must therefore limit solar heat gains and overheating risk during hot and humid summers while maintaining sufficient envelope insulation to reduce heat loss in winter, making insulation and external shading particularly relevant in this climate [12,13]. This dual-load condition makes retrofit decision-making more complex than in heating- or cooling-dominated regions, because annual energy and carbon performance depends on the combined effects of building envelopes, equipment systems, operational controls, and renewable energy technologies [14]. Therefore, retrofit planning in the HSCW region requires not only the selection of effective individual technologies, but also a better understanding of how different technologies perform when they are implemented together.
Existing studies have examined a wide range of retrofit technologies for reducing building energy use and carbon emissions. In the HSCW climate zone, building envelope performance is particularly important because it affects both summer cooling and winter heating loads [15]. Sensitivity analysis has shown that the performance of existing building envelopes can be significantly lower than the GB50189-2015 benchmark model, with heating and cooling loads reported to be 18.94% higher, while optimized envelope parameters can reduce the comprehensive load by 28.26% [16,17]. Simulation studies for office buildings in this region have further reported energy-saving potentials of 5.74–7.86% for exterior wall retrofit, 5.11–7.39% for roof retrofit, 9.11–11.88% for window renovation, and 3.09–10.95% for shading systems [17]. These findings indicate that envelope-related measures can provide measurable energy-saving benefits under the dual cooling–heating demand of the HSCW region.
Equipment and control measures have also been widely investigated in public building retrofit. Efficient HVAC systems, LED lighting systems, and Building Energy Management Systems (BEMS) are commonly adopted to improve operational energy performance. Depending on building type and system integration level, BEMS has been reported to achieve energy savings of 20–50% [18]. Integrated lighting and HVAC control can further reduce HVAC energy consumption by up to 30%, corresponding to an approximately 20% reduction in overall building energy consumption [19]. Renewable energy technologies, including Building-Integrated Photovoltaic (BIPV) systems and solar thermal systems, are also increasingly incorporated into retrofit strategies to support low-carbon energy supply [20,21]. These studies have provided important evidence on the technical potential of different retrofit measures.
However, the evidence base for retrofit decision-making remains incomplete. First, much of the existing research relies on energy simulation, case study analysis, or life cycle assessment (LCA). Simulation tools such as EnergyPlus, eQUEST, and DeST can efficiently compare alternative retrofit solutions, but their results are sensitive to assumptions regarding weather files, occupancy schedules, equipment parameters, control strategies, and baseline conditions [22,23]. Case studies can reflect actual retrofit outcomes, but their findings are often difficult to generalize because of small sample sizes and project-specific conditions [24,25]. LCA studies provide a broader carbon perspective by considering both operational and embodied emissions, but many of them focus on a single technology or a specific case rather than large-scale comparisons across real retrofit projects [26,27,28,29]. Therefore, retrofit decision-making still lacks sufficient empirical support from large samples of real-world public building projects [30].
Second, most existing studies evaluate individual technologies or pre-defined retrofit packages, whereas actual retrofit projects rarely adopt a single measure. Multiple technologies are usually implemented simultaneously, and their effects may overlap or interact [31]. Under such multi-technology conditions, the apparent benefit of one measure may be partly driven by other measures adopted in the same project. Conventional univariate comparison is therefore insufficient to identify which technologies have stable independent contributions and which technologies mainly appear effective because they are co-applied with other high-impact measures. This limitation is particularly important for public buildings in China’s HSCW region, where retrofit decisions must balance carbon reduction, energy savings, investment priorities, and practical implementation constraints [32,33].
To address these gaps, this study develops an interpretable data-driven framework for technology prioritization and collaborative retrofit pathway identification based on 218 real-world public building retrofit projects in China’s HSCW region. The carbon reduction rate (CRR) is adopted as the core evaluation indicator by comparing post-retrofit carbon emissions with pre-retrofit baseline emissions. Fifteen commonly applied retrofit technologies are classified into three categories: building envelope retrofit technologies, equipment system upgrades, and renewable energy or green technologies. The framework integrates three complementary methods. First, the Mann–Whitney U test is used to examine whether projects adopting a given technology show significantly different carbon reduction performance from those that do not. Second, an XGBoost regression model combined with SHAP analysis is used to identify the relative importance and marginal contribution of each technology under multi-technology conditions. Third, Apriori association rule mining is applied to high-performing projects to identify technology combinations that are more frequently associated with high carbon-reduction outcomes.
This study contributes to the literature in three ways. First, it provides empirical evidence from 218 real-world public building retrofit projects, complementing simulation-based and small-sample studies. Second, it develops an interpretable analytical framework that integrates statistical testing, machine learning interpretation, and association rule mining to evaluate technology effectiveness, conditional importance, and collaborative application patterns within a unified process. Third, it proposes a technology prioritization system and a set of association-based retrofit pathways for public buildings in the HSCW region. The findings can support evidence-based retrofit planning, investment prioritization, and low-carbon building policy.
2. Methods
2.1. Data Source and Case Selection
This study used project-level data from completed public building energy-efficiency retrofit projects in the Hot Summer and Cold Winter (HSCW) region of China. The original data were obtained from four types of project documents: (1) acceptance assessment reports of building energy-efficiency retrofit projects; (2) green building assessment and operational records; (3) records of energy-efficiency retrofit technology applications; and (4) energy audit and carbon-emission accounting reports.
The extracted information included project location, building type, construction year, building floor area, adopted retrofit technologies, baseline annual carbon emissions, and post-retrofit annual carbon emissions. The raw records were checked for consistency in project identification, technology classification, carbon-accounting boundary, and emission units. Projects with missing key variables, incomplete technology records, non-positive baseline emissions, or abnormal carbon-emission values were excluded. After multi-source data integration, data cleaning, and consistency verification, 218 valid retrofit projects were retained for analysis.
The carbon-accounting boundary was limited to annual operational carbon emissions at the individual-building level. Baseline and post-retrofit emissions covered the energy carriers reported within the same project boundary and were calculated using consistent emission units and accounting methods. Embodied emissions associated with retrofit materials, equipment manufacture, transport, construction, and end-of-life treatment were outside the scope of this study. Projects were retained only when the pre- and post-retrofit records used consistent energy types and accounting boundaries.
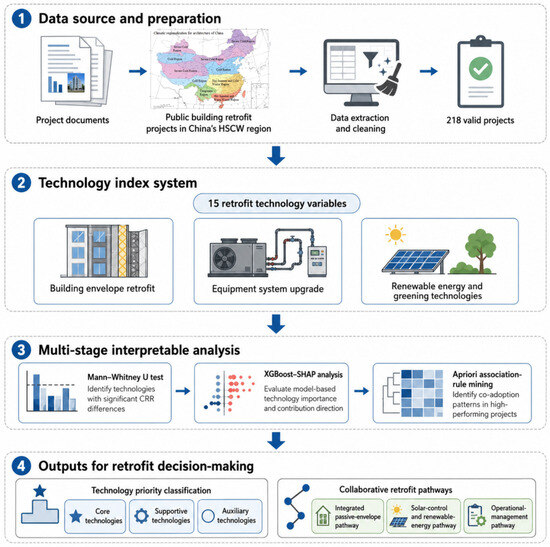
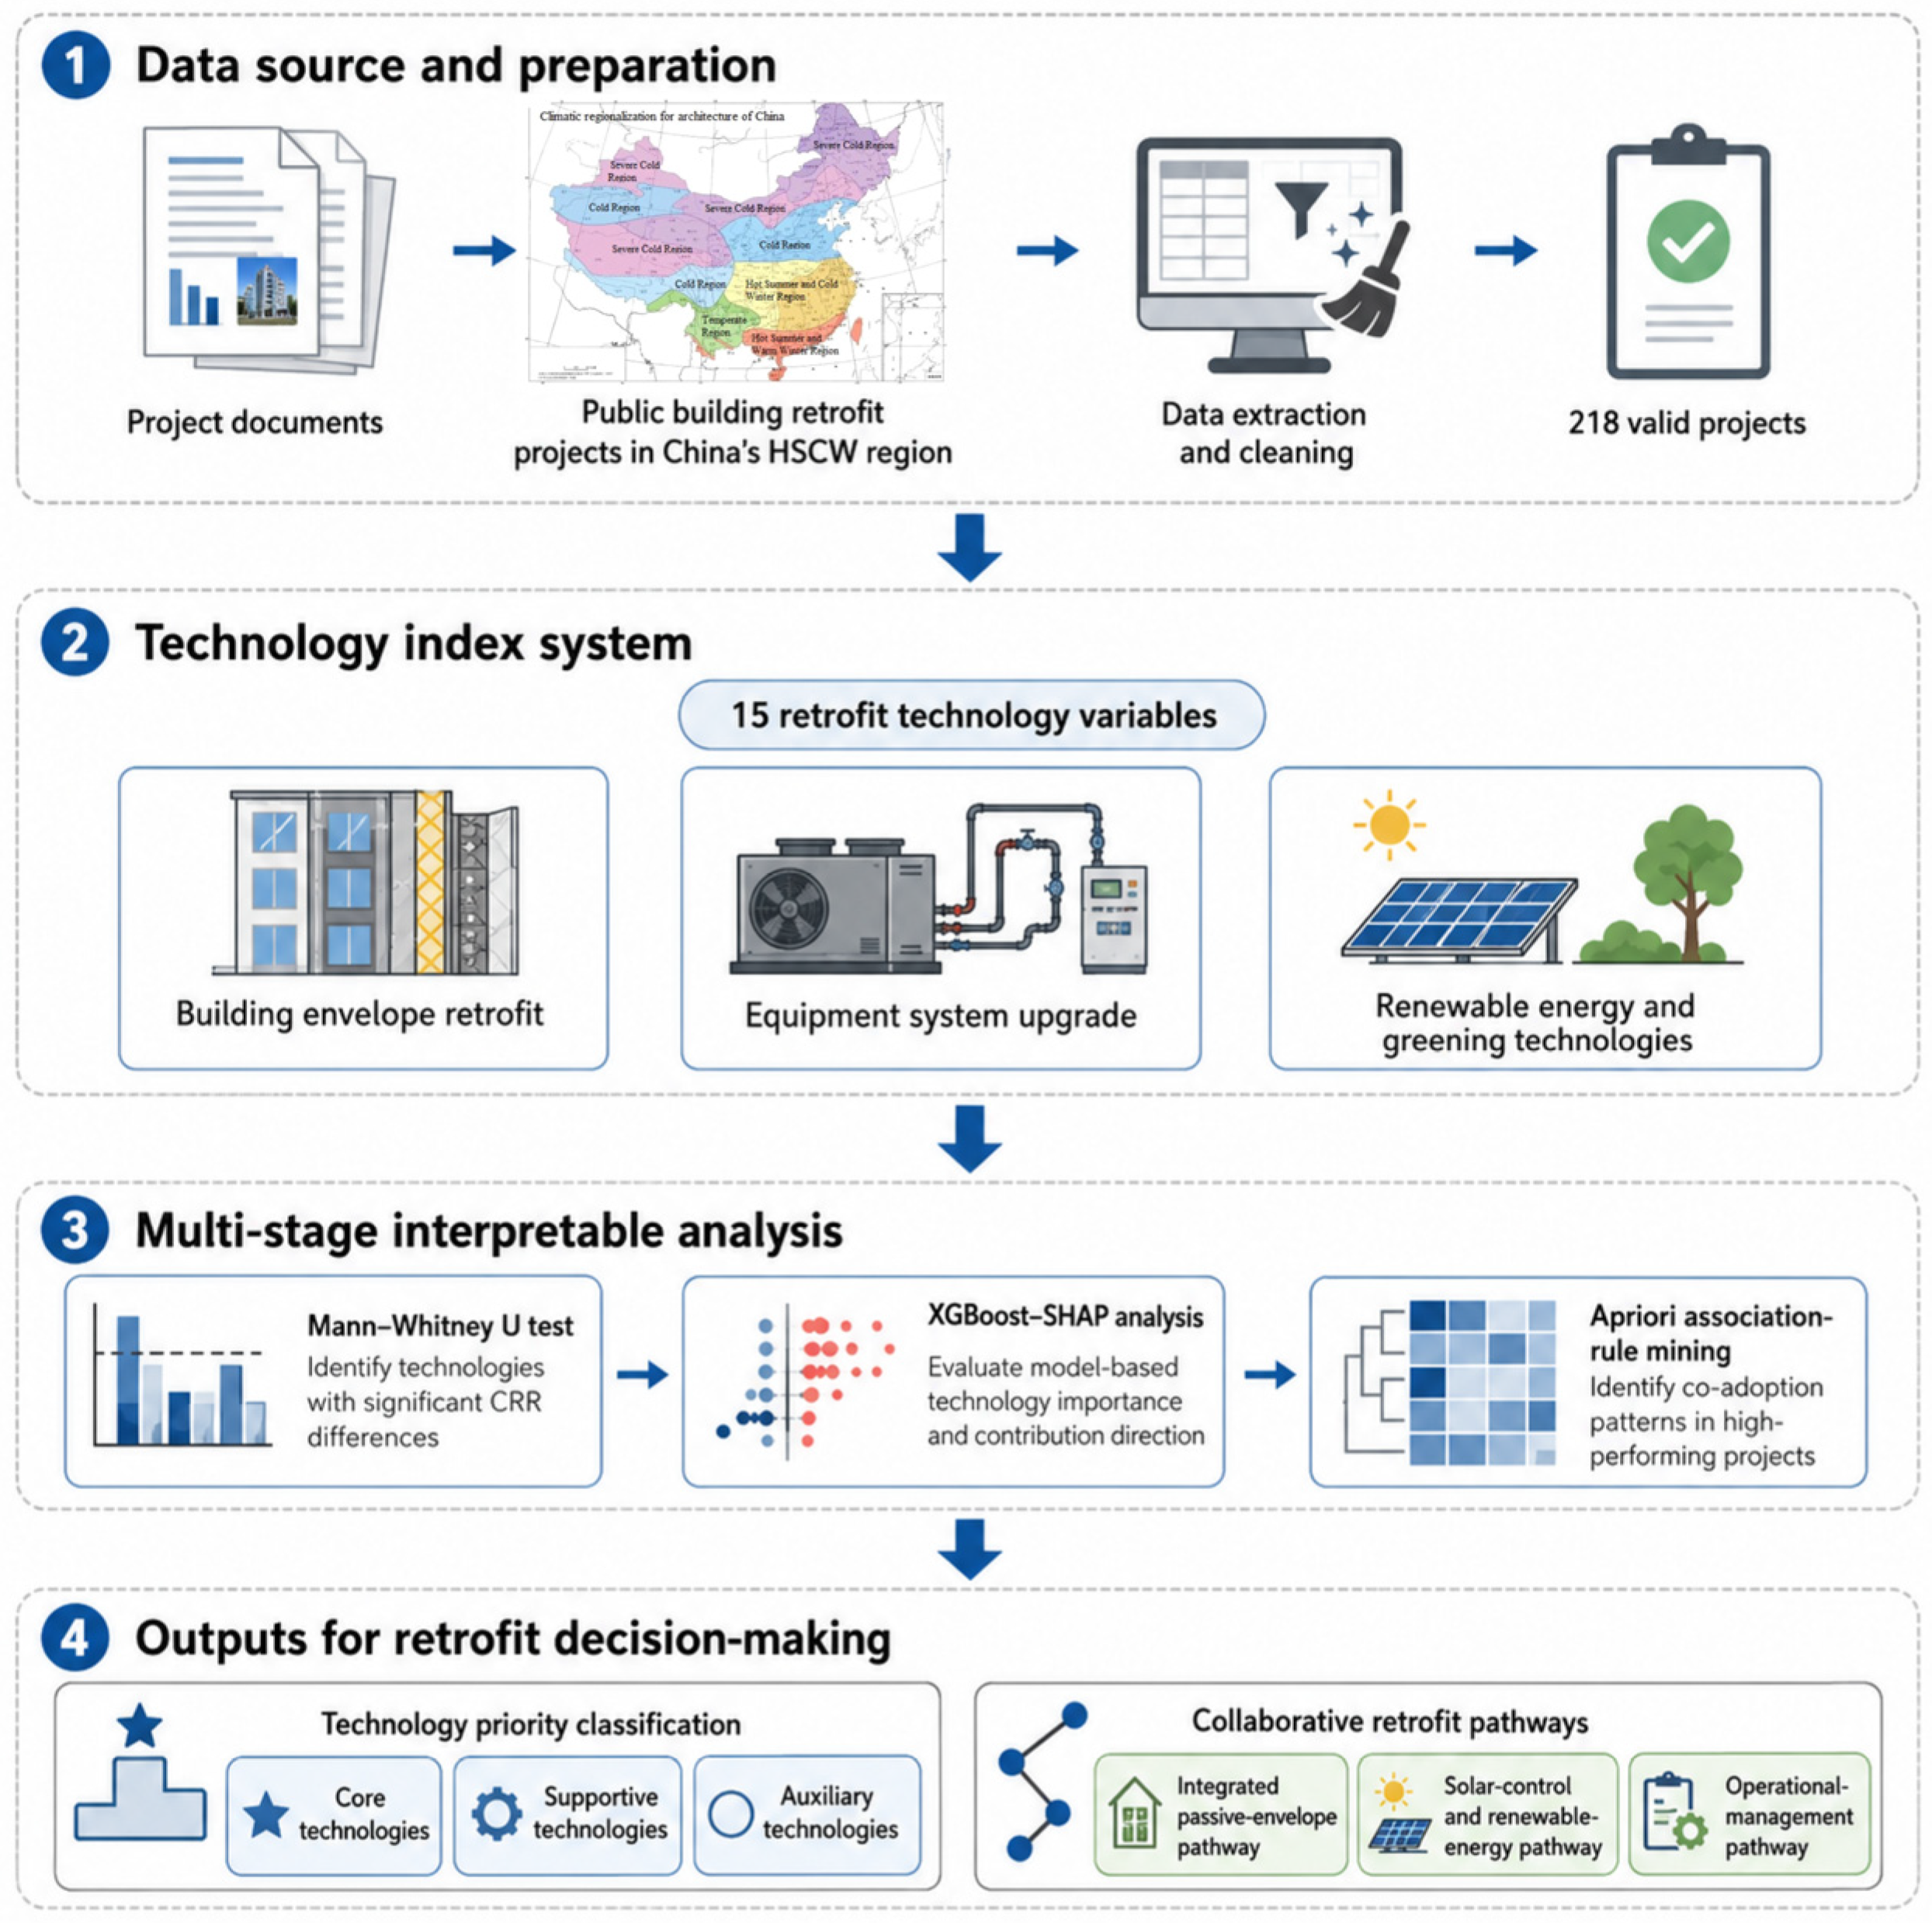
As shown in Figure 1, the analytical procedure included three main steps: univariate statistical comparison, multivariate model interpretation, and technology co-adoption pattern mining. These results were then integrated to construct a technology priority system for public building retrofits in the HSCW region.
Figure 1.
Analytical workflow of this study.
2.2. Retrofit Technology Classification and Carbon Reduction Indicator
To ensure consistency and comparability across projects, the retrofit measures reported in the project documents were standardised into 15 binary technology variables. Each variable was coded as 1 if the corresponding technology was adopted in a project and 0 otherwise. For HVAC system retrofit, the binary indicator captured any reported HVAC-related upgrade, as the source records did not consistently distinguish generation equipment from associated distribution-system components. These technologies were classified into three categories according to their dominant energy-saving or carbon-reduction mechanisms: building envelope retrofit, equipment system upgrade, and renewable energy and greening technologies, as shown in Table 1.
Table 1.
Classification of retrofit technology variables.
Building envelope retrofit technologies mainly reduce carbon emissions by decreasing heating and cooling loads through improved envelope thermal performance. Equipment system upgrades reduce operational carbon emissions primarily by improving system efficiency, equipment performance, and operational control. Renewable energy and greening technologies contribute to carbon reduction through on-site renewable energy generation, local microclimate improvement, or limited ecological carbon-sink effects.
Following the common before-and-after evaluation logic used in retrofit measurement and verification, the carbon reduction rate (CRR) was used as the dependent variable to evaluate project-level retrofit performance [34]. CRR was calculated as the percentage reduction in annual operational carbon emissions after retrofit relative to the pre-retrofit baseline, as shown in Equation (1):
where represents the annual operational carbon emissions of the building before retrofit, and represents the annual operational carbon emissions after retrofit. CRR was adopted as a normalised performance indicator because it reduces the influence of project scale and baseline emission level, thereby enabling comparison across buildings with different sizes, functions, and locations.
2.3. Statistical and Machine-Learning Analysis
A three-step analytical approach was used to identify retrofit technologies with significant statistical associations, stable model-based contributions, and frequent co-adoption patterns in high-performing projects.
First, the Mann–Whitney U test was used to compare the CRR distributions between projects adopting and not adopting each retrofit technology [35]. This non-parametric test was selected because the CRR data were not normally distributed and the sample sizes of the adoption and non-adoption groups were uneven for several technologies. For each technology, the 218 projects were divided into an adoption group and a non-adoption group. To account for the increased risk of false-positive findings arising from multiple comparisons across the 15 technologies, the Benjamini–Hochberg procedure was applied to control the false discovery rate (FDR) [36], with q < 0.05 considered statistically significant.
Second, an XGBoost regression model was developed to evaluate the relative contribution of retrofit technologies under multi-technology conditions [37]. The predictive model included the 15 binary technology variables, the total number of adopted technologies, construction year, log-transformed building floor area, building type, and project location. The model can be expressed as , where denotes the adoption status of the ith retrofit technology, N is the total number of adopted technologies, Y is construction year, A is building floor area, B is building type, and L is project location. Building types and locations represented by fewer than five projects were grouped into an “Other” category to reduce instability arising from sparse categories. XGBoost was used to capture potential nonlinear relationships and interaction effects among the variables. Model performance was evaluated using five repeated 5-fold cross-validations, with R2 and RMSE used as performance indicators.
For technology-level SHAP interpretation, a corresponding XGBoost model was fitted using the 15 technology variables and the same project-level covariates, but excluding the total number of adopted technologies. This variable was excluded because it was directly derived from the 15 technology indicators and could redistribute their individual SHAP contributions. SHAP analysis was then applied to interpret the trained XGBoost model [38]. Mean absolute SHAP values were used to quantify the global importance of each technology, while the distribution of SHAP values was examined to assess the direction and magnitude of its association with predicted CRR. Technology importance was averaged across the 25 validation models generated by the repeated cross-validations, and the corresponding interquartile ranges were used to assess ranking stability. In comparison with the Mann–Whitney U test, the XGBoost–SHAP analysis provides a multivariate assessment of technology importance after accounting for co-adopted measures and observable project characteristics.
Third, Apriori association-rule mining was applied to high-performing projects, defined as the top 30% of projects ranked by CRR [39]. Each project was treated as a transaction, and the adopted technologies were treated as items. Support, confidence, and lift were used to evaluate technology co-adoption patterns. Support measures the frequency of a technology combination, confidence represents the conditional probability of co-adoption, and lift compares the observed co-occurrence frequency with that expected under statistical independence. A lift value greater than 1 indicates a positive association between technologies.
2.4. Technology Priority Classification
The technology priority tiers were developed by integrating four sources of evidence: FDR-adjusted Mann–Whitney significance, mean SHAP importance, the direction of SHAP contributions, and ranking stability across repeated cross-validation. Adoption sample size was also considered when interpreting technologies with limited empirical support. The resulting tiers represent sample-based empirical priorities rather than definitive causal or investment rankings.
Based on this integrated evidence, technologies were classified into three priority levels. Core technologies were those supported by convergent statistical and model-based evidence and that remained consistently highly ranked across repeated validation models. Supportive technologies showed significant or potentially meaningful associations but had lower model importance, greater ranking variability, or limited adoption samples. Auxiliary technologies showed weak or inconsistent evidence within the available dataset.
Apriori association-rule mining was then used as a complementary analysis to identify empirical co-adoption patterns among high-performing projects. These association rules were not interpreted as causal effects, but as evidence of practical retrofit pathways frequently observed in projects with relatively high CRR.
Since the dataset was derived from actual retrofit projects rather than controlled experiments, the results were interpreted as statistical associations, model-based contributions, and empirical co-adoption patterns rather than direct causal effects.
3. Results
3.1. Descriptive Statistics of the Retrofit Projects
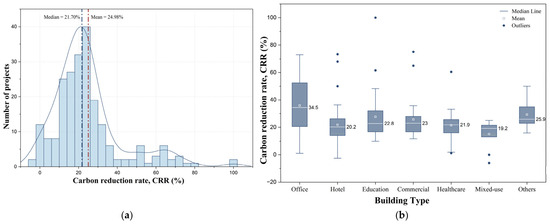
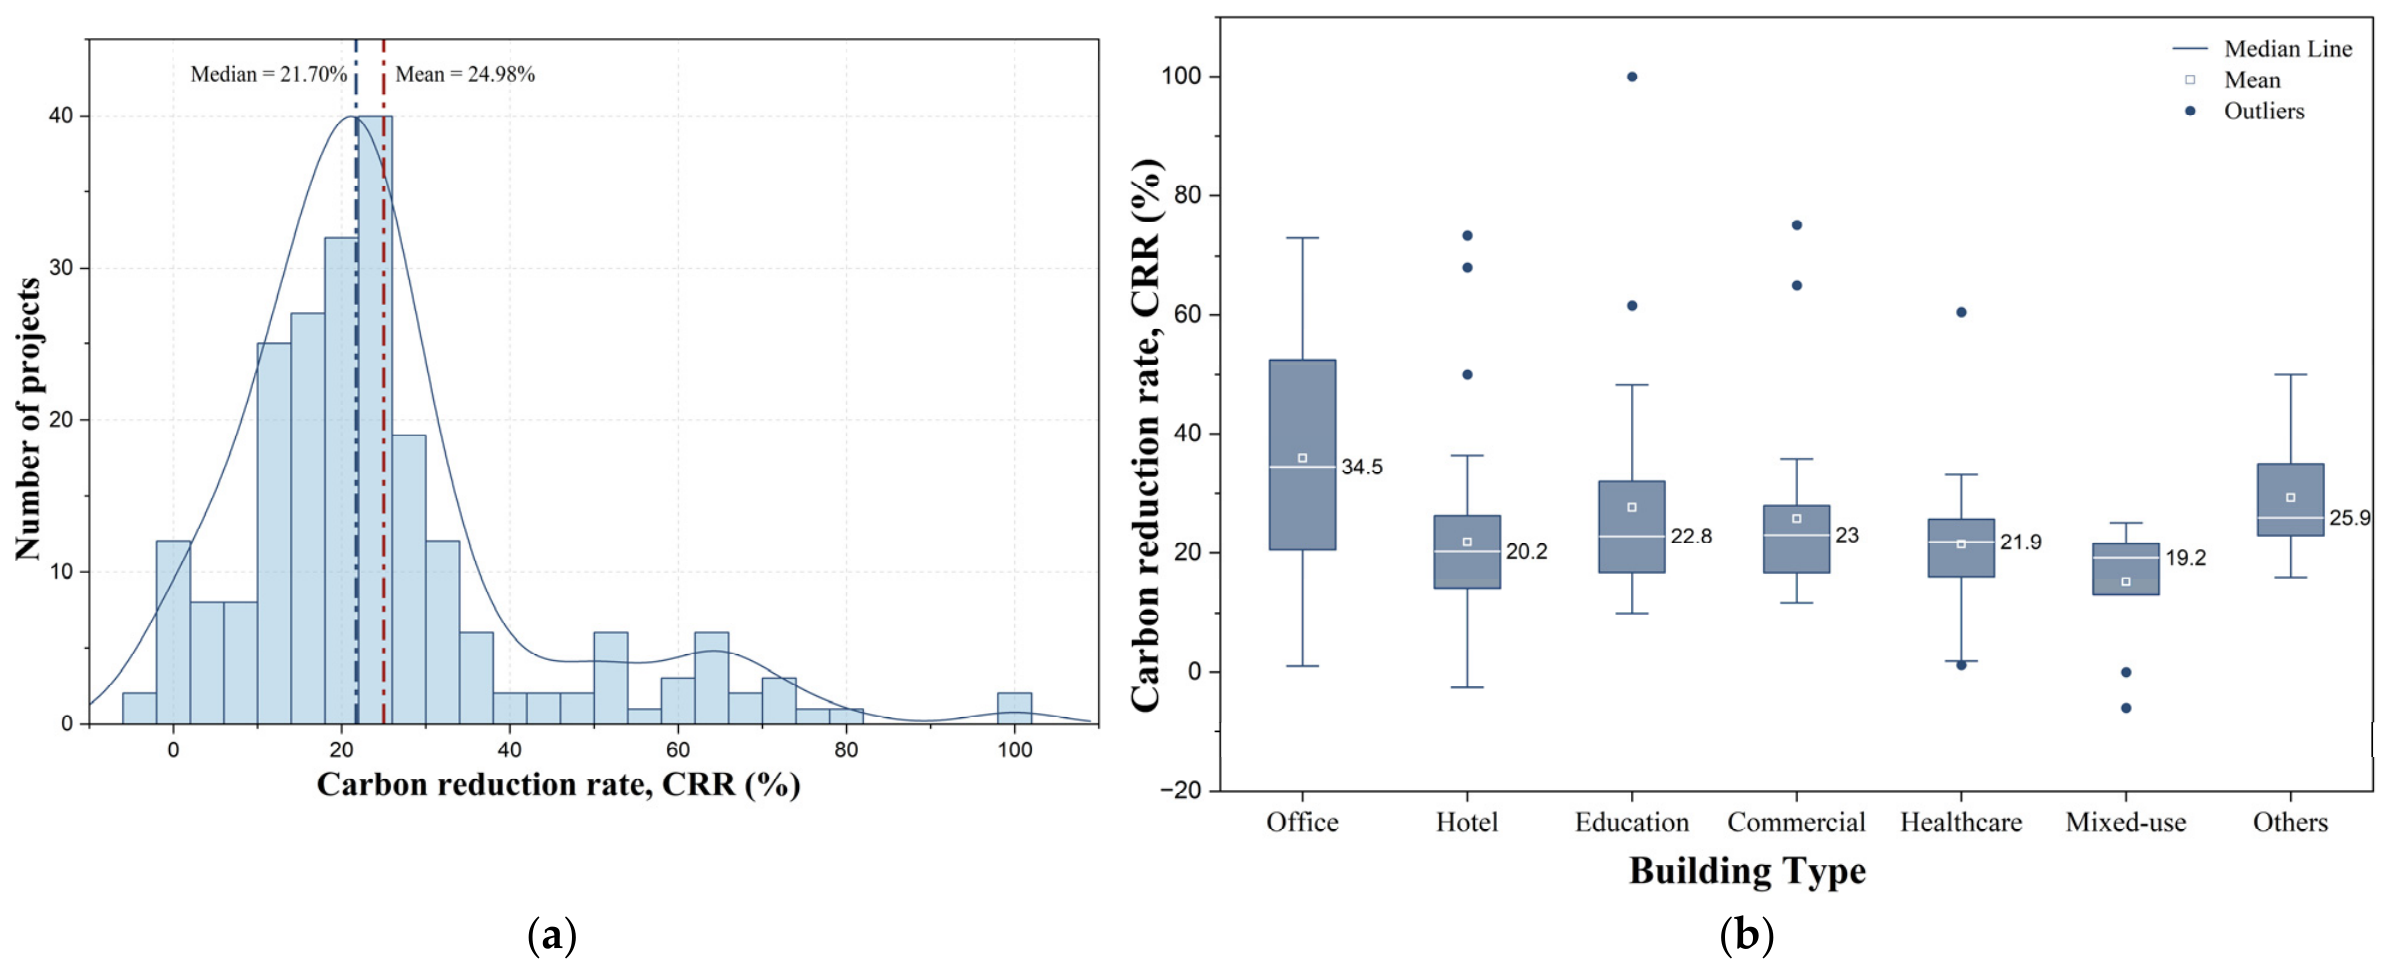
The 218 retrofit projects showed considerable variation in carbon reduction performance across both individual projects and building types. As shown in Figure 2a, the distribution of CRR was right-skewed, with a mean value of 24.98%, a median value of 21.70%, and a standard deviation of 17.65%. This indicates that most projects achieved low-to-moderate carbon reductions, while a smaller number of projects reached substantially higher reduction levels. The presence of several high-CRR cases suggests that deep carbon reduction was achievable in some retrofit projects, although such outcomes were not representative of the overall sample.
Figure 2.
(a) Distribution of carbon reduction rates across the 218 retrofit projects; (b) carbon reduction rates by building type. Building types with fewer than five cases were grouped as “Others”.
Figure 2b compares the CRR distributions across different building types. Office buildings showed the widest variation, with several high-CRR cases and a median CRR of 34.5%, suggesting substantial heterogeneity in retrofit outcomes within this category. Hotel, commercial, healthcare, and mixed-use buildings showed more concentrated distributions, with median CRR values generally around 19–23%. Education buildings also exhibited a wide range, including one project with a CRR close to 100%, indicating that high carbon reduction can be achieved in some individual cases but is not representative of the whole category. Overall, Figure 2b indicates that carbon reduction performance varied across building functions, while the within-type dispersion suggests that building type alone cannot fully explain retrofit outcomes.
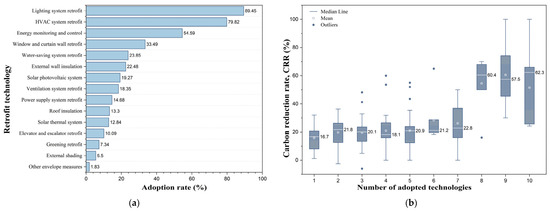
The adoption structure of the 15 retrofit technology variables is presented in Figure 3a. Lighting system retrofit and HVAC system retrofit were the most widely adopted measures, with adoption rates of 89.45% and 79.82%, respectively. Energy consumption monitoring and intelligent control were also frequently adopted, with an adoption rate of 54.59%. In contrast, external shading, greening retrofit, and other envelope-related measures had relatively low adoption rates. This indicates that equipment-related measures were more commonly implemented in actual public building retrofit practice, whereas several passive envelope and greening measures were less frequently adopted.
Figure 3.
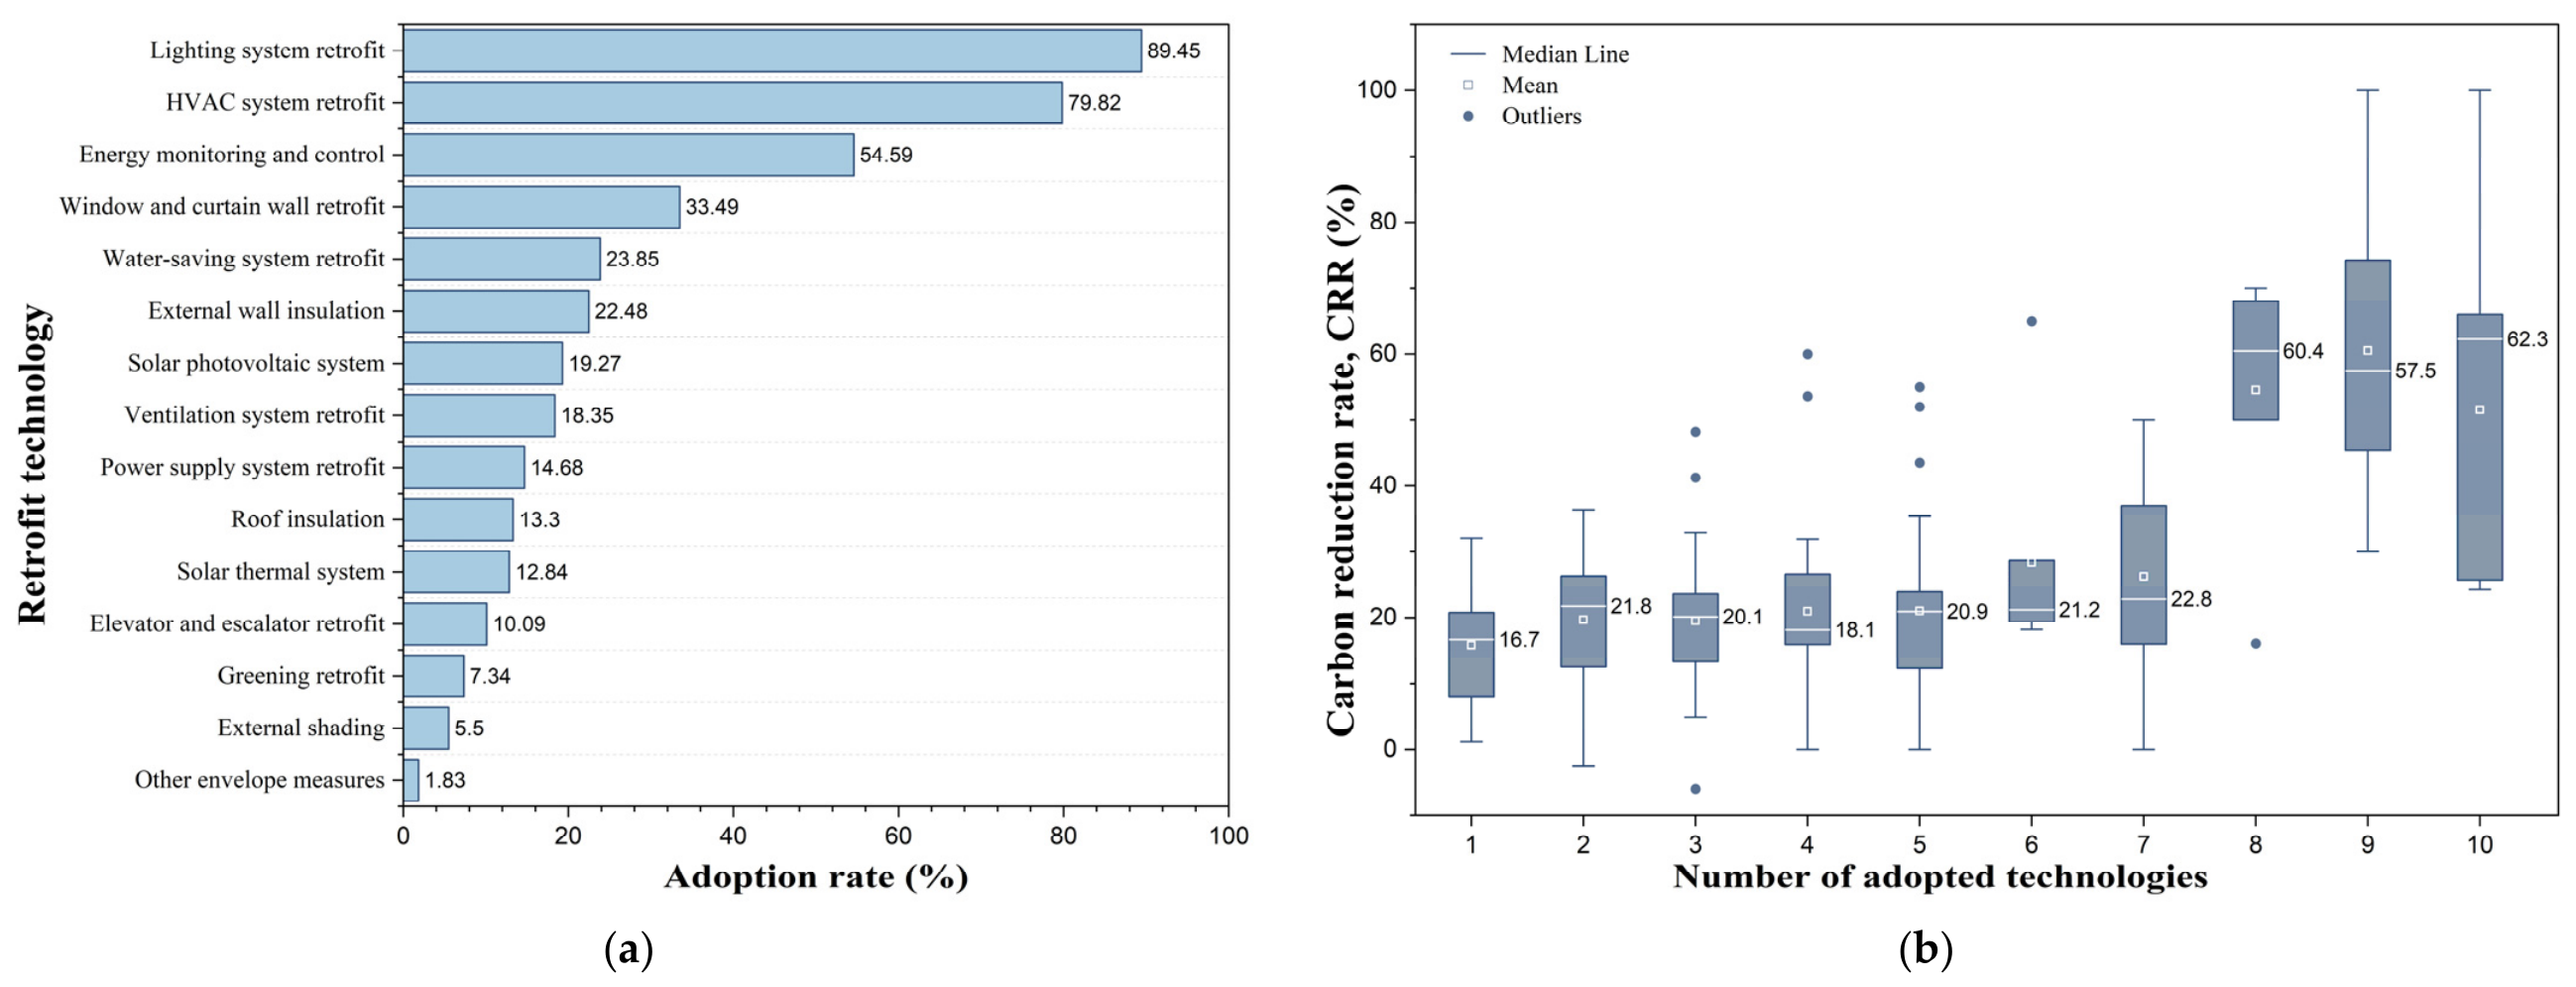
(a) Adoption rates of the 15 retrofit technology variables; (b) carbon reduction rates by the number of adopted technologies per project.
Figure 3b shows the relationship between CRR and the number of adopted retrofit technologies per project. Most projects adopted multiple technologies rather than a single measure: only 13 projects adopted one technology, while the majority adopted two or more technologies. Projects adopting a larger number of technologies generally tended to show higher CRR values, especially when eight or more technologies were implemented. However, the variation within each group remained considerable, indicating that retrofit performance was not determined solely by the number of adopted technologies. The type of technologies adopted and their co-adoption patterns are therefore important for explaining project-level carbon reduction outcomes.
3.2. Mann–Whitney U Test Results
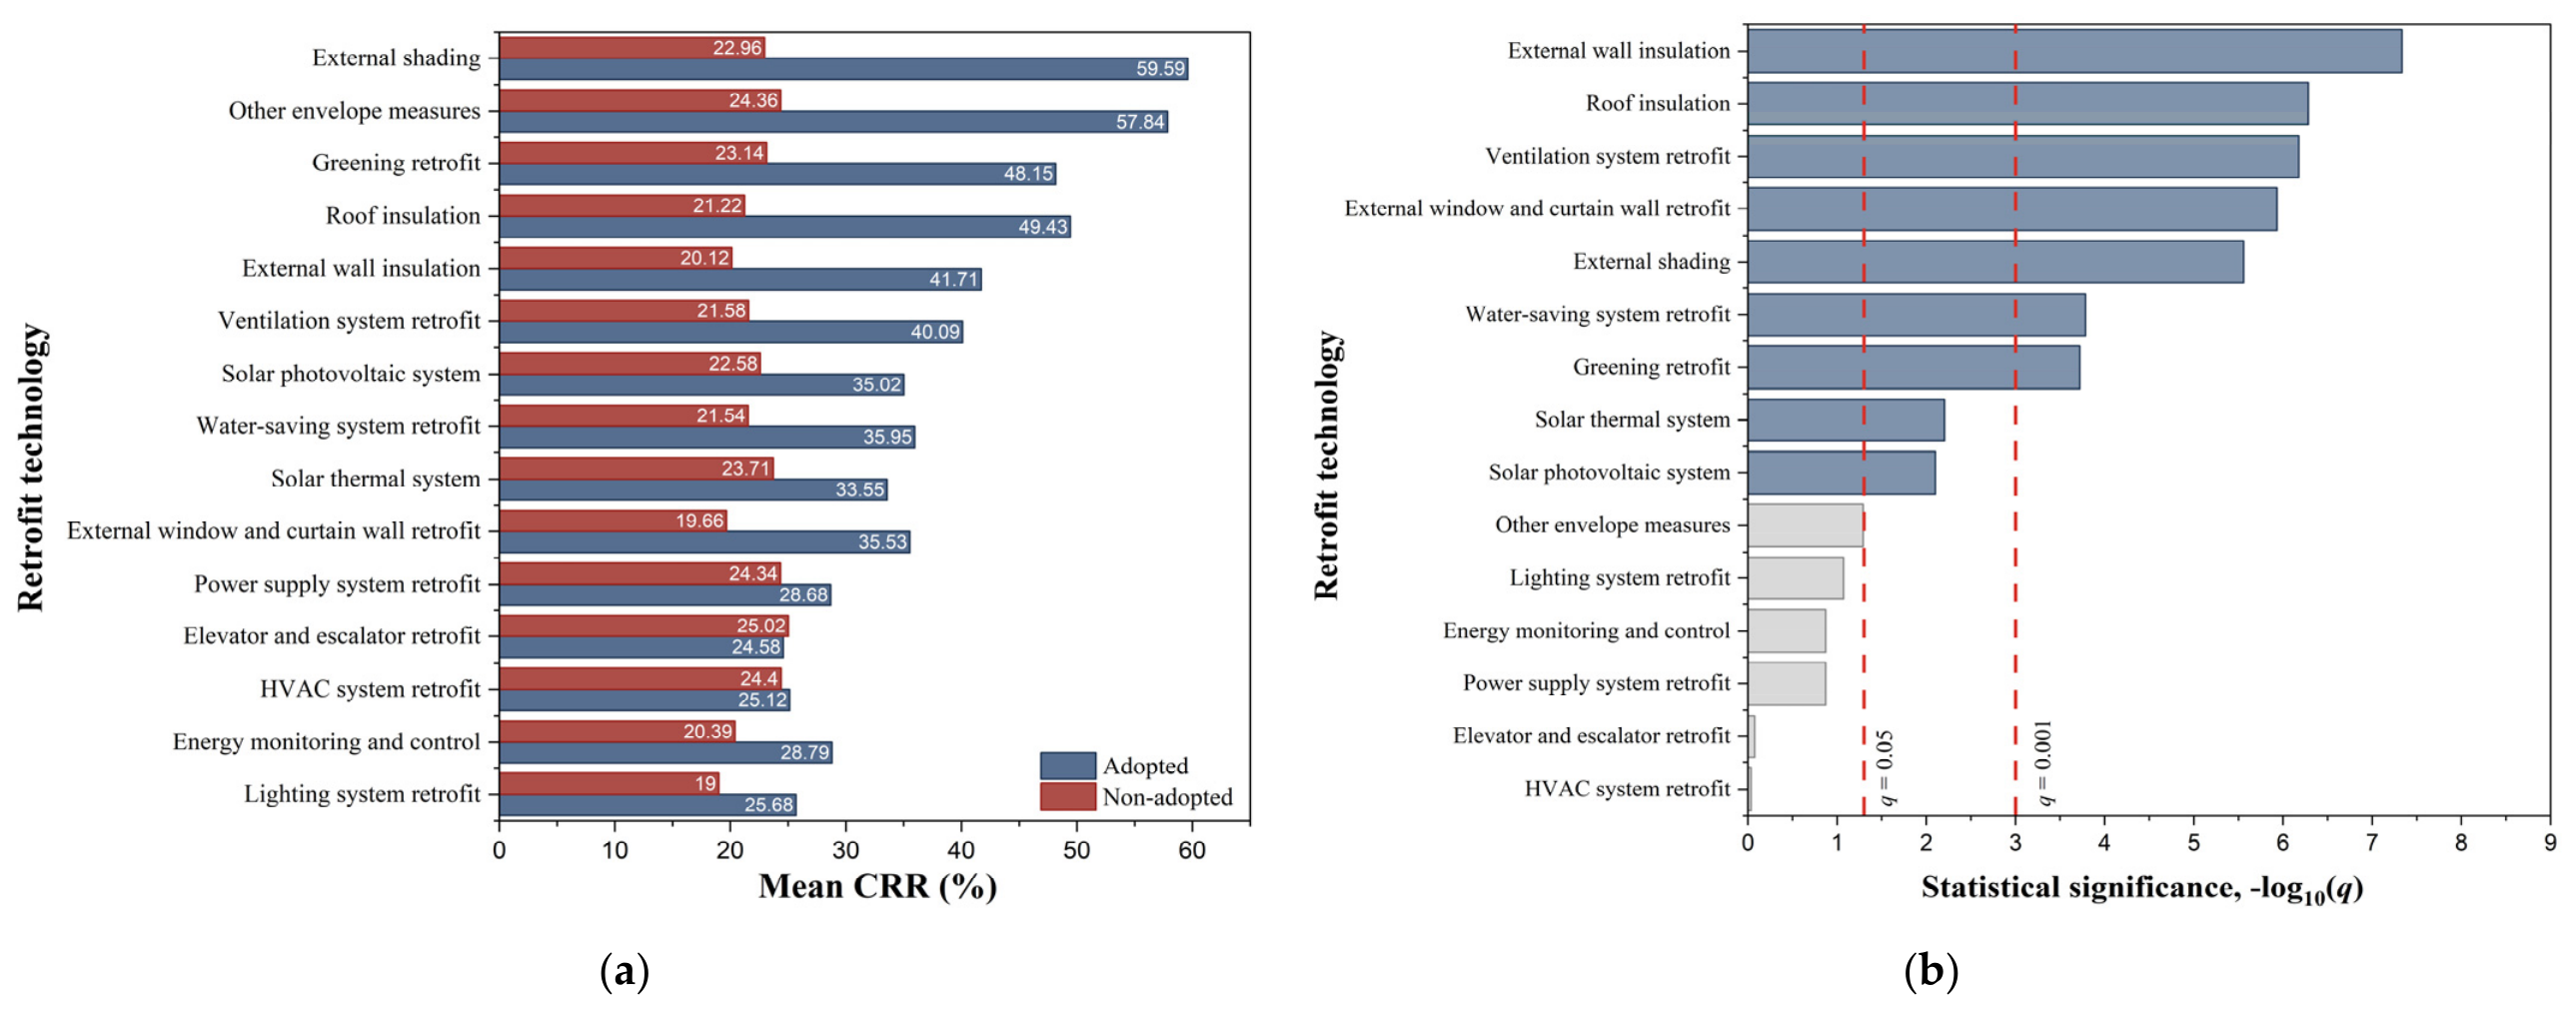
The Mann–Whitney U test was used to compare the CRR distributions between the adoption and non-adoption groups for each retrofit technology. As shown in Figure 4b, nine of the 15 technologies showed statistically significant differences after Benjamini–Hochberg FDR correction (q < 0.05). Seven technologies reached a higher significance level of q < 0.001: external wall insulation, roof insulation, ventilation system retrofit, external window and curtain wall retrofit, external shading, water-saving system retrofit, and greening retrofit.
Figure 4.
(a) Comparison of mean CRR between adoption and non-adoption groups for each retrofit technology; (b) statistical significance of the Mann–Whitney U tests after Benjamini–Hochberg FDR correction, expressed as −log10(q). The dashed lines indicate q = 0.05 and q = 0.001.
Figure 4a compares the mean CRR between the adoption and non-adoption groups. Several envelope-related technologies showed particularly large differences. Projects adopting external wall insulation had a mean CRR of 41.7%, compared with 20.1% for projects without this measure. Roof insulation showed a larger difference, with a mean CRR of 49.4% in the adoption group and 21.2% in the non-adoption group. External shading had the highest mean CRR among all adoption groups, reaching 59.6%, compared with 23.0% for projects without external shading. Other envelope-related measures did not remain statistically significant after FDR correction (q = 0.051) and were represented by only four adoption cases.
Some system-related and renewable-energy-related technologies also showed significant differences. Projects adopting ventilation system retrofit had a mean CRR of 40.1%, compared with 21.6% for projects without this measure. Water-saving system retrofit was associated with a higher mean CRR, with 36.0% in the adoption group and 21.5% in the non-adoption group. Solar photovoltaic and solar thermal systems also remained significant after FDR correction (q < 0.05), with mean CRR values of 35.0% and 33.6% in their adoption groups, respectively.
By contrast, lighting system retrofit, HVAC system retrofit, energy consumption monitoring and intelligent control, power supply and distribution system retrofit, and elevator and escalator retrofit did not show statistically significant differences in CRR between the adoption and non-adoption groups. For lighting and HVAC system retrofits, this may be partly related to their high adoption rates, which reduced the contrast between the two groups. These measures may therefore represent commonly implemented baseline retrofit measures rather than differentiating factors for high carbon reduction performance.
Overall, the Mann–Whitney U test identified significant associations between CRR and several envelope, ventilation, water-saving, renewable-energy, and greening measures after correction for multiple comparisons. However, these results represent univariate associations rather than independent technology effects because actual retrofit projects often adopted multiple technologies simultaneously. Further multivariate analysis was therefore conducted using the XGBoost–SHAP approach.
3.3. XGBoost–SHAP Analysis Results
The predictive XGBoost model included the 15 technology-adoption variables, the total number of adopted technologies, construction year, log-transformed floor area, building type, and project location. The total number of adopted technologies was included to represent the overall breadth of each retrofit project. Across five repeated 5-fold cross-validations, the model achieved a mean R2 of 0.417 and a mean RMSE of 0.127, indicating moderate predictive performance for a heterogeneous dataset of completed retrofit projects.
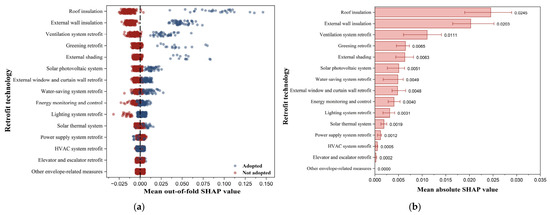
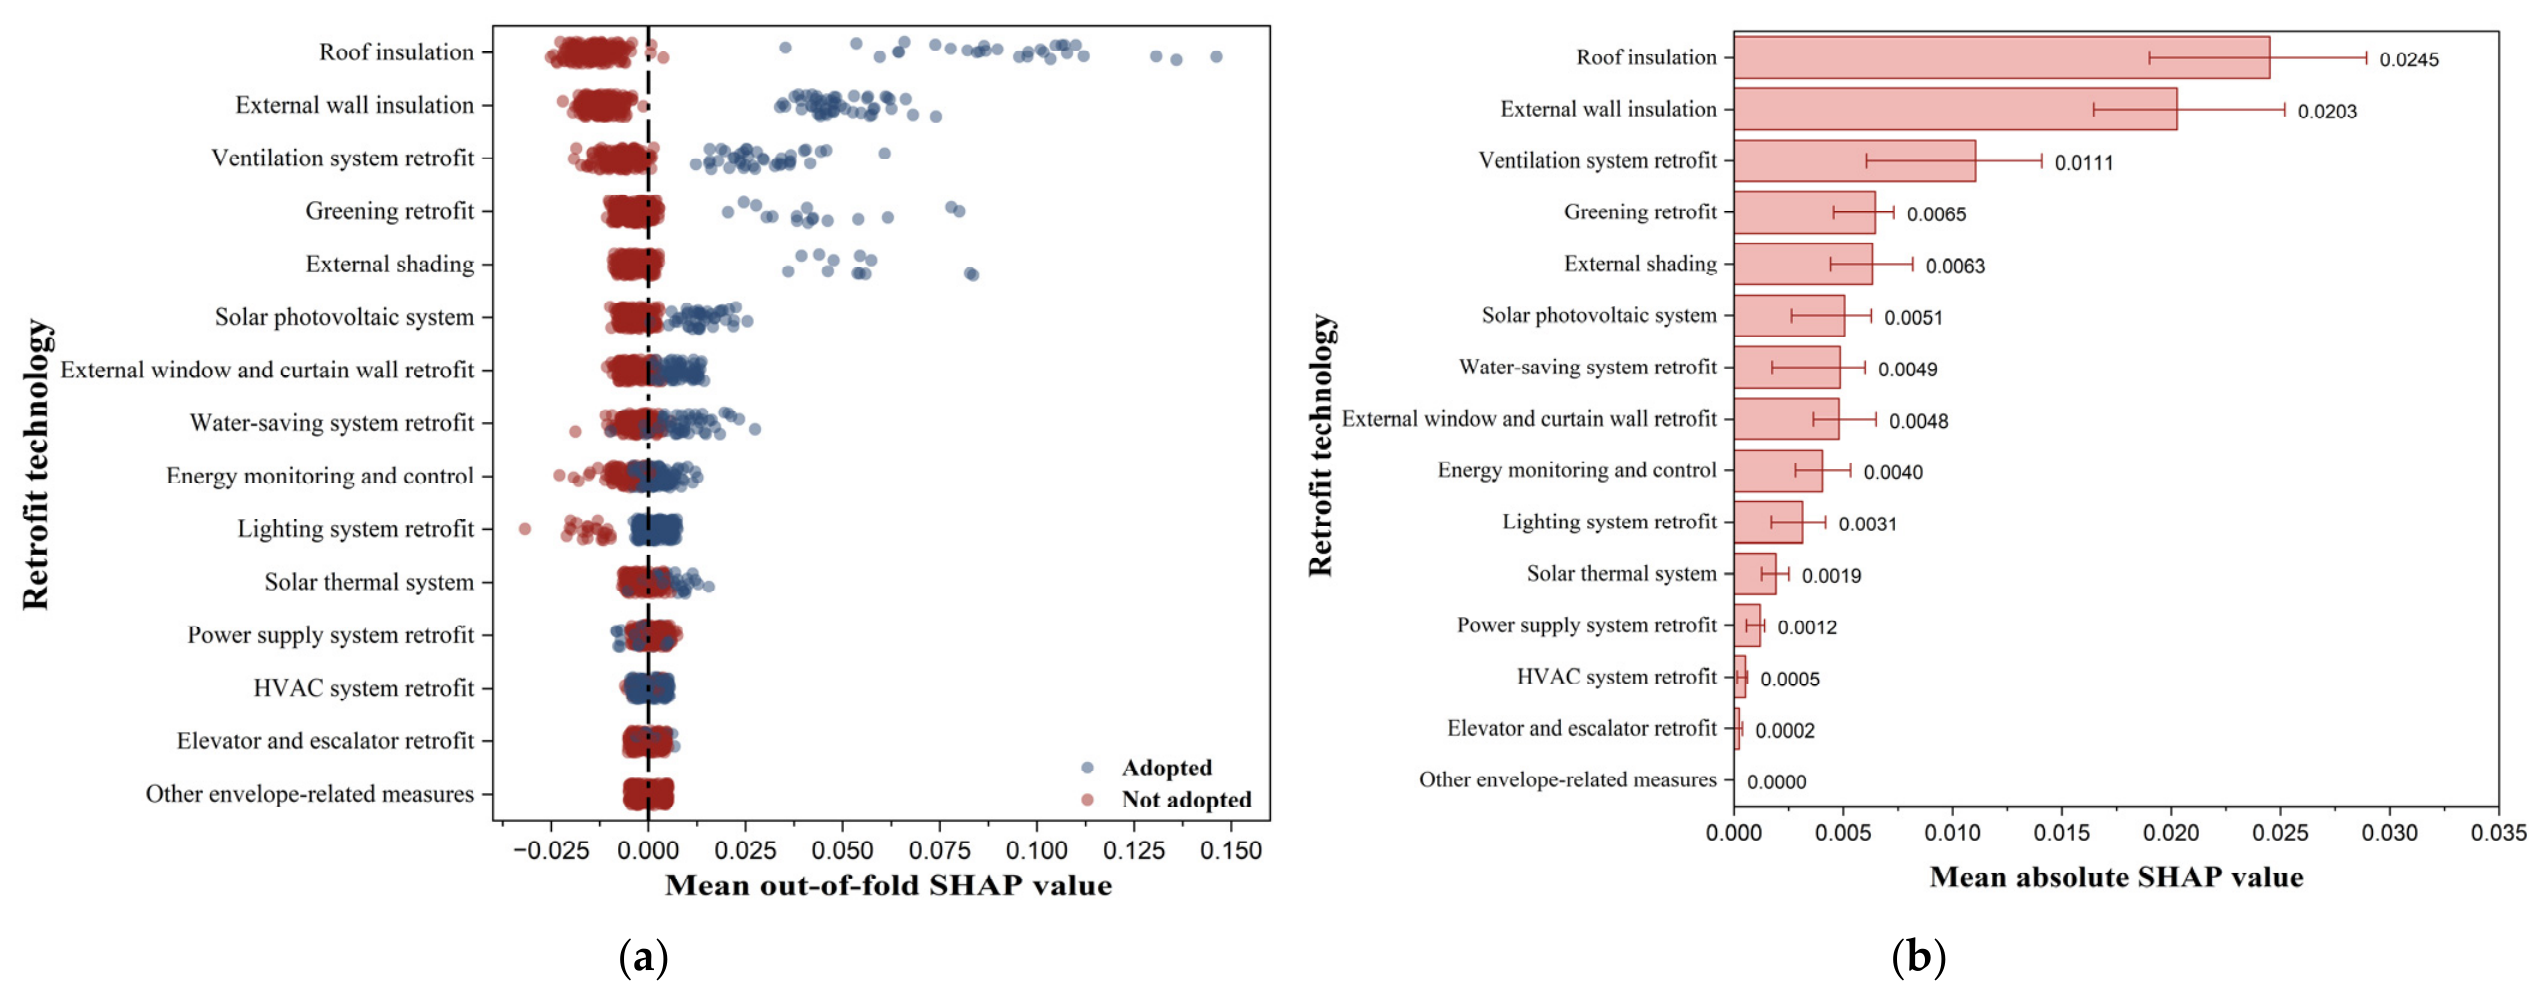
For technology-level SHAP interpretation, the total number of adopted technologies was excluded because it was directly derived from the 15 technology indicators and could redistribute their individual contributions. Figure 5a shows the distribution and direction of SHAP values for the 15 retrofit technologies. Roof insulation, external wall insulation, and ventilation system retrofit were generally associated with positive SHAP values, indicating higher predicted CRR after accounting for the available project characteristics. Greening retrofit, solar photovoltaic systems, and external shading also showed positive contributions, although their distributions were more variable. The external shading result should be interpreted cautiously because only 12 projects adopted this measure.
Figure 5.
(a) Distribution and direction of out-of-fold SHAP values for the 15 retrofit technologies; (b) mean absolute SHAP importance across five repeated 5-fold cross-validations. Error bars in panel (b) represent the interquartile ranges across the 25 validation models.
By contrast, lighting system retrofit, HVAC system retrofit, elevator and escalator retrofit, and other envelope-related measures showed SHAP values concentrated close to zero. These technologies contributed relatively little to distinguishing projects with higher and lower predicted CRR. Lighting and HVAC retrofits were widely adopted, suggesting that they may represent common baseline measures rather than key differentiating factors for higher carbon-reduction performance.
Figure 5b presents the mean absolute SHAP importance of each technology across the 25 validation models, with the error bars representing the interquartile ranges. Roof insulation had the highest mean absolute SHAP value (0.0245), followed by external wall insulation (0.0203) and ventilation system retrofit (0.0111). Greening retrofit (0.0065), external shading (0.0063), and solar photovoltaic systems (0.0051) showed intermediate importance. Water-saving system retrofit, external window and curtain wall retrofit, and energy monitoring and control had smaller contributions, with mean absolute SHAP values of 0.0049, 0.0048, and 0.0040, respectively. HVAC system retrofit, elevator and escalator retrofit, and other envelope-related measures had negligible model-based importance.
Overall, the SHAP results show that adoption frequency did not necessarily correspond to predictive importance. Roof insulation, external wall insulation, and ventilation system retrofit showed the strongest and most consistent contributions to predicted CRR. These results were considered together with the FDR-adjusted Mann–Whitney U tests and adoption sample sizes in the subsequent technology priority classification.
3.4. Integrated Technology Priority Classification
Based on the FDR-adjusted Mann–Whitney U tests and the repeated-validation XGBoost–SHAP analysis, the 15 retrofit technologies were classified into three empirical priority categories: core, supportive, and auxiliary technologies (Table 2). The classification was based on convergent evidence from the FDR-adjusted significance, the magnitude and stability of SHAP importance across the 25 validation models, and the number of adoption cases, rather than on a single numerical threshold.
Table 2.
Integrated priority classification of retrofit technologies.
Core technologies showed statistically significant CRR differences, consistently high SHAP importance, and sufficient adoption cases. Supportive technologies remained significant after FDR correction but showed lower model-based importance, greater variability across validation models, or relatively small adoption samples. Auxiliary technologies did not remain significant after FDR correction and/or showed limited SHAP importance. The resulting categories represent evidence tiers within the present dataset rather than causal effects, cost-effectiveness rankings, or definitive implementation priorities.
Roof insulation, external wall insulation, and ventilation system retrofit were classified as core technologies. All three remained highly significant after FDR correction and showed the highest mean absolute SHAP values across the repeated validation models. They were also represented by 29–49 adoption cases, providing a stronger empirical basis than technologies with very small adoption samples. These results indicate that insulation and ventilation measures were the technologies most consistently associated with higher CRR after adjustment for the available project characteristics.
Greening retrofit, external shading, solar photovoltaic systems, water-saving system retrofit, external window and curtain wall retrofit, and solar thermal systems were classified as supportive technologies. All remained significant after FDR correction, but their evidence was less consistent than that of the core technologies. External shading, for example, showed a pronounced CRR difference and positive SHAP contributions, but it was adopted in only 12 projects and showed greater variability across the validation models. Greening retrofit was similarly based on a relatively small adoption sample. The other supportive technologies showed significant univariate associations but lower model-based importance.
Energy monitoring and control, lighting system retrofit, power supply and distribution system retrofit, HVAC system retrofit, elevator and escalator retrofit, and other envelope-related measures were classified as auxiliary technologies. None remained significant after FDR correction. Energy monitoring and lighting retrofits showed some model-based contribution but did not produce significant CRR differences between the adoption and non-adoption groups. Lighting and HVAC retrofits were also widely adopted, suggesting that they may represent common baseline measures rather than factors that differentiated higher-CRR projects. Other envelope-related measures were adopted in only four projects and narrowly failed to reach the adjusted significance threshold (q = 0.051).
Overall, roof insulation, external wall insulation, and ventilation system retrofit showed the strongest convergence between statistical significance, adoption sample size, and stable model-based importance. Supportive technologies may provide additional benefits under appropriate project conditions, whereas the evidence for auxiliary technologies was comparatively limited. These categories should therefore be interpreted as sample-based evidence tiers and should be combined with project-specific considerations such as cost, technical compatibility, implementation disruption, and remaining equipment service life when informing actual retrofit decisions.
3.5. Collaborative Pathway Analysis
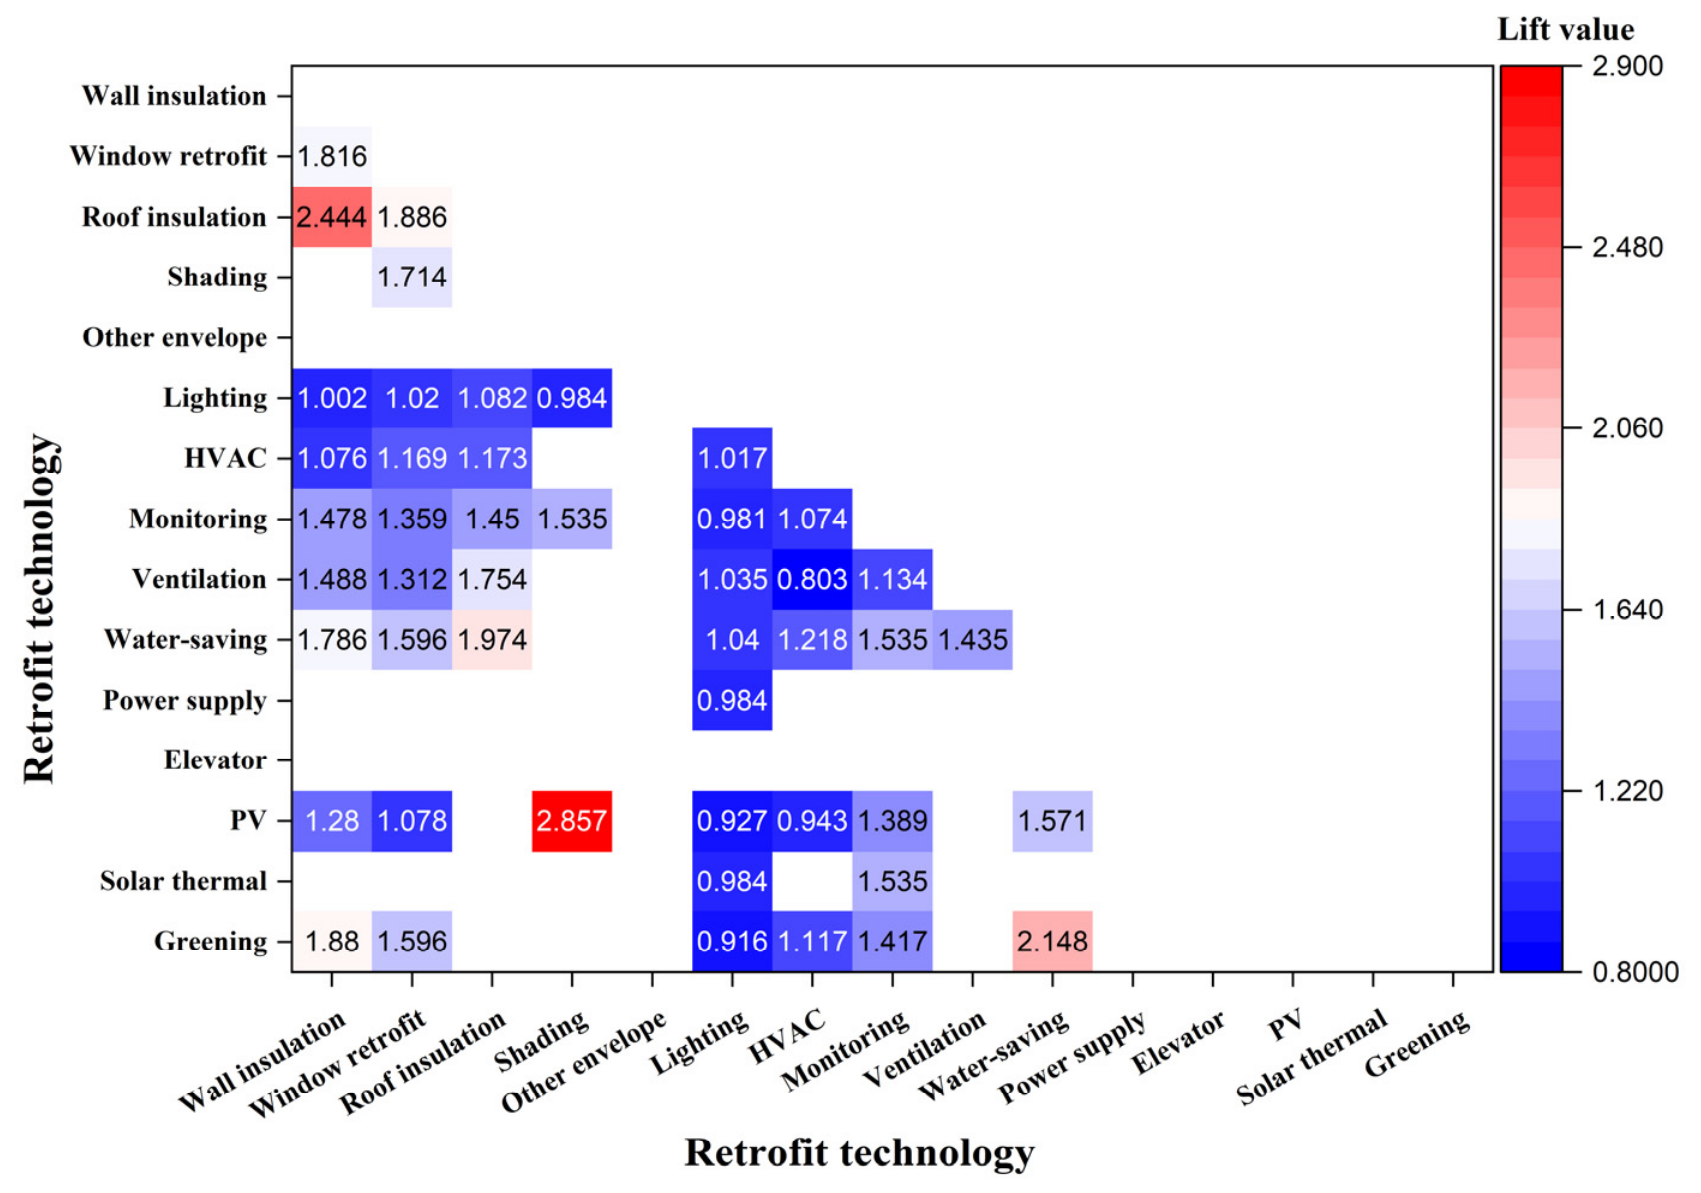
Apriori association-rule mining was applied to the high-performing projects, defined as the top 30% of projects ranked by CRR. This subset included 66 projects with CRR values of 26.28% or higher. The threshold was used as an operational definition of high-performing projects. The analysis aimed to identify technologies that were frequently adopted together within this subset. Figure 6 presents the pairwise lift heatmap, while Table 3 summarises representative directional association rules with support ≥ 0.15, confidence ≥ 0.60, and lift greater than 1.
Figure 6.
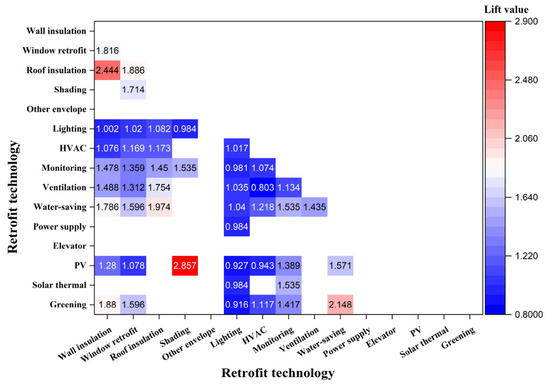
Pairwise lift heatmap of retrofit technologies among high-performing projects. High-performing projects were defined as the top 30% of projects ranked by CRR. The colour scale represents lift values, and only technology pairs with support ≥ 0.15 are shown.
Table 3.
Representative association rules among high-performing retrofit projects.
Figure 6 shows that several frequently adopted system-related combinations, such as lighting system retrofit + HVAC system retrofit, lighting system retrofit + energy monitoring and control, and HVAC system retrofit + energy monitoring and control, had high support values but lift values close to 1. This indicates that their co-occurrence was mainly related to their high overall adoption rates rather than a strong association beyond statistical independence. By contrast, stronger lift values were observed for several envelope and renewable-energy combinations. External shading and solar photovoltaic systems showed the highest lift value of 2.857, followed by roof insulation + external wall insulation with a lift value of 2.444.
As shown in Table 3, the rule “roof insulation → external wall insulation” had a support of 0.273, confidence of 1.000, and lift of 2.444, indicating that all high-performing projects adopting roof insulation also adopted external wall insulation. Roof insulation was also associated with external window and curtain wall retrofit and water-saving system retrofit. In addition, external shading was strongly associated with solar photovoltaic systems, while greening retrofit was associated with water-saving system retrofit. These results indicate that several technology combinations occurred repeatedly among the high-performing projects.
Overall, the association-rule results reveal three recurring co-adoption patterns. The first is an integrated passive-envelope package combining roof insulation, external wall insulation, and external window or curtain wall retrofit. The second is a solar-control and renewable-energy combination linking external shading with photovoltaic systems. The third is an operational-management pattern combining water-saving, greening, photovoltaic, and energy monitoring measures. The arrows in Table 3 indicate conditional associations and should not be interpreted as causal effects, temporal sequences, or implementation order. These technology packages provide a descriptive basis for understanding common retrofit combinations in the HSCW region.
4. Discussion
4.1. Envelope-Centred Decarbonisation Pattern and the Role of Ventilation in the HSCW Region
The results of this study indicate an envelope-centred retrofit pattern, complemented by ventilation improvement, for public buildings in China’s Hot Summer and Cold Winter (HSCW) region. Roof insulation, external wall insulation, and ventilation system retrofit were identified as core technologies because they showed statistically significant CRR differences, consistently high SHAP importance across the repeated validation models, and sufficient adoption samples. This finding is consistent with the climatic characteristics of the HSCW region, where buildings experience both strong cooling demand in summer and heating demand in winter. Under this dual-load condition, the thermal performance of the building envelope directly affects the basic heating and cooling loads and therefore becomes a key prerequisite for achieving effective operational carbon reduction.
The mechanism behind this pattern is relatively clear. Improved roof and wall insulation can reduce heat transfer through the building envelope, while effective ventilation retrofit can reduce cooling demand and improve indoor environmental control when matched with appropriate operating conditions. External shading can also reduce solar heat gain during hot periods, although it was classified as supportive because its result was based on only 12 adoption cases and showed greater variation across the validation models. These measures reduce or manage the underlying thermal load before or during equipment operation. As a result, system-side measures such as HVAC upgrades or operational control may perform more effectively when envelope and ventilation conditions have already been improved.
This finding does not imply that equipment upgrades are unimportant. Lighting and HVAC retrofits were the most widely adopted measures in the sample and may provide reliable operational savings. However, their high adoption rates and relatively limited ability to distinguish higher-CRR projects suggest that they often functioned as standard retrofit measures rather than the main factors associated with deeper carbon reduction. For projects targeting higher CRR, early-stage planning should therefore assess roof and wall thermal performance and ventilation conditions rather than relying solely on equipment replacement.
4.2. Difference Between Univariate Association and Multivariate Importance
The comparison between the FDR-adjusted Mann–Whitney U tests and XGBoost–SHAP analysis highlights the importance of distinguishing univariate association from multivariate model-based contribution. The Mann–Whitney U test identified technologies whose adoption groups had significantly different CRR distributions from non-adoption groups. However, actual retrofit projects usually adopted multiple technologies simultaneously. Under such conditions, the apparent performance difference of one technology may partly reflect its co-adoption with other measures.
The XGBoost–SHAP analysis provided a complementary interpretation by evaluating technology importance under multi-technology adoption conditions while controlling for construction year, floor area, building type, and project location. For example, external window and curtain wall retrofit remained statistically significant after FDR correction but showed lower SHAP importance than roof insulation, external wall insulation, and ventilation system retrofit. This suggests that part of its univariate association may overlap with broader envelope retrofit packages.
External shading also showed a large univariate CRR difference and positive SHAP contributions, but its model-based importance was less stable and the adoption group included only 12 projects. It was therefore classified as supportive rather than core. Conversely, energy monitoring and control showed some model-based contribution but did not remain significant after FDR correction, and was consequently classified as auxiliary.
These findings suggest that statistical significance should not be directly equated with retrofit priority. A technology may show a significant adoption–performance difference but have lower or less stable importance after other variables are considered. Similarly, a frequently adopted technology may be practically necessary but may not strongly differentiate projects with higher and lower CRR. The combined use of FDR-adjusted statistical testing, repeated-validation SHAP analysis, and adoption sample size therefore provides a more balanced basis for classification than any single indicator.
4.3. Collaborative Retrofit Pathways and Practical Implications
The Apriori association-rule mining further shows that high-performing projects were characterised by recurring technology packages rather than isolated technology adoption. The pairwise lift heatmap and association rules identified three main collaborative pathways. The first is an integrated passive-envelope pathway, combining roof insulation, external wall insulation, and external window or curtain wall retrofit. The second is a solar-control and renewable-energy pathway, linking external shading with solar photovoltaic systems. The third is an operational-management pathway, involving water-saving measures, greening retrofit, photovoltaic systems, and energy monitoring.
These pathways should be interpreted as empirical co-adoption patterns rather than causal synergistic effects. A high lift value indicates that two technologies were more likely to be adopted together in high-performing projects than would be expected under statistical independence, but it does not prove that the combination directly caused higher CRR. The directional arrows in the association rules also represent conditional probabilities rather than temporal sequences or recommended implementation order.
From a decision-making perspective, the results suggest that retrofit strategies should move beyond a simple checklist of commonly adopted measures. Roof insulation, external wall insulation, and ventilation system retrofit should receive greater attention when the existing building has poor envelope or ventilation performance. Supportive technologies, including external shading, greening retrofit, solar photovoltaic systems, water-saving system retrofit, external window and curtain wall retrofit, and solar thermal systems, should then be selected according to building function, baseline condition, technical feasibility, and investment constraints.
However, the empirical carbon-reduction priority identified in this study should not be interpreted as an economic or practical implementation ranking. Envelope measures may require substantial capital investment, façade or roof access, waterproofing and fire-safety coordination, and greater disruption to normal building operation. Equipment and control upgrades are generally more modular, easier to phase, and may offer shorter payback periods even when their SHAP importance is lower.
Actual retrofit decisions should therefore combine the evidence presented here with project-specific energy audits, life-cycle cost analysis, remaining equipment service life, technical compatibility, construction disruption, and available investment. Auxiliary technologies may remain necessary for operational improvement, regulatory compliance, or the replacement of ageing equipment, even though they showed limited ability to distinguish higher-CRR projects in this dataset.
4.4. Limitations and Future Research
This study has several limitations. First, the dataset was derived from completed real-world retrofit projects rather than controlled experiments. Therefore, the findings should be interpreted as statistical associations, model-based contributions, and empirical co-adoption patterns, rather than direct causal effects.
Second, the technology variables were coded as binary adoption indicators. This means that the analysis could not capture the intensity, quality, cost, or technical specification of each measure, such as insulation thickness, window thermal performance, HVAC efficiency improvement, photovoltaic capacity, or control-system sophistication.
Third, although construction year, floor area, building type, project location, and the number of adopted technologies were included in the predictive model, its mean cross-validated R2 was 0.417. This moderate value indicates that a substantial proportion of project-level variation remained unexplained. Potentially important factors that were unavailable included baseline energy intensity, exact operating schedules, occupant behaviour, indoor environmental requirements, equipment condition, project investment, execution quality, and post-retrofit operational management.
Fourth, several technologies had relatively small adoption samples. External shading and greening retrofit were adopted in only 12 and 16 projects, respectively, while other envelope-related measures were represented by only four projects. Their statistical and model-based results should therefore be interpreted cautiously, even though repeated cross-validation was used to assess ranking stability.
Future research could extend this framework by incorporating more detailed technology-performance indicators, life-cycle carbon assessment, and cost-effectiveness analysis. Longitudinal monitoring data could also be used to examine whether the identified priority technologies and collaborative pathways produce stable carbon reduction over time. Finally, applying the same framework to other climate zones would help test whether the envelope-dominated pattern observed in the HSCW region is region-specific or generalisable to other public building retrofit contexts.
5. Conclusions
This study proposed an interpretable data-driven framework for prioritising public building retrofit technologies in China’s HSCW region. Based on 218 real-world retrofit projects, CRR was used as the main performance indicator, and 15 retrofit technologies were analysed using FDR-adjusted Mann–Whitney U tests, repeated-validation XGBoost–SHAP analysis, and Apriori association-rule mining.
The predictive XGBoost model, which included technology adoption, retrofit breadth, construction year, floor area, building type, and project location, achieved a mean R2 of 0.417 and a mean RMSE of 0.127 across five repeated 5-fold cross-validations. The results show that carbon-reduction performance varied substantially across projects and that adoption frequency did not necessarily correspond to model-based importance.
Roof insulation, external wall insulation, and ventilation system retrofit were classified as core technologies because they showed highly significant CRR differences, consistently high SHAP importance, and adequate adoption samples. External shading, greening retrofit, solar photovoltaic systems, external window and curtain wall retrofit, water-saving system retrofit, and solar thermal systems were classified as supportive technologies. Energy monitoring and control, lighting system retrofit, HVAC system retrofit, power supply and distribution system retrofit, elevator and escalator retrofit, and other envelope-related measures were classified as auxiliary technologies.
The association-rule analysis further showed that high-performing projects tended to adopt technologies as packages. Three recurring patterns were identified: an integrated passive-envelope package, a solar-control and renewable-energy combination, and an operational-management package. These patterns represent empirical co-adoption relationships rather than causal synergies or prescribed implementation pathways.
Overall, the findings suggest that public building retrofits in the HSCW region should give particular attention to envelope insulation and ventilation performance, while selecting shading, renewable-energy, water-saving, greening, equipment, and control measures according to project conditions. The three priority categories represent sample-based evidence tiers rather than universal investment rankings. Practical decisions should additionally consider cost-effectiveness, technical feasibility, operational disruption, and remaining equipment life.
Author Contributions
Conceptualization, Z.G. and Q.W.; methodology, Z.G. and Q.W.; investigation, Y.Q.; validation, Z.Z.; visualization, C.X. and Y.M.; supervision, S.S.Y.L.; writing—original draft preparation, Z.G. and Y.M.; writing—review and editing, Z.G., Y.Q., C.X., S.S.Y.L., Z.Z., Y.M. and Q.W. All authors have read and agreed to the published version of the manuscript.
Funding
This research received no external funding.
Data Availability Statement
Data will be made available on request.
Conflicts of Interest
Authors Yan Qu and Chan Xia are employed by Arcplus Group PLC and Shanghai Research Institute of Building Sciences Co., Ltd., respectively. The remaining authors declare that the research was conducted in the absence of any commercial or financial relationships that could be construed as a potential conflict of interest.
References
- International Energy Agency. Buildings. Available online: https://www.iea.org/energy-system/buildings (accessed on 23 June 2026).
- UN Environment Programme (UNEP); Global Alliance for Buildings and Construction (GlobalABC). 2024/2025 Global Status Report for Buildings and Construction: Not Just Another Brick in the Wall; United Nations Environment Programme: Nairobi, Kenya, 2025. [Google Scholar]
- Luo, S.-L.; Shi, X.; Yang, F. A review of data-driven methods in building retrofit and performance optimization: From the perspective of carbon emission reductions. Energies 2024, 17, 4641. [Google Scholar] [CrossRef] [Scilit]
- Liu, K.; Tian, J.; Chen, J.; Wen, Y. Low-Carbon retrofitting path of existing public buildings: A comparative study based on green building rating systems. Energies 2022, 15, 8724. [Google Scholar] [CrossRef] [Scilit]
- Hong, L.; Zhou, N.; Feng, W.; Khanna, N.; Fridley, D.; Zhao, Y.; Sandholt, K. Building stock dynamics and its impacts on materials and energy demand in China. Energy Policy 2016, 94, 47–55. [Google Scholar] [CrossRef] [Scilit]
- Cai, W.; Wu, Y.; Zhong, Y.; Ren, H. China building energy consumption: Situation, challenges and corresponding measures. Energy Policy 2009, 37, 2054–2059. [Google Scholar] [CrossRef] [Scilit]
- Building Energy Consumption and Carbon Emission Data Committee. Research Report on Carbon Emissions in Urban and Rural Construction Sector in China (2024 Edition); China Association of Building Energy Efficiency: Beijing, China, 2025. (In Chinese) [Google Scholar]
- Building Energy Conservation Research Center of Tsinghua University. Annual Development Research Report on Building Energy Efficiency in China 2024: Rural Residential Building Special Topic; China Architecture & Building Press: Beijing, China, 2024. (In Chinese) [Google Scholar]
- Hu, S.; Jiang, Y.; Yan, D. China Building Energy Use and Carbon Emission Yearbook 2021; China Architecture & Building Press: Beijing, China, 2021. [Google Scholar]
- Xing, R.; Hanaoka, T.; Masui, T. Deep decarbonization pathways in the building sector: China’s NDC and the Paris agreement. Environ. Res. Lett. 2021, 16, 044054. [Google Scholar] [CrossRef] [Scilit]
- Chen, Y.; Li, M.; Cao, J.; Cheng, S.; Zhang, R. Effect of climate zone change on energy consumption of office and residential buildings in China. Theor. Appl. Climatol. 2021, 144, 353–361. [Google Scholar] [CrossRef] [Scilit]
- Marma-Laetitia, M.; Song, J.; Short, A.C.; Chen, S.; Wu, J.; Yang, W.; Xu, J.; Zhao, Q.; Ge, J.; Liu, M. The hot summer-cold winter region in China: Challenges in the low carbon adaptation of residential slab buildings to enhance comfort. Energy Build. 2020, 223, 110181. [Google Scholar] [CrossRef] [Scilit]
- Ge, J.; Li, S.; Chen, S.; Wang, X.; Jiang, Z.; Shen, C. Energy-efficiency strategies of residential envelope in China’s Hot Summer–Cold Winter Zone based on intermittent thermal regulation behaviour. J. Build. Eng. 2021, 44, 103028. [Google Scholar] [CrossRef] [Scilit]
- Liu, C.; Ma, W.; Hao, J.; Luo, D.; Zuo, J.; Zhang, C. Energy retrofitting assessment of public building envelopes in China’s hot summer and cold winter climate region. Buildings 2022, 12, 1866. [Google Scholar] [CrossRef] [Scilit]
- Miao, Y.; Ye, T.; Xiao, J.; Lau, S.S.Y.; Zhou, Z. Investigation on alkali-activated insulation mortar containing high-volume recycled concrete powder for energy-efficient buildings. Energy Build. 2024, 303, 113825. [Google Scholar] [CrossRef] [Scilit]
- Liu, C.; Sharples, S.; Mohammadpourkarbasi, H. Evaluating insulation, glazing and airtightness options for Passivhaus EnerPHit retrofitting of a dwelling in China’s hot summer–cold winter climate region. Energies 2021, 14, 6950. [Google Scholar] [CrossRef] [Scilit]
- Chow, D.H.C.; Li, Z.; Darkwa, J. The effectiveness of retrofitting existing public buildings in face of future climate change in the hot summer cold winter region of China. Energy Build. 2013, 57, 176–186. [Google Scholar] [CrossRef] [Scilit]
- Kozlovska, M.; Petkanic, S.; Vranay, F.; Vranay, D. Enhancing energy efficiency and building performance through BEMS-BIM integration. Energies 2023, 16, 6327. [Google Scholar] [CrossRef] [Scilit]
- Amjath, M.; Chandanie, H.; Amarasinghe, S. Energy retrofits for improving energy efficiency in buildings: A review of HVAC and lighting systems. In Proceedings of the World Construction Symposium; University of Moratuwa: Colombo, Sri Lanka, 2021. [Google Scholar]
- Miao, Y.; Liu, P.; Fu, I.C.S.; Lei, Q.; Lau, S.S.Y.; Tao, Y. The study of architectural geometry and shape in the energy balance of glazed roofs. Buildings 2022, 12, 1550. [Google Scholar] [CrossRef] [Scilit]
- Giovanardi, A.; Passera, A.; Zottele, F.; Lollini, R. Integrated solar thermal façade system for building retrofit. Sol. Energy 2015, 122, 1100–1116. [Google Scholar] [CrossRef] [Scilit]
- Pan, Y.; Zhu, M.; Lv, Y.; Yang, Y.; Liang, Y.; Yin, R.; Yang, Y.; Jia, X.; Wang, X.; Zeng, F. Building energy simulation and its application for building performance optimization: A review of methods, tools, and case studies. Adv. Appl. Energy 2023, 10, 100135. [Google Scholar] [CrossRef] [Scilit]
- Foucquier, A.; Robert, S.; Suard, F.; Stéphan, L.; Jay, A. State of the art in building modelling and energy performances prediction: A review. Renew. Sustain. Energy Rev. 2013, 23, 272–288. [Google Scholar] [CrossRef] [Scilit]
- Ma, Z.; Cooper, P.; Daly, D.; Ledo, L. Existing building retrofits: Methodology and state-of-the-art. Energy Build. 2012, 55, 889–902. [Google Scholar] [CrossRef] [Scilit]
- Ruparathna, R.; Hewage, K.; Sadiq, R. Improving the energy efficiency of the existing building stock: A critical review of commercial and institutional buildings. Renew. Sustain. Energy Rev. 2016, 53, 1032–1045. [Google Scholar] [CrossRef] [Scilit]
- Cabeza, L.F.; Rincón, L.; Vilariño, V.; Pérez, G.; Castell, A. Life cycle assessment (LCA) and life cycle energy analysis (LCEA) of buildings and the building sector: A review. Renew. Sustain. Energy Rev. 2014, 29, 394–416. [Google Scholar] [CrossRef] [Scilit]
- Mazur, Ł.; Olenchuk, A. Life cycle assessment and building information modeling integrated approach: Carbon footprint of masonry and timber-frame constructions in Single-Family houses. Sustainability 2023, 15, 15486. [Google Scholar] [CrossRef] [Scilit]
- Wang, G.; Luo, T.; Luo, H.; Liu, R.; Liu, Y.; Liu, Z. A comprehensive review of building lifecycle carbon emissions and reduction approaches. City Built Environ. 2024, 2, 12. [Google Scholar] [CrossRef] [Scilit]
- Fenner, A.E.; Kibert, C.J.; Woo, J.; Morque, S.; Razkenari, M.; Hakim, H.; Lu, X. The carbon footprint of buildings: A review of methodologies and applications. Renew. Sustain. Energy Rev. 2018, 94, 1142–1152. [Google Scholar] [CrossRef] [Scilit]
- Papangelopoulou, M.D.; Alexakis, K.; Askounis, D. Assessment methods for building energy retrofits with emphasis on financial evaluation: A systematic literature review. Buildings 2025, 15, 2562. [Google Scholar] [CrossRef] [Scilit]
- Meng, Q.; Hu, L.; Li, M.; Qi, X. Assessing the environmental impact of building life cycle: A carbon reduction strategy through innovative design, intelligent construction, and secondary utilization. Dev. Built Environ. 2023, 16, 100230. [Google Scholar] [CrossRef] [Scilit]
- He, Q.; Hossain, M.U.; Ng, S.T.; Skitmore, M.; Augenbroe, G. A cost-effective building retrofit decision-making model–Example of China’s temperate and mixed climate zones. J. Clean. Prod. 2021, 280, 124370. [Google Scholar] [CrossRef] [Scilit]
- Liu, C.; Sharples, S.; Mohammadpourkarbasi, H. A review of building energy retrofit measures, passive design strategies and building regulation for the low carbon development of existing dwellings in the hot summer–cold winter region of China. Energies 2023, 16, 4115. [Google Scholar] [CrossRef] [Scilit]
- Efficiency Valuation Organization. International Performance Measurement and Verification Protocol (IPMVP): Core Concepts; Efficiency Valuation Organization: Washington, DC, USA, 2022. [Google Scholar]
- Mann, H.B.; Whitney, D.R. On a test of whether one of two random variables is stochastically larger than the other. Ann. Math. Stat. 1947, 18, 50–60. [Google Scholar] [CrossRef] [Scilit]
- Benjamini, Y.; Hochberg, Y. Controlling the false discovery rate: A practical and powerful approach to multiple testing. J. R. Stat. Soc. Ser. B 1995, 57, 289–300. [Google Scholar] [CrossRef] [Scilit]
- Chen, T.; Guestrin, C. Xgboost: A scalable tree boosting system. In Proceedings of the 22nd Acm Sigkdd International Conference on Knowledge Discovery and Data Mining; ACM: New York, NY, USA, 2016; pp. 785–794. [Google Scholar]
- Lundberg, S.M.; Lee, S.-I. A unified approach to interpreting model predictions. Adv. Neural Inf. Process. Syst. 2017, 30, 4765–4777. [Google Scholar]
- Huang, L.; Chen, H.; Wang, X.; Chen, G. A fast algorithm for mining association rules. J. Comput. Sci. Technol. 2000, 15, 619–624. [Google Scholar] [CrossRef] [Scilit]

Disclaimer/Publisher’s Note: The statements, opinions and data contained in all publications are solely those of the individual author(s) and contributor(s) and not of MDPI and/or the editor(s). MDPI and/or the editor(s) disclaim responsibility for any injury to people or property resulting from any ideas, methods, instructions or products referred to in the content. |
© 2026 by the authors. Licensee MDPI, Basel, Switzerland. This article is an open access article distributed under the terms and conditions of the Creative Commons Attribution (CC BY) license.