


Abstract
This paper examines the competitive ranges of timber, steel, and reinforced concrete beams, determined using multi-parameter cost optimization that includes global warming costs (CO2 emissions) associated with beam production. Simply supported beams subjected to self-weight and uniform imposed loads were optimized using discrete mixed-integer non-linear programming (MINLP). The objective functions included material, energy, labor, and CO2 emission costs associated only with manufacturing. Concrete remains the most cost-effective material across nearly all configurations, with glulam and steel being 2.3 and 2.8 times more expensive, respectively. Sawn timber outperforms concrete (by 9.5%) only at short spans (7.5 m) and low loads (10 kN/m1). Environmentally, timber yields the lowest manufacturing footprint, while steel and concrete emit 3.0 and 1.8 times more CO2 than glulam. Currently, CO2 emission costs average just 3.8% of total costs. However, a sensitivity analysis shows that extreme carbon taxes break concrete’s monopoly, increasing its costs by up to 637.4% and making timber the cheapest option for low-to-medium loads. Concrete is resilient to material price shocks at larger scales but highly vulnerable to rising labor rates (up to a 66.3% increase). While current carbon pricing is too low to influence material selection, future substantial tax escalations will shift structural competitiveness toward timber.
1. Introduction
Due to its significant environmental impact, the construction industry is a key sector for achieving sustainable development goals. In response to increasing sustainability requirements and stricter environmental regulations, research in this area has focused on developing sustainable construction practices. These efforts aim to reduce resource and energy consumption, improve production efficiency, and mitigate environmental impacts, particularly carbon emissions.
Several studies have addressed beam optimization from different material-specific perspectives. Surit and Wethyavivorn [1] applied topology optimization to reinforced concrete beams to obtain an efficient distribution of concrete and reinforcement. Mela and Heinisuo [2] optimized welded high-strength steel I-beams for weight and cost according to Eurocode 3, while Bru et al. [3] used a genetic algorithm for the optimum design of CFRP and GFRP reinforcement of timber beams. Mayencourt et al. [4] investigated computational shape optimization and digital fabrication of solid timber beams with the aim of reducing material use. Markandeya Raju et al. [5] minimized the cost of singly reinforced concrete beams using the Generalized Reduced Gradient method, and Mohammedali et al. [6] optimized variable-depth steel I-beams to reduce structural volume. Fiorotti et al. [7] used a genetic algorithm to minimize either financial cost or CO2 emissions of externally pre-tensioned steel beams. More recently, Izhar et al. [8] proposed a constructability-aware multi-objective optimization of reinforced concrete beams considering weight, cost, and embodied carbon, while Szeptyński et al. [9] optimized reinforced concrete and glue-laminated timber beams using a control-theory-based approach. So et al. [10] combined cost-optimized data generated by the crow search algorithm with an artificial neural network for automated reinforced concrete beam design, and de Castro et al. [11] investigated the optimization of reinforced concrete beams with UHPFRC with a focus on reducing CO2 emissions.
Recent studies further indicate that beam research is increasingly focused on sustainability, advanced materials, strengthening techniques, and service-life assessment. For example, Keintjem et al. [12] compared ASD and LRFD design approaches for steel I-beams and highlighted the importance of serviceability constraints. Yang et al. [13] experimentally strengthened steel I-section beams using wire arc additive manufacturing. Zhang et al. [14] investigated the torsional behavior of UHPFRC beams and proposed design recommendations. Galano et al. [15] studied NSM-CFRP strengthening of post-tensioned concrete bridge girders, Taher et al. [16] compared CFRP and shape-memory-alloy strengthening of reinforced concrete beams using an equivalent-stiffness framework, and Datsiuk et al. [17] experimentally assessed the residual capacity of timber beams after long-term service. Additionally, structural optimization has been explored across various domains: Sapkota et al. [18] integrated machine learning into optimization, Radgolchin and Awtar [19] focused on optimizing bearing characteristics, and Luo et al. [20] investigated high-frequency fatigue resistance within optimized designs.
Although researchers/engineers have carried out many optimizations of beams made of a single building material (or reinforced concrete, timber or steel), few papers have been published showing researchers optimizing beams made of different building materials, where the results obtained between beams made of different materials have been compared and where some sustainability challenges have also been addressed. Merta et al. [21] optimized and compared reinforced concrete and double symmetrically welded steel I-beams. The optimization was performed using non-linear programming (NLP) for spans between 5 and 30 m and for a uniformly variable imposed load of 5 kN/m1. Eurocodes 2 and 3 were used. Hassan and Johansson [22] compared glulam and steel beams in terms of structural design, manufacturing, erection costs and greenhouse gas emissions. The study was evaluated by a structural analysis (without optimization) considering Eurocodes 3 and 5 including lateral–torsional buckling strength. Six different spans from 2 to 12 m (2 m step) were analyzed, for which six different standard HEA steel sections and six different glulam cross-sections were defined. The structures represent roof beams loaded with a snow load of 25.92 kN/m1 (in Sweden) and a self-weight of the roof slab of 2.4 kN/m1. Ozimboski et al. [23] presented a study on the optimized design of reinforced concrete and steel beams considering cost as an objective function. Simulated annealing was used for the optimization. In their comparative study, they defined spans of up to 25 m (1 m step), a dead load of 16 kN/m1 and a live load of 7 kN/m1. Brazilian codes were considered for dimensioning. Kripka et al. [24] applied multi-criteria decision-making methods (DMM) to optimize reinforced concrete, steel and timber (glulam) beams in order to choose the best material. They minimized the production cost of beams and the environmental impacts separately. Two different spans of 4 m and 8 m as well as a 13 kN/m1 permanent load and 4.5 kN/m1 live load were considered. Brazilian standards were used for the dimensioning. Bahrami and Azizian [25] dealt with glulam and reinforced concrete beams in a multi-storey building in Gävle, Sweden. The research method involved the use of StruSoft FEM design software for modeling, analysis and design (no optimization). Reinforced concrete and timber beams were compared. Oh et al. [26] presented a study in which the environmental impacts of timber, concrete and steel as building materials were evaluated and compared. To achieve an optimal design, all beams were designed with the lowest component weight in each condition. The spans of the beams ranged from 3 to 8 m, and the live load ranged from 2 to 6 kN/m2. Korean design standards and the allowable strength design method (ASD—structural analysis) were used (no optimization). Bogataj et al. [27], Žula and Kravanja [28] and Žula et al. [29] calculated the sustainable profit generated by optimizing the simply supported, continuous and cantilever beams. Mixed-integer non-linear programming optimization was applied. Three different construction materials, timber, steel and reinforced concrete, were investigated for the defined span and uniform load. Simple cost objective functions were defined. The results were compared to identify the most suitable material. Eurocode standards were used.
Overall, the reviewed literature shows significant progress in beam optimization, sustainable design, and strengthening technologies. However, most studies focus on a single material, one structural system, or a limited set of objectives. Systematic multi-parameter comparisons of timber, steel, and reinforced concrete beams over practical ranges of spans and loads, considering standard dimensions, material grades, production costs, and CO2 emission costs within a unified optimization framework, remain limited. The present study addresses this gap by identifying the competitive ranges of sawn timber, glulam, steel, and reinforced concrete beams using discrete MINLP-based optimization.
This paper examines competitive ranges of timber, steel, and reinforced concrete beams, determined using multi-parameter cost optimization that includes global warming costs (CO2 emissions) generated during beam production. The consideration of the carbon footprint in structural design and optimization is increasingly important due to the rising cost of CO2 emissions. Despite their simplicity, beams are among the most widely used structural elements in construction. Analyzing their production costs in relation to CO2 emissions provides valuable insights for the construction industry. The results of this study have practical implications for engineering design and decision-making.
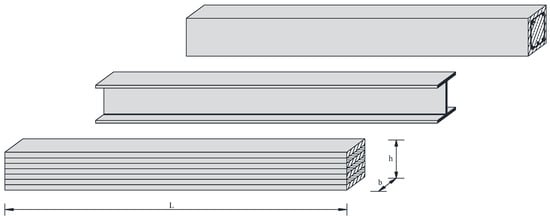
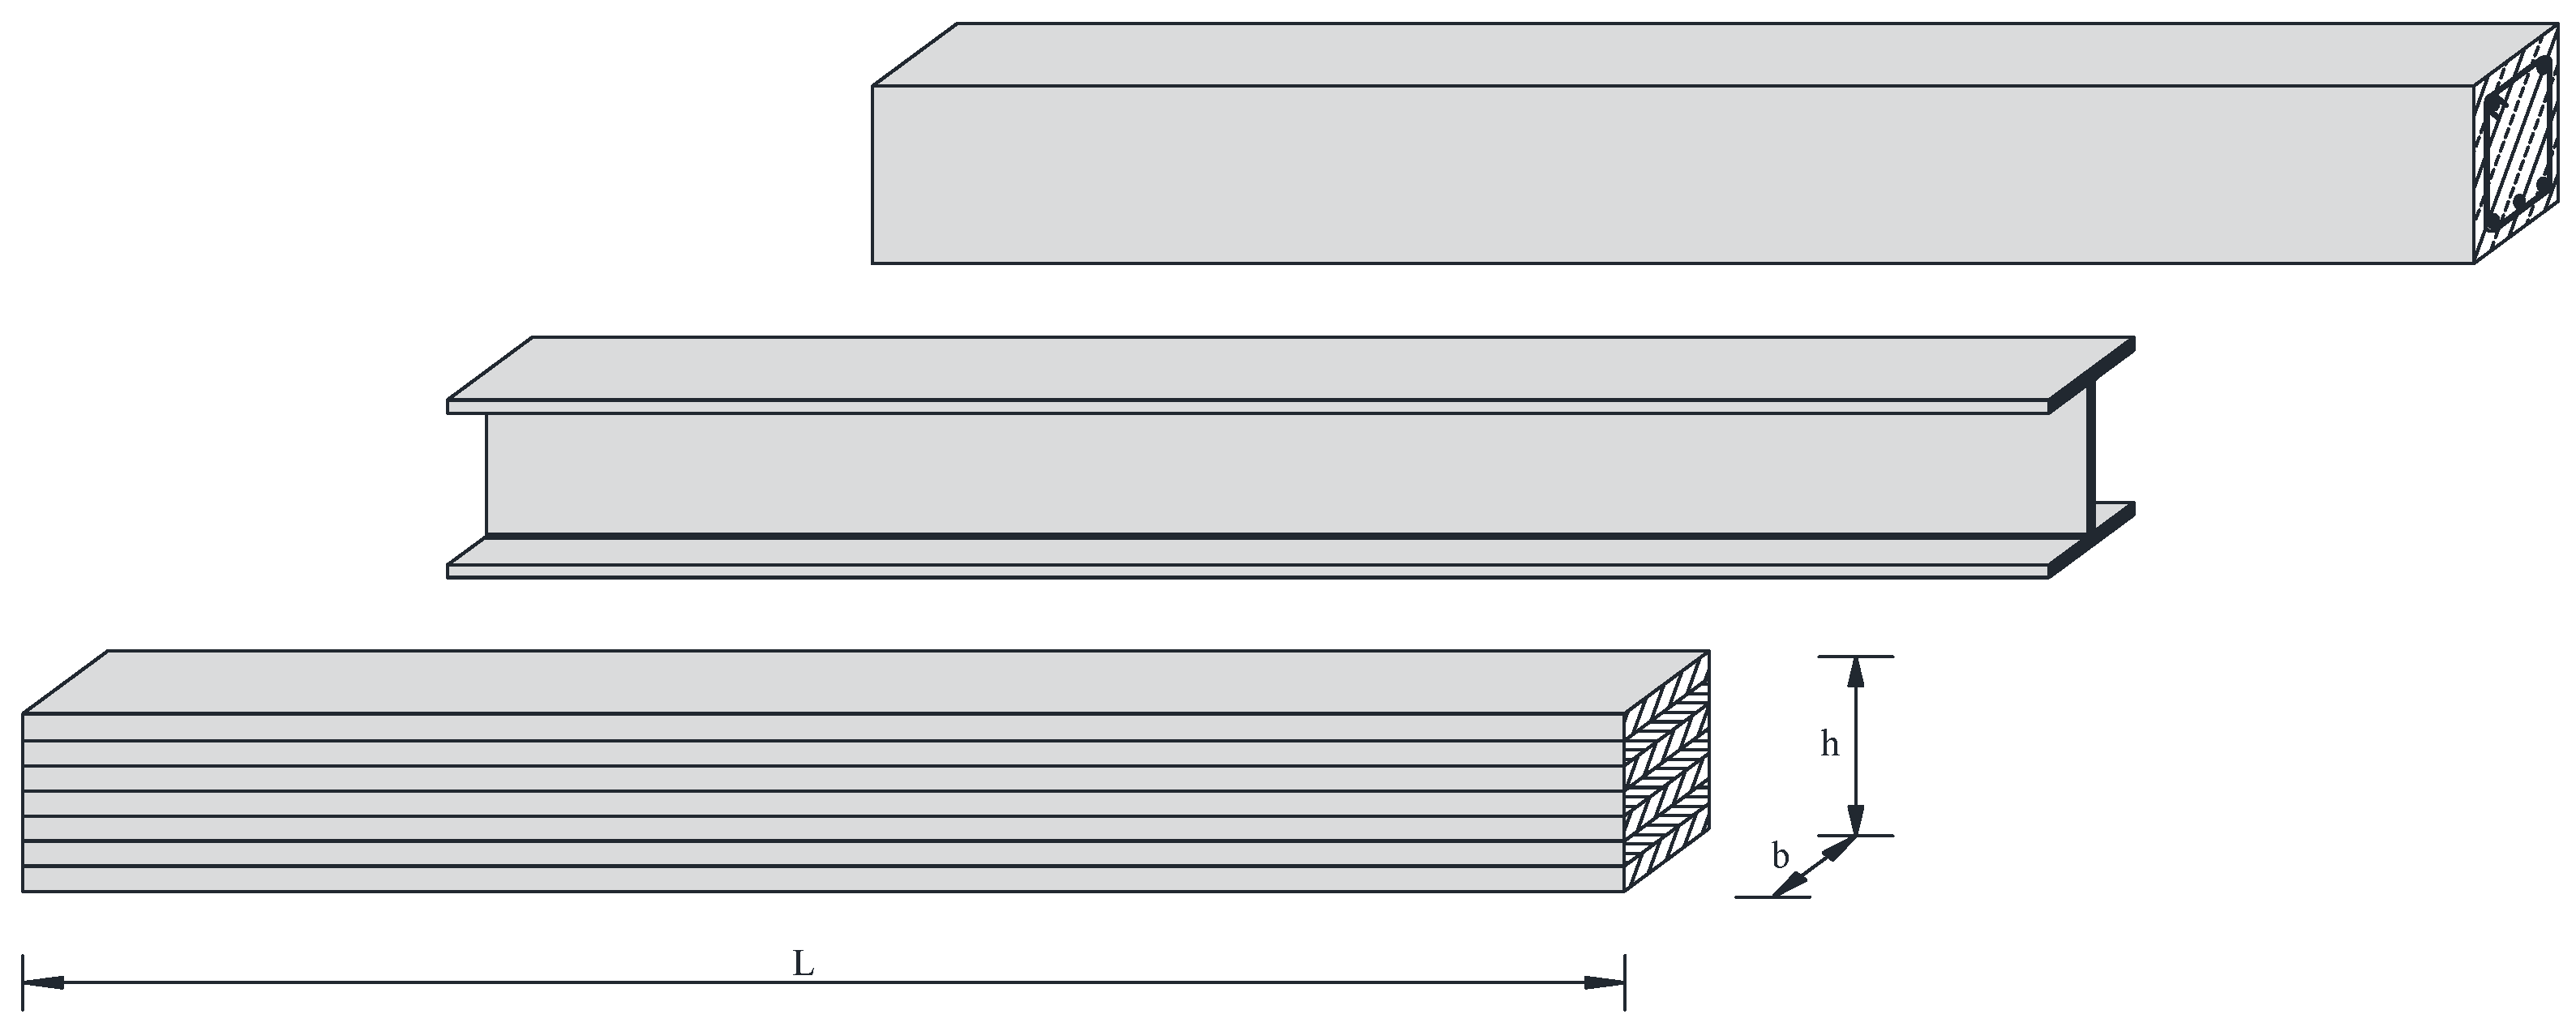
Structural optimization is used here instead of conventional structural analysis. By ensuring full utilization of beam cross-sections during optimization, the accuracy of comparisons between beams made from different materials is improved. The optimization is performed for the most commonly used rectangular cross-sections of timber and concrete beams, as well as welded steel I-sections (see Figure 1). Both sawn timber and glued laminated timber are included. Due to the rectangular cross-sections considered, only beam spans up to 15 m are analyzed. Mixed-integer non-linear programming (MINLP) is employed for discrete optimization, allowing the selection of standard/discrete dimensions and material grades. This approach yields realistic structural solutions.
Figure 1.
Timber, steel and reinforced concrete beams.
Although several studies have addressed the cost-effective use of timber, steel, and concrete beams and their associated CO2 emissions, the optimal application ranges of these materials in practice—even when accounting for CO2 emission costs—have not yet been fully determined. In this context, the multi-parameter comparative study presented in this paper builds on and extends three previous works [27,28,29], which considered only specific spans and load cases. Here, a series of MINLP optimizations were carried out for different building materials, spans, loads, material grades and discrete sizes. For this purpose, various building materials and grades (sawn timber, glulam timber, steel, and reinforced concrete), spans from 2.5 to 15 m, uniform loads from 5 to 50 kN/m1, and more than 2700 different discrete size alternatives were defined. These parameters were selected to cover the range of practical applications in which these beam types are typically employed.
The task of the multi-parameter optimization was to identify the best competitive beam materials for different spans and loads in terms of self-manufacturing costs and CO2 emissions. For this purpose, three separate optimization models for the cost optimization of timber, steel and reinforced concrete beams were developed. Three different accurate objective functions were defined and provided with equality and inequality constraints. The objective functions include the self-manufacturing material, energy and labor costs of the structures, as well as the costs of CO2 emissions incurred during the production of beams. The models’ constraints include equations for the calculation of internal forces, stresses and deflections as well as constraints for the dimensioning according to the Eurocode standards.
Although beams are among the simplest structural elements in construction, seven fundamental questions about optimal design can still be raised, particularly when different construction materials, CO2 emissions, spans, and loads are considered:
- What are the optimal production plus CO2 emission costs of timber, steel, and reinforced concrete beams?
- For which ranges of spans and loads does each material (timber, steel and concrete) offer the most cost-competitive design?
- How much CO2 is emitted during the manufacture of beams?
- Which material is the best and which is the worst in terms of CO2 emissions?
- What proportion of total beam costs arises from CO2 emissions incurred during production?
- How do fluctuations in material unit prices and labor rates affect the total costs and the economic resilience of each beam type?
- At what carbon tax escalation thresholds do material crossovers occur for the most and least cost-competitive beam designs?
To answer the above questions, a multi-parameter MINLP cost optimization was performed. The outer-approximation and equality-relaxation (OA/ER) algorithm [30,31,32] was used. In addition, a multi-parameter sensitivity analysis was conducted to answer the last two equations.
2. Materials and Methods
2.1. Assumptions and Limitations
The following assumptions and limitations were taken into account in the study:
- Simply supported beams subjected to self-weight plus a uniform-imposed load are considered;
- Three different construction material variants are used: (sawn and glued laminated) timber, structural steel and reinforced concrete;
- Timber and concrete beams are designed with rectangular cross-sections, while steel beams are designed with duo-symmetrical welded I-sections (the most commonly used cross-sections);
- Spans up to 15 m are considered for glulam, steel, and reinforced concrete beams (rectangular glulam and concrete cross-sections are not suitable for longer spans);
- Beams are subjected only to static loads; consequently, resistance to vibrations and earthquakes is not considered;
- Uniform imposed loads up to 50 kN/m1 are considered for glulam, steel, and reinforced concrete beams;
- Spans up to 7.5 m are considered for sawn timber beams (rectangular sawn timber cross-sections are not suitable for longer spans);
- Uniform imposed loads up to 20 kN/m1 are considered for sawn timber beams (higher loads lead to impractically heavy designs);
- The dimensioning constraints of the beams are defined according to the Eurocode specifications: Eurocode 5 for timber [33], Eurocode 3 for steel [34] and Eurocode 2 for reinforced concrete [35];
- All three beam alternatives are assumed to be used under the same conventional service conditions representative of typical building applications;
- The protective measures included in the cost models correspond to those normally required in engineering practice for these structures (e.g., steel beams include anti-corrosion and fire-protection coatings, timber beams include impregnation, while concrete beams typically do not require additional protection);
- The objective functions for beams include only the material, power, labor, and global warming costs due to CO2 emissions associated with manufacturing. The costs of transporting and installing finished beams are not considered in this study;
- The service life costs (operational, maintenance, repair, and rehabilitation costs of beams) are not considered;
- The overall life-cycle costs (LCC) such as design, construction, transport, operational, maintenance, repair, rehabilitation and end-of-life costs are outside the scope of this study;
- In the defined objective functions, only the CO2 emissions caused by the materials used to manufacture the beams are taken into account (CO2 caused by the energy consumed during production, transport, maintenance, repair, demolition and recycling is not considered);
- Potential deterioration caused by aggressive environmental exposure, together with the associated maintenance, repair, and replacement interventions during the service life, is excluded from the optimization;
- The environmental impacts of the three materials over their service life (e.g., radon gas exposure) are not considered;
- The calculated production costs reflect the economic input data adopted in this study (unit prices from Central Europe);
- The study considers exposed timber beams with the effective breadth of the cross-sections. Only one type, the cheapest timber materials, are used: sawn timber C24 and glulam GL24h (all other stronger timber materials are much more expensive, they are not or very rarely available on the market).
2.2. Optimization Models of Beams
Three separate MINLP optimization models were developed for timber, steel and reinforced concrete beams. The models were modeled in the GAMS24.8 (General Algebraic Modeling System) environment [36]. For each model, a specific cost objective function was defined and subjected to (in)equality constraints. The constraints represent the equations for calculating the internal forces, stresses and deflections as well as the equations for dimensioning the beams. The dimensioning constraints are defined in such a way that the ultimate and serviceability limit state conditions in accordance with the Eurocode specifications are met. In addition, the models include input data (scalars and parameters) such as span, imposed load, material properties, safety factors, discrete dimension alternatives, alternative material strengths, unit prices, coefficients for cost items, etc. The models also include continuous variables such as costs, mass, loadings, internal forces, stresses, deflections, etc., and discrete binary 0–1 variables that are used to calculate discrete decisions such as standard sizes, discrete/rounded dimensions and standard materials/grades.
The optimization models were formulated assuming identical environmental conditions for all beam alternatives. Consequently, only the initial protective measures applied during beam production were included in the cost calculations, while maintenance activities related to long-term environmental degradation were not considered.
2.3. Cost Objective Functions
For each of the three construction materials—timber, steel and reinforced concrete—a specific cost objective function of the beam structure was defined. The objective functions comprise the self-manufacturing costs and the global warming costs caused by the CO2 emissions of the materials used in the production of the beams. The accurate material, energy and labor cost items are derived and inserted into the objective functions.
Note that the carbon footprint emission factors used in this study represent production-stage embodied CO2 emissions. Biogenic carbon storage in timber products was intentionally excluded. Consequently, the comparison reflects only greenhouse gas emissions associated with the materials used to produce beams for all investigated beam types.
The objective function of the timber beam (see Equation (1)) defines the objective variable COSTt, which includes the self-manufacturing material, power and labor costs COSTMPL,t plus the global warming costs due to CO2 emissions generated during fabrication. In the equation, Vt represents the volume of the timber beam, fCFEFt is the carbon footprint emission factor for timber and CGW is the price of global warming. The cost items involved in COSTMPL,t are introduced by Equation (2) and shown in Table 1 by Equations (8)–(12).
min COSTt = COSTMPL,t + Vt · fCFEFt · CGW
COSTMPL,t = CM,t + CM,imp + CM,paint + CL,paint
The objective function of the steel beam (see Equation (3)) determines the objective variable COSTs, which contains the self-manufacturing material, power and labor costs COSTMPL,s and the costs for global warming due to CO2 emissions. Here, Vs stands for the volume of the steel beam, fCFEFs for the carbon footprint emission factor for structural steel and CGW for the price of global warming. The cost items involved in COSTMPL,s are represented by Equation (4) and shown in Table 1 by Equations (13)–(30).
min COSTs = COSTMPL,s + Vs · ρs · fCFEFs · CGW
COSTMPL,s = CM,s + CM,e + CM,ac,fp,tc + CM,c,ng + CM,c,oxy + CP,c,gm + CP,w + CL,c,oxy-ng + CL,g + CL,p,a,t + CL,w + CL,spp
Similarly, Equation (5) defines the objective variable COSTc of the reinforced concrete beam, which includes the self-manufacturing material, power and labor costs COSTMPL,c and the costs of global warming due to CO2 emissions caused by the concrete and reinforcing steel used. Vc is the volume of concrete used, fCFEFc is the carbon footprint emission factor for concrete, Vr is the volume of reinforcing steel used, fCFEFr is the carbon footprint emission factor for the reinforcing steel and CGW is the price of global warming.
Since the carbon footprint emission factor for concrete fCFEFc depends on the concrete strength fck (which is calculated as the optimal strength during the optimization process), it is not entered into the model as a scalar (input data) but is defined as a dependent variable by Equation (6) as a function of fck. The cost items involved in COSTMPL,c are introduced by Equation (7) and shown in Table 1 by Equations (31)–(41).
min COSTc = COSTMPL,c + Vc · fCFEFc · CGW + Vr · ρs · fCFEFr · CGW
fCFEFc = −0.0341 · (10 · fck)2 + 7.3825 · (10 · fck) + 100.37 (fck in kN/cm2)
COSTMPL,c = CM,c + CM,r + CM,f + CP,v + CL,f + CL,r + CL,c + CL,v + CL,cc
It should be noted that the symbols of the scalars (input data) and variables included in the above cost items are shown in Table 2 for the timber beam, in Table 3 for the steel beam and in Table 4 for the reinforced concrete beam. Further information on the above cost items for steel and reinforced concrete beams can be found in the articles by Klanšek and Kravanja [37,38] and Kravanja et al. [39]. Some cost items for timber beams can be found in reference [40] by Jelušič and Kravanja.
Table 1.
Cost items involved in the objective functions of timber, steel and reinforced concrete beams.
Also note that glulam beams with greater depths (heights) are more expensive on the market than those with smaller depths. Therefore, the unit price of glulam pM,t is proposed by Equation (9) as a function of the height of the timber beam ht. In contrast, the unit price of sawn timber is taken as a constant (scalar). Similarly, the unit price of steel pM,s depends on the plate/sheet thickness t and the yield strength of the steel fy [39]. Thicker sheet thicknesses t and higher strengths fy lead to higher unit prices for steel than lower ones (see Equation (14)). The factor cs stands for the unit price of steel S235 for the standard sheet thickness t = 8 mm. Concrete with higher strengths fck has higher unit prices pM,c [39] (see Equation (32)). The factor cc is the unit price for concrete C25/30.
Table 2.
Scalars (input data) and variables in the objective function of the timber beam.
Table 3.
Scalars (input data) and variables in the objective function of the steel beam.
Table 4.
Scalars (input data) and variables in the objective function of the reinforced concrete beam.
2.4. Equality and Inequality Constraints of the Models
The optimization models contain both equality and inequality constraints corresponding to the equations used to calculate the internal forces, stresses and deflections, and to determine the dimensions of the beams. The dimensioning constraints are established to ensure compliance with the ultimate and serviceability limit state conditions as specified in the Eurocode standards.
The most important dimensioning constraints are shown in Table 5 for three different models: Equations (42)–(62) represent the constraints for the timber beam optimization model, Equations (63)–(101) stand for the constraints for the steel beam model and Equations (102)–(132) represent the constraints for the reinforced concrete beam model.
Table 5.
Dimensioning constraints for timber, steel and reinforced concrete beams.
The optimization model of the timber beam comprises dimensioning constraints defined according to Eurocode 5 [33]. Equation (42) stipulates that the design bending stress about the y axis σm,y,d must not exceed the design bending strength of the timber fm,y,d. The expressions σm,y,d, fm,y,d, the design bending moment MEd, the design load qEd and Wt are defined by Equations (43)–(47). Note that all the different terms in the above equations represent either scalars (input data) or variables, which are listed in Table 6 and Table 7. For example, bt and ht stand for width and height (depth) of the timber cross-section. The condition that the design shear stress τd must be less than or equal to the design shear strength fv,d is defined by Equations (48)–(52), where VEd is the design shear force and bef is the effective width of the cross-section. The lateral–torsional stability is checked with Equation (53), where the reduction factor of the bending strength due to lateral buckling kcrit (see Equations (54) and (55)) is proposed by Kravanja et al. [41] and defined as a continuous function over the entire interval of the three different equations of Eurocode 5, approximated by the computational intelligence of WolframAlpha [42]. The relative bending slenderness for the rectangular timber cross-section λrel,m is calculated by Equation (56), where the factor c1 [43], which depends on the ratio ht/bt of the cross-section, is approximated as a continuous function defined by Equation (57) (see also Kravanja et al. [41]). While the instantaneous deflection of the beam is controlled by Equations (58)–(60), the final deflection of the beam is limited by Equations (61) and (62).
Table 6.
Scalars (input data) and variables in the constraints of all optimization models.
Table 7.
Scalars (input data) and variables in the constraints of the timber beam.
The optimization model of the steel beam contains constraints for the dimensioning that were determined in accordance with Eurocode 3 [34]. The defined scalars and variables are listed in Table 6 and Table 8. While the design bending moment MEd is checked by Equations (63)–(66), the design shear force VEd is constrained by Equations (67)–(69). The shear buckling resistance of the web is modeled by Equations (70)–(75). Here, the reduction factor for the shear resistance of the web χw is approximated and represented by Equations (72) and (73), where λw is a slenderness parameter. The class 3 cross-section requirements for flanges and web (elastic resistance) and the shear lag in the flanges are checked using Equations (76)–(78). The lateral–torsional buckling resistance of the beam is checked with the known equations for duo-symmetrical I steel beams: Equations (79)–(89), see former Eurocode 3 (ENV 1993), and Subotić and Lučić [44]. The resistance of fillet welds is calculated using Equations (90)–(94), where aw is the effective throat thickness of the weld. Here, the ultimate strength of the steel fu and the correlation factor βw are approximated as functions of the yield strength fy (which is also the variable and is calculated as the optimal value during optimization). Finally, the final deflection of the beam and the deflection due to the variable-imposed load are checked using Equations (95)–(101).
Table 8.
Scalars (input data) and variables in the constraints of the steel beam.
The optimization model of the reinforced concrete beam comprises constraints modeled according to Eurocode 2 [35]. Equations (102) and (103) introduce the condition for the bending moment resistance of the beam, where MRd stands for the design bending moment resistance of the cross-section. It should be noted that, as shown in Table 6 and Table 9, all the different symbols/terms in the equations represent either scalars (input data) or variables. The design shear resistance and shear reinforcement are calculated according to the conditions of Equations (104) and (105), where Asw represents the cross-sectional area of the shear reinforcement (see also Žula et al. [45]). The requirements for the minimum area of the reinforcing steel As,min and the maximum area of the reinforcing steel As,max are handled by Equations (106)–(108). The lateral–torsional buckling constraints are introduced by Equations (109)–(118), derived from Girija & Devdas Menon [46], where Mult is a calculated ultimate flexural failure moment. The crack control is checked using Equations (119) and (120). The vertical deflection of the reinforced concrete beam is checked using Equations (121)–(132). For loads with a duration that causes creep, we calculate the effective elastic modulus of concrete Ec,eff according to Equation (126), where the creep coefficient φ(∞, t0) is proposed as an approximation function: Equation (127).
Table 9.
Scalars (input data) and variables in the constraints of the reinforced concrete beam.
2.5. Logical Constraints and Discrete Variables
Logical constraints and discrete variables are defined to determine discrete/standard dimensions and grades. The optimal discrete dimension or grade D is calculated as the scalar product between a vector of j discrete values/alternatives dj = {d1, d2, d3, …, dj} and a vector of j associated binary 0–1 variables yj = {y1, y2, y3, …, yj} (see Equation (133)). As the sum of the j binary variables is defined as 1 (see Equation (134)), to the variable D can be assigned exactly one discrete value dj.
2.6. Multi-Parameter Discrete Optimization of Beams
Several individual discrete cost optimizations were performed for different parameters such as different building materials, different material grades, spans, imposed loads, and different discrete/standard dimensions. For this purpose, the multi-parameter cost optimization was performed for:
- Eleven different building materials:
- ○
- One glulam grade (GL24h; stronger grades are very rarely available on the market);
- ○
- Three different structural steel grades (S 235, S 275 and S 355);
- ○
- Seven different reinforced concrete strengths (C20/25, C25/30, C30/37, C35/45, C40/50, C45/55 and C50/60).
- Two different objective criteria (with and without CO2 emission costs);
- Six different spans (2.5 m, 5 m, 7.5 m, 10 m, 12.5 m and 15 m);
- Six different continuous uniformly distributed imposed loads (5 kN/m1, 10 kN/m1, 20 kN/m1, 30 kN/m1, 40 kN/m1 and 50 kN/m1);
- A total of 2749 different alternatives for discrete dimensions:
- ○
- Forty-seven alternatives for the width and 98 alternatives for the height (in cm) for the glued laminated timber cross-section;
- ○
- A total of 1051 alternatives for the flange breadth, 1301 alternatives for the web height and 8 alternatives (all in mm) for the flange and web thicknesses for the steel cross-section;
- ○
- A total of 103 alternatives for the width, 141 alternatives for the height and 18 alternatives for the reinforcing steel area for the reinforced concrete cross-section.
To determine the optimal range of beams made from sawn timber, a special multi-parameter optimization was also conducted for shorter spans and lower loads for three different spans (2.5 m, 5.0 m, and 7.5 m) and four different uniformly distributed imposed loads (5, 10, 15, and 20 kN/m1).
Table A1, Table A2, Table A3, Table A4, Table A5, Table A6 and Table A7 in Appendix A list the input data used (safety factors, material characteristics, unit prices, etc.) for the objective functions and constraints of the models, separately for timber, steel and reinforced concrete beams.
For each beam material (timber, steel, and concrete), a specific MINLP optimization model was developed, and a corresponding MINLP superstructure was defined. Each optimization model includes the objective function, equality and inequality constraints, continuous variables (costs, mass, loadings, internal forces, stresses, etc.), and discrete binary variables used to calculate discrete dimensions and material strengths/grades. Each MINLP superstructure consists of various alternative substructures, defined by combinations of different discrete dimensions and material strengths.
The discrete MINLP optimizations of the beams are proposed to be performed using the outer-approximation and equality-relaxation (OA/ER) algorithm [30,31,32]. The OA/ER algorithm performs a sequence of iterative calculations involving mixed-integer linear programming (MILP) and non-linear programming (NLP) subproblems. The MILP subproblem corresponds to the linear discrete optimization of the superstructure in the linear space (a linear approximation of the entire problem) to identify new discrete variables and a new structure (with new standard dimensions and material strength). The NLP subproblem corresponds to the exact non-linear optimization of the structure identified in the previous MILP solution. At each iteration (MILP followed by NLP), new linearizations derived from the NLP subproblem’s solution are added to the MILP space, which thus becomes increasingly rich. When the optimization direction is minimization, the MILPs provide lower bounds, and the NLPs provide upper bounds for the entire MINLP problem. For convex problems, the search terminates when the bounds converge, while for nonconvex problems, it terminates when there is no improvement in the NLP solution.
The multi-parameter optimization processes were conducted using the MipSyn and GAMS/DICOPT computer programs developed by Kravanja and Grossmann [47], and Grossmann and Viswanathan [48], respectively. We used GAMS/CONOPT (Generalized Reduced Gradient method) by Drud [49] to solve the NLP subproblems and GAMS/CPLEX (branch and bound method) [50] for the MILP subproblems. The software normally required between five and fifty iterations to find solutions.
2.7. Typical Calculations
Typical MINLP optimizations of self-manufacturing costs including global warming costs (CO2 emissions incurred during production) are presented here for 12.5 m long timber (glulam), steel and reinforced concrete beams subjected to self-weight and an imposed uniform load of 50 kN/m1.
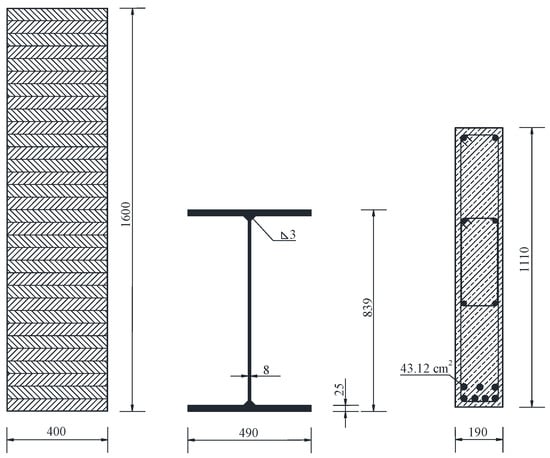
The glulam beam superstructure comprises 4606 different structure alternatives, the steel I-beam superstructure includes 262.531 · 106 different structure alternatives, and the reinforced concrete beam superstructure consists of 1.830 · 106 different beam alternatives. One structure among these alternatives is optimal. For the comparison, two different objective criteria were defined: the self-manufacturing costs of the structures with CO2 emission costs (criterion 1) and without CO2 emission costs (criterion 2). A total of 15 min of working time was needed to obtain all six optimal solutions (see Table 10). Optimal costs, dimensions and material grades were calculated. The optimal dimensions of the cross-sections are shown in Figure 2. The dimensions and material grades obtained are identical for both objective criteria.
Table 10.
Results of MINLP optimizations of timber, steel and reinforced concrete beams for a span of 12.5 m and a load of 50 kN/m1.
Figure 2.
Optimal timber, steel and reinforced concrete cross-sections (mm) for a span of 12.5 m and a load of 50 kN/m1.
For the given span and load, the glulam beam is the most expensive solution (9793.84 €), while the reinforced concrete beam is the cheapest solution (3425.58 €). At the same time, the timber beam exhibits the lowest CO2 emissions incurred during its production: 1216.80 kg CO2/beam, which costs only 141.15 €. In contrast, the production of steel beam shows the highest CO2 emissions: 2563.86 kg CO2/beam and a cost of 297.41 €. Although the calculated costs of the CO2 emissions generated are low, the amount of 2563.86 kg CO2 is, for example, equivalent to the emissions produced by driving an average car (100 g CO2/km) over a distance of 25,000 km.
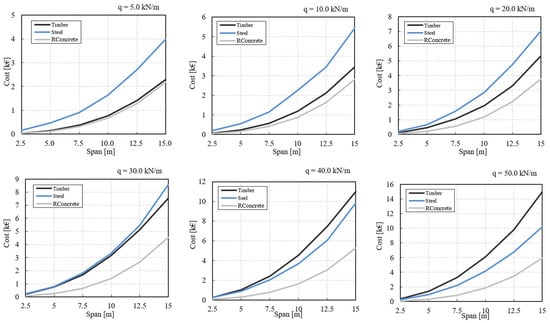
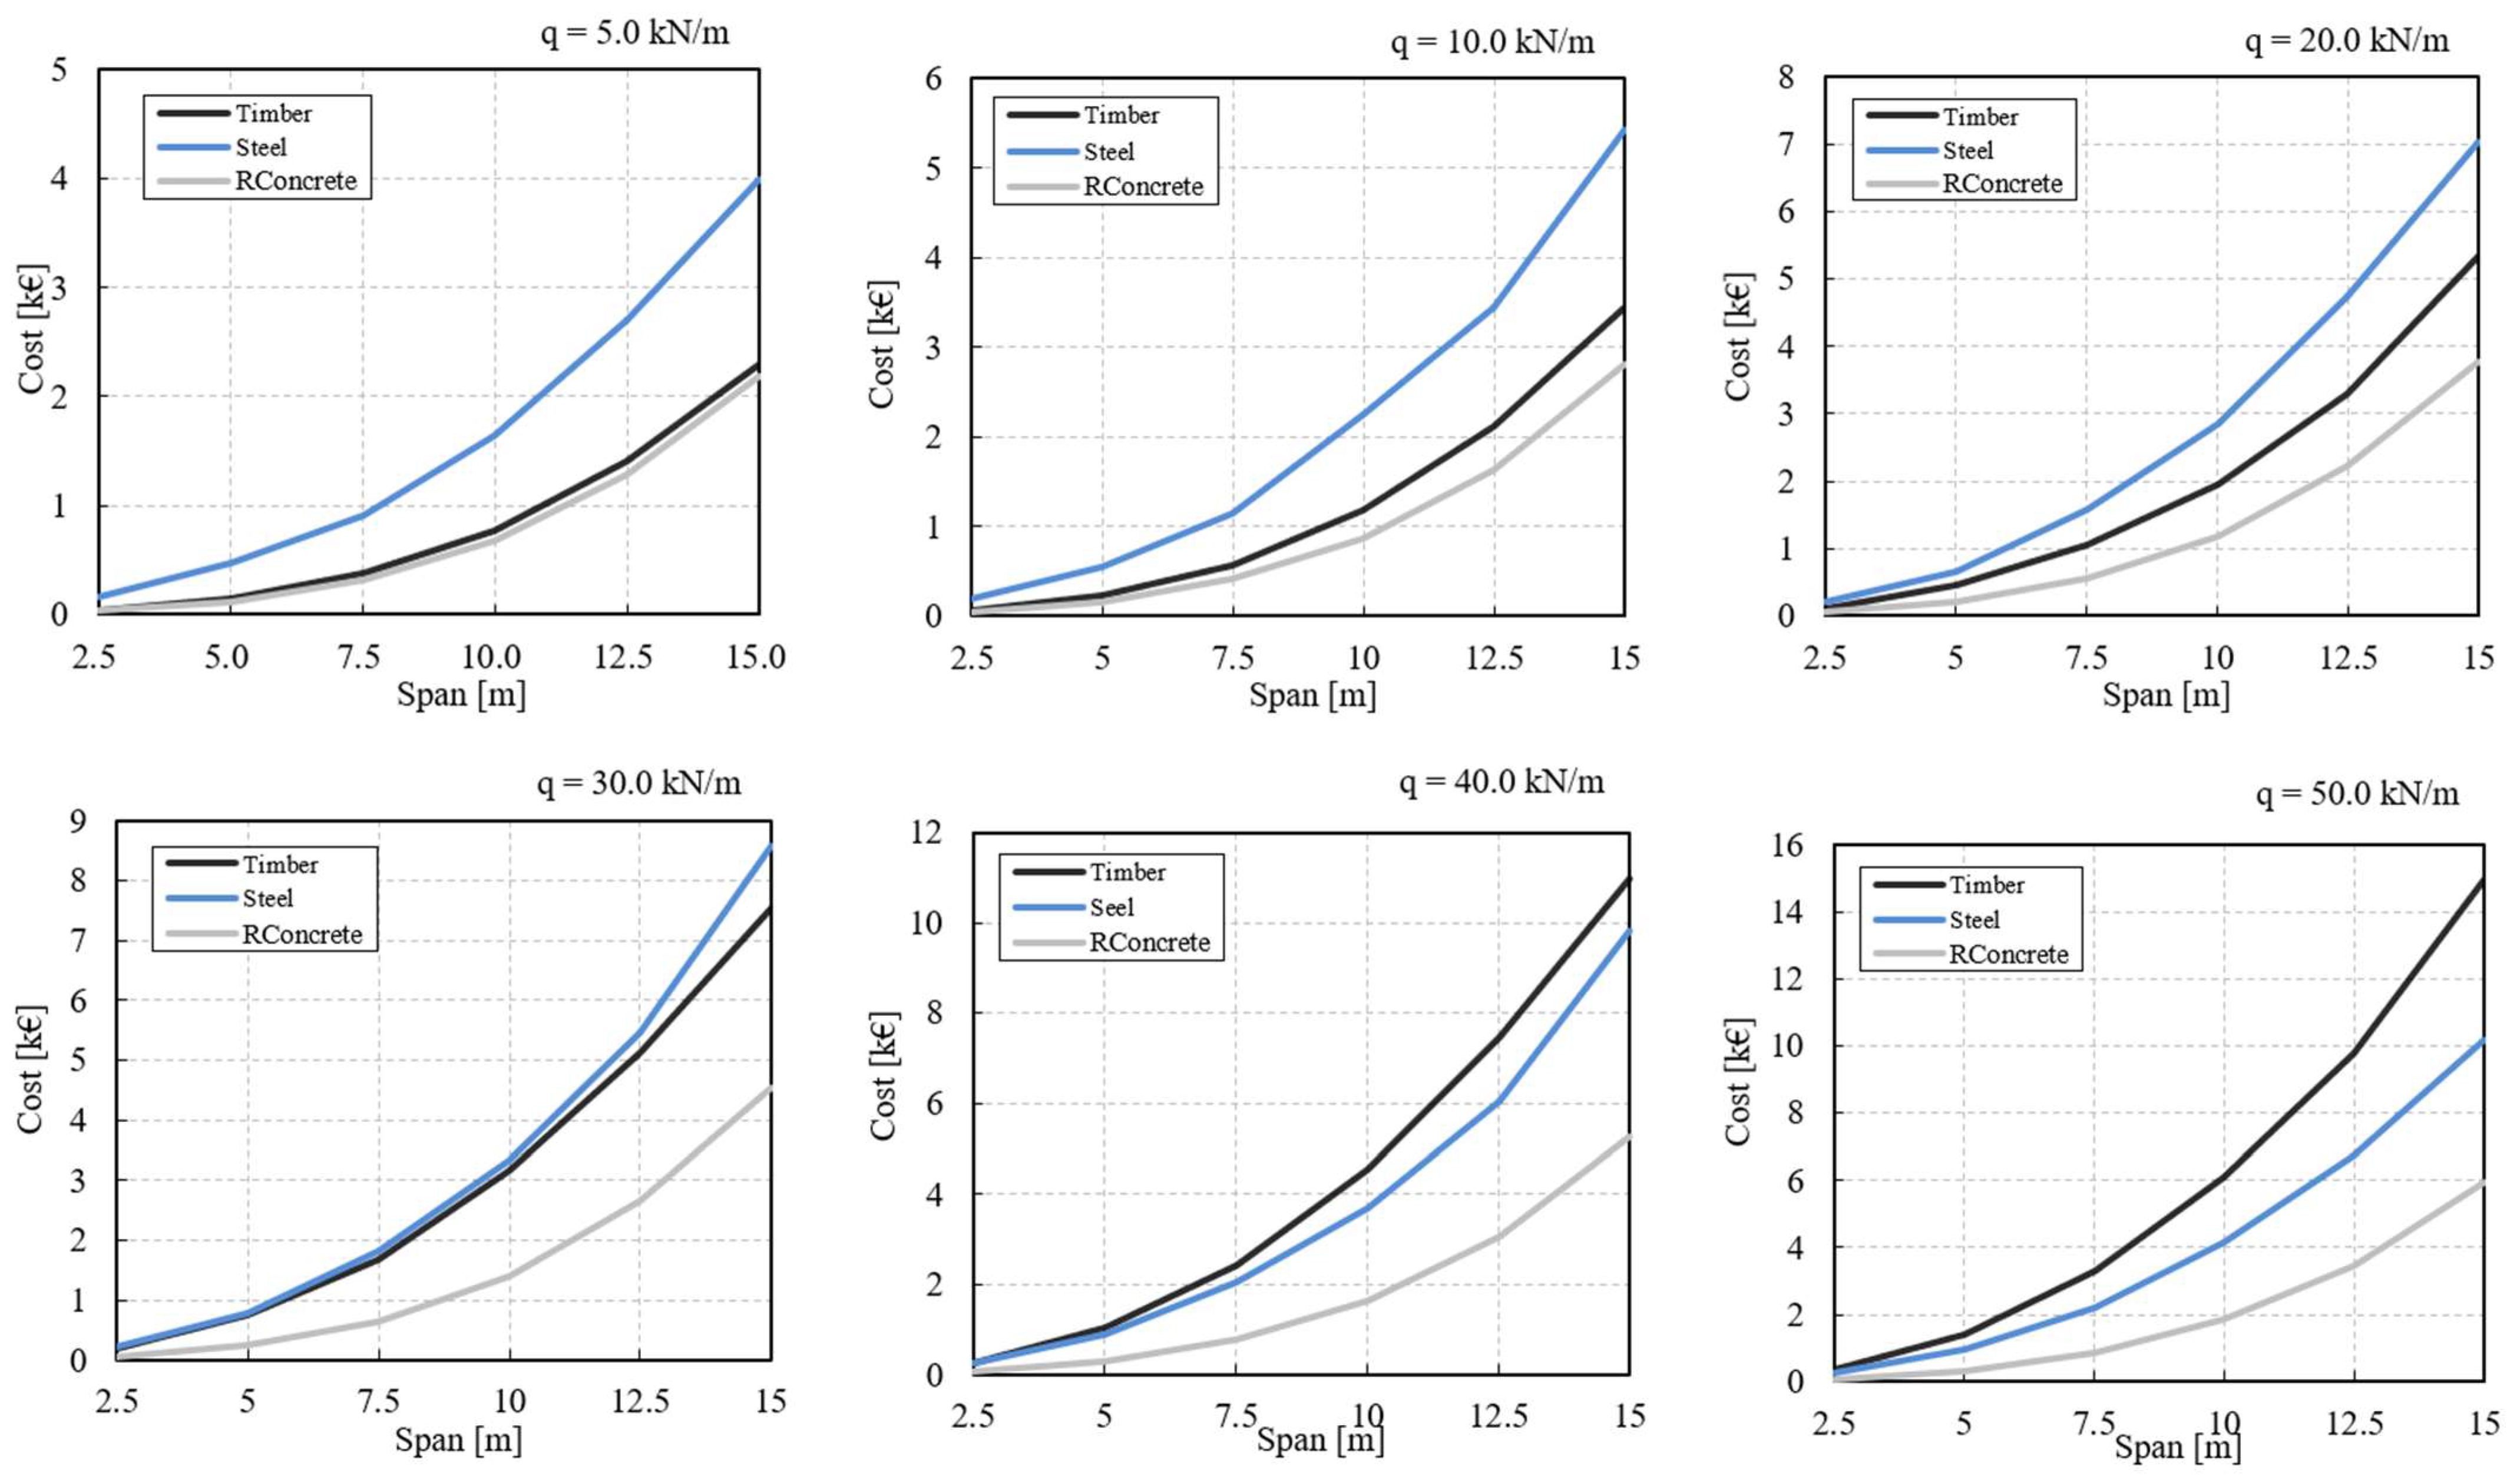
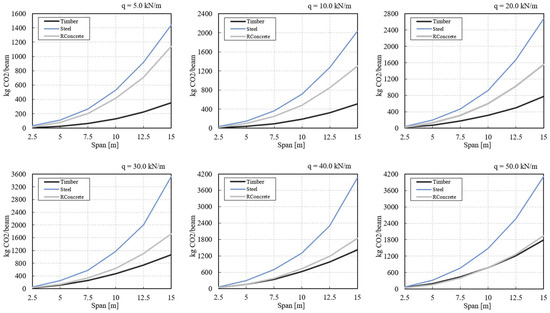
Note that these optimal production plus CO2 emission costs, as well as CO2 emissions, can also be quickly obtained from the last diagrams in Figure 3, Figure 4 and Figure 5, respectively.
Figure 3.
Diagrams of the optimal total self-manufacturing plus CO2 emission costs of glued laminated timber, steel and reinforced concrete beams.
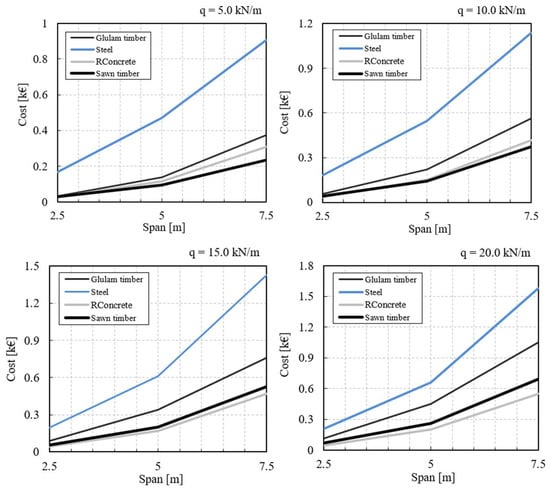
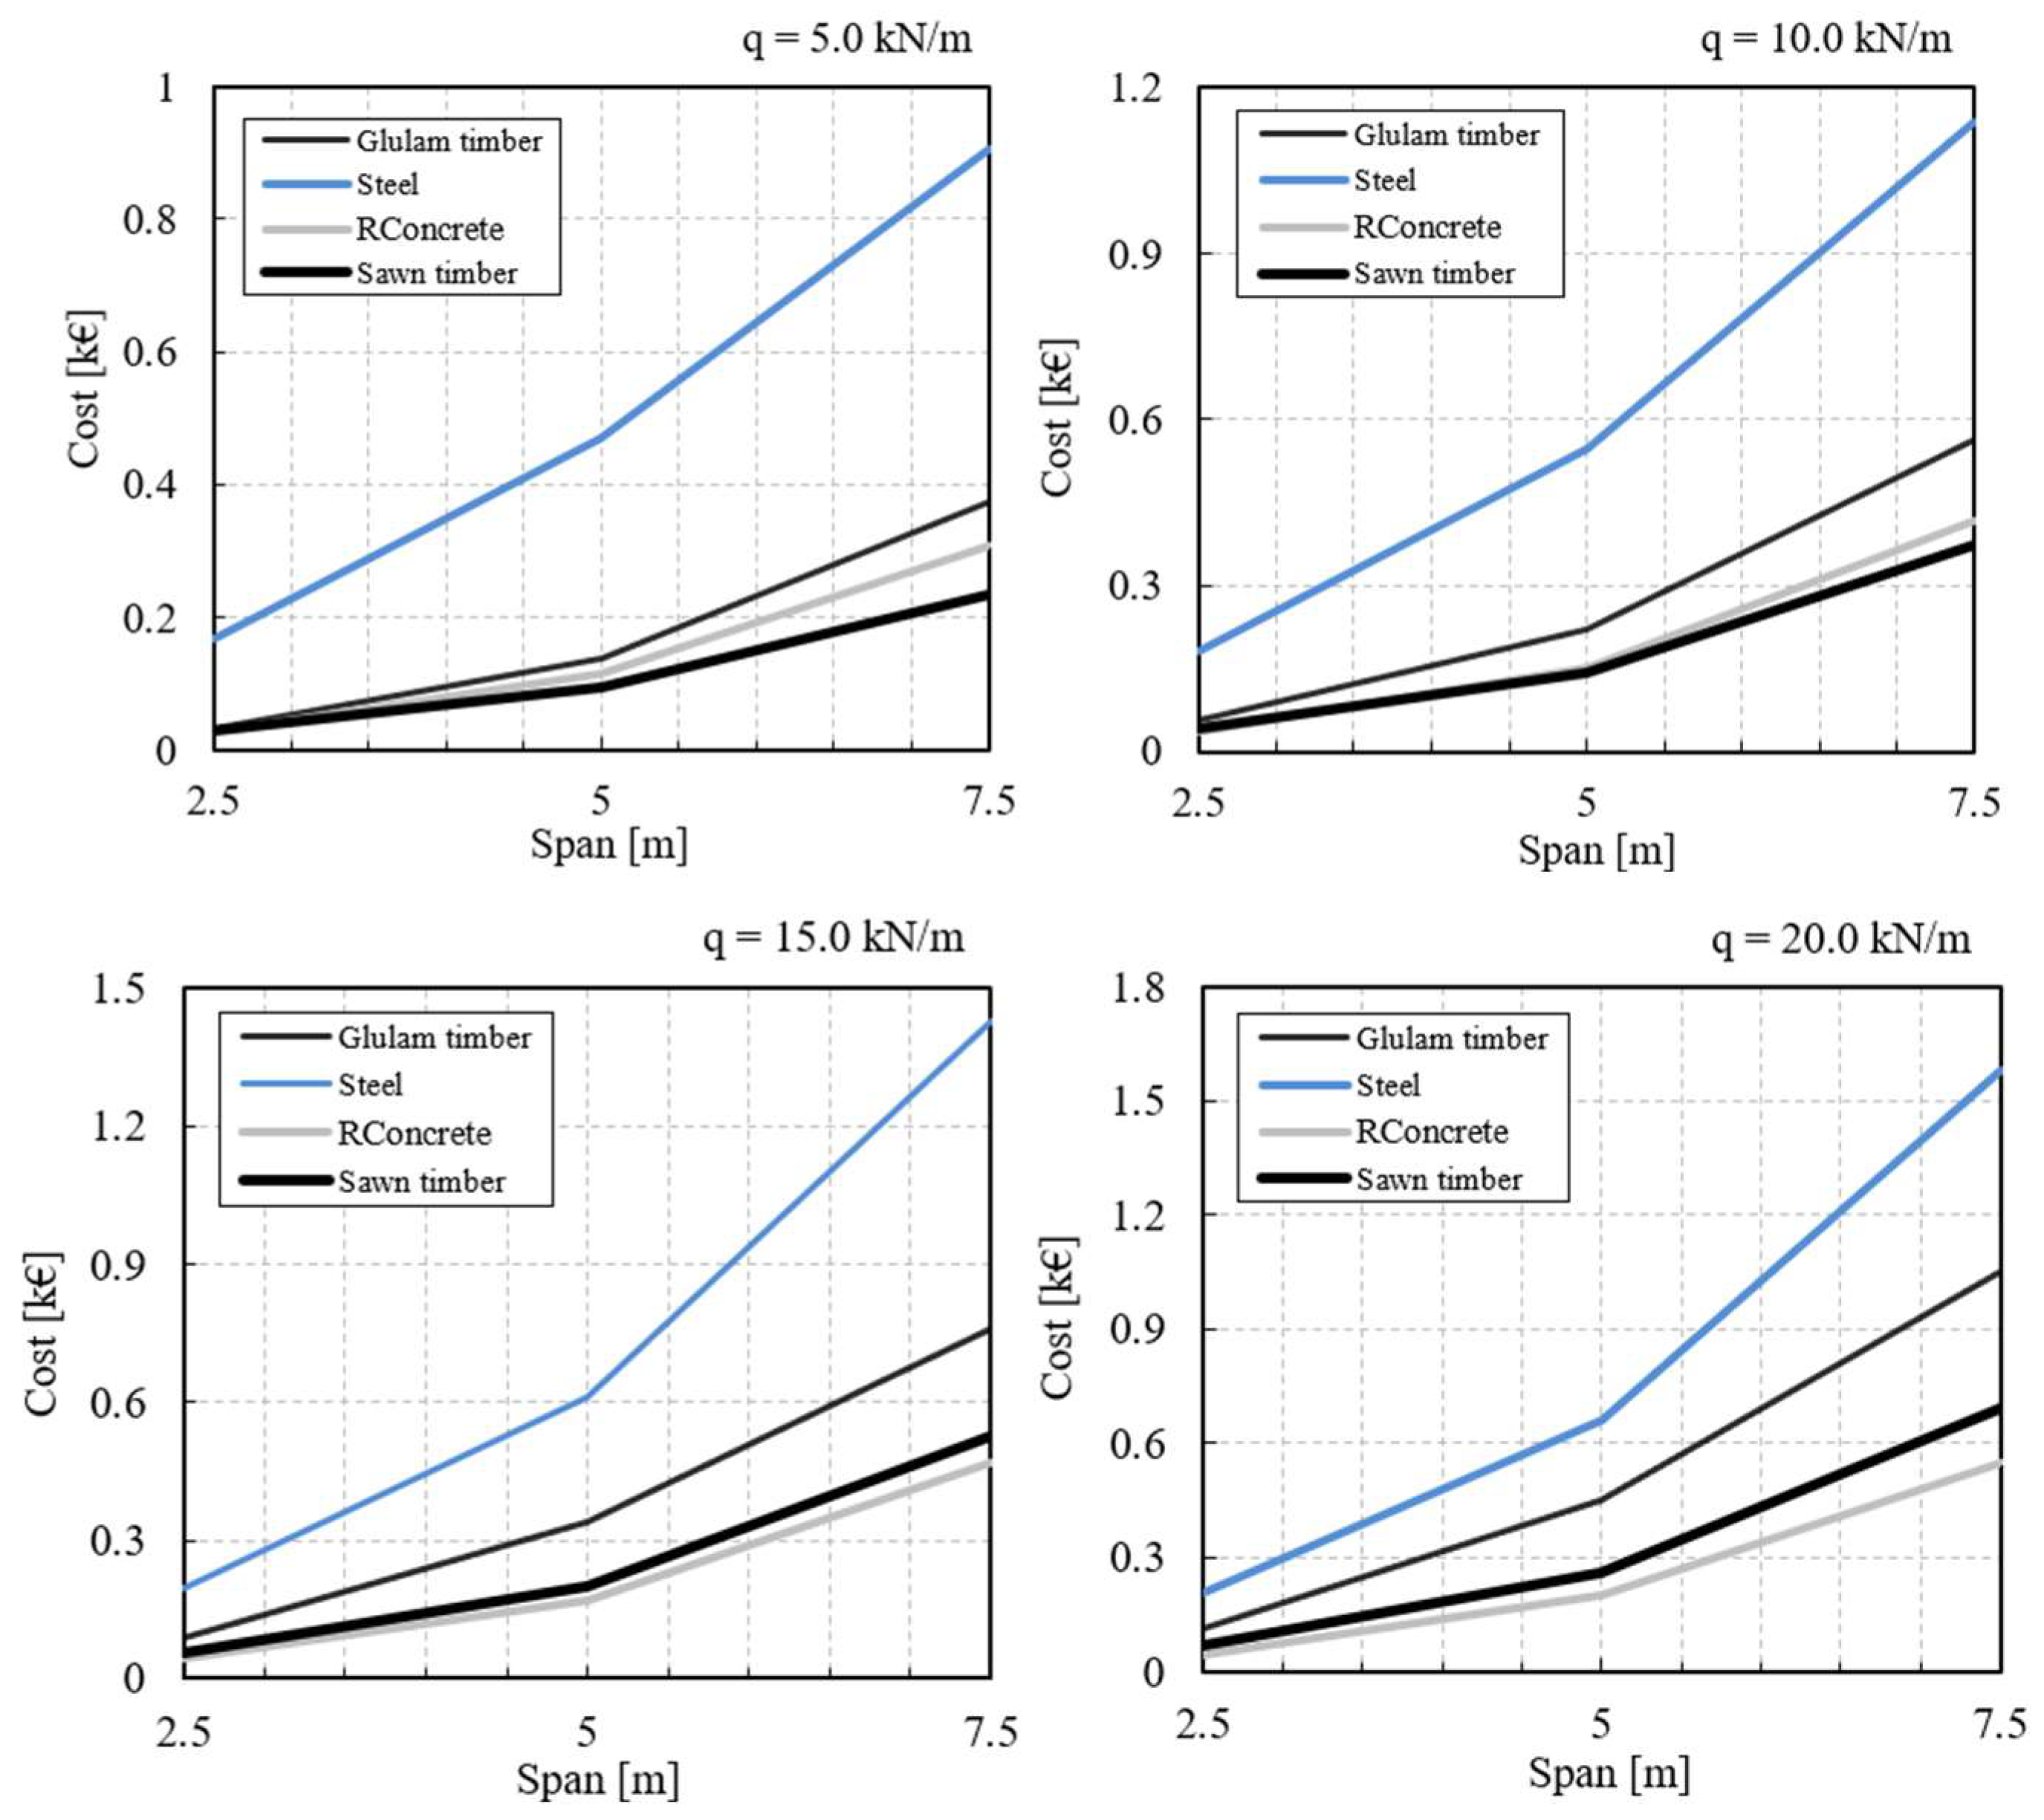
Figure 4.
Diagrams of the optimal total self-manufacturing plus CO2 emission costs of sawn timber, glulam timber, steel and reinforced concrete beams for lower spans and loads.
Figure 5.
Diagrams of the CO2 emissions of glued laminated timber, steel and reinforced concrete beams.
3. Results
A total of 216 individual MINLP optimizations were performed for three different types of beams (glued laminated timber, steel and reinforced concrete), two different objective criteria (with and without CO2 emission costs), six different span lengths (from 2.5 m to 15 m) and six different uniform loads (from 5 kN/m1 to 50 kN/m1).
3.1. Optimal Total Self-Manufacturing Plus CO2 Emission Costs of Beams
Figure 3 shows the diagrams of the calculated optimal total self-manufacturing plus CO2 emission costs of glued laminated timber, steel, and reinforced concrete beams (in €/beam). The diagrams were developed for six different imposed uniform loads (from 5 kN/m1 to 50 kN/m1) and for six different spans (from 2.5 m to 15 m).
The optimal total self-manufacturing plus CO2 emission costs of timber beams are 1.25 times, 2.17 times and 3.43 times higher than the costs of reinforced concrete beams for low (5 and 10 kN/m1), medium (20 and 30 kN/m1) and high (40 and 50 kN/m1) imposed loads, respectively (see cost increment coefficients in Table 11). These costs are also shown in the table for short spans (2.5 and 5 m), medium spans (7.5 m and 10 m) and long spans (12.5 m and 15 m). The obtained costs of timber beams are on average 2.28 times higher than the costs of reinforced concrete beams for all spans and loads.
Table 11.
Cost increment coefficients of the cost ratios between glued laminated timber and reinforced concrete beams and between steel and reinforced concrete beams.
The optimal total self-manufacturing plus CO2 emission costs of steel beams are 3.09 times, 2.79 times and 2.64 times higher than the costs of reinforced concrete beams for low, medium and high imposed loads, respectively. The achieved costs of steel beams are on average 2.84 times higher than the costs of reinforced concrete beams for all spans and loads (see Table 11).
In addition, Figure 4 presents diagrams of the optimal total self-manufacturing plus CO2 emission costs of sawn timber, glulam, steel, and reinforced concrete beams (in €/beam) for lower spans and loads. The diagrams were developed for four different imposed uniform loads (5, 10, 15, and 20 kN/m1) and three different spans (2.5 m, 5.0 m, and 7.5 m).
Sawn timber beams are suitable for imposed loads up to 20 kN/m1 and for spans up to 7.5 m, as their cross-sections become too large for longer spans, even at the lowest defined load. For spans up to 7.5 m and loads up to 10 kN/m1, sawn timber is the most suitable material for beams, being on average 9.56% less expensive than reinforced concrete beams.
Reinforced concrete beams are the most favorable structures for all spans and loads, except within the narrow optimal range of sawn timber. Steel beams are the most expensive for loads up to 30 kN/m1, while glulam beams are the most expensive for loads greater than 30 kN/m1.
3.2. CO2 Emissions Generated During Beam Production
Figure 5 shows the diagrams of the calculated CO2 emissions of glued laminated timber, steel and reinforced concrete beams generated during their manufacture (kg CO2/beam). The diagrams were created for six different imposed uniform loads from 5 kN/m1 to 50 kN/m1 and for six different spans (from 2.5 m to 15 m).
In terms of CO2 emissions, glulam beams are the most favorable beams for all spans and loads, while steel beams are the least favorable structures. The CO2 emissions of reinforced concrete beams vary between the higher steel emissions and the lower timber emissions. With increasing loads, the CO2 emissions of reinforced concrete beams converge toward those of timber, equalizing at 50 kN/m1.
The calculated CO2 emissions of steel beams are 4.16 times, 2.68 times and 2.12 times higher than the calculated emissions of timber beams for low, medium and high imposed loads respectively. The calculated CO2 emissions of steel beams are on average 2.99 times higher than the emissions of timber beams for all spans and loads (see CO2 emission increment coefficients in Table 12).
Table 12.
CO2 emission increment coefficients of the emission ratios between steel and glulam timber beams and between reinforced concrete and glulam beams.
The obtained CO2 emissions of reinforced concrete beams are 2.85 times, 1.57 times and 1.02 times higher than the emissions of timber beams for low, medium and high imposed loads respectively. The calculated CO2 emissions of reinforced concrete beams are on average 1.81 times higher than the emissions of timber beams for all spans and loads (see Table 12).
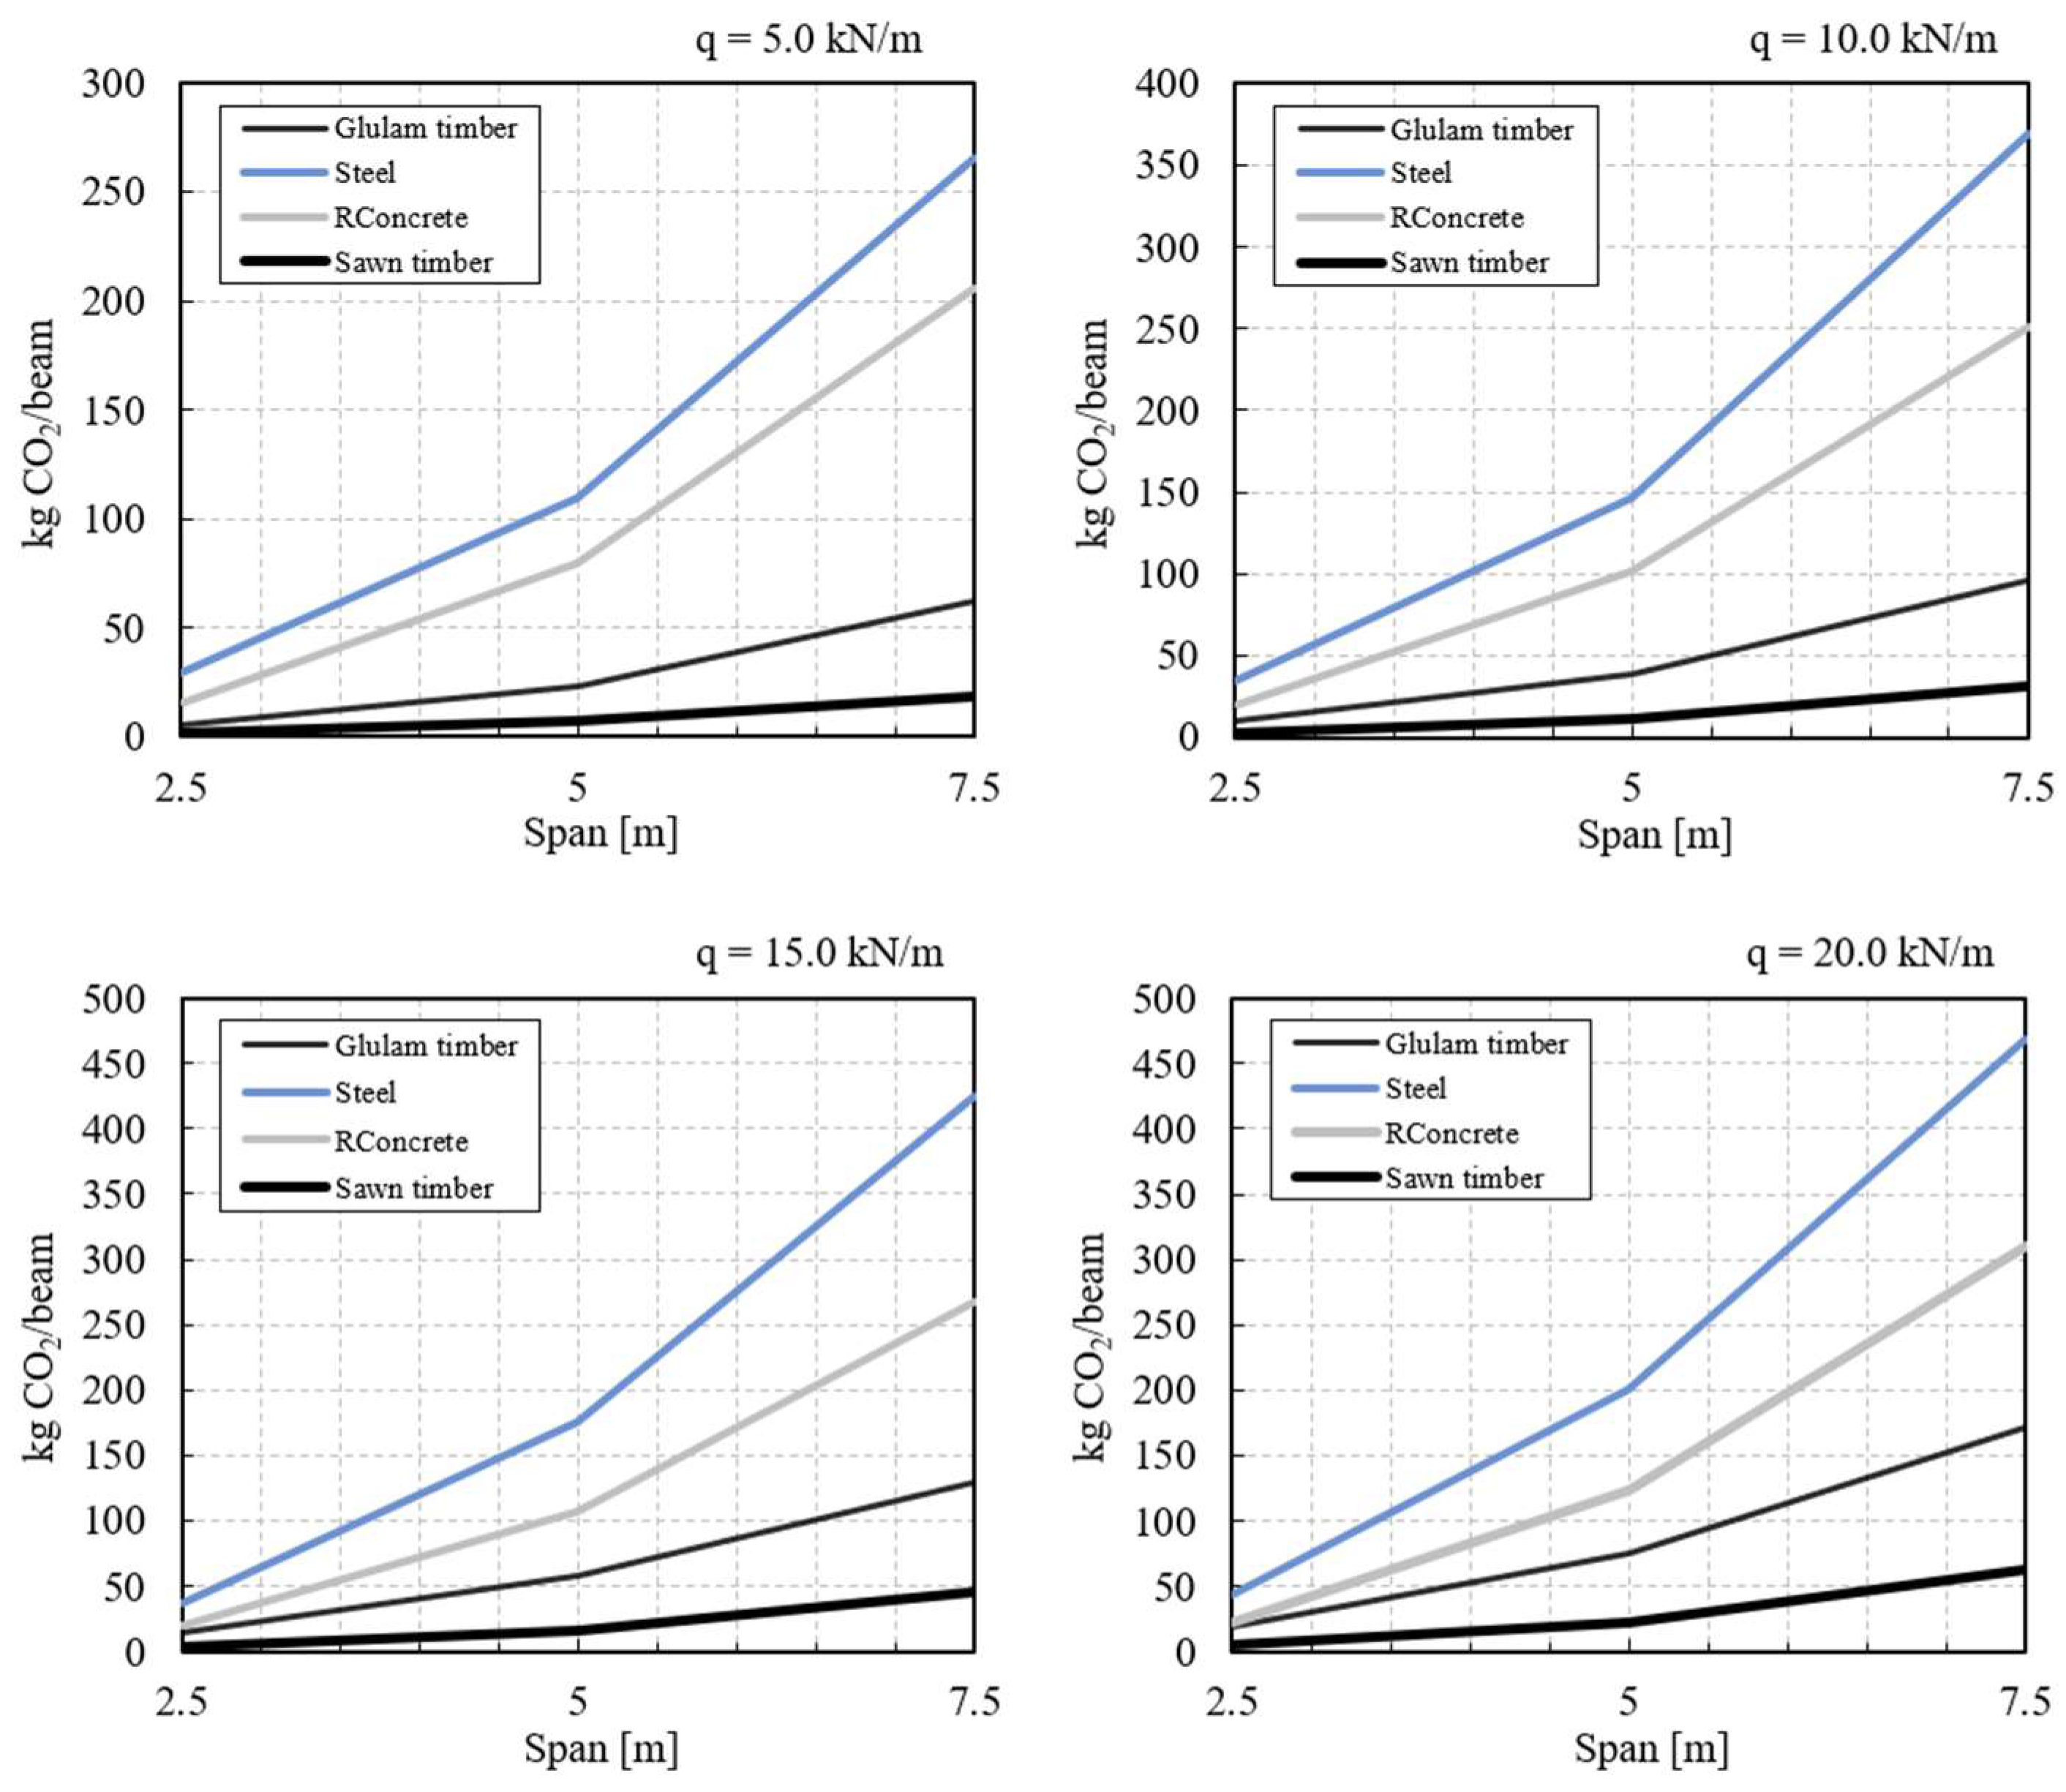
Additionally, the diagrams of the CO2 emissions of sawn timber, glulam, steel, and reinforced concrete beams generated during their production (kg CO2/beam) are presented for lower spans and loads (see Figure 6). These diagrams were developed for four different imposed uniform loads (5, 10, 15, and 20 kN/m1) and three different spans (2.5 m, 5.0 m, and 7.5 m).
Figure 6.
Diagrams of the CO2 emissions of sawn timber, glued laminated timber, steel and reinforced concrete beams.
Sawn timber is the most suitable material for beams in terms of CO2 emissions for spans up to 7.5 m and loads up to 20 kN/m1. Within its optimal range (spans up to 7.5 m and loads up to 10 kN/m1), it generates 2.83 times lower emissions than glued timber beams.
3.3. Shares of CO2 Emission Costs in the Total Optimal Costs of Beams
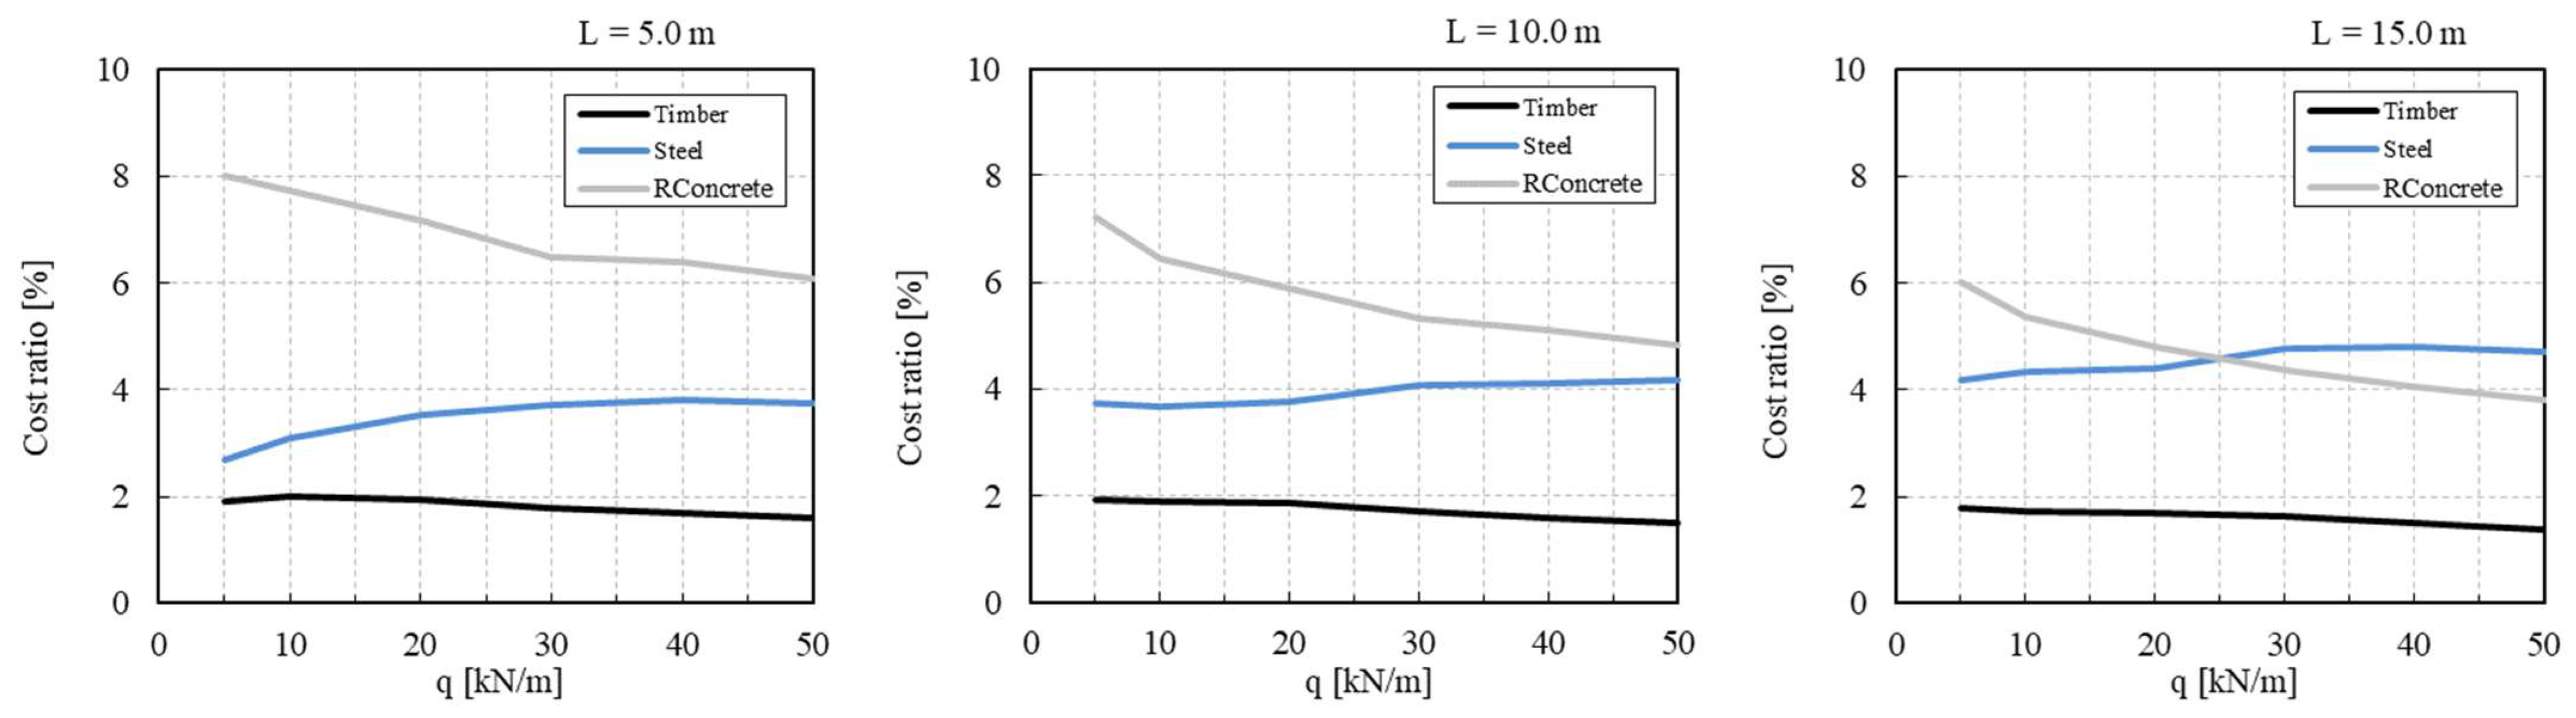
Since the price of global warming is low, the share of CO2 emission costs in the total optimal costs is also low. Figure 7 shows the graphs of the calculated shares of CO2 emission costs in the total optimal costs of glued laminated timber, steel and reinforced concrete beams (in %). The diagrams were developed for three different spans from 5 m to 15 m and six imposed uniform loads from 5 kN/m1 to 50 kN/m1. The calculated shares are 1.73% for timber, 3.96% for steel and 5.85% for reinforced concrete beams. The average share of CO2 emission costs in the total costs for all three types of beams is very low at 3.85%.
Figure 7.
Diagrams of the CO2 emission shares of glued laminated timber, steel and reinforced concrete beams.
3.4. Multi-Parameter Sensitivity Analysis
A multi-parameter sensitivity analysis of the optimal beam configurations was performed by systematically varying the following economic input parameters:
- Material unit prices (timber, steel, concrete and reinforcing steel) fluctuated by ±30% from their baseline values (from Table A1);
- Labor cost per working hour was adjusted to discrete levels of 15 €/h and 50 €/h from the baseline 25 €/h (from Table A1);
- Global warming price CGW escalated to 10-fold, 25-fold, 50-fold, 75-fold, and 100-fold scenarios relative to its baseline (from Table A1).
The sensitivity analysis evaluates how fluctuations in material, labor and global warming costs impact the structural costs of glulam, steel, and reinforced concrete beams across nine systematically arranged span-load combinations (L1 to L3) and span ranges (S1 to S3). L1 represents a short span of 5 m, L2 a medium span of 10 m, and L3 a long span of 15 m; S1 represents a low load of 10 kN/m1, S2 a medium load of 30 kN/m1, and S3 a high load of 50 kN/m1.
The sensitivity analysis of material unit price fluctuations, shown in Table 13, evaluates how material price and labor cost fluctuations impact the total self-manufacturing plus CO2 emission costs of glulam, steel and reinforced concrete beams across nine span-load combinations S1–L1 to S3–L3, relative to the baseline costs from Table A1 (Central Europe).
Table 13.
Sensitivity analysis of material unit price fluctuations: percentage cost deviations.
Load-dependent cost-sensitivity of fluctuating materials: For both timber and steel beams, the sensitivity of the total cost scales directly with increasing loading and span demands. For example, a ±30% shift in timber prices changes the total cost by only ±5.54% at low span-load conditions (S1–L1) but this increases to ±15.76% at the highest threshold (S3–L3). Steel shows very similar behavior, ranging from roughly ±13% up to ±20% cost sensitivity.
Robustness of reinforced concrete: Conversely, reinforced concrete (RC) demonstrates an inverse cost-sensitivity trend; it becomes more resilient to material price shocks at larger structural scales. A +30% increase in concrete unit prices raises the total baseline cost by +6.77% for S1–L1 but this drops to only +2.84% for S3–L3.
To evaluate the market robustness of the initial findings, a targeted sensitivity analysis of labor cost fluctuations was performed by varying the labor rates, as shown in Table 14. The baseline labor cost of 25 €/h was compared with a lower rate of 15 €/h and a higher rate of 50 €/h across all nine span-load combinations.
Table 14.
Sensitivity analysis of labor cost fluctuations: percentage cost deviations relative to the 25 €/h baseline.
High vulnerability of reinforced concrete: Reinforced concrete (RC) displays the highest cost sensitivity to labor fluctuations. Increasing the labor rate to 50 €/h leads to a massive rise in the total costs of RC beams, between +46.44% and +66.37%. This underscores that RC remains a heavily labor-dependent technology due to mandatory, non-automated, on-site tasks such as formwork assembly, rebar placement, and curing periods. Cost vulnerability peaks noticeably at the maximum loads.
The sensitivity analysis of global warming price (CGW) escalation was conducted to test the economic resilience of the beam structures against increasing environmental carbon taxes (see Table 15). When evaluating the increase from the baseline to a 100-fold-higher carbon tax, the materials exhibit starkly different behaviors. Timber beams prove highly cost resilient, with total cost increases of only +137.2% to +199.6%. Conversely, the cost of RC beams increases significantly, ranging between +377.9% and +637.5%, severely crippling their cost competitiveness. Steel beams demonstrate high sensitivity to CGW increases, with total costs rising between +290.8% and +457.1% (with maximum vulnerability at S3–L3).
Table 15.
Sensitivity analysis of global warming price (CGW) escalation: percentage cost deviations.
Crossover thresholds for the optimal–cheapest beam material: While RC beams maintain complete optimal cost dominance under baseline market parameters, high environmental taxes prompt material switches. In this case timber beams may become cheaper than RC beams. Table 16 shows which beam material is the absolute cheapest at each threshold. Because of its superior carbon-sequestration properties and minimal dead weight, timber displaces RC beams under low loads (L1). This occurs first at long spans (S3–L1) under a mild 10-fold CGW, and extends to short and medium spans (S1–L1, S2–L1) at a 25-fold CGW. Under medium loads (L2), timber is cheapest for long spans (S3–L2) at a 50-fold CGW and for medium spans (S2–L2) at a 100-fold CGW. Under high load conditions (L3), concrete remains unbeatable across all span variations.
Table 16.
Compressed material dominance matrix (CGW sensitivity): the cheapest beam material.
Crossover thresholds for the worst–most expensive beam material: Table 17 shows which material is the most expensive at each threshold. Under standard baseline conditions, the peak total cost alternates between steel and timber depending on the span geometry. However, tracking the escalation to a 25-fold CGW at the heaviest cross-section (S3–L3) reveals a clear material inversion: structural steel overtakes timber and becomes the most expensive solution. From a 50-fold carbon tax threshold onward, structural steel consistently remains the least viable financial option across all nine span-load thresholds.
Table 17.
Compressed material dominance matrix (CGW sensitivity): the most expensive beam material.
Because the CGW values mentioned are very high, the sensitivity analysis of global warming cost escalation indicates that a significant change in the competitiveness of beam materials due to an increase in the price of global warming is unlikely in the near future. Nevertheless, CO2 emission costs of all materials will increase in the future, consequently raising the total costs of beam production.
4. Discussion
The structural, economic, and environmental optimization of beams highlights a critical trade-off between baseline manufacturing costs and carbon footprint sustainability. Under current market conditions (the baseline scenario), reinforced concrete (RC) beams clearly dominate total costs across almost all span-load configurations. On average, glued laminated timber (glulam) and steel beams are 2.3 and 2.8 times more expensive than RC beams, respectively. The only narrow exception occurs within short spans (≤7.5 m) and low loads (≤10 kN/m1), where sawn timber becomes the most economical option, undercutting RC by 9.5%.
However, evaluating structures solely on baseline financial cost obscures their environmental impact. When assessing manufacturing sustainability, glulam and sawn timber beams exhibit superior carbon profiles. Steel beams generate three times higher CO2 emissions than timber, while RC beams emit 1.8 times more than timber on average. Despite these stark ecological differences, CO2 emission costs currently account for a negligible fraction of total optimal structural costs—averaging just 3.8% across all variants (1.7% for timber, 4% for steel, and 5.8% for RC). This imbalance explains why ecologically damaging structures remain the default market choice under baseline pricing.
The multi-parameter sensitivity analysis exposes the distinct economic vulnerabilities of each material and outlines the market dynamics required to encourage sustainable timber construction. Material price fluctuations of ±30% reveal that timber and steel exhibit load-dependent cost sensitivity; their total cost sensitivity escalates at larger scales (up to 15.7% for timber and up to 20.8% for steel). Conversely, RC shows an inverse cost-sensitivity trend, becoming more resilient to material price shocks at larger structural scales (dropping to +2.8% deviation at S3–L3). The primary economic vulnerability of RC lies in its high dependence on manual, non-automated on-site labor (formwork, rebar placement, curing). Increasing labor costs from 25 €/h to 50 €/h triggers a massive total cost increase for RC beams—between +46.4% and +66.3%. In stark contrast, timber and steel structures are highly prefabricated, showing minimal vulnerability to labor rate hikes (maximums of +9.1% and +25.7%, respectively). Consequently, regions with high labor costs inherently diminish the cost competitiveness of concrete.
The most transformative changes occur under simulated global warming price (CGW) escalations, which act as a direct carbon tax. Timber beams possess exceptional carbon-tax resilience, experiencing a maximum cost increase of only +199.6% even under an extreme 100-fold CGW scenario. Meanwhile, RC costs skyrocket by up to +637.4%, and steel costs rise by up to +457.1%. These varying tax responses trigger critical crossover thresholds where timber replaces RC as the absolute cheapest material. Because of its light dead weight and high carbon sequestration, timber breaks RC’s monopoly first at low loads (10 kN/m1). It achieves dominance at long spans under a mild 10-fold CGW tax, expanding to short and medium spans at a 25-fold tax. At medium loads (20 kN/m1), timber becomes the cheapest material at a 50-fold tax for long spans and at a 100-fold tax for medium spans. Under heavy structural loads (30 kN/m1), however, RC’s structural capacity remains unmatched, securing its financial dominance across all tax scenarios.
Conversely, tracking the “worst-case” financial choice under carbon tax escalation reveals a major shift for structural steel. Under baseline conditions, the peak total cost alternates between steel and timber depending on span geometry. However, at a 25-fold CGW escalation at the heaviest cross-section, at the longer span and under higher loads (at 15 m and 30 kN/m1), a clear material inversion occurs: structural steel overtakes timber and becomes the most expensive solution. From a 50-fold carbon tax threshold onward, structural steel consistently remains the least financially viable option across all nine span-load thresholds.
Because these simulated CGW values are very high, a drastic near-future change in material competitiveness solely due to global warming pricing is unlikely. Nevertheless, as CO2 emission costs inevitably rise, total beam production costs will increase across all materials, demanding greater industrial efficiency and structural optimization.
5. Conclusions
This paper presents the competitive ranges of timber, steel, and reinforced concrete beams, determined through multi-parameter cost optimization that includes CO2 emission costs. The latter are associated with beam production, but not with transport, maintenance, repair, demolition, or recycling, which are not considered. Simply supported beams subjected to self-weight and uniform imposed loads were analyzed. Timber and concrete beams were designed with rectangular cross-sections, while steel beams were designed as welded I-sections. Mixed-integer non-linear programming (MINLP) was used for discrete optimization, considering direct optimization of standard dimensions and material grades. Three optimization models and objective functions were defined, including material, energy, labor, and CO2 emission costs. Eurocode-based constraints were modeled. The multi-parameter MINLP optimization was performed for various spans, loads, material grades, and discrete dimensions. The results were used to develop comparative diagrams and to address the posed questions.
A multi-parameter sensitivity analysis of the optimal beam configurations was performed for fluctuations in material unit prices and labor hourly rates, as well as for escalations in global warming prices (CGW).
The following key limitations were adopted in the multi-parameter optimization and sensitivity analysis:
- Standards and design codes: The study is based on Eurocode specifications. Applying other standards (such as US, Japanese, or Chinese codes) may change the structural dimensions, materials, and costs, while the underlying optimization methodology remains universally applicable;
- Economic input data: The results rely on material unit prices and labor rates from Central Europe. Variations in regional market prices and labor costs will change the absolute costs but can be accommodated by using region-specific data;
- Impact of cost definitions: The objective functions are defined strictly in terms of initial manufacturing inputs, including material, energy, labor, and global warming costs. Expanding the optimization scope to include service life costs or comprehensive life-cycle costs (LCC) would shift the cost balance and could alter the final optimization outcomes;
- Environmental input data: The calculations incorporate global warming prices (CGW) and carbon footprint emission factors for material use in Central Europe. Although the results will differ, the methodology allows adjustment to reflect other geographical and environmental data.
When analyzing the results of the multi-parameter optimization and sensitivity analysis, the following key findings were identified:
- Competitive ranges of beam materials: Spans and loads are determined where timber, steel, or concrete are most economical (via MINLP cost optimization, including CO2 taxation);
- Concrete baseline superiority: Reinforced concrete remains the most cost-effective beam material across nearly all spans and loads under standard market conditions;
- Timber’s economic threshold: Sawn timber outperforms concrete economically (by 9.5%) only within a narrow range of short spans (7.5 m) and low loads (10 kN/m1);
- High cost barriers: On average, glulam and steel beams are 2.3 and 2.8 times more expensive than concrete;
- Timber’s ecological dominance: Wood options yield the lowest manufacturing footprint, whereas steel and concrete generate 3 and 1.8 times more CO2 emissions, respectively;
- Negligible carbon pricing: CO2 emission costs account for only a small share of total structural costs, averaging 3.8%;
- Compressed material dominance matrices: The absolute cheapest and most expensive beam materials are mapped across different span-load and carbon tax scenarios (via sensitivity analysis);
- Opposing material price elasticities: Concrete becomes more cost resilient to material price shocks at larger scales, whereas timber and steel exhibit heightened cost volatility;
- Concrete labor vulnerability: Concrete production is heavily penalized by rising labor rates, increasing total costs by up to 66.3% due to mandatory on-site operations;
- Carbon tax resilience: Timber features superior cost resilience under extreme carbon tax scenarios, whereas concrete costs increase by up to 637.4%;
- Market dominance crossover: High carbon taxes successfully break concrete’s monopoly, making timber the cheapest option for low-to-medium load applications;
- Steel’s financial unviability: Beyond a 50-fold global warming cost escalation, structural steel consistently becomes the most expensive and least viable structural option across all configurations;
- Delayed carbon pricing impact: Because the simulated global warming costs are exceptionally high, a drastic near-future shift in material competitiveness driven solely by carbon pricing remains unlikely;
- Carbon tax incentive gap: Current global warming pricing is too low to influence material selection.
Nevertheless, as the cost of global warming is expected to rise due to the rapid warming of the Earth’s atmosphere, accounting for CO2 emissions will become increasingly important in future structural design.
Author Contributions
Conceptualization, S.K.; methodology, S.K. and T.Ž.; software, S.K. and T.Ž.; validation, S.K. and T.Ž.; formal analysis, S.K. and T.Ž.; investigation, S.K. and T.Ž.; resources, S.K. and T.Ž.; data curation, T.Ž.; writing—original draft preparation, S.K.; writing—review and editing, S.K. and T.Ž.; visualization, S.K. and T.Ž.; supervision, S.K. and T.Ž. All authors have read and agreed to the published version of the manuscript.
Funding
This research was supported by the Slovenian Research and Innovation Agency (ARIS), national research program P2-0129.
Data Availability Statement
Data will be made available on request.
Conflicts of Interest
The authors declare no conflicts of interest.
Abbreviations
The following abbreviations are used in this manuscript:
| CGW | Price of global warming |
| LCC | Life-cycle costs |
| MINLP | Mixed-integer non-linear programming |
| MILP | Mixed-integer linear programming |
| NLP | Non-linear programming |
| DMM | Decision-making method |
| ASD | Allowable strength design method |
| FEM | Finite element method |
| GAMS | General Algebraic Modeling System |
| OA/ER | Outer-approximation and equality-relaxation algorithm |
| RC | Reinforced concrete |
Appendix A
Table A1.
Input data for the objective function of the timber beam.
Table A2.
Input data for the objective function of the steel beam.
Table A3.
Input data for the objective function of the reinforced concrete beam.
Table A4.
Input data for the constraints of all optimization models.
Table A5.
Input data for the model constraints of the timber beam.
Table A6.
Input data for the model constraints of the steel beam.
Table A7.
Input data for the model constraints of the reinforced concrete beam.
References
- Surit, S.; Wethyavivorn, B. Topology optimization of reinforced concrete beams by a spread-over reinforcement model with fixed grid mesh. Songklanakarin J. Sci. Technol. 2011, 33, 95–100. [Google Scholar]
- Mela, K.; Heinisuo, M. Weight and cost optimization of welded high strength steel beams. Eng. Struct. 2014, 79, 354–364. [Google Scholar] [CrossRef] [Scilit]
- Bru, D.; Varona, F.B.; Ivorra, S.; Baeza, F.J. Structural optimization of timber beams with composite materials. WIT Trans. Built Environ. 2015, 168, 595–606. [Google Scholar] [CrossRef] [Scilit]
- Mayencourt, P.L.; Giraldo, J.S.; Wong, E.; Mueller, C.T. Computational Structural Optimization and Digital Fabrication of Timber Beams. In Proceedings of the IASS Annual Symposium 2017 “Interfaces: Architecture. Engineering. Science”, Hamburg, Germany, 25–28 September 2017. [Google Scholar]
- Markandeya Raju, P.; Manasa, A.; Rohini, G. Cost optimization of a rectangular singly reinforced concrete beam by Generalized Reduced Gradient method. IOP Conf. Ser. Mater. Sci. Eng. 2021, 1025, 012005. [Google Scholar] [CrossRef] [Scilit]
- Mohammedali, T.K.; Mohammed, A.H.; Khalaf, R.D.; Sammen, S.S. Finite Element Model for the Optimization of Steel I-Beam with Variable Depth. IOP Conf. Ser. Mater. Sci. Eng. 2021, 1076, 012100. [Google Scholar] [CrossRef] [Scilit]
- Fiorotti, K.M.; Silva, G.F.; Calenzani, A.F.G.; Alves, É.C. Optimization of steel beams with external pretension, considering the environmental and financial impact. Asian J. Civ. Eng. 2023, 24, 3331–3344. [Google Scholar] [CrossRef] [Scilit]
- Izhar, T.; Ahmad, S.A.; Mumtaz, N. Multiobjective design optimization of reinforced concrete beam coupled with market practice based constructability function using simulated annealing. Asian J. Civ. Eng. 2024, 25, 3901–3914. [Google Scholar] [CrossRef] [Scilit]
- Szeptyński, P.; Jasińska, D.; Mikulski, L. Shape Optimization and Experimental Investigation of Glue-Laminated Timber Beams. Materials 2024, 17, 6263. [Google Scholar] [CrossRef] [Scilit] [PubMed]
- So, J.; Lee, S.; Seong, J.; Lee, D. The Optimal Cost Design of Reinforced Concrete Beams Using an Artificial Neural Network—The Effectiveness of Cost-Optimized Training Data. Buildings 2025, 15, 1577. [Google Scholar] [CrossRef] [Scilit]
- de Castro, D.C.; Mendes, J.C.; Krahl, P.A.; Ribeiro, P.O. Optimization of the reinforced concrete beam with UHPFRC with a focus on reducing CO2 emissions. IOP Conf. Ser. Earth Environ. Sci. 2025, 1536, 012037. [Google Scholar] [CrossRef] [Scilit]
- Keintjem, M.; Suwondo, R.; Razak, H.; Altaee, M. Strength and Serviceability in Steel Beam Design: A Comparative Study of ASD and LRFD. IOP Conf. Ser. Earth Environ. Sci. 2025, 1564, 012032. [Google Scholar] [CrossRef] [Scilit]
- Yang, J.; Wadee, M.A.; Gardner, L. Strengthening of steel I-section beams by wire arc additive manufacturing—Concept and experiments. Eng. Struct. 2025, 322, 119113. [Google Scholar] [CrossRef] [Scilit]
- Zhang, Z.; Xie, T.Y.; Zhao, X.Y. Torsional behavior of ultra-high-performance fiber-reinforced concrete beams: Testing, modeling and design recommendation. J. Build. Eng. 2025, 112, 113885. [Google Scholar] [CrossRef] [Scilit]
- Galano, S.; Losanno, D.; Parisi, F.; Scalvenzi, M. Experimental investigation on flexural response of post-tensioned concrete girders strengthened with near-surface mounted carbon fiber reinforced polymers. Constr. Build. Mater. 2026, 531, 146580. [Google Scholar] [CrossRef] [Scilit]
- Taher, J.; Molod, M.A.; Daraei, A. Comparative Performance of Reinforced Concrete Beams Strengthened with Shape Memory Alloys and CFRP Using an Equivalent Stiffness Approach. J. Compos. Sci. 2026, 10, 349. [Google Scholar] [CrossRef] [Scilit]
- Datsiuk, V.; Homon, S.; Lukianenko, O.; Gomon, S.; Puhach, Y.; Gomon, P.; Kis, N.; Kutsyna, I. Structural performance of timber beams after long-term service: An experimental study. Procedia Struct. Integr. 2026, 81, 73–77. [Google Scholar] [CrossRef] [Scilit]
- Sapkota, S.C.; Panagiotakopoulou, C.; Dahal, D.; Beskopylny, A.N.; Dahal, S.; Asteris, P.G. Optimizing high-strength concrete compressive strength with explainable machine learning. Multiscale Multidiscipliary Model. Exp. Des. 2025, 8, 160. [Google Scholar] [CrossRef] [Scilit]
- Radgolchin, M.; Awtar, S. A New Class of Single-Degree-of-Freedom Compliant Mechanisms with Optimal Bearing Characteristics. ASME J. Mech. Des. 2026, 148, 103304. [Google Scholar] [CrossRef] [Scilit]
- Luo, J.; Tang, P.; Zhu, S.; Zhai, W. Towards an optimal geometric profile of high-speed railway fastening clips with high-frequency fatigue resistance. Thin-Walled Struct. 2026, 226, 114967. [Google Scholar] [CrossRef] [Scilit]
- Merta, I.; Kravanja, S.; Klanšek, U. Optimization based cost comparison between reinforced concrete and steel beams. In High Performance Structures and Materials, Proceedings of the Fourth International Conference on High Performance Structures and Materials, Algarve, Portugal, 13–15 May 2008; WIT Press: Southampton, UK, 2008; pp. 449–456. [Google Scholar]
- Hassan, O.A.B.; Johansson, C. Glued laminated timber and steel beams. A comparative study of structural design, economic and environmental consequences. J. Eng. Des. Technol. 2018, 16, 398–417. [Google Scholar] [CrossRef] [Scilit]
- Ozimboski, J.M.; Pravia, Z.M.C.; Kripka, M. Optimization of Reinforced Concrete Beams and Steel Beams: A Comparative Study. Int. J. Struct. Glass Adv. Mater. Res. 2020, 4, 160–167. [Google Scholar] [CrossRef] [Scilit]
- Kripka, M.; Mezzomo, K.; Pravia, Z.C. Multicriteria decision-making method applied to optimized reinforced concrete, steel and wood beams. Exacta 2022, 22, 880–898. [Google Scholar] [CrossRef] [Scilit]
- Bahrami, A.; Azizian, D. Assessment of Glulam and Reinforced Concrete Beams in Multi-Storey Building. Civ. Environ. Eng. 2022, 18, 66–75. [Google Scholar] [CrossRef] [Scilit]
- Oh, J.W.; Pang, S.J.; Ahn, K.S.; Oh, J.K. A structural-member level assessment of the environmental impact of timber, reinforced concrete and steel in building construction. In Proceedings of the World Conference on Timber Engineering (WCTE 2023), Oslo, Norway, 19–22 June 2023; pp. 989–994. [Google Scholar] [CrossRef] [Scilit]
- Bogataj, M.; Čuček, L.; Žula, T.; Kravanja, S.; Kravanja, Z. Sustainable synthesis and optimization of engineering systems. In High Performance and Optimum Design of Structures and Materials III, Proceedings of the Third International Conference on High Performance and Optimum Design of Structures and Materials (HPSM/OPTI 2018), Ljubljana, Slovenia, 11–13 July 2018; WIT Transactions on the Built Environment (Online): Southampton, UK, 2018; Volume 175, pp. 185–194. [Google Scholar]
- Žula, T.; Kravanja, S. Sustainability profit generated by the optimization of continuous beams. In Proceedings of the 2nd International Conference on Technologies & Business Models for Circular Economy: Conference Proceedings (TBMCE 2019), Portorož, Slovenia, 24–25 October 2019. [Google Scholar]
- Žula, T.; Kravanja, S.; Jelušič, P. Sustainability profit gained by the optimized clamped beams. In Proceedings of the 3rd International Conference on Technologies & Business Models for Circular Economy: Conference proceedings (TBMCE 2021), Portorož, Slovenia, 13–15 September 2021. [Google Scholar]
- Kocis, G.R.; Grossmann, I.E. Relaxation Strategy for the Structural Optimization of Process Flowsheets. Ind. Eng. Chem. Res. 1987, 26, 1869–1880. [Google Scholar] [CrossRef] [Scilit]
- Kravanja, Z.; Grossmann, I.E. New Developments and Capabilities in PROSYN—An Automated Topology and Parameter Process Synthesizer. Comput. Chem. Eng. 1994, 18, 1097–1114. [Google Scholar] [CrossRef] [Scilit]
- Kravanja, S.; Kravanja, Z.; Bedenik, B.S. The MINLP optimization approach to structure synthesis, Part I: A general view on simultaneous topology and parameter optimization. Int. J. Numer. Methods Eng. 1998, 43, 263–292. [Google Scholar] [CrossRef] [Scilit]
- EN 1995-1-1:2004; Eurocode 5. Design of Timber Structures. European Committee for Standardization: Brussels, Belgium, 2004.
- EN 1993-1-1:2005; Eurocode 3. Design of Steel Structures. European Committee for Standardization: Brussels, Belgium, 2005.
- EN 1992-1-1:2004; Eurocode 2. Design of Concrete Structures. European Committee for Standardization: Brussels, Belgium, 2004.
- Brooke, A.; Kendrick, D.; Meeraus, A. GAMS—A User’s Guide; Scientific Press: Redwood City, CA, USA, 1988. [Google Scholar]
- Klanšek, U.; Kravanja, S. Cost estimation, optimization and competitiveness of different composite floor systems—Part 1: Self-manufacturing cost estimation of composite and steel structures. J. Constr. Steel Res. 2006, 62, 434–448. [Google Scholar] [CrossRef] [Scilit]
- Klanšek, U.; Kravanja, S. Cost estimation, optimization and competitiveness of different composite floor systems—Part 2: Optimization based competitiveness between the composite I beams, channel-section and hollow-section trusses. J. Constr. Steel Res. 2006, 62, 449–462. [Google Scholar] [CrossRef] [Scilit]
- Kravanja, S.; Žula, T.; Klanšek, U. Multi-parametric MINLP optimization study of a composite I beam floor system. Eng. Struct. 2017, 130, 316–335. [Google Scholar] [CrossRef] [Scilit]
- Jelušič, P.; Kravanja, S. Optimal design and competitive spans of timber floor joists based on multi-parametric MINLP optimization. Materials 2022, 15, 3217. [Google Scholar] [CrossRef] [Scilit] [PubMed]
- Kravanja, S.; Žula, T. Optimization of a single-storey timber building structure. Int. J. Comput. Methods Exp. Meas. 2021, 9, 126–140. [Google Scholar] [CrossRef] [Scilit]
- WolframAlpha Computational Intelligence. Available online: https://www.wolframalpha.com/ (accessed on 13 February 2020).
- Vratuša, S.; Premrov, M. Projektiranje lesenih konstrukcij. In Projektiranje Gradbenih Konstrukcij po Evrokod Standardih; Inženirska Zbornica Slovenije: Ljubljana, Slovenia, 2009; pp. 5/1–5/117. [Google Scholar]
- Subotić, P.; Lučić, D. Overview of the methods for calculating elastic critical LTB moment. In Proceedings of the 7th International Conference Contemporary Achievements in Civil Engineering, Subotica, Serbia, 23–24 April 2019; pp. 371–379. [Google Scholar] [CrossRef] [Scilit]
- Žula, T.; Kravanja, S.; Klanšek, U. MINLP optimization of a composite I beam floor system. Steel Compos. Struct. 2016, 22, 1163–1192. [Google Scholar] [CrossRef] [Scilit]
- Girija, K.; Menon, D. Reduction in flexural strength in rectangular RC beams due to slenderness. Eng. Struct. 2011, 33, 2398–2406. [Google Scholar] [CrossRef] [Scilit]
- Kravanja, Z. Challenges in sustainable integrated process synthesis and the capabilities of an MINLP process synthesizer MipSyn. Comput. Chem. Eng. 2010, 34, 1831–1848. [Google Scholar] [CrossRef] [Scilit]
- Grossmann, I.E.; Viswanathan, J. DICOPT—Discrete and Continuous Optimizer; Engineering Design Research Center (EDRC) at Carnegie Mellon University: Pittsburgh, PA, USA, 2002. [Google Scholar]
- Drudd, A.S. CONOPT—A Large-Scale GRG Code. ORSA J. Comput. 1994, 6, 207–216. [Google Scholar]
- GAMS24.8. GAMS/Cplex, CPLEX 20.1. GAMS, Solver Manuals. GAMS: Frechen, Germany, 2021. Available online: https://www.gams.com/latest/docs/S_CPLEX.html (accessed on 29 May 2021).
- The Concept, Structure, and Midpoint Tables of the Eco-Costs for LCA. Sustainability Impact Metrics, a Spin-Off of the Delft University of Technology, 2022. Available online: https://www.ecocostsvalue.com/ecocosts/eco-costs-concept/ (accessed on 14 March 2023).

Disclaimer/Publisher’s Note: The statements, opinions and data contained in all publications are solely those of the individual author(s) and contributor(s) and not of MDPI and/or the editor(s). MDPI and/or the editor(s) disclaim responsibility for any injury to people or property resulting from any ideas, methods, instructions or products referred to in the content. |
© 2026 by the authors. Licensee MDPI, Basel, Switzerland. This article is an open access article distributed under the terms and conditions of the Creative Commons Attribution (CC BY) license.