1. Introduction
Deep excavation engineering constitutes a critical stage in the construction of buildings and underground structures, playing a vital role in ensuring both construction quality and safety [
1,
2,
3,
4,
5,
6,
7]. In particular, large-scale excavations are increasingly adopted in projects such as urban utility tunnels, metro systems, and large urban complexes [
8,
9,
10,
11,
12]. Over the past few decades, urban infrastructure worldwide has undergone substantial renewal and expansion, and excavation works for underground structures have exhibited trends toward larger scale, greater depth, and longer excavation lengths. These developments have posed new and more demanding challenges for deep excavation and support systems technologies [
13,
14,
15,
16].
The environmental impacts induced by deep excavation have attracted increasing attention. With the growing number of large-scale deep excavations carried out in densely built urban areas, excavation activities inevitably induce deformation in the surrounding soil, which in turn leads to displacement of adjacent existing structures. During the construction of large deep excavations, the monitoring, prediction, and control of small displacements have become key technical issues for ensuring construction safety, optimizing support system design, and mitigating environmental impacts. These issues also represent an important research direction in deep excavation engineering.
Three primary research approaches have been widely adopted to investigate soil deformation induced by deep excavation: theoretical analysis [
17,
18,
19,
20,
21,
22], numerical simulation [
23,
24,
25,
26,
27], and field measurements [
28,
29,
30,
31,
32], forming a multidimensional research framework. Theoretical analysis is a classical research method in which mathematical models are established by quantifying the interaction mechanisms between the soil and the structure, thereby enabling the estimation of excavation-induced deformation and internal stresses. Li et al. [
33] proposed a three-dimensional analytical method for calculating ground settlement induced by excavation based on the isotropic elastic half-space theory that considers the non-uniform convergence mode of the retaining wall. The method effectively captures the influence of excavation size and the three-dimensional distribution of retaining wall deformation on ground settlement. Han et al. [
34], based on an improved Coulomb earth pressure theory, introduced the concepts of a spatial influence factor and a plane strain ratio, and developed a three-dimensional earth pressure calculation method associated with flexible retaining wall displacement that accounts for spatial effects, layered clay, and seepage. Zheng et al. [
35], based on the superposition principle of soil loss in a half-space medium, proposed an analytical method capable of predicting soil displacements at both the ground surface and subsurface induced by excavation in sand and clay.
With the advancement of computational technology, numerical simulation techniques have been widely applied in geotechnical engineering research, enabling the intuitive visualization of stress–deformation distributions in elastoplastic analyses and multiphysical field analyses. Shi et al. [
36], through field monitoring and three-dimensional numerical simulations, investigated the deformation characteristics of the ground surface and structures induced by the excavation of a large-scale deep excavation supported by double circular internal bracing in heterogeneous soft soil strata. Ge et al. [
37] calibrated the parameters of the Modified Cam-Clay constitutive model for Nanjing floodplain soft soil through laboratory tests and, in combination with field monitoring and three-dimensional numerical simulations, systematically analyzed the spatiotemporal evolution of retaining structure deformation, ground settlement, column heave, and pipeline settlement during the excavation of a large and deep excavation. Zhang et al. [
38] employed three-dimensional numerical analysis to reveal the deformation control mechanism of deep excavations in soft clay reinforced with jet grouting piles, demonstrating that increasing the reinforcement area and reducing the pile spacing can significantly decrease wall deformation and axial forces in the supports.
At engineering sites, continuous deformation monitoring plays an irreplaceable role in revealing the evolution characteristics of excavation-induced deformation and in guiding engineering practice. This is particularly important for representative projects with significant technical challenges and limited precedent, in which such monitoring enables the timely identification of critical engineering issues and potential safety hazards arising from insufficient consideration in design and construction. Xu et al. [
39] investigated the behavior of a 77.3 m deep circular excavation through field monitoring and computational methods. They found that the excavation transformed the diaphragm walls into an elliptical cylinder shape, with 3D methods proving more accurate than 2D approaches. Hensman et al. [
40] present monitoring data of a 12 m deep excavation supported by a combi-wall cofferdam in soft clays and peats, quantifying how vibratory piling increased wall displacements by up to 111% and establishing that temperature-induced axial loads accounted for a significant proportion of prop loads. Masini et al. [
41] document the performance of a 30 m deep top-down excavation adjacent to the ancient Aurelian Walls, demonstrating that a stiff retaining system limited maximum wall displacement to just 0.1% of excavation height, with the ancient structures undergoing negligible tilting of only 0.014°. Han et al. [
42] analyzed field data from a deep excavation in soft clay and numerically investigated the protecting effects of partition walls. They found that partition walls can reduce maximum wall displacement by up to 50% and building settlement by up to 67%, with optimal design parameters recommended for historical building protection. Although previous studies have achieved considerable progress in understanding structural and soil deformations induced by deep excavation, research on narrow-strip metro station excavations in coastal soft soil regions with excavation depths exceeding 35 m and five underground levels remains limited. Consequently, systematic understanding of excavation-induced deformation characteristics for such conditions is still insufficient.
Based on field monitoring data, this study conducts a staged deformation analysis of the entire excavation process of a 38 m ultra-deep excavation. The spatiotemporal deformation responses of the diaphragm wall, columns, adjacent ground surface, and nearby buildings are systematically characterized. A series of empirical relationships describing excavation-induced structural and environmental deformations are established, and the staged development characteristics are quantified, providing references for similar engineering projects.
2. Project Overview
The ultra-deep excavation of the station on Tianjin Metro Line 8 is located in a densely built-up urban area of Tianjin, China. The excavation has a plan dimension of 156.1 m × (27.3–29.4) m, with a maximum excavation depth of 38.3 m (36.65 m for the standard section), which is approximately equivalent to the height of a 13-story building. This station is not only the deepest metro station currently under construction in Tianjin but also the deepest metro station constructed to date in soft soil regions of China.
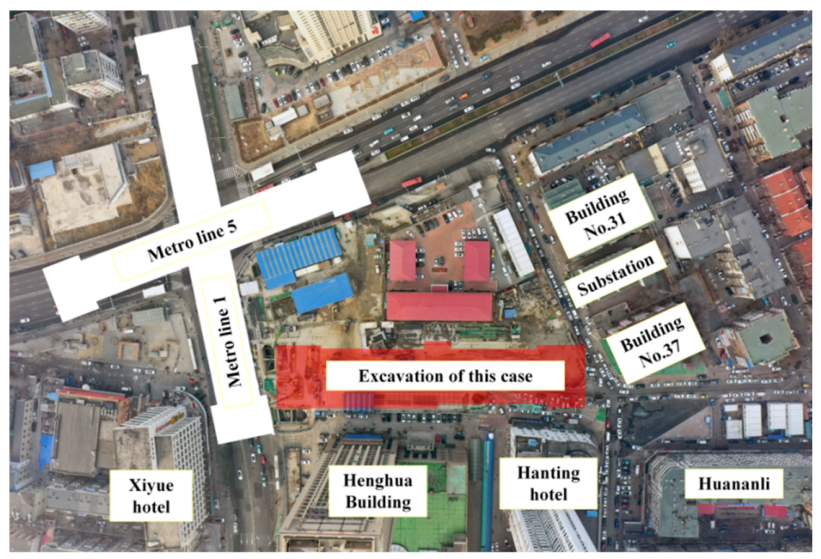
As a major interchange hub, the station is situated on the east side of the intersection of Dagunan Road and Qiongzhou Road. It is linearly arranged along Qiongzhou Road in the east–west direction and forms an interchange system with the existing station on Metro Lines 1 and 5. The surrounding environment is highly complex, with densely distributed buildings. Several adjacent structures are located on the eastern and southern sides of the excavation. On the east side are Buildings No. 31 and No. 37 on Minhou Road and a 35 kV substation, while Henghua Building and Hanting Hotel are located on the south side. The closest structure to the excavation is the Huananli residential building, a six-story masonry building with a raft foundation, at a minimum distance of only 7.8 m from the excavation boundary. Therefore, during the construction of this ultra-deep excavation, strict control of excavation-induced deformation and its impact on adjacent buildings is of critical importance, posing significant technical challenges. The layout of the excavation and the surrounding environment is shown in
Figure 1, and the heights and foundation types of the surrounding buildings are shown in
Table 1.
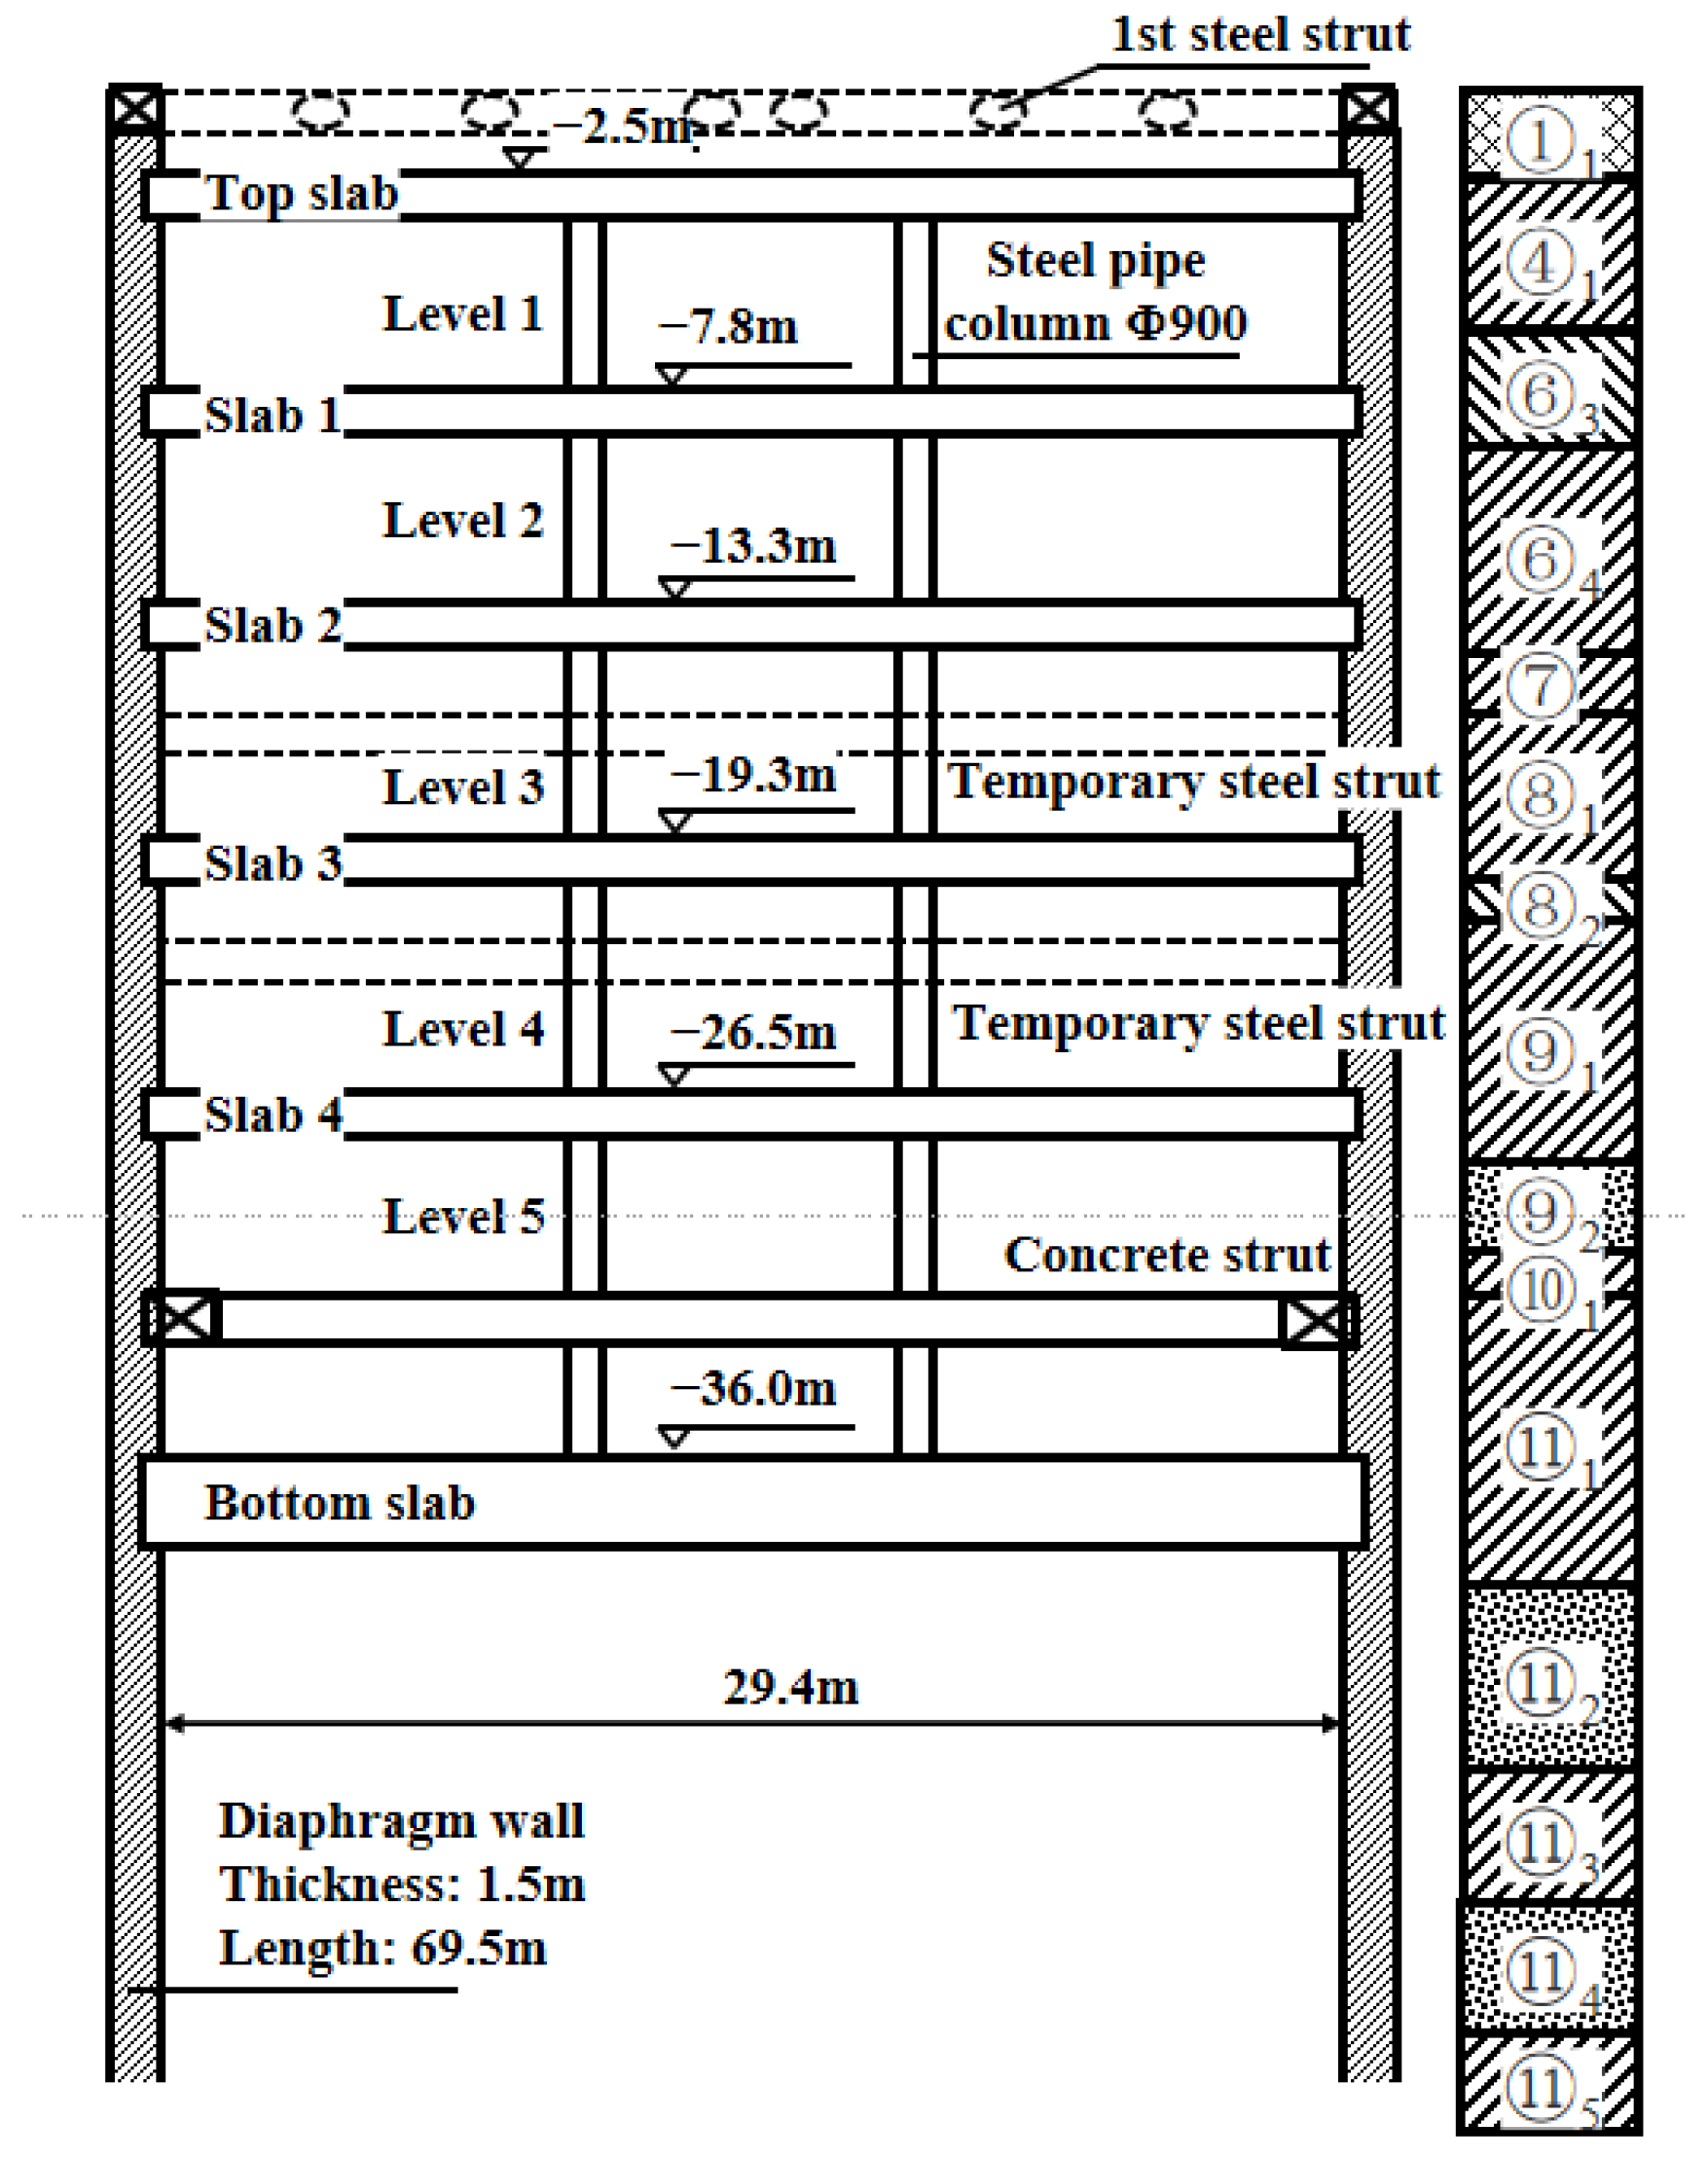
The retaining system of the main excavation primarily consists of diaphragm walls with a thickness of 1.4 m. In the section adjacent to the Minhou Road residential building No. 37 at the east end, the diaphragm wall thickness increases to 1.5 m. The maximum embedded depth of the diaphragm wall reaches 69.5 m. The excavation is constructed using the top-down method, in which the permanent floor slabs of the station structure also serve as the internal bracing system. In the standard section, the top slab is 0.8 m thick, the slabs at levels 1 to 4 are 0.4 m thick, and the bottom slab is 1.6 m thick.
At the west end shaft, two levels of temporary steel struts with a diameter of Φ800 mm are installed at levels 3 and 4. One additional level of temporary steel struts is provided at level 2 at the east end shaft. All temporary steel struts are removed during the construction of the sidewalls. At level 5, a reinforced concrete strut with a cross-section of 1300 mm × 1100 mm is installed and then dismantled after the completion of the bottom slab casting. The detailed cross-section of the support system is shown in
Figure 2.
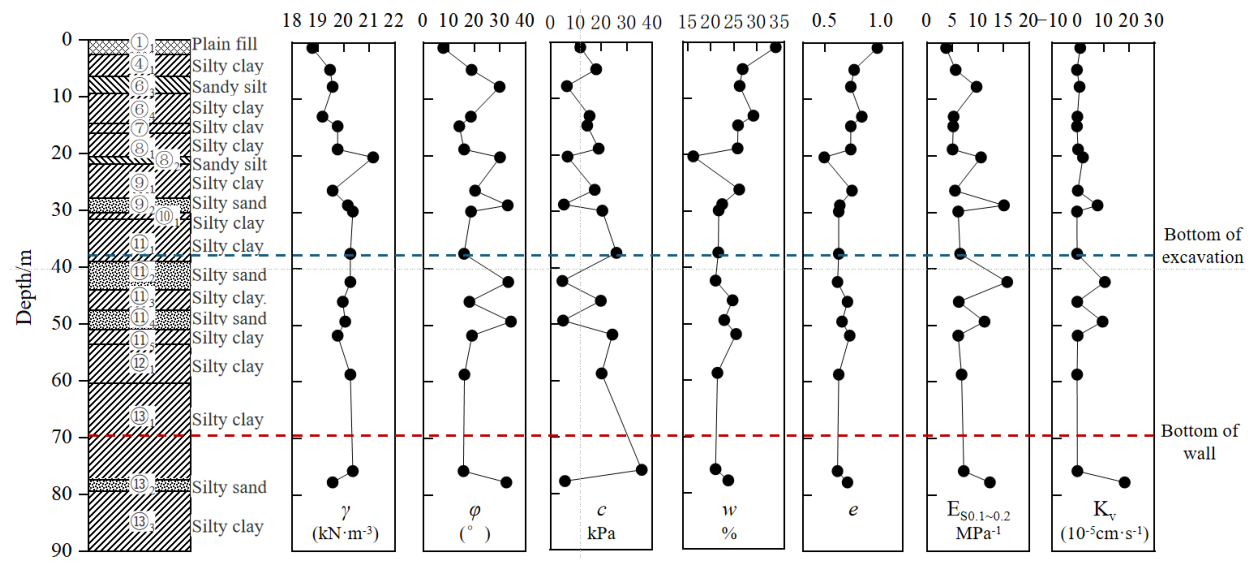
The excavation site is located in a coastal plain with generally flat terrain. The basic physical and mechanical parameters of the soil layers are presented in
Figure 3. The base of the excavation is situated in Stratum ⑪
1, while the toe of the diaphragm wall is embedded in Stratum ⑬
1. The discussion of different soil layer characteristics and their engineering implications is presented in
Table 2.
Although detailed OCR data were unavailable for all soil layers, the soft clay deposits generally exhibited normally consolidated to lightly overconsolidated behavior, consistent with regional Tianjin soft soil conditions. The subsurface profile comprises soft clay and silty clay sequences typical of the Tianjin coastal plain, with shallow groundwater leading to high natural water content and low effective stress in the upper layers. These soft clays, characterized by high compressibility, low permeability, and low undrained shear strength, are highly sensitive to excavation-induced stress relief, meaning that their behavior is primarily governed by lateral wall deformation and ground settlement. Slow excess pore pressure dissipation induces time-dependent consolidation effects. Deeper clay layers, with higher stiffness and strength, enhance basal stability and resist excessive wall movement, whereas sandy silt interlayers, with higher permeability, facilitate drainage and pore pressure redistribution, influencing excavation system deformation. Overall, the observed wall deformation, column heave, and ground settlement are closely related to the combined effects of high compressibility, low undrained shear strength, and consolidation characteristics of the soft clay deposits.
To facilitate a more efficient and systematic analysis of the subsequent deformation monitoring results, the entire excavation process is divided into six typical construction stages according to the distinctive characteristics of each phase. This classification aims to clearly identify the key nodes and state transitions during the excavation. The detailed definition of these stages is presented in
Table 3.
3. Monitoring Scheme
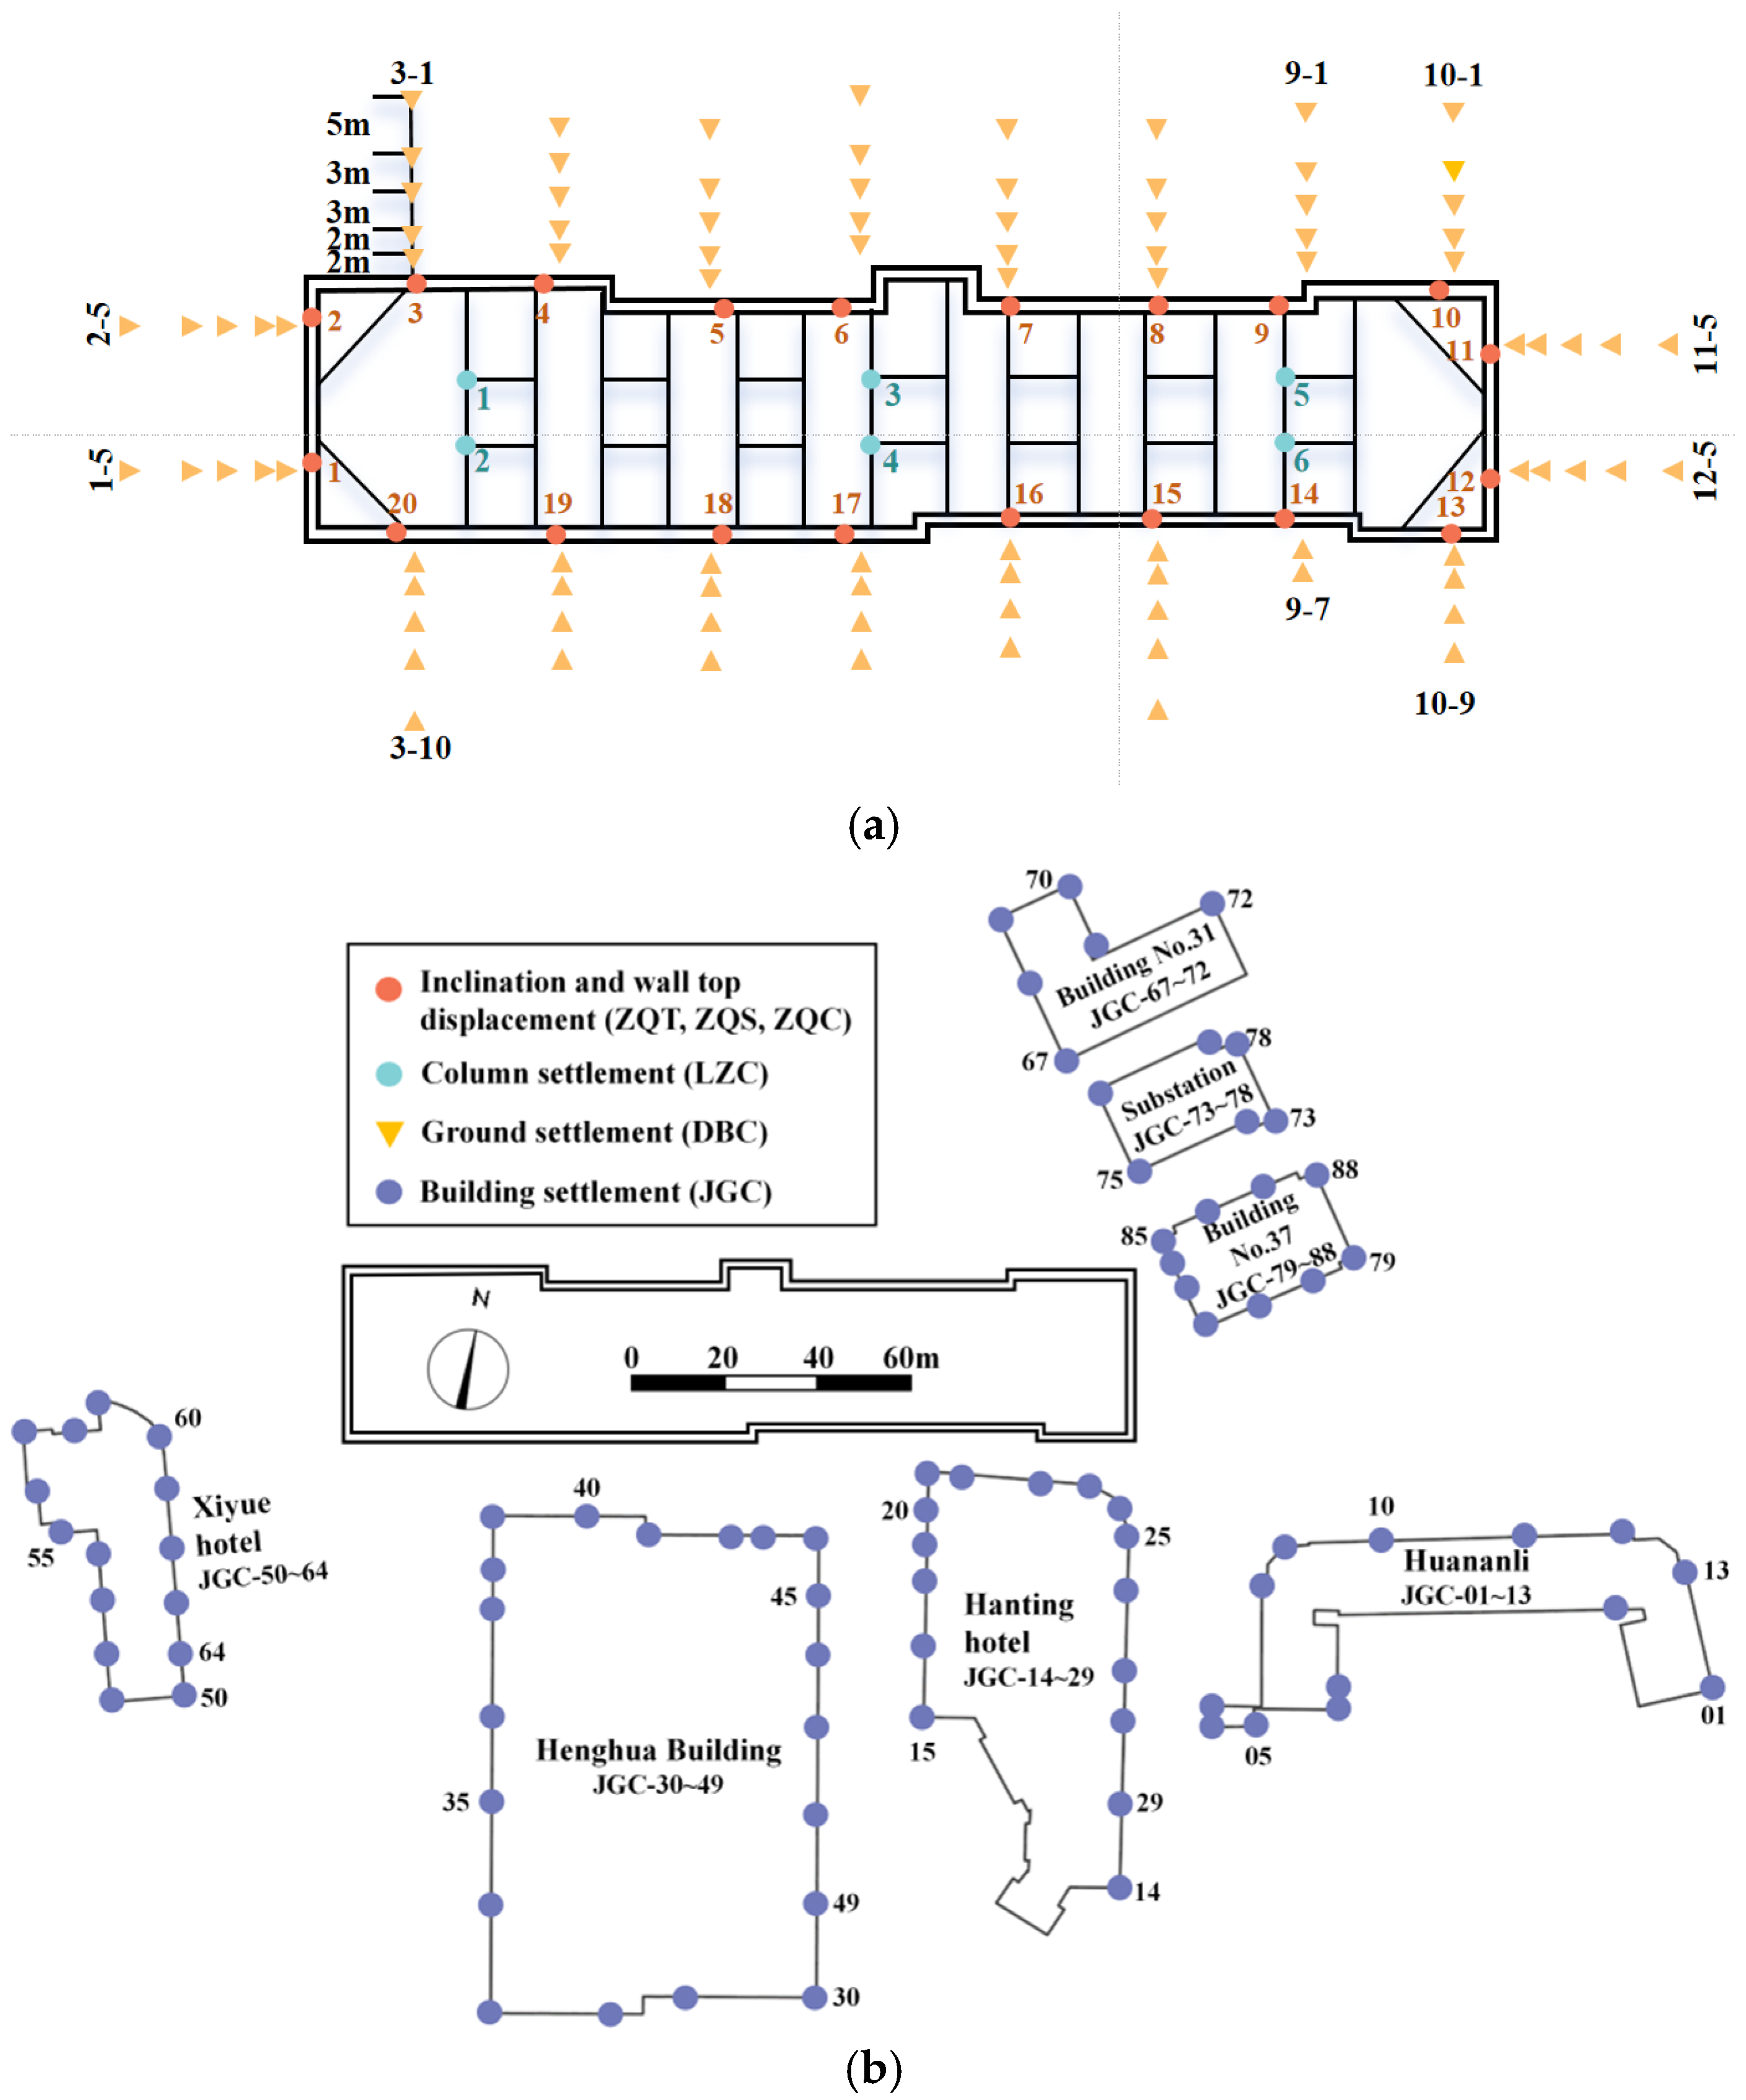
The monitoring program includes the following items: lateral displacement of the diaphragm wall, horizontal and vertical displacement at the top of the wall, vertical displacement of the column piles, ground surface settlement outside the excavation, and settlement of adjacent buildings. The plan view of the monitoring point layout is shown in
Figure 4. The layout of monitoring points for diaphragm wall displacement and ground surface settlement is shown in
Figure 4a, while the distribution of building settlement monitoring points outside the excavation is presented in
Figure 4b.
To ensure the reliability of the field monitoring data, all monitoring activities were conducted in accordance with the requirements of relevant Chinese standards for excavation monitoring and deformation measurement.
Table 4 summarizes the monitoring instruments, measurement ranges, measurement accuracies, and monitoring frequencies adopted in this study.
All monitoring instruments were calibrated and verified before installation. During construction, periodic inspections and recalibrations were conducted in accordance with the project monitoring specification. Stable benchmark points were established in areas unaffected by excavation activities, generally more than 30–50 m away from the excavation boundary. The benchmark network was independently verified once per month, and working benchmarks were checked before each monitoring cycle. Any benchmark exhibiting abnormal movement was excluded and re-established. All monitoring data were subjected to quality screening before analysis. Missing data points and outliers were verified through repeated measurements. Only validated data were included in the final database used for deformation analysis.
Ground surface settlement monitoring points (DBC) are arranged along lines perpendicular to the excavation direction and are divided into 12 groups in total. Groups 1 and 2 are located at the western end of the excavation, whereas Groups 11 and 12 are located at the eastern end. Within each group, the monitoring points are numbered from X-1 to X-5 from the closest to the farthest point. Along the longitudinal side of the excavation, each column from west to east constitutes one group, corresponding to Groups 3–10. Within each group, the monitoring points are numbered from X-1 to X-10 from north to south. A total of 88 building settlement monitoring points are installed. For each building, the monitoring points are numbered sequentially in a clockwise direction along its perimeter. The numbering range for each building and the identification numbers of some monitoring points are indicated in the figure.
4. Deformation of the Excavation Structure
4.1. Analysis of Diaphragm Wall Deformation
4.1.1. Overview of Lateral Deformation of the Diaphragm Wall
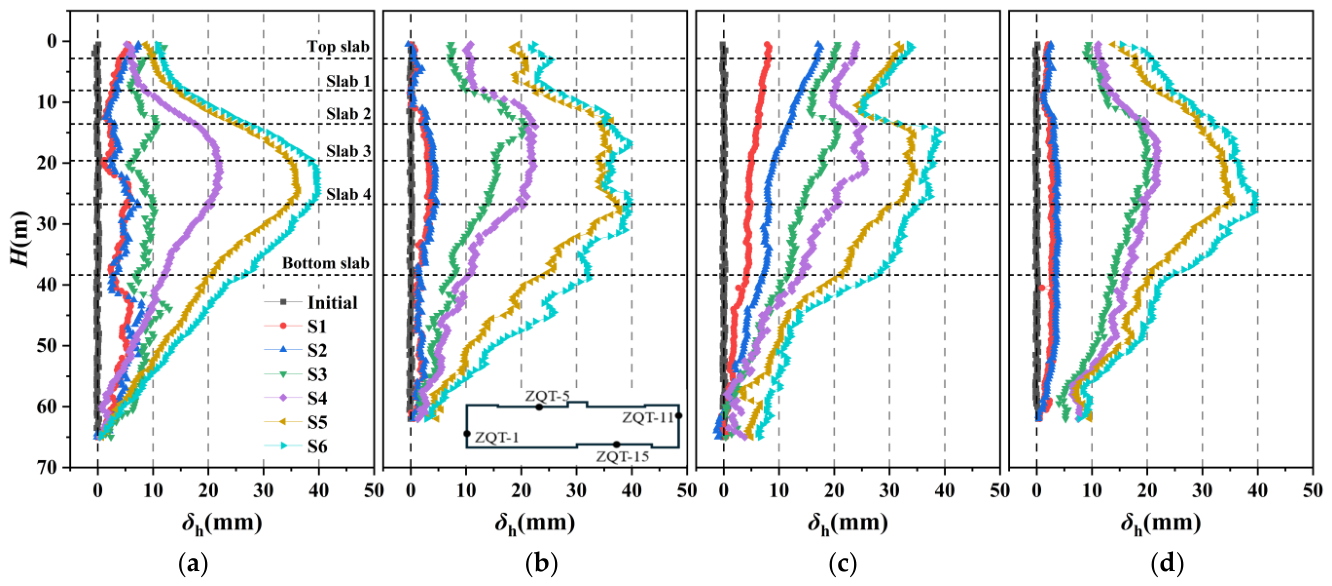
This study investigates the lateral deformation characteristics of representative monitoring points along the diaphragm walls of a deep excavation. On each side of the excavation, one monitoring point was selected: ZQT-5 on the north side and ZQT-15 on the south side for the long edges, and ZQT-1 on the west side and ZQT-11 on the east side for the short edges. ZQT-5 and ZQT-15 are located at the concave positions within the standard section, where the concave positions are identified as risk zones for deformation control. ZQT-1 and ZQT-11 are situated at the ends of the two end shafts. Due to the corner effect and the influence of external structures, these end shafts exhibit different deformation characteristics from those of the standard section. The primary objective of this section is to examine the shape evolution of wall deflection profiles and to compare the deformation characteristics under different structural and excavation conditions.
Figure 5 presents the lateral deformation (
δh) of the diaphragm wall at different depths (
H) during each stage of the deep excavation process. The lateral deformation patterns of the diaphragm walls along the long edges exhibit a typical “inward-bulging” profile. The monitoring results indicate that the final maximum lateral displacements at ZQT-5 and ZQT-15 reached 39.5 mm. Upon completion of the first basement level excavation, the excavation depth reached 8.2 m, representing 20% of the total excavation depth; this is defined as the shallow excavation stage. At this stage, the maximum wall deflections at the aforementioned monitoring points were 4.7 mm, 5.3 mm, 4.0 mm, and 2.7 mm, respectively. A comparative analysis between the final excavation stage (completion of the fifth basement level) and the shallow excavation stage reveals that the final excavation depth is 4.65 times that of the shallow stage, whereas the average lateral displacement is 8.64 times greater than that observed during shallow excavation. This phenomenon demonstrates that excavation depth has stage-dependent effects on diaphragm wall deformation. During the shallow excavation stage, deformation is effectively constrained due to the relatively shallow excavation depth and the substantial embedded length of the diaphragm wall. In contrast, during the deep excavation stage, the lateral deformation of the diaphragm wall increases more pronouncedly with increasing excavation depth.
The analysis of monitoring data from ZQT-1 and ZQT-11 along the short edges indicates that the diaphragm walls at both locations deflect toward the excavation; however, the deformation patterns differ significantly. At ZQT-1, the diaphragm wall exhibits an “inward-bulging” deformation pattern with a maximum lateral displacement of 39.7 mm. Conversely, at ZQT-11, the diaphragm wall initially demonstrates a “cantilever-type” deformation pattern prior to the construction of the first basement slab, subsequently transitioning to an “S-shaped” profile with a maximum lateral displacement of 39.3 mm. Unlike the response observed at ZQT-1 on the west side, this deformation pattern is primarily attributed to the asymmetric arrangement of temporary steel struts on the east and west sides of the excavation. As described in
Section 2, several additional temporary steel struts and corner braces were installed between the first and second basement slab levels at the east end shaft. These supports provide significant restraint against wall displacement, causing an inflection in the lateral deformation profile of the diaphragm wall at this location. In addition, the diaphragm wall on the east side is designed with a greater thickness than that on the west side, resulting in increased stiffness and exhibiting a cantilever-type deformation pattern with inward inclination toward the excavation. However, under the eccentric loading induced by the adjacent Minhou Road No. 37 building, the wall top still exhibits an inward displacement tendency, ultimately resulting in the formation of an “S-shaped” lateral displacement curve.
4.1.2. Maximum Lateral Deformation and Position Development Characteristics
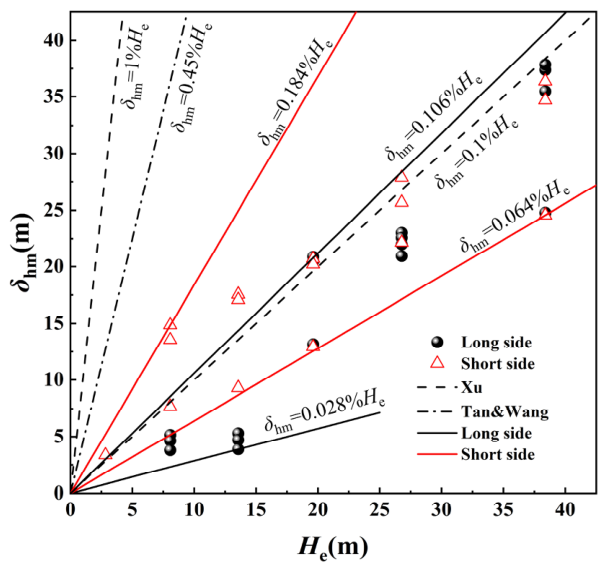
Figure 6 presents the relationship between the maximum lateral wall deflection (
δhm) and the excavation depth (
He). In this project, the maximum lateral deflections induced by the excavation stages primarily range from 0.028%
He to 0.106%
He for the long-side walls, and from 0.064%
He to 0.184%
He for the short-side walls. These results indicate that the lateral deformation control for the diaphragm walls at the short-side ends is less effective than that for the long-side walls. Overall, the maximum lateral deflections of the diaphragm walls are distributed between 0.028%
He and 0.184%
He, with an average value of approximately 0.087%
He.
Compared with other engineering cases in Shanghai, among the 93 deep excavation projects with diaphragm wall support constructed by the bottom-up method compiled by Xu [
43], the maximum lateral deformation of the wall is mainly concentrated within 0.1%
He–1%
He. In contrast, both the lower and upper bounds of the observed maximum wall displacement are lower than the values reported within the statistical range mentioned above. Furthermore, compared with the field measurements of metro station excavations in Shanghai soft clay reported by Tan and Wang [
44], the upper bound in this case is markedly lower than the value of 0.45%
He. Both the Shanghai area and the Tianjin area, where this case is located, belong to coastal soft soil regions, and the deformation values were normalized by excavation depth during the comparison. It is evident that the top-down excavation system adopted in this project provided effective deformation control under the investigated conditions. Although notable differences remain among the cases, this project demonstrates favorable deformation control under the top-down construction method, which can serve as a reference for similar engineering projects.
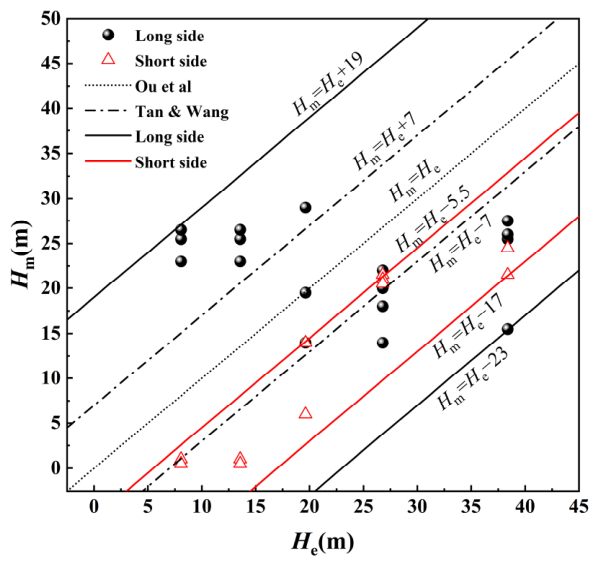
Figure 7 illustrates the relationship between the depth of the maximum lateral deformation of the diaphragm wall (
Hm, referenced to the ground surface) and the excavation depth (
He, referenced to the ground surface). Based on an analysis of field measurements, Ou et al. [
45] reported that, except for the initial cantilever excavation stage, the maximum wall deformation generally occurs in the vicinity of the excavation face; that is, the depth corresponding to the maximum lateral deformation is approximately equal to the excavation depth (
Hm =
He). According to the field data for metro station excavations in Shanghai soft clay compiled by Tan and Wang, the ratio
Hm/
He is mainly distributed between
Hm =
He − 7 and
Hm =
He + 7.
For the present project, a comparison between the short side and the long side of the excavation shows that the values on the short side are mainly within Hm = He − 17 to Hm = He − 5.5, and Hm increases with increasing excavation depth H. In contrast, the values on the long side are primarily distributed between Hm = He − 23 and Hm = He + 19, exhibiting relatively strong stability with no clear pattern in variation. In terms of the evolution of Hm, a pronounced stage-dependent characteristic is observed. When He < 20 m, Hm ≥ He, indicating that the location of maximum deformation is below the excavation face. When He ≥ 20 m, Hm < He, meaning that the location of maximum deformation is above the excavation face. Overall, Hm shows a wide distribution ranging from Hm = He − 17 to Hm = He + 19. This range not only covers the distribution intervals reported in previous studies but also reflects the diversity and complexity of the depth of maximum lateral deformation in ultra-deep excavations.
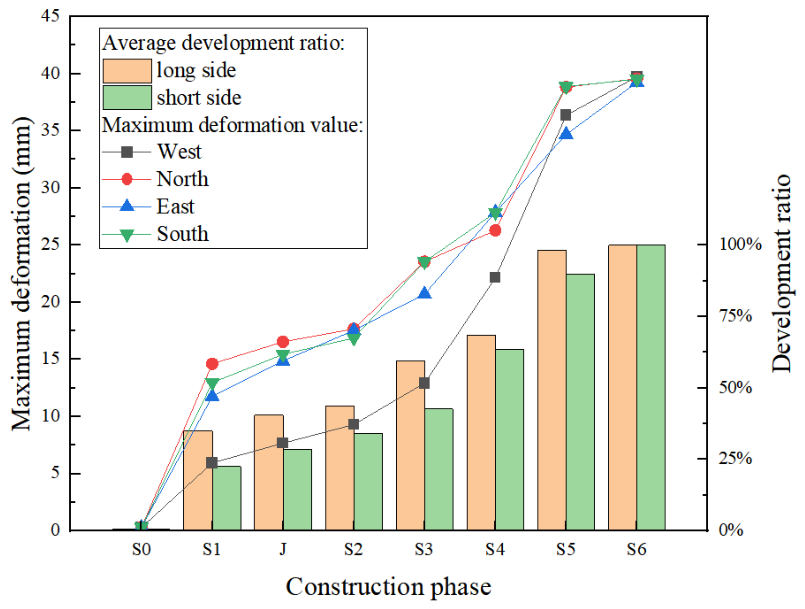
Figure 8 presents the maximum lateral deformation of the diaphragm wall at different orientations at the end of each excavation stage, together with the corresponding development ratio relative to the final deformation. The maximum lateral deformation refers to the maximum lateral displacement of the diaphragm wall in different orientations at each excavation stage. The development ratio is defined as the proportion of the final deformation value attained at a given location during each excavation stage, with the final deformation at that location taken as the baseline (i.e., 100%). In cases where negative displacement occurs, it is represented as a negative proportion. The evaluation of the development ratio for ground settlement in
Section 5.2 follows the same principle.
The four sides of the rectangular excavation are divided into east, west, south, and north directions, with the north and south directions representing the long side, and the east and west directions representing the short side. As shown in the figure, the deformation develops significantly more slowly on the west side than at the other positions. This is because an existing metro station and tunnel structures are located outside this side of the excavation; in the early excavation stages, the soil mass outside the pit maintains good integrity, resulting in a smaller earth pressure acting on the diaphragm wall than at other locations. In the later stages of excavation, however, the integrity of the soil mass and the existing structures weakens, and the maximum lateral deformation of the diaphragm walls at different positions gradually becomes comparable.
A comparison between the long and short sides indicates that the development ratio of the diaphragm wall on the long side is greater than that on the short side at all excavation stages. This is attributed to the larger length of the long side wall, which provides a higher degree of freedom for lateral deformation, as well as to the influence of the markedly smaller deformation on the west side. The growth curves of both the maximum lateral deformation and the development ratio with construction stage exhibit a convex pattern, indicating a higher growth rate in the later stages than in the earlier stages. The development ratios at each excavation stage are listed in
Table 5, in which the row “Max Position” denotes the development ratio of the overall maximum lateral deformation of the diaphragm wall at each stage.
4.1.3. Deformation Analysis of the Top of Underground Diaphragm Walls
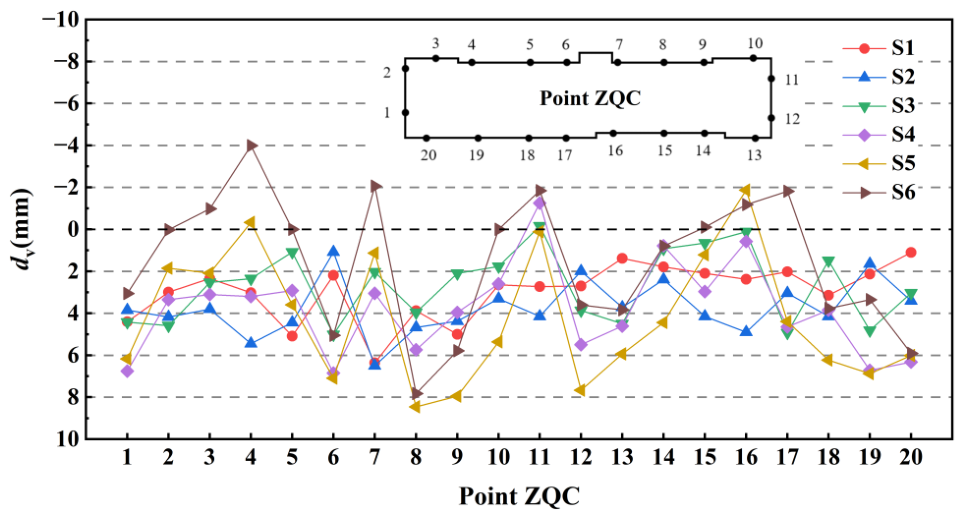
Figure 9 shows the variation in the cumulative settlement at the top of the diaphragm wall (
dv) under different working conditions. The positive value indicates the vertical settlement of the wall, while the negative value indicates the vertical uplift. The monitoring results reveal pronounced stage-dependent characteristics in the cumulative settlement at each monitoring point. The maximum cumulative settlement is 8.5 mm (ZQC-08 at S5), while the maximum uplift is −4.0 mm (ZQC-04 at S6), with an overall range from −4.0 mm to 8.5 mm. Taking the maximum excavation depth of the excavation (
Hemax) as the reference, the range is −0.23%~0.04%
Hemax.
From S1 to S6, the cumulative settlement at most monitoring points exhibits a trend of initial increase followed by a decrease. Taking monitoring point ZQC-08 as an example, the settlement reaches a maximum value of 8.5 mm at S5 and then decreases to 7.8 mm at S6. This trend is closely related to the sequence of earth excavation and slab construction. During the excavation stage, the soil mass adjacent to the diaphragm wall undergoes settlement due to the unloading effect, leading to an increase in settlement. With the establishment of the slab support system and the construction of the station structure, the deformation of the diaphragm wall is restrained, the rate of settlement decreases, and the deformation gradually stabilizes.
For most monitoring points, the maximum ground settlement occurs during stages S4 and S5, while a small number of points reach their maximum values during stages S1 and S2. During the excavation process, the diaphragm wall exhibits a clear upward movement. At most locations, this upward movement occurs after stage S2 (He ≥ 10 m). Therefore, the vertical displacement of the diaphragm wall generally exhibits a pattern of settlement during the early stage of excavation and heave during the late stage of excavation. The transition from wall-top settlement during the early excavation stages to wall-top heave during the later stages is thought to result from the combined effects of wall self-weight, excavation unloading, soil–structure interaction, and structural load redistribution.
During the initial excavation stages, the diaphragm wall had already been constructed and was subjected to self-weight as well as interface friction along the embedded depth. At this stage, the unloading effect associated with excavation was small because only the upper soil layers had been removed. Consequently, the downward force induced by wall self-weight remained dominant, resulting in a slight settlement of the wall top. As excavation proceeded to deeper levels, a substantial reduction in overburden stress occurred within the excavation. Simultaneously, progressive soil unloading induced upward rebound of the underlying soft clay strata, which was also reflected by the measured column heave and ground rebound. The construction of floor slabs in the top-down excavation system further enhanced structural integrity and redistributed loads within the excavation system, thereby limiting excessive downward deformation. As a result, excavation-induced unloading gradually became the dominant mechanism, leading to wall-top uplift. In addition, the observed wall-top uplift was consistent with the overall deformation characteristics of the excavation, including column rebound and basal soil heave. Although detailed pore-water pressure measurements were not available, no abnormal groundwater fluctuations were recorded during construction. Therefore, the observed vertical displacement behavior is primarily attributed to excavation-induced stress relief and rebound of the soft clay strata rather than changes in groundwater conditions.
4.2. Analysis of Vertical Displacement of Columns
4.2.1. Analysis of Column Rebound
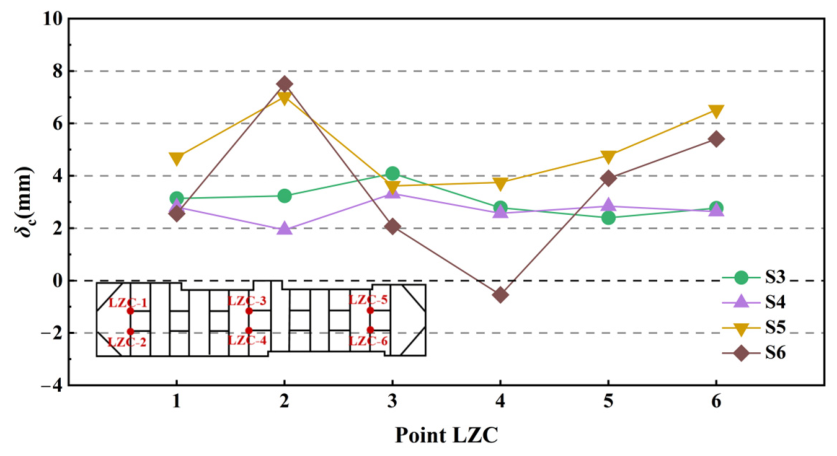
The statistical results of the vertical displacement of the columns (
δc) at different excavation stages are shown in
Figure 10. The average column rebound is 3.5 mm, while the maximum rebound reaches 7.5 mm (LZC-02), which corresponds to 0.009%
Hemax (38.3 m). This result is consistent with the findings of Zheng et al. [
46], indicating that under the top-down construction method, the column rebound does not exceed 0.05% of the excavation depth, which is significantly more than 50% lower than the ratio obtained in the bottom-up construction method (0.05–0.25%). This behavior is primarily attributed to the relatively large global stiffness of the floor slabs in the top-down construction method, which more effectively restrains column rebound. These findings further demonstrate the advantage of the top-down construction method in deep excavation engineering, particularly for projects with stringent requirements for column rebound control.
4.2.2. Comparison of Column Rebound Caused by Top-Down and Bottom-Up Construction Methods
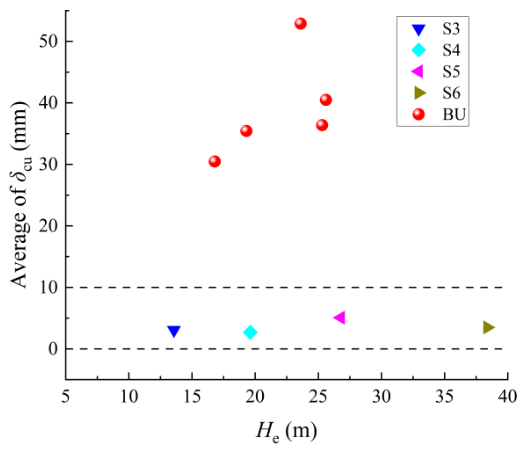
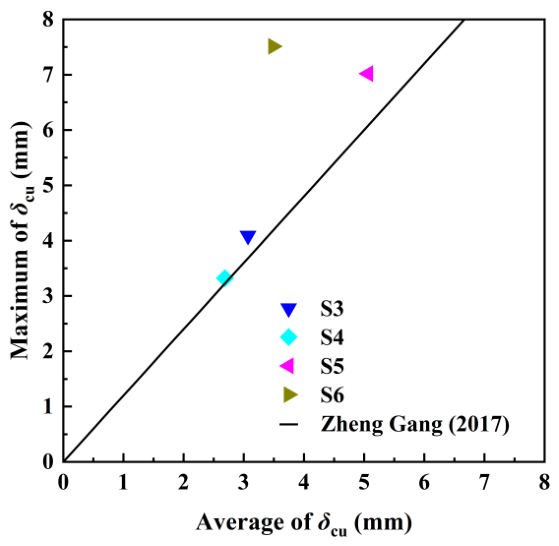
To further investigate the characteristics of column rebound, a comparative analysis was conducted between the column rebound at different construction stages of this top-down excavation and that of the bottom-up method. In the monitoring data from 34 metro station foundation pits reported by Zheng Gang [
46], a good linear relationship is observed between the maximum and average column rebound in bottom-up construction, with the maximum value being approximately 1.2 times the average. However, as shown in
Figure 11, the top-down method adopted in this project exhibits a greater dispersion in column rebound, and the maximum rebound values consistently exceed 1.2 times the corresponding average values. This indicates that the variability of column rebound under top-down construction is larger than that under the bottom-up method. Nevertheless, the top-down method still effectively controls the overall magnitude of column rebound, demonstrating its superiority in complex deep excavation projects.
As shown in
Figure 12, to verify the effectiveness of the top-down method in controlling column rebound, five bottom-up excavation cases reported by Zheng Gang et al. [
46] were selected for comparative analysis. The results indicate that, under similar excavation depths, the top-down method significantly reduces the overall magnitude of column rebound, which is maintained within the range of 3–10 mm, showing a marked improvement over the bottom-up method that is consistent with previous findings. Specifically, for the deep metro foundation pit constructed by the top-down method in this study, the column rebound induced by excavation exhibits a relatively small mean value, with a fluctuation range of −0.5~7.5 mm and a final average of 3.5 mm. This represents a reduction of more than 80% compared with the bottom-up method, and does not exceed 0.03%
He.
5. Deformation Analysis of the Surrounding Environment of the Excavation
5.1. Monitoring of Building Settlement near the Excavation Site
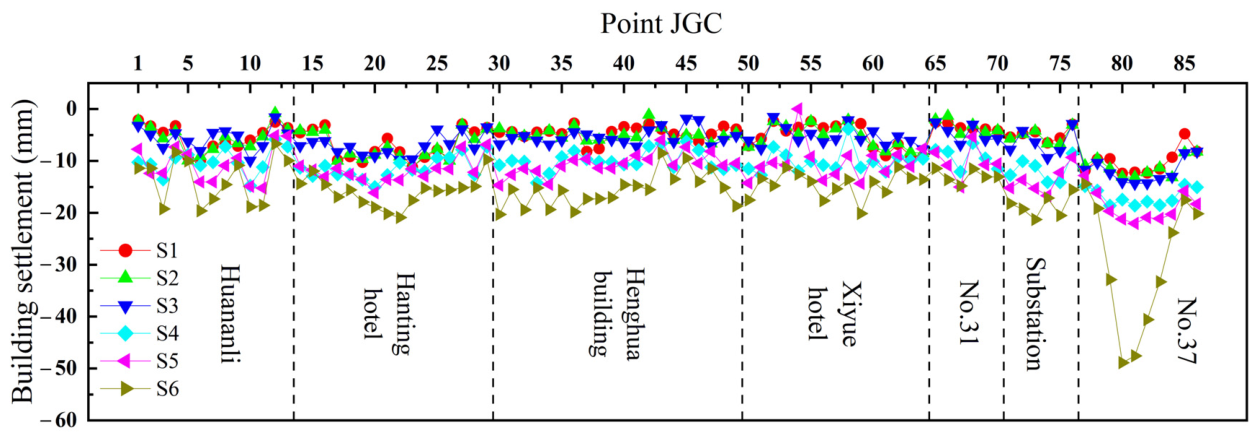
The environment surrounding the excavation site is complex and contains numerous buildings. According to the inspection results, the overall structural stability of the buildings remained satisfactory during construction, with no significant tilting, wall cracking, or other adverse phenomena observed. The settlement curves of surrounding buildings at different excavation stages are shown in
Figure 13. After the excavation was completed, the cumulative settlement values of the buildings corresponding to monitoring points JGC-81 to JGC-85 exceeded 30 mm, significantly higher than those at other monitoring points. Among these monitoring points, the settlement issue of the residential building at No. 37 Minhou Road, corresponding to monitoring point JGC-82, was the most notable, with a cumulative settlement value of 48.9 mm. Although the settlement of this residential building is relatively large, the differential settlement at the location of maximum tilt is 15 mm over a monitoring point spacing of 8 m. Therefore, the ratio of the maximum differential settlement to the distance between monitoring points (i.e., local tilt) does not exceed the limit value of 0.002. Moreover, no significant cracking or inclination has been observed on the building. Among the monitored buildings, the Hanting Hotel and Henghua Building are high-rise commercial–residential buildings exceeding twenty stories, both supported by pile-raft foundations. The surrounding buildings were constructed relatively early; with the exception of the Henghua Hotel, which was completed in 2001, the remaining buildings were completed around 1995. Currently, all buildings are settling normally, and no abnormal conditions have been observed.
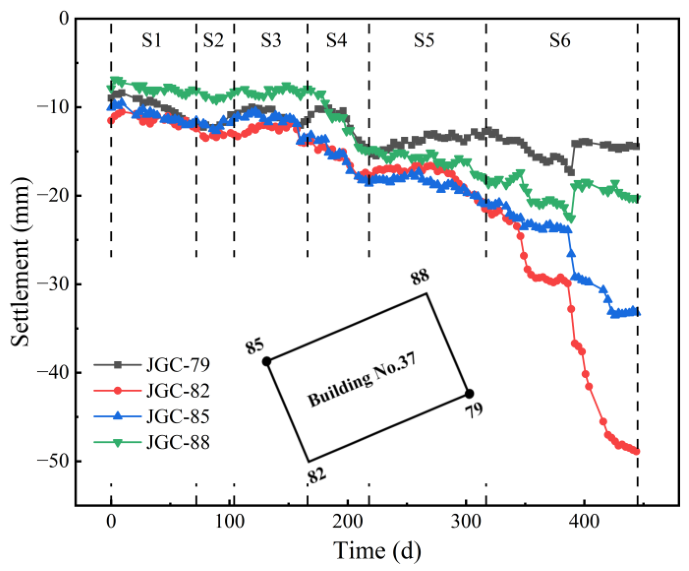
The residential building at No. 37 Minhou Road is of considerable age. In this study, we conducted a detailed time-series analysis of its settlement.
Figure 14 presents the settlement–time curve for this building. The analysis results show that, during the excavation process, all building monitoring points exhibited varying degrees of settlement, with the settlement values decreasing progressively with distance from the excavation. As the excavation depth increased, the settlement at each monitoring point also increased. Notably, during the excavation of the fifth lower level of the foundation pit, the settlement rate suddenly accelerated, eventually slowing down during the pouring of the bottom slab. This indicates that the deep excavation phase of the ultra-deep foundation pit has a significantly greater impact on the settlement deformation of nearby buildings compared to the shallow excavation phase.
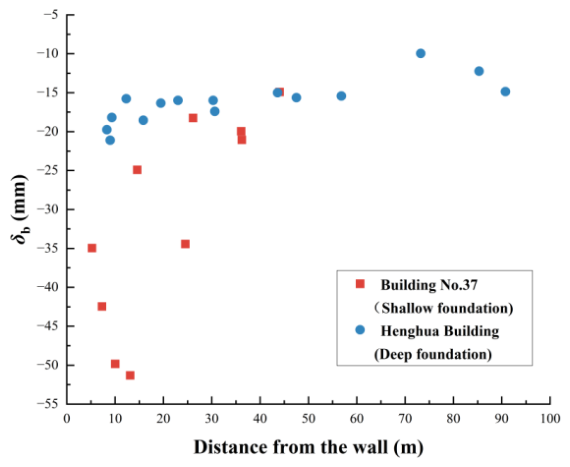
Figure 15 shows the relationship between building settlement and distance from the excavation. The nearby Henghua Building is approximately 16.51 m from the excavation site, with Φ800 bored cast in situ piles of 45 m length. It is founded on a deep pile foundation with high stiffness, and the pile tip depth exceeds the excavation depth. These piles exert a restraining effect on the soil deformation induced by the excavation, thereby effectively reducing the settlement of the building. Consequently, the settlement of the Henghua Building is noticeably smaller than that of the residential building at No. 37 Minhou Road, which has a raft foundation. This indicates that, during excavation, buildings with deep pile foundations exhibit smaller settlements than those with shallow foundations, highlighting the significant influence of pile foundation depth and stiffness on settlement deformation near an excavation.
Further analysis of the monitoring data reveals that, as the distance from the excavation increases, the deformation of pile foundations is significantly lower than that of buildings with raft foundations. This phenomenon is likely attributed to the unique mechanical behavior of pile group foundations. Through the cooperative action of multiple piles, a pile group foundation forms a highly integrated, stiff structural system capable of effectively distributing and resisting external forces, thereby mitigating further deformation to some extent. However, due to its higher overall stiffness, the pile group foundation tends to behave as a unified unit during deformation, resulting in a wider zone of influence. This characteristic implies that pile group foundations may still exhibit some deformation even at a considerable distance from the excavation; for instance, at a distance of 90.8 m from the excavation, a settlement of 14.4 mm was observed. Nevertheless, the deformation is relatively small, and the overall stability remains satisfactory.
5.2. Ground Surface Settlement Around the Excavation Area
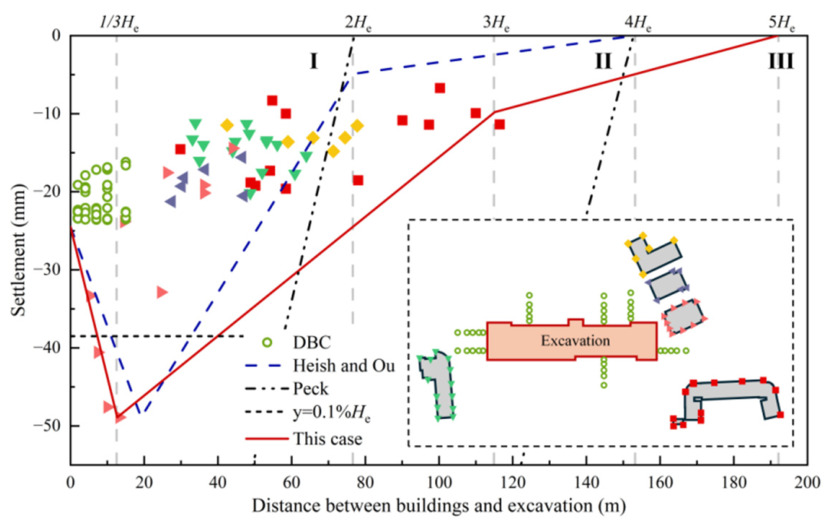
During the excavation process, 20 groups of monitoring points were systematically arranged on the ground surface around the excavation to measure settlement data. Each group of monitoring points was distributed along a straight line perpendicular to the edge of the excavation. The monitoring points were located at distances of 2 m, 4 m, 7 m, 10 m, and 15 m from the excavation. The relationship between the final settlement data (DBC) of selected monitoring points and the distance from the excavation is shown in
Figure 16.
The distribution range of the ground settlement monitoring points is limited and cannot capture settlement conditions far from the excavation. Considering that some buildings around the excavation are low and supported by raft or strip shallow foundations, their settlement can be approximately regarded as reflecting ground settlement. Therefore, the relationship between settlement values (both ground and building) and the distance from the excavation is presented in
Figure 16, which illustrates the settlement pattern over a relatively wide range around the excavation.
As shown in
Figure 16, the ground settlement values are close to the building settlement values, indicating the reasonableness of this approach. The zoning theory of settlement outside excavations proposed by Peck [
47] and the trough-shaped settlement pattern proposed by Hsieh and Ou [
48,
49] are incorporated into the figure. It can be observed that the settlement mainly occurs in Zone I as defined by Peck, with a small amount occurring in Zone II with a significantly smaller magnitude. The envelope curve of settlement versus distance generally conforms to the trough-shaped pattern, with the maximum settlement occurring at a distance of
He/3 from the diaphragm wall, which is generally consistent with the findings of Hsieh and Ou. However, at a distance of approximately 2
He from the excavation face, the settlement reaches −18.6 mm, accounting for 37.9% of the maximum settlement value, exceeding 0.3 times the maximum settlement value. Significant settlement is still observed at a distance of 3He from the diaphragm wall. Therefore, the settlement envelope curve derived from this case is presented as an extended settlement model, as illustrated in the figure: the maximum settlement occurs at a distance of
He/3 from the diaphragm wall; the settlement at the edge of the diaphragm wall is 50% of the maximum value; the inflection point between the primary and secondary influence zones is located at a distance of 3
He from the diaphragm wall, where the settlement is one-fifth of the maximum value; and the secondary influence zone extends to a distance of 5
He from the diaphragm wall.
These extended influence ranges are attributed to the fact that the excavation depth in this case is significantly greater than that of the series of excavations studied by Hsieh and Ou, and that this case employed an ultra-deep, ultra-thick diaphragm wall combined with the top-down construction method. In Zone I near the excavation, the ground settlement values are all within 0.1% He, indicating satisfactory deformation control. However, the influence zone is larger than traditional empirical predictions, extending beyond 3He, with notable settlement still observed at a distance of 3He from the excavation. The proposed model provides empirical guidance for the settlement influence zone and settlement pattern of soft soil excavations with depths exceeding 30 m.
The maximum surface settlement values and development ratios in different regions at each stage of excavation are shown in
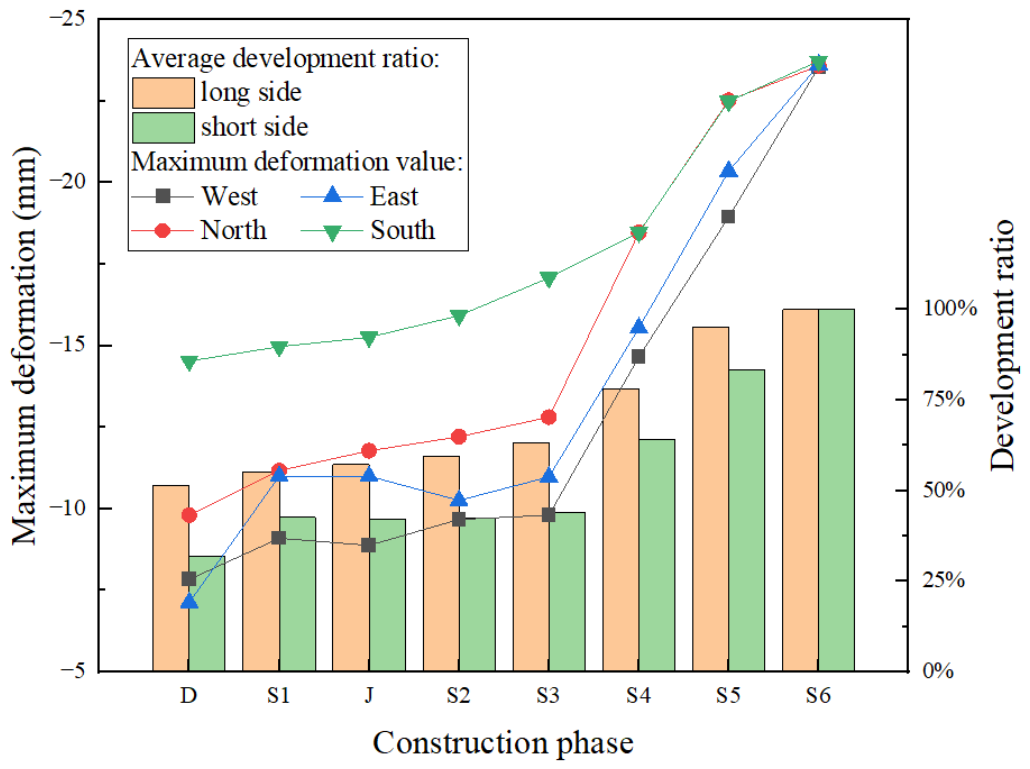
Figure 17. The surrounding area of the rectangular excavation is divided into four directions—east, west, south, and north—based on the orientation of the four sides. The area outside the long side along the north–south direction is labeled as the “long side area,” while the area outside the short side along the east–west direction is labeled as the “short side area.” From the figure, it can be seen that the surface settlement on the south side of the excavation is significantly larger than in other areas during the early stages of excavation, which is due to the presence of multiple high-rise buildings on the south side. In the later stages of excavation, the surface settlement across all areas tends to become more uniform, indicating that as the excavation depth increases, the spatial variation in the impact of buildings on surface settlement decreases. The maximum deformation values and development ratios follow a convex curve at different excavation stages, indicating that the impact of excavation on surface settlement increases as the excavation depth grows. The development ratios of surface settlement at each excavation stage are shown in
Table 6, where the “Max Position” row represents the overall maximum surface settlement value development ratio around the excavation at each stage. It can be seen that ground deformation at the end of the diaphragm wall construction stage already accounted for more than 30% of the final total settlement, and exceeded 50% in the long-side area.
In terms of maximum ground settlement, more than 60% of the final cumulative ground settlement was observed during the diaphragm wall construction stage. This indicates that diaphragm wall construction and the associated ground disturbance played an important role in the development of settlement. However, it should be recognized that the observed settlement may have also been influenced by factors such as slurry trench excavation, stress redistribution, groundwater fluctuations, and time-dependent soil consolidation. Therefore, the present observations demonstrate a strong temporal association between diaphragm wall construction and settlement development, rather than a strict quantification of the individual contribution of each mechanism.
6. Conclusions
(1) The maximum lateral displacement of the diaphragm wall approaches 40 mm, forming an overall inward-convex profile. Deformation is strongly governed by excavation depth, with markedly accelerated growth during deep excavation stages, requiring the stringent control of support and monitoring. At the east-end shaft, the diaphragm wall exhibits a cantilever state that differs from other locations. This phenomenon is attributed to the combined effect of eccentric loading from adjacent buildings and the installation of buttresses for the second underground floor. The maximum lateral displacement ranges from 0.028% He to 0.106% He along the long side and from 0.064% He to 0.184% He along the short side, indicating weaker control on the short side; the overall average is approximately 0.087% He, outperforming comparable bottom-up excavations in Shanghai. The variation in Hm shows spatial and stage dependency: for the short side, Hm is mainly between He − 17 and He − 5.5, whereas for the long side, Hm ≥ He when He < 20 m and Hm < He when He ≥ 20 m.
(2) The vertical displacement of the diaphragm wall top ranges from −0.23% to 0.04% Hemax. At most locations, the wall settles under self-weight during shallow excavation (He < 10 m) and shifts to upward movement during deep excavation (He ≥ 10 m), dominated by unloading-induced soil rebound. Column rebound ranges from −0.001% to 0.030% Hemax, with an average of 3.5 mm, representing a reduction of over 50% compared with bottom-up excavation due to top-down constraints.
(3) Building settlement exhibits a significant dependence on foundation type: settlements of buildings with raft foundations are considerably larger than those of high-rise buildings with pile-raft foundations. At a distance of 90.8 m from the excavation face, a settlement of 14.4 mm was still recorded for a pile-raft foundation building, indicating a wider influence zone than previously recognized. This case aligns more closely with the extended ground settlement influence zone model. The maximum settlement occurs at a distance of He/3 from the diaphragm wall; the primary influence zone extends to 3He, and the secondary influence zone extends to 5He. The settlement at the boundary between the primary and secondary influence zones is approximately one-sixth of the maximum value.
(4) This study quantifies the stage-wise development ratios of diaphragm wall lateral displacement and ground surface settlement outside the excavation. The maximum lateral displacement develops to 36.79%, 44.49%, 59.26%, 70.13%, 97.84%, and 100.00% after the six excavation stages (including the overburden layer), respectively. The corresponding development ratios of maximum ground surface settlement, following diaphragm wall construction and the six excavation stages, are 61.26%, 63.11%, 67.12%, 72.01%, 77.91%, 94.94%, and 100.00%. The development rate along the long side exceeds that along the short side. Settlement induced during diaphragm wall construction accounts for more than half of the final value and requires strict control.
Author Contributions
Conceptualization, X.C.; Methodology, Q.L.; Investigation, W.W., X.Z., Y.M. and B.L.; Resources, X.Z., Y.M. and B.L.; Data curation, W.W., X.Z. and Y.Z.; Writing—original draft, W.W. and Y.Z.; Writing—review & editing, X.C. and Q.L.; Funding acquisition, X.C. and Q.L. All authors have read and agreed to the published version of the manuscript.
Funding
This work was supported by the Tianjin Science Foundation for Distinguished Young Scientists of China (Grant No. 241CQJC00170), the Postdoctoral Fellowship Program of CPSF (Grant Number GZC20252133), the China Postdoctoral Science Foundation (Grant No. 2025M773243), and the National Natural Science Foundation of China (Grant No. 52578615). Their support is gratefully acknowledged.
Data Availability Statement
The raw data supporting the conclusions of this article will be made available by the authors on request.
Conflicts of Interest
Authors Xinwang Zhang, Yongsheng Ma and Bing Li were employed by the company China Construction Eighth Engineering Division Corp. Ltd., Tianjin. The remaining authors declare that the research was conducted in the absence of any commercial or financial relationships that could be construed as a potential conflict of interest.
References
- Bayesteh, H.; Sabermahani, M.; Ostadhossein, H.; Elahi, H. Performance of a large-span deep excavation in saturated fine-grained soil adjacent to a historical building: A case study. Tunn. Undergr. Space Technol. 2025, 162, 106638. [Google Scholar] [CrossRef]
- Cheng, K.; Xu, R.Q.; Ying, H.W.; Gan, X.L.; Zhang, L.S. Performance of Diaphragm Walls in Soft Clay of a Deep Basement Excavation. Soil Mech. Found. Eng. 2022, 59, 159–166. [Google Scholar] [CrossRef]
- Houhou, M.N.; Emeriault, F.; Belounar, A. Three-dimensional numerical back-analysis of a monitored deep excavation retained by strutted diaphragm walls. Tunn. Undergr. Space Technol. 2019, 83, 153–164. [Google Scholar] [CrossRef]
- Liu, N.W.; Pan, J.J.; Li, M.G.; Li, Y. Deformation characteristics of an ultra-deep and small-scale rectangular excavation in Hangzhou soft clay. Tunn. Undergr. Space Technol. 2023, 137, 105117. [Google Scholar] [CrossRef]
- Zhao, Y.; Chen, X.; Hu, B.; Huang, L.; Lu, G.; Yao, H. Automatic monitoring and control of excavation disturbance of an ultra-deep foundation pit extremely adjacent to metro tunnels. Tunn. Undergr. Space Technol. 2023, 142, 105445. [Google Scholar] [CrossRef]
- Cheng, K.; Xu, R.; Ying, H.; Gan, X.; Zhang, L.; Liu, S. Observed performance of a 30.2 m deep-large basement excavation in Hangzhou soft clay. Tunn. Undergr. Space Technol. 2021, 111, 103872. [Google Scholar] [CrossRef]
- Guo, P.P.; Gong, X.A.; Wang, Y.X.; Lin, H.; Zhao, Y.L. Analysis of observed performance of a deep excavation straddled by shallowly buried pressurized pipelines and underneath traversed by planned tunnels. Tunn. Undergr. Space Technol. 2023, 132, 104946. [Google Scholar] [CrossRef]
- Li, Y.; Wang, D.; Luo, Y.; Wang, L.; Li, J.; Suo, N. Evolution of Tunnel Uplift Induced by Overlying Oblique Intersection Angle Excavation and an Effective Protection Measure. Int. J. Geomech. 2024, 24, 04024253. [Google Scholar] [CrossRef]
- Peng, T.; Ren, D.; Kang, C.; Liu, H.; Xue, P.; Huang, H. Deformation Characteristics of Soft Soil Induced by Deep Excavation and Its Impact on Adjacent Tunnels: A Case Study in Shanghai. KSCE J. Civ. Eng. 2024, 28, 1715–1728. [Google Scholar] [CrossRef]
- Shi, J.W.; Chen, Y.H.; Lu, H.; Chen, Z.B.; Shi, C. Field investigation on long-term deformation characteristics of long-and-narrow basements in soft clays. Can. Geotech. J. 2025, 62, 1–19. [Google Scholar] [CrossRef]
- Zhu, Y.H.; Wang, W.D.; Xu, Z.H.; Chen, J.J.; Yang, Z.H. Observed performances and spatial effects of a set of 40 m ultra-deep rectangular excavations in Shanghai soft soils. Soils Found. 2026, 66, 101710. [Google Scholar] [CrossRef]
- Gan, F.; Zheng, G.; Li, M.; Liu, J.; Zhou, H.; Cao, T.; Bi, J.; Zhang, Y.; Liu, H.; Cen, Y.; et al. Large-scale model tests on inclined steel pipe pile retaining structures upon excavation. J. Rock Mech. Geotech. Eng. 2025, 18, 4924–4939. [Google Scholar] [CrossRef]
- Chen, R.P.; Li, Z.C.; Chen, Y.M.; Ou, C.Y.; Hu, Q.; Rao, M. Failure Investigation at a Collapsed Deep Excavation in Very Sensitive Organic Soft Clay. J. Perform. Constr. Facil. 2015, 29, 04014078. [Google Scholar] [CrossRef]
- Liu, X.R.; Wang, J.; Zhou, X.; Zhang, M.; Wang, L.; Xu, B.; Lou, X. Response of Long-Short Supporting Piles due to Deep Excavation in Soil-Rock Combined Strata. Int. J. Geomech. 2024, 24, 04023276. [Google Scholar] [CrossRef]
- Tan, Y.; Wang, D.L. Characteristics of a Large-Scale Deep Foundation Pit Excavated by the Central-Island Technique in Shanghai Soft Clay. I: Bottom-Up Construction of the Central Cylindrical Shaft. J. Geotech. Geoenviron. Eng. 2013, 139, 1875–1893. [Google Scholar] [CrossRef]
- Zheng, G.; Guo, Z.; Zhou, H.; Tan, Y.; Wang, Z.; Li, S. Multibench-Retained Excavations with Inclined-Vertical Framed Retaining Walls in Soft Soils: Observations and Numerical Investigation. J. Geotech. Geoenviron. Eng. 2024, 150, 05024003. [Google Scholar] [CrossRef]
- Chen, R.-P.; Xu, Y.; Wang, H.-L.; Meng, F.; Yin, C.-S. Theoretical model of lateral soil arching effect in sand with flexible retaining wall. Proc. Inst. Civ. Eng.-Geotech. Eng. 2025, 178, 599–614. [Google Scholar] [CrossRef]
- Crispin, J.J.; Bateman, A.H.; Voyagaki, E.; Campbell, A.; Mylonakis, G.; Bolton, M.D.; Vardanega, P.J. MSD applied to the construction of the British Library basement: A multi-stage excavation in London Clay. Can. Geotech. J. 2024, 61, 596–603. [Google Scholar] [CrossRef]
- Fan, X.-Z.; Phoon, K.-K.; Xu, C.-J.; Tang, C. Closed-form solution for excavation-induced ground settlement profile in clay. Comput. Geotech. 2021, 137, 104266. [Google Scholar] [CrossRef]
- Chen, H.H.; Li, J.P.; Yang, C.Y.; Feng, C. A theoretical study on ground surface settlement induced by a braced deep excavation. Eur. J. Environ. Civ. Eng. 2022, 26, 1897–1916. [Google Scholar] [CrossRef]
- Huang, M.S.; Wang, H.Y.; Tang, Z.; Yu, J. Basal stability analysis of braced excavations in anisotropic and non-homogeneous undrained clay using streamline velocity fields. Acta Geotech. 2021, 16, 1175–1186. [Google Scholar] [CrossRef]
- Jin, Z.X.; Zhang, C.; Li, W.; Tu, S.; Wang, L.; Wang, S. Stability analysis for excavation in frictional soils based on upper bound method. Comput. Geotech. 2024, 165, 105916. [Google Scholar] [CrossRef]
- Li, M.; Chen, H.; Zhang, Z.; Chen, J.; Yang, Q. Numerical analysis of a deep and oversized group excavation: A case study. Undergr. Space 2025, 21, 178–197. [Google Scholar] [CrossRef]
- Tabaroei, A.; Sarfarazi, V.; Moaveni, M.; Vakili Amir, H.; Pham Tuan, A. Deep Excavation–Induced Stability Evaluation of a Triple Tunnel Using Discrete and Continuum Numerical Modeling. Int. J. Geomech. 2025, 25, 04024299. [Google Scholar] [CrossRef]
- Russo, G.; Nicotera Marco, V.; Esposito, I. 3D FEM Back Analysis of the Observed Performance of a Very Deep Excavation in the Historical Center of Naples, Italy. J. Geotech. Geoenviron. Eng. 2024, 150, 04024010. [Google Scholar] [CrossRef]
- Goh, A.T.C.; Zhang, R.H.; Wang, W.; Wang, L.; Liu, H.L.; Zhang, W.G. Numerical study of the effects of groundwater drawdown on ground settlement for excavation in residual soils. Acta Geotech. 2020, 15, 1259–1272. [Google Scholar] [CrossRef]
- Zhou, H.Z.; Zheng, G.; He, X.P.; Wang, E.Y.; Guo, Z.Y.; Nie, D.Q.; Ma, S.K. Numerical modelling of retaining structure displacements in multi-bench retained excavations. Acta Geotech. 2020, 15, 2691–2703. [Google Scholar] [CrossRef]
- Liang, R.; Wu, J.; Sun, L.; Shen, W.; Wu, W. Performances of adjacent metro structures due to zoned excavation of a large-scale basement in soft ground. Tunn. Undergr. Space Technol. 2021, 117, 104123. [Google Scholar] [CrossRef]
- Tan, Y.; Lu, Y.; Wang, D. Interactive behaviors of four closely spaced mega excavations in soft clays: Case study on an excavation group in Shanghai, China. Tunn. Undergr. Space Technol. 2023, 138, 105186. [Google Scholar] [CrossRef]
- Li, Z.; Yang, K.; Xu, X.; Yang, Y.; Jiang, Y.; Tong, L.; Chen, Y. Investigation of metro tunnel response to multiple adjacent large excavations in soft soils. Tunn. Undergr. Space Technol. 2024, 152, 105935. [Google Scholar] [CrossRef]
- Meng, F.-Y.; Chen, R.-P.; Wu, H.-N.; Xie, S.-W.; Liu, Y. Observed behaviors of a long and deep excavation and collinear underlying tunnels in Shenzhen granite residual soil. Tunn. Undergr. Space Technol. 2020, 103, 103504. [Google Scholar] [CrossRef]
- Ren, D.X.; Kang, C.; Peng, T.; Li, Y.; Wang, J.L. Deformation Behavior of a Large-Scale Excavation and the Effect of an Adjacent Foundation Pit on the Excavation. Int. J. Civ. Eng. 2024, 22, 1493–1505. [Google Scholar] [CrossRef]
- Li, H.; Huang, M.; Yu, J.; Li, Y.; Guo, Y. Three-dimensional solution for braced excavation-induced ground settlement. Comput. Geotech. 2024, 172, 106460. [Google Scholar] [CrossRef]
- Han, M.; Chen, X.S.; Jia, J.Q. Analytical solution for displacement-dependent 3D earth pressure on flexible walls of foundation pits in layered cohesive soil. Acta Geotech. 2024, 19, 5249–5275. [Google Scholar] [CrossRef]
- Zheng, C.; Franza, A.; Jimenez, R. Analytical prediction for ground movements due to deep excavations in soils. Tunn. Undergr. Space Technol. 2023, 141, 105316. [Google Scholar] [CrossRef]
- Shi, J.; Chen, Z.; Chen, Y.; Wang, B.; Ni, X.; Zheng, J. Deformation characteristics of a large-scale basement supported by dual-circular props in heterogeneous soft stratum: Field and numerical investigation. Tunn. Undergr. Space Technol. 2025, 166, 106935. [Google Scholar] [CrossRef]
- Ge, C.H.; Yang, M.; Li, P.F.; Zhang, M.J.; Zhang, Z.H. Performance and environmental impacts of deep foundation excavation in soft soils: A field and modeling-based case study in Nanjing, China. Undergr. Space 2024, 18, 218–238. [Google Scholar] [CrossRef]
- Zhang, W.; Li, Y.; Goh, A.T.C.; Zhang, R. Numerical study of the performance of jet grout piles for braced excavations in soft clay. Comput. Geotech. 2020, 124, 103631. [Google Scholar] [CrossRef]
- Xu, L.Q.; Li, W.; Liu, L.; Wu, F.; Fan, Z.; Chen, R. Deformation analysis of a deep excavation with a servo control system adjacent to an existing foundation pit: A case study in Shenzhen. Tunn. Undergr. Space Technol. 2026, 170, 107374. [Google Scholar] [CrossRef]
- Hensman, P.J.; Orazalin, Z.Y.; Sheil, B.B. Monitoring the construction of a deep energy-from-waste bunker in soft clay and peat. Geotechnique 2023, 74, 1765–1779. [Google Scholar] [CrossRef]
- Masini, L.; Gaudio, D.; Rampello, S.; Romani, E. Observed Performance of a Deep Excavation in the Historical Center of Rome. J. Geotech. Geoenviron. Eng. 2021, 147, 05020015. [Google Scholar] [CrossRef]
- Han, M.; Li, Z.; Mei, G.; Bao, X.; Jia, J.; Liu, L.; Li, Y. Characteristics of subway excavation in soft soil and protective effects of partition wall on the historical building and pile foundation building. Bull. Eng. Geol. Environ. 2022, 81, 307. [Google Scholar] [CrossRef]
- Xu, Z.; Wang, J.; Wang, W. Deformation behavior of diaphragm walls in deep excavations in Shanghai. China Civ. Eng. J. 2008, 41, 81–86. [Google Scholar] [CrossRef]
- Tan, Y.; Wang, D. Characteristics of a Large-Scale Deep Foundation Pit Excavated by the Central-Island Technique in Shanghai Soft Clay. II: Top-Down Construction of the Peripheral Rectangular Pit. J. Geotech. Geoenviron. Eng. 2013, 139, 1894–1910. [Google Scholar] [CrossRef]
- Ou, C.-Y.; Hsieh, P.-G.; Chiou, D.-C. Characteristics of ground surface settlement during excavation. Can. Geotech. J. 1993, 30, 758–767. [Google Scholar] [CrossRef]
- Zheng, G.; Zhang, T.; Cheng, X.; Diao, Y. Statistical analysis of measured data of center post upheaval in metro station excavations in Tianjin. Rock Soil Mech. 2017, 38, 387–394. [Google Scholar] [CrossRef]
- Peck, R.B. Deep excavations and tunnelling in soft ground. In Proceedings of the International Conference on Soft Ground Engineering; Mexican Society of Geotechnical Engineering: Mexico City, Mexico, 1969. [Google Scholar]
- Hsieh, P.-G.; Ou, C.-Y. Shape of ground surface settlement profiles caused by excavation. Can. Geotech. J. 1998, 35, 1004–1017. [Google Scholar] [CrossRef]
- Ou, C.-Y.; Hsieh, P.-G. A simplified method for predicting ground settlement profiles induced by excavation in soft clay. Comput. Geotech. 2011, 38, 987–997. [Google Scholar] [CrossRef]
Figure 1.
Plan layouts of the construction site environment.
Figure 1.
Plan layouts of the construction site environment.
Figure 2.
Cross-sectional view of the support structure.
Figure 2.
Cross-sectional view of the support structure.
Figure 3.
Physical and mechanical properties of soil layers.
Figure 3.
Physical and mechanical properties of soil layers.
Figure 4.
Distribution of monitoring points. (a) Monitoring points of support structures and ground surface. (b) Monitoring points of surrounding building settlement.
Figure 4.
Distribution of monitoring points. (a) Monitoring points of support structures and ground surface. (b) Monitoring points of surrounding building settlement.
Figure 5.
Lateral displacement curve of the diaphragm wall. (a) ZQT-1; (b) ZQT-5; (c) ZQT-11; (d) ZQT-15.
Figure 5.
Lateral displacement curve of the diaphragm wall. (a) ZQT-1; (b) ZQT-5; (c) ZQT-11; (d) ZQT-15.
Figure 6.
Relationship between
δhm and
He [
43,
44].
Figure 6.
Relationship between
δhm and
He [
43,
44].
Figure 7.
Relationship between
Hmax and
He [
44,
45].
Figure 7.
Relationship between
Hmax and
He [
44,
45].
Figure 8.
Development of maximum lateral wall displacement at various locations.
Figure 8.
Development of maximum lateral wall displacement at various locations.
Figure 9.
Vertical displacements of the top of the wall at different excavation stages.
Figure 9.
Vertical displacements of the top of the wall at different excavation stages.
Figure 10.
Vertical displacements of the column at different excavation stages.
Figure 10.
Vertical displacements of the column at different excavation stages.
Figure 11.
Relationship between the average and maximum column rebound [
46].
Figure 11.
Relationship between the average and maximum column rebound [
46].
Figure 12.
Comparison of column rebound induced by TD and BU construction methods.
Figure 12.
Comparison of column rebound induced by TD and BU construction methods.
Figure 13.
Settlement of adjacent buildings under different excavation stages.
Figure 13.
Settlement of adjacent buildings under different excavation stages.
Figure 14.
Time-history diagram of settlement at monitoring points of Building No. 37.
Figure 14.
Time-history diagram of settlement at monitoring points of Building No. 37.
Figure 15.
Relationship between building settlement and distance from the excavation.
Figure 15.
Relationship between building settlement and distance from the excavation.
Figure 16.
Ground settlement, building settlement, and influence zone around the excavation.
Figure 16.
Ground settlement, building settlement, and influence zone around the excavation.
Figure 17.
Development of maximum surface settlement at various locations.
Figure 17.
Development of maximum surface settlement at various locations.
Table 1.
Building information.
Table 1.
Building information.
| Buildings | Information |
|---|
| Xiyue hotel | 9 stories above ground, with a pile-raft foundation. |
| Hanting hotel | 2 stories underground and 28 stories above ground, with a pile-raft foundation consisting of Φ800 bored cast in situ piles with a length of 42 m. |
| Henghua Building | 2 stories underground and 27 stories above ground, with a pile-raft foundation consisting of Φ800 bored cast in situ piles with a length of 45 m. |
| Huananli | 8 stories above ground with a raft foundation. |
| Building No. 37 | 6 stories above ground with a raft foundation. |
| Substation | 1 story above ground with a strip foundation. |
| Building No. 31 | 6 stories above ground with a raft foundation. |
Table 2.
Engineering characteristics and their influence of major soil layers.
Table 2.
Engineering characteristics and their influence of major soil layers.
| Soil Layer | Main Geotechnical Characteristics | Engineering Significance |
|---|
| Fill | Heterogeneous structure and relatively low stiffness | Limited influence due to shallow thickness |
| Silty clay | High water content, high compressibility, low permeability | Main contributor to ground settlement and wall deformation |
| Soft clay | High void ratio, low undrained shear strength, high compressibility | Controls excavation-induced deformation and consolidation settlement |
| Clay | Moderate strength and compressibility | Provides partial confinement to wall movement |
| Sandy silt | Relatively high permeability and stiffness | Influences seepage behavior and pore pressure dissipation |
| Deep clay layer | Higher strength and overconsolidation level | Contributes to basal stability and limits excessive wall deflection |
Table 3.
Main stages of excavation.
Table 3.
Main stages of excavation.
| Code | Construction Stage | Depth/m | Time |
|---|
| D | Diaphragm wall construction | 0 | 2021.08~2022.11.09 |
| S0 | Before excavation | 0 | Before 2022.11.09 |
| S1 | Covering soil above roof excavation | 3.32 | 2022.11.09~2023.01.20 |
| J | Dewatering test | 3.32 | 2023.01.20~2023.01.28 |
| S2 | 1st floor excavation | 8.17 | 2023.01.28~2023.02.21 |
| S3 | 2nd floor excavation | 13.67 | 2023.02.21~2023.04.21 |
| S4 | 3rd floor excavation | 19.72 | 2023.04.21~2023.06.17 |
| S5 | 4th floor excavation | 26.87 | 2023.06.17~2023.09.25 |
| S6 | 5th floor excavation | 37.99 | 2023.09.25~2024.01.31 |
Table 4.
Monitoring system and quality assurance measures.
Table 4.
Monitoring system and quality assurance measures.
| Monitoring Item | Instrument
/Sensor | Monitoring Range | Accuracy | Frequency | Control Thresholds |
|---|
| Diaphragm wall lateral displacement (ZQT) | Inclinometer | Full wall depth | ±0.4 mm/m | 1~2 times/d | −30~+50 mm |
| Wall-top horizontal displacement (ZQS) | Total station | Entire wall top | ±0.8 mm | 1~2 times/d | ±30 mm |
| Wall-top vertical displacement (ZQC) | Total station | Entire wall top | ±0.3 mm/km | 1~2 times/d | ±30 mm |
| Column vertical displacement (LZC) | Digital level | 6 columns | ±0.3 mm/km | 1~2 times/d | ±10 mm |
Ground surface
settlement (DBC) | Digital level | Within 15 m out of wall | ±0.3 mm/km | 1~2 times/d | ±30 mm |
| Building settlement (JGC) | Digital level | Adjacent buildings | ±0.3 mm/km | 1~2 times/d | +20~−30 mm |
Table 5.
Development ratios of maximum lateral wall displacement by location and stage.
Table 5.
Development ratios of maximum lateral wall displacement by location and stage.
| Position | Development Ratios for Each Excavation Stage |
|---|
| S0 | S1 | J | S2 | S3 | S4 | S5 | S6 |
|---|
| Long side | 0.76% | 34.88% | 40.45% | 43.70% | 59.55% | 68.47% | 98.26% | 100.00% |
Short
side | 0.75% | 22.49% | 28.59% | 34.06% | 42.66% | 63.38% | 89.93% | 100.00% |
Max
position | 0.75% | 36.79% | 41.62% | 44.49% | 59.26% | 70.13% | 97.84% | 100.00% |
Table 6.
Development ratios of maximum surface settlement by location and stage.
Table 6.
Development ratios of maximum surface settlement by location and stage.
| Position | Development Ratios for Each Excavation Stage |
|---|
| D | S1 | J | S2 | S3 | S4 | S5 | S6 |
|---|
| Long side | 51.43% | 55.24% | 57.15% | 59.45% | 63.17% | 78.12% | 95.16% | 100.00% |
| Short side | 31.75% | 42.62% | 42.16% | 42.29% | 44.09% | 64.07% | 83.35% | 100.00% |
| Max position | 61.26% | 63.11% | 64.33% | 67.12% | 72.01% | 77.91% | 94.94% | 100.00% |
| Disclaimer/Publisher’s Note: The statements, opinions and data contained in all publications are solely those of the individual author(s) and contributor(s) and not of MDPI and/or the editor(s). MDPI and/or the editor(s) disclaim responsibility for any injury to people or property resulting from any ideas, methods, instructions or products referred to in the content. |