


Abstract
Horizontally buried rectangular hollow pipe barriers are investigated as a potential solution for mitigating ground-borne vibrations in densely built environments. This study combines high-fidelity three-dimensional finite-element analyses, a computationally efficient two-dimensional plane-strain modeling strategy, and a Python-based automated optimization framework to evaluate the effects of barrier geometry and material properties on vibration isolation performance. The results show that vertical vibration attenuation is consistently better than horizontal attenuation. Among the geometric variables, burial depth and barrier width are the dominant factors, with isolation benefits becoming marginal when the burial depth exceeds approximately 3 m and with barrier widths smaller than about 0.5 m leading to poor performance. The material parametric study indicates a threshold behavior for stiffness contrast: the improvement in isolation gradually saturates when the Young’s modulus ratio of barrier to soil exceeds about 5.12, suggesting that reinforced concrete provides a practical balance between structural reliability and engineering applicability. A comparison between the three-dimensional and two-dimensional models shows that the plane-strain approximation can reproduce the three-dimensional results with acceptable accuracy while substantially reducing the computational demand. The automated optimization further identifies high-performing design configurations for practical application. Overall, the study offers numerical insight and computational guidance for the preliminary design and evaluation of rectangular hollow pipe barriers for ground vibration mitigation.
1. Introduction
Ground-borne vibrations induced by rail transit, road traffic, construction activities, and industrial machinery may adversely affect nearby buildings, buried infrastructure, and vibration-sensitive facilities. These vibrations propagate primarily in the form of Rayleigh surface waves and body waves, and their intensity depends on source characteristics, soil stratigraphy, and the dynamic properties of the transmission medium. In urban areas, excessive ground-borne vibration not only causes structural distress—ranging from cosmetic cracking to cumulative fatigue damage—but also disrupts the normal operation of precision instruments in laboratories, hospitals, and high-tech manufacturing facilities. Furthermore, prolonged exposure to vibration-induced noise can lead to human annoyance, sleep disturbance, and reduced work efficiency, making vibration control an essential component of urban environmental management [1,2]. With the continuous densification of urban environments and the increasing proximity between vibration sources and protected structures, the development of effective and practically feasible vibration mitigation measures has become an important topic in geotechnical engineering. Mitigation strategies can be broadly classified into three categories: source isolation (e.g., floating slab tracks, resilient fasteners), receiver protection (e.g., base isolation of buildings), and wave-path interruption (e.g., trenches, barriers, and wave-impeding blocks). Among these, wave-path interruption has attracted sustained research interest because it can simultaneously protect multiple structures along the propagation path without requiring modifications to the vibration source or the protected buildings [1,3].
The propagation-path mitigation measures commonly adopted in practice include open trenches, in-filled trenches, single or multiple rows of piles, and wave-impeding blocks (WIBs). Each approach exploits the impedance mismatch between the barrier material and the surrounding soil to reflect, scatter, or diffract incident wave energy, thereby reducing the vibration amplitude beyond the barrier. Open trenches are generally regarded as efficient screening measures because the strong impedance contrast between the trench and the surrounding soil can significantly reduce transmitted wave energy. Previous studies have shown that these barriers’ performance is strongly affected by trench depth, whereas the influences of trench width and other geometric variables are more dependent on source and site conditions [4,5,6]. However, despite their effectiveness, trench-type barriers are often difficult to apply in densely built environments because of excavation instability, groundwater disturbance, safety concerns, and space constraints [7]. In-filled trenches using soft materials (e.g., geofoam, rubber chips, bentonite slurry) can partially overcome the stability limitations of open trenches, but their isolation efficiency is generally lower and highly dependent on the stiffness contrast between the fill material and the surrounding soil [3,7,8].
Pile barriers constitute another important category of vibration isolation systems. Their mitigation performance is generally associated with wave reflection, scattering, and energy redistribution caused by the pile rows, and depends on parameters such as pile spacing, row number, embedment depth, and soil properties [8,9,10,11,12,13,14,15]. Recent analytical and numerical studies have extended the pile-barrier concept to hollow pipe piles and multi-row configurations, demonstrating that the vibration isolation behavior is governed by the combined effects of geometric layout and material impedance contrast [14,15]. WIBs have also been studied as buried isolation measures, and previous numerical investigations have shown that their effectiveness is sensitive to burial depth, plate dimension, and excitation characteristics [16,17,18]. More recent work has explored hybrid configurations such as periodic trench–WIB (PT-WIB) systems, which combine the band-gap characteristics of periodic structures with the impedance-blocking effect of a buried rigid plate, achieving broadband attenuation at low to medium frequencies [18]. Although these barriers have demonstrated potential under specific conditions, their performance is often case dependent, and practical design guidance remains limited for many engineering scenarios.
In response to the limitations of conventional barriers, several innovative concepts have emerged in recent years. Periodic wave barriers, inspired by phononic and sonic crystals, consist of regularly spaced inclusions (e.g., concrete columns, hollow pipes) that manipulate wave propagation through Bragg scattering and local resonance effects, creating frequency band gaps within which wave transmission is significantly suppressed [19,20]. Metamaterial-based trench barriers, which exploit local resonance mechanisms, have shown promising attenuation performance in laboratory-scale experiments for low-frequency vibrations [21]. Geocell-reinforced soil beds have also been proposed as a shallow vibration isolation measure, with numerical and experimental studies indicating that geocells can diffract vibration energy and reduce lateral transmission [1,8]. These developments reflect a broader trend toward engineered wave barriers that go beyond simple geometric obstruction.
Against this background, buried hollow-pipe barriers have emerged as a promising alternative because they combine the wave-screening capability of buried obstacles with improved structural stability and construction adaptability. Recent studies have shown that horizontally buried hollow pipes can provide favorable vibration isolation performance and may offer practical advantages over conventional open trenches in urban applications [22,23,24]. Ni et al. (2023) [25] further demonstrated that periodically arranged in-filled pipe barriers can effectively attenuate Rayleigh waves through a combination of periodicity-induced band gaps and pipe–soil interaction. Hu et al. (2025) [26] recently compared the isolation performance of circular and rectangular hollow pipes and identified the rectangular cross-section as being advantageous for certain geometric configurations. These findings indicate that hollow-pipe barriers deserve further investigation as a distinct class of buried vibration mitigation measures.
Despite these advances, a systematic design-oriented study for horizontally buried rectangular hollow pipe barriers is still lacking. In particular, the relative importance of burial depth, barrier width, barrier position, pipe arrangement, and material stiffness has not yet been clarified within a unified framework. Moreover, the computational cost of fully three-dimensional parametric analysis remains a major obstacle to practical design exploration, making it necessary to examine whether reduced-order modeling can provide sufficient accuracy for efficient optimization. Additionally, the recent literature lacks an automated optimization framework tailored to hollow-pipe barriers that can balance vibration attenuation performance with construction practicality.
Therefore, this study focuses on horizontally buried rectangular hollow pipe barriers for ground vibration mitigation. A high-fidelity three-dimensional finite-element model is first established to examine the effects of key geometric and material parameters on vibration isolation performance. A two-dimensional plane-strain model is then evaluated as a computationally efficient surrogate for large-scale parametric analysis. It is worth noting that evolutionary optimization techniques—such as genetic algorithms, particle swarm optimization, and differential evolution—have been widely applied to similar engineering problems and possess strong global search capabilities in high-dimensional design spaces. Similarly, artificial intelligence methods, in particular artificial neural networks trained on numerical simulation data, offer an attractive avenue for constructing rapid surrogate models that can drastically accelerate the design and optimization of vibration isolation systems. In the present work, however, a systematic parametric enumeration coupled with surrogate modeling is adopted because it preserves direct physical interpretability of individual parameter influences and remains computationally feasible for the reduced set of primary variables. Exploring the combination of finite-element analysis, evolutionary optimization and machine-learning-based surrogates constitutes a promising direction for future research. On this basis, a Python-based automated optimization framework is developed to identify high-performing design configurations. The objectives of the study are to clarify the governing parameters of rectangular hollow pipe barriers, assess the applicability of reduced-order numerical modeling, and provide numerical insight and computational guidance for their preliminary design and evaluation in practical geotechnical vibration mitigation problems.
2. Numerical Modeling
2.1. 3D Finite-Element Model
A three-dimensional finite-element model was developed in Plaxis 3D to investigate the vibration isolation performance of horizontally buried rectangular hollow pipe barriers subjected to harmonic strip loading. Previous studies indicate that ground vibrations induced by a vibration source are significant within a range of approximately 10 times the Rayleigh wavelength (LR), beyond which the ground vibration diminish [7]. Based on the wave characteristics of the present problem, the model dimensions were taken as 100 m × 80 m × 20 m (length × width × height). The adopted dimensions were selected to minimize boundary reflection while maintaining computational efficiency. The hollow pipe barrier extended over the full model width, and the pipe walls were simulated using plate elements. To capture the interaction between the pipe walls and the adjacent soil, interface elements were introduced along the pipe–soil boundary. Because the vibration-induced dynamic strains in both the soil and the barrier remain below 10−4, it is reasonable to assume that the pipe and the surrounding soil maintain tight contact throughout the entire dynamic loading process. Accordingly, the interface was assigned a high shear stiffness so that no slip or separation was permitted, effectively enforcing a fully bonded condition. This treatment is consistent with the small-strain linear-elastic modeling approach adopted for both materials and provides a simplified yet adequate description of the load-transfer mechanism for the current problem. The response was evaluated through monitoring points arranged on the ground surface behind the barrier. The first monitoring point was located 20 m from the center of the vibration source, and the remaining points were placed at intervals of 0.2 m, giving a total of 51 monitoring points.
2.2. Material Model and Basic Parameters
The soil parameters adopted in the present analysis were taken from Yang and Hung (1997) [4], where they were determined experimentally. In practical applications, hollow pipes are commonly constructed using reinforced concrete; accordingly, reinforced concrete was selected as the reference barrier material in the baseline model. Because the vibration-induced shear strain in both the soil and the barrier remained below 10−4, the response was assumed to remain within the small-strain elastic range. Therefore, both the soil and the barrier were modeled as linear elastic materials.
The material parameters used in the baseline model are summarized in Table 1. For the soil, the density, Poisson’s ratio, Young’s modulus, and damping ratio were taken as 1800 kg/m3, 0.25, 4.6 × 10⁷ pa, and 5%, respectively. For the reinforced-concrete barrier, the corresponding values were 2500 kg/m3, 0.167, 27 × 109 pa, and 1%, respectively. Based on the adopted soil properties, the shear-wave velocity, Rayleigh-wave velocity, and Rayleigh wavelength were calculated as VS = 101 m/s, VR = 93 m/s, and LR = 3 m.
Table 1.
Material properties of soil and barrier.
2.3. Boundary Conditions and Loading
To represent the semi-infinite extent of the soil medium and suppress spurious wave reflections from the truncated model boundaries, viscous absorbing boundaries were applied to the model boundaries following the classical Lysmer-Kuhlemeyer formulation [27]. The viscous coefficients were taken as C1 = 1.0 and C2 = 0.25. In addition, the bottom boundary was fixed, and the lateral boundaries were restrained in the normal direction.
The excitation was applied as a harmonic strip load on the ground surface. The strip load had a length of 10 m and a width of 2 m, and its time history was expressed as
where q(t) is the vertical surface load at time t, q0 is the load amplitude, and f is the excitation frequency. In this study, f = 31 Hz was adopted as a representative excitation frequency for the comparative and parametric analyses. Railway-induced ground vibrations typically span a broad frequency range of approximately 1–100 Hz, with the dominant frequency content strongly dependent on local soil conditions. For the soil properties considered herein, an excitation frequency of 31 Hz corresponds to a Rayleigh wavelength of approximately 3 m, providing a representative condition for evaluating barrier–soil interaction. In the two-dimensional model introduced later, the harmonic load amplitude was taken as 1 kN/m2, consistent with the baseline configuration used for model comparison.
2.4. Mesh Discretization
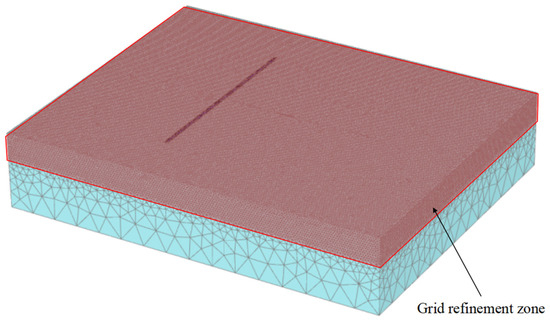
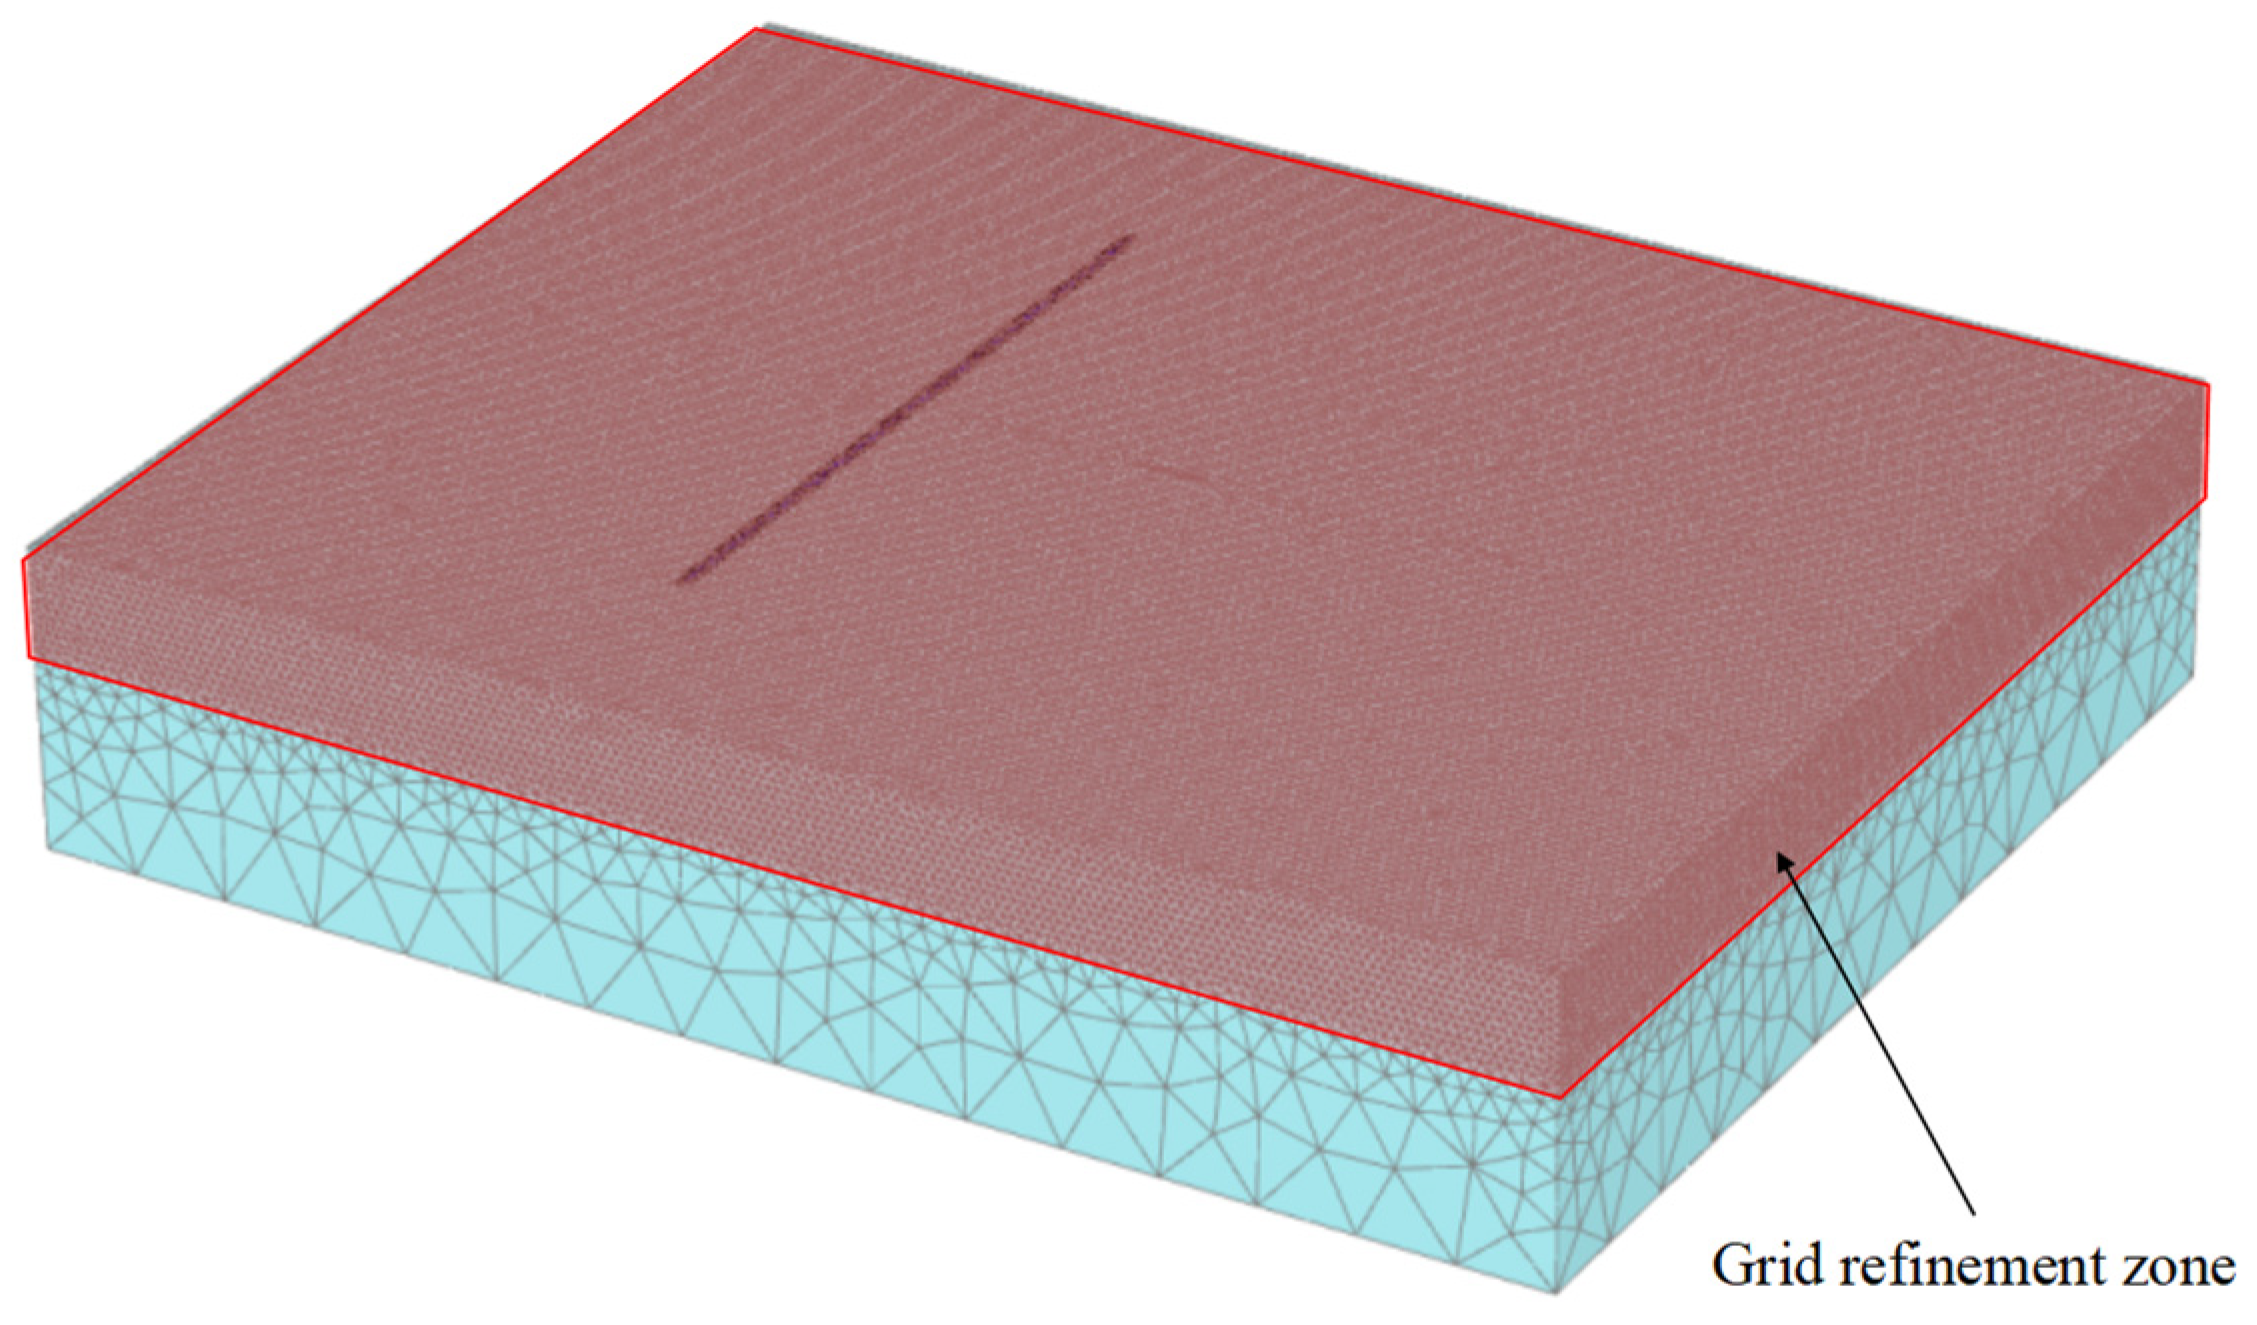
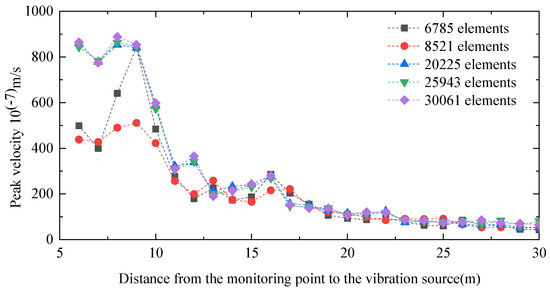
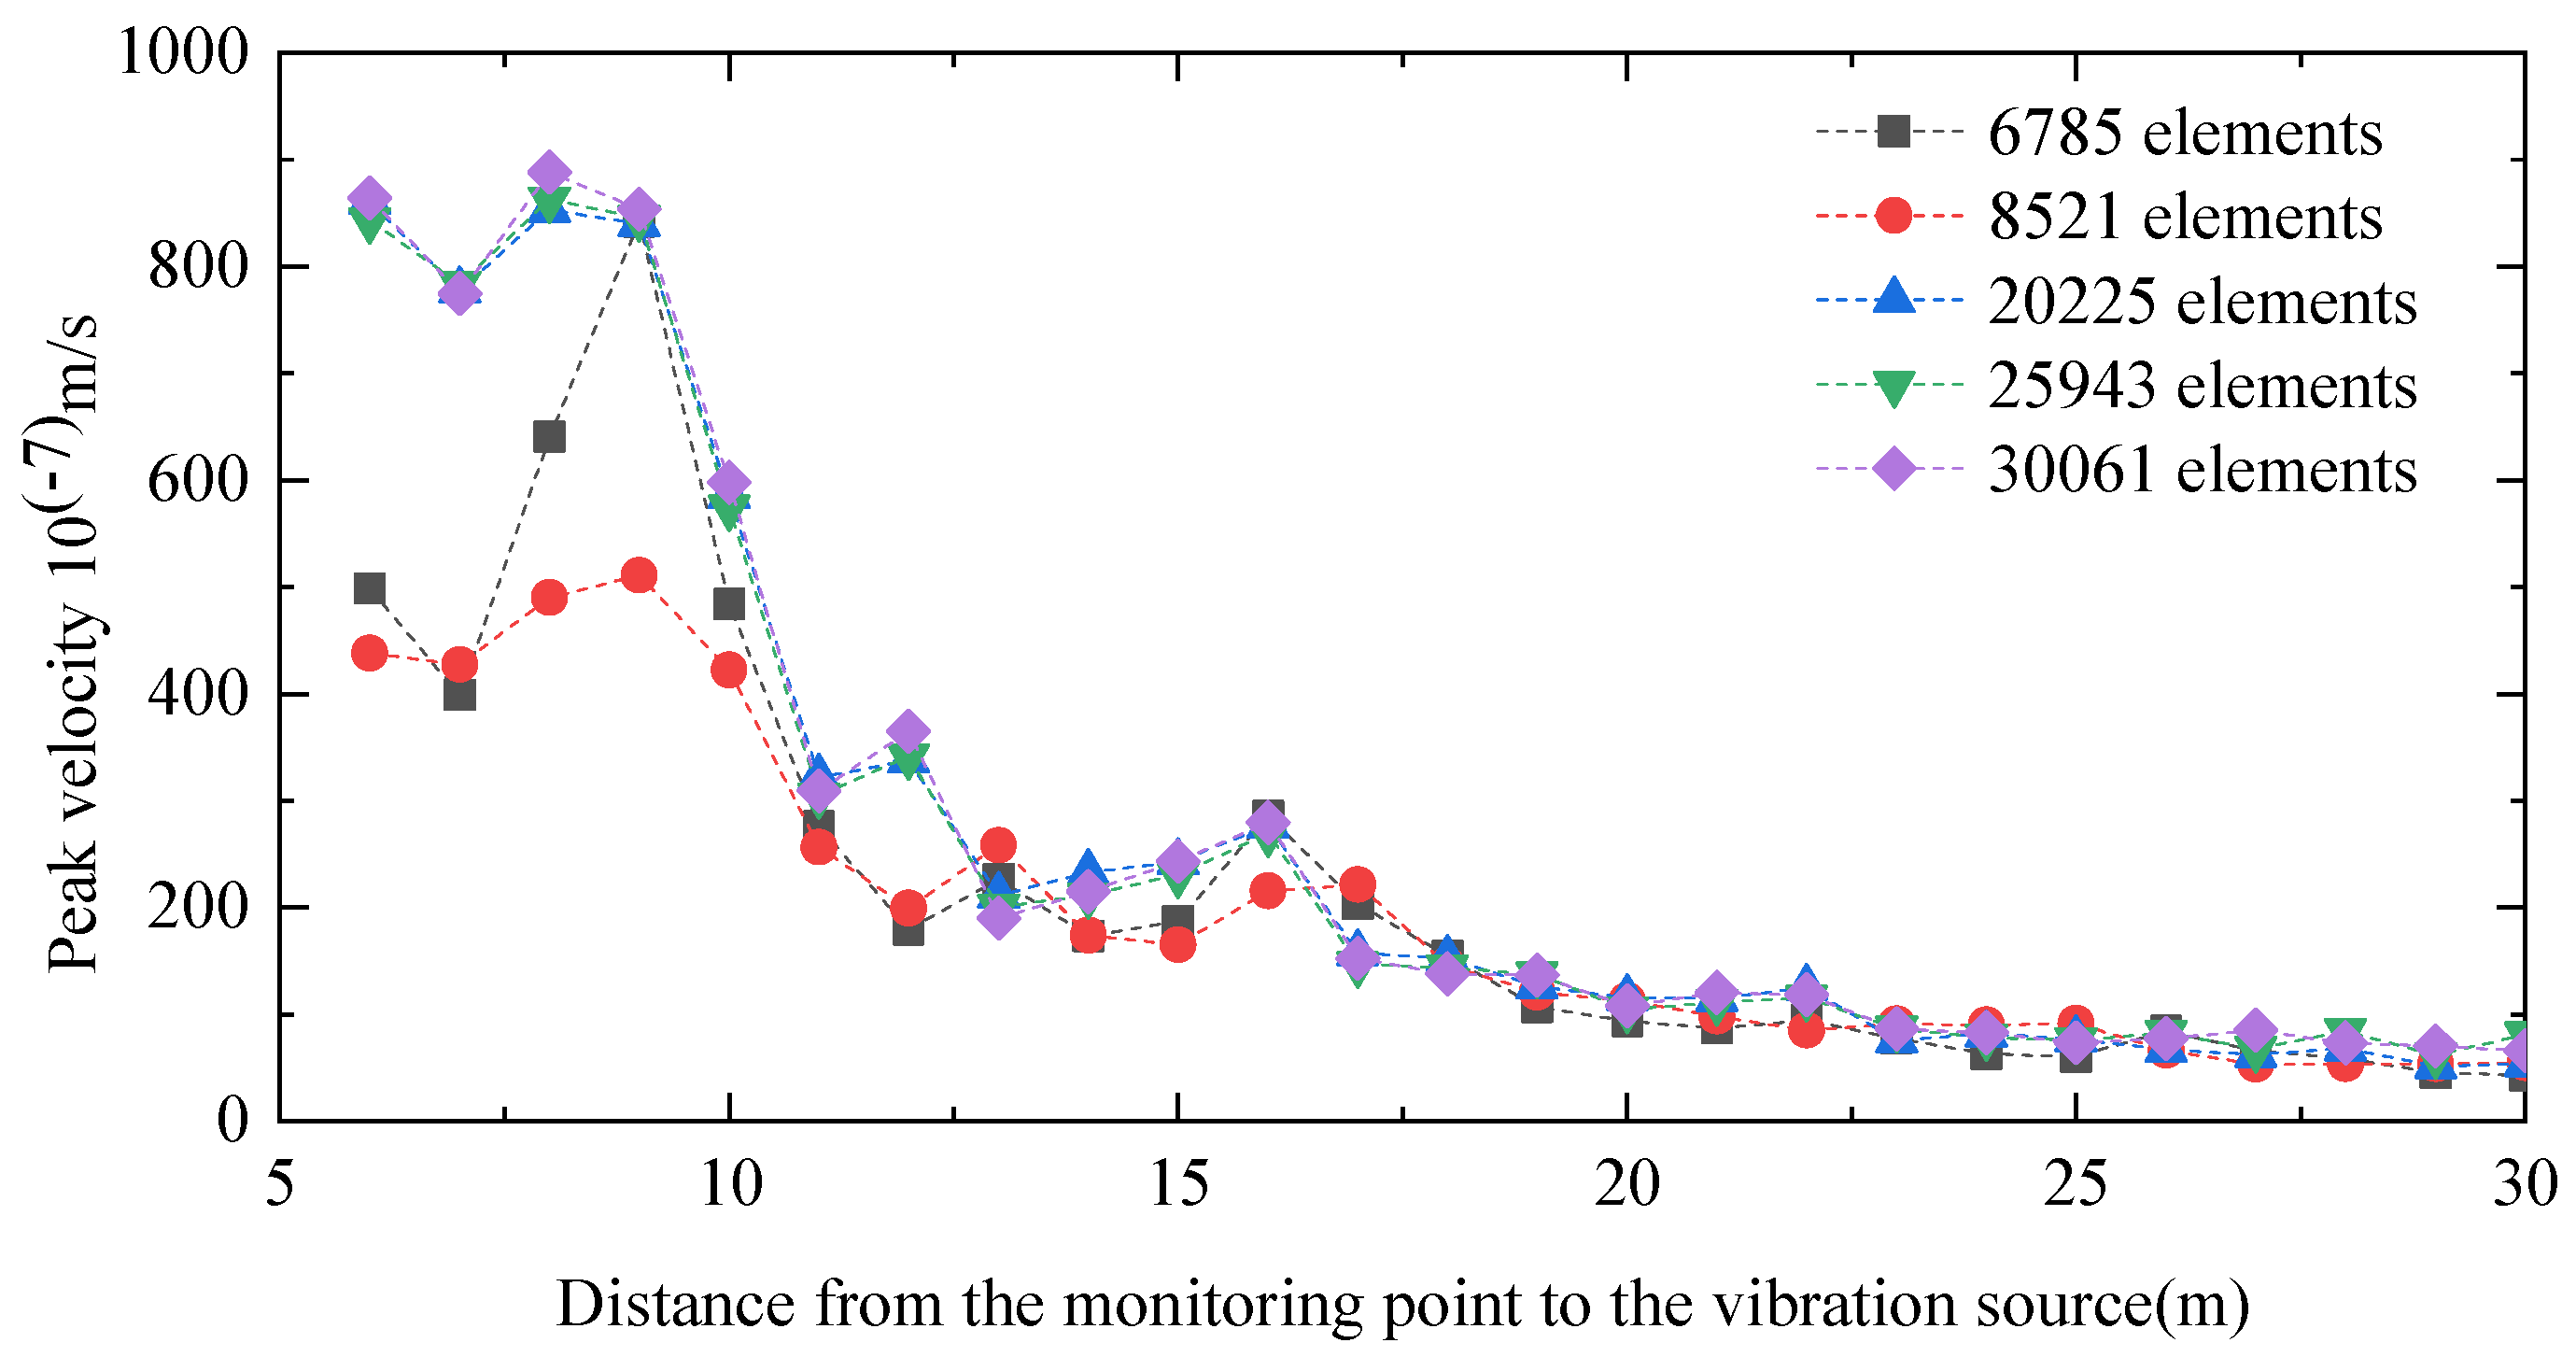
Because Rayleigh-wave energy is concentrated mainly in the shallow soil layer, mesh refinement was applied to the upper region of the model, the loading area, and the barrier zone. The adopted mesh partitioning scheme is shown in Figure 1. A mesh sensitivity analysis was carried out by varying the local refinement factor in these critical regions through the built-in coarseness control of Plaxis 3D, while keeping the global mesh parameters unchanged. Five meshes with progressively increasing refinement were generated, and for each mesh the total number of elements and the average element size in the refined area were obtained from the software’s mesh information query tool. The resulting element count was adopted as an indirect but convenient indicator of mesh density—a common practice in finite-element convergence studies for wave propagation problems. The surface velocity amplitudes at a representative monitoring point were then compared across the five meshes, as shown in Figure 2. The results show that the coarsest mesh produced noticeable discrepancies, whereas the response gradually converged as the mesh was refined. The three densest meshes produced nearly identical results, confirming that mesh convergence has been achieved and further refinement is unnecessary.
Figure 1.
Partitioning scheme of the finite-element mesh.
Figure 2.
Mesh convergence analysis.
Considering both accuracy and computational efficiency, the final 3D mesh contained approximately 20,225 elements. In the refined region, the average element size was about 0.423 m, which satisfies the meshing recommendation of Kuhlemeyer and Lysmer (1973) [28], namely that the characteristic element size should be smaller than approximately one-eighth of the minimum wavelength to ensure adequate accuracy in wave propagation analysis.
2.5. Model Validation
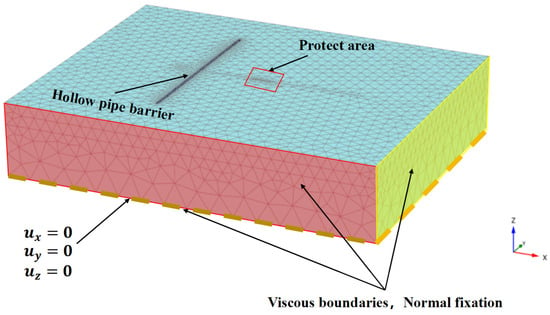
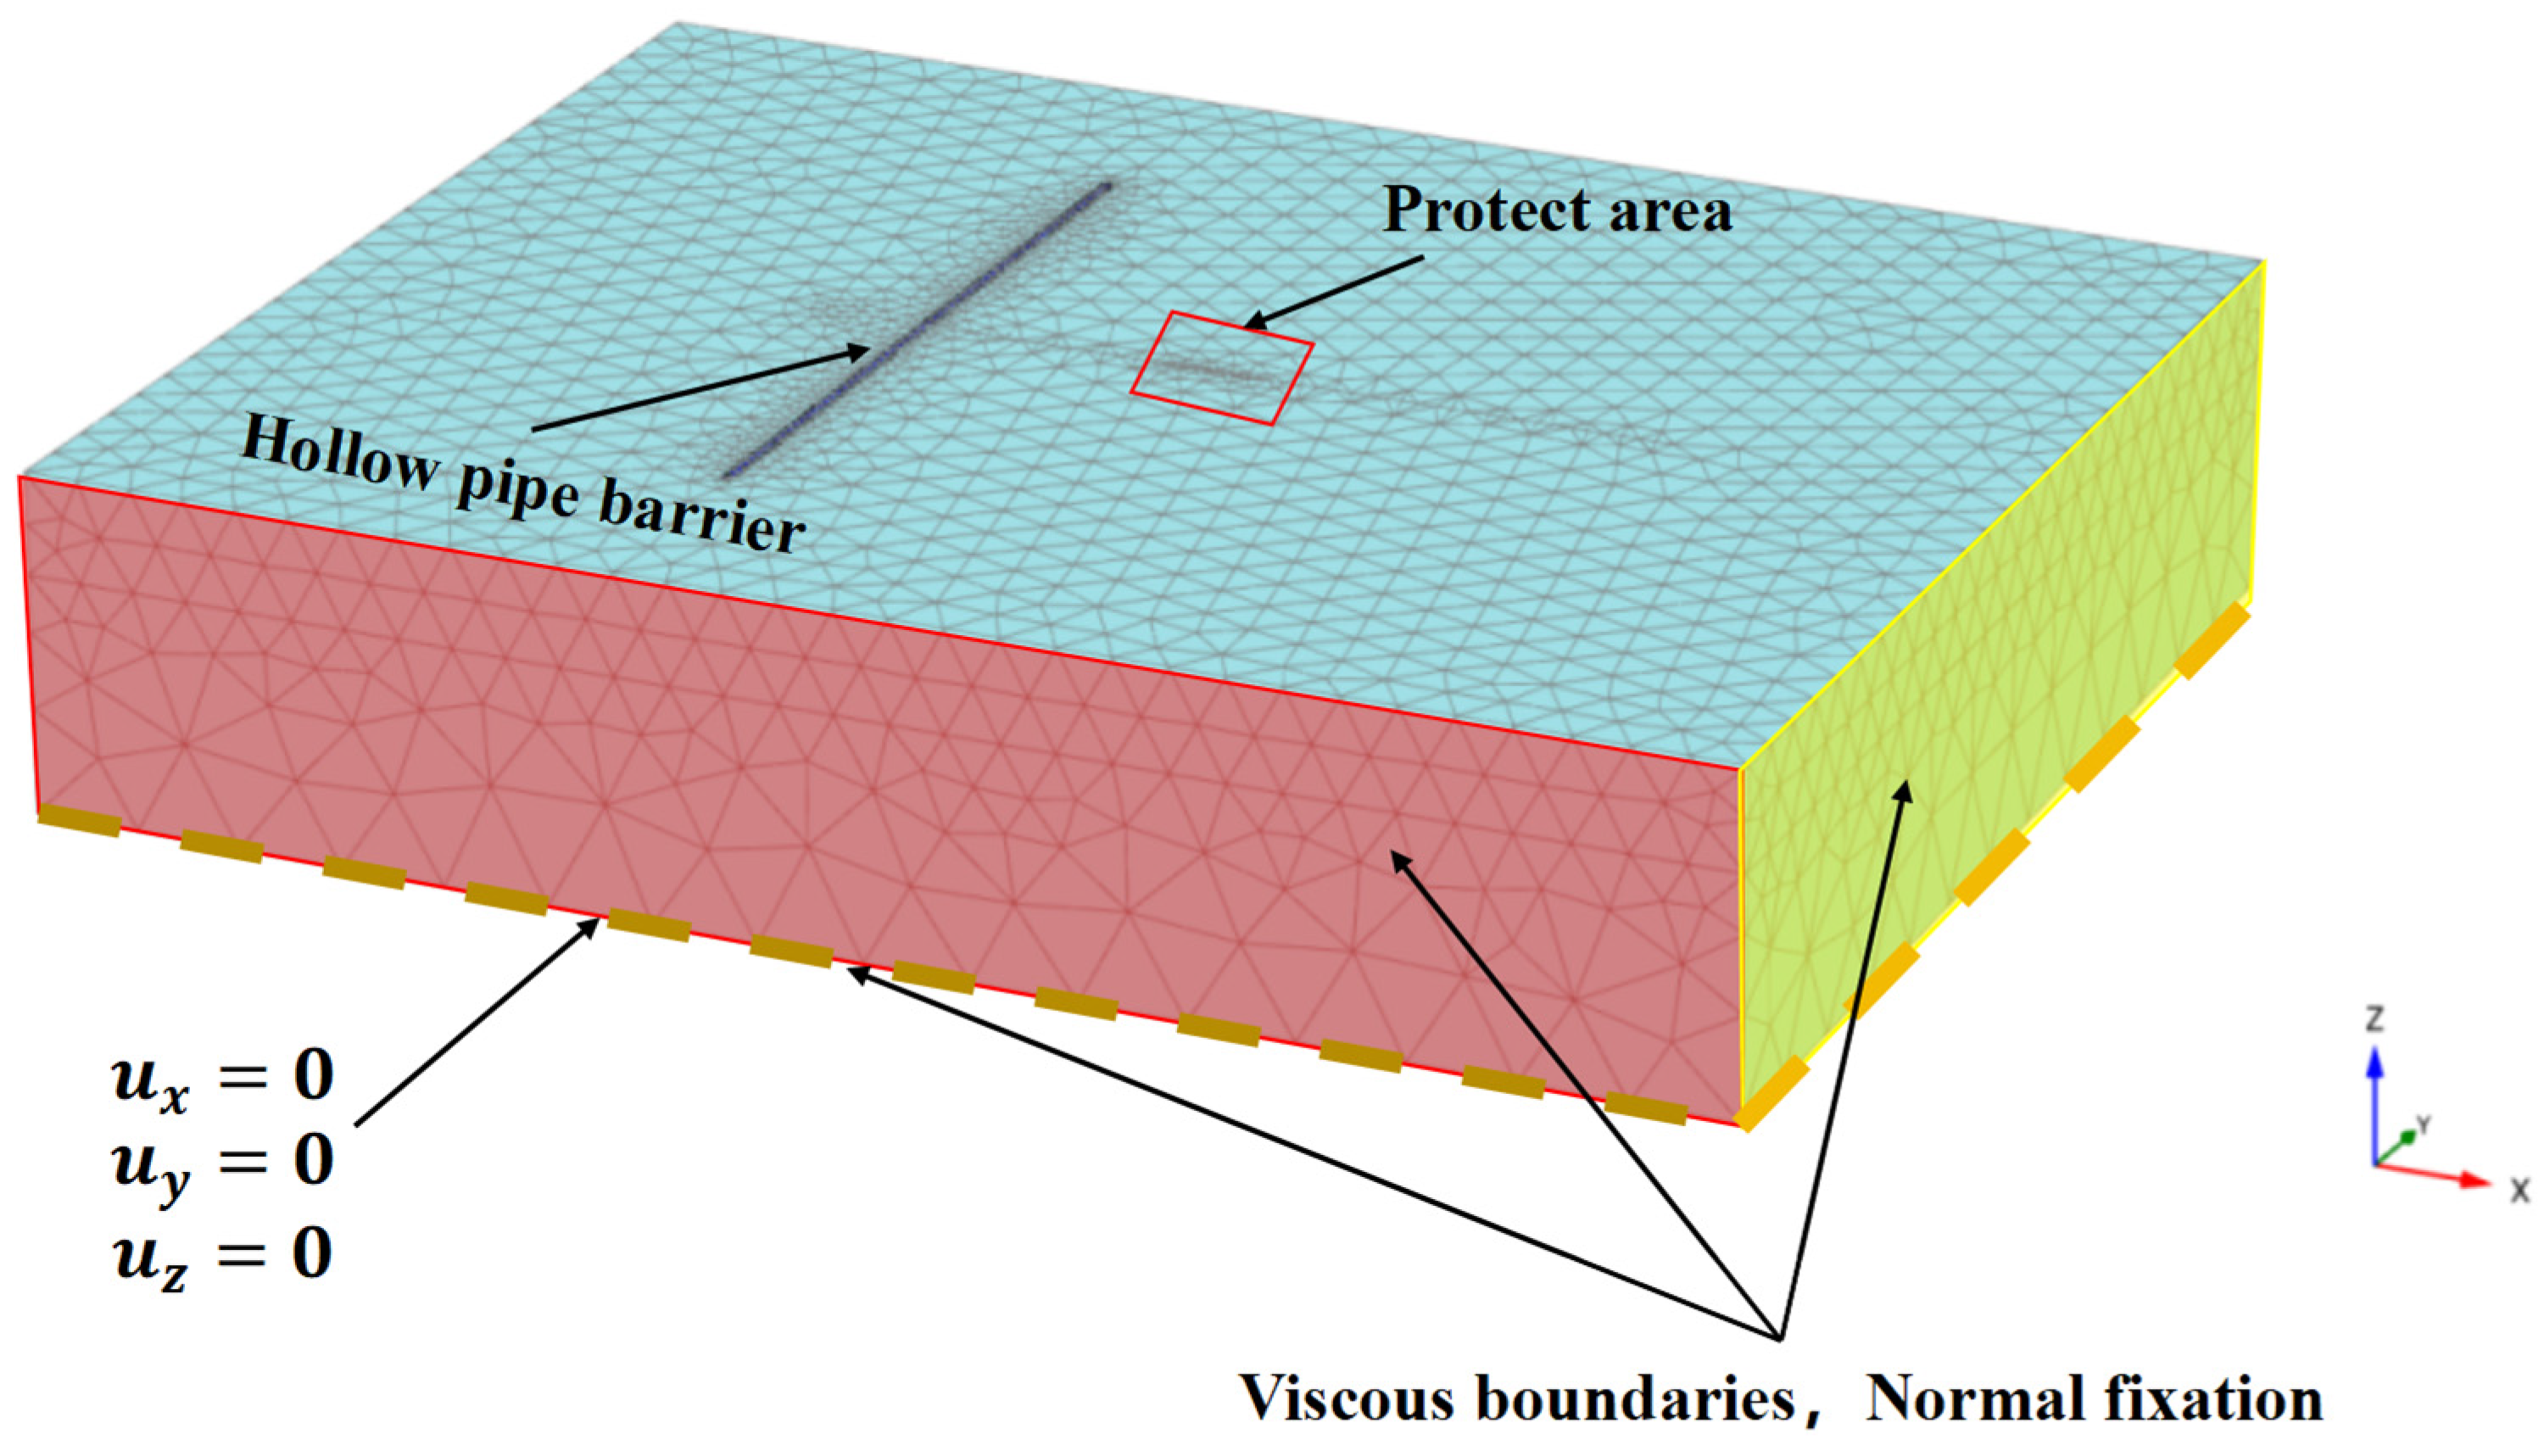
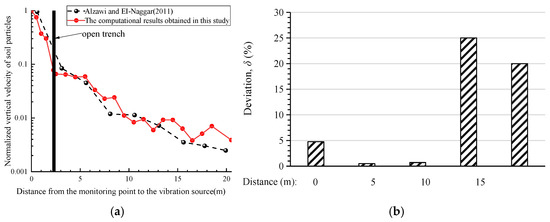
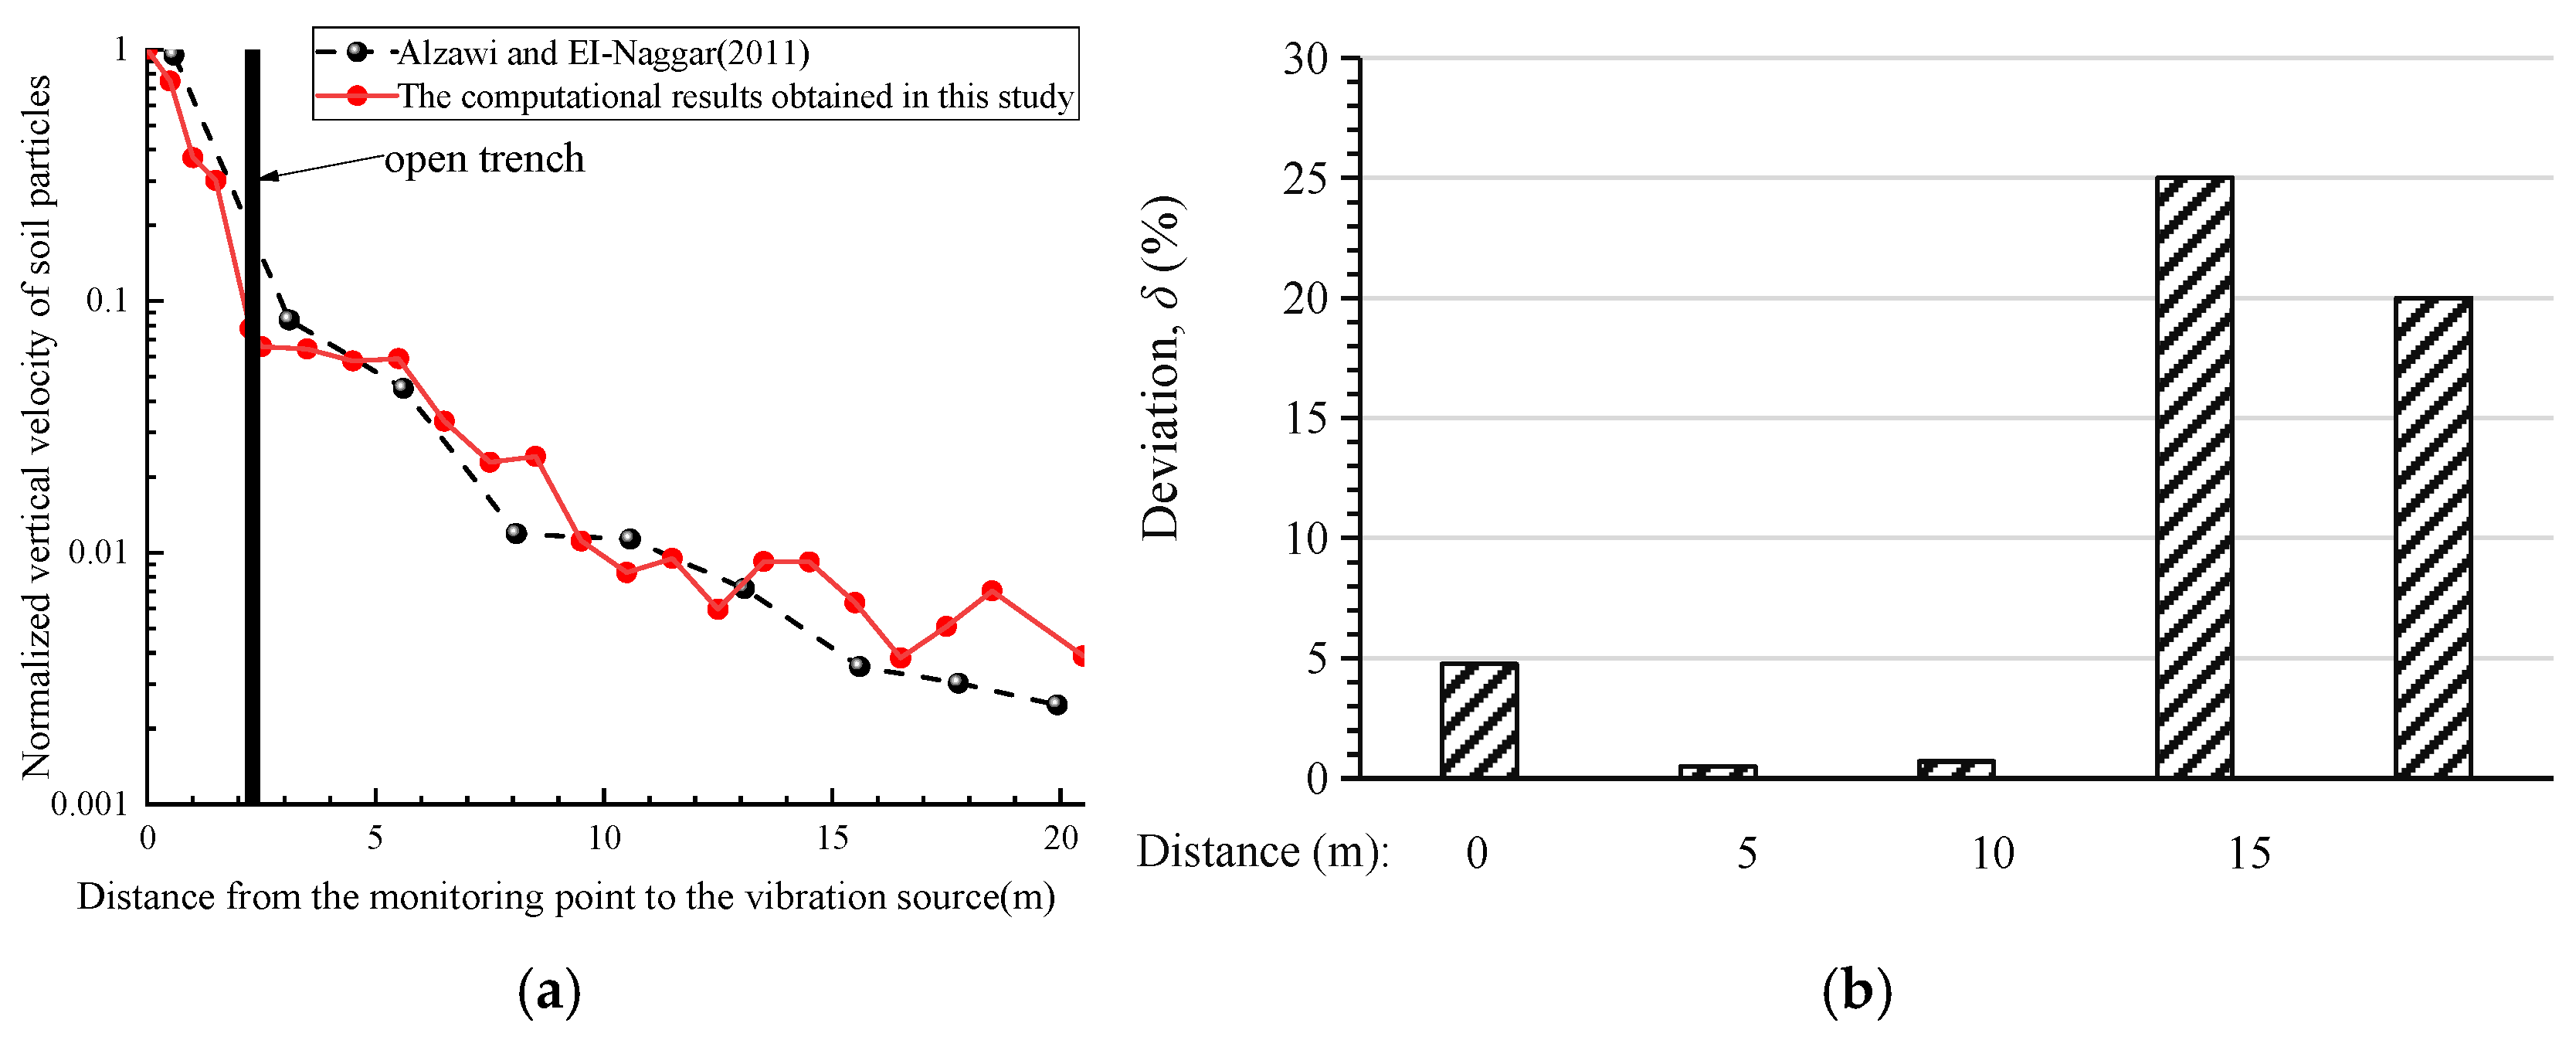
The validity of the 3D modeling strategy was assessed by comparison with the field data reported by Alzawi and El-Naggar (2011) [29]. For this purpose, the material stiffness and density of the rectangular hollow pipe barrier were reduced to zero so that the barrier degenerated into an open trench, thereby reproducing the validation scenario reported in the reference study. Figure 3 shows the corresponding numerical model, and Figure 4 compares the computed and measured responses.
Figure 3.
Three-dimensional finite-element model.
Figure 4.
Model validation results: (a) comparison between numerical results and experimental data; and (b) bar chart of relative deviation [29].
As shown in Figure 4a, the normalized vertical displacement decreases with increasing distance from the vibration source in both the numerical and experimental results. To quantify the agreement, the relative deviation was defined as
where VN and VE are the numerical and experimental values, respectively. The calculated deviations, shown in Figure 4b, range from 0% to 25%. Although some local discrepancies remain, the overall agreement is considered acceptable for the present parametric study, indicating that the proposed numerical model can capture the main vibration attenuation characteristics of the barrier–soil system. The validated modeling strategy—including the treatment of soil–structure interaction, the use of viscous absorbing boundaries, and the mesh discretization scheme—provides a reasonable basis for the subsequent parametric and optimization analyses. It is noted that numerical models calibrated against field measurements of similar wave-barrier problems are widely accepted in geotechnical vibration engineering for comparative studies, especially when direct experimental data for a specific novel barrier type are not yet available but the underlying physical mechanisms (wave reflection, scattering, and impedance contrast) remain the same.
3. Comparative Analysis of 3D and 2D Models
3.1. 2D Plane-Strain Model
A full three-dimensional parametric analysis of horizontally buried rectangular hollow pipe barriers is computationally expensive, particularly when the model is coupled with automated scripting for large-scale design exploration. Since the present loading condition corresponds to a strip harmonic excitation and the barrier extends continuously in the out-of-plane direction, the problem can be approximated as a plane-strain problem. On this basis, an equivalent two-dimensional finite-element model was established in Plaxis 2D to replace the 3D model in the subsequent large-scale parametric and optimization analyses.
The dimensions of the 2D model were 100 m × 20 m (length × height), and the soil domain was discretized using 15-node triangular elements. The same baseline soil and barrier material parameters adopted in the 3D model were used in the 2D analysis. The bottom boundary was fixed, and the lateral boundaries were restrained in the normal direction. Viscous absorbing boundaries were again adopted with C1 = 1.0 and C2 = 0.25. To improve solution accuracy in the wave-dominant region, the upper 10 m of the soil layer was refined. The model was subjected to the same harmonic excitation frequency of 31 Hz, and the material response was also assumed to remain linear elastic.
3.2. Comparison Between 2D and 3D Results
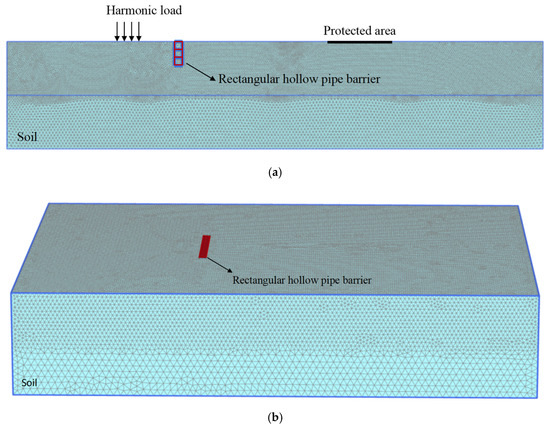
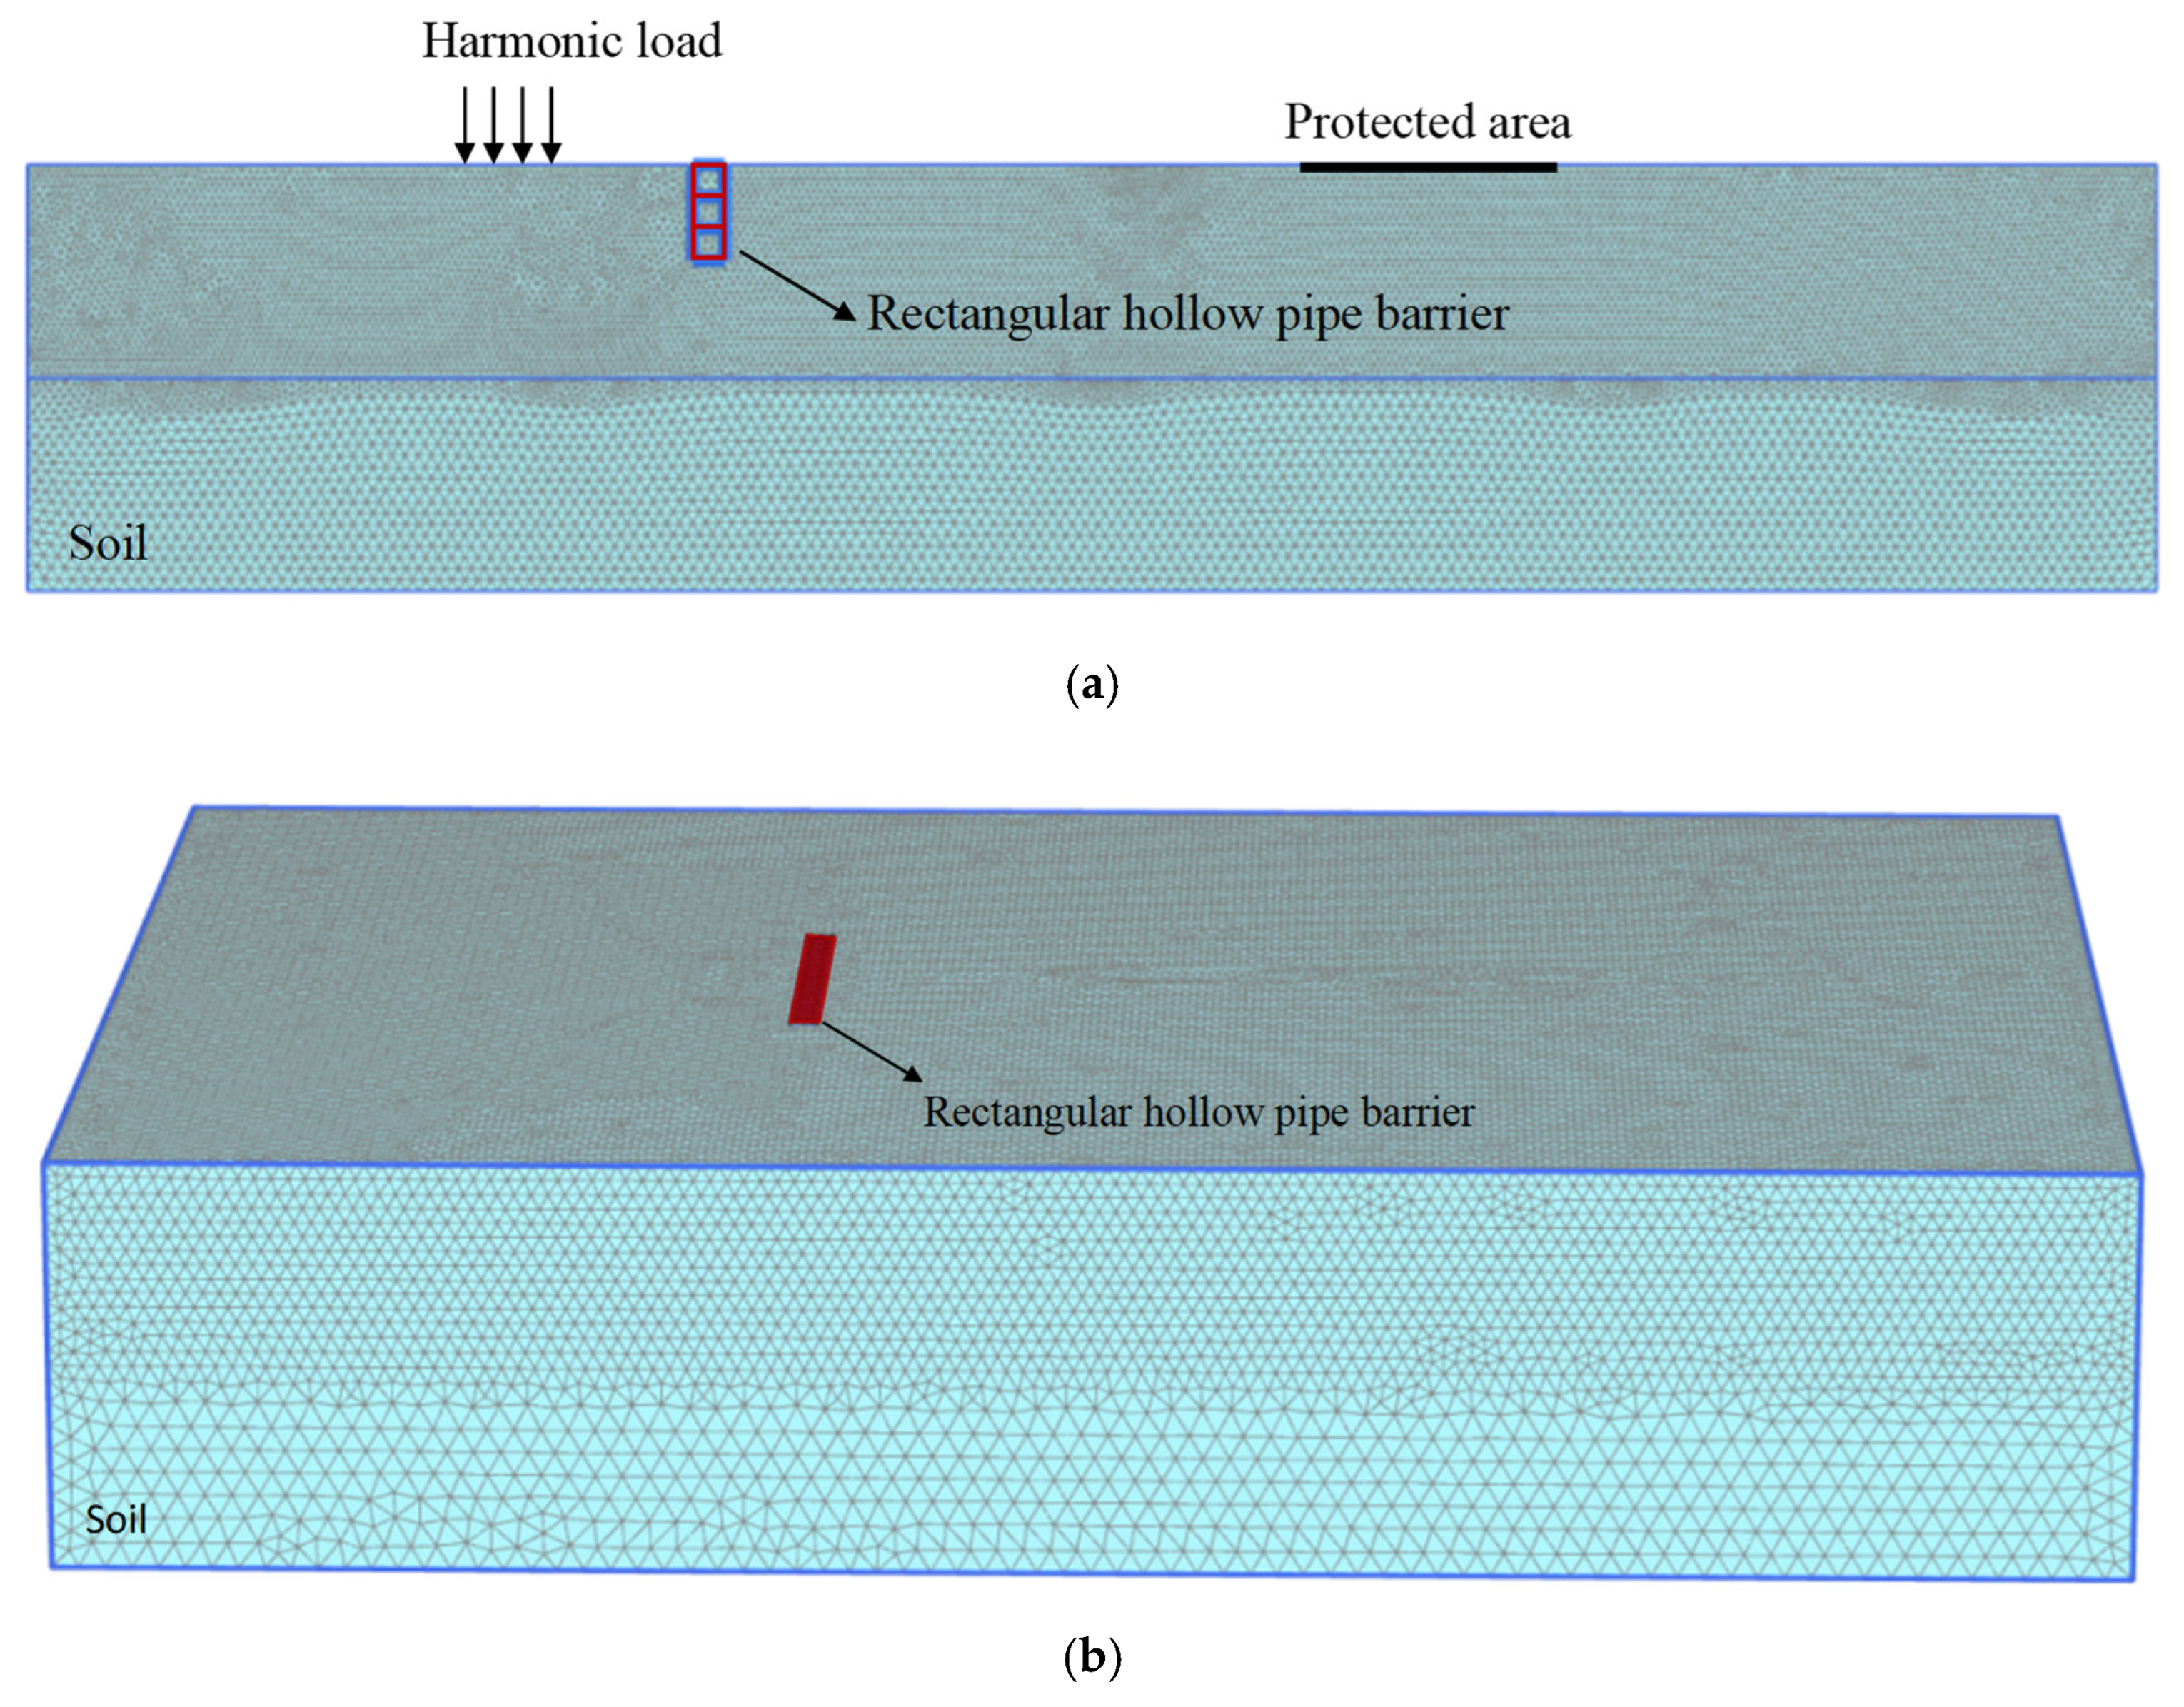
To evaluate whether the 2D plane-strain model can serve as a reliable surrogate for the 3D model, both models were analyzed under identical geometric, material, and loading conditions. Figure 5a,b show the corresponding 2D and 3D finite-element meshes. In the 3D model, the strip load length and barrier length were taken as 10 m and 80 m, respectively, while all other key parameters were kept consistent with those of the 2D model.
Figure 5.
Two-dimensional and three-dimensional finite-element meshes in Plaxis: (a) 2D finite-element mesh; and (b) 3D finite-element mesh.
To quantify the vibration isolation performance at a monitoring point, the velocity amplitude attenuation ratio, ARR, is defined as
where Vb and V0 denote the peak velocity amplitudes at the same monitoring point with and without the barrier, respectively. Accordingly, a smaller ARR indicates better vibration isolation performance.
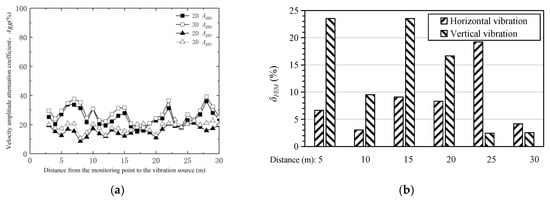
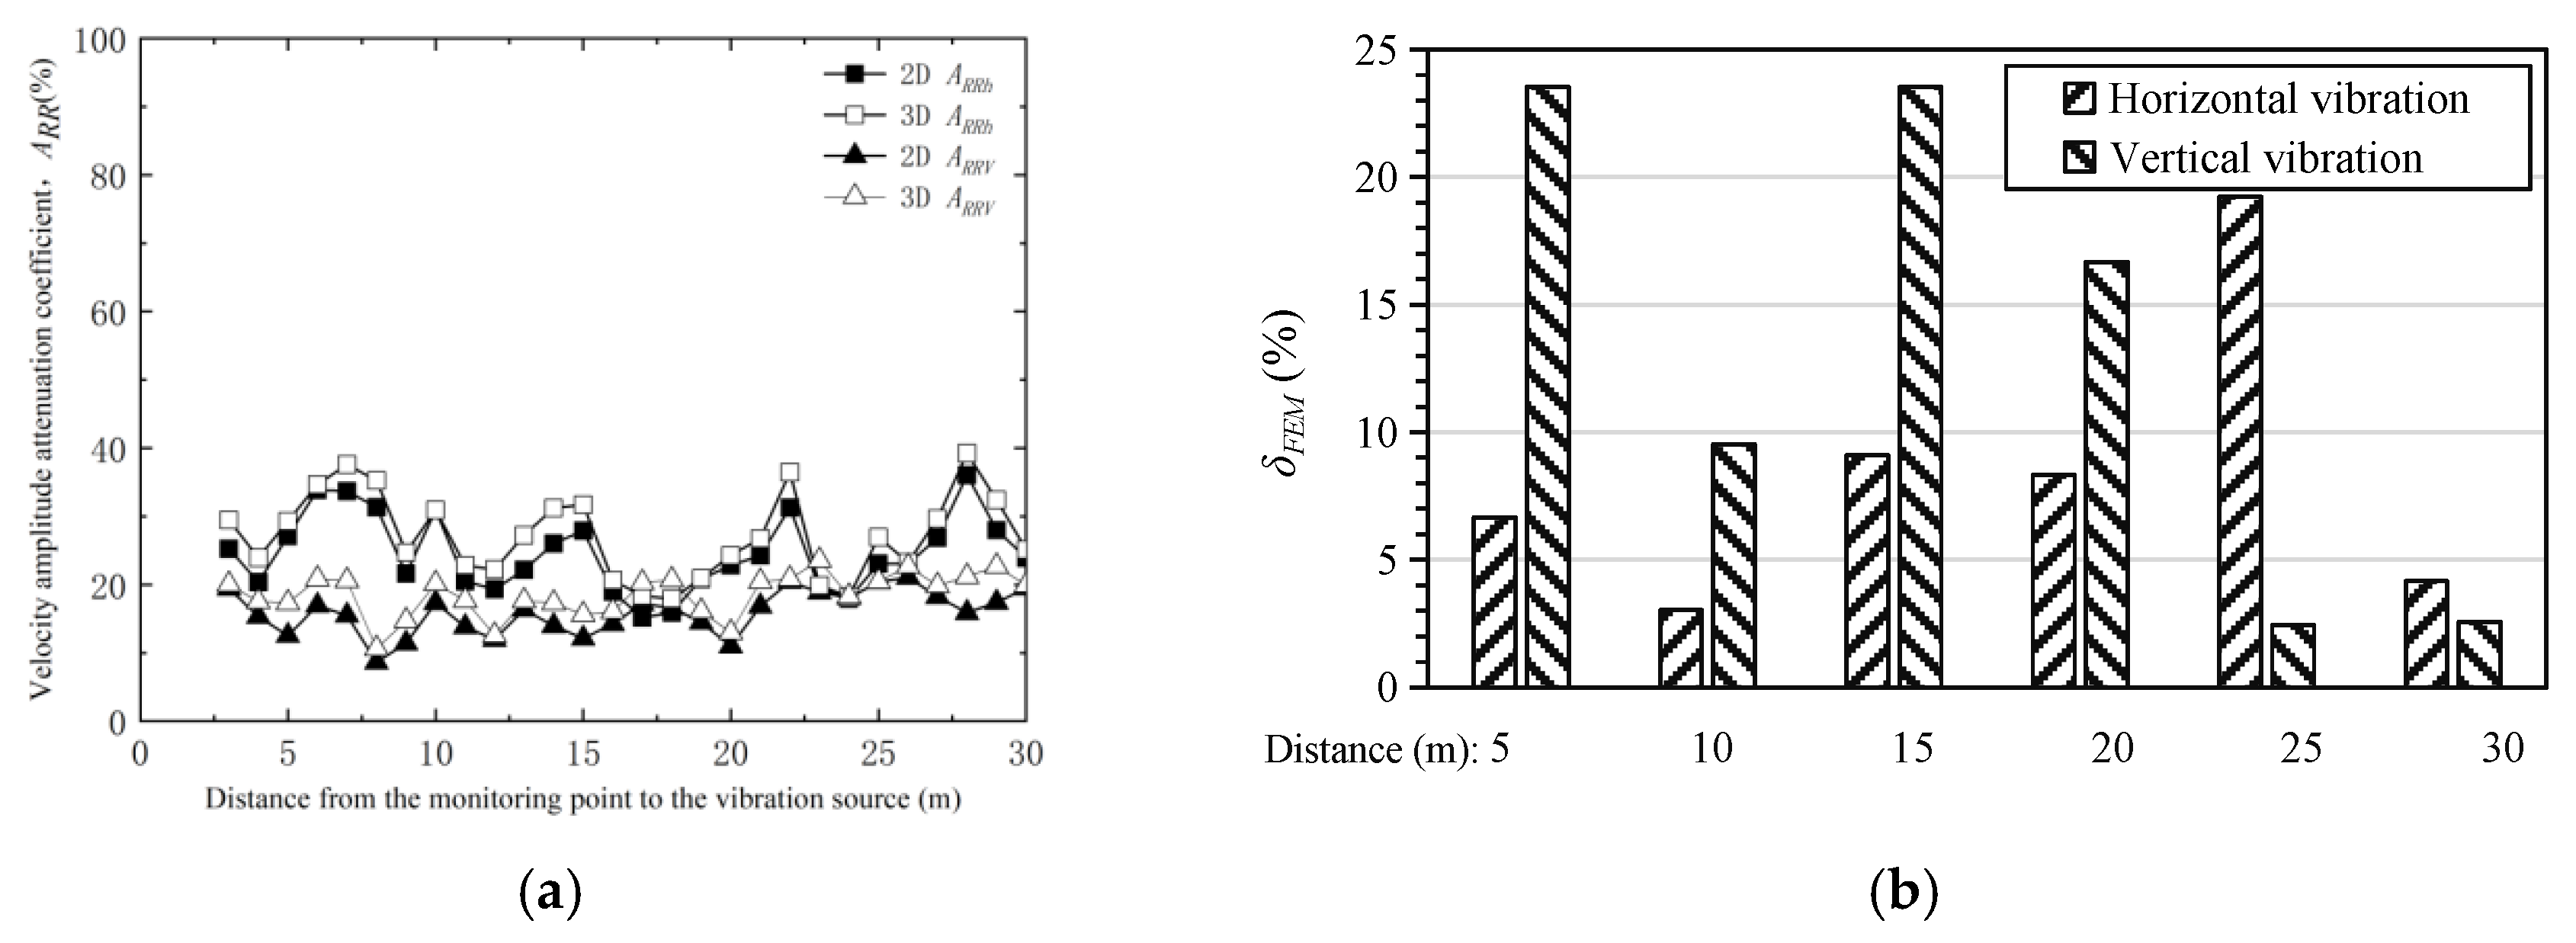
Figure 6a compares the velocity amplitude attenuation ratio, ARR, at different monitoring points obtained from the two models. The 2D and 3D results follow similar spatial trends, and the average deviation between them is less than 10%. The deviation was quantified as
where and are the attenuation ratios obtained from the two-dimensional and three-dimensional analyses, respectively. As shown in Figure 6b, the pointwise deviation ranges approximately from 3% to 24%, with the 2D model generally yielding slightly lower attenuation estimates than the 3D model. The 2D model is intended for comparative parametric screening rather than exact replacement of the 3D response at every monitoring point.
Figure 6.
Comparison between 2D and 3D numerical results: (a) variation in ARR with distance; and (b) bar chart of deviation.
These results indicate that the two-dimensional plane-strain model can reproduce the overall vibration isolation trend of the three-dimensional model with acceptable accuracy, while requiring substantially less computational effort. It was therefore adopted as the surrogate model for the subsequent automated parametric optimization.
4. Parametric Analysis Results and Discussion
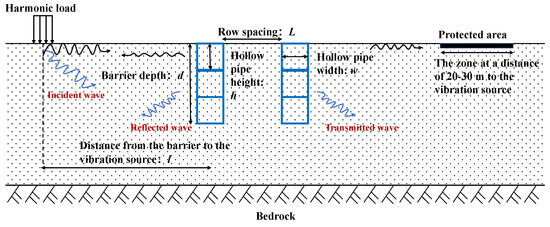
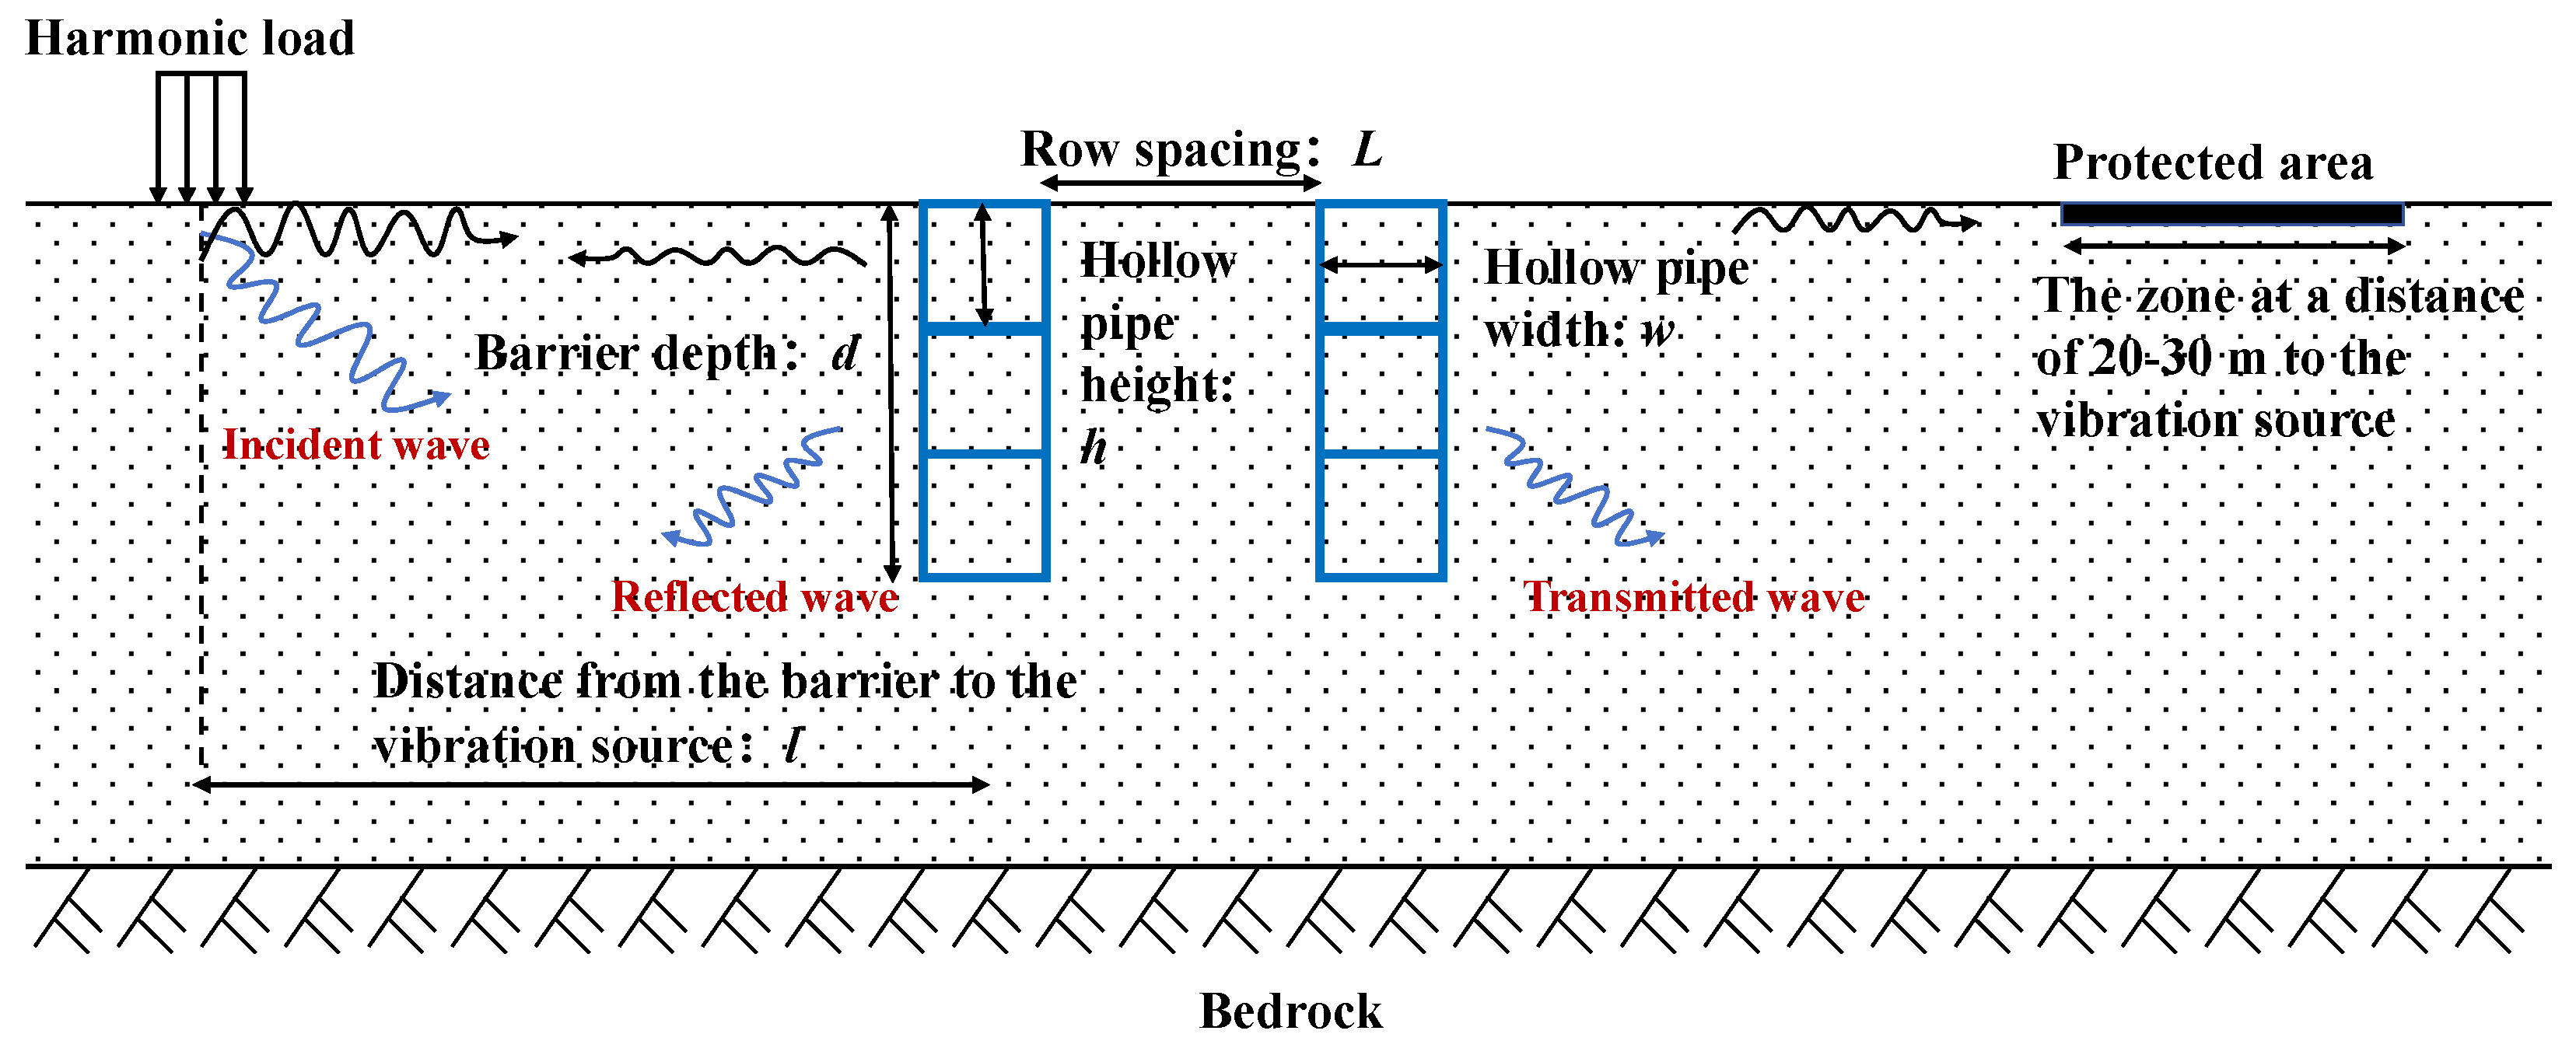
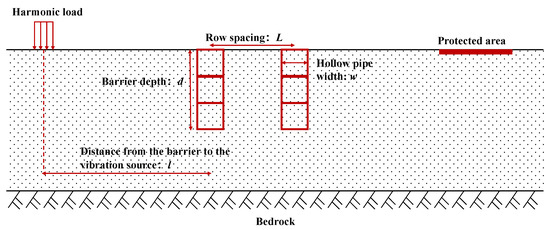
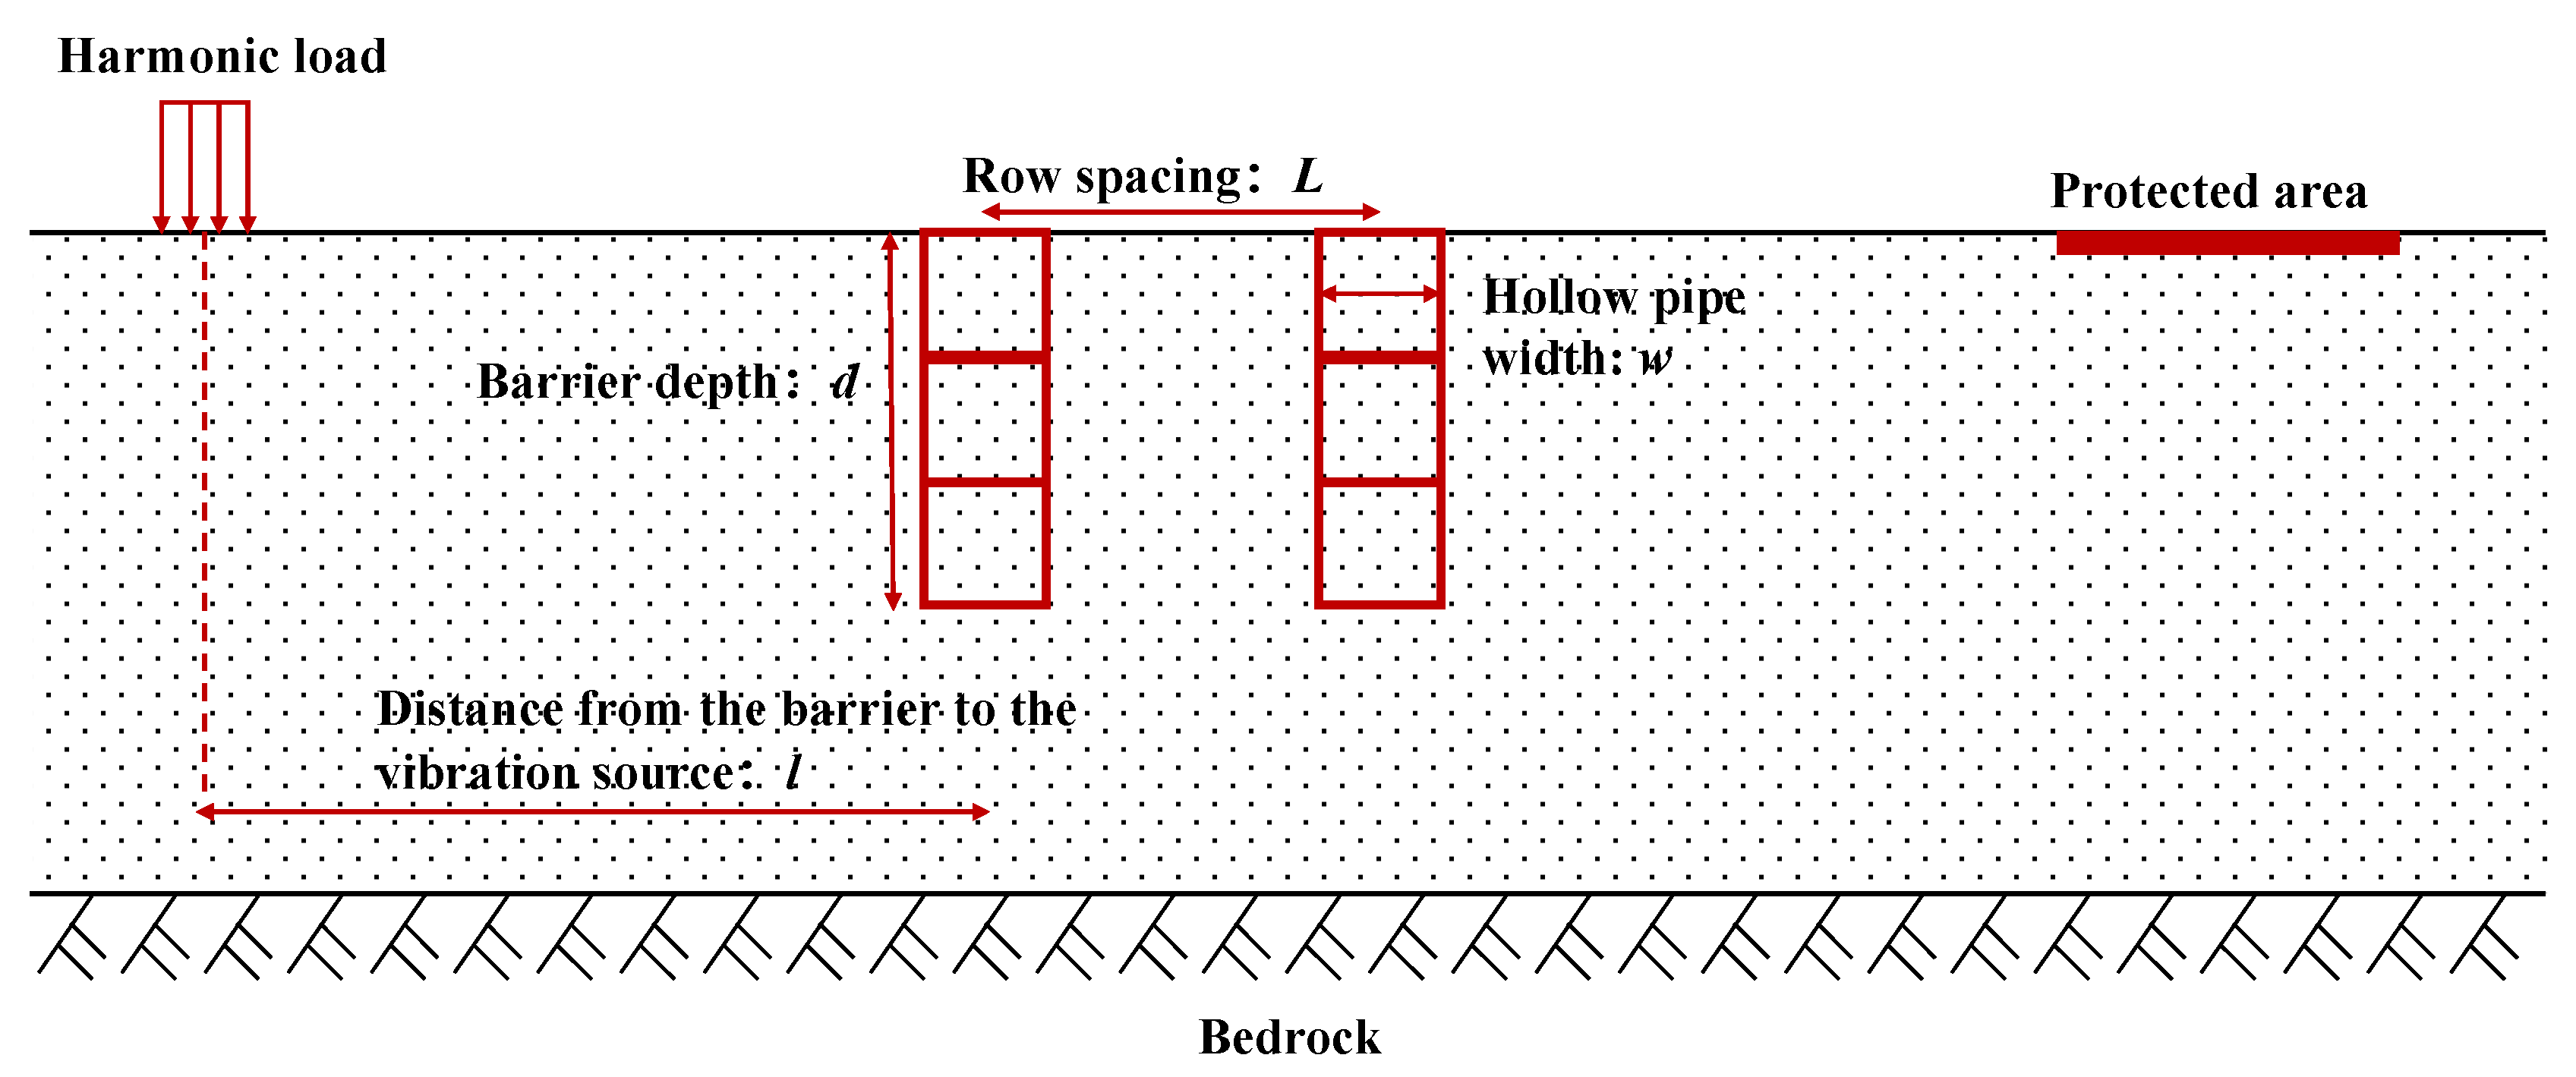
This section systematically evaluates how the key geometric and material parameters affect the vibration isolation performance of horizontally buried rectangular hollow pipe barriers (as shown in Figure 7). The underlying physical mechanisms are discussed alongside the parametric trends to provide a comprehensive understanding. The barrier performance is quantified by the average attenuation coefficients for horizontal (Arh) and vertical (Arv) vibrations, as defined in Equation (5); lower values indicate better isolation.
where x is the length of the protected area. The corresponding average attenuation coefficients for horizontal and vertical vibrations are denoted by Arh and Arv, respectively. Since smaller values of Ar indicate lower transmitted vibration amplitudes, lower Arh and Arv correspond to better isolation performance.
Figure 7.
Schematic diagram of the rectangular hollow pipe barrier for vibration isolation.
4.1. Influence of Barrier Geometry
The geometric parameters investigated include the burial depth, barrier width, position relative to the source, number of rows, and row spacing. Their individual and coupled effects are discussed below, with an emphasis on the physical mechanisms governing the observed trends.
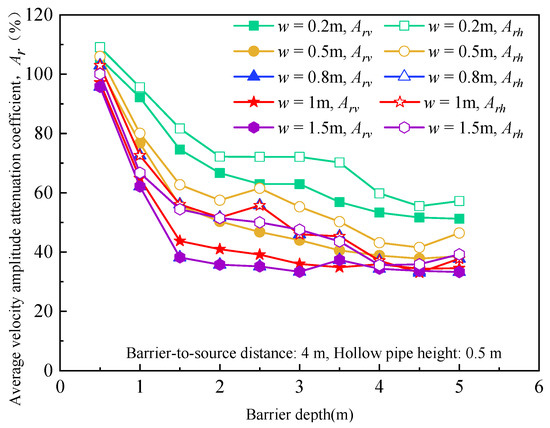
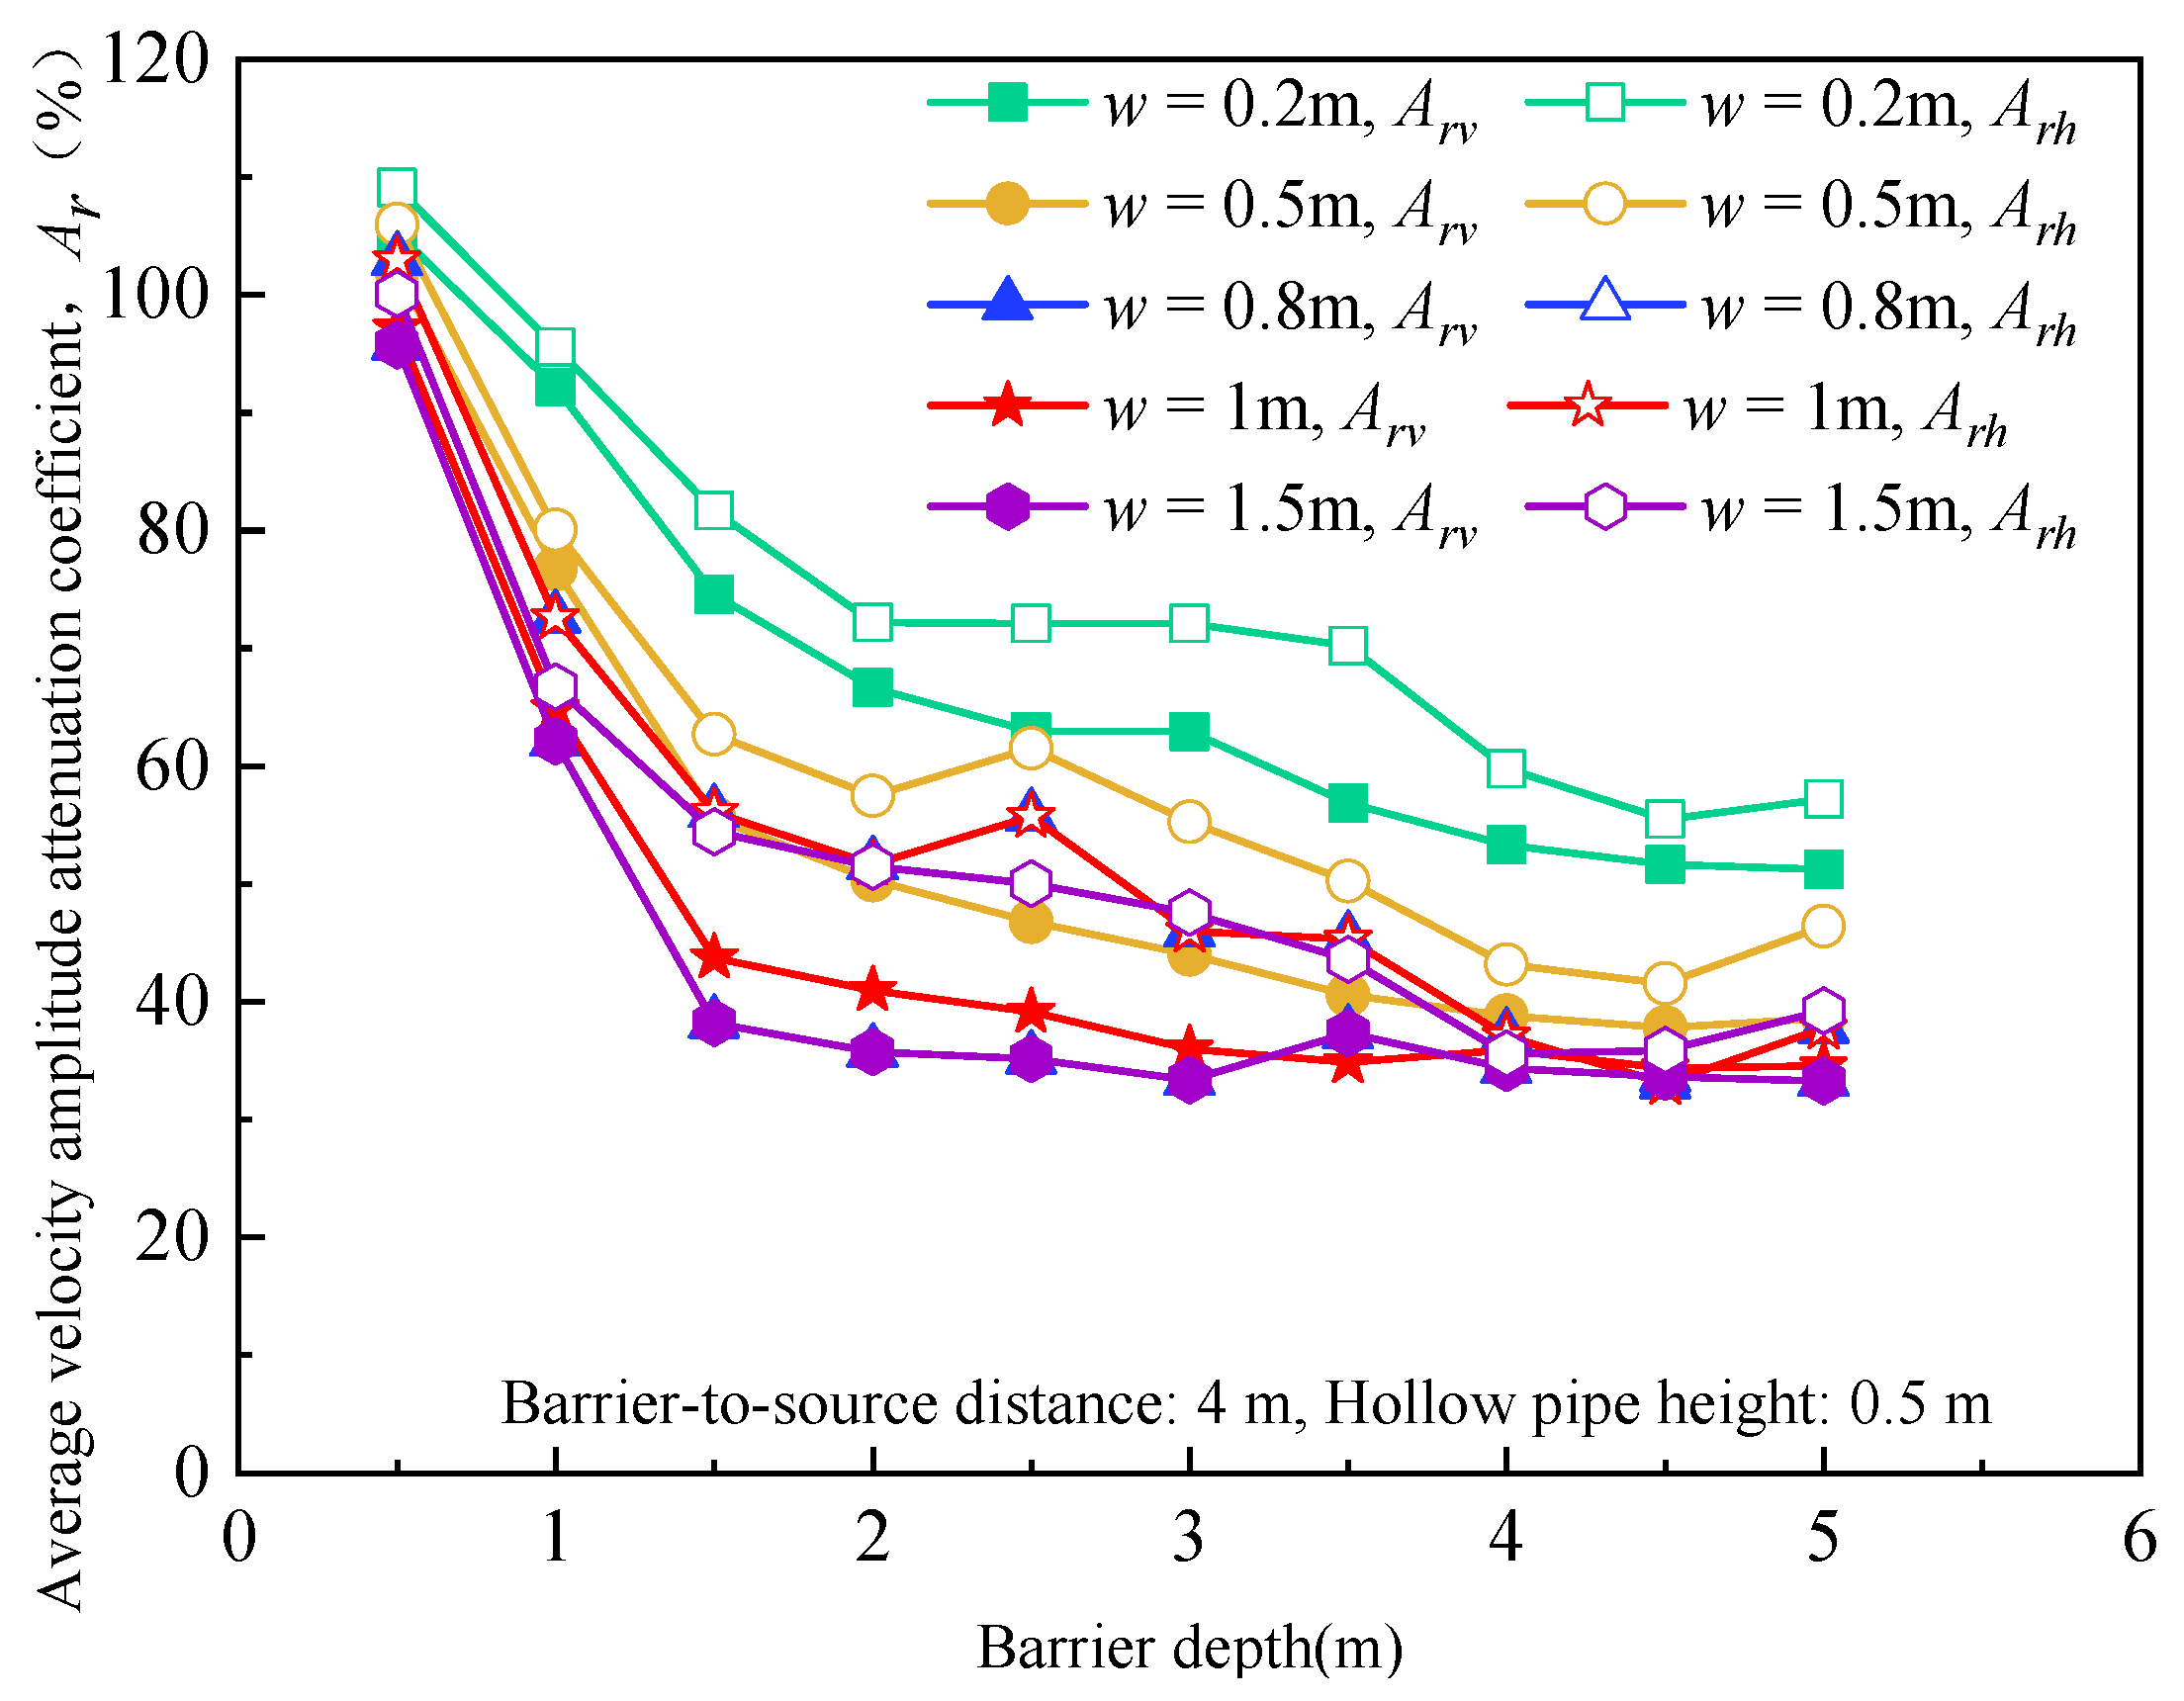
Barrier Depth. When the barrier was located 4 m from the vibration source and the height of a single rectangular hollow pipe was fixed at 0.5 m, the barrier depth was varied by changing the number of buried pipes. Figure 8 shows the average attenuation coefficients under different barrier depths. As the barrier depth increases, both Arh and Arv decrease rapidly at first and then gradually stabilize. The most pronounced improvement occurs between 0.5 m and 1.5 m; beyond this depth, the isolation performance continues to improve, but the rate of improvement becomes noticeably slower. In all cases, vertical vibration is attenuated more effectively than horizontal vibration.
Figure 8.
Influence of barrier depth on vibration isolation performance.
This trend is directly linked to the propagation characteristics of Rayleigh-wave-dominated surface vibration. For the soil properties considered (Rayleigh wavelength λR ≈ 3 m), most of the wave energy is concentrated within roughly one wavelength from the surface. Increasing the barrier depth therefore allows a larger fraction of the shallow wave field to be intercepted. Once the barrier depth approaches the effective penetration depth of the surface wave, the additional barrier segment lies outside the zone of significant dynamic stress, and further deepening contributes little to screening. This explains the performance plateau observed at depths greater than approximately 3 m. The results also show that width and depth are coupled: when depth is shallow (<~3 m), increasing width offers clear benefits; once depth is sufficient, the responses for widths greater than about 0.5 m become similar, while the 0.2 m width case consistently performs poorly. From a design perspective, depth is a primary parameter, but increasing it beyond about 3 m is rarely efficient unless specific site conditions require deeper placement to intercept body wave paths.
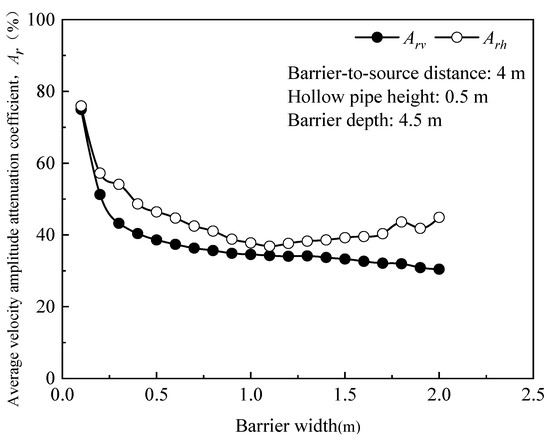
Barrier Width. With the barrier depth fixed at 4.5 m, the barrier-to-source distance maintained at 4 m, and the height of a single hollow pipe set at 0.5 m, the influence of barrier width on vibration isolation performance is shown in Figure 9. Both Arh and Arv decrease rapidly at first and then gradually stabilize as the width increases. The sensitivity to width is strongest when the barrier is relatively narrow, particularly when the width is no greater than about 0.5 m. Beyond this range, further widening provides only limited additional improvement. The horizontal attenuation coefficient remains consistently larger than the vertical one, again indicating that vertical vibration is attenuated more effectively than horizontal vibration.
Figure 9.
Influence of barrier width on vibration isolation performance.
The physical mechanism is similar to that observed for barrier depth. A wider barrier enlarges the effective obstacle encountered by the incoming wave field, thereby increasing the extent of reflection, scattering, and diffraction. When the width is very small, waves can more easily bypass the barrier, so the isolation performance is highly sensitive to width. Once the width exceeds a threshold, however, the barrier already occupies a sufficiently large portion of the effective propagation region, and the marginal benefit of additional width becomes small. For engineering design, width should be treated as a threshold-type parameter rather than a variable that must be increased indefinitely. Widths below about 0.5 m lead to clear performance degradation, whereas moderate widths already capture most of the attainable benefit.
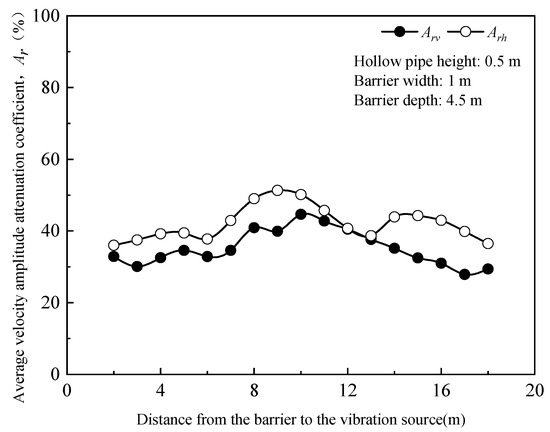
Barrier Position. The influence of barrier position was studied by fixing the barrier depth and width at 4.5 m and 1 m, respectively, while maintaining a source-to-protected-area distance of 20 m. Figure 10 presents the variation in average attenuation coefficients with barrier-to-source distance. The results show that both Arh and Arv vary in an oscillatory manner as the barrier-to-source distance increases. Nevertheless, the more favorable configurations are concentrated in two regions: close to the vibration source and close to the protected area.
Figure 10.
Influence of barrier position on vibration isolation performance.
This behavior reflects two distinct isolation mechanisms. When the barrier is placed near the source, it behaves more like an active isolation measure by intercepting the vibration field before wave energy has spread significantly into the surrounding soil. When the barrier is placed near the protected area, it functions more as a passive screening measure by blocking incoming waves immediately before they reach the target zone. By contrast, intermediate positions are generally less favorable because the barrier neither intercepts the concentrated near-source wave field nor provides direct shielding near the receiver. The oscillatory variation is also consistent with interference effects among incident, reflected, and diffracted waves. Since the relative phase relationship changes with barrier position, the resulting attenuation is not monotonic. In practical terms, barrier position should be optimized rather than selected purely by convenience. Where site conditions permit, placing the barrier either near the source or near the protected area is preferable to placing it in an arbitrary intermediate position.
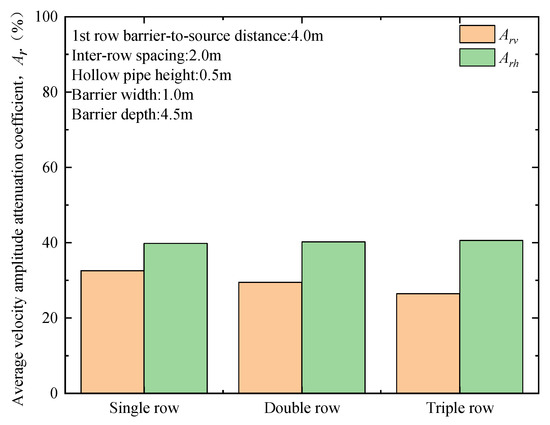
Number of Barrier Rows. In this analysis, the first barrier row was maintained at 4 m from the vibration source, while the row spacing, barrier depth and width were fixed at 2 m, 4.5 m, and 1 m, respectively. Figure 11 shows the average attenuation coefficients for barriers with different numbers of rows. As the number of rows increases from one to three, Arv decreases noticeably, indicating improved vertical vibration isolation. The improvement in vertical isolation efficiency is approximately 6% from one row to three rows. In contrast, the horizontal attenuation coefficient changes only slightly, indicating that row number has a relatively limited effect on horizontal vibration isolation under the present conditions.
Figure 11.
Influence of the number of barrier rows on vibration isolation performance.
The greater benefit for vertical vibration can be attributed to cumulative screening. Multiple rows provide repeated opportunities for wave reflection and scattering, gradually reducing the transmitted energy of the dominant surface-wave motion. This layered shielding effect appears to be more effective for vertical motion, whereas horizontal motion is less sensitive to repeated geometric blockage and more dependent on the overall redistribution of wave energy within the soil. Therefore, multi-row layouts can be useful when vertical vibration control is a primary design objective or when a single row is insufficient. However, because the gain is moderate rather than dramatic, additional rows should be justified against the increased construction footprint and cost.
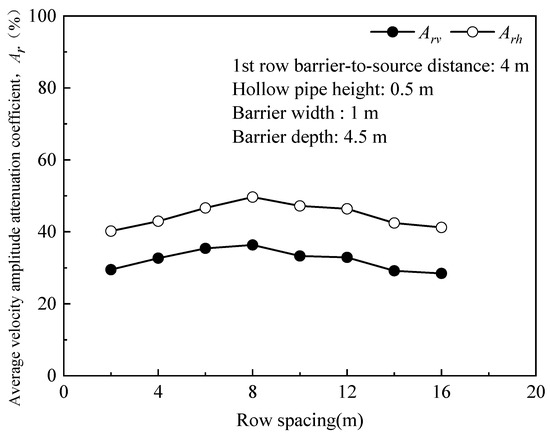
Barrier Row Spacing. To investigate the effect of row spacing in double-row rectangular hollow pipe barriers, the barrier depth and width were fixed at 4.5 m and 1 m, and the first row was located 4 m from the vibration source. The spacing between rows was then varied from 2 m to 16 m. Figure 12 shows the corresponding average attenuation coefficients. The results indicate that the average attenuation coefficient first increases and then decreases slightly with increasing row spacing. This implies that relatively small spacing, or alternatively a configuration in which the second row lies closer to the protected area, is beneficial for vibration isolation. This non-monotonic trend shows that the two rows do not act independently. When the rows are close together, they behave more like a composite barrier with stronger cumulative impedance contrast and reduced transmission through the inter-row region. When the second row is positioned farther downstream and closer to the protected area, it can again provide a strong shielding effect before waves enter the protected zone. Intermediate spacing appears less favorable because the transmitted wave field has sufficient space to reorganize between rows, thereby weakening the cumulative screening effect.
Figure 12.
Influence of row spacing on vibration isolation performance.
Hence, row spacing should be treated as an optimization variable rather than a purely geometric construction parameter. Properly chosen spacing can improve the performance of a double-row system, whereas arbitrary spacing may fail to realize the benefit of the additional row.
4.2. Influence of Barrier Material Properties
The material parameters of the hollow pipe—Young’s modulus, density, Poisson’s ratio, and damping ratio—are examined below. Their influence is interpreted in the context of impedance contrast and small-strain dynamics.
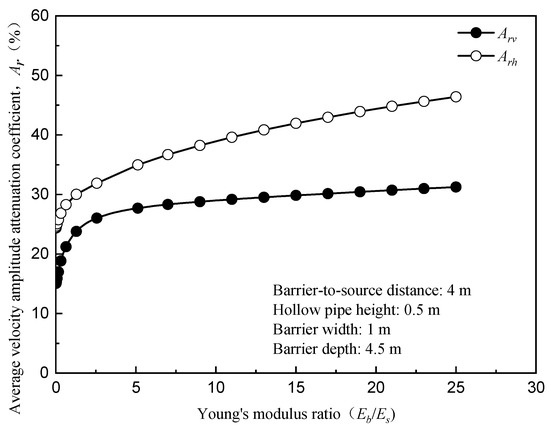
Young’s Modulus. Figure 13 shows the influence of the Young’s modulus ratio Eb/Es, where Eb and Es denote the Young’s moduli of the hollow pipe and soil, respectively. The modulus ratio was varied from 0.01 to 25 to cover a broad range of stiffness contrasts. As Eb/Es increases from very small values, both Arh and Arv increase rapidly at first and then gradually stabilize. The strongest sensitivity occurs in the low-stiffness range, especially when Eb/Es < 0.64. Once the modulus ratio exceeds about 5.12, further increases in stiffness produce little additional change in vibration isolation performance. This behavior is governed by stiffness contrast. When the barrier stiffness approaches zero, the system tends toward the limiting case of an open trench, which is known to provide strong screening because of the extreme impedance discontinuity. As the barrier becomes stiffer, the impedance contrast changes rapidly, which strongly affects wave reflection and transmission. Once the barrier is already much stiffer than the surrounding soil, however, further increases in stiffness do not substantially alter the relative contrast, so the isolation performance enters a saturation regime.
Figure 13.
Influence of the Young’s modulus of the hollow pipe on vibration isolation performance.
This result has direct practical significance. Common construction materials such as reinforced concrete and steel both fall well above the identified threshold. For example, reinforced concrete in the present study corresponds to Eb/Es ≈ 587, which is already deep within the saturation range. Therefore, using a material much stiffer than reinforced concrete is unlikely to yield meaningful performance gains. Reinforced concrete is thus a practical and economical choice because it provides sufficient stiffness, structural reliability, and good constructability without the unnecessary cost associated with steel.
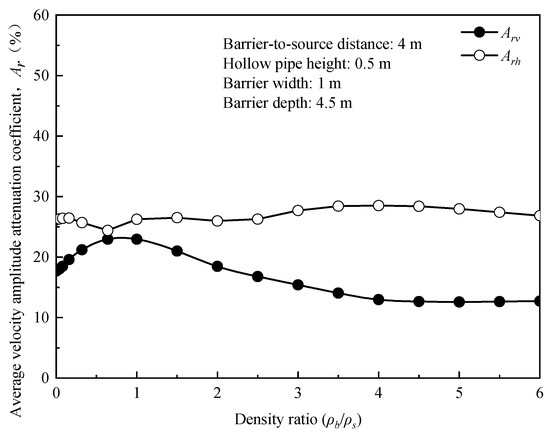
Hollow Pipe Density. Figure 14 examines the effect of the hollow pipe-to-soil density ratio ρb/ρs on vibration isolation efficiency, with the barrier-to-source distance, width, and depth fixed at 4 m, 1 m, and 4.5 m, respectively. The results reveal clear differences between horizontal and vertical vibration isolation. For horizontal vibration, Arh changes only moderately over the investigated density range, with a broad optimum occurring near ρb/ρs ≈ 0.9. For vertical vibration, the sensitivity is much stronger: Arv increases initially, reaches a peak near ρb/ρs ≈ 0.9, and then gradually stabilizes at a lower level as the density ratio increases further.
Figure 14.
Influence of the hollow pipe-to-soil density ratio (ρb/ρs) on vibration isolation performance.
This contrast indicates that density affects not only impedance but also inertial interaction between the barrier and the surrounding soil. For vertical vibration, heavier barriers tend to participate more strongly in the vertical motion and may transmit part of the incoming energy rather than screen it effectively. Lighter barriers, by contrast, preserve the geometric blockage effect more efficiently. For horizontal vibration, the response is less sensitive to density, suggesting that geometry and stiffness contrast play more dominant roles than mass contrast alone. From a design standpoint, density should be selected with reference to the target vibration mode. If vertical vibration reduction is the main objective, lighter materials are advantageous provided that structural requirements remain satisfied. The reinforced-concrete baseline case still offers a reasonable engineering compromise, because it remains within an acceptable performance range while also providing good availability, durability, and structural capacity.
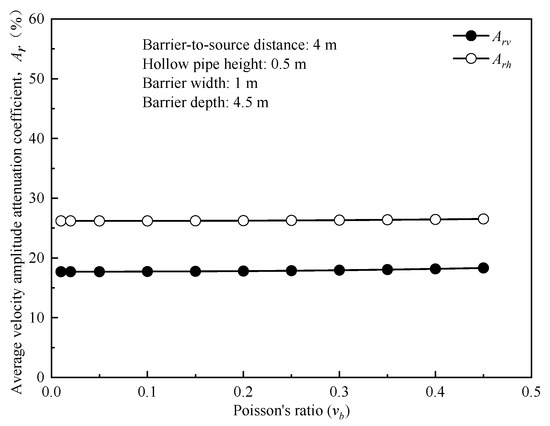
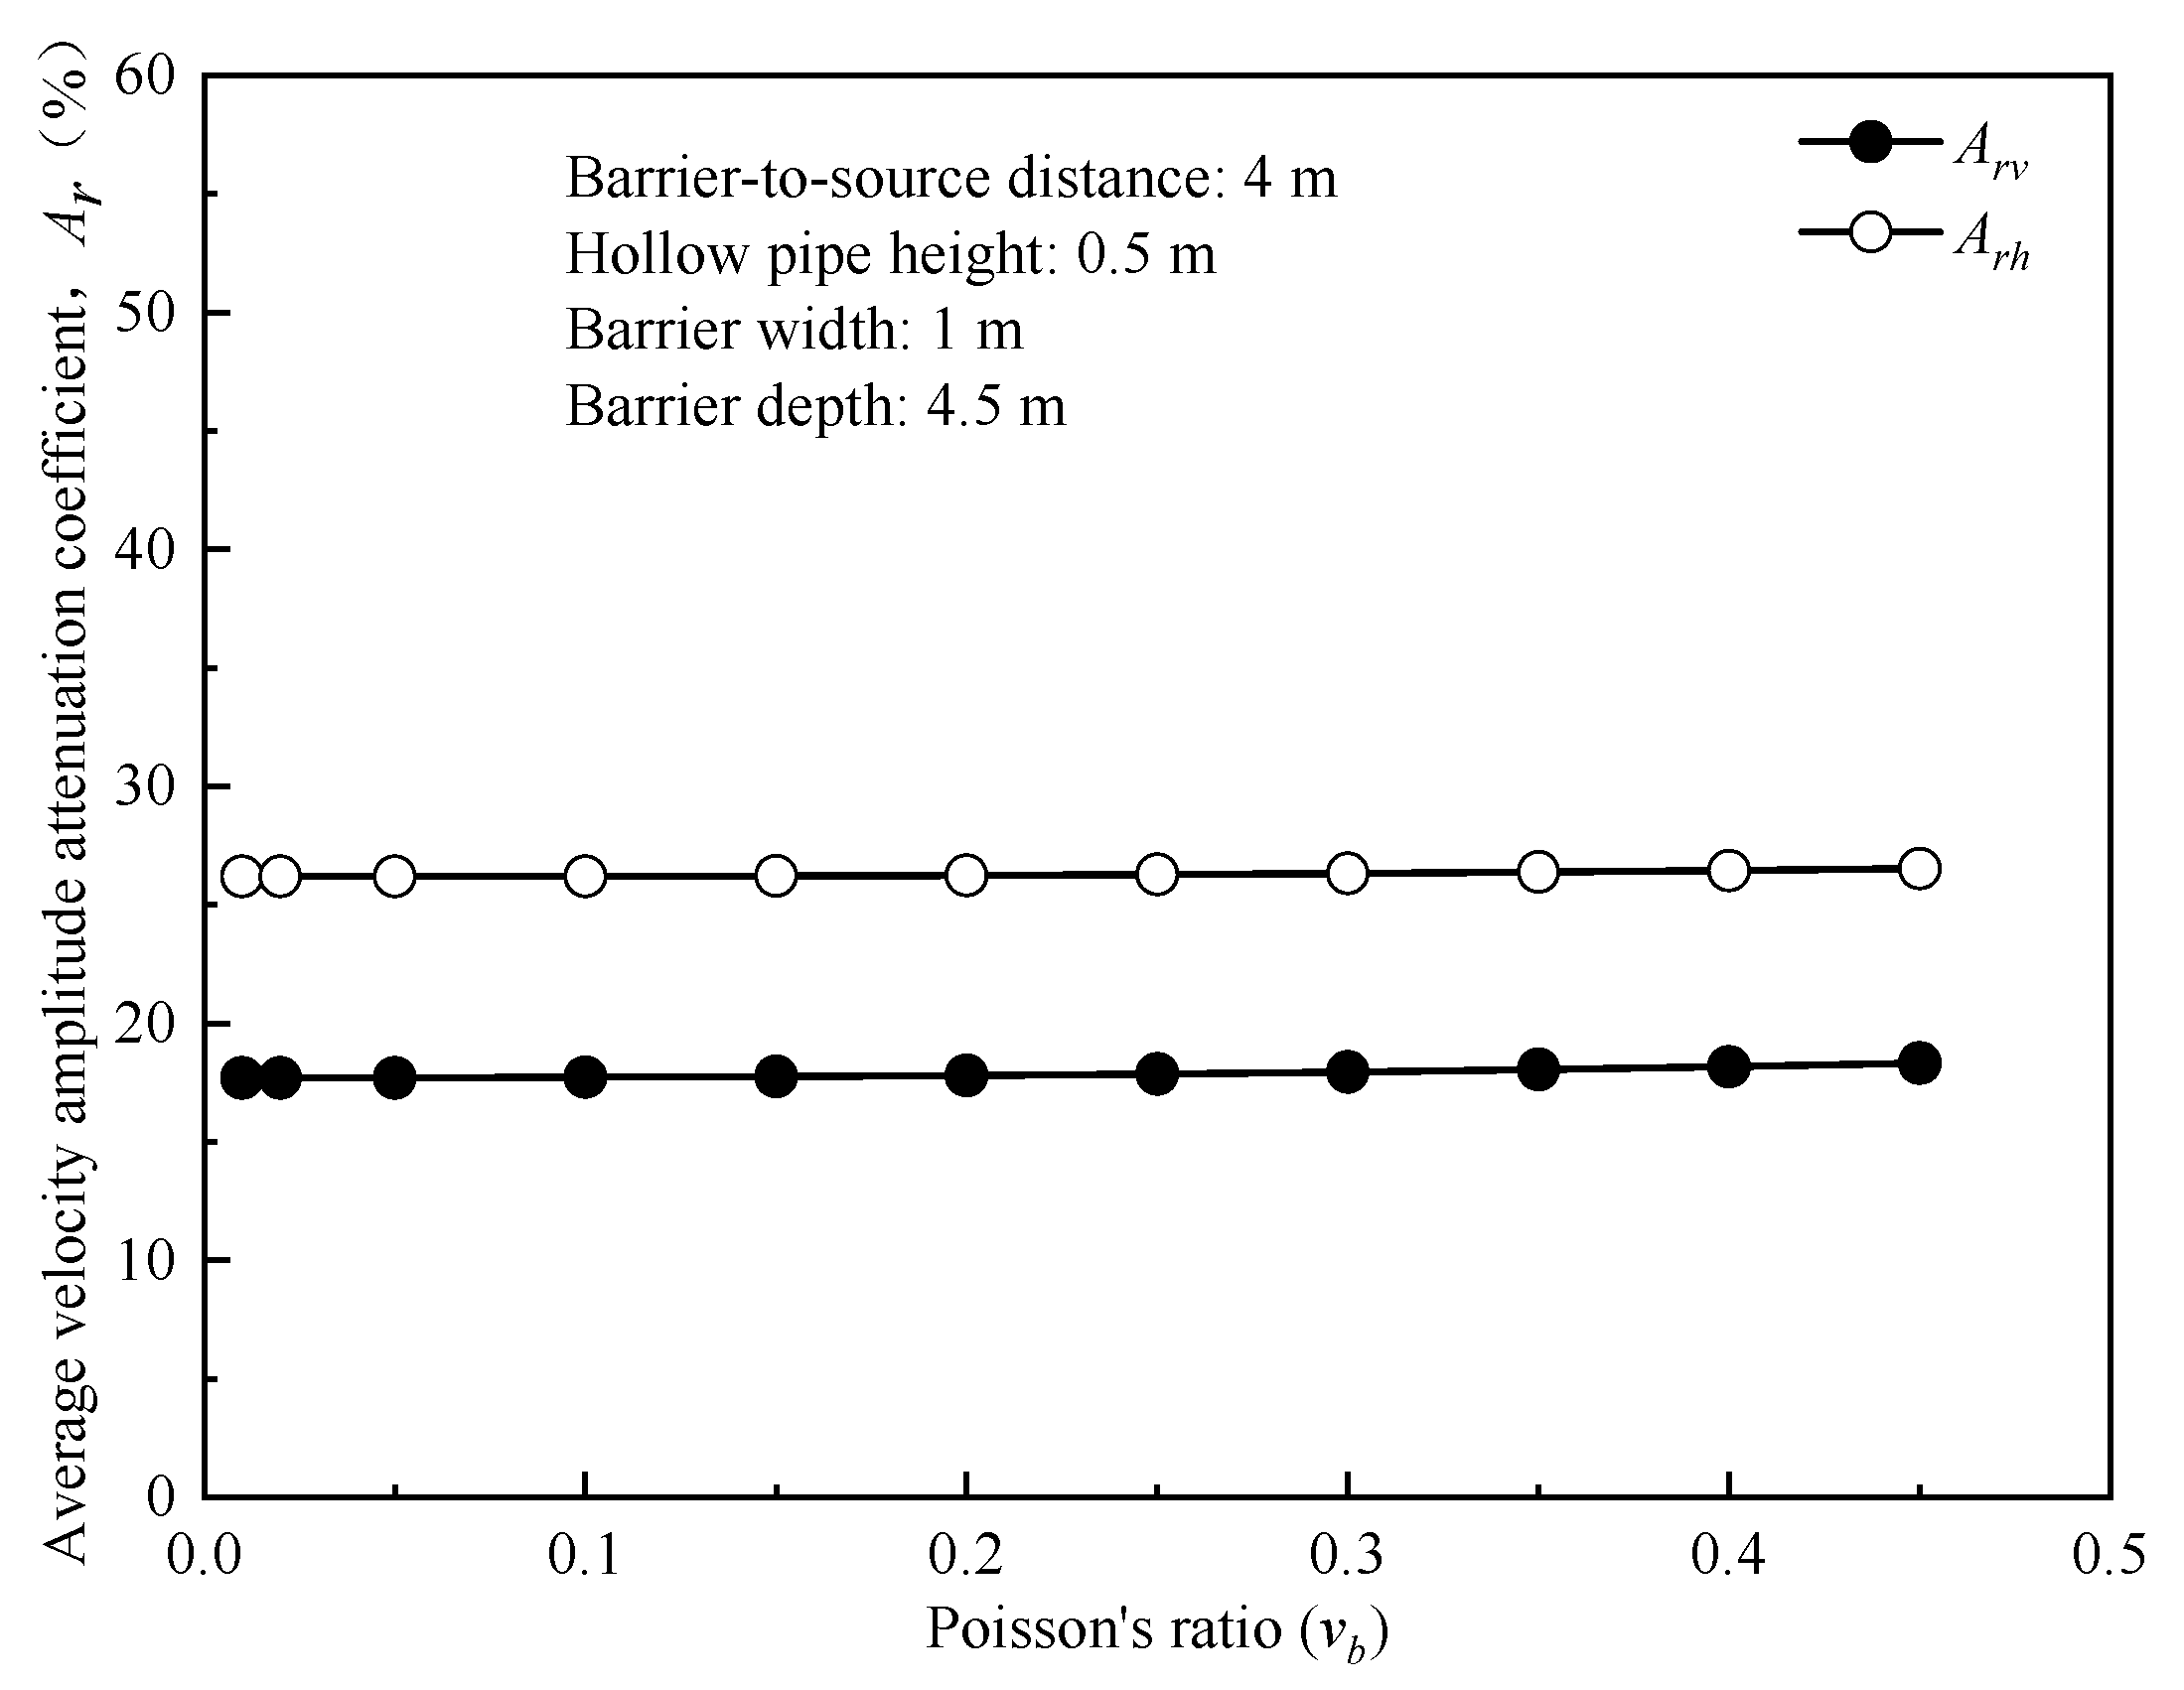
Hollow Pipe Poisson’s Ratio. Figure 15 shows the influence of the hollow pipe Poisson’s ratio νb on vibration isolation efficiency for fixed barrier geometry and loading conditions. The results demonstrate negligible sensitivity of both vertical and horizontal isolation to Poisson’s ratio. The vertical attenuation coefficient remains approximately constant at about 18%, and the horizontal coefficient remains close to about 26%, with only very small fluctuations over the full range of νb.
Figure 15.
Influence of the Poisson’s ratio of the hollow pipe on vibration isolation performance.
This insensitivity is consistent with the governing physics of the present problem. Under small-strain linear-elastic conditions, the dominant screening mechanisms are controlled primarily by geometric blockage and by stiffness and density contrasts between the barrier and the soil. By comparison, Poisson’s ratio mainly affects the coupling between volumetric and shear deformation and therefore has only a secondary influence on the global wave-transmission pattern for the parameter range considered here. Consequently, Poisson’s ratio does not need to be regarded as a primary design parameter for vibration isolation. It may instead be selected according to structural design requirements or material availability without materially affecting barrier performance.
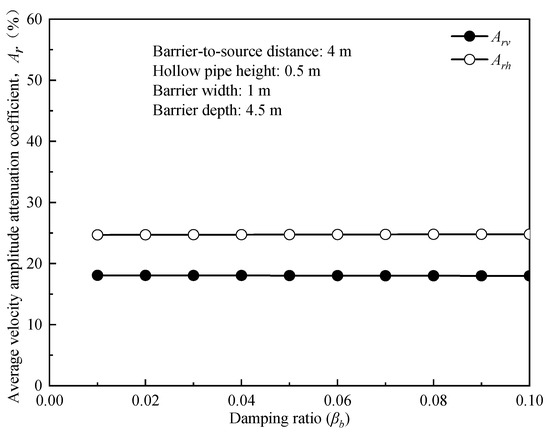
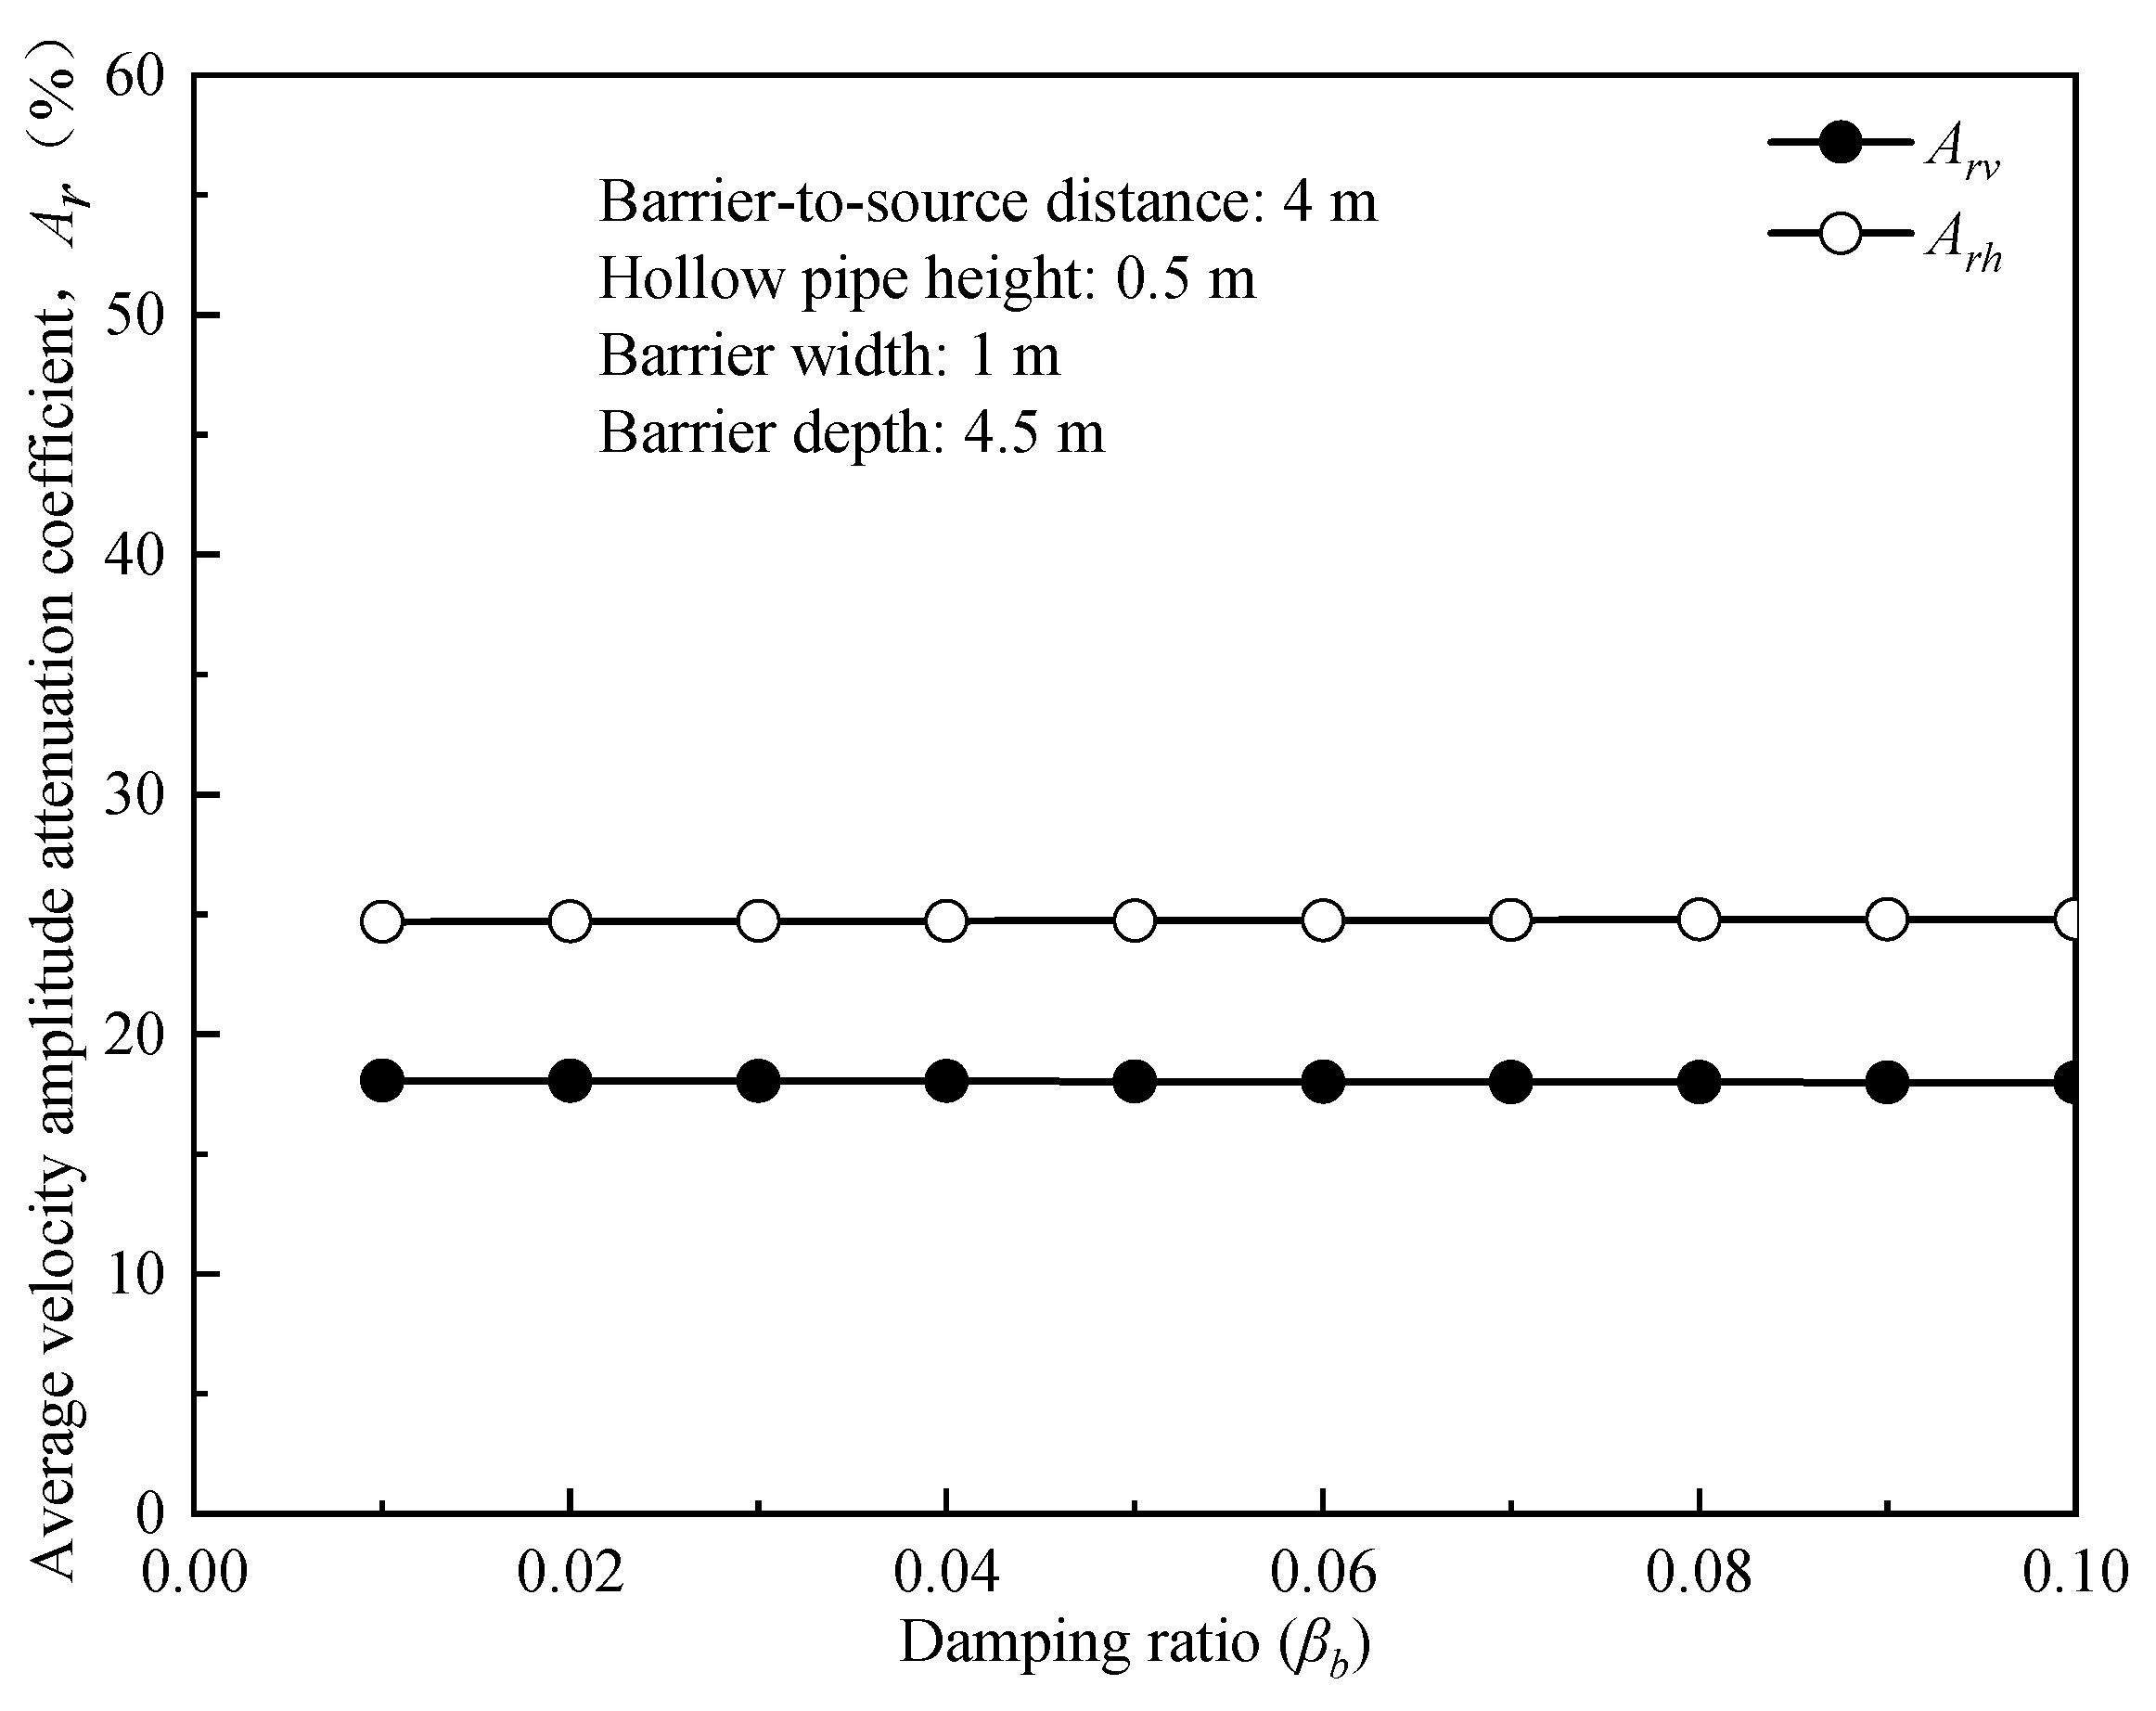
Hollow Pipe Damping Ratio. Figure 16 shows the influence of the hollow pipe damping ratio βb on vibration isolation efficiency under the same geometric and loading conditions. Both Arh and Arv remain almost unchanged as the damping ratio varies from 0.01 to 0.1. The vertical attenuation coefficient remains close to about 18%, while the horizontal coefficient remains approximately 25–26%, with only minor fluctuations.
Figure 16.
Influence of the damping ratio of the hollow pipe on vibration isolation performance.
This weak sensitivity indicates that the main vibration reduction mechanism in the present problem is not dissipation-driven. Since the induced strains remain within the small-strain elastic range, the dominant isolation effect comes from geometric obstruction, reflection, scattering, and redistribution of wave energy rather than from material damping within the barrier itself. As a result, increasing damping does not significantly alter the overall transmission pattern.
Therefore, damping ratio should not be regarded as a primary design lever for this type of barrier under low-strain harmonic loading. Material selection should instead focus on geometry, stiffness contrast, density, durability, and construction feasibility.
In summary, the material parametric investigation establishes a clear hierarchy of influence among the parameters considered. The Young’s modulus contrast between the barrier and the surrounding soil is the most critical factor, although its effect saturates once a moderate threshold is exceeded. Barrier density exhibits a mode-dependent influence that deserves particular attention when vertical vibration isolation is the primary design objective. In contrast, both Poisson’s ratio and the damping ratio of the barrier material exert a negligible effect under the small-strain conditions examined in this study. These findings offer straightforward guidance for material selection in engineering practice.
5. Optimal Design by Automated Scripting
The preceding parametric analyses show that the vibration isolation performance of horizontally buried rectangular hollow pipe barriers is governed mainly by geometric variables that remain adjustable in practical design, including barrier position, burial depth, barrier width, number of rows, and row spacing. By contrast, environmental parameters such as soil condition, excitation characteristics, and barrier material properties are generally fixed.
To align the optimization procedure with practical design conditions, five primary design variables were selected: barrier position, barrier depth, barrier width, number of barrier rows, and row spacing. Because barrier depth is jointly controlled by single-pipe height and the number of pipes per row, the total number of design variables considered in the automated analysis became six, as illustrated in Figure 17. The automation workflow was implemented in Python 3.14.6, making use of the Plaxis remote-scripting interface (plxscripting) for model generation, calculation control, and result extraction. Auxiliary data processing and file management within the loop were handled with standard libraries including numpy for numerical operations, itertools for generating the parameter combinations, and os for system-level tasks. No specialized evolutionary or machine-learning libraries were required given the parametric enumeration strategy adopted herein. A full factorial exploration with 10 levels for each variable would require 106 model runs. With a computation time of approximately 20 s per case, this would correspond to about 231.5 days of calculation, which is not practical.
Figure 17.
Schematic diagram of the design parameters of the horizontally buried rectangular hollow pipe barrier.
Based on the trends observed in the parametric study, representative parameter levels were selected, as summarized in Table 2. This reduced the total number of combinations to 5625 and lowered the estimated computation time to approximately 31.25 h, corresponding to a reduction of about 99.4% relative to the full factorial design. This simplified but still representative design space preserves the dominant variables while removing obviously redundant combinations.
Table 2.
The distribution of key parameters for wave barriers.
The optimization results, summarized in Table 3, show that the vibration isolation performance varies greatly among different parameter combinations. The difference between the best and worst schemes reaches about 69%, demonstrating that barrier performance is highly sensitive to combined design effects and cannot be inferred reliably from any single parameter in isolation.
Table 3.
Calculation results of average attenuation coefficient of vertical velocity amplitude in protected area under key parameter combinations.
The numerically optimal configuration corresponds to Case 1, in which the first barrier row is placed 3 m from the vibration source, the barrier consists of three rows, the single-pipe width is 1.5 m, the total barrier depth is 7.5 m, and the row spacing is 1.75 w. Under this scheme, the vertical vibration isolation efficiency reaches approximately 95%. However, this is a relatively aggressive configuration that requires large width, large depth, and multiple rows, and may therefore be difficult to implement in practice because of space limitations, construction complexity, and cost.
For this reason, the near-optimal configuration represented by Case 392 is particularly important. In that case, the first row is located 5 m from the source, the barrier width is 0.75 m, the total depth is 4.5 m, and only two rows are used. Although the numerical isolation efficiency is reduced slightly to about 90%, the barrier arrangement becomes considerably more practical and economical because the required depth and number of rows are both reduced.
This comparison highlights an important design principle: the absolute numerical optimum is not necessarily the most suitable engineering solution. Instead, the objective of automated optimization should be to identify performance-efficient configurations that balance vibration reduction against construction difficulty, space requirements, and cost. In this sense, the Python-based scripting framework functions not only as a numerical search tool but also as a practical decision-support method for preliminary barrier design.
Furthermore, the optimization results reinforce the parametric findings of Section 4: the top-ranked configurations consistently feature adequate depth (≥3 m) and width (≥0.5 m), confirming the threshold behaviors identified earlier. Although the numerically optimal design (Case 1) achieves superior attenuation, it does so with aggressive dimensions that are difficult to implement in dense urban environments. The availability of near-optimal alternatives (e.g., Case 392), which sacrifice only a few percentage points of isolation efficiency but require substantially less excavation and material, demonstrates the practical value of the automated optimization framework. By exploring a reduced but representative design space, the Python-based workflow enables engineers to rapidly identify balanced solutions that meet both performance targets and site constraints.
6. Discussion and Limitation
The conclusions of this study should be interpreted within the scope of the adopted modeling assumptions and loading conditions. First, the analyses are based on a linear-elastic, small-strain formulation for both the soil and the barrier. This assumption is appropriate for the present comparative study, but it does not account for nonlinear soil behavior, stiffness degradation, interface slip, or possible structural damage to the barrier under stronger excitation. Therefore, the present results are more suitable for preliminary evaluation and comparative design analysis than for direct prediction of barrier performance under all field conditions.
In addition, the soil medium is modeled as a homogeneous linear-elastic material with uniform properties throughout the domain. In actual ground conditions, soil stiffness, density, and damping can vary significantly with depth and horizontal location, and natural soils typically exhibit stratification, spatial heterogeneity, and material nonlinearity. This spatial variability may influence wave propagation patterns, alter the effective impedance contrast between the barrier and the surrounding soil, and consequently affect the predicted vibration isolation efficiency. For instance, layered soil profiles can induce wave refraction and mode conversion at stratum interfaces, modifying the incidence angle and energy distribution of surface waves arriving at the barrier. Similarly, a stiff surficial crust or a soft near-surface layer can shift the dominant frequency content and the effective Rayleigh wavelength, which in turn alters the depth- and width-dependent threshold behaviors identified in the parametric study. The presence of spatially variable soil properties may also lead to asymmetric wave propagation and scattering, potentially reducing the representativeness of the optimal configurations derived from a homogeneous baseline model. Therefore, the quantitative threshold values (e.g., the 3 m depth and 0.5 m width limits, and the 5.12 stiffness ratio) reported herein should be regarded as indicative references from an idealized homogeneous ground, rather than universal design values applicable to all site conditions. For site-specific applications, it is recommended that the soil variability be characterized through in situ measurements (e.g., multichannel analysis of surface waves, standard penetration tests, or cross-hole seismic tests) and that the barrier design be further verified through numerical analyses incorporating representative soil profiles and, where feasible, stochastic simulations that account for spatial variability.
Second, the vibration source is represented by a harmonic strip load at a single representative frequency. This loading form provides a clear basis for comparing the effects of geometric and material parameters, but it cannot reproduce the full frequency content and temporal complexity of real traffic, railway, or machinery-induced ground vibrations. Since the isolation performance of buried barriers may vary with excitation frequency and wavelength, the conclusions obtained here should not be interpreted as frequency-independent design rules.
The present study does not include a systematic analysis of excitation frequency or soil layering, as these additional variables would have multiplied the computational effort and obscured the primary geometric and material effects. However, the authors’ previous work on circular hollow pipes [30] showed that higher frequencies (shorter wavelengths) improve isolation efficiency, while soil layering can significantly alter wave propagation and barrier performance. These trends are expected to apply qualitatively to the rectangular pipes studied herein. Future research will extend the optimization framework to incorporate multiple frequencies and heterogeneous soil profiles, enabling more robust design guidelines.
Third, although the three-dimensional numerical model was validated against published experimental results through an equivalent open-trench configuration, dedicated experimental validation for horizontally buried rectangular hollow pipe barriers is still lacking. Additional laboratory and field studies would be valuable for assessing scale effects, construction variability, installation tolerances, and long-term in-service performance. Nevertheless, the validation using the degenerate open-trench case demonstrates that the present modeling framework can correctly reproduce the fundamental wave propagation and screening phenomena governed by the same physical principles that apply to rectangular hollow pipe barriers. Hence, the model is considered sufficiently reliable for the comparative parametric screening and design exploration conducted in this work.
Fourth, the two-dimensional plane-strain model used in the large-scale parametric and optimization analyses should be regarded as an efficient surrogate model rather than an exact replacement for the three-dimensional response. While the comparison shows that the 2D model can reproduce the main trends of the 3D model with acceptable accuracy, local deviations remain because the actual vibration field is inherently three-dimensional. The 2D model is therefore most appropriate for comparative parametric screening and design-space exploration, whereas final assessment of critical configurations would still benefit from three-dimensional verification.
Finally, the optimization framework developed in this study focuses on vibration isolation performance under the considered numerical conditions. Practical engineering design may also need to account for additional factors, including construction feasibility, structural safety, durability, underground utility interference, and project cost. These factors were not explicitly incorporated into the numerical objective function and should be considered in future design-oriented studies. With regard to the predictive capability of the present modeling approach, it is important to delineate its intended scope of utility. The numerical results obtained in this study are based on idealized conditions—linear elastic material behavior, homogeneous soil, a single representative excitation frequency, and a simplified barrier–soil interface free of slip or separation. Under these assumptions, the model provides reliable predictions of the relative trends and parametric sensitivities, and can effectively serve as a screening and scoping tool for preliminary barrier design. It helps identify dominant geometric and material parameters, reveal threshold behavior, and narrow down the design space for more detailed site-specific analysis. However, quantitative transfer of the predicted isolation efficiencies to actual field conditions would require additional calibration against in situ measurements, and proper consideration of factors such as layered soil profiles, groundwater fluctuations, non-stationary loading with broad frequency spectra, and construction-induced inhomogeneities. Pending such comprehensive validation, the model is best employed for comparative parametric studies and for extracting general design insights, rather than for delivering absolute magnitude forecasts of ground vibration attenuation at a specific site.
7. Conclusions
This study investigated the vibration isolation performance of horizontally buried rectangular hollow pipe barriers through combined three-dimensional finite-element analysis, two-dimensional plane-strain modeling, parametric evaluation, and Python-based automated optimization. The main conclusions are as follows:
- (1)
- Horizontally buried rectangular hollow pipe barriers provide effective vibration mitigation; vertical vibration attenuation is consistently stronger than horizontal attenuation.
- (2)
- Burial depth and barrier width are the dominant geometric parameters. Performance gains diminish when the depth exceeds approximately 3 m, and widths below about 0.5 m lead to poor isolation. Barrier position, number of rows, and row spacing also influence performance and should be optimized in combination.
- (3)
- The barrier–soil stiffness contrast exhibits a threshold at a Young’s modulus ratio of about 5.12, beyond which the isolation response saturates. Reinforced concrete lies well within this saturation range, providing a practical balance. Poisson’s ratio and damping ratio have negligible effects, while barrier density shows a mode-dependent influence on vertical vibration.
- (4)
- The validated two-dimensional plane-strain model reproduces the main three-dimensional trends with acceptable accuracy and substantially reduces computational demand, making it suitable for large-scale parametric screening.
- (5)
- The Python-based automated optimization framework reduces the computational cost of design exploration by approximately 99.4%. The results further demonstrate that near-optimal configurations often achieve a more favorable trade-off between isolation performance and construction practicality than the numerically optimal design.
Author Contributions
Conceptualization, M.N.; Methodology, Z.H.; Validation, S.B.; Resources, S.B.; Writing—original draft, Z.H.; Writing—review & editing, Q.C. and S.B.; Visualization, M.N. and S.B.; Supervision, Q.C.; Funding acquisition, H.D. All authors have read and agreed to the published version of the manuscript.
Funding
This work was supported by the Natural Science Foundation of Jiangxi Province, China (Grant Nos. 2024QT04 and 20242BAB204095).
Data Availability Statement
Some or all data, models, or code that support the findings of this study are available from the corresponding author upon reasonable request.
Acknowledgments
The authors gratefully acknowledge the financial support.
Conflicts of Interest
The authors declare no conflicts of interest.
Abbreviations
| Ar | Average attenuation coefficient |
| Arv | Average vertical attenuation coefficient |
| Arh | Average horizontal attenuation coefficient |
| ARR | Velocity amplitude attenuation ratio |
| ARRv | Vertical velocity amplitude attenuation ratio |
| ARRh | Horizontal velocity amplitude attenuation ratio |
| L | Row spacing of hollow pipe barriers |
| l | Barrier-to-source distance |
| β | Damping Ratio |
| βb | Damping ratio of hollow pipes |
| ν | Poisson’s Ratio |
| νb | Poisson’s Ratio of Hollow Pipes |
| νs | Poisson’s Ratio of Soils |
| w | Width of a single hollow pipe |
| ρ | Density |
| ρb | Hollow Pipe Density |
| ρs | Soil Density |
References
- Hegde, A. Mitigation of ground vibrations using geocells: A mini-review. Front. Built Environ. 2024, 10, 1428871. [Google Scholar] [CrossRef] [Scilit]
- Ouakka, S.; Olivier, V.; Georges, K. Railway ground vibration and mitigation measures: Benchmarking of best practices. Railw. Eng. Sci. 2022, 30, 1–22. [Google Scholar] [CrossRef] [Scilit]
- Ajel, H.A.; Al-Jubair, H.S.; Ali, J.K. An experimental study on vibration isolation by open and in-filled trenches. Open Eng. 2022, 12, 555–569. [Google Scholar] [CrossRef] [Scilit]
- Yang, Y.B.; Hung, H.H. A parametric study of wave barriers for reduction of train-induced vibrations. Int. J. Numer. Meth. Eng. 1997, 40, 3729–3747. [Google Scholar] [CrossRef] [Scilit]
- Ji, C.; Gao, F.; Cheng, L.; Liu, Y. Research on vibration-isolating rate of vibration-isolating slot under buried pipe subjected to blasting seismic waves. Vibroeng. Procedia 2018, 20, 97–102. [Google Scholar] [CrossRef] [Scilit]
- Ji, C.; Gao, F.; Li, X.; Yu, Y.; Cheng, L. Numerical analysis of vibration-isolating effect of vibration-isolating slot under buried pipe subjected to millisecond blasting. Vibroeng. Procedia 2018, 21, 32–37. [Google Scholar] [CrossRef] [Scilit]
- Çelebi, E.; Fırat, S.; Beyhan, G.; Çankaya, İ.; Vural, İ.; Kırtel, O. Field experiments on wave propagation and vibration isolation by using wave barriers. Soil Dyn. Earthq. Eng. 2009, 29, 824–833. [Google Scholar] [CrossRef] [Scilit]
- Ujjawal, K.N.; Venkateswarlu, H.; Hegde, A. Vibration isolation using 3D cellular confinement system: A numerical investigation. Soil Dyn. Earthq. Eng. 2019, 119, 220–234. [Google Scholar] [CrossRef] [Scilit]
- Cai, Y.Q.; Ding, G.Y.; Xu, C.J. Amplitude reduction of elastic waves by a row of piles in poroelastic soil. Comput. Geotech. 2009, 36, 463–473. [Google Scholar] [CrossRef] [Scilit]
- Xu, B.; Lu, J.F.; Wang, J.H. Numerical analysis of the isolation of the vibration due to Rayleigh waves by using pile rows in the poroelastic medium. Arch. Appl. Mech. 2010, 80, 123–142. [Google Scholar] [CrossRef] [Scilit]
- Xia, T.D.; Sun, M.M.; Chen, C.; Chen, W.Y.; Ping, X. Analysis on multiple scattering by an arbitrary configuration of piles as barriers for vibration isolation. Soil Dyn. Earthq. Eng. 2011, 31, 535–545. [Google Scholar] [CrossRef] [Scilit]
- Xu, P. Analysis of isolation effectiveness of shear waves by a row of hollow pipe piles in saturated soils. Transp. Porous Media 2017, 120, 415–432. [Google Scholar] [CrossRef] [Scilit]
- Ba, Z.N.; Liu, S.P.; Wu, M.T.; Liang, J.W. Analytical solution of the near field vibration isolation effect of pipe pile barriers under a cylindrical wave source. Eng. Mech. 2022, 39, 138–148. [Google Scholar] [CrossRef]
- Nimbalkar, S.; Basack, S. Pile group in clay subjected to cyclic lateral load: Numerical modelling and design recommendation. Mar. Georesour. Geotechnol. 2022, 42, 67–87. [Google Scholar] [CrossRef] [Scilit]
- Nimbalkar, S.; Basack, S. Pile group in clay under cyclic lateral loading with emphasis on bending moment: Numerical modelling. Mar. Georesour. Geotechnol. 2022, 41, 269–284. [Google Scholar] [CrossRef] [Scilit]
- Jiang, Y.; Ma, Q. Study on vibration isolation effect of wave impeding block in unsaturated soil under S-wave incidence. Acta Mech. 2022, 233, 4119–4139. [Google Scholar] [CrossRef] [Scilit]
- Chen, J.; Wu, Y.; Gao, G.; Song, Y. Far-field passive vibration isolation analysis of WIB under dynamic machine loading. Chin. J. Geotech. Eng. 2023, 45, 128–133. (In Chinese) [Google Scholar] [CrossRef]
- Gao, L.; Cai, C.; Li, C.; Mak, C.M. Numerical analysis of the mitigation performance of a buried PT-WIB on environmental vibration. Sensors 2023, 23, 7666. [Google Scholar] [CrossRef] [Scilit] [PubMed]
- Laghfiri, H.; Lamdouar, N.; Abbas, S.; Boudi, E.M. Periodic wave impeding barrier as a countermeasure of ground vibration. Adv. Mech. Eng. 2023, 15, 16878132231190994. [Google Scholar] [CrossRef] [Scilit]
- Albino, C.; Godinho, L.; Amado-Mendes, P.; Alves-Costa, P.; Dias-da-Costa, D.; Soares, D., Jr. 3D FEM analysis of the effect of buried phononic crystal barriers on vibration mitigation. Eng. Struct. 2019, 196, 109340. [Google Scholar] [CrossRef] [Scilit]
- Nistri, F.; Cosentini, R.M.; Dal Poggetto, V.F.; Miniaci, M.; Charkaluk, P.; Pugno, N.; Gliozzi, A.S.; Bosia, F. Mitigation of groundborne vibrations using metabarriers. Soil Dyn. Earthq. Eng. 2023, 175, 108247. [Google Scholar] [CrossRef] [Scilit]
- Chen, Q.; Li, Y.; Ke, W.; Basack, S.; Xu, C. New technique for ground vibration mitigation by horizontally buried hollow pipes. Int. J. Geomech. 2021, 21, 04021114. [Google Scholar] [CrossRef] [Scilit]
- Chen, Q.; Li, Y.; Hu, Z.; Xu, C.; Basack, S.; Ke, W. Utilization of horizontally buried hollow pipes for ground vibration mitigation in public transport infrastructure: Innovative technique. Int. J. Geomech. 2022, 22, 04022215. [Google Scholar] [CrossRef] [Scilit]
- Hu, Z.; Chen, Q.; Xu, C.; Basack, S.; Luo, W. Horizontal hollow pipes used as vibration isolation barriers: Numerical modelling and design optimization. Transp. Geotech. 2022, 37, 100885. [Google Scholar] [CrossRef] [Scilit]
- Ni, A.; Shi, Z.; Meng, Q.; Lim, C.W. A novel buried periodic in-filled pipe barrier for Rayleigh wave attenuation: Numerical simulation, experiment and applications. Eng. Struct. 2023, 297, 116971. [Google Scholar] [CrossRef] [Scilit]
- Hu, Z.; Chen, Q.; Xu, C.; Nimbalkar, S.; Huang, N. Effectiveness and Optimization Analysis of Vibration Isolation Performance of Circular and Rectangular Hollow Pipes: Numerical Modeling. Int. J. Geomech. 2025, 25, 04025026. [Google Scholar] [CrossRef] [Scilit]
- Lysmer, J.; Kuhlemeyer, R.L. Finite dynamic model for infinite media. J. Eng. Mech. Div. 1969, 95, 859–877. [Google Scholar] [CrossRef] [Scilit]
- Kuhlemeyer, R.L.; Lysmer, J. Finite element method accuracy for wave propagation problems. J. Soil Mech. Found. Div. 1973, 99, 421–427. [Google Scholar] [CrossRef] [Scilit]
- Alzawi, A.; Naggar, M.H.E. Full scale experimental study on vibration scattering using open and in-filled (GeoFoam) wave barriers. Soil Dyn. Earthq. Eng. 2011, 31, 306–317. [Google Scholar] [CrossRef] [Scilit]
- Hu, Z.; Chen, Q.; Xu, C.; Basack, S.; Luo, W. 3D dynamic numerical modeling on vibration mitigation efficiency of open trench with horizontal hollow pipes. Earthq. Eng. Eng. Vib. 2025, 24, 795–809. [Google Scholar] [CrossRef] [Scilit]

Disclaimer/Publisher’s Note: The statements, opinions and data contained in all publications are solely those of the individual author(s) and contributor(s) and not of MDPI and/or the editor(s). MDPI and/or the editor(s) disclaim responsibility for any injury to people or property resulting from any ideas, methods, instructions or products referred to in the content. |
© 2026 by the authors. Licensee MDPI, Basel, Switzerland. This article is an open access article distributed under the terms and conditions of the Creative Commons Attribution (CC BY) license.