Article

Seismic Performance of Ultra-High-Strength Concrete Beam–Column Connections with Openings Under Cyclic Loading


by
Mahmoud A. El-Mandouh
1,*,
Basem O. Rageh
2,
Dina A. Abdulaziz
1,
Hassan Youssef
3 and
Ahmed A. El-Barbary
4
1
Civil Engineering Department, Faculty of Engineering, Beni-Suef University, Beni-Suef 62511, Egypt
2
Civil Engineering Department, Delta Higher Institute for Engineering and Technology, Mansoura 35511, Egypt
3
Civil Construction Technology Department, Faculty of Technology and Education, Beni-Suef University, Beni-Suef 62511, Egypt
4
Department of Civil Engineering, Faculty of Engineering, Al-Baha University, Alaqiq 65779, Saudi Arabia
*
Author to whom correspondence should be addressed.
Buildings 2026, 16(13), 2509; https://doi.org/10.3390/buildings16132509
Submission received: 27 May 2026 / Revised: 18 June 2026 / Accepted: 20 June 2026 / Published: 24 June 2026
(This article belongs to the Section Building Structures)

Abstract

In modern multistory buildings, integrating beam web openings adjacent to beam–column connections (BCCs) is frequently required to accommodate utility ducts and piping. While this optimizes clear story height, it drastically alters the stress distribution within the BCCs under seismic loading. Consequently, this study evaluates the seismic performance of twenty-one exterior BCCs, with particular emphasis on the coupled effects of opening configuration (size and location) and concrete type: normal strength concrete (NSC, fc′ = 25 MPa), high-strength concrete (HSC, fc′ = 80 MPa), and ultra-high-strength concrete (UHPC, fc′ = 120 MPa). For BCC specimens without openings, upgrading from NSC to HSC and UHPC increased the failure load (Pf) by about 66.67% and 111.11%, and the ultimate capacity (Pu) by 61.54% and 100.0%, respectively. Conversely, web openings reduced the (Pu) of HSC specimens by 14–34%, and UHPC specimens by 12–31%, respectively, when compared to the reference specimens without openings. Furthermore, the presence of web openings compromised cumulative energy dissipation capacity by 16–36% for (NSC), 13–31% for (HSC), and 12–28% for (UHPC), compared with the corresponding reference specimens without openings. Although HSC and UHPC provided superior absolute energy performance, they did not eliminate the structural deficiencies associated with openings positioned adjacent to the joint core. Consequently, a critical threshold value of S/D ≥ 0.5 (where S represents the distance from the column face to the edge of the opening, and D denotes the beam depth), is recommended for HSC and UHPC. In contrast, conventional NSC strictly requires a more conservative limit of S/D ≥ 1.0 to prevent severe cyclic shear degradation near the high-stress region.

1. Introduction

The seismic resilience of RC frames is a critical issue in modern structural design, particularly with the rapid pace of urbanization in seismically active regions. Recent evaluations of structural failures have shown that global instability is rarely caused by the failure of individual structural members. Instead, catastrophic collapse is more often governed by complex stress states and the subsequent degradation within beam–column connections (BCCs) subjected to reversed cyclic loading [1]. Many RC buildings have collapsed due to the weakness of BCCs, especially when subjected to reversed cyclic loading. This type of loading causes stiffness degradation, bond slip [2], and joint shear distress, which deteriorate the overall lateral load-resisting system [3,4,5,6]. These joints are force-transmission nodes where the whole lateral load-resisting mechanism becomes vulnerable when their shear resistance degrades or when the bond deterioration accelerates [7]. Repeated load reversals accelerate stiffness degradation and induce severe cyclic shear stress reversals at the BCCs. As the bond strength decreases and microcracks form around the weak regions, they trigger the pinching effect in the hysteretic response. The hysteresis loop shortens when reinforcement begins to slip through the damaged concrete, significantly reducing the connection’s ability to dissipate energy [8]. Usually, the failure progress from extensive cracking across the joint to localized crushing or diagonal splitting near the edge of the opening [8,9].
Openings are frequently provided in RC elements to allow access for mechanical, electrical and plumbing services without raising the floor height. However, the existence of openings changes the internal force transfer mechanism and may weaken critical regions of the structural system. The situation is more critical when openings are placed close to BCCs, which are responsible for transmitting seismic forces throughout the lateral-load resisting system. Any reduction in the capacity of these locations during seismic loading could affect the overall performance of the structure. Therefore, it is extremely essential to understand the effects of web openings on the seismic behavior of BCCs and to develop efficient mitigation strategies against their adverse effects in earthquake-resistant design.
The effect of openings in shear-critical zones on the behavior of RC beams has been demonstrated in several studies [10,11,12,13,14]. For instance, El-Sisi et al. [15] studied the effect of openings on the RC beams’ structural response. Square openings were provided in the shear span and tension zones of the test specimens to facilitate uniform testing procedures. The results showed that the bending capacity was slightly reduced when the openings were located in the flexural tension zone. The ultimate load was found to be reduced by 14% for an opening of 360 mm× 120 mm compared with the reference beam without openings. The results also showed that the ultimate capacity was considerably reduced due to the reduction of effective depth and the development of stress concentrations around the edge of the opening. These localized stresses lead to the premature initiation and propagation of cracks [12,16,17,18].
Several studies [19,20,21,22] have investigated the negative effects of openings in RC elements using external reinforcement techniques, particularly FRP composites. The main goal of these techniques is to minimize the reduction in strength and stiffness due to geometrical imperfections.
In traditional BCCs, the transfer of shear is controlled by diagonal compression struts, transverse confinement, and the bond interaction between the longitudinal reinforcement and the surrounding concrete [23]. This balance is disrupted by the presence of an opening which reduces the compression strut action, transfers tensile stresses to the opening corners, and decreases the effective joint shear area. When subjected to monotonic loading, this disruption may manifest localized cracking. Under reversed cyclic loading, the effects more severe [24].
The behavior of BCCs under cyclic loading was studied by Amin et al. [25] using a validated numerical method, with particular attention to the effect of web openings. The results revealed the importance of the opening location and reinforcement for the stability of the connection. Moreover, the application of reinforcement directly around the openings was more effective in enhancing the ultimate load capacity than reinforcing the entire connection. The investigation indicated that the strength of the structure was reduced by around 38% for wide rectangular openings near the supports without adequate reinforcement. The use of specific reinforcement approaches may considerably reduce these losses, thereby reducing the strength deficiency to roughly 24%.
Galustanian et al. [26] developed three-dimensional nonlinear FE models that were validated against four experimental data sets. Then a parametric study of the geometric parameters was carried out, including the beam depth, width, and opening dimensions. The analysis highlighted that the presence of openings tends to induce more brittle behavior, as indicated by a significant reduction in both strength and stiffness after the peak load. Increasing the beam depth promoted this brittle behavior and reduced the drift capacity at failure by as much as 75%, while the ductility was improved with a greater beam width. Larger openings consistently reduced the drift capacity from about 5% to 1.5%. Additionally, load resistance was reduced by up to 61% at a 1.5% drift level.
Recent studies have focused on controlling macro-cracking using FRP composites to enhance the seismic performance of BCCs [27,28,29,30]. Humairy et al. [31] conducted an experimental study on five one-third scale, exterior RC BCCs integrated with slabs to evaluate the performance of three retrofitting methods namely, bolted steel angle cage (BSAC), hybrid GFRP with steel box anchorage (GFRP-BSB) and hybrid GFRP with near-surface mounted bars (GFRP-NSM). The cyclic test results indicated that the BSAC option had the highest maximum confinement and strength recovery (+37%), whilst the hybrid GFRP-BSB system presented a balanced gain in strength (+23%) and ductility (+12%). The GFRP-NSM system exhibited the greatest improvement in total drift capacity (+16%), primarily because of the continuity provided by the tensile reinforcement. Mechanism-based interpretations suggest that there is no universally optimal scheme, and the real contribution of the floor slab is crucial for the load transfer channels and the ultimate retrofit efficacy under cyclic loading.
In addition to the development of FRP composites in BCCs, TRM (Textile Reinforced Mortar) has emerged as a very successful cement-based solution to improve cyclic behavior and shear strength of BCCs. Dogan et al. [32] demonstrated that the failure mode of the exterior BCCs can be changed by localized passive confinement with optimized layouts of Textile Reinforced Mortar (TRM) strips, resulting in a 34% increase in energy dissipation.
Recent studies in enhanced BCCs have focused mostly on improving the seismic performance and assembly efficiency of composite and precast frames under cyclic loading. Zhu et al. [33] reported that the utilization of internal core steel tubes within confined concrete BCCs can successfully prevent premature diagonal shear crushing. Wang et al. [34] employed blind-bolting technology with extended endplates to achieve optimal structural adjustability and damage control of Concrete-Filled Double-Skin Steel Tube (CFDST) connections. In a complementary effort, Wu et al. [35] presented replaceable semi-rigid bolted angle dissipators that can effectively limit the cyclic damage within the connection zone. To enhance self-centering capability, Yu et al. [36] developed precast BCCs incorporating with external friction devices, which remained completely elastic up to 4% drift and increased the damping capacity to 13.4%.
Shifting the focus toward geometric modification, Hashemi et al. [37] developed the “joint enlargement” retrofitting technology that utilizes prestressed steel angles in 2D and 3D spaces for structural enhancement of corner RC BCCs with insufficient non-seismic details. Five full-scale specimens were tested by cyclic loading using this new technology. The essential plastic hinge was successfully shifted from the joint core to the end of the beam span. Finally, this structural modification remarkably enhanced the connection performance, achieving a 22% rise in average maximum lateral force and a 214% improvement in cumulative energy dissipation capacity at 6% drift ratio.
Recently, the use of Ultra-High-Performance Concrete (UHPC) in BCCs has emerged as a significant research focus due to the major influence of the behavior of BCCs on the overall structural response to seismic loads. However, a limited number of studies have investigated this use, particularly regarding seismic performance. For instance, Zhang et al. [38] carried out a series of quasi-static tests to study the seismic performance of BCCs using UHPC composite beams and high-strength concrete (HSC) columns. The experimental results showed that all specimens failed in ductile flexure, but the UHPC–HSC connections had better structural integrity with less damage. The proposed system showed a more stable hysteretic response and improved energy dissipation capacity when compared to the conventional cast-in-place connection. Furthermore, the load-bearing capacity increased by approximately 10–11%, indicating enhanced strength. The results also confirmed the improvements in stiffness, deformation capacity, and ductility, with ductility values higher than 3.5.
Finally, Su et al. [39] integrated UHPC materials in BCCs by adopting a UHPC-filled socket connection to successfully move important inelastic damage away from the connection interface and into the column components. The external steel sheath of the concrete-filled steel tube (CFST) column configurations provides continuous passive confinement to the core concrete, which effectively retards local buckling and avoids premature diagonal shear failure under severe reversals associated with displacement-controlled loading.
Based on the gaps identified in the literature, this study directly tackles the lack of research addressing BCCs with openings under cyclic loading. Bridging the gap between architectural utility and seismic safety, this research utilizes high-strength (HSC) and UHPC to deliver the systematic numerical investigation into how opening sizes and spatial placement dictate the global hysteretic response of BCCs with openings. The structural relevance of this work is that it provides a methodology to quantify key mechanisms of seismic degradation, including stiffness degradation and cumulative energy dissipation factors under cyclic loading.
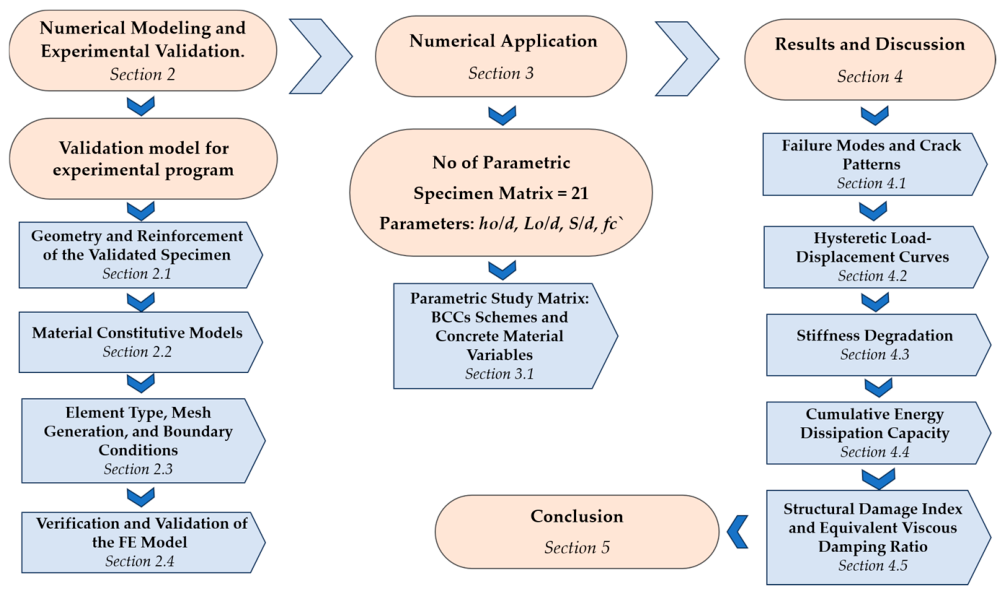
To provide a clear and structured overview of this investigation, a comprehensive methodological framework of the study is presented in Figure 1.

2. Numerical Modeling and Experimental Validation

2.1. Geometry and Reinforcement of the Validated Specimen

The numerical investigation began with a comprehensive evaluation of the finite element (FE) model against the experimental data of the BCC specimens tested by Choi et al. [40]. This validation establishes the capability of the numerical model to accurately represent the cyclic behavior of the BCC before proceeding to the parametric study.
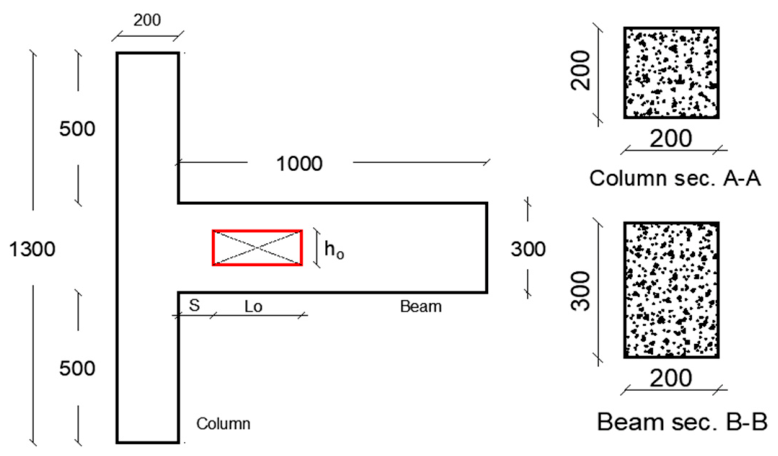
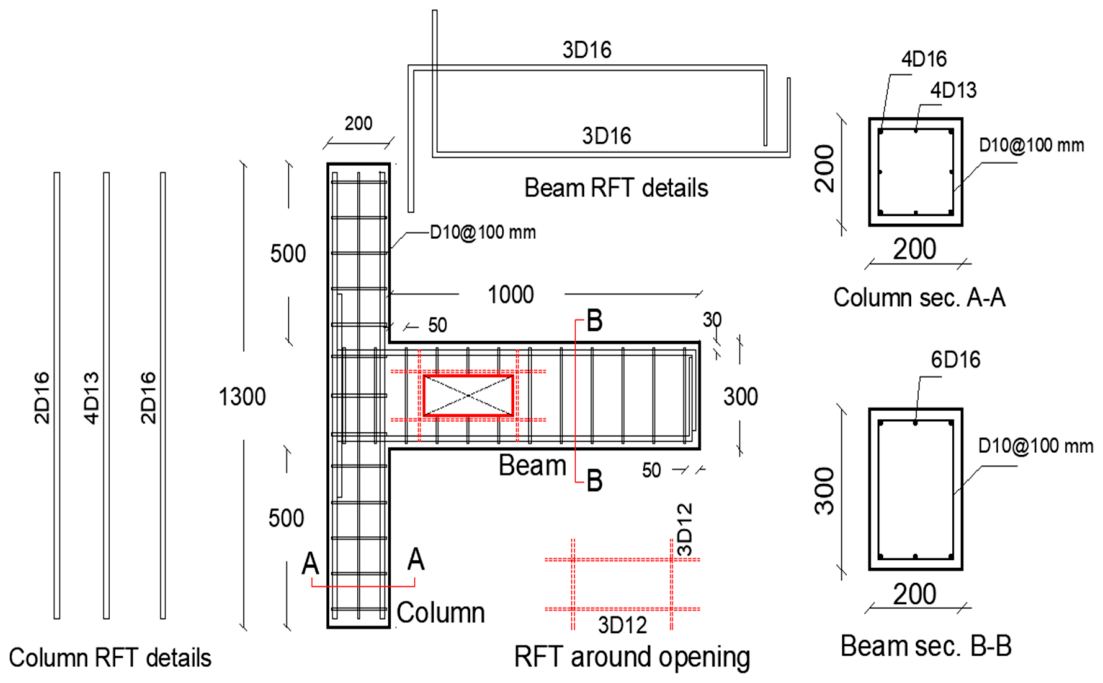
To ensure complete structural consistency, all the geometrical configurations, cross-sectional dimensions and reinforcement details of the analyzed specimens are shown in Figure 2 and Figure 3. The height of the column is 1300 mm with a concrete cross section of 200 mm × 200 mm. Each column had four longitudinal bars with a diameter of 16 mm at the corners and four longitudinal bars with diameters of 13 mm at the mid sides. The columns had ties of 10 mm diameter spaced at 100 mm center-to-center.
All beams had a length of 1000 mm, and their concrete section was 200 mm × 300 mm. Each beam had three longitudinal top and bottom bars with a diameter of 16 mm. The beams had stirrups of 10 mm diameter spaced at 100 mm center-to-center [40].
Table 1 illustrates the mechanical properties of the reinforcing bars. Additional reinforcement was provided around the opening in the form of three 12 mm diameter bars on each side of the opening, to compensate for the reinforcement cut from the beam. The yield strengths of the D10, D13, and D16 bars are 499, 487, and 467 MPa, respectively.

2.2. Material Constitutive Models

ANSYS WORKBENCH 2025 R2 simulation software [41] used to develop the three-dimensional numerical FE model to examine the cyclic performance of BCCs with and without openings. The model incorporates a combination of solid and rebar elements to accurately represent the structural elements and obtain their response under cyclic loading conditions.
The concrete elements were discretized using 8-node solid elements (CPT215) to accomplish an accurate simulation of concrete elements that are subjected to various loading conditions. Moreover, CPT215 supports mechanical degrees of freedom (UX, UY, UZ). In the ANSYS WORKBENCH 2025 R2, the stress–strain curve represents the nonlinear performance of concrete when utilizing quadratic solid elements such as CPT215 [42,43,44,45,46]. In addition, the initial linear portion corresponds to elastic behavior, followed by nonlinear hardening up to ultimate stress, and then softening due to cracking and damage progression. The model is primarily based on uniaxial compressive strength (fc′), the biaxial compressive strength (fb), and tensile strength (ft). Furthermore, the compression cap intersection is defined as (σvc = −0.67fb), the compression cap ratio R, is assumed to be equal to 2. Moreover, the hardening performance is defined by the parameter D, which is equal to 5 × 10⁵ MPa, and the tensile cap hardening is defined as (RT = 1).
In addition, the damage development parameters are βt and βc. These parameters describe the nonlinear performance of concrete, describing cracking, crushing, and post-peak softening, while maintaining numerical stability and reducing mesh sensitivity. Furthermore, the values of all parameters of the examined NSC, HSC, and UHPC specimens are listed in Table 2.

2.3. Element Type, Mesh Generation, and Boundary Conditions

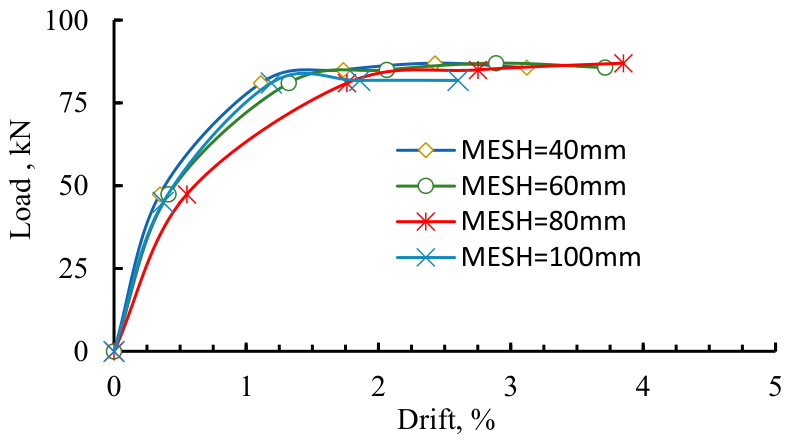
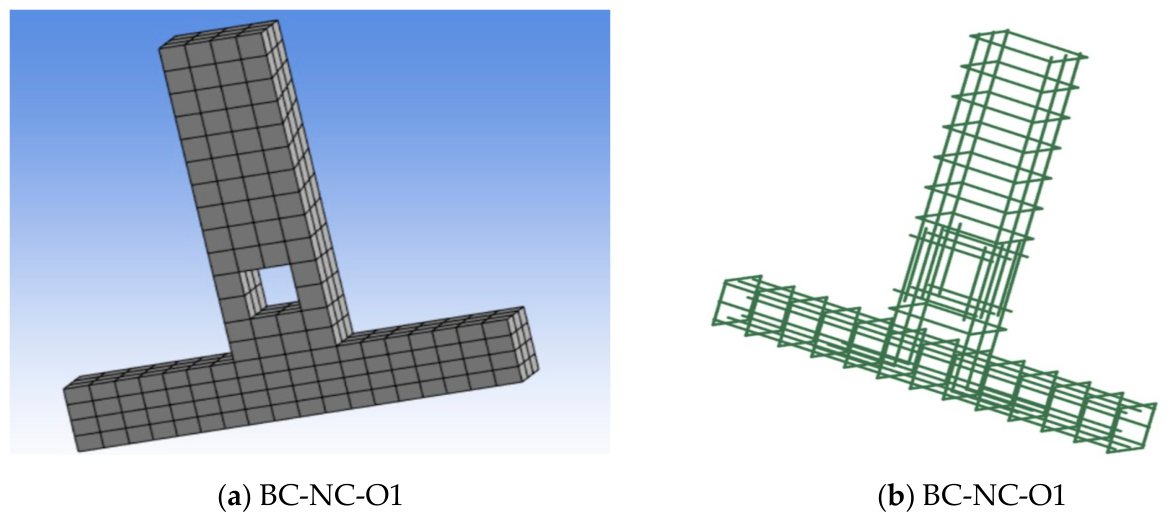
A uniform mesh size is employed across all elements in the FE model to guarantee node compatibility at material interfaces, thus improving simulation accuracy. A mesh sensitivity analysis was carried out in ANSYS Workbench utilizing the validation model (BC-NC-W1) with four mesh sizes of 40 mm, 60 mm, 80 mm, and 100 mm. In addition, the corresponding load–displacement curves were obtained for each mesh configuration and are shown in Figure 4. The results show that, in the case of mesh size = 40 mm and 60 mm, unconvergence solutions were obtained, and the maximum displacements were approximately decreased by 37% and 55%, respectively, compared with 80 mm mesh size. Moreover, for the 100 mm mesh size, the maximum force and maximum displacement were lowered by an average of 13% compared with the mesh size 80 mm. Furthermore, for a mesh size of 80 mm, stable convergence and good agreement with experimental results are shown in Section 3.
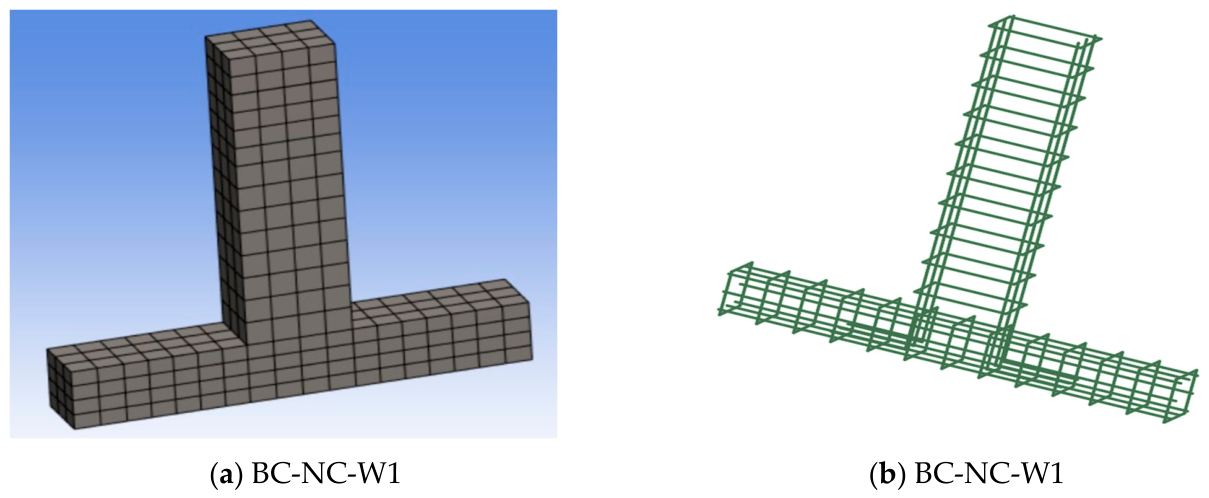
In this study, concrete is simulated by a three-dimensional solid element CPT215, with each element sized 80 mm× 80 mm× 80 mm and discretized using a hexahedral mesh. In ANSYS WORKBENCH [41], a hexahedral mesh composed of linear (Hex8) elements is employed for reinforced concrete by using the Multizone method to guarantee convergence in nonlinear analyses.
Additionally, reinforcing steel is modeled using an embedded reinforcement approach, where in hexahedral meshes, the reinforcing steel is identified as embedded line bodies inside the concrete utilizing REINF265 elements associated with the three-dimensional solid elements [46]. Figure 5 and Figure 6 illustrate the volumetric mesh of the concrete and reinforcement, respectively, for some selected BCCs.
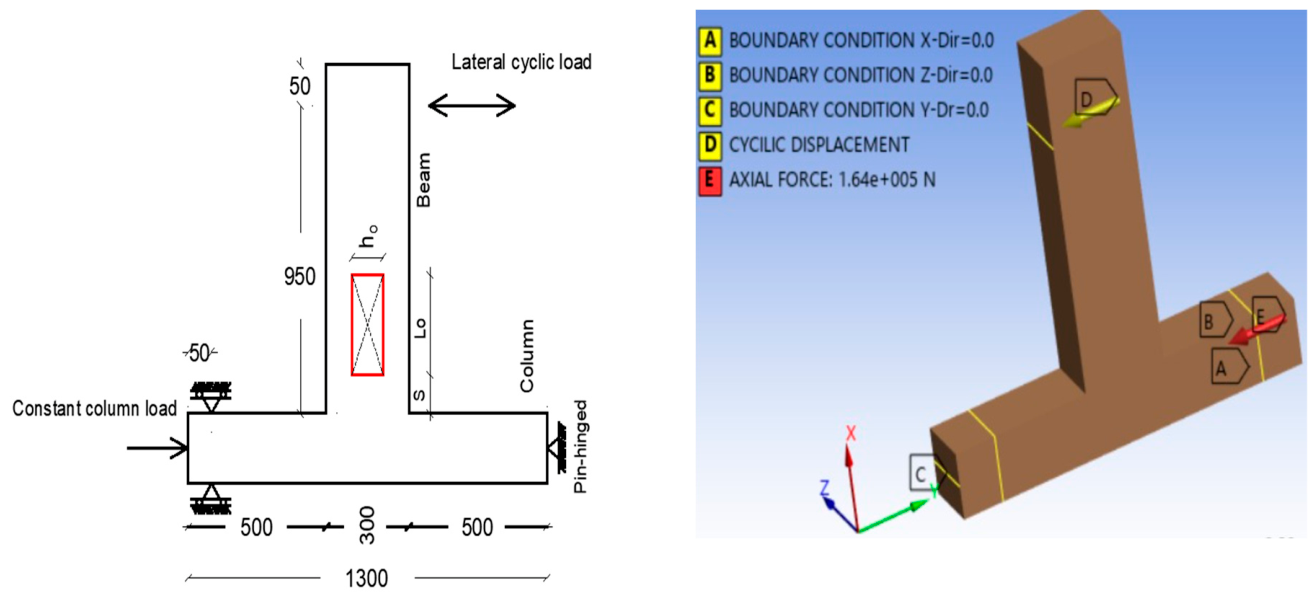
As explained in Figure 7, one end of the column is modeled as a roller support to restrain vertical displacement without resisting axial load, while the other end is defined as a pinned support with Ux = Uy = Uz = 0 to denote the indication of contraflexure and the experimental setup.

2.4. Verification and Validation of the FE Model

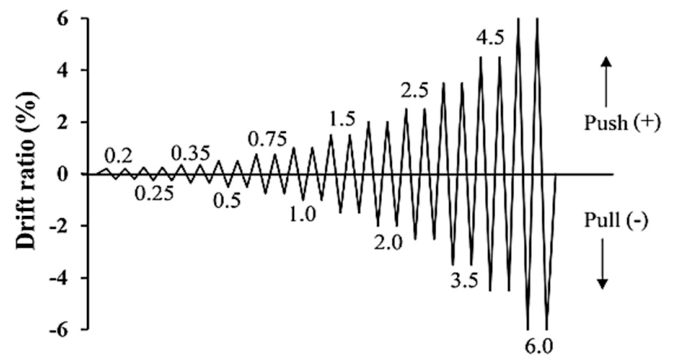
The beam end is loaded laterally under displacement control, as illustrated in the Figure 8. The cyclic loading protocol is applied twice in both the positive (+) and negative (−) directions at each step, with drift ratios varying from 0.2% to 6.0% [47]. Furthermore, a constant axial load equal to 10% of the column’s gross-section axial capacity (0.10·Ag·fc′) was maintained as the loading protocol.
The specimen BC-NC-W1 was experimentally investigated by Choi et al. [40] with a concrete compressive strength of fc′′ equal to 18 MPa under identical boundary conditions and the loading procedure, as illustrated in Figure 7 and Figure 8, respectively.
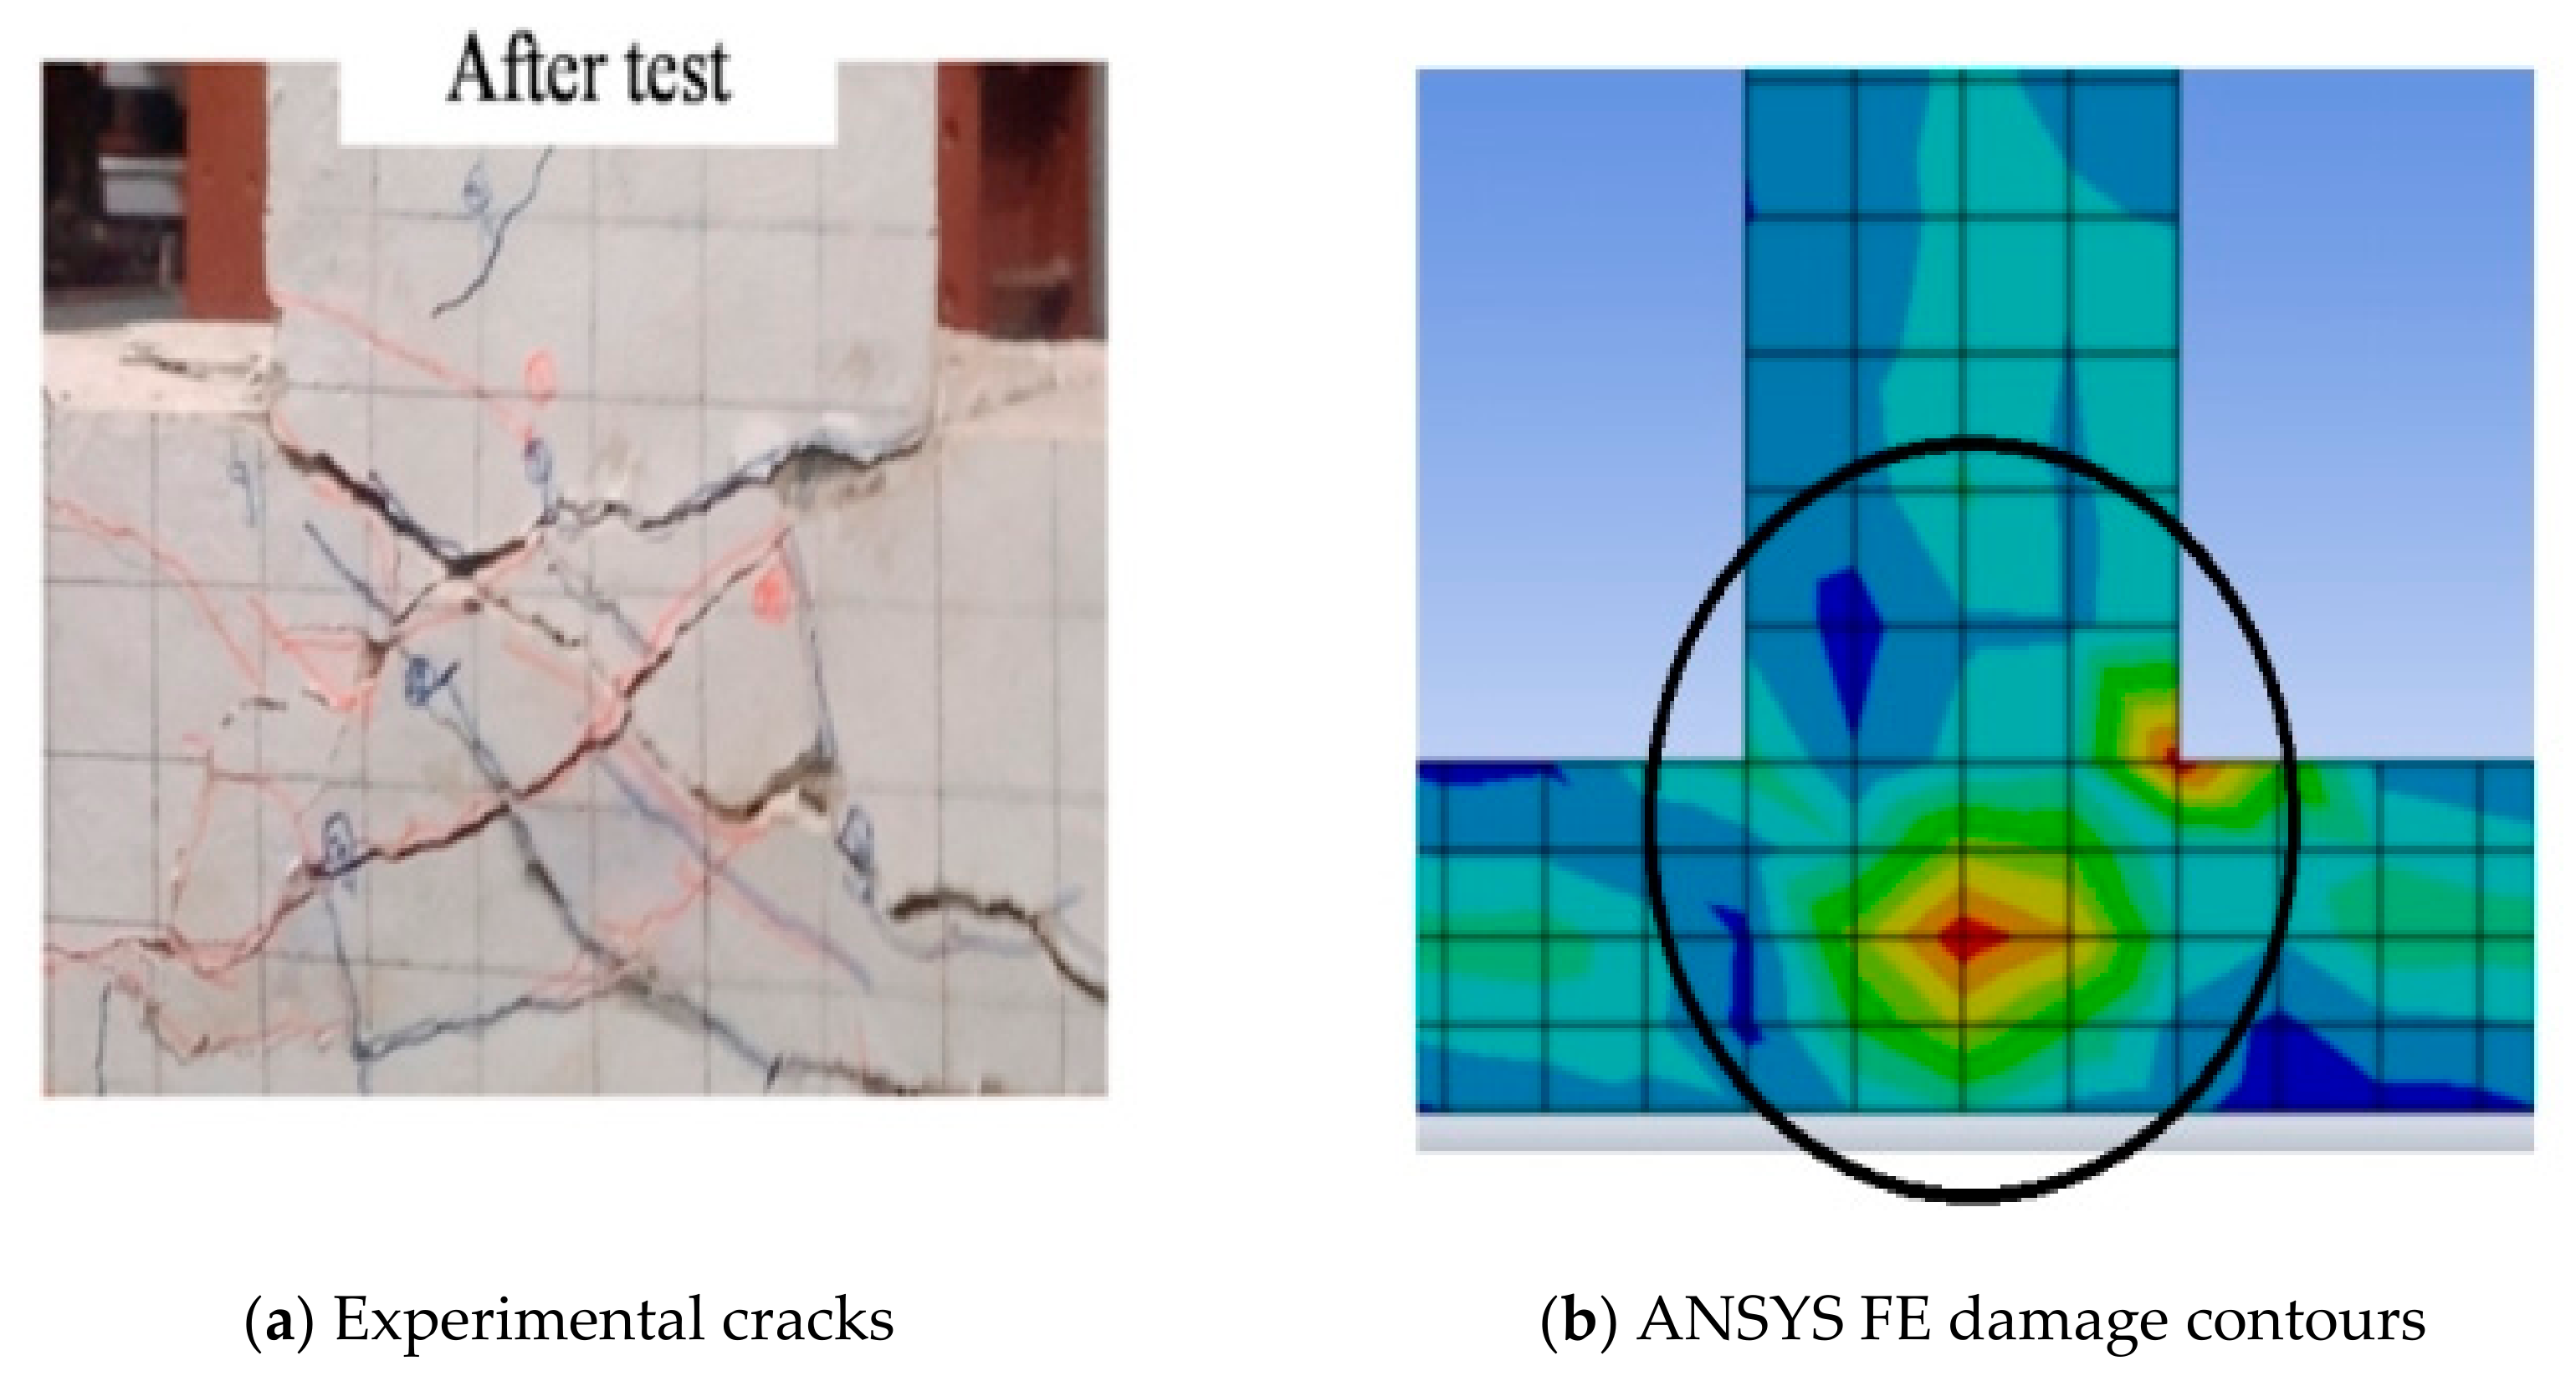
The experimental results are then compared with the corresponding FE simulations. The results indicate that the experimental model BC-NC-W1 exhibited extensive diagonal shear cracks concentrated in the beam-column joint zone, indicating significant damage under cyclic loading. Moreover, the ANSYS model predicted a similar crack configuration, with severe damage indications that were localized in the same joint zone and adjacent beam zones, as illustrated in Figure 9. In particular, the numerical results exhibit good agreement with the experimental observations in terms of crack locations and failure mode, with only minor variations in crack distribution and intensity.
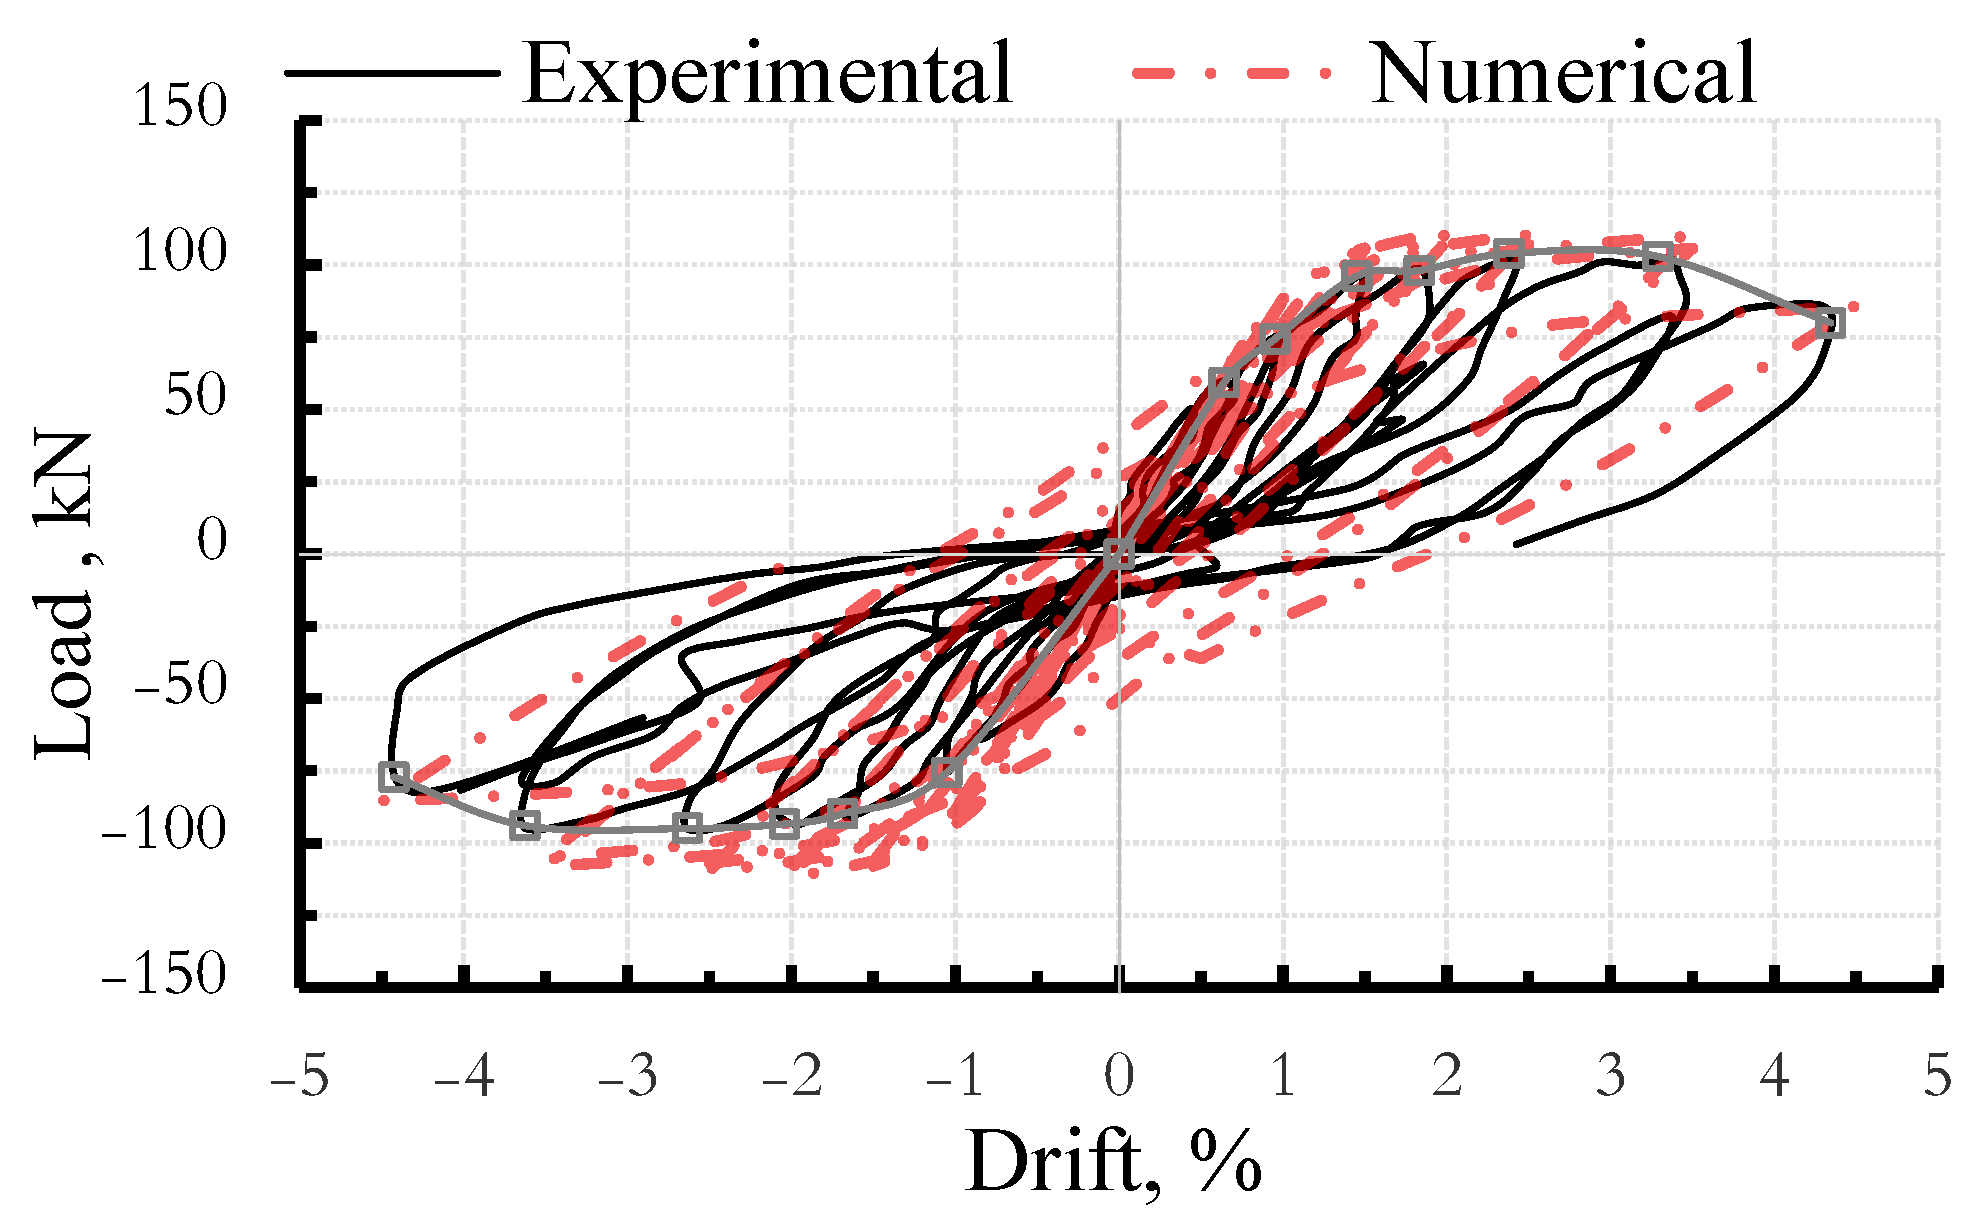
Furthermore, the comparison between the numerical and experimental hysteretic behavior of model BC-NC-W1 is shown in Figure 10. Moreover, the ultimate experimental lateral load is 84 kN, whereas the corresponding analytical value is 86 kN, indicating very close agreement between the experimental and numerical results. In addition, the experimental yield and ultimate displacements of model BC-NC-W1 are 10.70 mm and 37.0 mm, respectively, compared with the corresponding numerical values of 11.30 mm and 38.70 mm.
To further validate the proposed model, five experimental BCCs with different opening sizes and locations with a concrete compressive strength fc′ of 20 MPa under the loading procedure that is defined in the Figure 8. Table 3 presents a comparison between the experimental results and the corresponding numerical results. All models show a largely consistent trend when the experimental and numerical results are compared, with only slight systematic differences. The analytical mean for the critical load Pcr is somewhat lower at 22.12 kN with an equivalent standard deviation of 3.1 kN, whereas the experimental mean is roughly 23.49 kN with a standard deviation of 3.3 kN. This suggests that while the analytical model shows similar variability, the critical load is somewhat underestimated.
Additionally, the experimental results show a mean of about 2.25 mm with a very small standard deviation (SD ≈ 0.03 mm) for the cracking displacement Δcr, whereas the numerical values are consistently higher, with a mean of about 2.34 mm and a similarly low standard deviation (SD ≈ 0.025 mm), indicating high accuracy.
In addition, the experimental ultimate load (Pcr) has a mean value of approximately 72.66 kN with a standard deviation of about 12.5 kN, compared with the numerical mean of 74.61 kN and a slightly higher dispersion (SD ≈ 12.8 kN).
These findings indicate that the numerical manner slightly overestimates the load capacity, while preserving the spread of results.
In terms of ultimate displacement (Δu), experimental values average about 16.55 mm (SD ≈ 0.21 mm), though numerical expectations are higher at a mean of 17.75 mm (SD ≈ 0.23 mm). Overall, the numerical model provides a good representation of structural performance, with slight overestimation of displacements and ultimate capacity and negligible underestimation of critical loads, while preserving comparable variability to the experimental results.

3. Numerical Application

Parametric Study Matrix: BCCs Schemes and Concrete Material Variables

Twenty-one specimens were analyzed and divided into three concrete categories: normal-strength concrete (NC) with f c ′ = 25 MPa, high-strength concrete (HC) with f c ′ = 80 MPa, and ultra-high-strength concrete (UHPC) with f c ′ = 120 MPa . One reference specimen was included in each group, designated BC-NC-W1, BC-HC-W1, and BC-UH-W1 for the first, second, and third groups, respectively. The rectangular web openings in the remaining specimens were defined using three normalized geometric parameters: the distance from the column face to the nearest edge of the opening (S/d), the opening height-to-beam depth ratio (ho/d), and the opening length-to-beam depth ratio (Lo/d), where d represents the overall beam depth. The values under investigation were S/d = 0.0, 0.50, and 1.00; Lo/d = 0.50 and 1.00, and ho/d = 0.50 and 1.00.
The most critical condition occurs when S/d = 0.0, where the opening is located immediately adjacent to the column face, thereby significantly reducing stiffness and shear resistance and disrupting the natural strut-and-tie load-transfer mechanism within the joint region. The web opening moves progressively away from the column face and the highly stressed joint area when the distance ratio (S/d) increases. The general description of the examined specimens is shown in Table 4.

4. Results and Discussion

4.1. Failure Modes and Crack Patterns

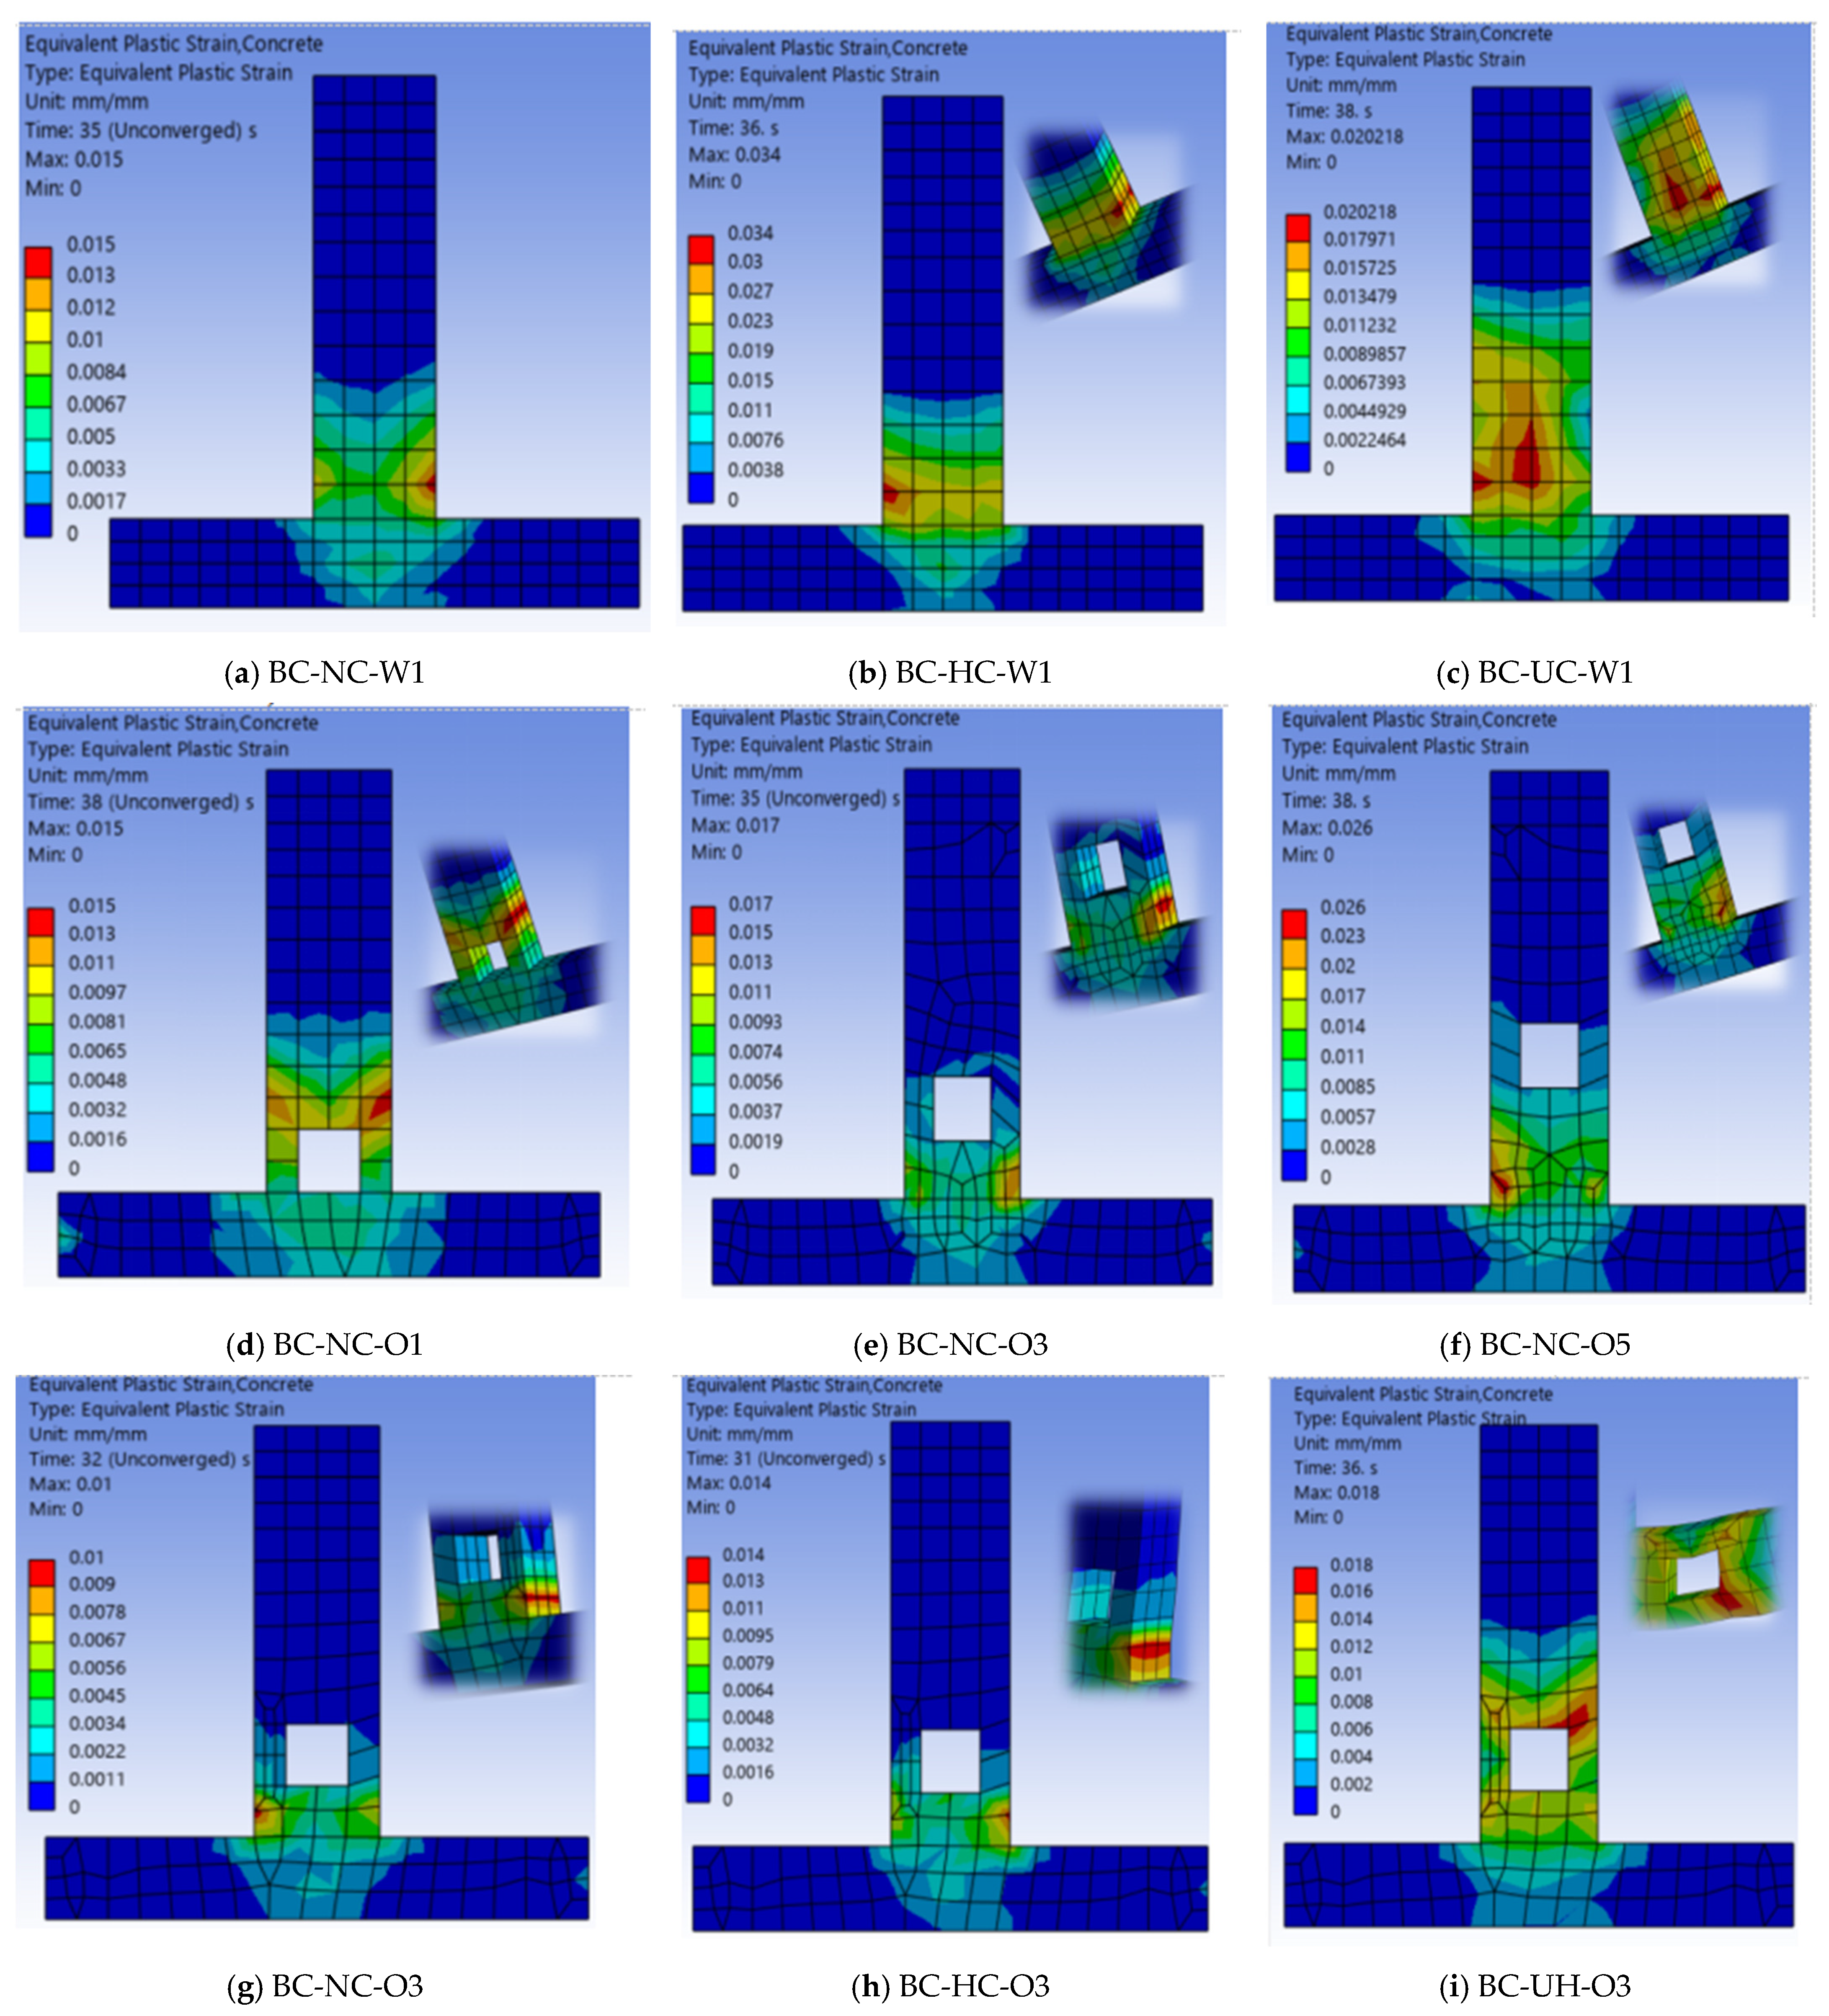
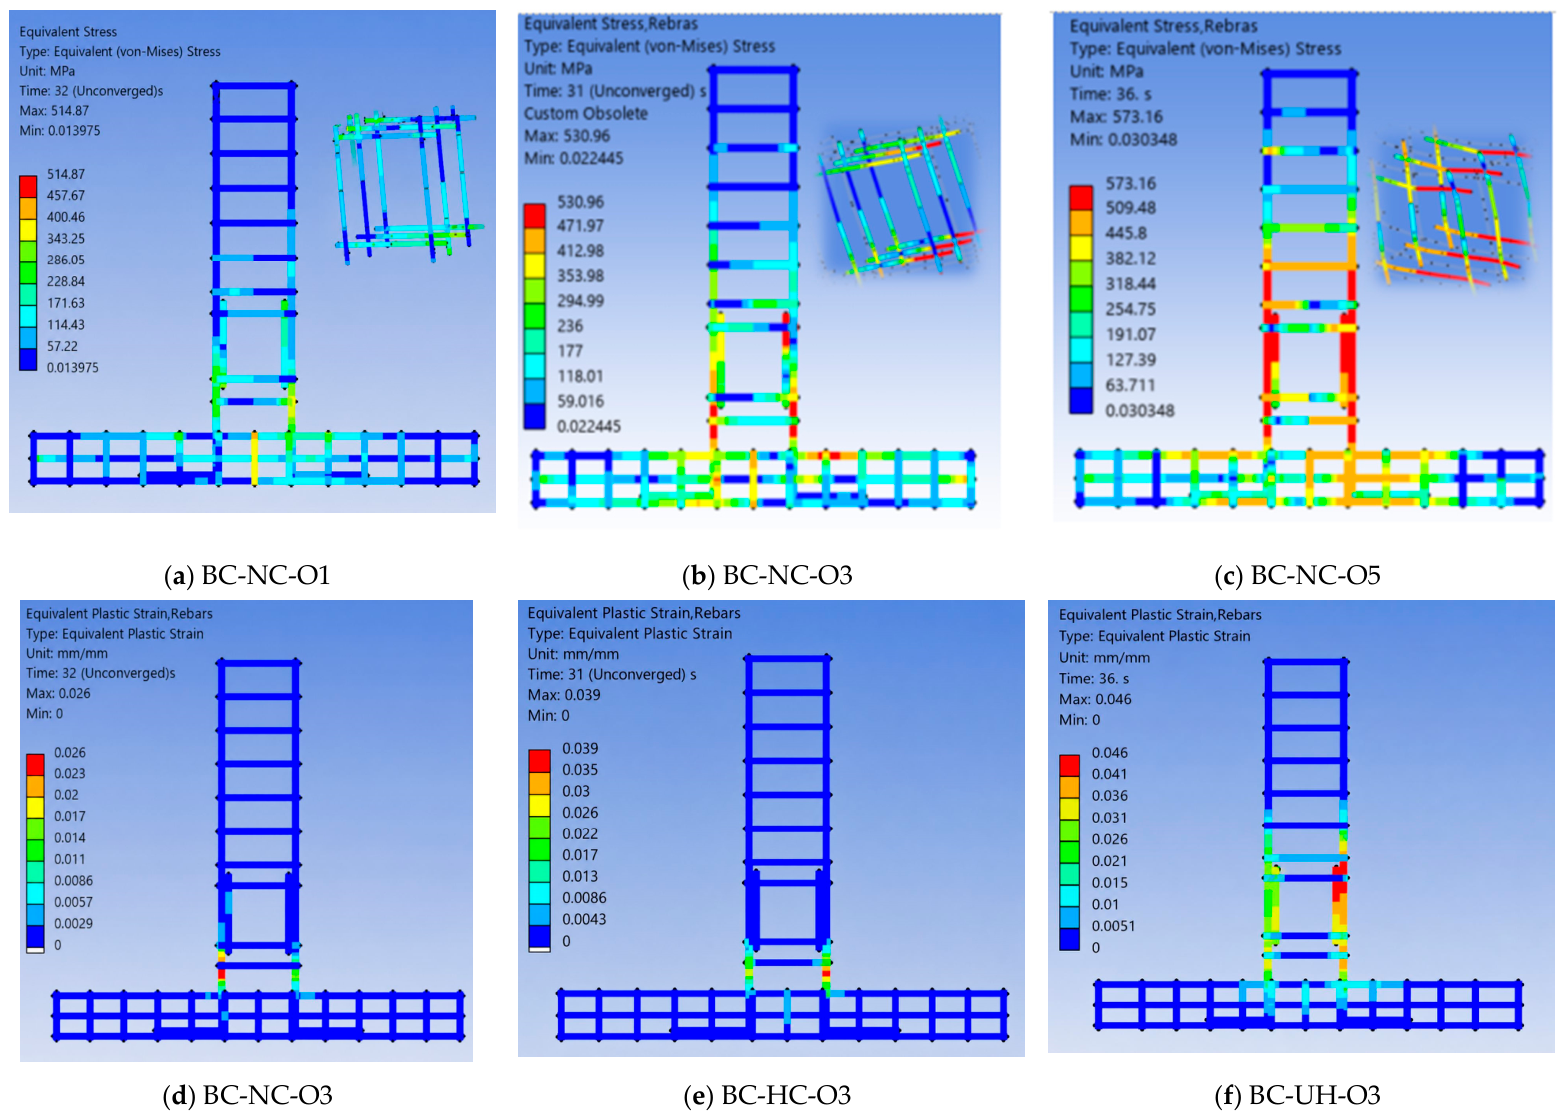
Figure 11 and Figure 12 illustrate equivalent plastic strain distributions for concrete and rebars for some selected specimens, respectively. Across all specimens, cracking initiates as fine vertical flexural cracks beside the column and progressively propagates with increasing cyclic load. As displacement increases, additional cracks form along the beam height, creating a distributed crack pattern. With further loading, some of these cracks begin to dominate, while minor inclined cracks may develop, indicating an interaction between flexural and shear mechanisms. The presence of openings leads to the spread of cracks around their edges. As illustrated in Figure 11, all main beam rebars reached yielding beside the column where the maximum concrete stress occurs.
As illustrated in Table 5, the comparison of the cracking load ( P c r ) among HSC and UHPC specimens without openings with respect to their corresponding NSC reference specimen demonstrates a consistent and marked improvement in crack resistance. For instance, in specimen BC-NC-W1, the cracking load is 22.0 kN, which increases significantly to 35.0 kN in BC-HC-W1 (representing an enhancement of approximately 59%) and further to 45.0 kN in BC-UH-W1 (about 105% higher than the NC specimen). This shows that UHPC has a great effect on increasing the cracking load by increasing the compressive strut at the beam-column connection. In addition, a comparison of the cracking displacement ( Δ c r ) for HSC and UHPC specimens relative to their corresponding NC reference specimens indicates only marginal variations, suggesting that the primary improvement is associated with load capacity rather than deformation at crack initiation. The specimen BC-NC-W1 has a Δ c r of 2.20 mm, which is almost unchanged in BC-HC-W1 (2.25 mm) and slightly increases in BC-UH-W1 (2.30 mm), indicating a 2–5% increase. These findings demonstrate that both HSC and UHPC successfully postpone the onset of cracks, with UHPC specimens offering the greatest improvement in cracking performance.
The effect of opening size and location on the cracking load was investigated in detail. The results indicate that the cracking load (Pcr) of specimens BC-NC-O1, BC-NC-O2, BC-NC-O3, BC-NC-O4, BC-NC-O5, and BC-NC-O6 decreased by approximately 31%, 36%, 23%, 32%, 18%, and 22%, respectively, when compared with the reference specimen BC-NC-W1. These decreases unequivocally show that the presence of openings significantly reduces the cracking load capacity.
The most obvious reductions were observed in specimen BC-NC-O2, indicating that openings adjacent to the column constitute the most critical location. In contrast, specimen BC-NC-O5 had the lowest reduction in cracking load compared with the reference specimens without opening.
The HSC specimens showed a similar pattern. In comparison to the reference specimen BC-HC-W1, the cracking load (Pcr) of BC-HC-O1, BC-HC-O2, BC-HC-O3, BC-HC-O4, BC-HC-O5, and BC-HC-O6 decreased by roughly 26%, 31%, 20%, 24%, 17%, and 22%, respectively. The application of HSC significantly increased the overall cracking load capacity and delayed the onset of cracking. The cracking load (Pcr) of the UHPC specimens BC-UH-O1, BC-UH-O2, BC-UH-O3, BC-UH-O4, BC-UH-O5, and BC-UH-O6 showed reductions of approximately 24%, 28%, 17%, 22%, 15%, and 20%, respectively, when compared to the reference specimen BC-UH-W1. These results provide more evidence that the negative effects of openings on cracking behavior can be lessened, but not completely eliminated, by using UHPC concrete.
In comparison to NSC references, HSC specimens generally show very little variation in cracking displacement Δ c r , whereas UHPC specimens consistently show a small increase (typically ranging from 2% to 4%). This indicates that while both HSC and UHPC greatly increase the cracking load, they do not significantly change the deformation level at which cracking begins, with UHPC causing only a slight increase in Δ c r .

4.2. Hysteretic Load-Displacement Curves

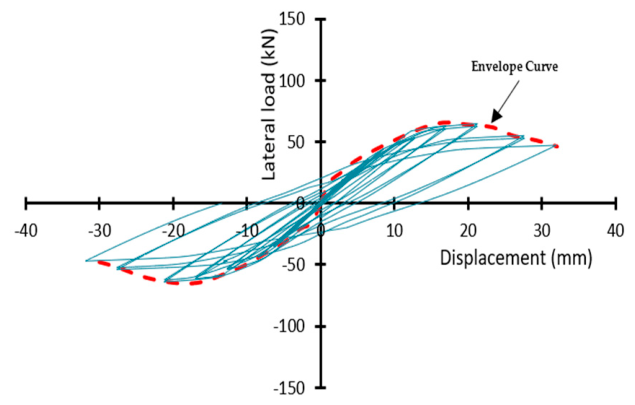
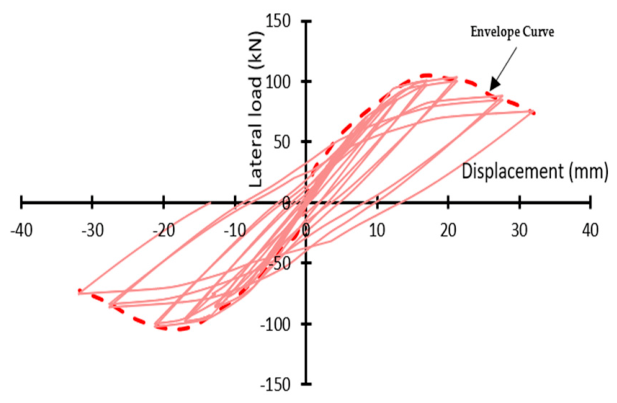
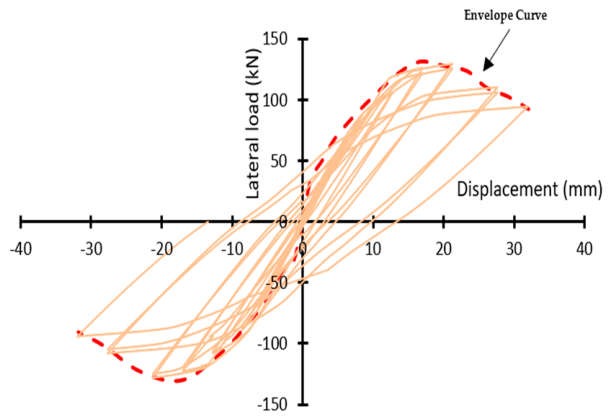
The reference specimens’ hysteretic load-displacement curves are shown in Figure 13, Figure 14 and Figure 15. The hysteretic behavior of specimens BC-NC-W1, BC-HC-W1, and BC-UH-W1 differ noticeably. The specimens BC-NC-W1, BC-HC-W1, and BC-UH-W1’s hysteretic load-displacement curves show a distinct increase in cyclic performance as concrete strength increases.
The specimen BC-NC-W1 shows limited energy dissipation due to its significantly lower peak load capacity and faster stiffness degradation. In comparison, BC-HC-W1 shows improved strength and initial stiffness, although some brittleness and degradation are still evident under repeated loading. Specimen BC-UH-W1 presents the most stable and well-developed hysteresis loops, with higher load capacity and enhanced energy dissipation. Overall, the ultra-high-strength concrete specimen outperforms the others in terms of strength, stability, and seismic efficiency.
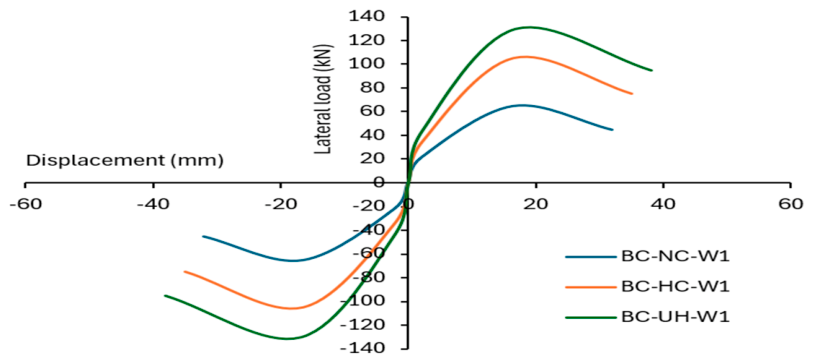
Figure 16 shows the envelope load-displacement curves of reference specimens. The results showed that the ultimate load (Pu) of BC-HC-W1 and BC-UH-W1 increased on BC-NC-W1 by about 61.54% and 100.0%, respectively, while the failure load (Pf) increased by about 66.67% and 111.11%. The corresponding ultimate displacement (Δu) remained nearly constant at 1% and 2%, and the failure displacement (Δf) increased slightly to 12.50% and 25.00% for BC-HC-W1 and BC-UH-W1, respectively. These percentages indicate that using HSC and UHPC significantly improves load-carrying capacity.
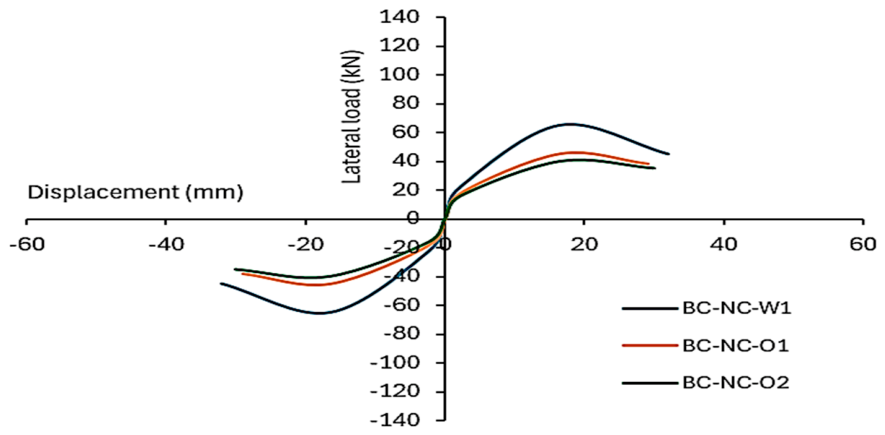
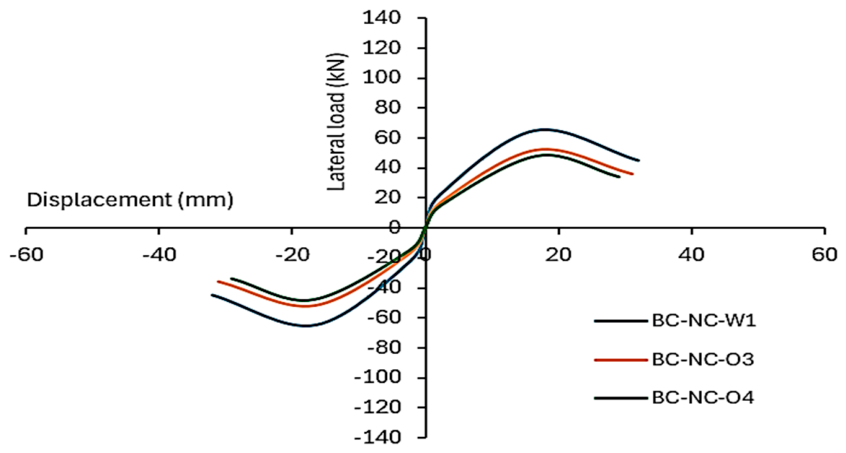
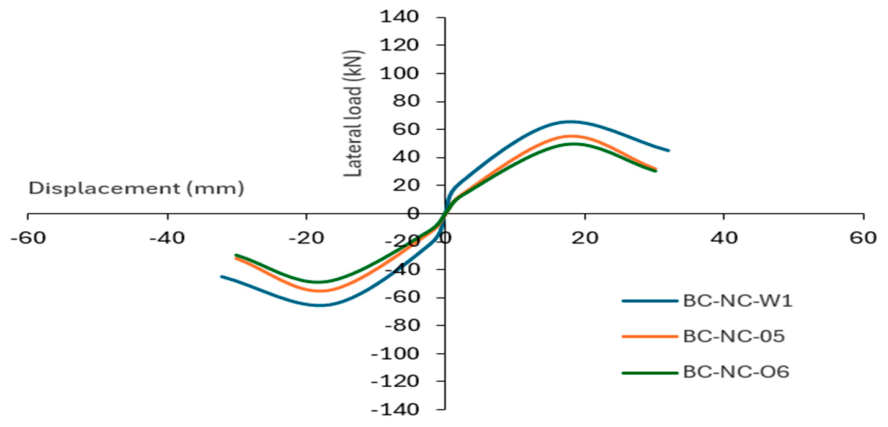
Figure 17, Figure 18 and Figure 19 illustrate the envelope of load-displacement curves of NSC specimens with different opening sizes and locations. The ultimate load (Pu) of the NSC specimens with openings shows a clear reduction compared to the reference specimen BC-NC-W1. While the reference specimen exhibited an ultimate load of 65.0 kN, the values for the specimens with opening ranged from 40.0 kN to 55.0 kN. This corresponds to reductions of about 31%, 38%, 20%, 26%, 15%, and 25% for BC-NC-O1, BC-NC-O2, BC-NC-O3, BC-NC-O4, BC-NC-O5, and BC-NC-O6, respectively.
The most significant reduction was observed in specimens BC-NC-O1 and BC-NC-O2, whereas BC-NC-O5 showed the smallest decrease, indicating that the opening size and location in BC-NC-O5 had a comparatively minor effect on the ultimate load capacity. Overall, the presence of openings led to a noticeable degradation in ultimate strength, with the extent of reduction depending on the opening location.
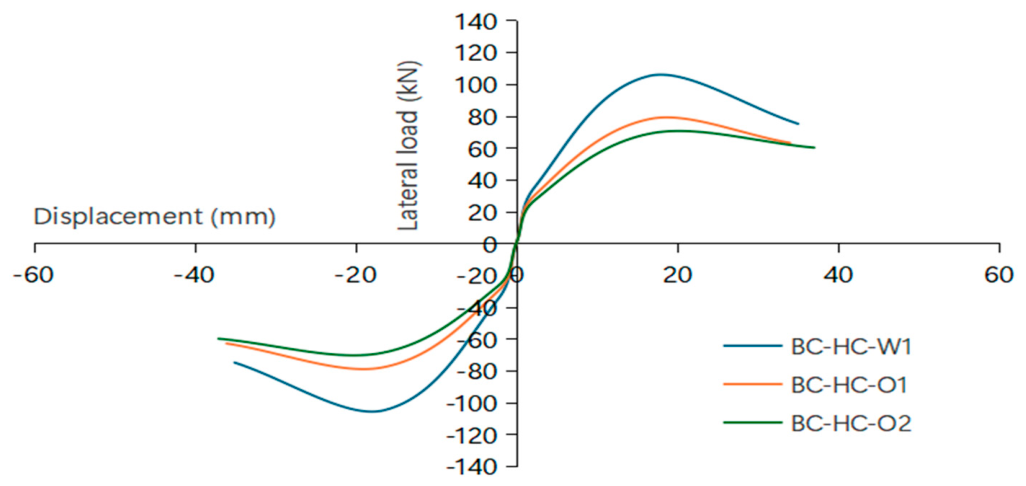
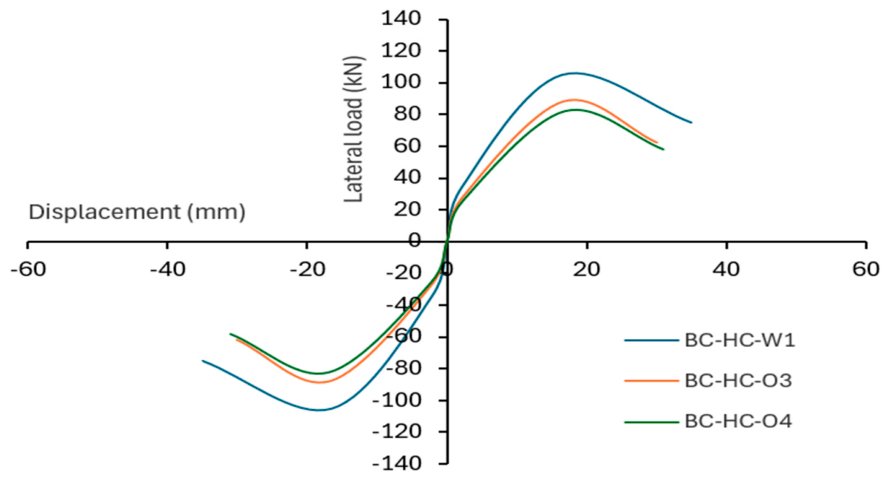
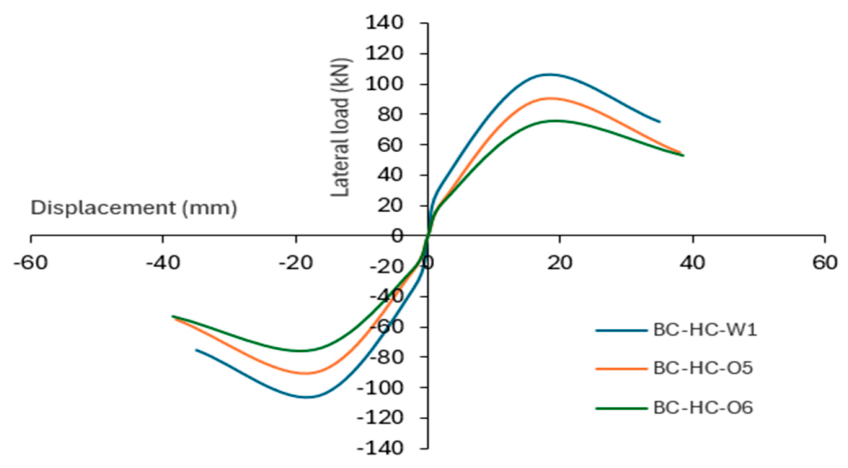
The envelope of the load-displacement curves of HSC specimens with various S/d ratios are shown in Figure 20, Figure 21 and Figure 22. With a value of 105.0 kN, the reference specimen BC-HC-W1 had a higher ultimate load (Pu) than the HSC specimens. The ultimate loads of specimens BC-HC-O1, BC-HC-O2, BC-HC-O3, BC-HC-O4, BC-HC-O5, and BC-HC-O6 were 78.0 kN, 69.4 kN, 88.0 kN, 82.0 kN, 90.0 kN, and 75.0 kN, corresponding to reductions of approximately 26%, 34%, 16%, 22%, 14%, and 29%, respectively. The specimens BC-HC-O2 and BC-HC-O5 displayed the greatest and least reduction, respectively, indicating a relatively less critical opening configuration. Overall, the HSC specimens maintained higher ultimate load capacities than the NSC specimens, despite clear reductions.
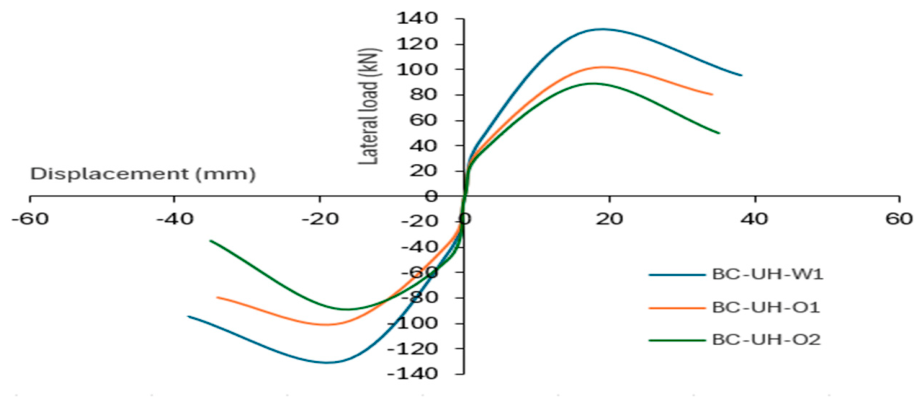
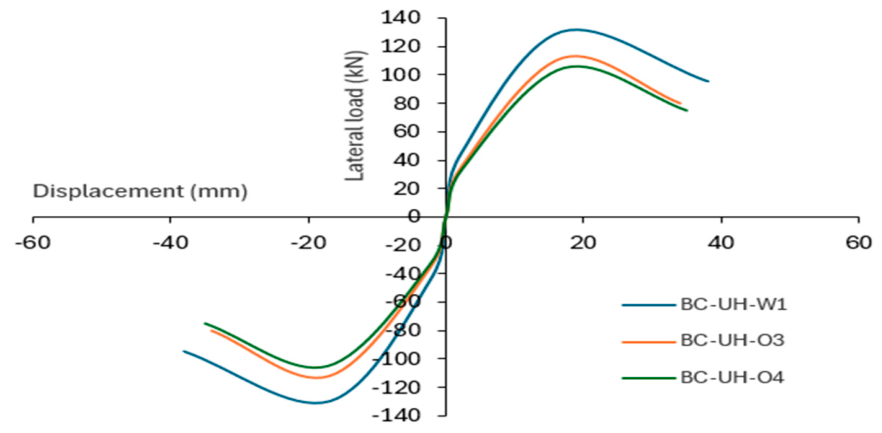
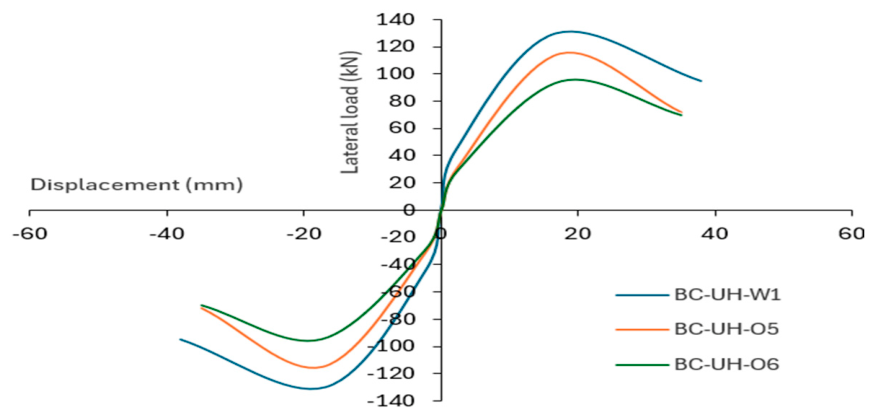
The envelope of the load-displacement curve of UHPC specimens with various S/d ratios is shown in Figure 23, Figure 24 and Figure 25. A similar pattern was found when the UHPC specimens were compared to the reference specimen BC-UH-W1, which had an ultimate load of 130.0 kN. The ultimate loads of specimens BC-UH-O1, BC-UH-O2, BC-UH-O3, BC-UH-O4, BC-UH-O5, and BC-UH-O6 were 100.0 kN, 89.6 kN, 112.0 kN, 105.0 kN, 115.0 kN, and 95.0 kN, resulting in reductions of approximately 23%, 31%, 14%, 19%, 12%, and 27%, respectively. The UHPC specimens had the highest ultimate load capacities of any group in spite of the reductions, demonstrating the advantage of higher-performance materials in reducing strength loss from openings.
According to the results, the ultimate load decreases with more severe or larger openings across NSC, HC, and UHPC specimens, with reductions reaching up to 35.38% for NSC, 28.57% for HC, and 26.92% for UHPC, indicating a clear weakening of structural strength. HSC and UHPC specimens consistently show smaller percentage reductions compared to NC, demonstrating that higher-strength concrete improves load-carrying capacity and partially offsets the adverse effects of openings on ultimate strength.
The results also showed that among specimens with openings, the ultimate displacement (Δu) remained nearly constant across NC, HC, and UHPC specimens (≈100–102%), while the failure displacement (Δf) increased progressively with higher-strength concrete: NC (≈106–109%), HSC (≈112–115%), UHPC (≈118–121%).

4.3. Stiffness Degradation

Stiffness degradation is an important parameter for evaluating the structural behavior of specimens, as it reflects the reduction in stiffness due to damage under cyclic loads. It helps determine a structure’s safety and serviceability and offers insight into the development of cracking, yielding, and general deterioration. It also makes it possible to compare various specimens or design strategies effectively and is especially helpful in understanding behavior under extreme or cyclic loading conditions. Each specimen’s stiffness degradation [48] is shown in Table 5. This is how each loading cycle’s stiffness K is determined:
K = [P+ve − P−ve]/[D+ve − D−ve]
where Δ+ve and Δ−ve are the maximum displacements in the positive and negative directions for each loading cycle at each loading stage, and P+ve and P−ve are the maximum loads in the positive and negative directions for each loading cycle at each loading stage. The computed stiffness degradation values for every tested specimen are summarized in Table 5, where Kult denotes the stiffness at the final loading stage, and K0 denotes the initial stiffness.
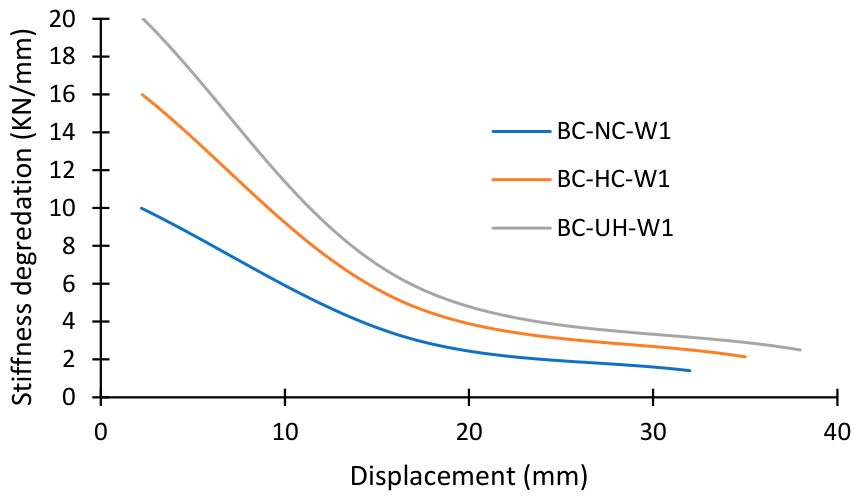
The stiffness degradation for reference specimens is shown in Figure 26. The impact of increasing concrete compressive strength on both initial stiffness and its degradation behavior is demonstrated by a comparison of stiffness degradation between reference specimens. The reference specimen BC-NC-W1 has a stiffness retention ratio of Kult/K0 = 0.32, with an initial stiffness K0 of 10.0 and an ultimate stiffness Kult of 3.2. The initial stiffness in BC-HC-W1 increases to 16.0 (a 60% increase relative to NSC), and when the concrete strength is increased to HSC, the final stiffness increases to 5.0. However, the stiffness degradation ratio is nearly constant at 0.31.
K0 and Kult also rise to 20.0 and 6.0, respectively, for the UHPC specimen BC-UH-W1, but the degradation ratio only slightly drops to 0.30. Although increased concrete strength significantly increases initial and ultimate stiffness, this pattern suggests that stiffness retention is not proportionately improved. This behavior may be attributed to the more brittle nature of HSC and UHPC concrete, which tends to lose stiffness more quickly after cracking due to their lower strain tolerance and a decreased capacity for microcracking. Therefore, stronger concrete increases load-carrying capacity (as shown by the increase in Pu from 65 kN to 130 kN), but it also causes stiffness to deteriorate a little more quickly than it did initially.
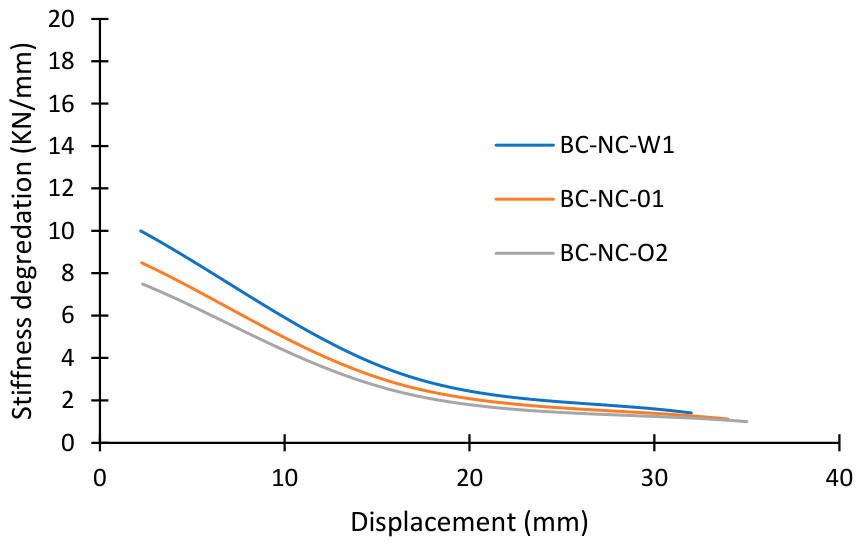
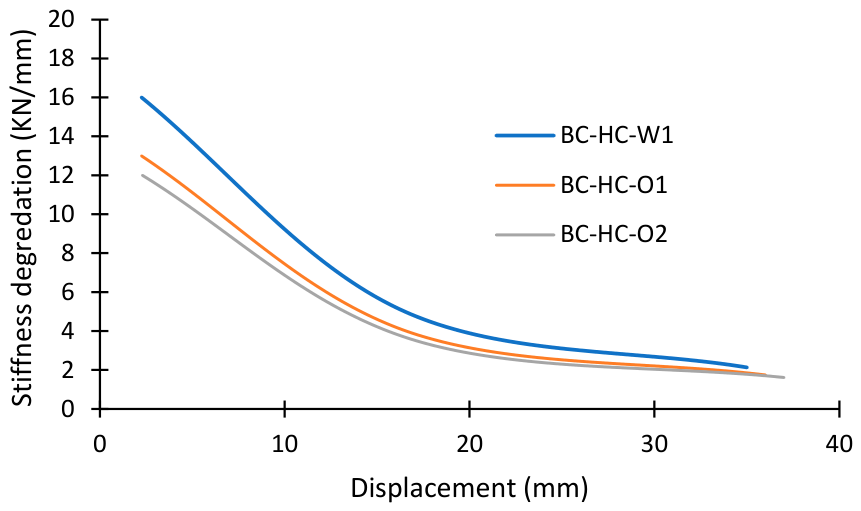
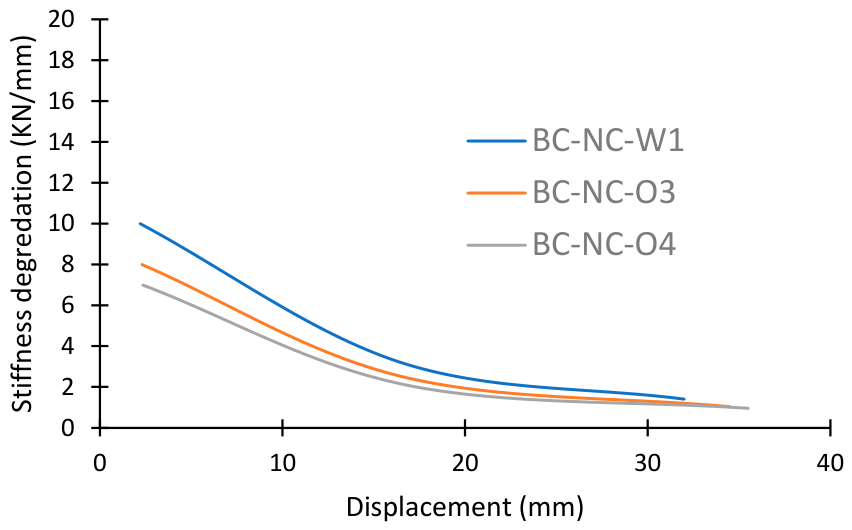
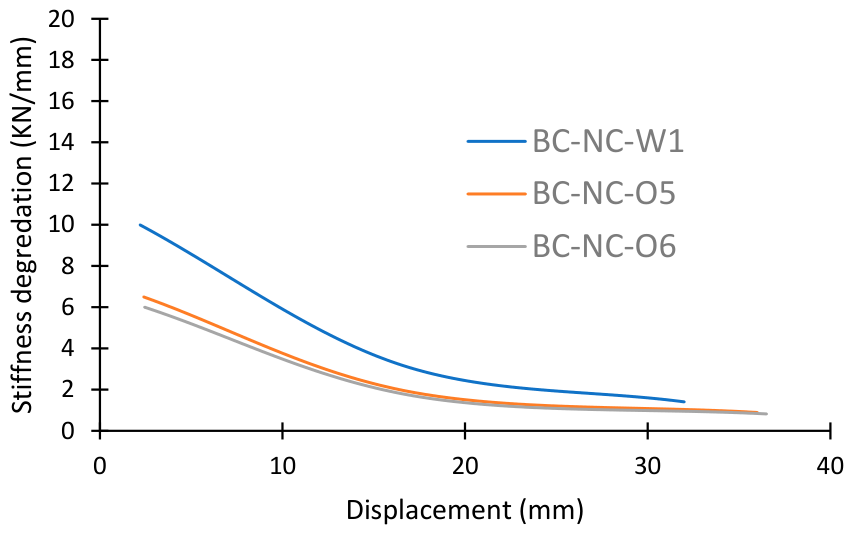
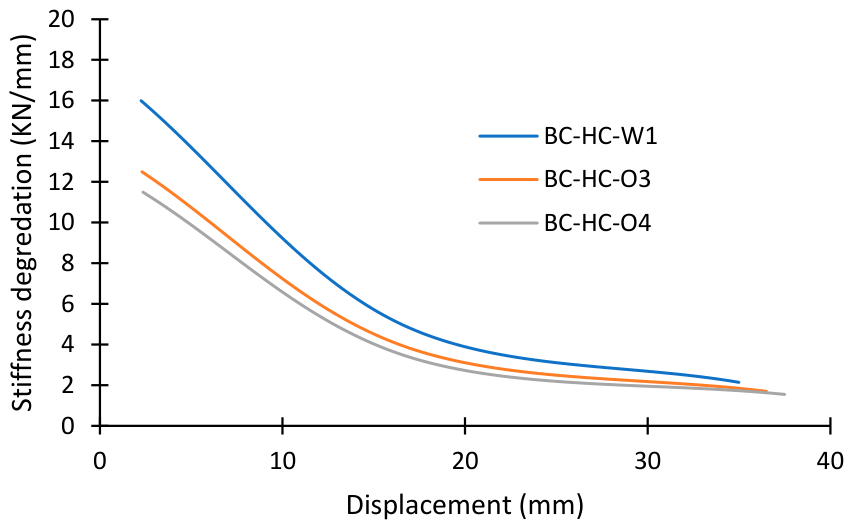
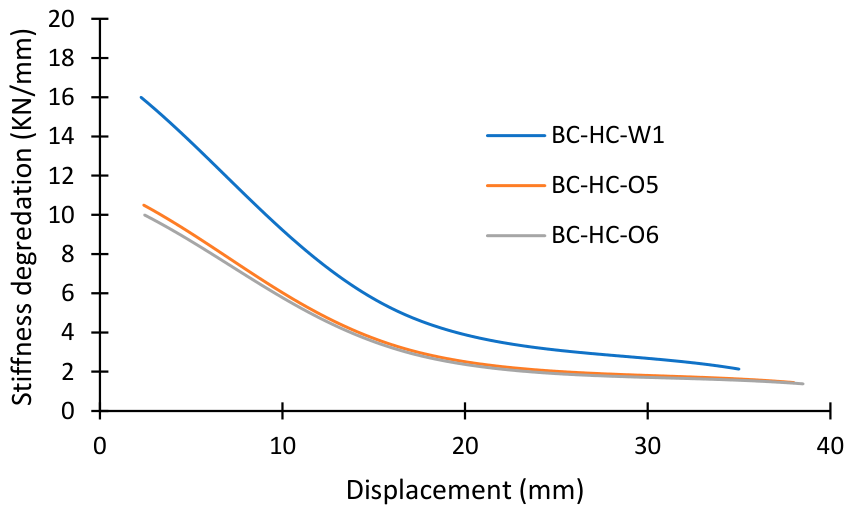
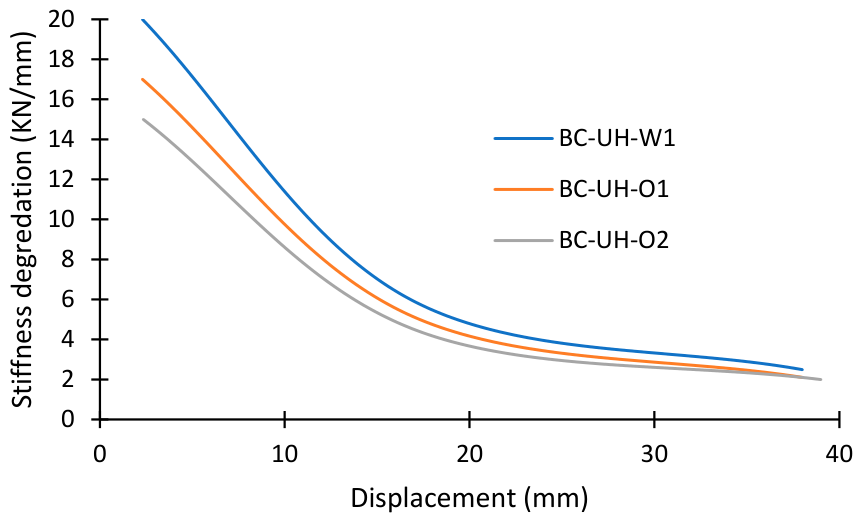
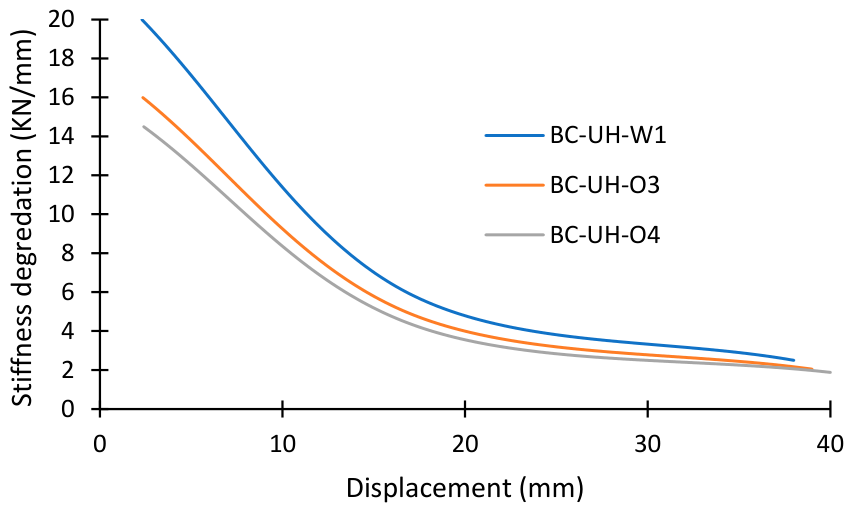
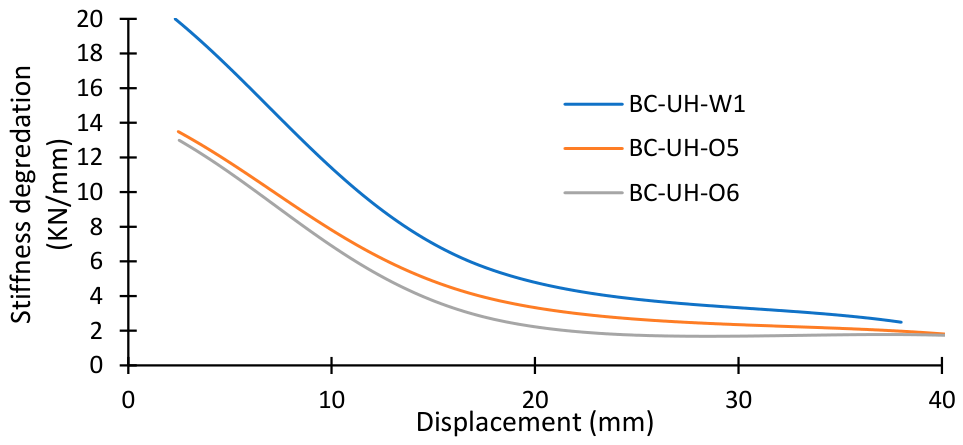
The ratio of ultimate stiffness to initial stiffness (Kult/K0), which gives a measure of the structural rigidity retained after loading, can be used to rigorously assess the impact of opening size and its effects on stiffness degradation. The stiffness degradation for specimens with openings is shown in Figure 27, Figure 28, Figure 29, Figure 30, Figure 31, Figure 32, Figure 33, Figure 34 and Figure 35. The results demonstrate that specimens with opening consistently show slightly more stiffness degradation than reference specimens at all concrete strength levels (NSC, HSC, and UHPC).
The NSC series’ stiffness ratio drops from 0.32 in the reference specimen to values between 0.29 and 0.31 for specimens with openings; BC-NC-O5 has the lowest ratio (0.29), which is roughly equivalent to a 9.4% reduction. In the HSC series, Kult/K0 drops from 0.31 in the reference specimen to about 0.30 for specimens with openings, a decrease of about 3–4%.
Similarly, the ratio in the UHPC specimens stays roughly constant between 0.30 and 0.31 as the opening size increases. These findings suggest that, although less so than reductions in load-carrying capacity or energy dissipation, the presence of openings, especially larger or less advantageous ones, accelerates stiffness degradation. Overall, the findings show that openings somewhat lessen the specimens’ structural rigidity, highlighting the importance of taking opening location and size into account when evaluating residual stiffness and overall structural performance.

4.4. Cumulative Energy Dissipation Capacity

Because it shows the total energy lost through cyclic loading until failure, cumulative energy is a crucial metric for assessing the overall seismic performance and damage resistance of BCCs. Its primary advantage is that, in contrast to single-point metrics like peak load or stiffness, it simultaneously measures strength and ductility [49]. Superior toughness and energy dissipation capacity are essential for earthquake-resistant design, and specimens with higher cumulative energy can withstand repeated loading with less degradation. Cumulative energy, or Ecum, is calculated using the total area enclosed by the load-displacement hysteresis loops during cyclic testing. Specifically, the area under each loading-unloading cycle until failure is added up to determine this numerically.
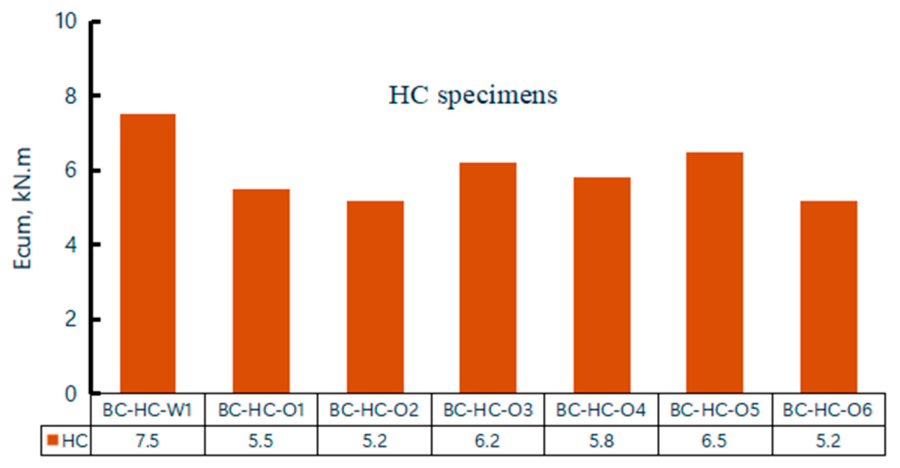
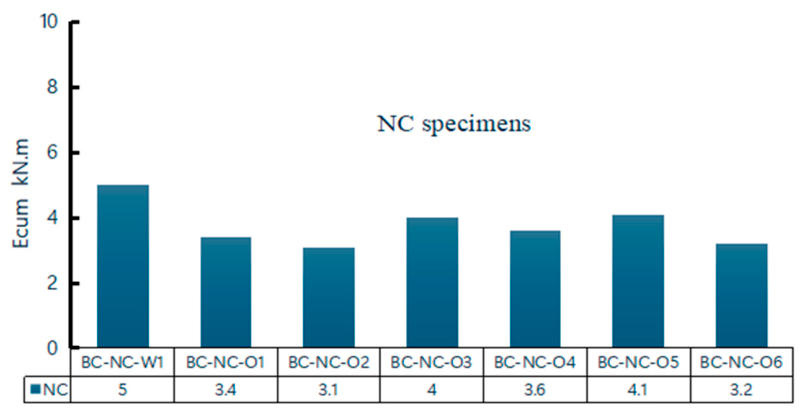
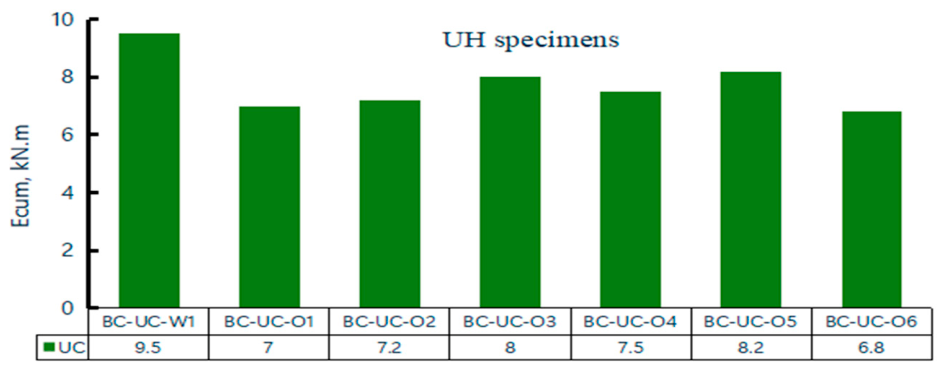
Figure 36, Figure 37 and Figure 38 show the cumulative energy dissipation for NSC, HSC, and UHPC specimens. The impact of increasing concrete strength on energy absorption is demonstrated by a comparison of cumulative energy dissipation between BC-HC-W1, BC-UH-W1, and the reference BC-NC-W1, as shown in Table 5. The HSC specimen, BC-HC-W1, dissipated 7.5 kN·m, the UHPC specimen, BC-UH-W1, dissipated 9.5 kN·m, and the normal-strength specimen, BC-NC-W1, dissipated 5.0 kN·m. This pattern demonstrates that higher-strength concrete enhances a structural element’s capacity to absorb and dissipate energy under cyclic loading.
The higher initial stiffness and peak load capacity of HSC and UHPC concretes, which enable them to withstand higher loads before noticeable degradation occurs, may be responsible for the increase in cumulative energy with concrete strength. However, higher-strength concrete is linked to somewhat more brittle behavior despite this increased energy dissipation, as evidenced by a steeper post-cracking stiffness degradation, suggesting a trade-off between strength and ductility. Overall, BC-HC-W1 and BC-UH-W1 show better energy absorption than BC-NC-W1, highlighting the advantage of employing higher-strength concrete for components that need improved cyclic or seismic performance.
The presence and location of openings affect the BCCs’ ability to absorb energy, as demonstrated by a comparison of cumulative energy dissipation across specimens with various opening sizes and locations. The NSC specimens with openings (BC-NC-O1 to BC-NC-O6) had lower cumulative energy values ranging from 3.2 to 4.2 kN·m, while BC-NC-W1 (without openings) dissipated 5.0 kN·m. This decrease suggests that openings create stress concentrations that lower energy dissipation and load-carrying capacity.
BC-HC-W1 dissipated 7.5 kN·m in the HSC specimens, whereas HSC specimens with openings (BC-HC-O1 to BC-HC-O6) dissipated 5.2–6.5 kN·m. Similarly, BC-UH-W1 dissipated 9.5 kN·m in the UHPC specimens, while UHPC specimens with openings dissipated 6.8–8.2 kN·m. The pattern shows that cumulative energy is consistently reduced by openings, with larger or unfavorably located openings resulting in greater reductions, even though higher-strength concrete increases cumulative energy. This highlights that in order to maximize energy dissipation and structural performance under cyclic loading, concrete strength as well as opening size and location must be carefully taken into account.

4.5. Structural Damage Index and Equivalent Viscous Damping Ratio

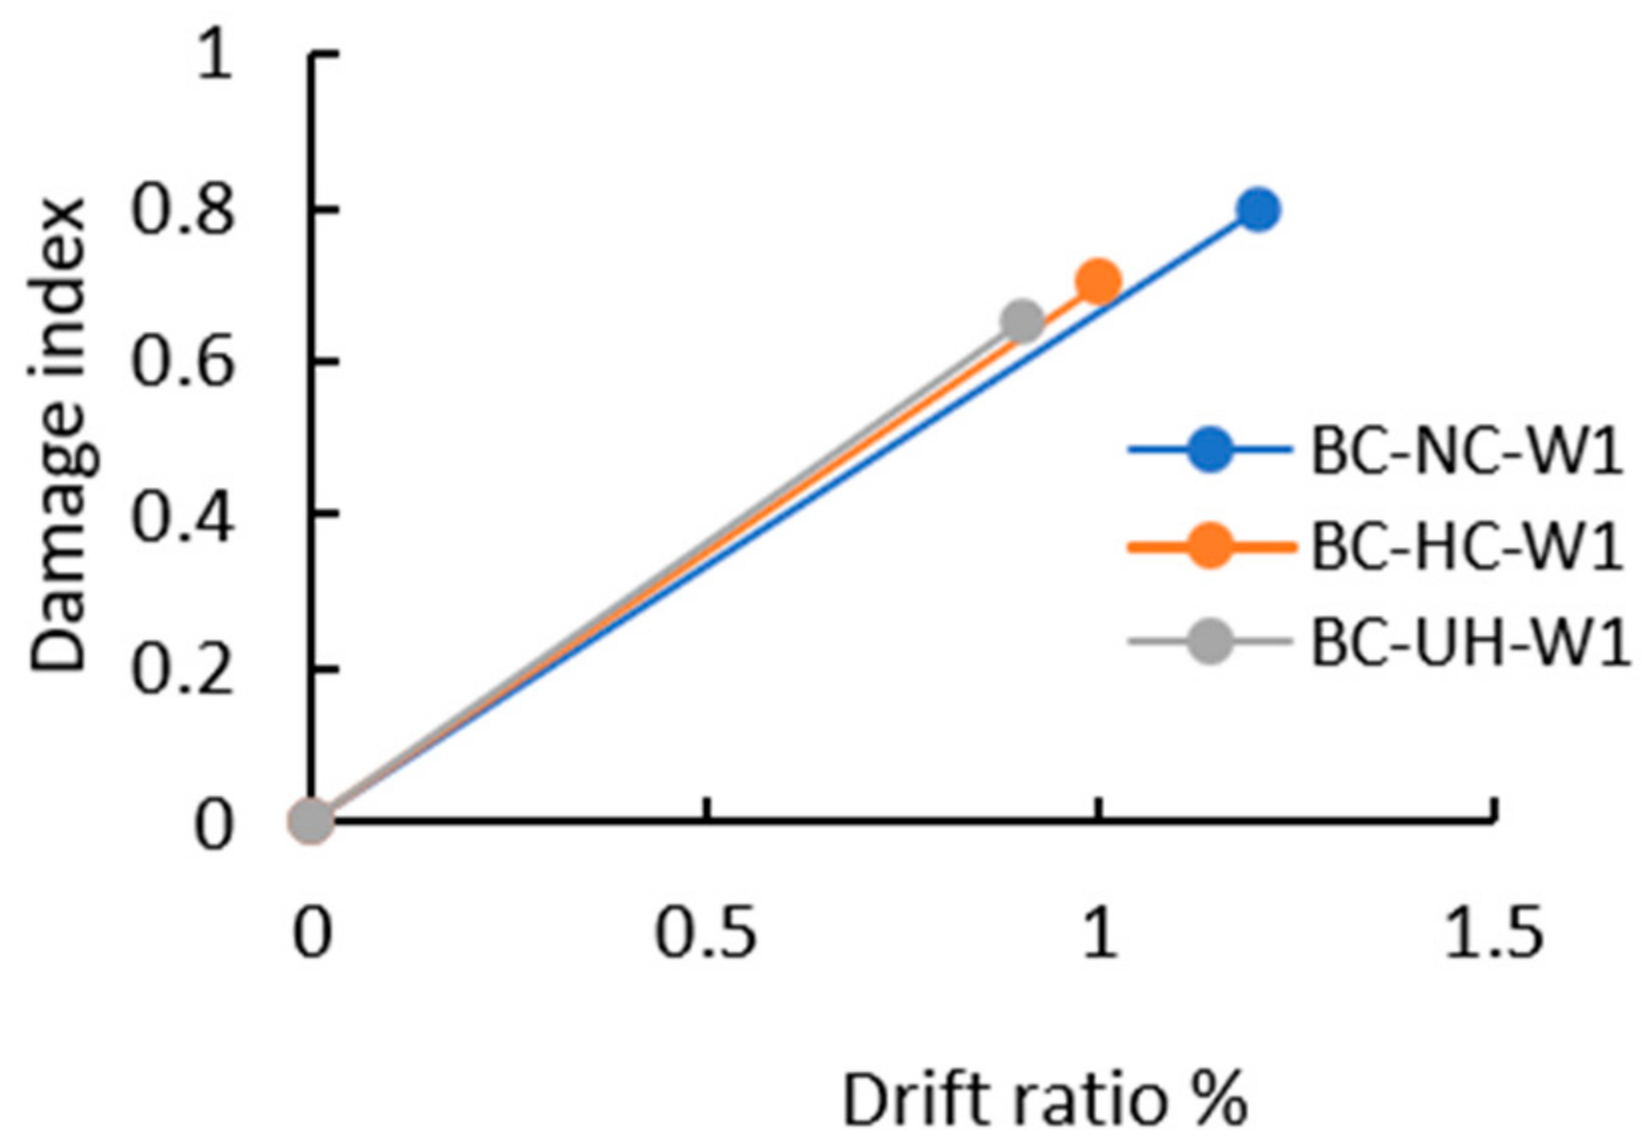
Numerous researchers have used a variety of indices to assess the deterioration of the BCCs caused by inelastic deformations [50]. The tested BCCs’ damage index amply illustrates how concrete grade affects structural deterioration under cyclic loading. The specimens BC-NC-W1, BC-HC-W1, and BC-UH-W1 clearly exhibit a positive linear correlation where damage increases with drift ratio, as shown in Figure 39. A member’s relative lateral displacement divided by its height yields the drift ratio, which is expressed as a percentage. It’s interesting to note that the BC-NC-W1 specimen has the highest damage index for a given drift ratio, indicating that regular concrete beams sustain more damage under lateral displacement than higher-grade concretes. The UHPC specimen (BC-UH-W1) exhibits the lowest damage index values at similar drift levels, even though both BC-HC-W1 and BC-UH-W1 show enhanced damage resistance. Because higher-grade concrete effectively reduces damage accumulation under cyclic loading, this trend highlights the important benefit of increasing concrete strength in enhancing structural resilience. Overall, the figure highlights the importance of concrete grade in reducing structural damage for the same drift demands and offers vital information for durability and seismic design considerations.
The impact of opening location and size on the damage index is shown in Table 5. With values ranging from 0.80 to 0.98, NSC specimens consistently showed the highest damage indices, indicating significant stiffness degradation in comparison to the initial condition. HSC specimens, on the other hand, showed lower damage indices, ranging from 0.70 to 0.88, indicating the advantage of HSC in lowering relative damage. With damage indices ranging from 0.65 to 0.82, the UHPC specimens showed the best resistance to stiffness reduction under equivalent loading. This pattern shows a clear inverse relationship between concrete grade and damage index: the relative deterioration of the structural response decreases as concrete strength increases from NC to UHPC, resulting in a lower damage index. These results demonstrate that openings lead to a measurable increase in damage accumulation; the most pronounced effect was seen in specimens with the largest or least advantageous openings. Thus, higher-grade concrete increases the resistance of the BCCs to cyclic and peak loading by decreasing stiffness loss, which is measured by the damage index.
Equivalent viscous damping, or the ratio of hysteretic energy dissipation to the system’s total energy consumption, is a critical metric for assessing seismic performance [51]. The equivalent viscous damping ratio (ξeq) for each investigated specimen, evaluated within Section 4.1 and summarized in Table 5, was calculated by the following expression [52]:
ξeq = 2 Aloop/π Arect
where Aloop is the area enclosed by the hysteresis loop, and Arect is the area of the matching elastic rectangle. It is evident that when concrete strength increases for the control specimens, the equivalent viscous damping ratio (ξeq) decreases. Specifically, BC-NC-W1 has the highest damping capacity (ξeq = 0.78), indicating that its more pronounced inelastic deformation causes it to dissipate more hysteretic energy. Conversely, BC-HC-W1 exhibits a moderate reduction (ξeq = 0.72), indicating a slight decrease in energy dissipation but an improvement in stiffness and strength. BC-UH-W1 has the lowest value (ξeq = 0.68), with a stiffer response and fewer hysteretic losses.
Overall, the results show that equivalent viscous damping gradually decreases as concrete strength increases from NC to UHPC, highlighting a trade-off between strength enhancement and energy dissipation capacity under cyclic loading. For all concrete grades (NSC, HSC, and UHPC), openings significantly affect the equivalent viscous damping ratio (ξeq). Because of increased damage accumulation and frictional energy dissipation, adding openings usually results in a slight increase in ξeq when compared to the reference specimens. For NC specimens, ξeq rises by about 17.9%, from 0.78 (W1) to 0.92 (O6). Conversely, UHPC specimens increase from 0.68 to 0.80, indicating an increase of roughly 17.6%, while HSC specimens show an increase from 0.72 to 0.85, indicating an improvement of roughly 18.1%.
Overall, the findings demonstrate that, despite a corresponding decrease in stiffness and strength, the presence of openings consistently increases the equivalent viscous damping ratio (ξeq) across NSC, HSC, and UHPC specimens by roughly 17–18%, indicating improved energy dissipation capacity.
To substantiate structural efficacy and highlight quantitative advancement of the current investigation, a comprehensive literature-based comparative analysis is illustrated in Table 6. To avoid any ambiguity, the seismic behavior of BCCs was assessed, specifying the current study as the normalized benchmark (Normalized Baseline = 100%) against which the relative performance percentages of reference studies were mathematically indexed through their respective formulations for energy and stiffness degradation. From the table, for instance, Amin et al. [25] adopted heavy congested secondary reinforcement to accommodate beam web openings close to the core of the joint, resulting in rapid 150% stiffness loss and brittle shear failure. Finally, the results of the present investigation indicate the successful application of UHPC, which mitigates structural weaknesses due to the existing openings in BCCs, resulting in significant enhancements in cumulative energy absorption and stability of stiffness degradation as compared to regular specimens.
Beyond the quantitative comparison in Table 6, it is worth discussing in greater detail the results reported by Shishegaran et al. [53], as they used a fundamentally different technique to enhance the performance of BCCs. Their findings showed that increasing the column longitudinal reinforcement ratio may significantly improve the residual load-carrying capacity of the connections under post-earthquake fire conditions. In contrast, the present study aimed to mitigate the adverse impacts of web openings during reversed cyclic stress through material improvement with HSC and UHPC.
The presence of openings decreased the ultimate load capacity by approximately 14–34% in the HSC specimens and 12–31% in the UHPC specimens; however, the mechanical characteristics of HSC and UHPC successfully mitigated these deficiencies. As a result, the HSC and UHPC specimens exhibited the highest load-carrying capacity of the tested groups. This showed that material upgrading can be an effective alternative technique to preserve structural performance even with geometric discontinuities.

5. Conclusions

5.1. Scientific and Theoretical Contributions

The essential scientific and theoretical insights derived from the extensive non-linear FE simulations and parametric evaluations are outlined as follows:
  • Increasing the concrete strength from NSC to HSC and UHPC delayed crack initiation and improved the cracking load capacity, with UHPC providing the largest gains. In contrast, the displacement at crack initiation changed very little, suggesting that the improvement was primarily related to increased load resistance rather than enhanced deformability.
  • Although HSC and UHPC improved crack resistance, the size and location of the openings remained the governing factors in crack development. Openings positioned close to the column face were particularly detrimental and produced the largest reductions in cracking load.
  • The use of HSC and UHPC substantially increased the load-carrying capacity of the connections. Relative to NSC, the ultimate load increased by approximately 61.5% and 100%, respectively, while the failure load increased by about 66.7% and 111.1%. By contrast, the ultimate displacement remained almost unchanged, and only modest increases in failure displacement (12.5% and 25%) were observed.
  • Introducing openings into the HSC specimens reduced the ultimate load capacity by approximately 14–34% compared with the reference specimen BC-HC-W1. The most severe reduction occurred in BC-HC-O2, whereas BC-HC-O5 was the least affected. Despite these losses, the HSC specimens maintained relatively high load-carrying capacities, indicating that increased concrete strength can partly compensate for the adverse effects of openings.
  • A similar trend was observed for the UHPC specimens. Although openings reduced the ultimate load by approximately 12–31% relative to BC-UH-W1, UHPC consistently provided the highest load capacities among all specimens. The largest reduction was again associated with BC-UH-O2, while BC-UH-O5 exhibited the smallest loss in strength.
  • Increasing the concrete strength had little influence on the stiffness retention ratio, which remained within a narrow range of 0.30–0.32. Nevertheless, the initial and ultimate stiffness increased markedly, by approximately 60% for HSC and 100% for UHPC. The introduction of openings caused only a slight additional reduction in stiffness retention.
  • The equivalent viscous damping ratio gradually decreased as the concrete strength increased from NSC to UHPC, dropping from 0.78 to 0.68. This trend reflects the lower hysteretic energy dissipation associated with stronger and stiffer concretes. In contrast, the presence of openings increased the damping ratio by approximately 17–18% across all concrete grades, likely due to increased damage accumulation and frictional sliding during cyclic loading.
  • Openings consistently reduced the cumulative energy dissipation capacity of the connections, with reductions ranging from 16–36% for NSC, 13–31% for HSC, and 14–28% for UHPC. The reductions became more pronounced as the openings increased in size or were placed in unfavorable locations. Even so, HSC and particularly UHPC maintained higher absolute energy dissipation capacities than NSC, indicating that stronger concretes can alleviate, but not completely overcome, the detrimental effects of openings.

5.2. Engineering Applications and Practical Implications

Openings in BCCs may be located near the joint core at a critical ratio of S/D ≥ 0.5 using HSC and UHPC. On the other hand, conventional normal concrete NC strictly requires a more conservative boundary, dictating that opening proximity must not be less than S/D ≥ 1.0 to prevent severe cyclic shear degradation near the high-stress region adjacent to the joint core.

5.3. Study Limitations

Although the developed 3D FE models were rigorously validated, the following boundaries should be acknowledged:
  • The investigation was restricted to three concrete grades (NC, HSC, and UHPC) without varying the volumetric micro-fiber content or implementing specialized supplementary reinforcement detailing around openings.
  • The parametric investigation matrix focused strictly on BCCs under uniaxial, quasi-static lateral cyclic loading, without considering bi-directional cyclic actions or real-time random earthquake time-history accelerations.

Author Contributions

Conceptualization and methodology, M.A.E.-M.; software, validation, formal analysis, data curation, writing original draft preparation, writing review and editing, and visualization, M.A.E.-M., B.O.R., A.A.E.-B., and D.A.A.; investigation, M.A.E.-M., B.O.R., A.A.E.-B.; resources, supervision, and project administration, D.A.A., and H.Y. All authors have read and agreed to the published version of the manuscript.

Funding

This research received no external funding.

Data Availability Statement

The original contributions presented in this study are included in the article. Further inquiries can be directed to the corresponding author.

Conflicts of Interest

The authors declare no conflicts of interest.

References

  1. Au, F.T.K.; Huang, K.; Pam, H.J. Diagonally-reinforced beam–column joints reinforced under cyclic loading. Proc. Inst. Civ. Eng.-Struct. Build. 2005, 158, 21–40. [Google Scholar] [CrossRef]
  2. Shishegaran, A.; Ghasemi, M.R.; Varaee, H. Performance of a novel bent-up bars system not interacting with concrete. Front. Struct. Civ. Eng. 2019, 13, 1301–1315. [Google Scholar] [CrossRef] [Scilit]
  3. Ghobarah, A.; Saatcioglu, M.; Nistor, I. The impact of the 26 December 2004 earthquake and tsunami on structures and infrastructure. Eng. Struct. 2006, 28, 312–326. [Google Scholar] [CrossRef] [Scilit]
  4. Miyajima, M.; Fallahi, A.; Ikemoto, T.; Samaei, M.; Karimzadeh, S.; Setiawan, H.; Talebi, F.; Karashi, J. Site Investigation of the Sarpole-Zahab Earthquake, Mw 7.3 in SW Iran of November 12, 2017. JSCE J. Disaster FactSheet 2018, FS2018-E-0002. [Google Scholar]
  5. Xinchen, Z.; Bing, L. Seismic Performance of Interior Reinforced Concrete Beam–Column Joint with Corroded Reinforcement. J. Struct. Eng. 2022, 148, 4021275. [Google Scholar] [CrossRef] [Scilit]
  6. Shen, X.; Li, B.; Chen, Y.-T.; Tizani, W. Seismic performance of reinforced concrete interior beam-column joints with novel reinforcement detail. Eng. Struct. 2021, 227, 111408. [Google Scholar] [CrossRef] [Scilit]
  7. Galustanian, N.; El-Sisi, A.; Amer, A.; Elshamy, E.; Hassan, H. Review of the Structural Performance of Beams and Beam–Column Joints with Openings. CivilEng 2023, 4, 1233–1242. [Google Scholar] [CrossRef] [Scilit]
  8. Ramadan, O.; Abdelbak, S.; Saleh, A.; Alkhattabi, A. Modeling of Reinforced Concrete Beams With and Without Opening by Using Ansys. JES J. Eng. Sci. 2009, 37, 845–858. [Google Scholar] [CrossRef] [Scilit]
  9. Yu, D.; He, Z. Cohesive zone model-integrated hybrid numerical simulation strategy for RC/PC beam-column joints under reversed cyclic loadings. Structures 2025, 80, 109772. [Google Scholar] [CrossRef] [Scilit]
  10. Mansur, M.A. Effect of openings on the behaviour and strength of R/C beams in shear. Cem. Concr. Compos. 1998, 20, 477–486. [Google Scholar] [CrossRef] [Scilit]
  11. Jabbar, D.N.; Al-Rifaie, A.; Hussein, A.M.; Shubbar, A.A.; Nasr, M.S.; Al-Khafaji, Z.S. Shear behaviour of reinforced concrete beams with small web openings. Mater. Today Proc. 2021, 42, 2713–2716. [Google Scholar] [CrossRef] [Scilit]
  12. El-kareim Shoeib, A.; El-sayed Sedawy, A. Shear strength reduction due to introduced opening in loaded RC beams. J. Build. Eng. 2017, 13, 28–40. [Google Scholar] [CrossRef] [Scilit]
  13. Fu, L.; Wang, H.; Nakamura, H.; Wang, D. Mechanism of shear strengthening for RC beam by drilling web openings based on experiment and 3D RBSM analysis. Eng. Fail. Anal. 2023, 145, 107048. [Google Scholar] [CrossRef] [Scilit]
  14. Sayed, A.M. Numerical study using FE simulation on rectangular RC beams with vertical circular web openings in the shear zones. Eng. Struct. 2019, 198, 109471. [Google Scholar] [CrossRef] [Scilit]
  15. El-Sisi, A.A.; El-Emam, H.M.; El-Kholy, A.E.-M.I.; Ahmad, S.S.; Sallam, H.M.; Salim, H.A. Structural Behavior of RC Beams Containing Unreinforced Drilled Openings with and without CFRP Strengthening. Polymers 2022, 14, 2034. [Google Scholar] [CrossRef] [Scilit] [PubMed]
  16. Chiu, C.-K.; Liao, I.-H.; Choudhury, S.R.; Ho, Y.-Y. A simplified analytical method of shear strength for an RC beam with a transverse circular opening. Structures 2025, 79, 109513. [Google Scholar] [CrossRef] [Scilit]
  17. Ali, S.R.M.; Saeed, J.A. Shear capacity and behavior of high-strength concrete beams with openings. Eng. Struct. 2022, 264, 114431. [Google Scholar] [CrossRef] [Scilit]
  18. Barkhordari, M.; Jawdhari, A. Finite Element Analysis of UHPC Beams with Transverse Openings. In International Interactive Symposium on Ultra-High Performance Concrete; Iowa State University Digital Press: Ames, IA, USA, 2023. [Google Scholar] [CrossRef] [Scilit]
  19. Chiu, C.-K.; Sung, H.-F.; Shen, I.-T. Experimental investigation on retrofit effectiveness of CFRP strips for a transverse circular opening in an RC beam under cyclic loading. Structures 2026, 86, 111315. [Google Scholar] [CrossRef] [Scilit]
  20. Özkılıç, Y.O.; Aksoylu, C.; Yazman, Ş.; Gemi, L.; Arslan, M.H. Behavior of CFRP-strengthened RC beams with circular web openings in shear zones: Numerical study. Structures 2022, 41, 1369–1389. [Google Scholar] [CrossRef] [Scilit]
  21. Alyaseen, A.; Poddar, A.; Alissa, J.; Alahmad, H.; Almohammed, F. Behavior of CFRP-strengthened RC beams with web openings in shear zones: Numerical simulation. Mater. Today Proc. 2022, 65, 3229–3239. [Google Scholar] [CrossRef] [Scilit]
  22. Zhang, S.S.; Zhang, D.D.; Nie, X.F. Behavior of RC interior beam-to-column joints with FRP-strengthened beam web openings under cyclic loading. Eng. Struct. 2025, 324, 119373. [Google Scholar] [CrossRef] [Scilit]
  23. Murad, Y. Joint shear strength models for exterior RC beam-column connections exposed to biaxial and uniaxial cyclic loading. J. Build. Eng. 2020, 30, 101225. [Google Scholar] [CrossRef] [Scilit]
  24. Saha, P.; Meesaraganda, L.V. Experimental investigation of reinforced SCC beam-column joint with rectangular spiral reinforcement under cyclic loading. Constr. Build. Mater. 2019, 201, 171–185. [Google Scholar] [CrossRef] [Scilit]
  25. Amin, S.; Elwan, S.K.; Elzeiny, S.; Hamad, M.; Deifalla, A. Numerical modeling the effect of an opening on the behavior of exterior beam-column connections under cyclic loading. J. Build. Eng. 2021, 40, 102742. [Google Scholar] [CrossRef] [Scilit]
  26. Galustanian, N.; El-Sisi, A.E.-D.; Panahshahi, N.; Orton, S.; Sobhy, A. Cyclic performance of RC frame joints with drilled openings. Structures 2024, 64, 106568. [Google Scholar] [CrossRef] [Scilit]
  27. El-Naqeeb, M.H.; Hassanli, R.; Zhuge, Y.; Ma, X.; Bazli, M.; Manalo, A. Beam-column connections in GFRP-RC moment resisting frames: A review of seismic behaviour and key parameters. Structures 2025, 71, 108109. [Google Scholar] [CrossRef] [Scilit]
  28. Hashemi, S.A.; Shafaei, J.; Amiri, M.S. Seismic retrofit of RC beam-column joints by the combination of prestressed steel angles and CFRP sheets. Structures 2026, 89, 112039. [Google Scholar] [CrossRef] [Scilit]
  29. Xiong, M.-X.; Chen, C.; Liu, J. Effects of stirrup configuration and reinforcement ratio on the seismic behavior of GFRP-reinforced concrete beam-column joints. J. Build. Eng. 2026, 117, 114719. [Google Scholar] [CrossRef] [Scilit]
  30. Rahmanpour, M.; Zarrin, M.; Afshin, H.; Shakor, P.; Qader, D.N.; Aslani, F. Experimental study on repairing and retrofitting lightweight concrete external beam-column joint under cyclic loading using steel plates and CFRP. Structures 2026, 87, 111760. [Google Scholar] [CrossRef] [Scilit]
  31. Humairy, R.S.; Sharifi, M.; Amirabadi, R.; Shokrzadeh, M.R. Experimental evaluation of seismic retrofitting strategies for slab-integrated exterior RC beam–column joints: Comparative performance of BSAC, GFRP-BSB, and GFRP-NSM. Structures 2026, 86, 111454. [Google Scholar] [CrossRef] [Scilit]
  32. Doğan, T.P.; Erkan, İ.H.; Anıl, Ö.; Erdem, R.T. Strengthening of low performance reinforced concrete beam to column joints against seismic effects with textile reinforced mortar strips. J. Build. Eng. 2026, 120, 115442. [Google Scholar] [CrossRef] [Scilit]
  33. Zhu, Y.; Wang, W.; Lin, R. Comparative study on the seismic behavior of precast concrete-encased CFST column to precast and cast-in-place RC beam joints. J. Build. Eng. 2025, 104, 112278. [Google Scholar] [CrossRef] [Scilit]
  34. Wang, J.; Wang, W.; Guo, L. Seismic tests and nonlinear model of beam-CFDST column joints with blind fasteners. J. Build. Eng. 2022, 45, 103415. [Google Scholar] [CrossRef] [Scilit]
  35. Wu, Z.; Lu, X.; Bao, H.; Li, L.; Lu, Z. Experimental response of semi-rigid reinforced concrete beam-column joints with bolted angle dissipating connections. J. Build. Eng. 2024, 90, 109345. [Google Scholar] [CrossRef] [Scilit]
  36. Yu, J.; Yan, X.; Wang, G.; Chen, W.; Shi, S.; Lin, Z. Hysteretic behavior of prefabricated self-centering RC beam-CFDST column joints. Structures 2025, 80, 110007. [Google Scholar] [CrossRef] [Scilit]
  37. Hashemi, S.A.; Nezami, S.A.; Shafaei, J. Seismic retrofit of corner RC beam-column joints by 3D joint enlargement method: Experimental investigation. Eng. Struct. 2026, 350, 121960. [Google Scholar] [CrossRef] [Scilit]
  38. Zhang, X.; Teng, Y.; Ju, Y.; Wang, B.; Wang, D.; Zhao, J.; Kong, X. Experimental and theoretical study on seismic behavior of precast exterior UHPC-HSC beam-column connections. Case Stud. Constr. Mater. 2025, 23, e05619. [Google Scholar] [CrossRef] [Scilit]
  39. Su, S.; Zhang, G.; Han, Q.; Peng, L.; Chen, W.; Zhou, D.; Du, X. Failure mechanism of prefabricated canopy beam-column joints using CFST socket connection under cyclic loading. Eng. Struct. 2026, 351, 122032. [Google Scholar] [CrossRef] [Scilit]
  40. Choi, S.-H.; Kim, J.-H.; Jeong, H.; Kim, K.S. Seismic behavior of beam-column joints with different concrete compressive strengths. J. Build. Eng. 2022, 52, 104484. [Google Scholar] [CrossRef] [Scilit]
  41. DeSalvo, G.; Swanson, J. ANSYS Engineering Analysis System User’s Manual; Swanson Analysis Systems: Houston, PA, USA, 1985. [Google Scholar]
  42. Park, Y.; Ang, A.H.-S. Mechanistic Seismic Damage Model for Reinforced Concrete. J. Struct. Eng. 1985, 111, 722–739. [Google Scholar] [CrossRef] [Scilit]
  43. Mavlonov, R.; Razzakov, S.; Numanova, S. Stress-strain state of combined steel-FRP reinforced concrete beams. In E3S Web of Conferences; EDP Sciences: Occitania, France, 2023; Volume 452. [Google Scholar] [CrossRef] [Scilit]
  44. Zreid, I.; Kaliske, M. A gradient enhanced plasticity–damage microplane model for concrete. Comput. Mech. 2018, 62, 1239–1257. [Google Scholar] [CrossRef] [Scilit]
  45. Akin-Adamu, A.; Yalçınkaya, Ç.; Merter, O. Structural Analysis of Reinforced Ultra-High Performance Concrete Beams. In Proceedings of the Deu International Symposium Series On Graduate Researches-2022 Engineering Science, Izmir, Turkey, 17–18 November 2022. [Google Scholar]
  46. Mitkou, T.P.; Chrysanidis, T.A. R/C column modeling using ANSYS and loading rate and mesh method influence studies. In Proceedings of the 8th ECCOMAS Thematic Conference on Computational Methods in Structural Dynamics and Earthquake Engineering, Athens, Greece, 28–30 June 2021; Volume 2021. [Google Scholar] [CrossRef] [Scilit]
  47. 374 ACIC. Guide for Testing Reinforced Concrete Structural Elements Under Slowly Applied Simulated Seismic Loads; American Concrete Institute: Farmington Hills, MI, USA, 2013. [Google Scholar]
  48. Kheyroddin, A.; Rouhi, S.; Dabiri, H. An experimental study on the influence of incorporating lap or forging (GPW) splices on the cyclic performance of RC columns. Eng. Struct. 2021, 241, 112434. [Google Scholar] [CrossRef] [Scilit]
  49. Choi, S.H.; Hwang, J.H.; Lee, D.H.; Kim, K.S.; Zhang, D.; Kim, J.R. Experimental study on RC frame structures strengthened by externally-anchored PC wall panels. Comput. Concr. 2018, 22, 383–393. [Google Scholar] [CrossRef]
  50. Gil-Martín, L.M.; Rodríguez-Suesca, A.E.; Fernández-Ruiz, M.A.; Hernández-Montes, E. Cyclic behavior of RC beam-column joints with epoxy resin and ground tire rubber as partial cement replacement. Constr. Build. Mater. 2019, 211, 659–674. [Google Scholar] [CrossRef] [Scilit]
  51. Zhang, Y.; Gong, J.; Zhang, Q.; Han, S. Equivalent damping ratio model of flexure-shear critical RC columns. Eng. Struct. 2017, 130, 52–66. [Google Scholar] [CrossRef] [Scilit]
  52. Lim, W.Y.; Kang, T.H.K.; Hong, S.G. Effect of reinforcement details on seismic behavior of precast concrete wall-steel coupling beam systems. ACI Struct. J. 2018, 115, 1751–1763. [Google Scholar] [CrossRef] [Scilit]
  53. Shishegaran, A.; Moradi, M.; Naghsh, M.A.; Karami, B.; Shishegaran, A. Prediction of the load-carrying capacity of reinforced concrete connections under post-earthquake fire. J. Zhejiang Univ.-Sci. A 2021, 22, 441–466. [Google Scholar] [CrossRef] [Scilit]
Figure 1. Methodological framework of the numerical investigation.
Buildings 16 02509 g001
Figure 2. Beam–column cross-sections.
Buildings 16 02509 g002
Figure 3. Reference specimen dimensions and RFT (units, mm).
Buildings 16 02509 g003
Figure 4. Load displacement envelope curves for different mesh sizes.
Buildings 16 02509 g004
Figure 5. An illustration of concrete and rebars meshing for specimens BC-NC-W1.
Buildings 16 02509 g005
Figure 6. An illustration of the concrete and rebar meshing for specimens BC-NC-O1.
Buildings 16 02509 g006
Figure 7. Boundary condition of the analyzed specimen (units, mm).
Buildings 16 02509 g007
Figure 8. Loading protocol.
Buildings 16 02509 g008
Figure 9. Experimental vs. numerical (ANSYS) crack patterns of the reference specimen BC-NC-W1 with fc′ of 18 MPa.
Buildings 16 02509 g009
Figure 10. Experimental vs. numerical hysteretic (ANSYS) load-drift loops of the reference specimen BC-NC-W1 with f c ′ of 18 MPa.
Buildings 16 02509 g010
Figure 11. Equivalent plastic strain of concrete for some studied specimens.
Buildings 16 02509 g011
Figure 12. Equivalent plastic strain of rebars for some studied specimens.
Buildings 16 02509 g012
Figure 13. Hysteretic load-displacement curve of specimen BC-NC-W1.
Buildings 16 02509 g013
Figure 14. Hysteretic load-displacement curve of specimen BC-HC-W1.
Buildings 16 02509 g014
Figure 15. Hysteretic load-displacement curve of specimen BC-UH-W1.
Buildings 16 02509 g015
Figure 16. Envelope load displacement curves for the reference specimens.
Buildings 16 02509 g016
Figure 17. Envelope load displacement curve for the studied NC beam-column at S/d = 0.0.
Buildings 16 02509 g017
Figure 18. Envelope load displacement curve for the studied NC beam-column at S/d = 0.50.
Buildings 16 02509 g018
Figure 19. Envelope load displacement curve for the studied NC beam-column at S/d = 1.0.
Buildings 16 02509 g019
Figure 20. Envelope load displacement curve for the studied HSC beam-column at S/d = 0.0.
Buildings 16 02509 g020
Figure 21. Envelope load displacement curve for studied HSC beam-column at S/d = 0.50.
Buildings 16 02509 g021
Figure 22. Envelope load displacement curve for the studied HSC beam-column at S/d = 1.0.
Buildings 16 02509 g022
Figure 23. Envelope load displacement curve for the studied UHPC beam-column at S/d = 0.0.
Buildings 16 02509 g023
Figure 24. Envelope load displacement curve for the studied UHPC beam-column at S/d = 0.50.
Buildings 16 02509 g024
Figure 25. Envelope load displacement curve for the studied UHPC beam-column at S/d = 1.0.
Buildings 16 02509 g025
Figure 26. Stiffness degradation for reference specimens.
Buildings 16 02509 g026
Figure 27. Stiffness degradation for NC specimens at S/d = 0.0.
Buildings 16 02509 g027
Figure 28. Stiffness degradation for NC specimens at S/d = 0.5.
Buildings 16 02509 g028
Figure 29. Stiffness degradation for NC specimens at S/d = 1.0.
Buildings 16 02509 g029
Figure 30. Stiffness degradation for HSC specimens at S/d = 0.0.
Buildings 16 02509 g030
Figure 31. Stiffness degradation for HSC specimens at S/d = 0.5.
Buildings 16 02509 g031
Figure 32. Stiffness degradation for HSC specimens at S/d = 1.0.
Buildings 16 02509 g032
Figure 33. Stiffness degradation for UHPC specimens at S/d = 0.0.
Buildings 16 02509 g033
Figure 34. Stiffness degradation for UHPC specimens at S/d = 0.5.
Buildings 16 02509 g034
Figure 35. Stiffness degradation for UHPC specimens at S/d = 1.0.
Buildings 16 02509 g035
Figure 36. Cumulative energy for NC specimens.
Buildings 16 02509 g036
Figure 37. Cumulative energy for HSC specimens.
Buildings 16 02509 g037
Figure 38. Cumulative energy for UHPC specimens.
Buildings 16 02509 g038
Figure 39. Damage index versus drift ratio of reference specimens.
Buildings 16 02509 g039
Table 1. Mechanical properties of steel bars (in MPa units).
Diameter of BarYield Strength, fyUltimate Strength, fuElastic ModulusYield Strain
D10499590204.5740.00244
D12487613217.1620.00224
D16467606224.4640.00208
Table 2. Specifying material properties for ANSYS WORKBENCH simulations.
ParameterSymbolUnitsNSC (NC)HSC (HC)UHPC (UH)
Elastic modulusEMPa15,427.297330,268.043835,652.04
Poisson’s ratioμ-0.200.200.20
Yield Surface
Compressive strengthfc′MPa2580120
Biaxial compressive strengthfbMPa28.7592138
Uniaxial tensile strengthftMPa2.5812
Compression Cap
Compression cap locationσv2MPa−19.2−53−92
Compression cap shapeR-222
Hardening
Drucker–Prager yield hardeningDMPa240,00040,000400,000
Tensile cap shapeRT-111
Damage
Tension damage thresholdγt0-000
Compression damage thresholdγc0-1 × 10−51 × 10−51 × 10−5
Tension damage parameterβt-15001500750
Compression damage parameterβc-10001000500
Nonlocal interaction rangecmm225,60025,60025,600
Nonlocal parameterm-2.52.52.5
Table 3. Comparison between experimental and numerical results.
Specimen
Choi et al. [40]
ho/dLo/dS/dExperimental ResultsNumerical Results
Pcr (kN)Δcr (mm)Pu (mm)Δu (mm)Pcr (kN)Δcr (mm)Pu (mm)Δu (mm)
JC---28.962.2191.5016.3327.102.3193.8317.52
J10.500.500.5022.352.2569.1816.6021.082.3471.0617.82
J20.500.501.0024.132.2579.8016.9022.712.3481.9018.11
J30.501.000.5020.502.2958.6016.4719.312.3860.2717.66
J40.501.001.0021.512.2564.2016.4520.422.3465.9817.64
Table 4. Overview of the parametric specimen matrix.
Beam-Column No.SpecimenTypeho/dLo/dS/dfc′ (MPa)
1BC-NC-W1NC---25
2BC-HC-W1HC---80
3BC-UH-W1UH---120
4BC-NC-O1NC 25
5BC-HC-O1HC0.500.50zero80
6BC-UH-O1UH 120
7BC-NC-O2NC 25
8BC-HC-O2HC0.501.0zero80
9BC-UH-O2UH 120
10BC-NC-O3NC 25
11BC-HC-O3HC0.500.500.5080
12BC-UH-O3UH 120
13BC-NC-O4NC 25
14BC-HC-O4HC0.501.000.5080
15BC-UH-O4UH 120
16BC-NC-O5NC 25
17BC-HC-O5HC0.500.501.0080
18BC-UH-O5UH 120
19BC-NC-O6NC 25
20BC-HC-O6HC0.501.001.0080
21BC-UH-O6UH 120
Table 5. Summary of parametric study numerical results.
SpecimenPcrΔcrPuΔuPfΔfK0KultKult/K0Energy E c u m Drift RatioDξeq
BC-NC-W122.02.2065.016.545.032.010.03.20.325.01.20.800.78
BC-HC-W135.02.25105.016.575.035.016.05.00.317.51.00.700.72
BC-UH-W145.02.30130.016.895.038.020.06.00.309.50.90.650.68
BC-NC-O115.02.4045.017.032.031.06.51.90.293.41.500.950.9
BC-HC-O126.02.4078.017.055.038.010.53.10.305.51.300.850.82
BC-UH-O134.02.45100.017.372.040.513.54.00.307.01.200.800.78
BC-NC-O214.02.2040.015.630.029.16.52.20.303.11.30.600.71
BC-HC-O224.02.3069.416.840.034.012.02.90.295.21.20.800.76
BC-UH-O232.02.3589.616.675.036.014.04.10.307.21.10.750.69
BC-NC-O317.02.3052.016.636.034.58.02.50.314.01.350.880.85
BC-HC-O328.02.3088.016.762.036.512.53.90.316.21.150.780.78
BC-UH-O338.02.35112.017.080.039.016.04.90.318.01.050.720.74
BC-NC-O415.02.3548.016.834.035.57.02.10.303.61.450.920.88
BC-HC-O426.02.3582.016.958.037.511.53.40.305.81.250.820.8
BC-UH-O434.02.40105.017.275.040.014.54.30.307.51.150.780.76
BC-NC-O518.02.2555.016.538.034.08.52.70.324.21.30.850.8
BC-HC-O529.02.2590.016.663.036.013.04.00.316.51.10.750.74
BC-UH-O538.02.30115.016.880.038.017.05.20.318.21.00.700.7
BC-NC-O617.02.454916.13031.16.01.70.283.21.550.980.92
BC-HC-O627.02.457517.25338.510.02.90.295.21.350.880.85
BC-UH-O636.02.509517.57041.013.02.80.296.81.250.820.8
Table 6. Comprehensive comparative matrix of existing literature and current structural indicators.
ReferenceConcrete
Matrix
Web Opening StatusReinforcement/Mitigation TypeCumulative Energy DissipationStiffness Degradation Rate
1. Amin et al. (2021) [25](NSC)Varying openings near support (S/d)Traditional rebar 52%150%
(Rapid Loss)
Investigated opening proximity (S/d) and aspect ratios under cyclic load; suffered brittle web shear failure around the perforation zones.
2. Zhang X. et al. (2025) [38]Precast Concrete-Encased CFST(No openings)Small-diameter internal steel tubes58%145% (Rapid Loss)
Investigated precast assembly configurations; failed via abrupt joint core shear without structural routing challenges.
3. Su et al. (2026) [39]UHPC-filled CFST Core(No openings)Welded rebar socket connection85%110% (Stable Trend)
Studied prefabricated canopy socket joints under cyclic shear; omitted beam web opening architectural layouts.
4. Doğan et al. (2026) [32]Low-Performance Concrete(No openings)Textile Reinforced Mortar (TRM) strips42%165% (High Loss)
Focused on local strengthening of the deficient existing framework against cyclic shear forces.
5. Humairy et al. (2026) [31]Slab-Integrated Exterior RC(No openings)Bolted Steel Angle/GFRP-NSM strips62%135% (Moderate Loss)
Evaluated integrated slab effects on composite joint shear degradation under cyclic reversals.
6. Current InvestigationComparative Matrix:
NSC, HSC, & UHPC
Varying opening size and proximity (S/d)Standard reinforcement (No secondary congestion)100%
(Baseline Reference)
100%
(Most Gradual & Stable)
Disclaimer/Publisher’s Note: The statements, opinions and data contained in all publications are solely those of the individual author(s) and contributor(s) and not of MDPI and/or the editor(s). MDPI and/or the editor(s) disclaim responsibility for any injury to people or property resulting from any ideas, methods, instructions or products referred to in the content.