


Abstract
This study investigates the interlayer shear performance of 3D-printed concrete (3DPC) using direct shear tests. Three nominal layer heights, 5 mm, 10 mm, and 15 mm, were considered, and specimens were loaded parallel to the printing path (x direction) and perpendicular to the printing path (y direction). The results show that the interlayer nominal shear strength decreased with increasing layer height. When the layer height increased from 5 mm to 10 mm and then to 15 mm, the nominal shear strength decreased from 9.18 MPa to 7.01 MPa and 4.88 MPa in the x direction, and from 7.87 MPa to 5.29 MPa and 2.68 MPa in the y direction. At the same layer height, the x-direction specimens exhibited higher nominal shear strength than the corresponding y-direction specimens, with increases of approximately 17%, 33%, and 82% for the 5 mm, 10 mm, and 15 mm series, respectively. DIC analysis indicated that tensile–shear damage was the main local failure characteristic. The loading-direction effect was related to different shear-transfer paths: the L-x specimens mainly followed a “continuous filaments-mortar matrix-interlayer bonding” path, whereas the L-y specimens were more controlled by weak interlayer-edge regions and local stress concentration. The effective shear-area analysis showed that the effective bonded area decreased with increasing layer height. After area correction, the corrected shear strengths of the x-direction specimens were 9.18 MPa, 8.76 MPa, and 8.13 MPa for L-5-x, L-10-x, and L-15-x, respectively, while those of the y-direction specimens were 7.87 MPa, 6.61 MPa, and 4.47 MPa, respectively. This indicates that a larger layer height not only reduced the effective bonded area but also weakened filament compaction and bonding quality. The findings provide a mechanism-oriented basis for understanding the anisotropic interlayer shear behavior of 3DPC.
1. Introduction
3D-printed concrete (3DPC), or concrete additive manufacturing, has gained significant attention as an emerging construction technology due to its automated, layer-by-layer deposition of cementitious materials guided by digital models [1,2,3,4,5,6,7]. By eliminating the conventional formwork, 3DPC improves productivity, reduces material waste, and enables the fabrication of geometrically complex or customized components that are difficult to achieve using cast-in-place methods [8,9,10,11,12,13,14].
Despite its potential, the unique layer-wise manufacturing mechanism introduces a critical challenge: the interlayer interface often governs the mechanical weakness of 3DPC components. Rapid moisture loss, plastic shrinkage, and incomplete hydration at the fresh-to-hardened layer boundary may prevent adequate bonding, resulting in “cold joints” [15,16,17]. These interfaces act as preferential crack paths under loading, particularly in shear, where delamination can markedly reduce load-bearing capacity and stiffness. The presence of microcracks and interconnected pores at weak interfaces further accelerates the ingress of harmful agents, compromising long-term durability and structural reliability [18]. Consequently, understanding and improving interlayer bonding performance is essential for the safe and widespread application of 3DPC.
To address weak interlayer adhesion, current research has explored three primary enhancement strategies. Material modification approaches incorporate polymers, viscosity-modifying agents, or fiber reinforcement to improve cohesion and tensile resistance across layers [19,20,21]. Process optimization aims to control printing intervals, extrusion parameters, and nozzle movement to promote better wetting and contact between successive layers. Geometric enhancement through mechanical interlocking—such as keyed or tongue-and-groove interfaces—has also been proposed to resist shear displacement and enhance mechanical engagement [22,23,24,25,26,27]. While these studies demonstrate potential improvements, each approach presents limitations.
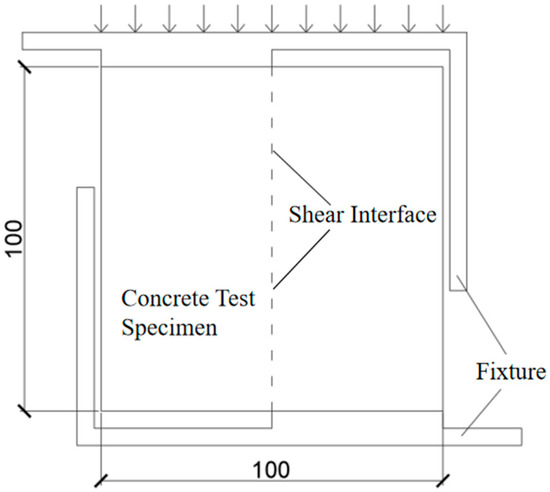
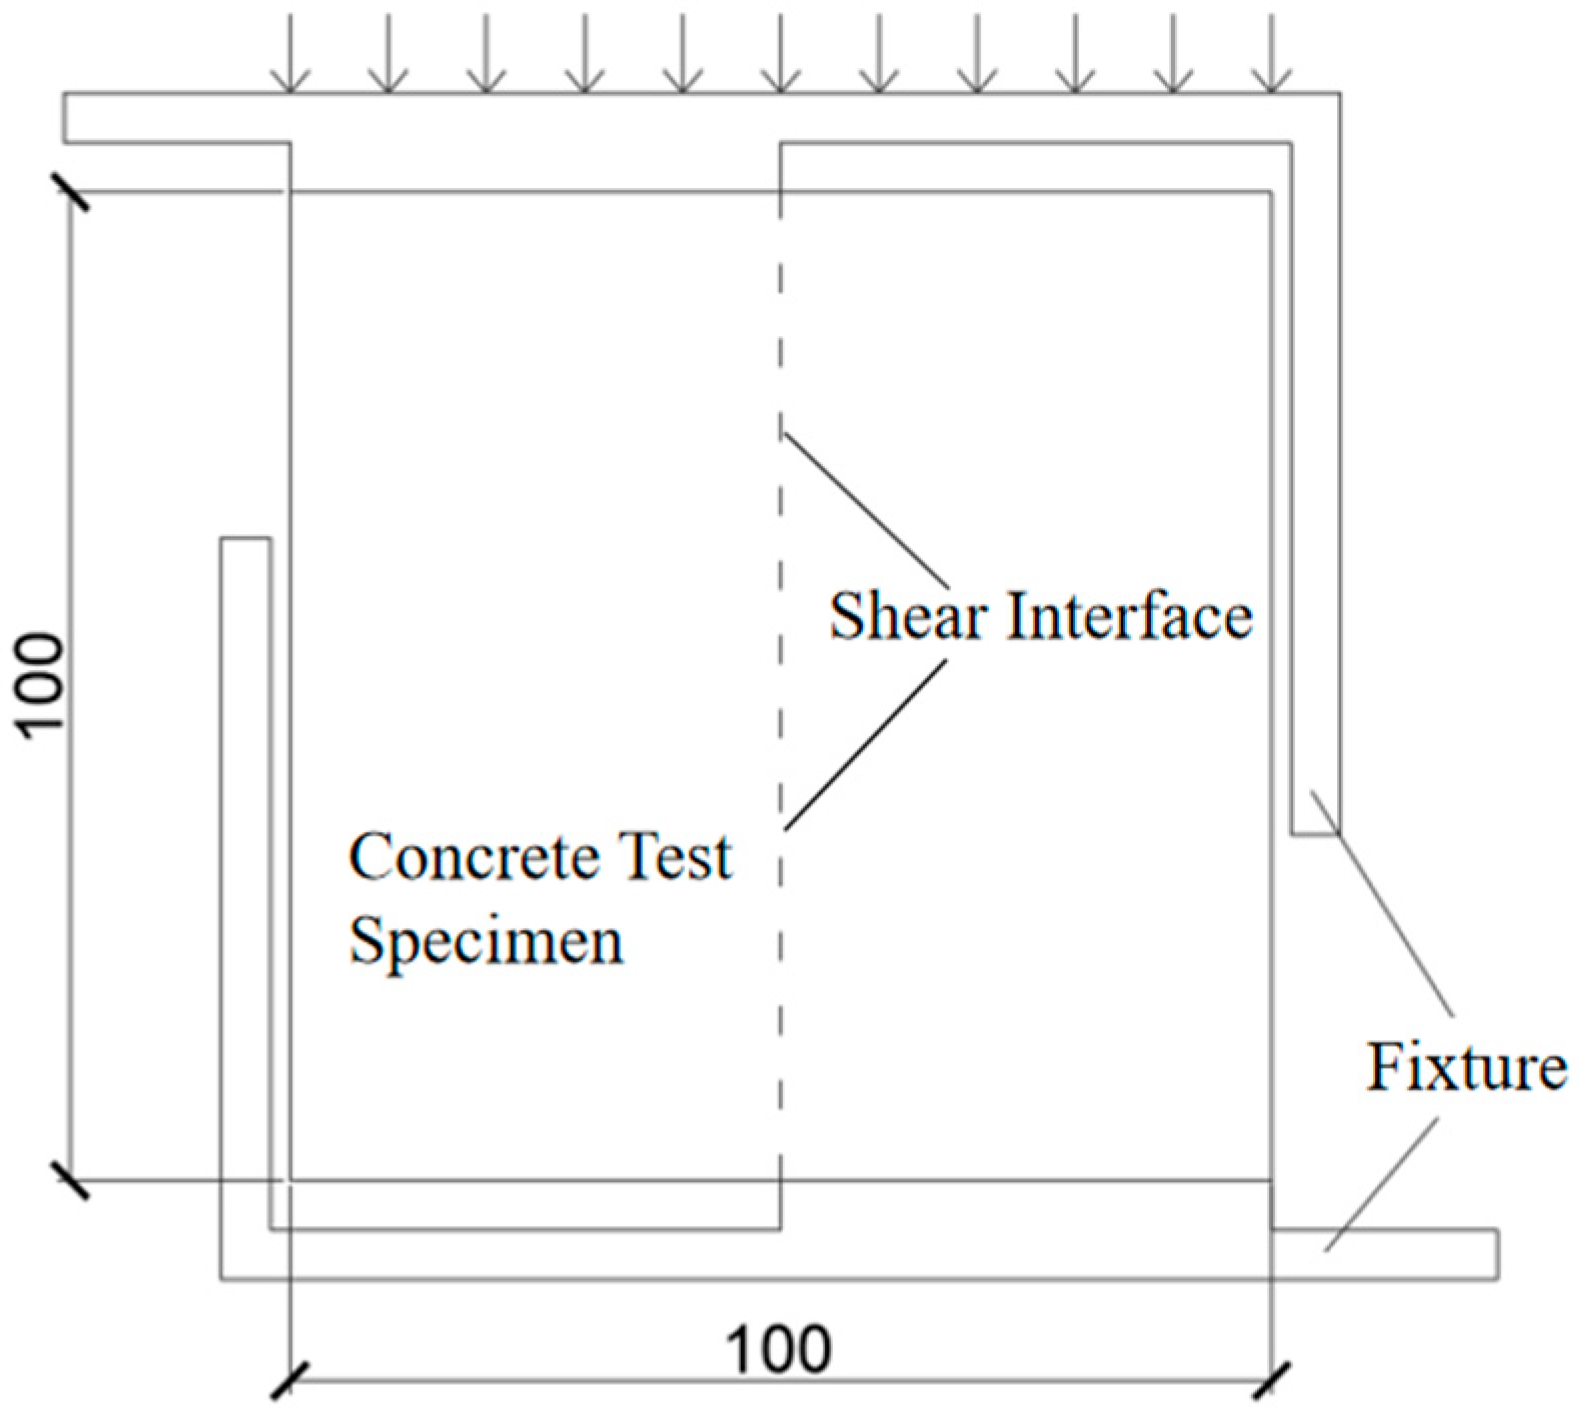
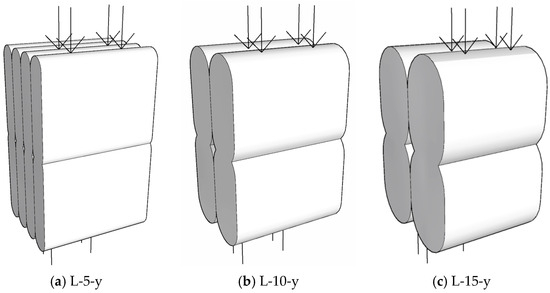
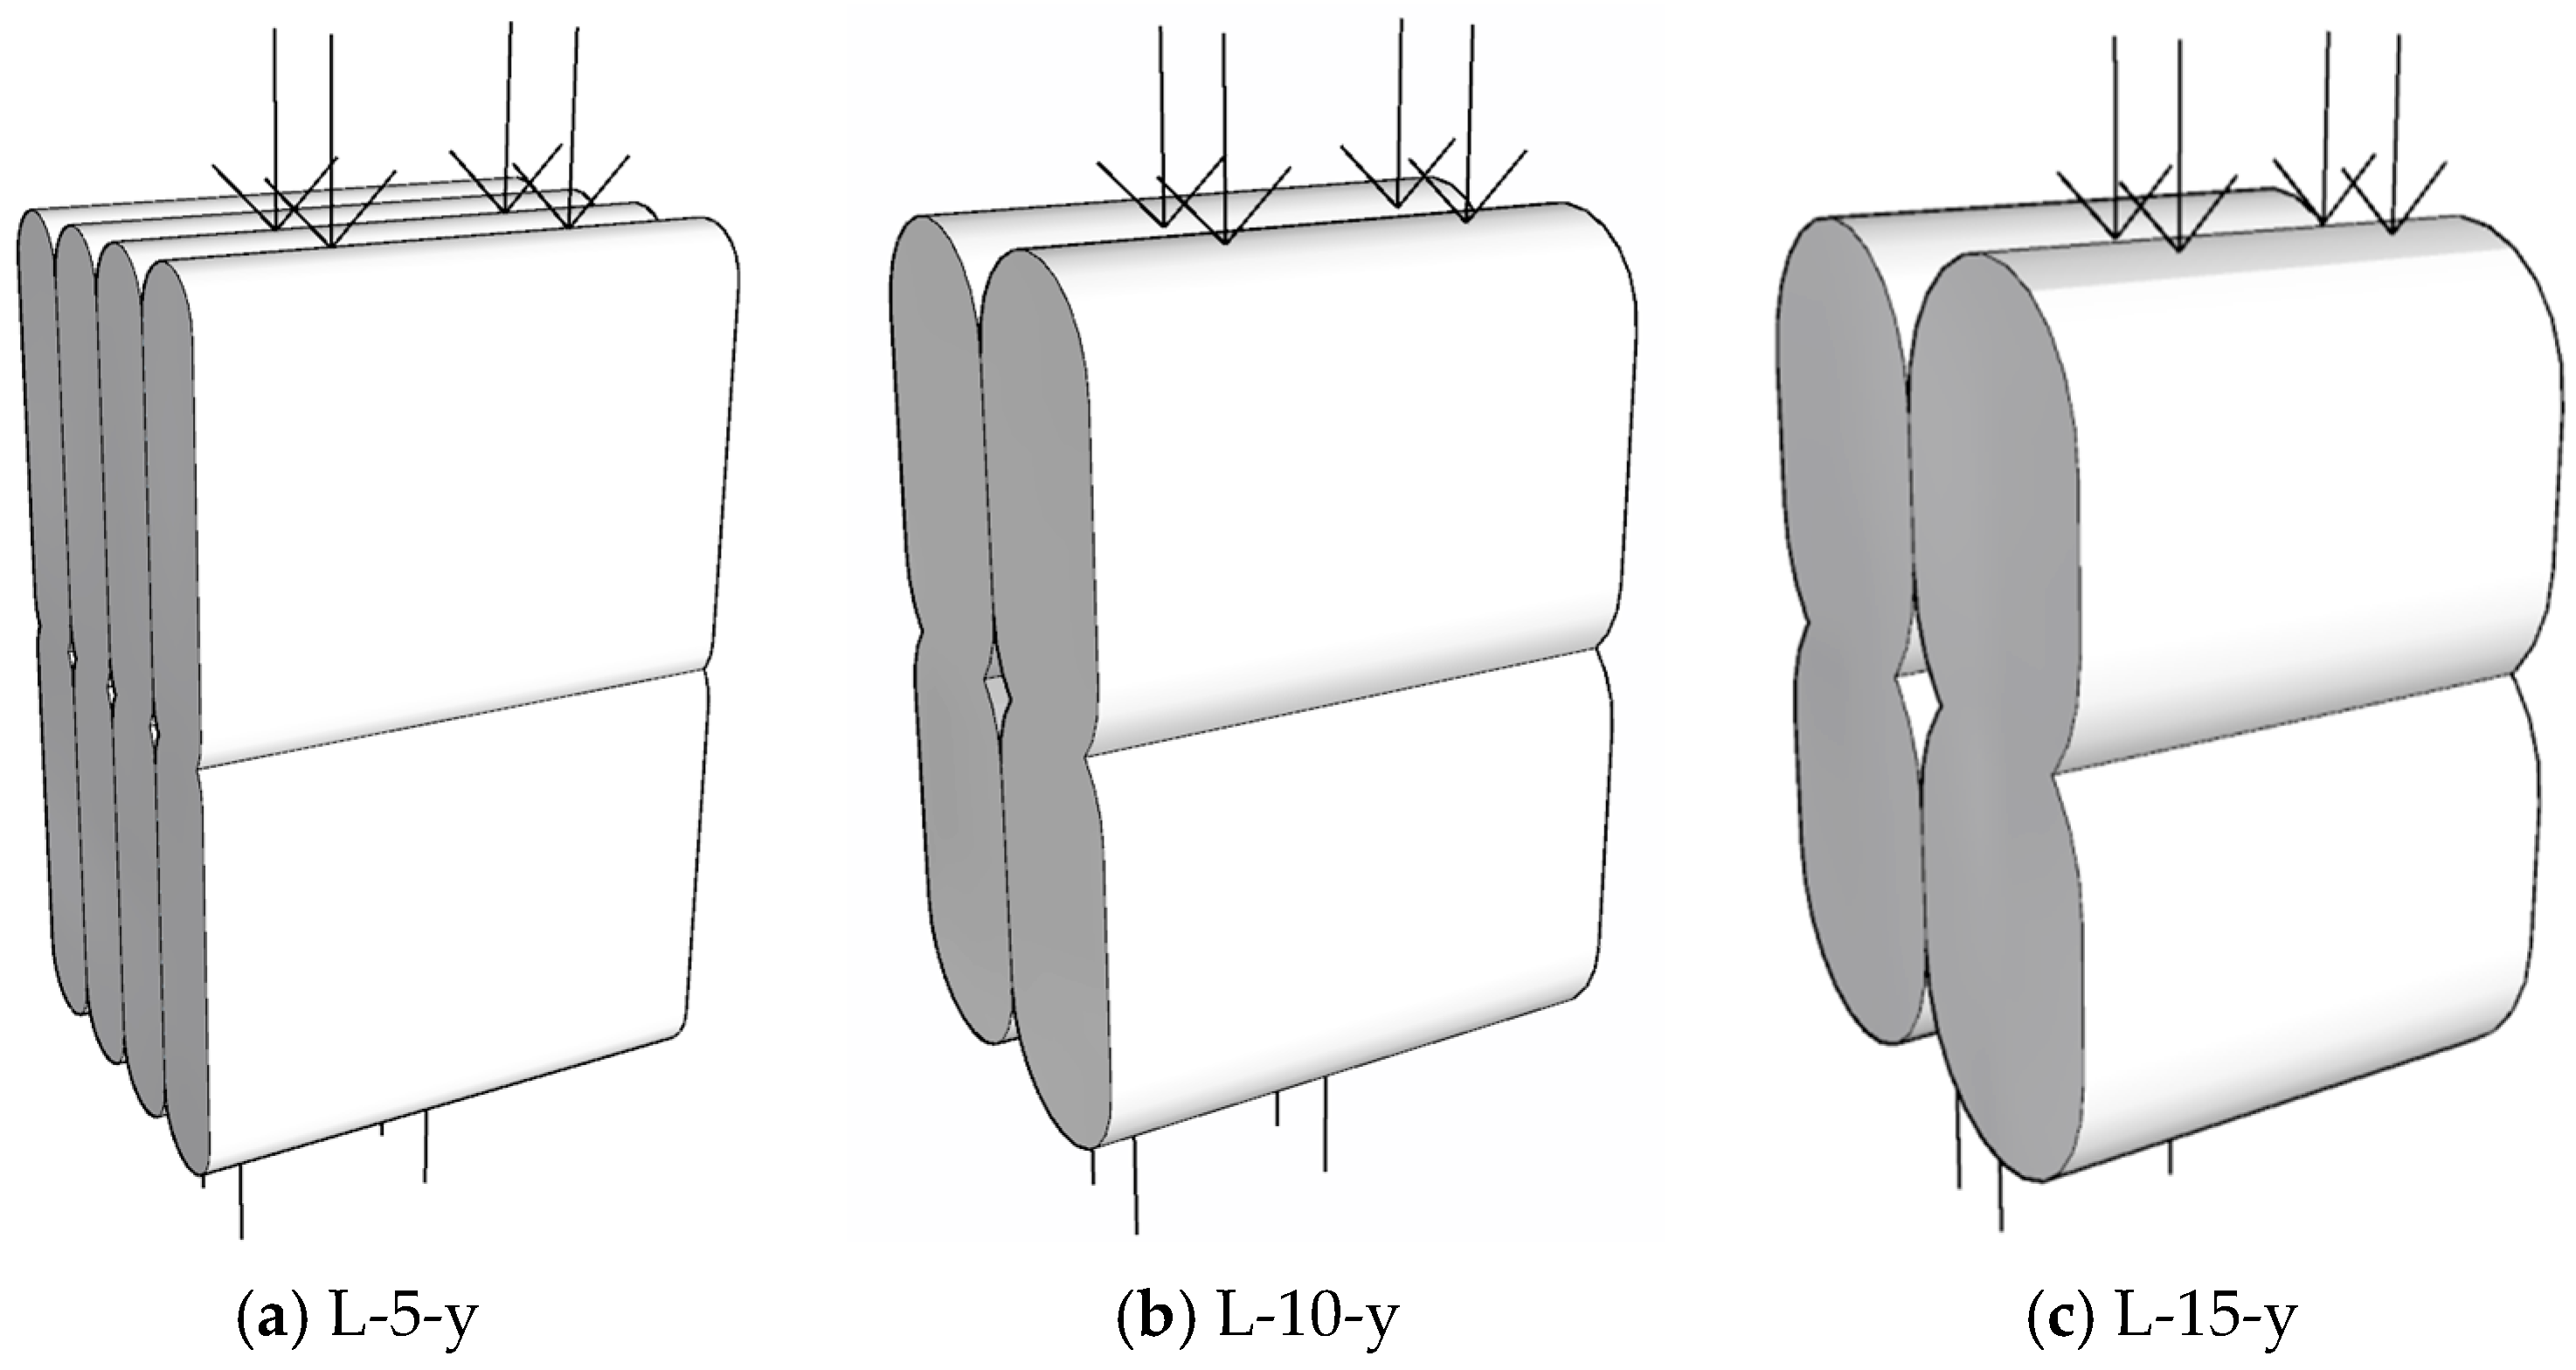
Meanwhile, current studies on interfacial shear strength employ diverse methods, leading to inconsistent and sometimes incomparable results. Rahul [28] evaluated cylindrical specimens cored across printed layers, reporting a 24–29% reduction in interlayer shear strength compared to monolithic specimens. Ma [29] and Liu [30] used cross-keyed specimens to assess tensile and shear strength simultaneously, obtaining interface strengths of approximately 1.9 MPa and 3.5 MPa; however, the geometric influence of keyed profiles on true planar shear strength remains uncertain. Ma [31] utilized a double-shear configuration but provided limited discussion of interface behavior. Other researchers have applied direct shear tests under constant normal stress [32,33], though the imposed confinement alters the measured response and obscures the intrinsic adhesive and cohesive contributions [32]. To avoid these effects, Tian [34] and Rahul [28] used direct shear tests, allowing clearer characterization of fundamental shear behavior. Irregular specimen geometries, such as Z-shaped and cruciform designs, have been explored, but bending or stress concentrations frequently interfere with accurate interpretation [35]. Because the present specimens were produced using linear deposition paths, the findings are most directly applicable to linearly printed elements; the additional effects of curved toolpaths, turning points, and start–stop events are outside the scope of this work and should be addressed in future studies [36,37]. Given these considerations, the direct shear test has become increasingly recognized as the most appropriate method for isolating pure interfacial shear properties in 3DPC. Therefore, as shown in Figure 1, this study adopts a direct shear test setup to characterize the intrinsic shear performance of 3DPC interfaces.
Figure 1.
Schematic of the loading configuration. Note: The arrow indicates the direction of the applied shear load.
The objective of this research is to systematically evaluate the interlayer shear behavior of 3DPC under different nominal layer heights and loading directions. Although previous studies have investigated interlayer bonding and shear performance of 3DPC, limited attention has been paid to how the variation in printed layer height affects the difference between shear behavior parallel to the printing path and that perpendicular to the printing path. In this study, three nominal layer heights—5 mm, 10 mm, and 15 mm—were selected, and direct shear tests were conducted in both the x direction and y direction. Combined with DIC-based crack observation, failure-mode classification, and effective shear-area analysis, this study aims to clarify the loading-direction-dependent shear-transfer mechanism of interlayer interfaces and to explain how layer-height-related changes in filament contact state affect interlayer shear resistance. The findings are expected to provide experimental evidence and a mechanism-oriented understanding for evaluating the anisotropic shear performance of 3DPC interlayer interfaces, provide a theoretical basis for the structural design of 3DPC components, and support the broader engineering application of this emerging construction technology.
2. Experimental Program
2.1. Materials and Specimen Design
The experimental 3DPC was prepared using P.O. 42.5 cement and tap water. Natural river sand with a fineness modulus of 2.41 was used as the fine aggregate. The mix also contained silica fume (SF), nano clay (NC), hydroxypropyl methylcellulose (HPMC), a defoaming agent (Def), sodium gluconate (SG), and a superplasticizer (SP). Among them, nano clay, hydroxypropyl methylcellulose, and sodium gluconate are thickeners. According to the previous experimental experience of our research group, the specific mixing ratio is shown in Table 1. Therefore, the conclusions of this study should be interpreted within the specific material system and printing parameters adopted here, and further verification is needed before extending them to other printable cementitious materials.
Table 1.
Mix proportions of 3DPC (unit: kg/m3).
2.2. Specimen Fabrication and 3D Printing Process
The 3DPC specimens were printed using a concrete 3D printer equipped with a screw-type extruder and a circular nozzle with a diameter of 10 mm. The nozzle travel speed was set to 10 mm/s, and the deposition sequence was unidirectional. During printing, the extrusion process remained continuous and stable, and no obvious fluctuation in filament deposition was observed. Due to the fluidity of 3DPC mortar, the actual width of the printed strips would extend to 20 mm under the influence of gravity. To systematically investigate interlayer shear performance, three layer heights—5 mm, 10 mm, and 15 mm—were selected. For the 5 mm, 10 mm, and 15 mm layer-height series, the screw extrusion speeds were set to 1 rad/s, 2.5 rad/s, and 5 rad/s, respectively, and the nozzle standoff distances from the substrate were set to 5 mm, 10 mm, and 15 mm, respectively. These parameter settings were used to obtain continuous and stable filament deposition under different target layer thicknesses.
The time interval between successive layer depositions was kept constant at 5 min for all printing sequences, measured from the start of the previous layer deposition to the start of the next layer deposition. All specimens were printed using the same nominal interlayer interval to reduce process variation. However, because the 5 mm, 10 mm, and 15 mm series required 20, 10, and 7 printed layers, respectively, the number of deposition passes and the cumulative open-time history of early layers were not identical among the different layer-height series.
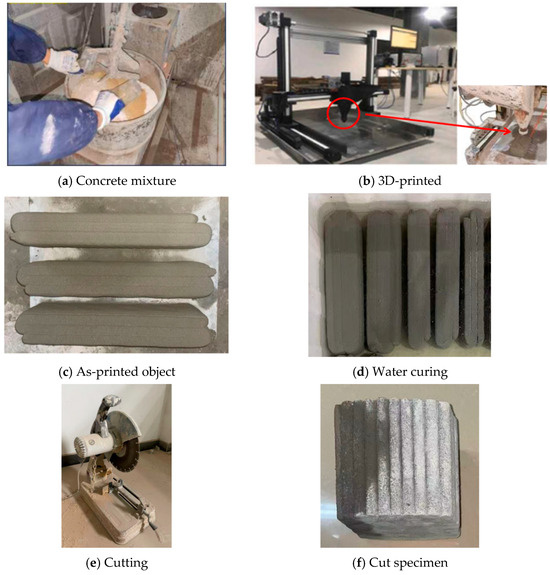
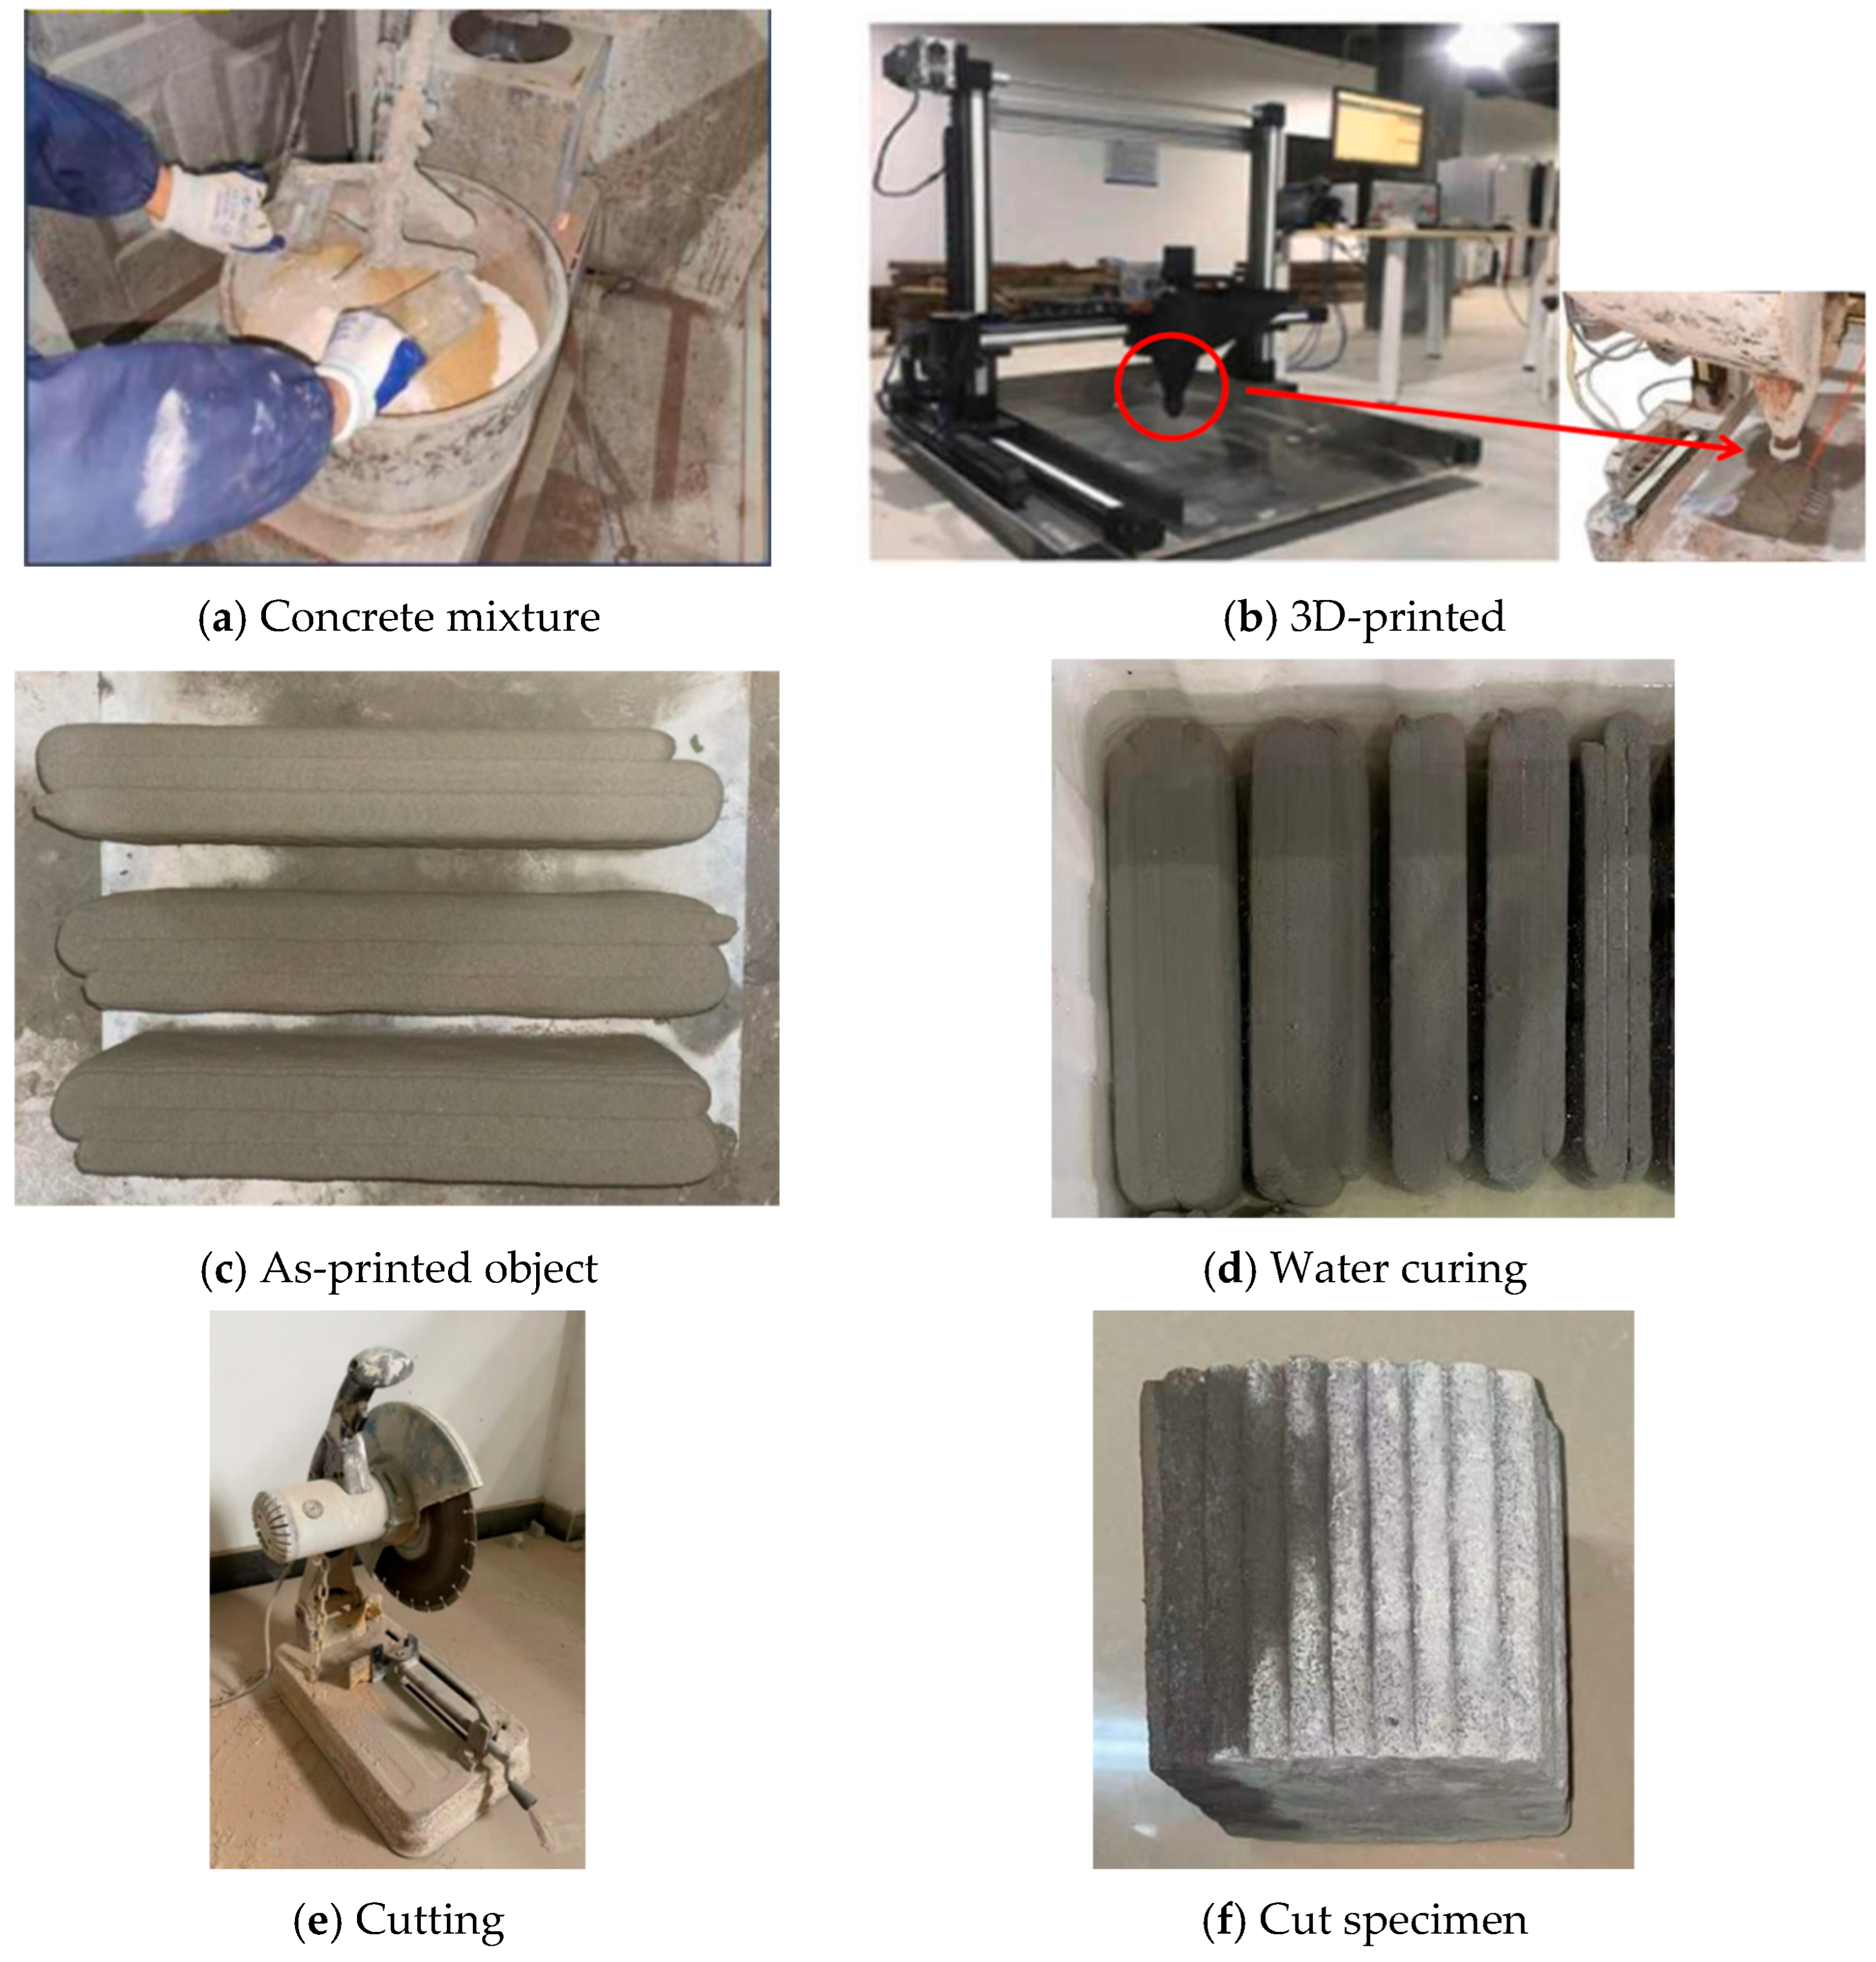
During printing, the environmental conditions were kept stable to avoid moisture loss or plastic shrinkage. After printing elements with a width of 100 mm and a height of 100 mm, all printed elements were covered with plastic sheets for 24 h to minimize early-age evaporation. They were then demolded and transferred to a curing room maintained at 20 ± 2 °C and >95% relative humidity for 28 days to ensure consistent hydration. After curing, the printed elements were cut into specimens with dimensions of 100 mm × 100 mm × 100 mm. To allow for comparative analysis, three specimens were prepared for each combination of layer thickness and loading direction. Additionally, three vibrated control cubes with dimensions of 100 mm × 100 mm × 100 mm were cast and compacted to determine the intrinsic mechanical properties of the bulk mortar without printing-induced interfaces. After curing, the printed mortar exhibited a compressive strength of 65.5 MPa. The specimen preparation process is shown in Figure 2.
Figure 2.
Specimen preparation process.
2.3. Specimen Design and Interface Configuration
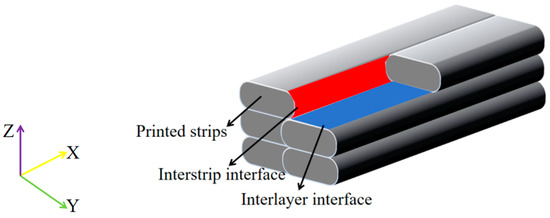
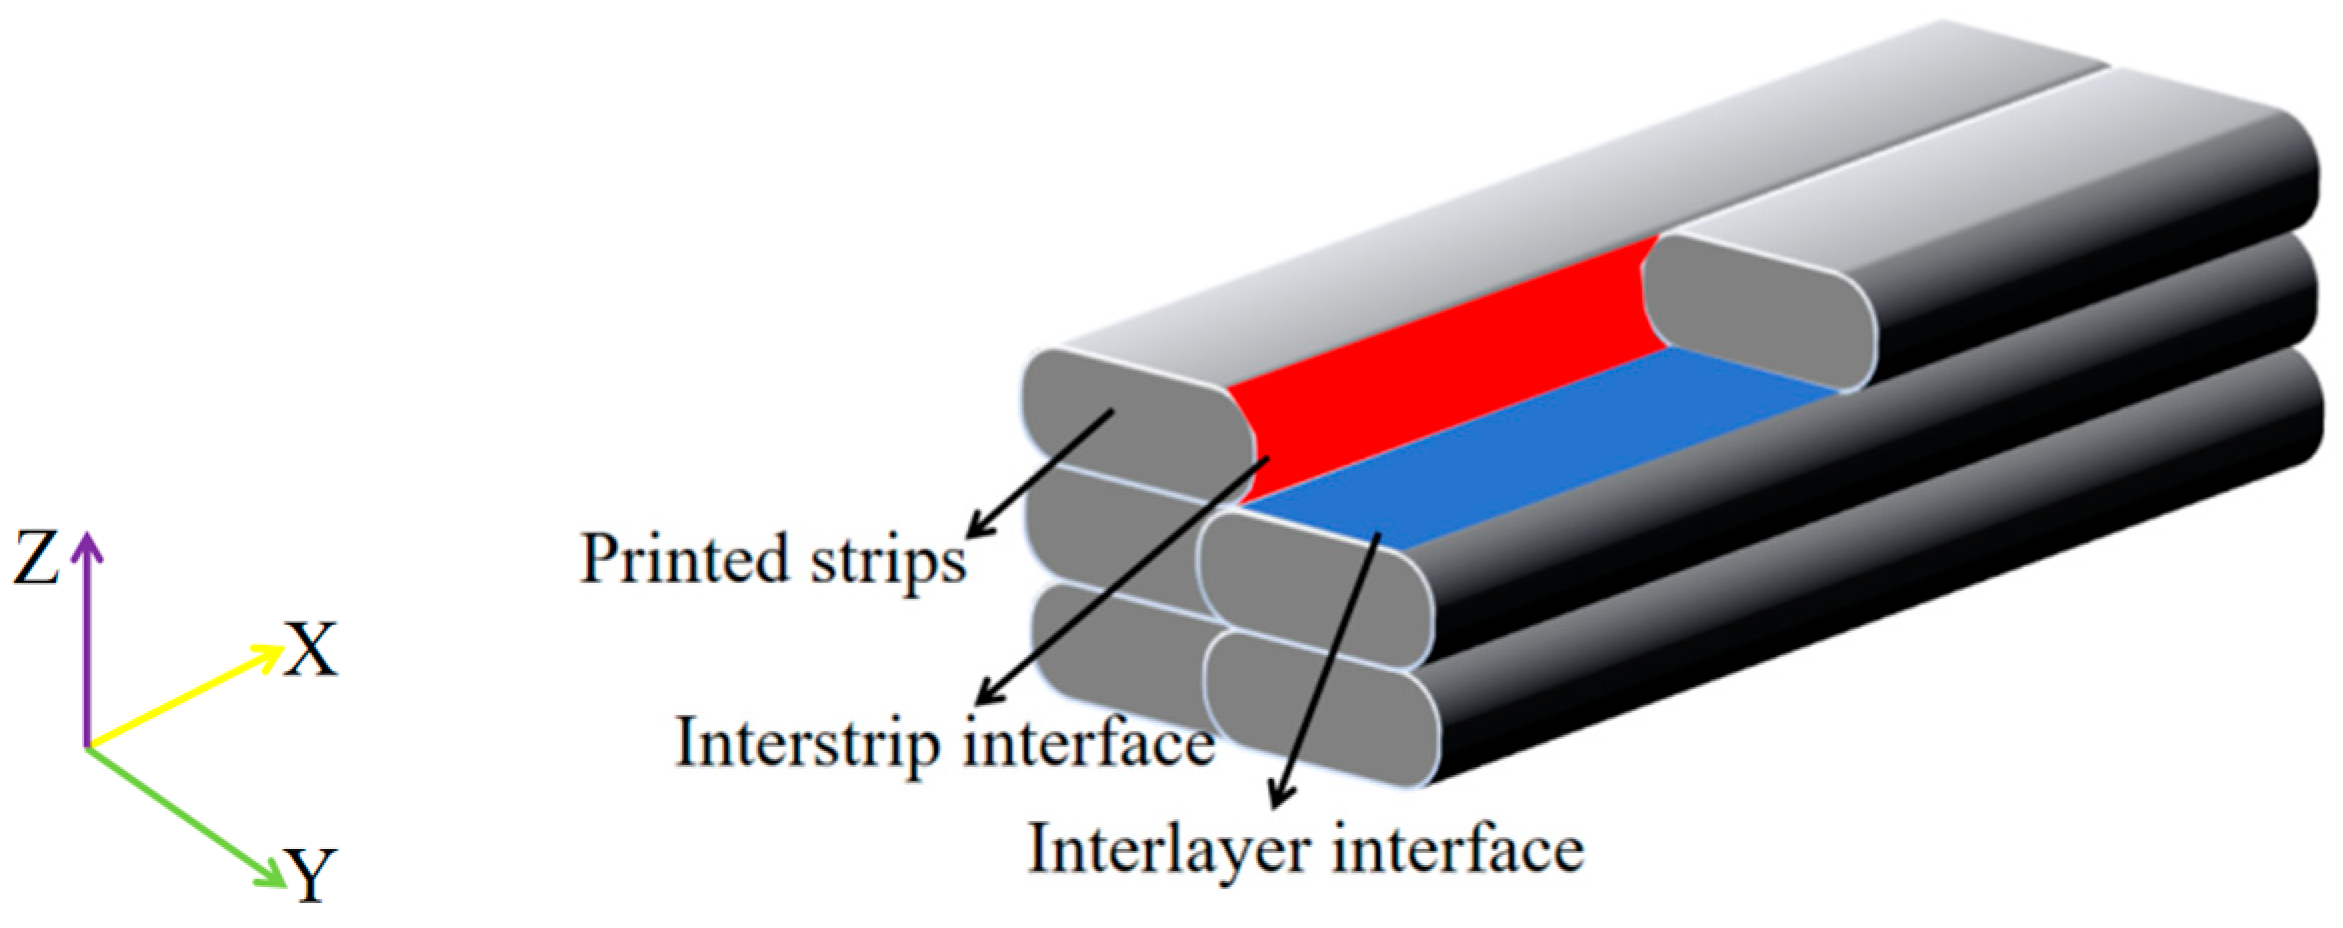
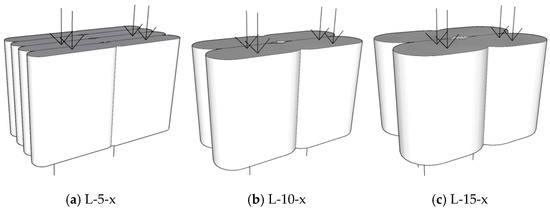
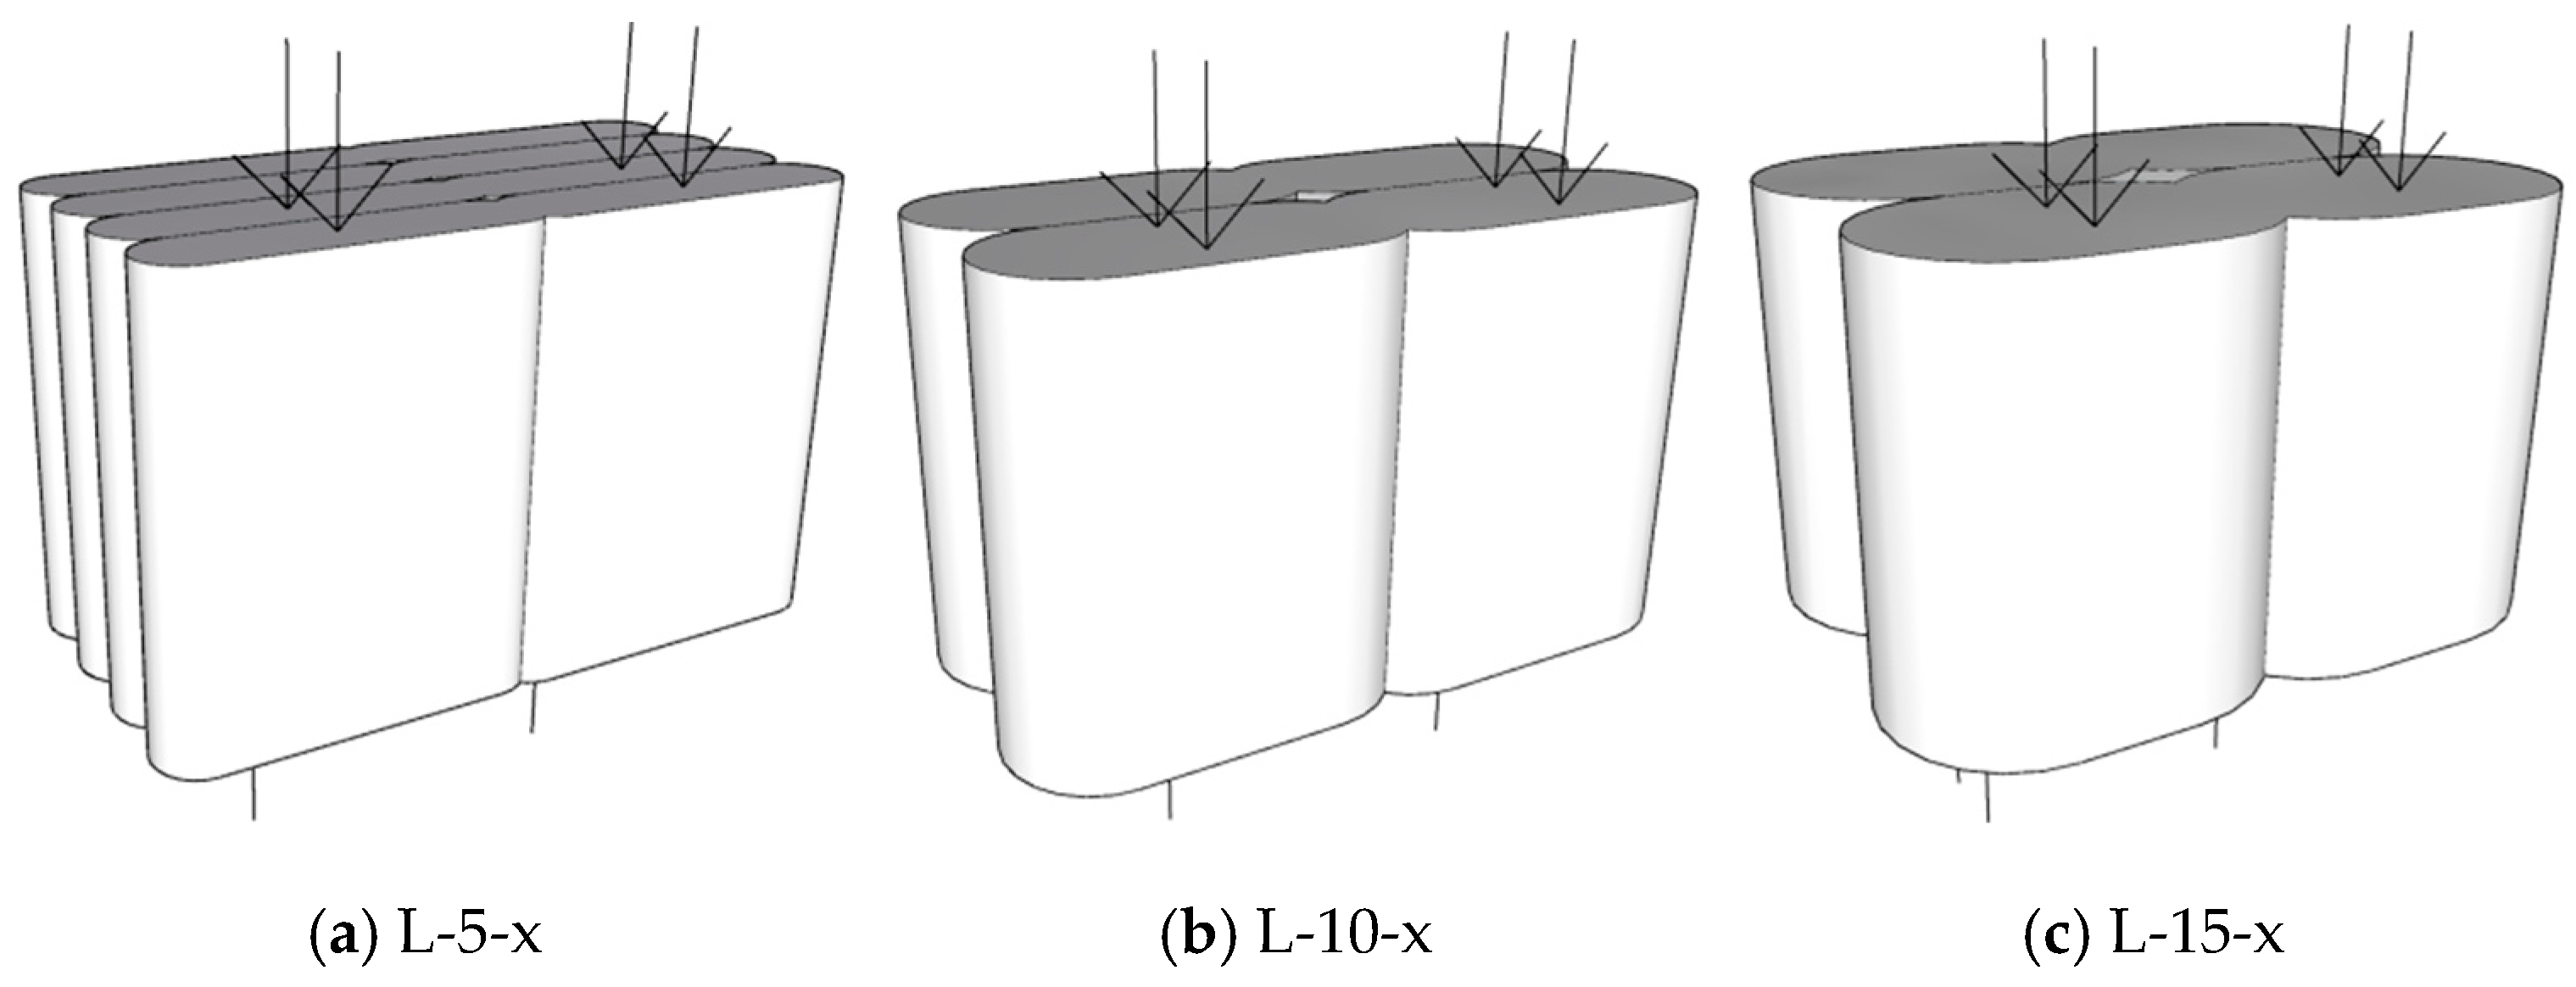
The printed specimens were designed as 100 mm cubes to ensure consistent geometry for shear testing and digital image analysis. A Cartesian coordinate system was established to define orientation: the x direction corresponded to the printing path, the y direction lay within the plane but perpendicular to x, and the z direction represented the build direction. One inherently formed interface was the focus of this investigation: the interlayer interface, represented by the red horizontal planes separating successive layers, as shown in Figure 3. This study primarily focused on interlayer shear strength. For each layer thickness, specimens were loaded in two orientations: load applied parallel to the printing path, as shown in Figure 4, and load applied perpendicular to the printing path, as shown in Figure 5. The specimens were named following the convention: L-Printing Thickness-Shear Direction-Specimen ID.
Figure 3.
3DPC specimen.
Figure 4.
Shear along the x printing direction. Note: the arrows indicate the direction of shear loading along the printing path (x direction).
Figure 5.
Shear along the y printing direction. Note: the arrows indicate the direction of shear loading perpendicular to the printing path (y direction).
It is particularly important to note that the nominal layer thickness was used as the grouping variable in this experimental design. In all series, the nominal shear area remained constant at 100 × 100 mm2, but the number of interlayer interfaces within each specimen changed with the variation in layer thickness: a 100 mm high sample printed with a 5 mm layer thickness contained 20 layers and 19 interfaces, while one printed with a 15 mm layer thickness contained approximately 7 layers and 6 interfaces. The shear test loads all of these interfaces simultaneously in the critical plane. The observed strength differences between series therefore reflect the combined effect of intrinsic interface quality and the number of interfaces in the shear plane, which cannot be fully separated in the present design. This limitation is acknowledged and should be considered when interpreting the results.
2.4. Test Procedure
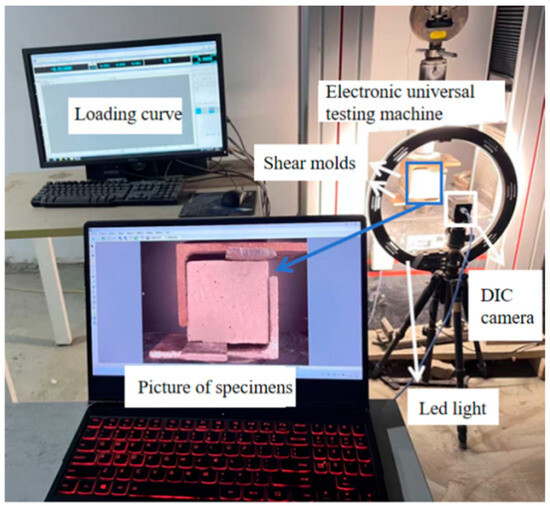
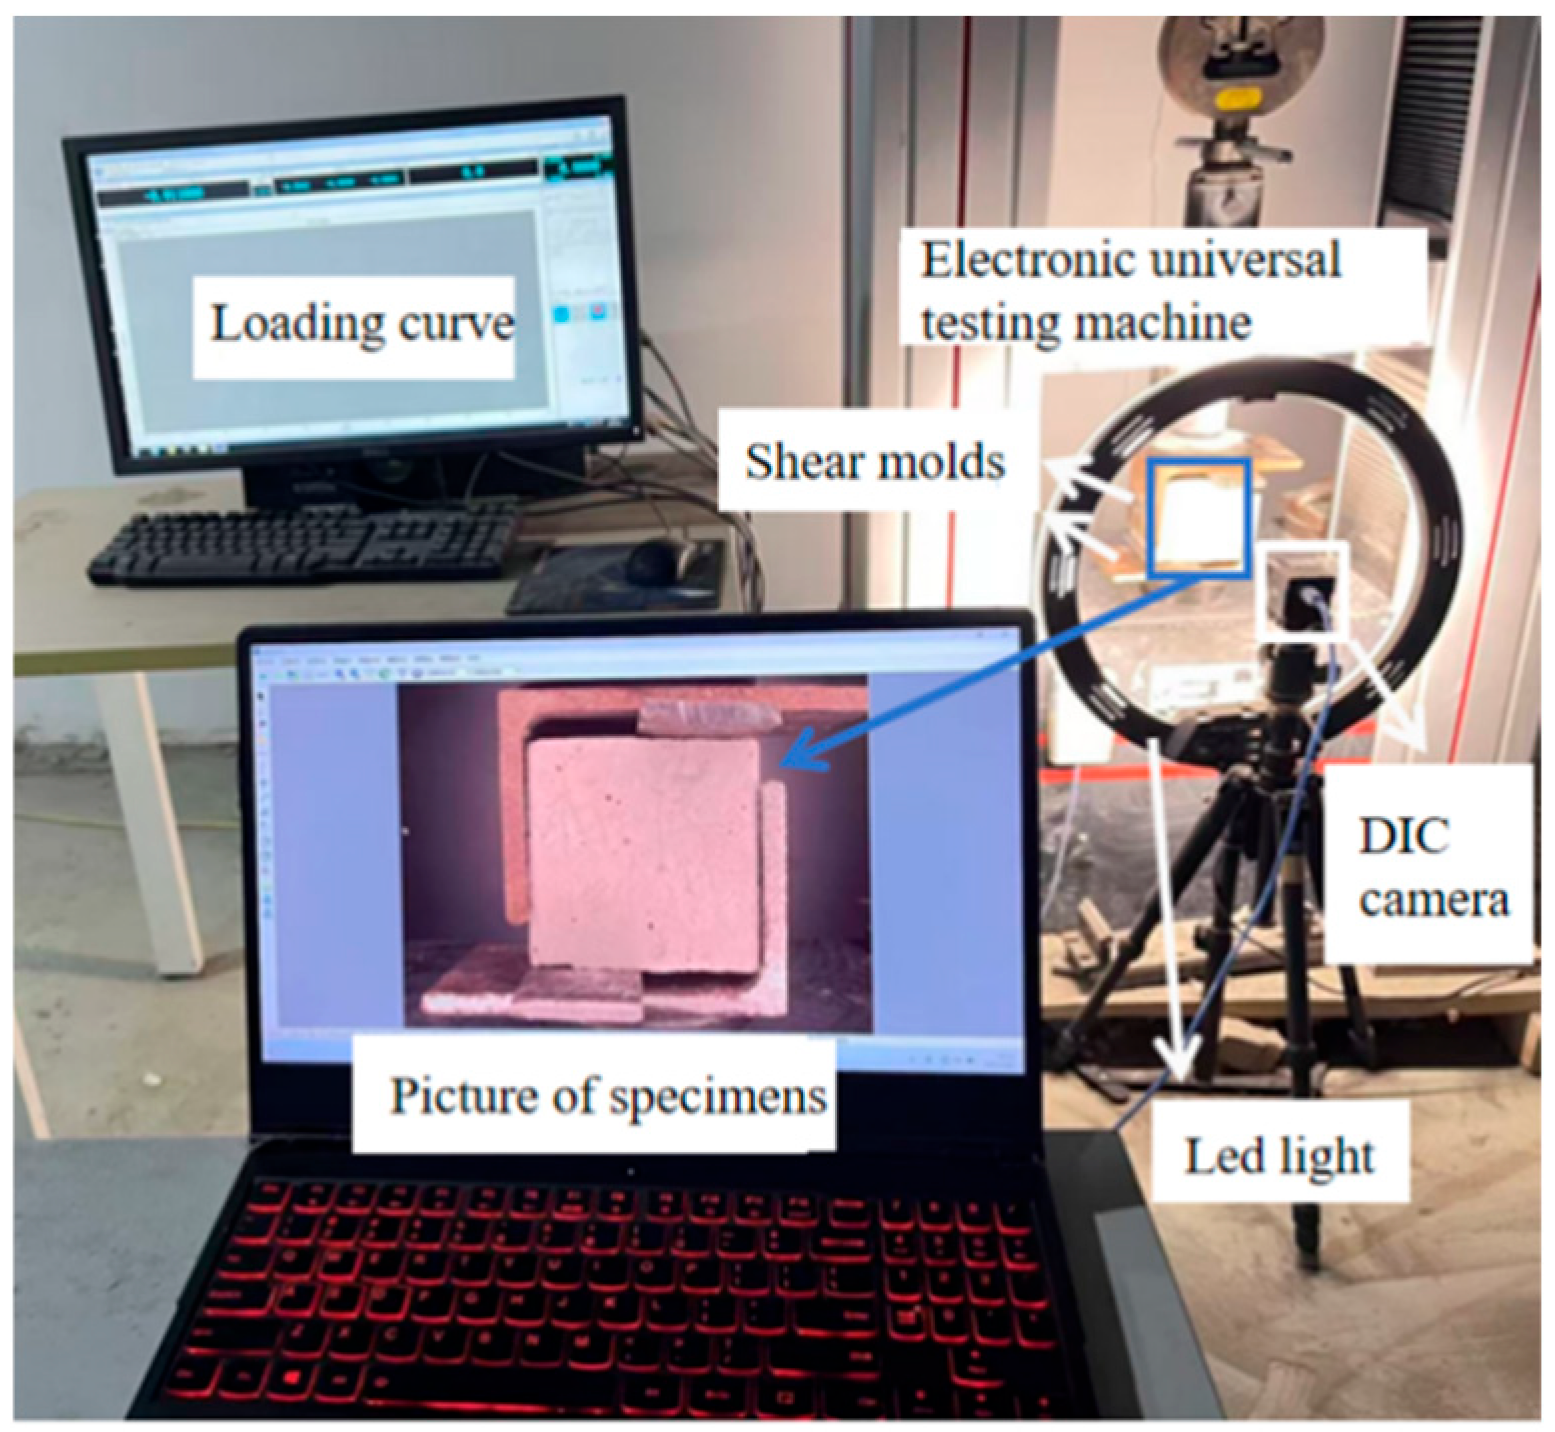
Direct shear testing was performed using a servo-controlled universal testing machine with a capacity of 100 KN, shown in Figure 6. A custom-designed steel shear fixture was used to ensure that loading was applied purely along the intended shear plane. A displacement-controlled loading rate of 0.30 mm/min was selected to promote stable crack propagation. Prior to testing, specimens were coated with a thin white paint layer and a fine black speckle pattern. A 1000 × 1000 pixel monochrome industrial camera equipped with a 50 mm lens recorded images at 1 frame per second, achieving an approximate spatial resolution of 0.12 mm/pixel.
Figure 6.
Test setup.
3. Results and Analysis
3.1. Test Results and Failure Character
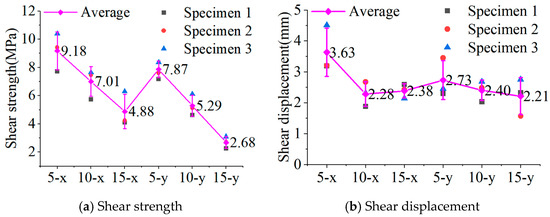
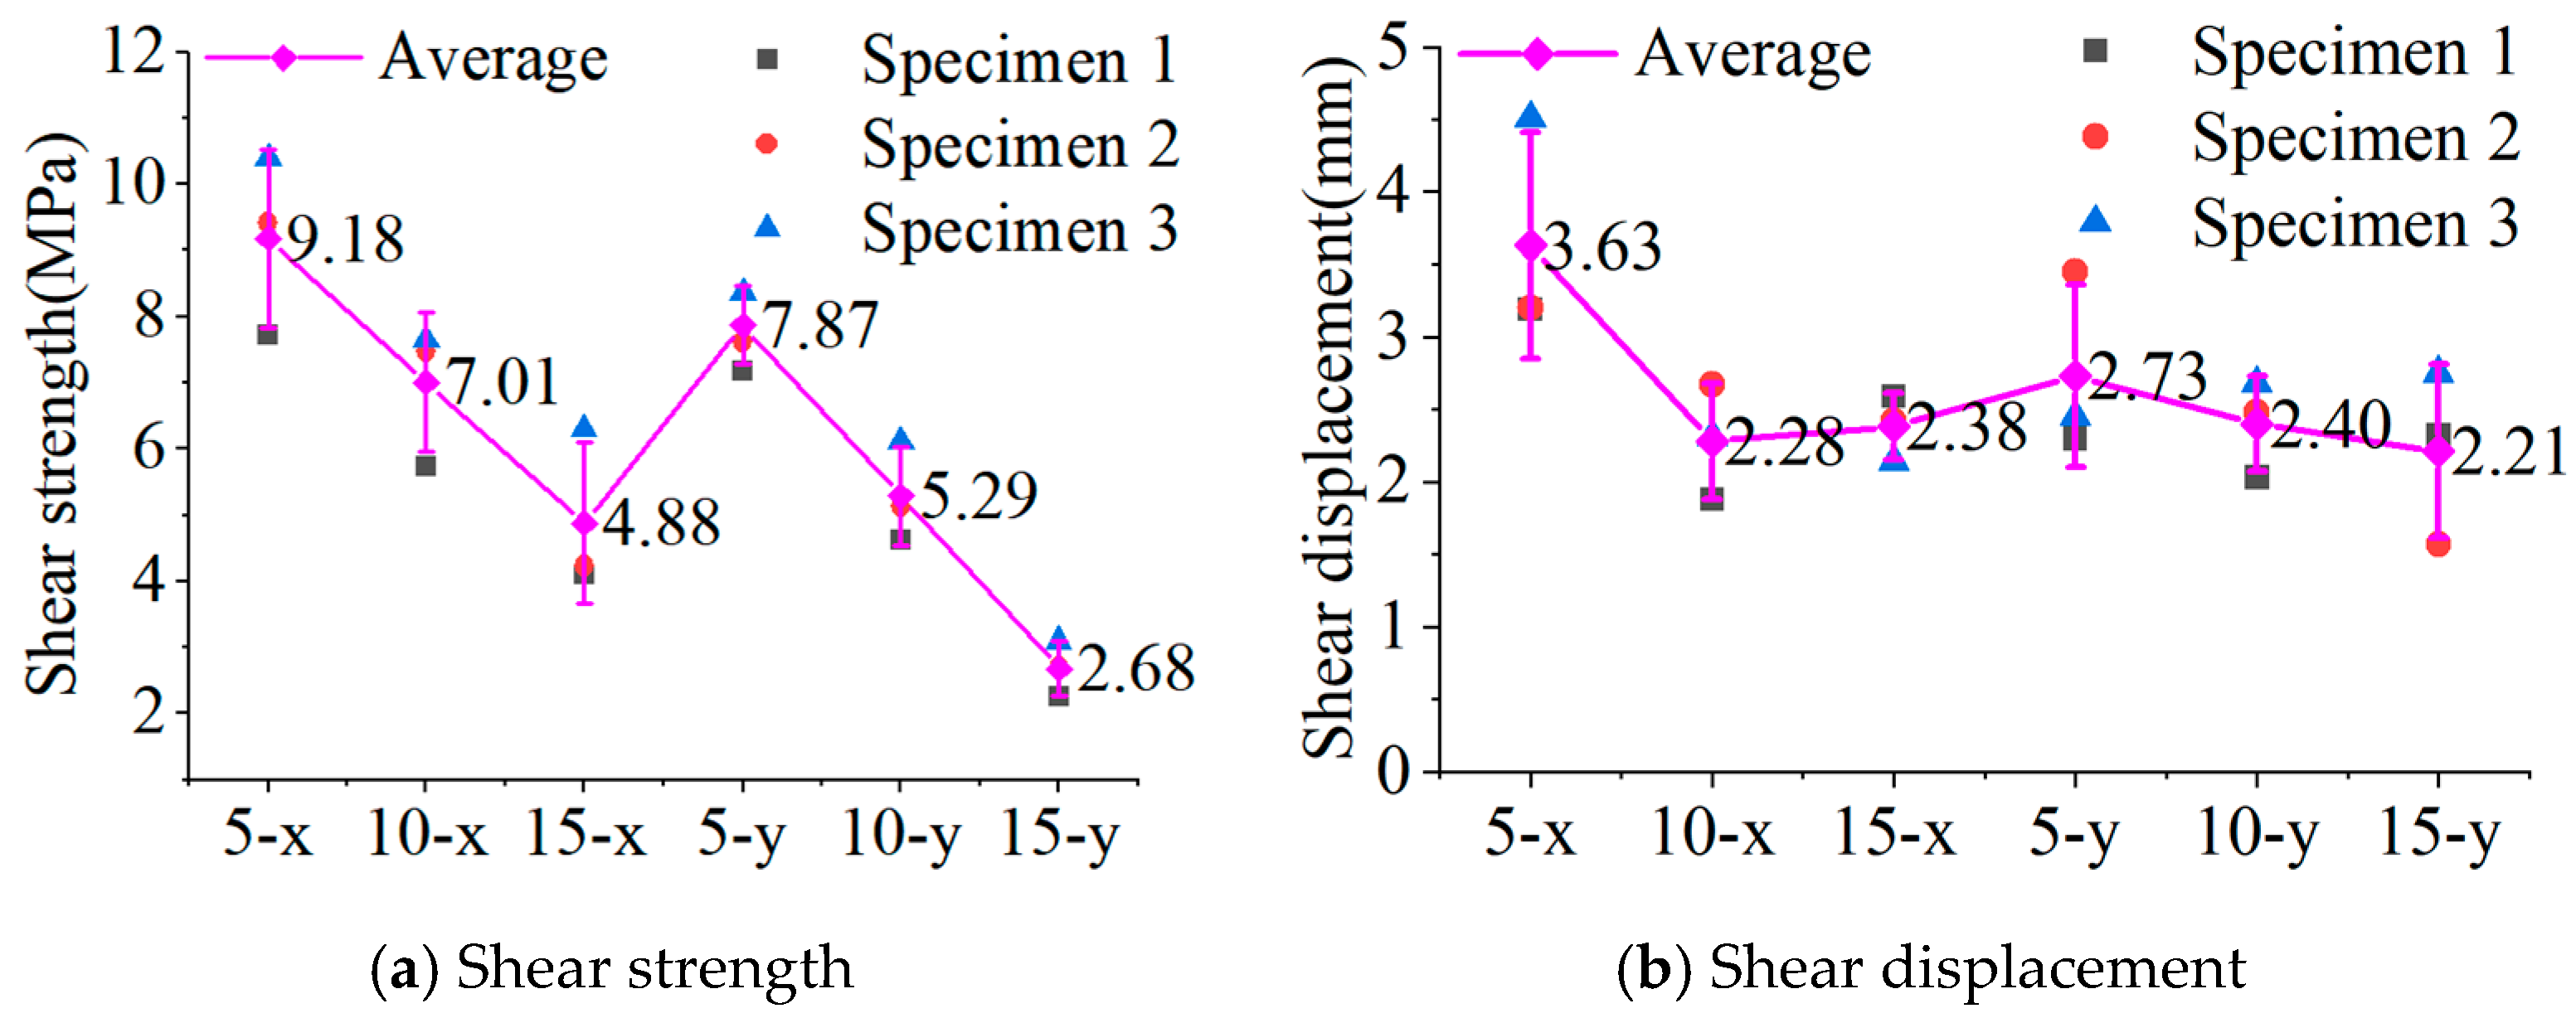
From Figure 7a, it can be observed that, for interlayer interfaces, the mean shear strengths of the specimens followed the order: L-15-x < L-10-x < L-5-x and L-15-y < L-10-y < L-5-y. At thicknesses of 5 mm and 10 mm, the L-x specimens exhibited mean shear strengths higher than the corresponding L-y specimens by 17% and 32%, respectively. At a thickness of 15 mm, the mean shear strength of L-x specimens exceeded that of L-y specimens by 82%.
Figure 7.
Shear strength and shear displacement for all specimens.
Figure 7b presents the displacements of each group and the mean displacement for each series of specimens. The average displacements followed the trend: 15-y < 10-x < 15-x < 10-y < 5-y < 5-x. Under these conditions, the mean slip of the 5-x specimens was 33% higher than that of the 5-y specimens, the 10-y specimens exhibited a 5% higher mean slip than the 10-x specimens, and the 15-x specimens showed a 7% increase relative to the 15-y specimens.
The mechanical properties and test results of all the specimens are summarized in Table 2. Here, Pu is the ultimate shear capacity of the specimen measured in the test, Δu is the shear slip corresponding to the peak load, and the nominal shear stress τu is calculated by the following Equation (1):
Table 2.
Mechanical properties and test results of all the specimens.
Pu is the ultimate shear load, and AL is the shear area. The shear area AL of the specimen is 100 × 100 = 10,000 mm2.
Given the limited sample size of three specimens per group, all reported percentage differences between groups should be interpreted as indicative trends rather than statistically confirmed findings. Formal statistical significance testing was not performed due to the small sample size.
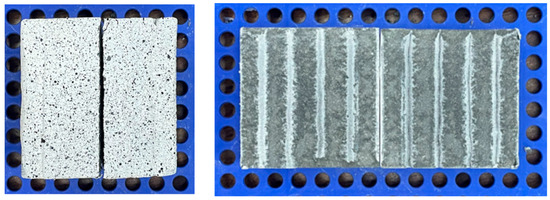
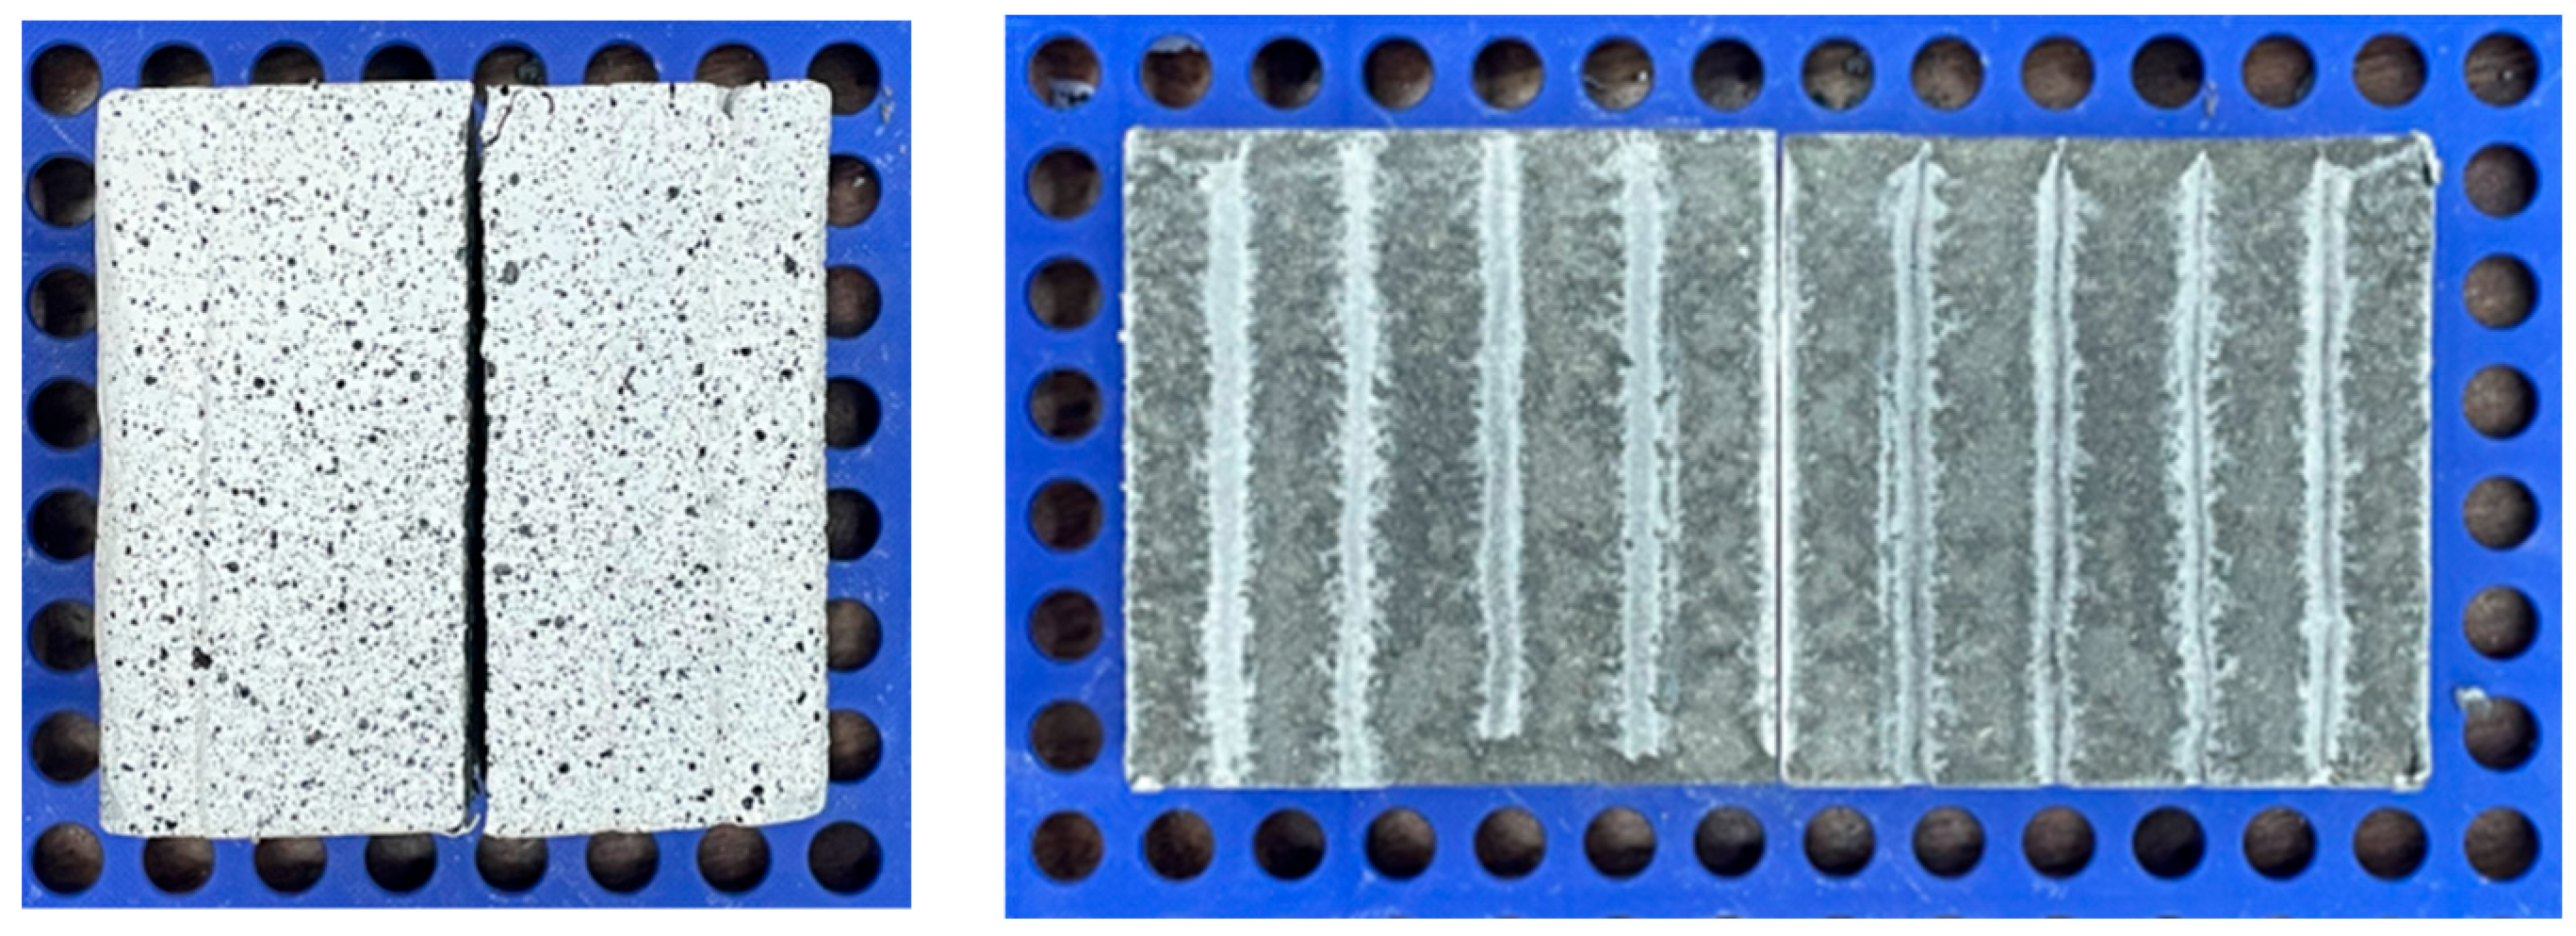
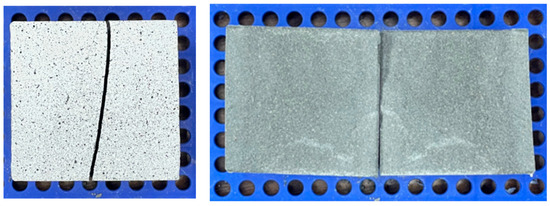
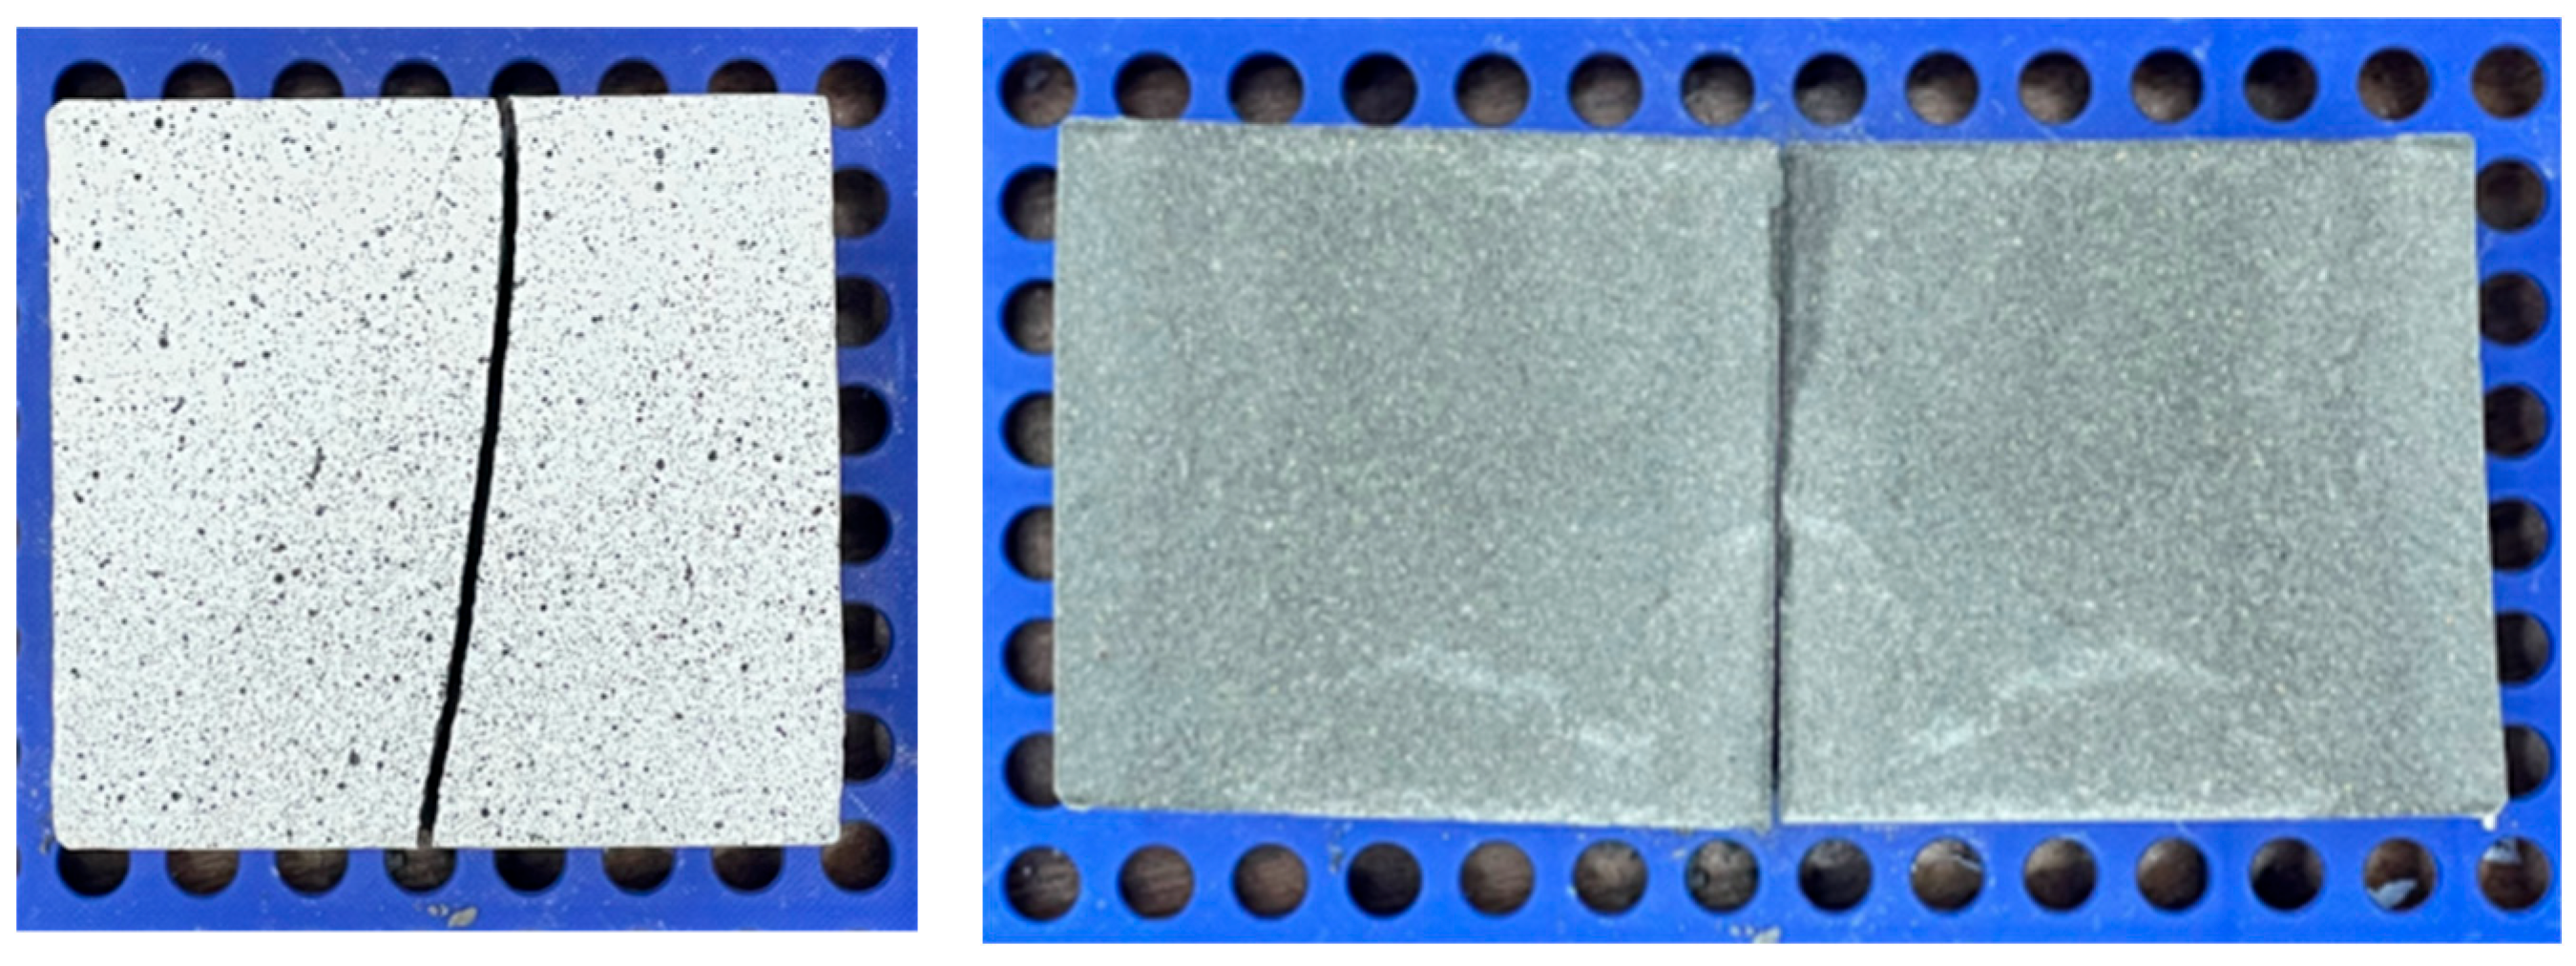
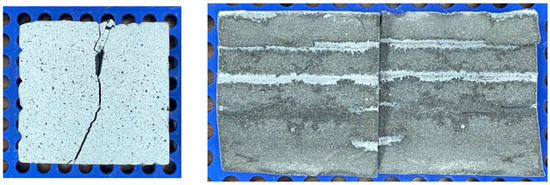
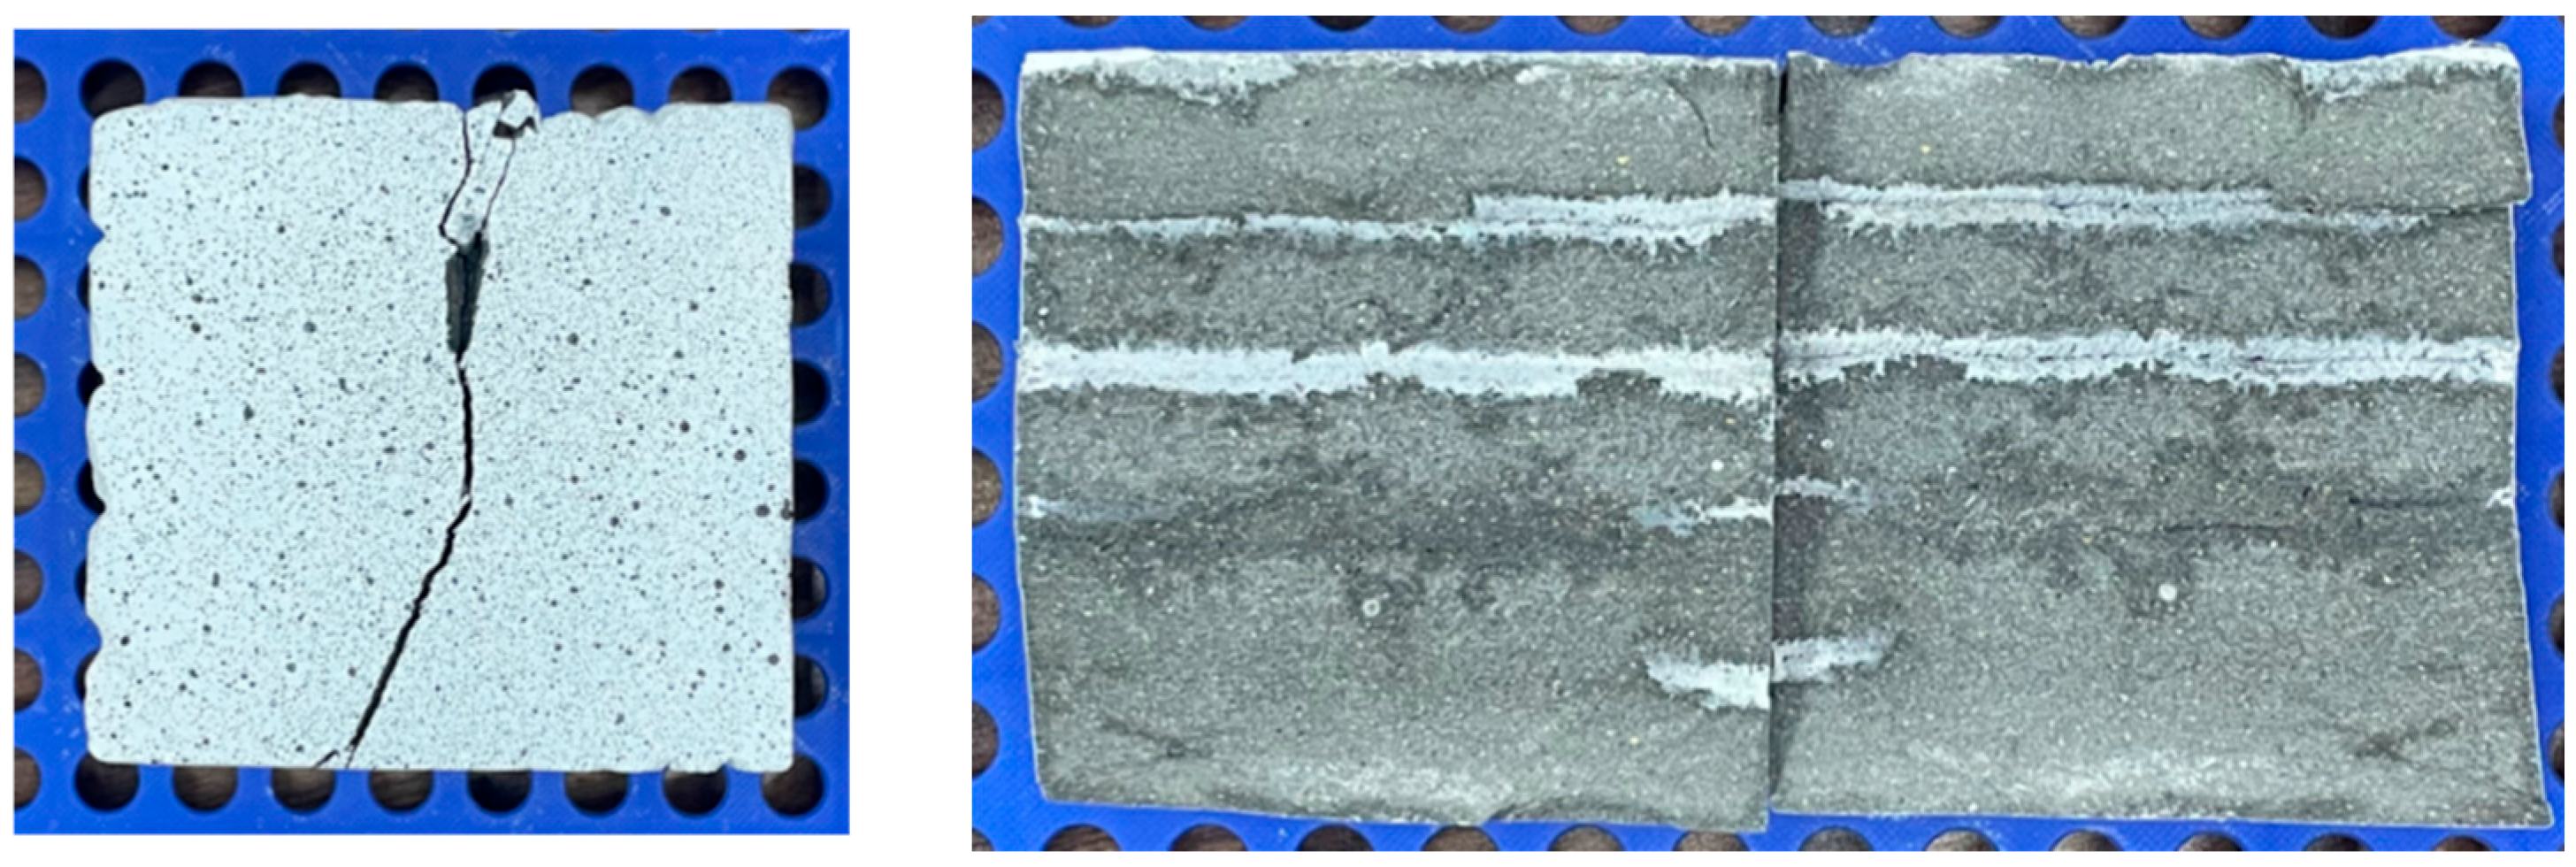
Different failure modes of 3DPC specimens generally correspond to distinct force-transfer mechanisms, shown in Figure 8, Figure 9 and Figure 10. In this study, the failure mode of each specimen was determined based on the post-failure morphology and the plane-developed fracture images. The main criteria included whether the crack propagated along the preset interlayer interface, whether the crack passed through the printed mortar matrix, and whether interfacial debonding and local matrix shear damage occurred simultaneously.
Figure 8.
Interfacial bonding failure.
Figure 9.
Shear failure.
Figure 10.
Combined interfacial bonding and shear failure.
Interfacial bonding failure (Mode I): During loading, cracks develop along the interfacial bonding plane, ultimately leading to specimen failure due to the loss of interfacial adhesion. The plane-developed fracture image usually shows a relatively continuous interfacial separation surface, and the original interlayer traces or printed filament texture can still be observed.
Shear failure (Mode II): During loading, portions of the mortar within the specimen undergo shear failure, ultimately leading to specimen fracture. No continuous and clear interfacial debonding surface is formed in the plane-developed fracture image.
Combined interfacial bonding and shear failure (Mode III): Cracks initiate along the interfacial bonding plane but propagate into the spatial domain during loading. The specimen ultimately fails due to the combined effects of interfacial bonding failure and shear failure. In the plane-developed fracture image, both interfacial separation traces and matrix shear-damage features can be observed.
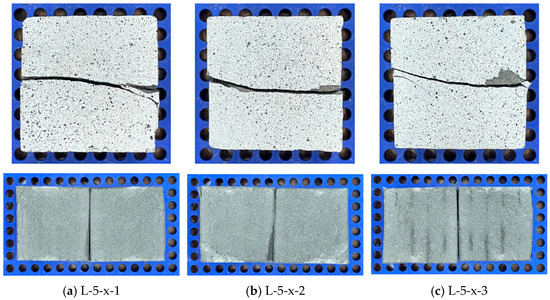
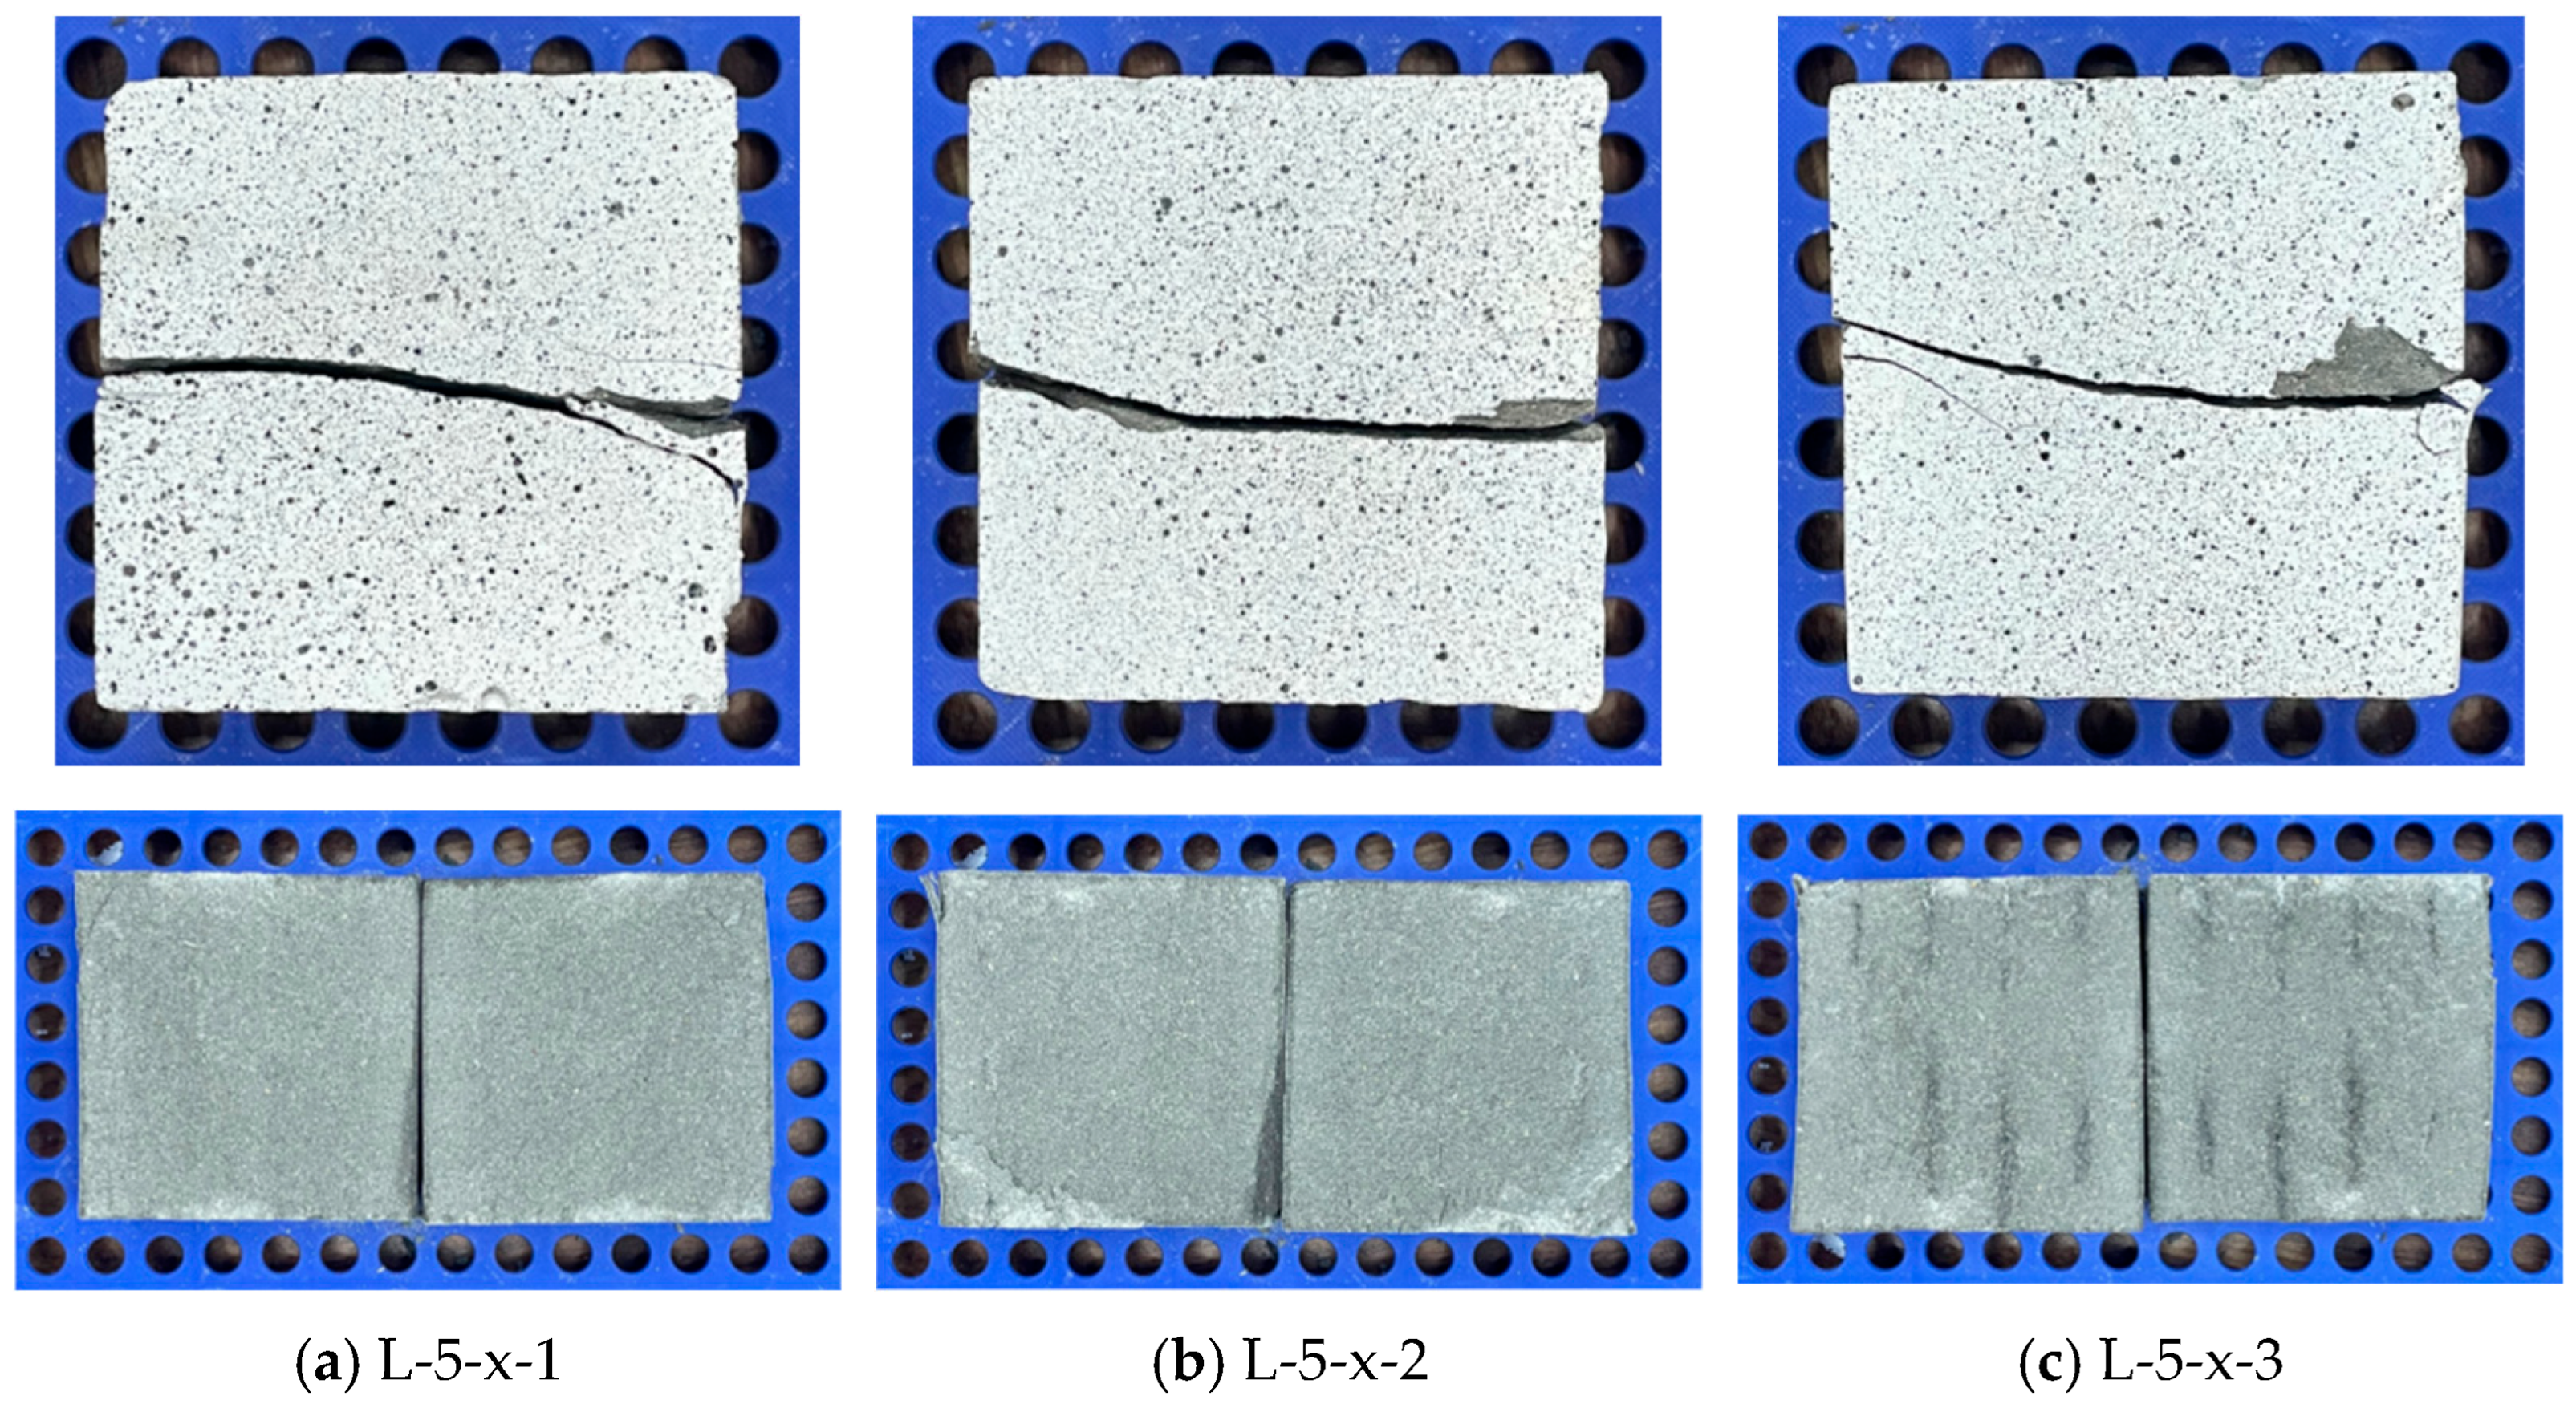
Figure 11 summarizes the damage patterns of the L-5-x specimens during loading, where cracks primarily occurred near the shear plane. Specifically, specimen L-5-x-3 was damaged due to combined interfacial bonding and shear failure (Mode III). The damage pattern of specimen L-5-x-2 was characterized by shear failure (Mode II), with the main crack concentrated in the shear region and propagating through the concrete matrix near the interlayer interface. In specimen L-5-x-1, cracks initially developed at the weakly bonded interfaces between 3D-printed mortar filaments; after minor damage to portions of the mortar, cracks propagated along the interlayer bonding plane of the 3DPC.
Figure 11.
The bearing mechanism of L-5-x specimens.
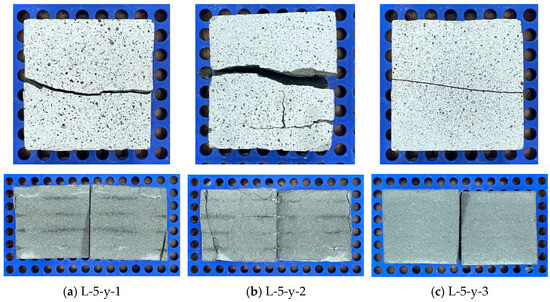
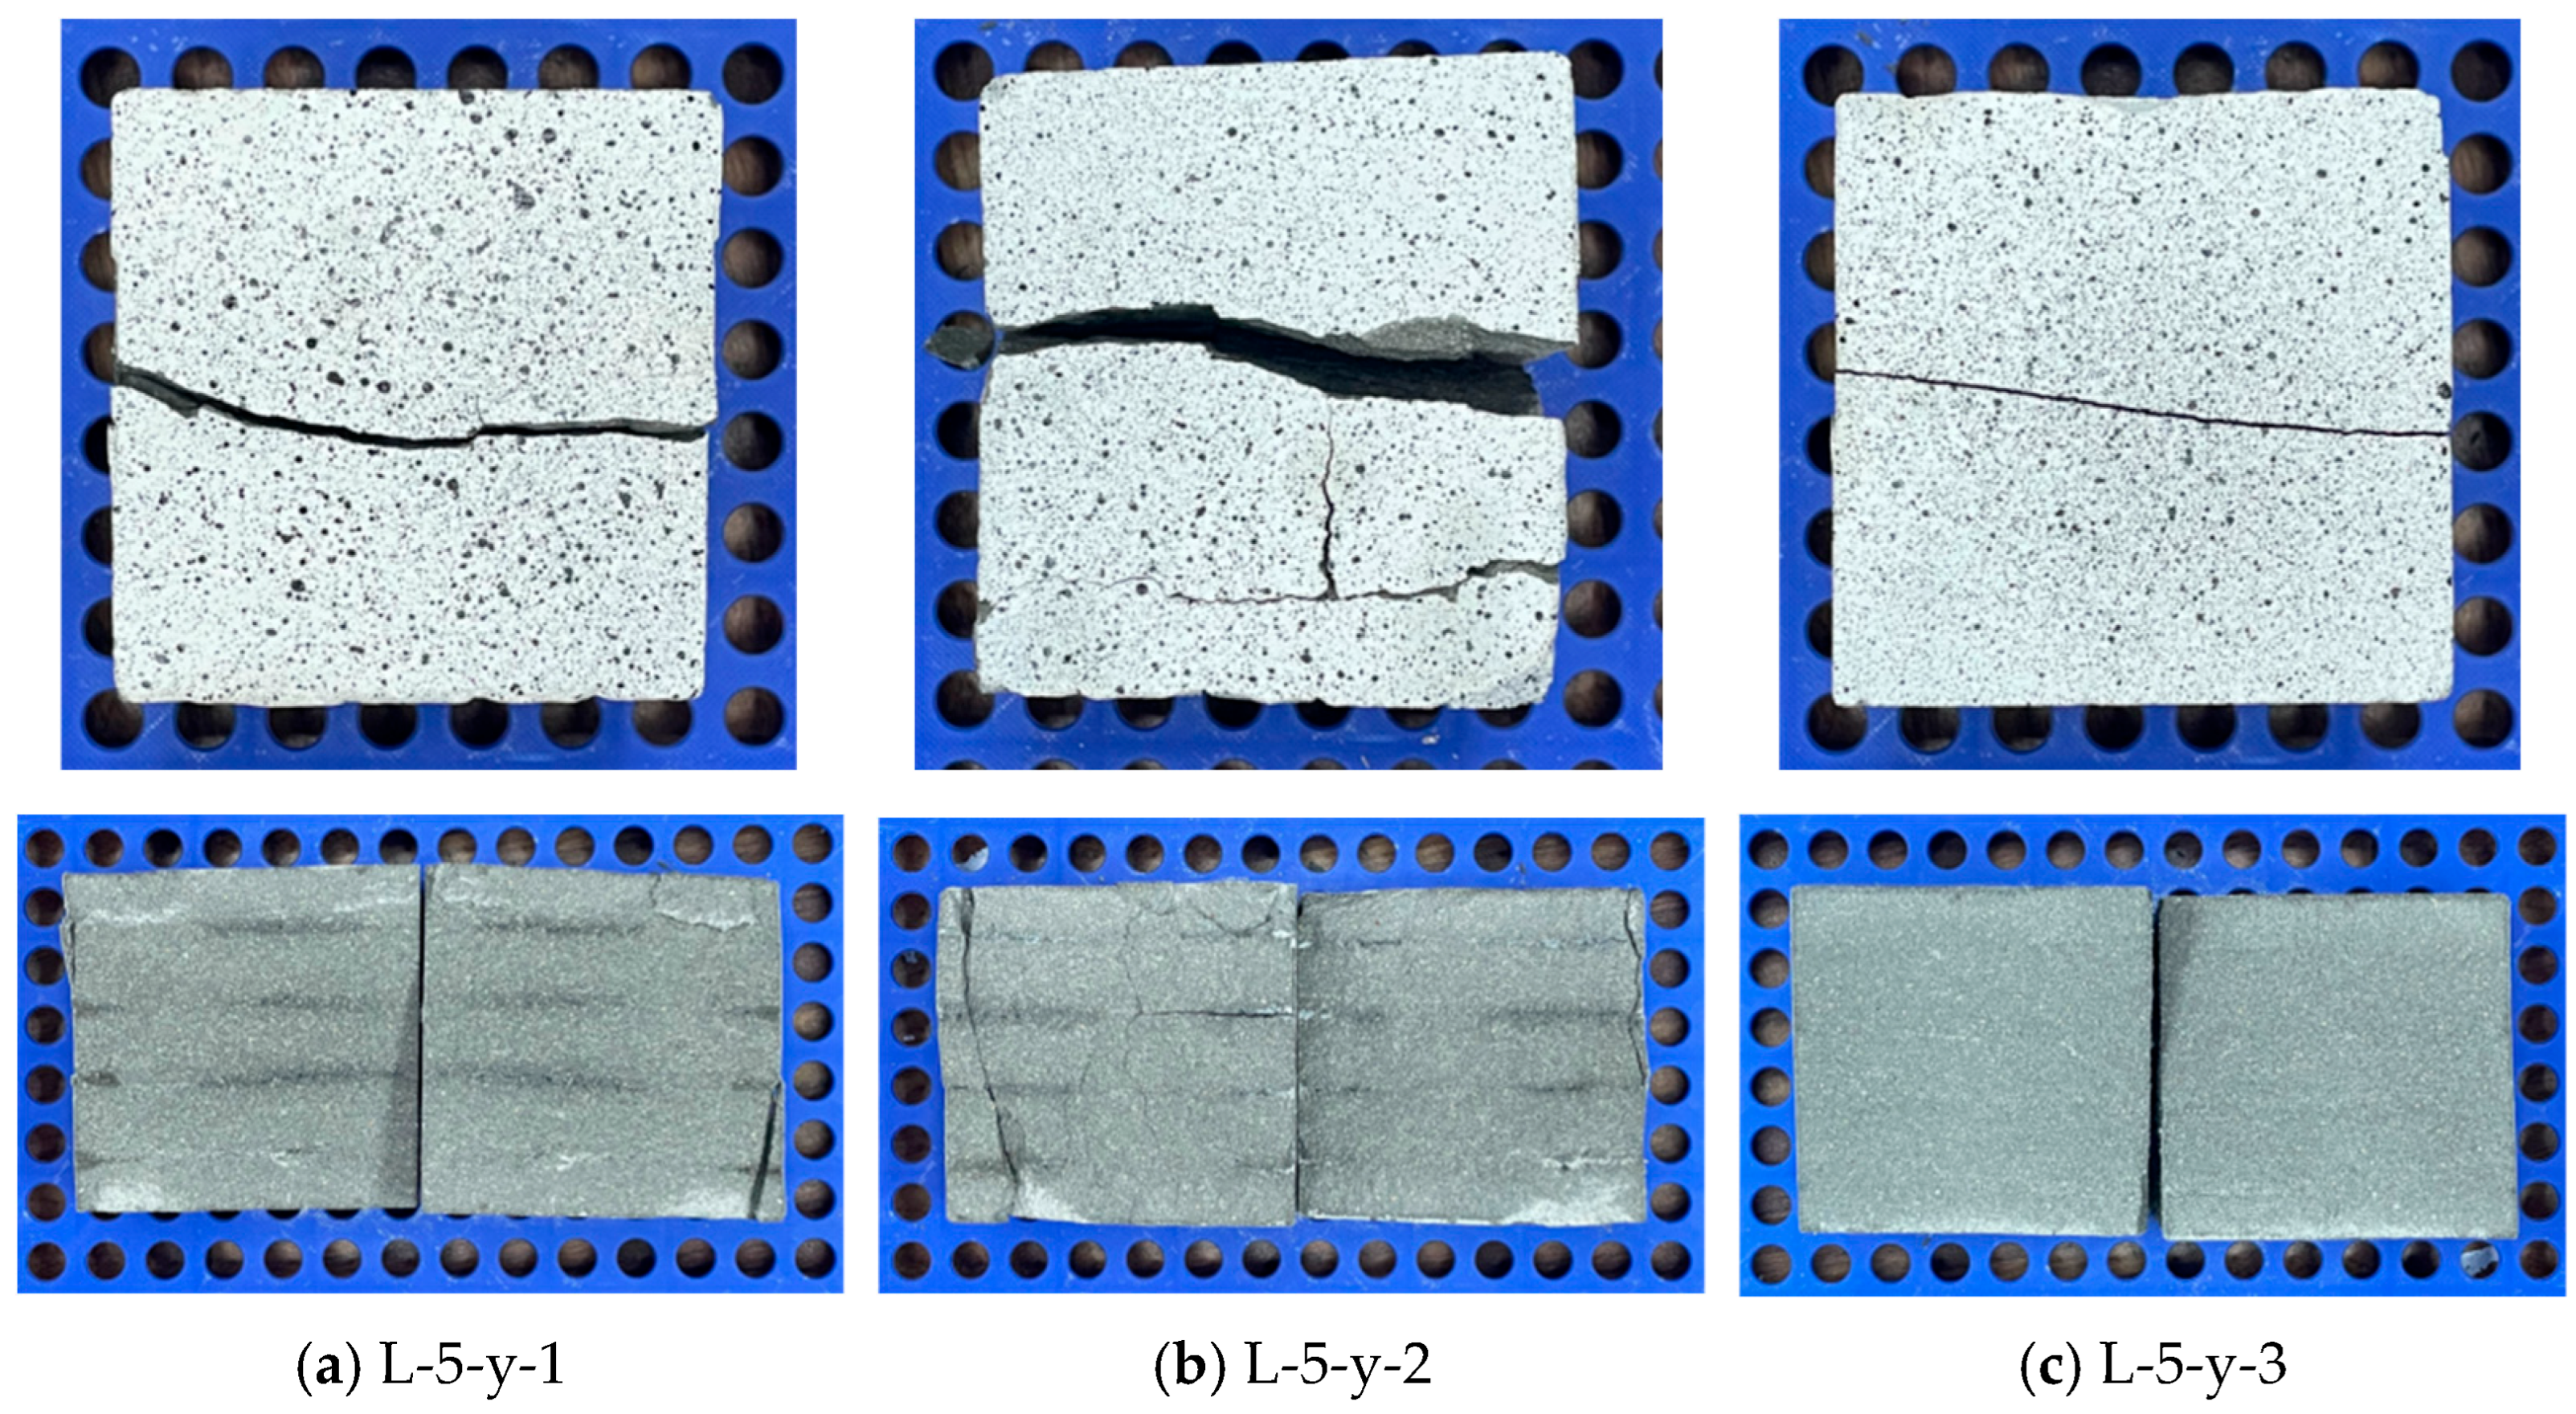
As shown in Figure 12, cracks in the L-5-y specimens during loading were primarily located near the shear plane. Specifically, in specimen L-5-y-1 and L-5-y-2, cracks developed along the shear plane during shearing, corresponding to combined interfacial bonding and shear failure (Mode III). In contrast, cracks in specimen L-5-y-3 propagated from top to bottom along weak points between the 3D-printed layers. Once the cracks reached the interface of the 3D-printed mortar, they propagated obliquely along the interlayer plane. This portion of splitting damage was the primary contributor to overall failure (Mode II).
Figure 12.
The bearing mechanism of L-5-y specimens.
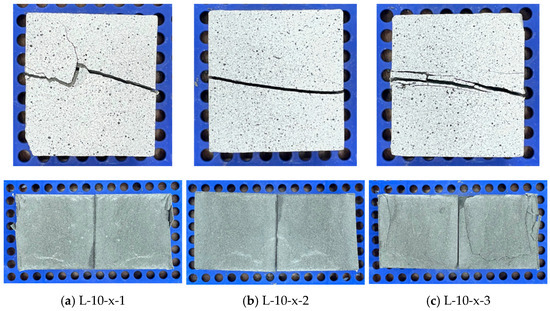
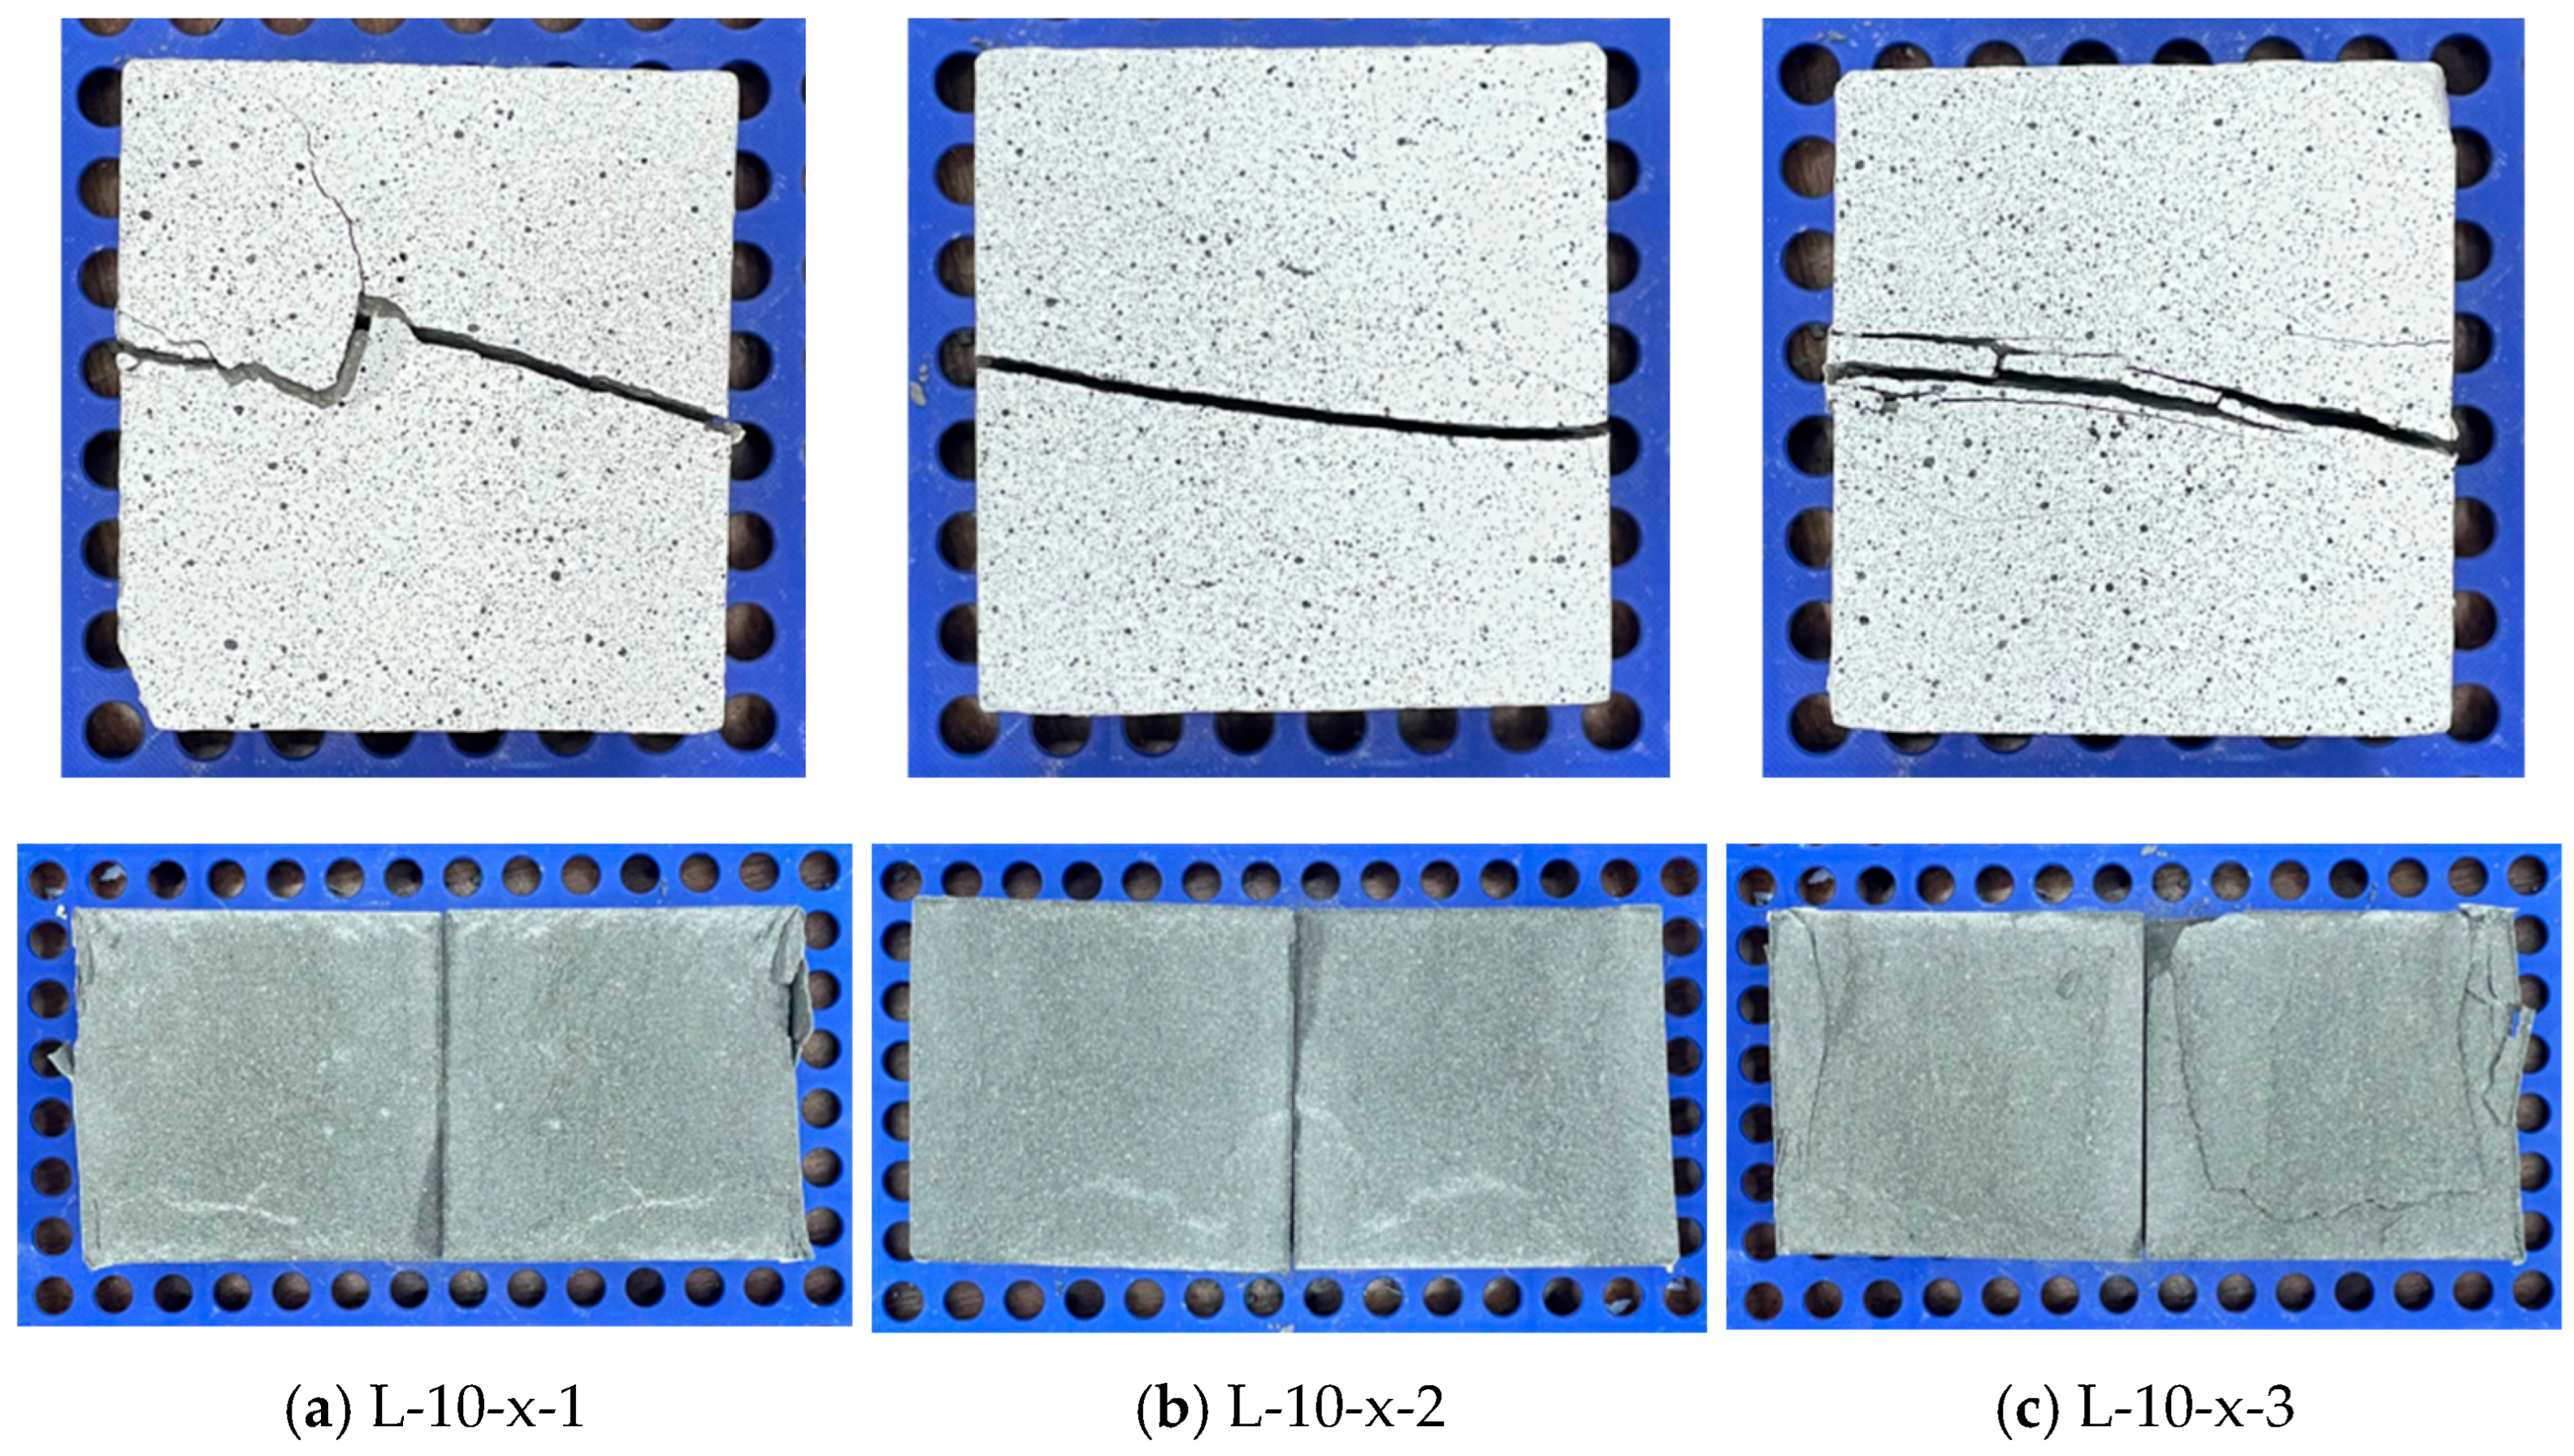
As shown in Figure 13, during loading, cracks in this series primarily developed along the bonding plane. Specifically, in specimen L-10-x-1, cracks formed along the bonding plane during shearing, and the failure mode was shear failure (Mode II). In specimens L-10-x-2 and L-10-x-3, cracks initially developed along the lower bonding plane, but splitting damage gradually evolved into oblique cracks that eventually penetrated the entire specimen. This portion of shear damage was the primary contributor to specimen failure (Mode II).
Figure 13.
The bearing mechanism of L-10-x specimens.
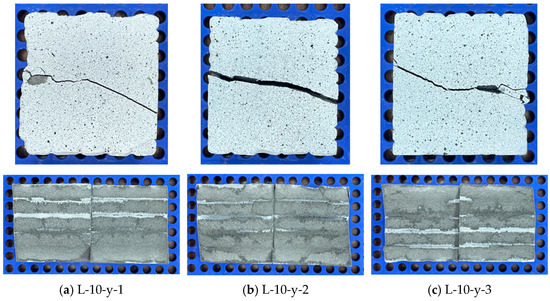
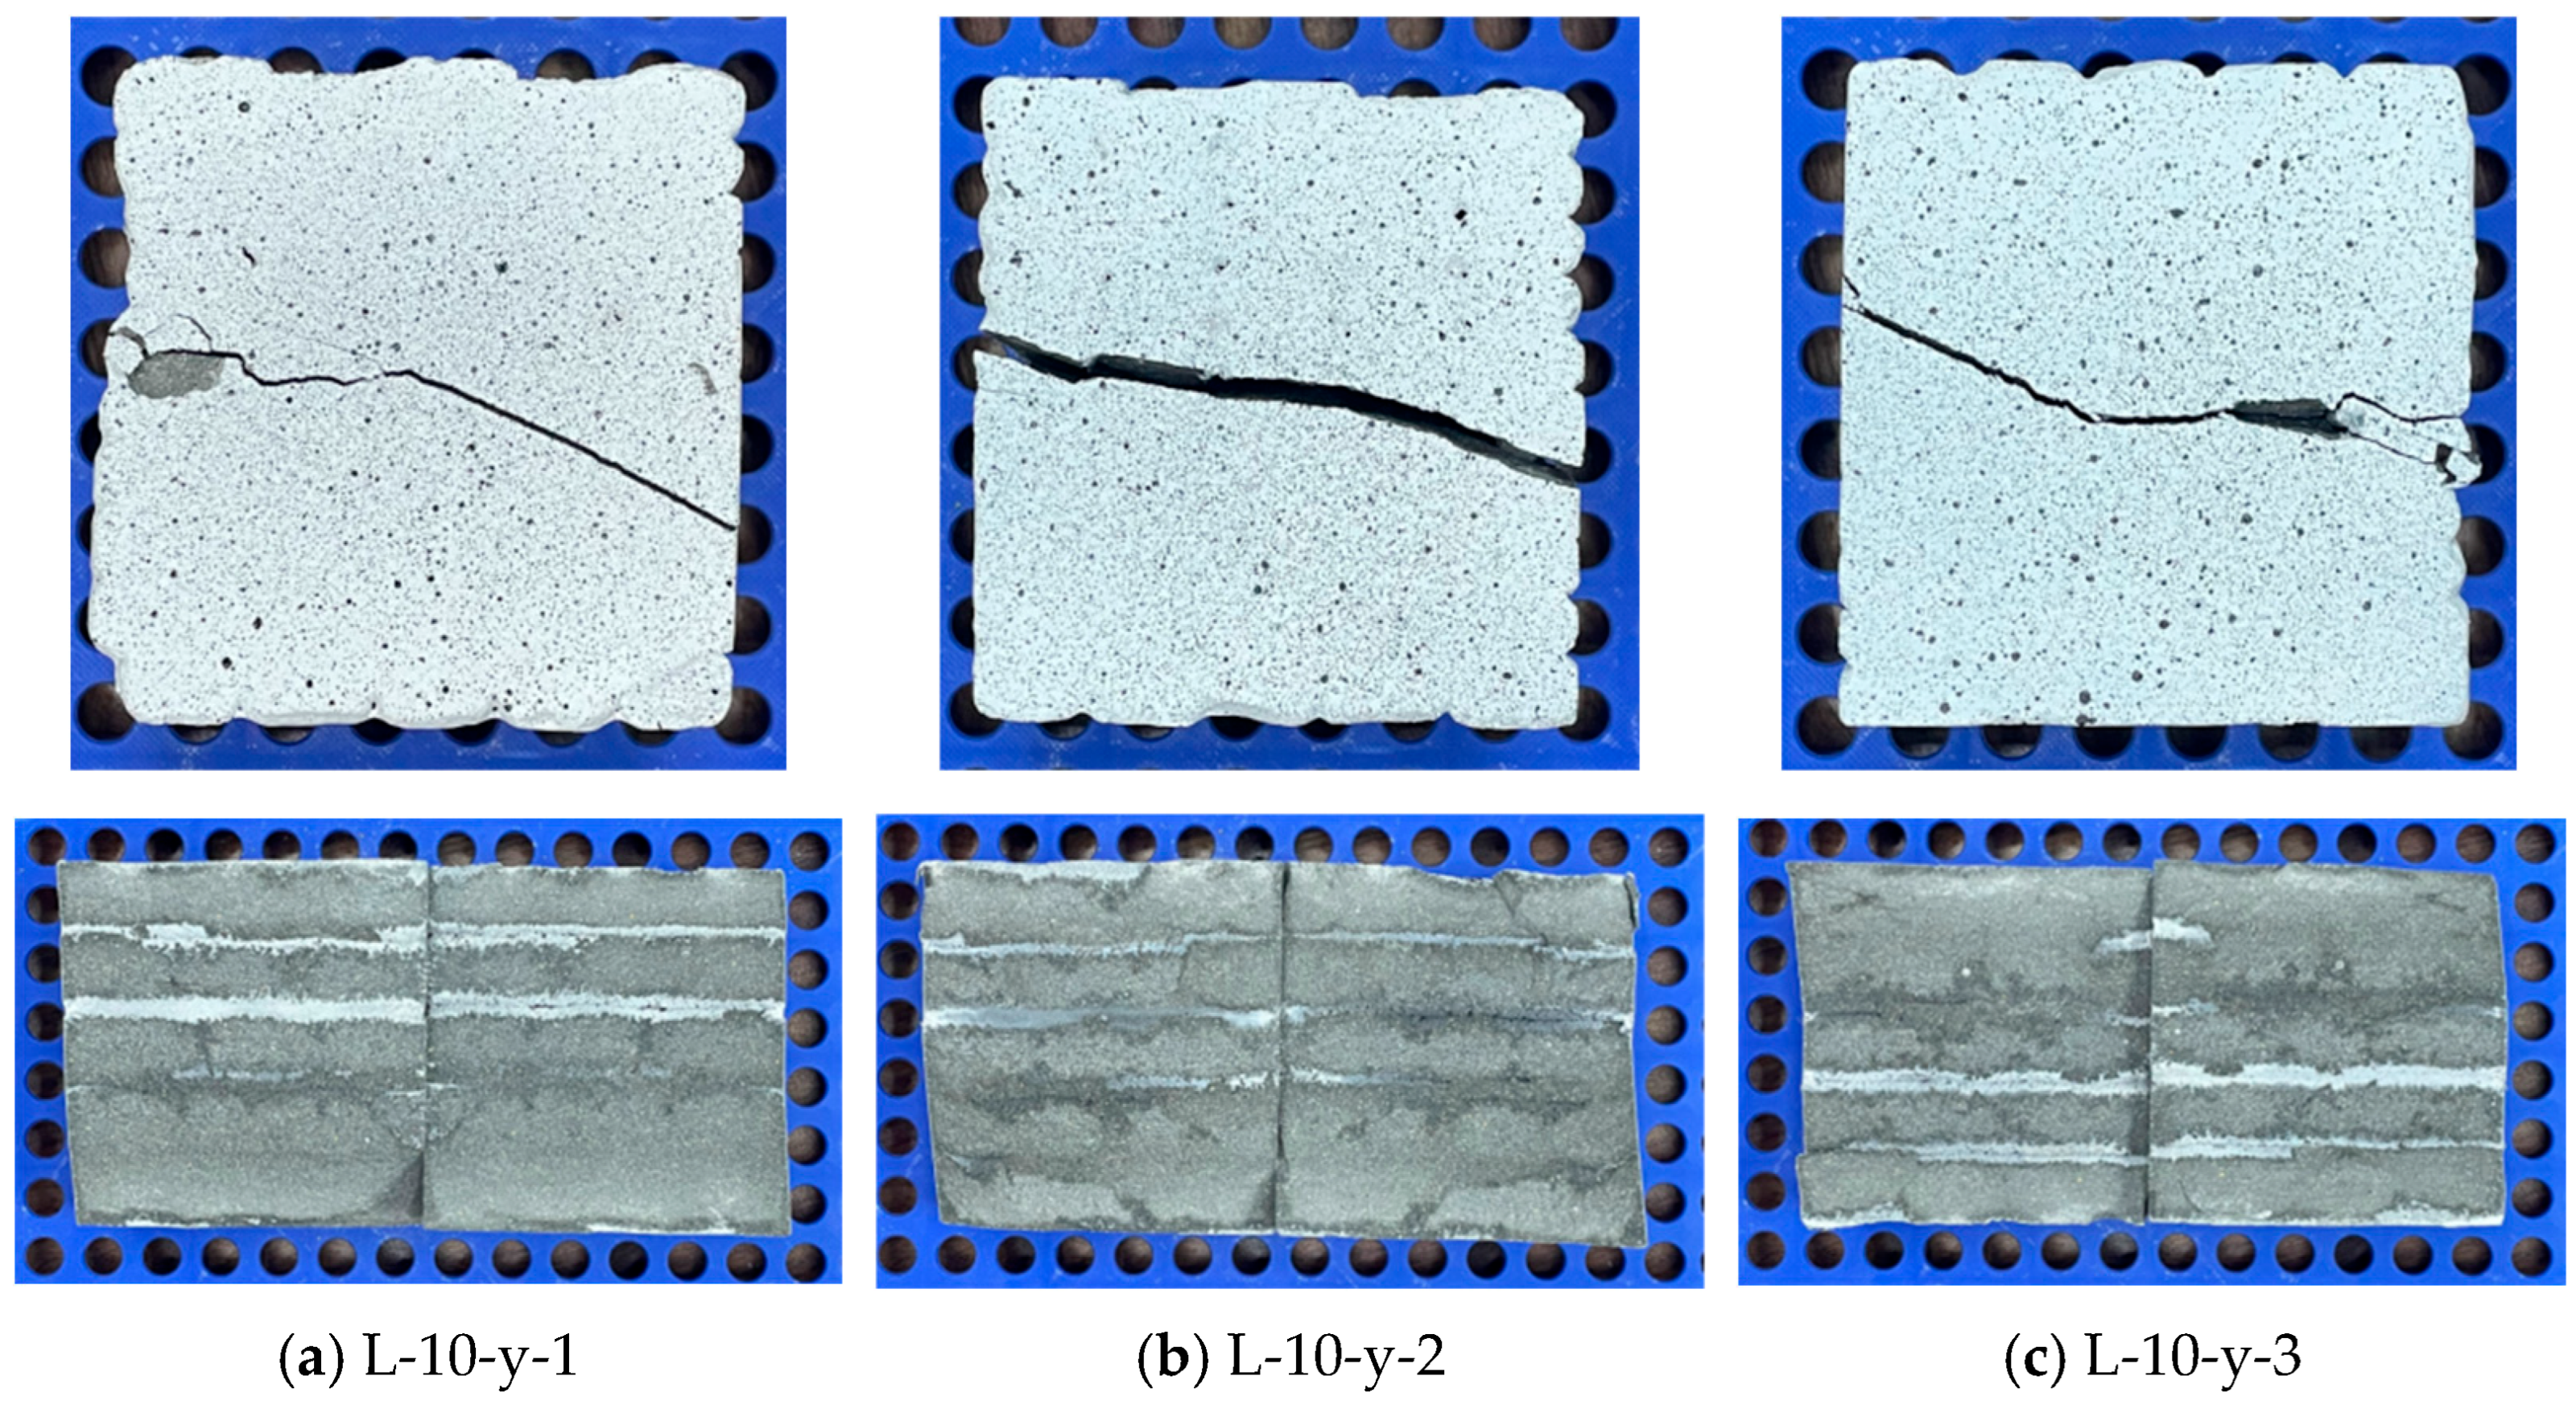
As shown in Figure 14, crack development in the L-10-y specimens during loading was relatively complex. Examination of the damage images indicates that in specimen L-10-y-1, cracks initially developed along the shear plane and initiated at approximately one-third of the specimen height due to applied stress. Subsequently, the cracks continued to propagate along the bonding plane at two-thirds of the height. In contrast, in specimen L-10-y-2, cracks propagated along the weak regions of the 3D-printed mortar up to half the specimen height, after which splitting damage occurred. The failure pattern of this specimen was such that half of the specimen experienced bonding failure, while the other half exhibited shear damage on the 3DPC side. In specimen L-10-y-3, cracks initially formed at the weakly bonded interfaces between 3D-printed mortar layers. After reaching two-thirds of the height, the cracks penetrated the entire specimen, while the remaining one-third experienced shear damage. L-10-y-1, L-10-y-2, and L-10-y-3 can all be classified as Mode III combined interfacial bonding and shear failure.
Figure 14.
The bearing mechanism of L-10-y specimens.
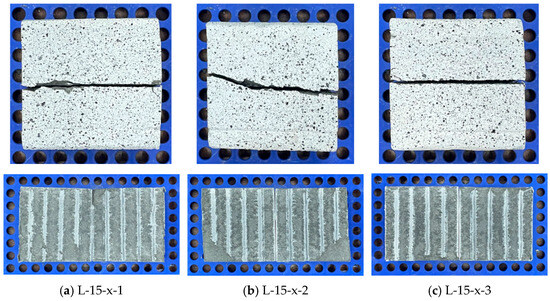
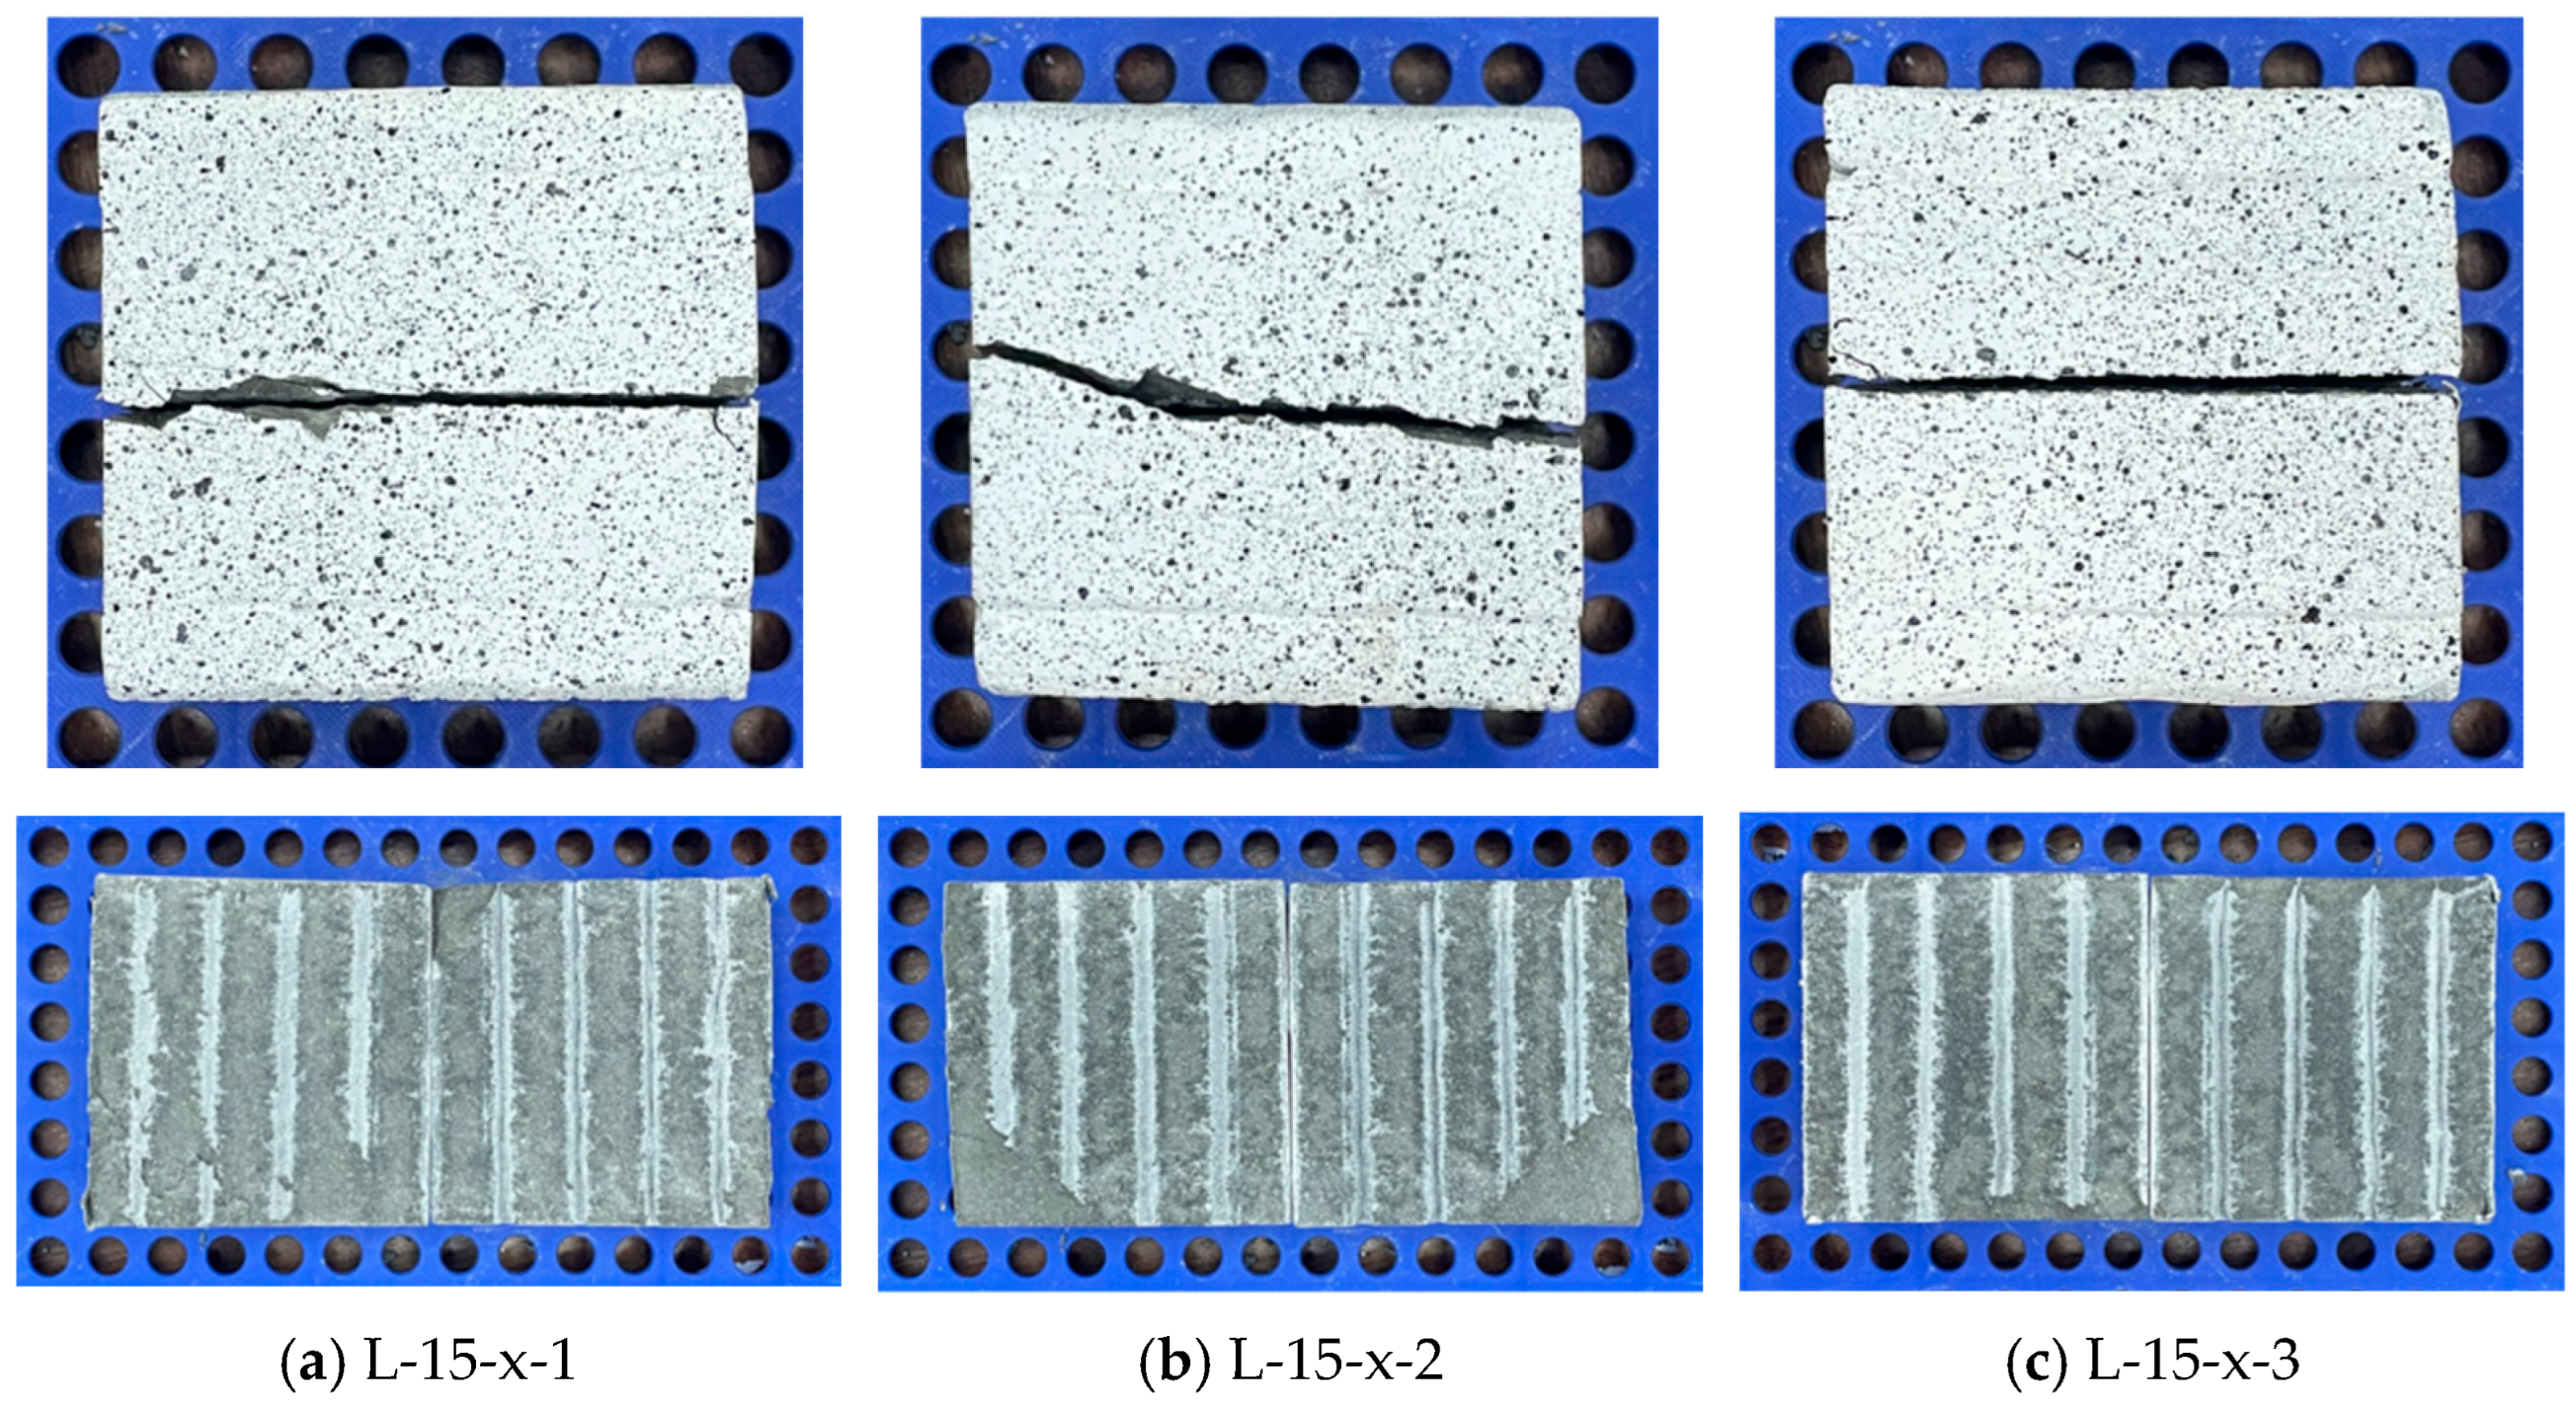
As shown in Figure 15, cracks in the L-15-x series primarily propagated along the interlayer interfaces. Specifically, specimens L-15-x-1 and L-15-x-3 failed by interfacial bonding failure, with cracks developing along the bond plane. Both specimens were classified as Mode I. L-15-x-2 is also primarily characterized by Mode I interfacial bonding failure. Although local spalling exists at the corners of the specimen, the damaged area is limited, no spatially extended cracks are formed, and the overall failure characteristics dominated by interfacial bonding are not altered.
Figure 15.
The bearing mechanism of L-15-x specimens.
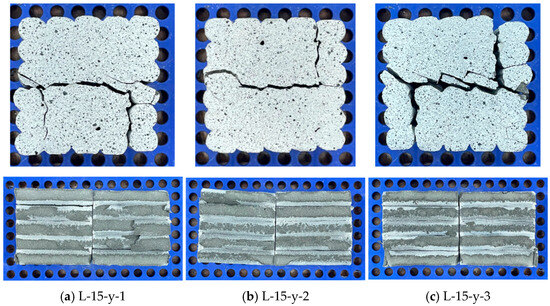
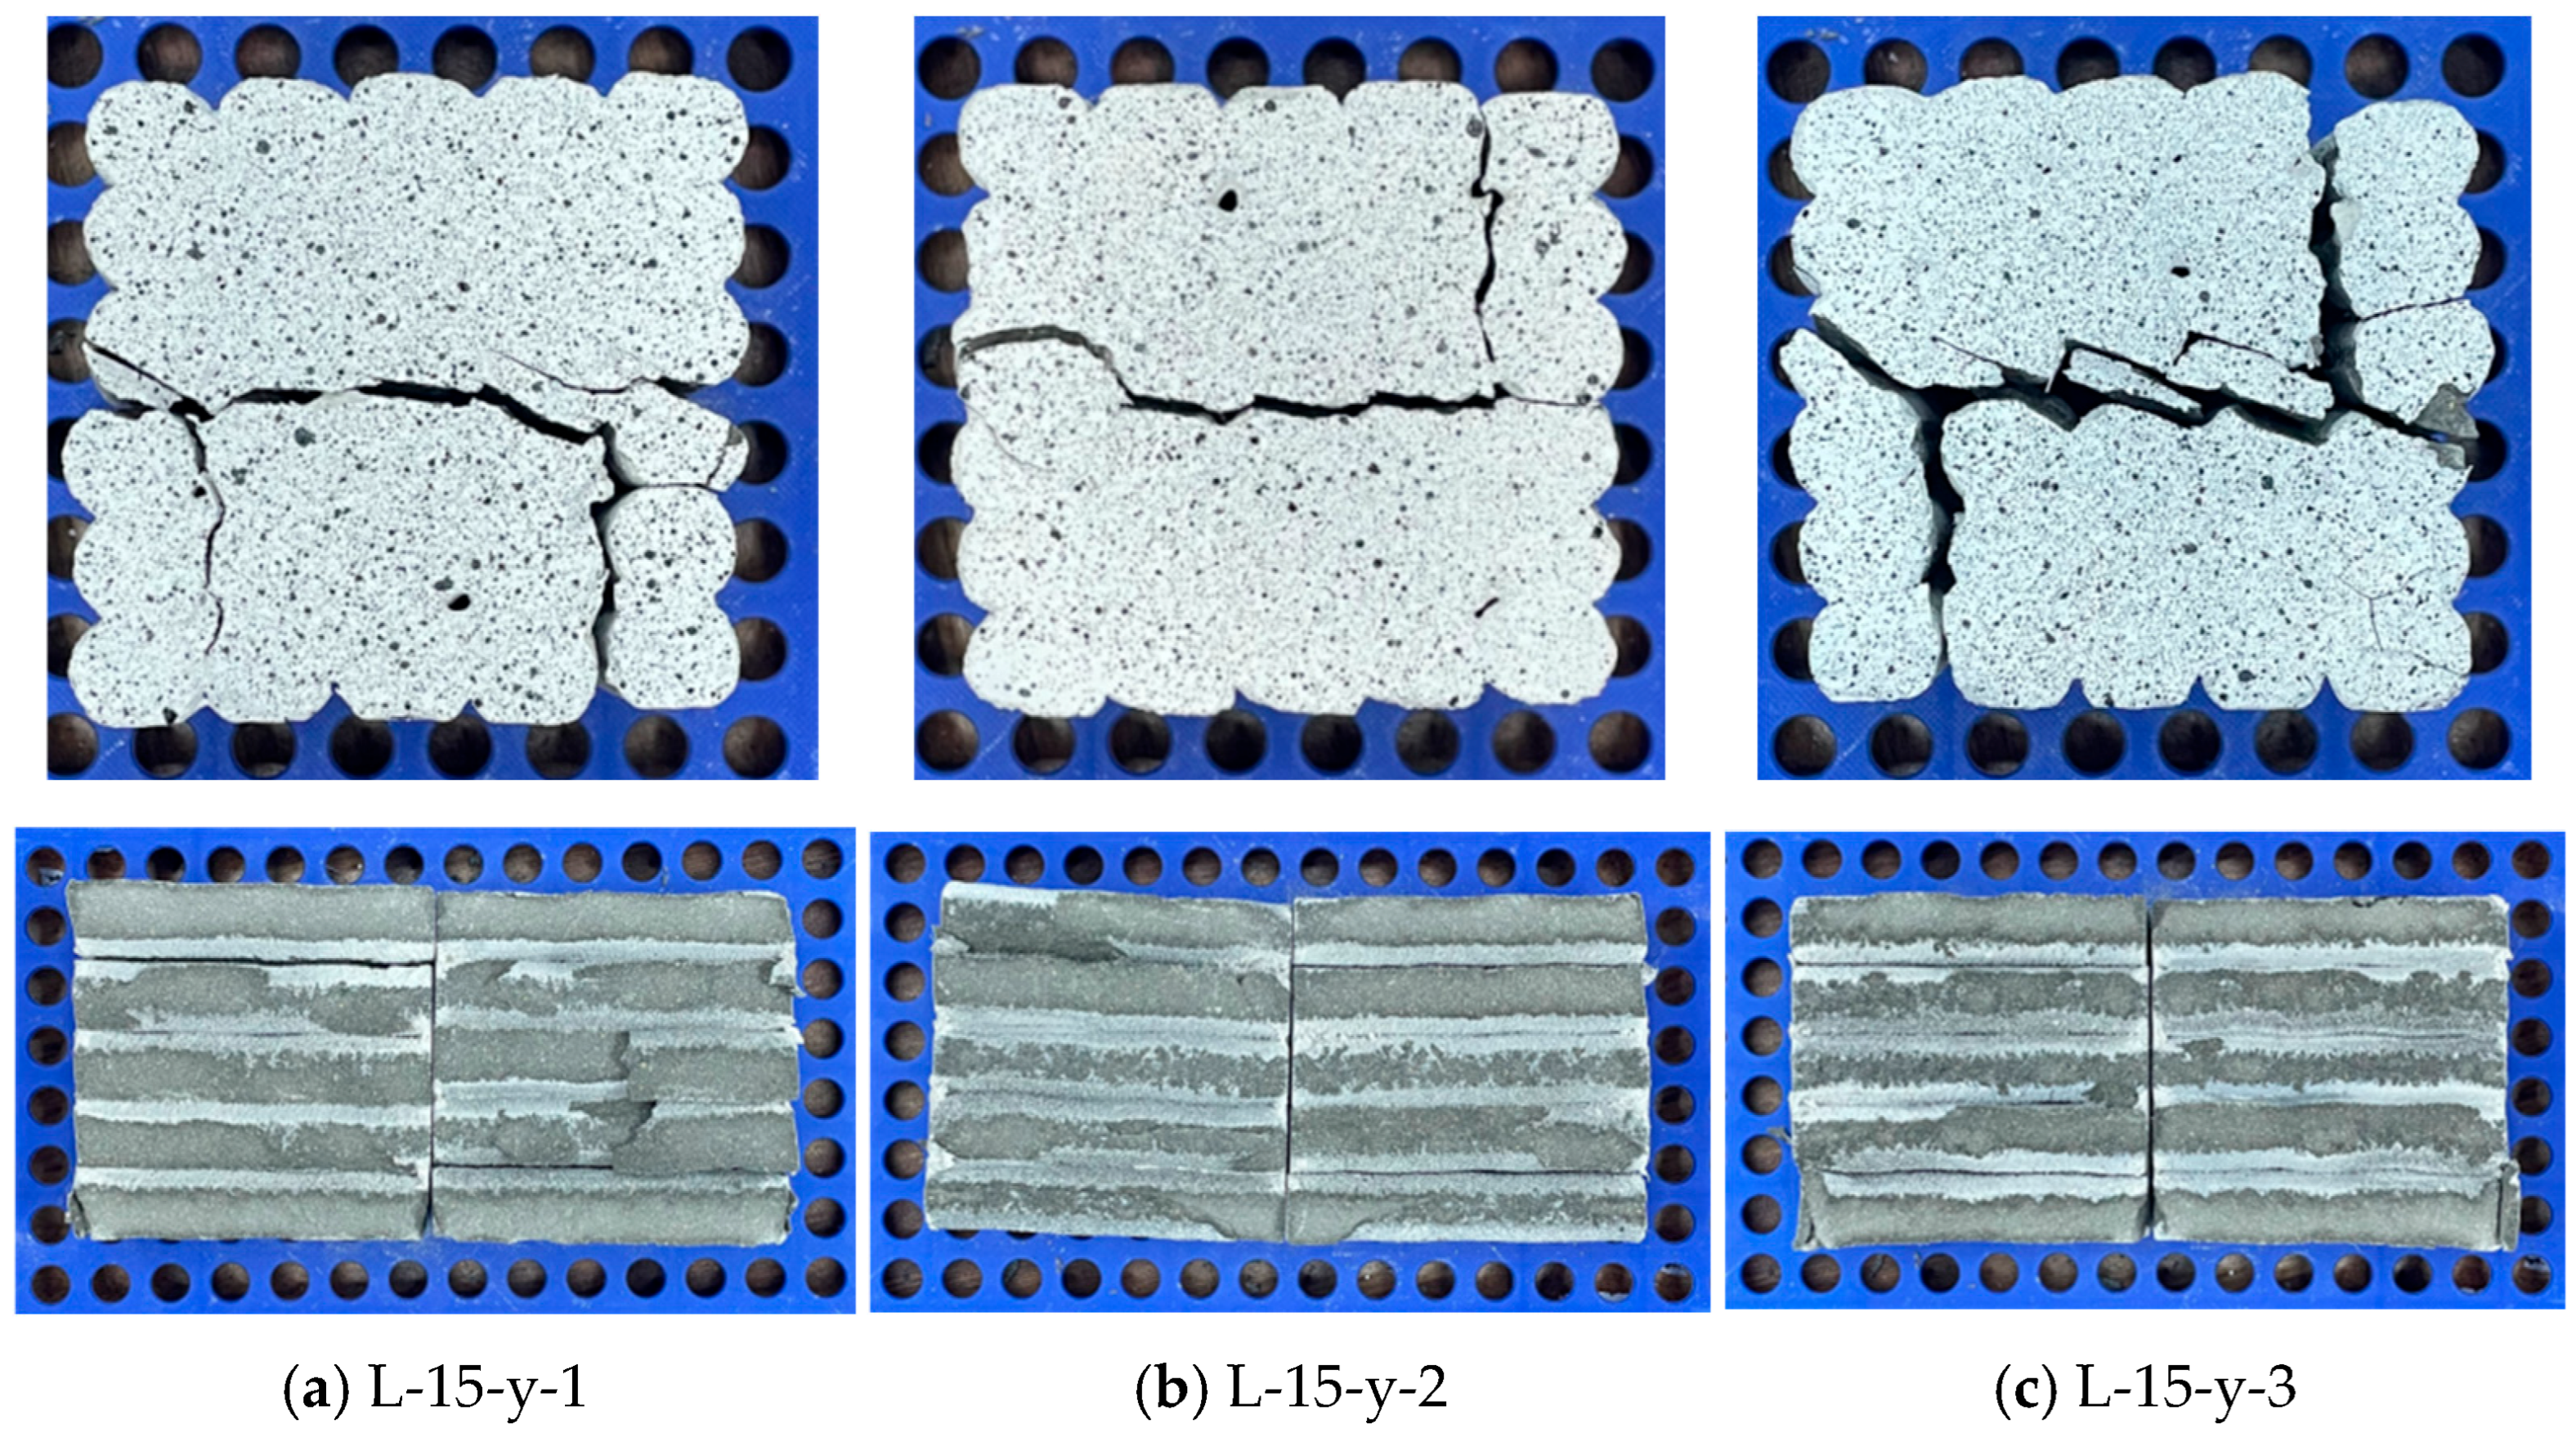
As shown in Figure 16, the L-15-y specimens exhibited the lowest shear capacity, with relatively complex crack development during loading. Examination of the damage images indicates that in specimen L-15-y-1, cracks initially developed along the shear plane, initiating at approximately one-fifth of the specimen height due to applied stress. Subsequently, the cracks continued to propagate along the bonding plane at four-fifths of the height. In addition to the through-going cracks along the shear plane and the fracture cracks in the printed material, partial through-thickness cracks perpendicular to the shear direction were observed at heights of one-fifth and four-fifths of the specimen. In contrast, in specimen L-15-y-3, cracks mainly developed on one side of the specimen, with splitting damage occurring after one-fifth of the specimen height. The failure pattern of this specimen was such that three-fifths of the specimen experienced shear failure, while two-fifths exhibited splitting damage on the 3DPC side. In specimen L-15-y-2, cracks initially formed at the weakly bonded interfaces between 3DPC layers. After reaching four-fifths of the specimen height, cracks penetrated the entire specimen, while the remaining four-fifths experienced splitting damage. Additionally, at one-fifth of the specimen height, a splitting crack perpendicular to the shear plane developed, penetrating one side of the specimen. Photographic observations of the damaged specimens further revealed that the forces acting during loading were complex, with cracks developing multiple times in three-dimensional space. The L-15-y series specimens exhibited interfacial bonding and shear failure (Mode III).
Figure 16.
The bearing mechanism of L-15-y specimens.
3.2. Load-Displacement Curve and Strain Distribution
To investigate the detailed stress distribution during specimen loading, digital image correlation (DIC) techniques were employed to analyze the images acquired throughout the loading process. The fundamental principle of DIC analysis involves tracking changes in pixel positions at the same point between two images captured before and after deformation. By identifying the positions of scatter patterns, the computer computes the corresponding coordinates using appropriate algorithms. Consequently, the correlation displacement at a given point is equivalent to the displacement vector. Through the careful observation and analysis of these images, particularly those capturing crack development, a comprehensive study was conducted. The DIC analysis revealed the presence of surface microcracks around regions of abrupt strain and displacement, with larger surface microcracks observed where displacement data exhibited discontinuities.
3.2.1. x Series
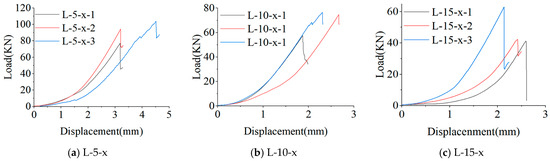
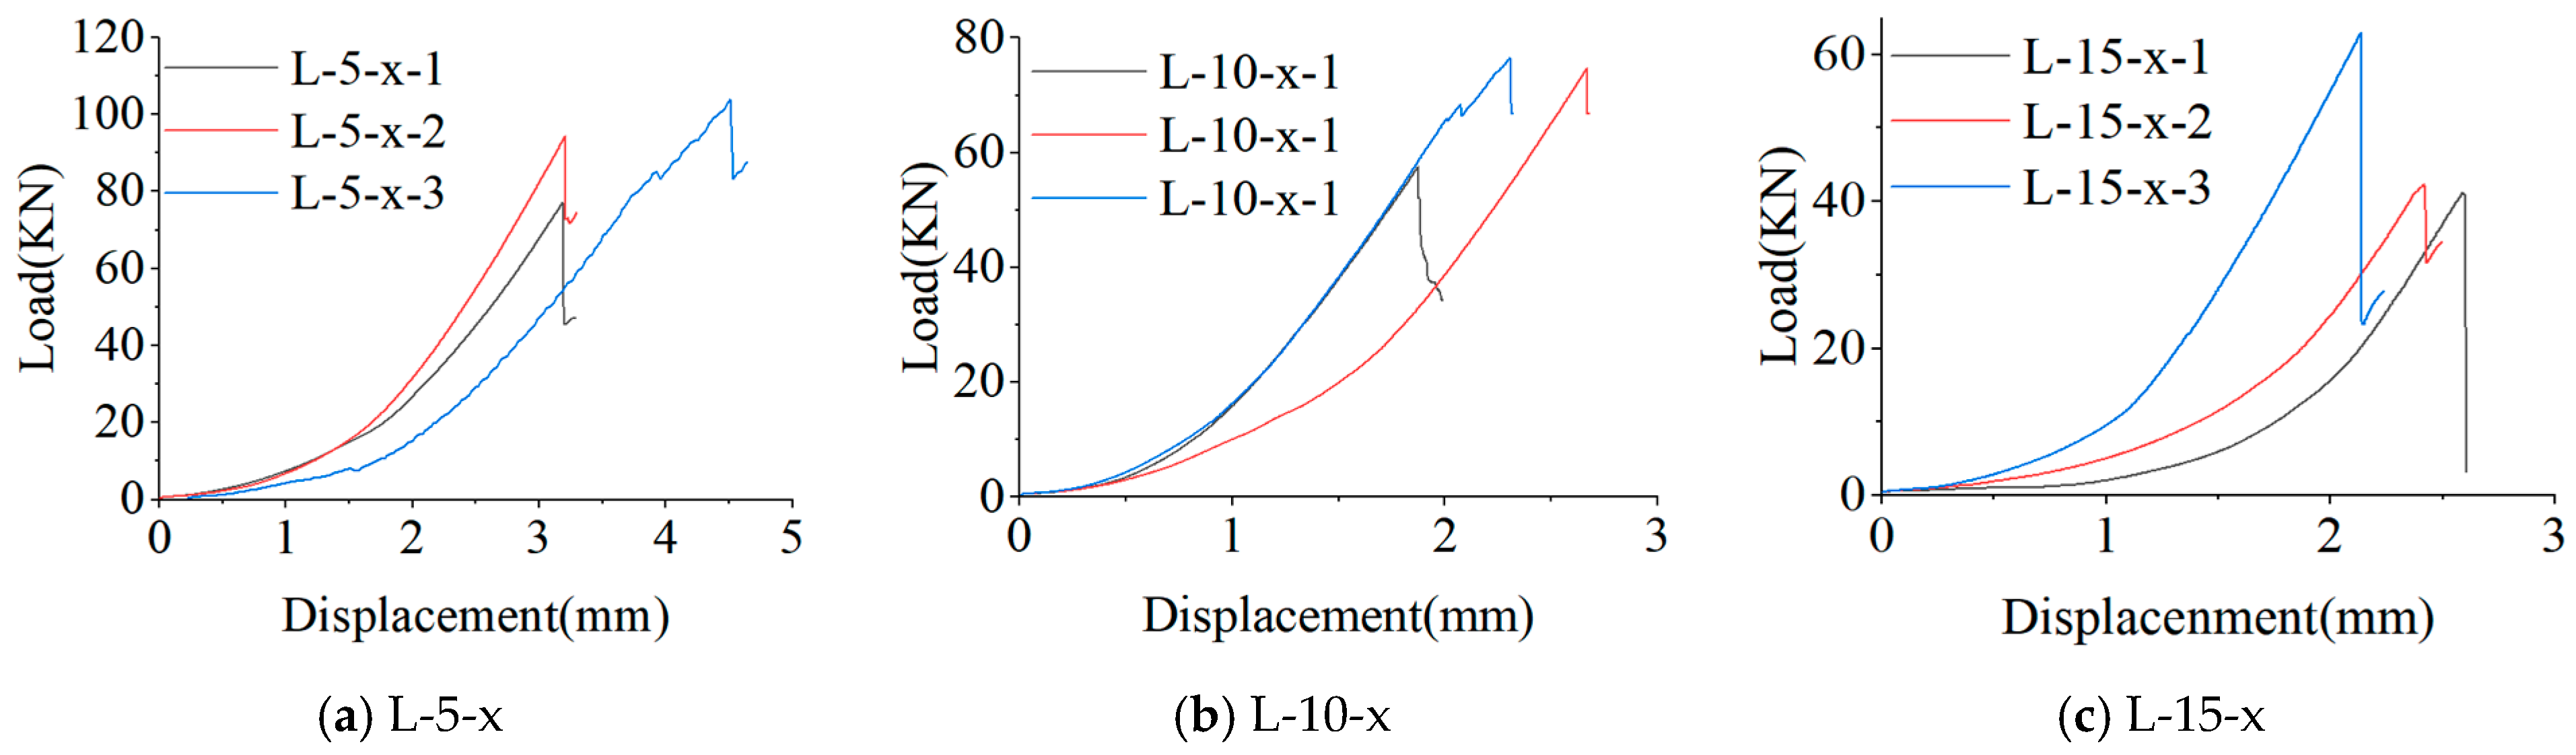
During the shearing process of the x series specimens, cracks propagated rapidly along the interface, and the specimens exhibited a typical brittle failure mode. That is, once the specimens reached the ultimate load, the cracks rapidly developed and penetrated through the interface, resulting in an abrupt load drop. The load-displacement curves of the L-5-x specimens, as shown in Figure 17a, reveal distinct stages throughout the loading process, with each curve exhibiting a single peak. Figure 17b presents the load-displacement curves of the L-10-x specimens, all of which experienced sudden failure upon reaching the ultimate load. Overall, compared with the L-5 specimens, this series exhibited lower shear capacity and smaller slip increments. As shown in Figure 17c, the L-15-x series showed further reductions in peak load. In the initial loading stage, the load increased slowly, and the initial slope was the smallest; thereafter, the slope increased to some extent, but the overall load-carrying capacity remained significantly lower than that of the L-5-x and L-10-x series, with greater variability among specimens.
Figure 17.
Load-displacement curves of the L-x series specimens.
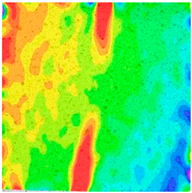
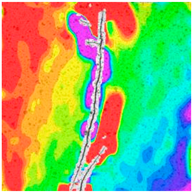
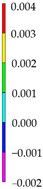
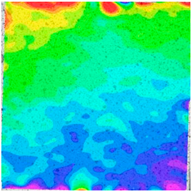
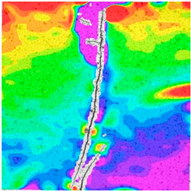
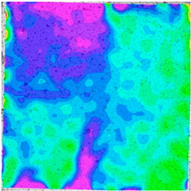
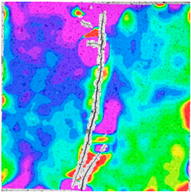
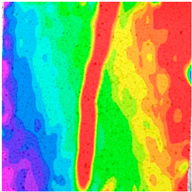
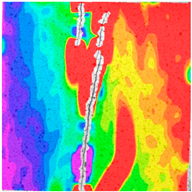
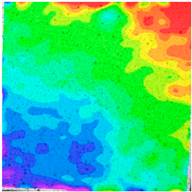
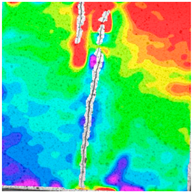
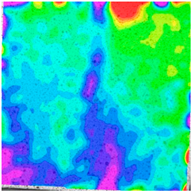
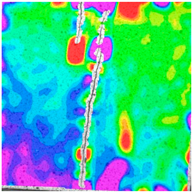
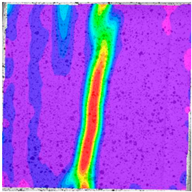
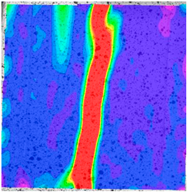
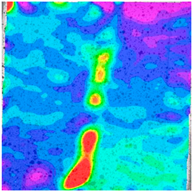
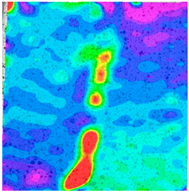
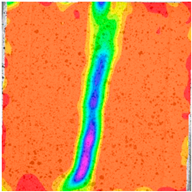
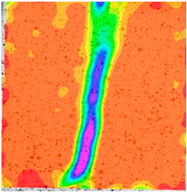
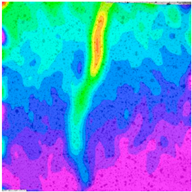
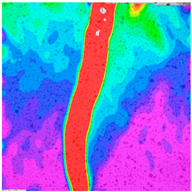
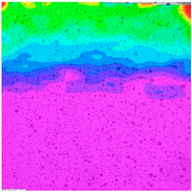
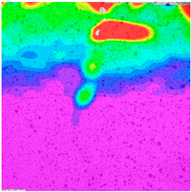
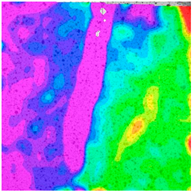
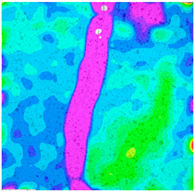
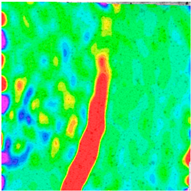
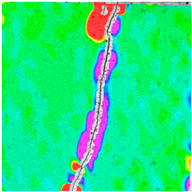
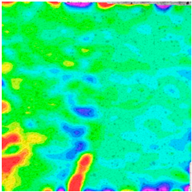
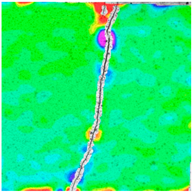
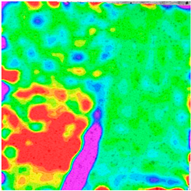
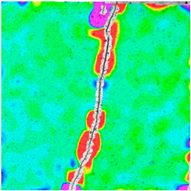
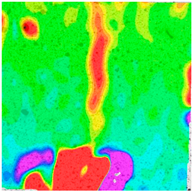
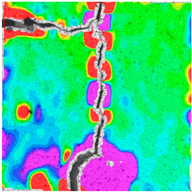
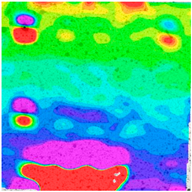
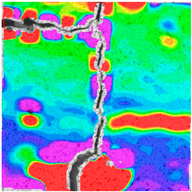
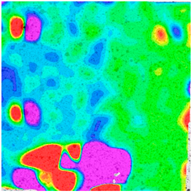
Table 3 presents the DIC strain nephograms of specimen L-5-x-3. Before the peak load, the exx field showed several local high-strain regions, but no continuous strain-localization band had yet formed. At the peak load, the high-strain exx region became concentrated near the middle of the specimen and formed a relatively continuous near-vertical strain band, which was generally consistent with the final crack path. The eyy field remained more diffuse than the exx field, and no obvious through-going strain band was observed. For exy, the shear strain was mainly distributed in localized patches before the peak load and then concentrated along the crack path at the peak load.
Table 3.
DIC strain nephograms of specimen L-5-x-3.
The damage evolution contour plots of specimen L-10-x-3 are shown in Table 4. As shown in Table 4, the strain evolution of L-10-x-3 was generally similar to that of L-5-x-3, but the strain localization before peak load was more evident. The main high-strain regions were concentrated near the middle crack path, especially in the exx and exy fields, while the eyy field only showed local patch-type concentration.
Table 4.
DIC strain nephograms of specimen L-10-x-3.
Analysis of the DIC strain fields, presented in Table 5, reveals that the initial crack during shear loading nucleated along the bonded interface. As shown in Table 5, L-15-x-2 showed a more distinct pre-peak localization feature than the L-5-x and L-10-x specimens. The exx and exy high-strain regions were mainly concentrated along the middle interlayer path, while the eyy field remained discontinuous and locally distributed. This indicates that, with increasing nominal layer height, the damage of the x-series specimens became more likely to localize earlier along the weak interlayer region.
Table 5.
DIC strain nephograms of specimen L-15-x-2.
After manually screening the loading-capture images of the L-x series specimens, DIC analysis was performed to obtain the maximum strain values in each direction near the main crack before failure. The numerical results are summarized in Table 6. As shown in Table 6, the mean exx values of the L-5-x, L-10-x, and L-15-x specimens are 0.0109, 0.0109, and 0.0079, respectively, which are higher than the corresponding mean eyy and exy values. This indicates that the L-x series specimens predominantly failed in tension-shear mode.
Table 6.
Maximum strain values of L-x series specimens before failure.
3.2.2. y Series
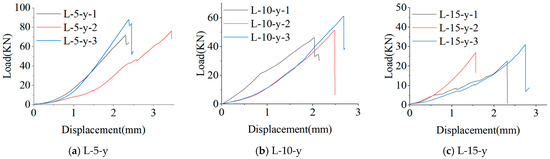
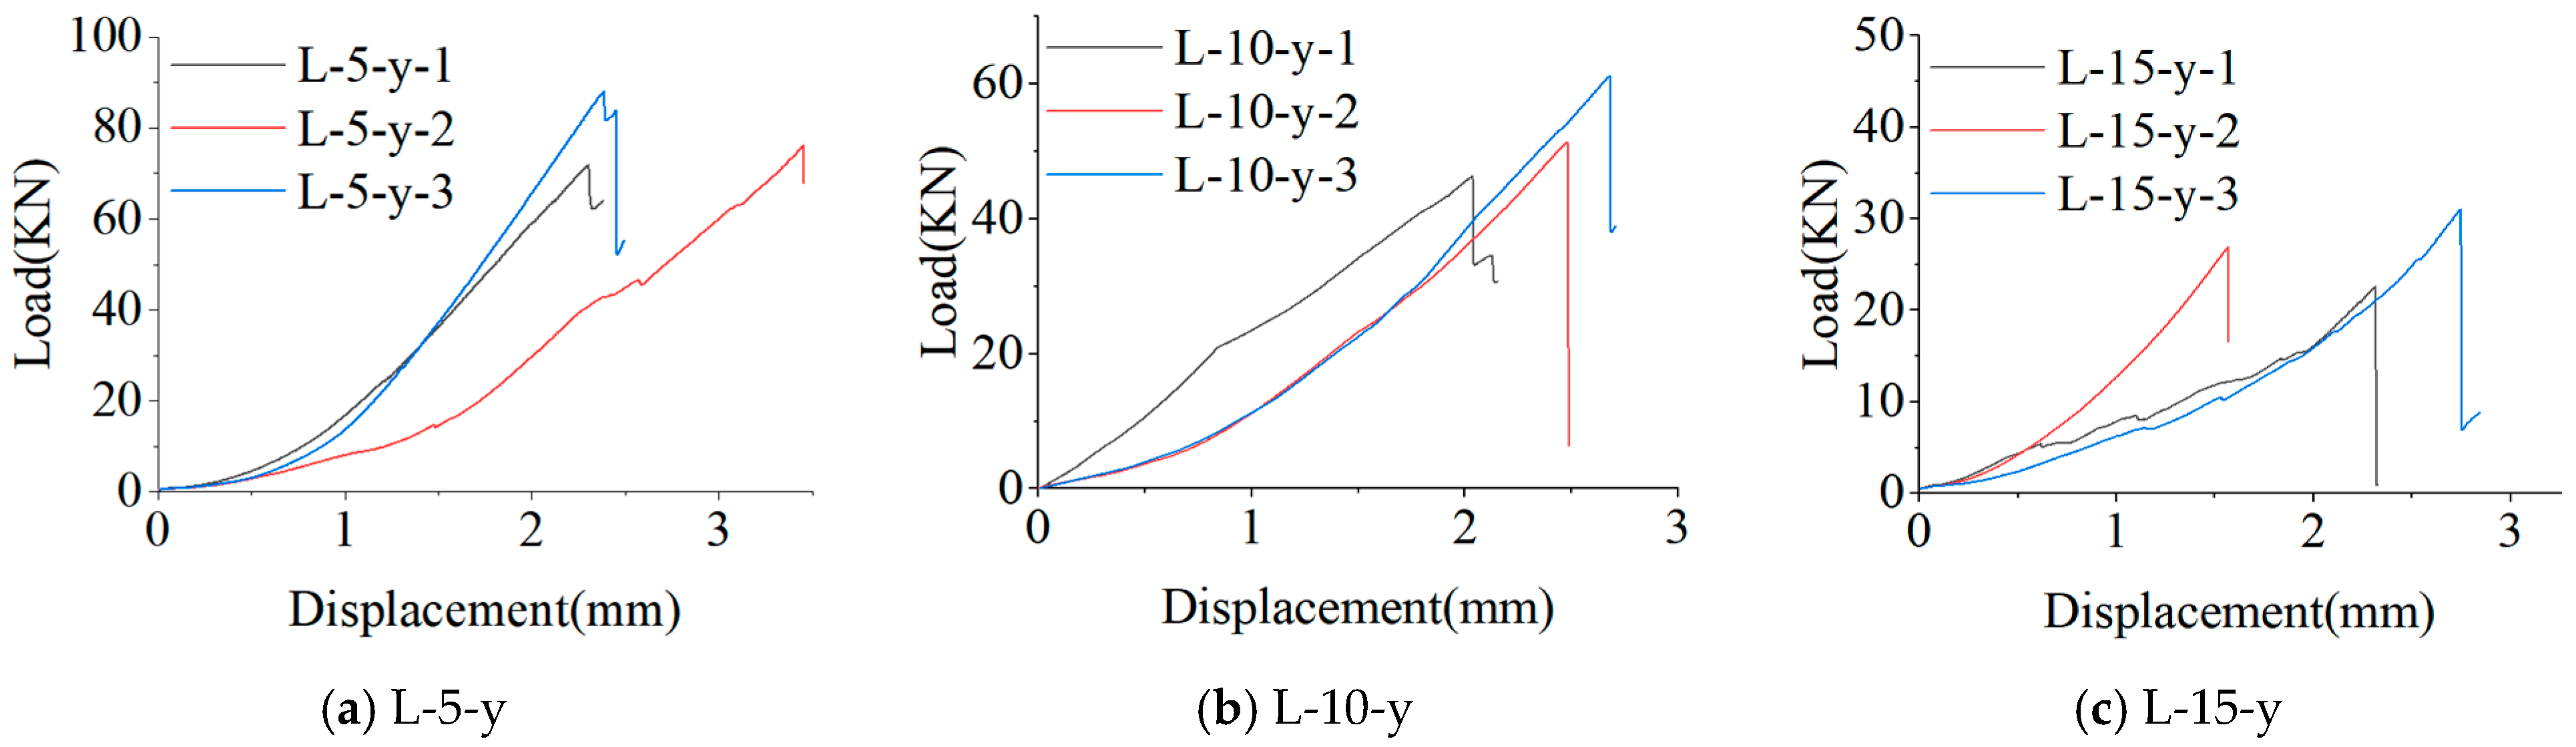
As shown in Figure 18a, the load-displacement curve of the L-5-y specimens exhibited a single-peak behavior, with only one primary crack forming near the shear plane during the loading process. The load-displacement curve of the specimen abruptly terminated upon reaching the ultimate load, coinciding with the formation of a single crack during loading. Compared with the L-5-x specimens, the L-5-y specimens demonstrated slightly reduced load-bearing capacity. As shown in Figure 18b, compared with the L-5-y specimens, this L-10-y series exhibited lower shear capacity and smaller slip improvement. The load-displacement curves indicate that this series also displayed lower scatter relative to the other series. As shown in Figure 18c, the load-displacement curves of the L-15-y specimens exhibit distinct characteristics during the loading phase. This series of specimens displays similar damage modes, with cracks developing along the shear interface and initiating oblique propagation at certain points. Notably, the shear failure in this series is no longer confined to the shear interface. In the specimens, the damage has extended into the printed concrete filaments, with crack propagation causing significant damage to the printed filaments. Furthermore, failure was not limited to the interlayer interface. Due to the increased printing thickness, more pronounced voids developed within the specimens, reducing overall specimen integrity. During interlayer shearing, the transverse intralayer interfaces also experienced significant damage. The load-displacement curves indicate that this series exhibits greater scatter compared with other series.
Figure 18.
Load-displacement curves of the L-y series specimens.
The strain analysis of specimen L-5-y-2 indicated that during cracking, the specimen exhibits a single peak, with the peak location propagating from the center toward the left side. As shown in Table 7, before the peak load, a narrow high-strain region had already appeared in the exx field near the middle of the specimen, but it had not yet developed into a through-going band. At the peak load, this high-strain region further expanded and formed a relatively continuous vertical strain band, which corresponded well with the final crack path. The eyy field mainly showed local strain differences between the upper and lower regions, while no continuous band fully consistent with the exx band was observed. The exy field was scattered before the peak load and then became concentrated along the main crack at the peak load.
Table 7.
DIC strain nephograms of specimen L-5-y-2.
As shown in Table 8, the strain evolution of specimen L-10-y-2 was generally similar to that of L-5-y-2, but the pre-peak localization was more evident. A clearer vertical high-strain band appeared in the exx field before the peak load, and a through-going crack path formed near the middle region at the peak load. The exy field also showed shear-strain concentration along the main crack, while the eyy field remained mainly locally distributed.
Table 8.
DIC strain nephograms of specimen L-10-y-2.
As shown in Table 9, specimen L-15-y-2 exhibited a more complex strain-localization pattern. The exx field showed a main vertical high-strain region in the middle of the specimen, together with local strain concentration in the lower part before the peak load. At the peak load, the main crack propagated through the middle region, accompanied by transverse branches or local deflections near the upper part. The exy field was also distributed along both the main crack and the branch regions, while the eyy field showed a more obvious local concentration around the crack and branch zones. Compared with L-5-y and L-10-y, the L-15-y specimen showed stronger local discontinuity and more complex crack development, indicating that increasing nominal layer height made the y-direction specimens more sensitive to weak interlayer regions and local defects.
Table 9.
DIC strain nephograms of specimen L-15-y-2.
After manually screening the loading-capture images of the L-y series specimens, a DIC analysis was performed to obtain the maximum strain values in each direction near the main crack before failure. The numerical results are summarized in Table 10. As shown in Table 10, the mean exx values of the L-5-y, L-10-y, and L-15-y specimens are the largest among the strain components, indicating that the specimens primarily failed in tension-shear mode. Moreover, the mean exx values increase with increasing printed layer thickness.
Table 10.
Maximum strain values of L-y series specimens before failure.
4. Theoretical Analysis
4.1. Effect of Loading Direction on Interlayer Shear Mechanism
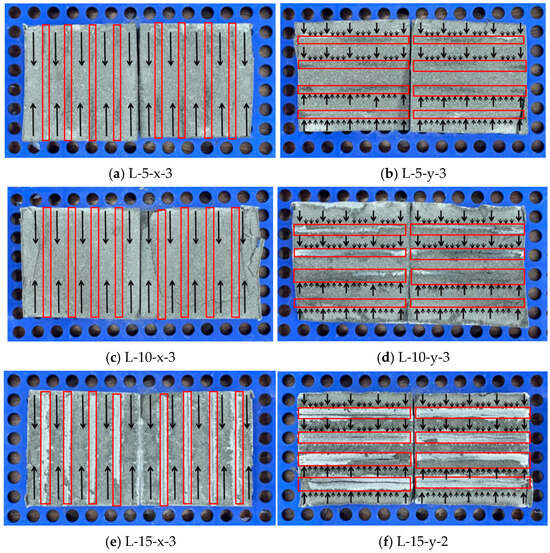
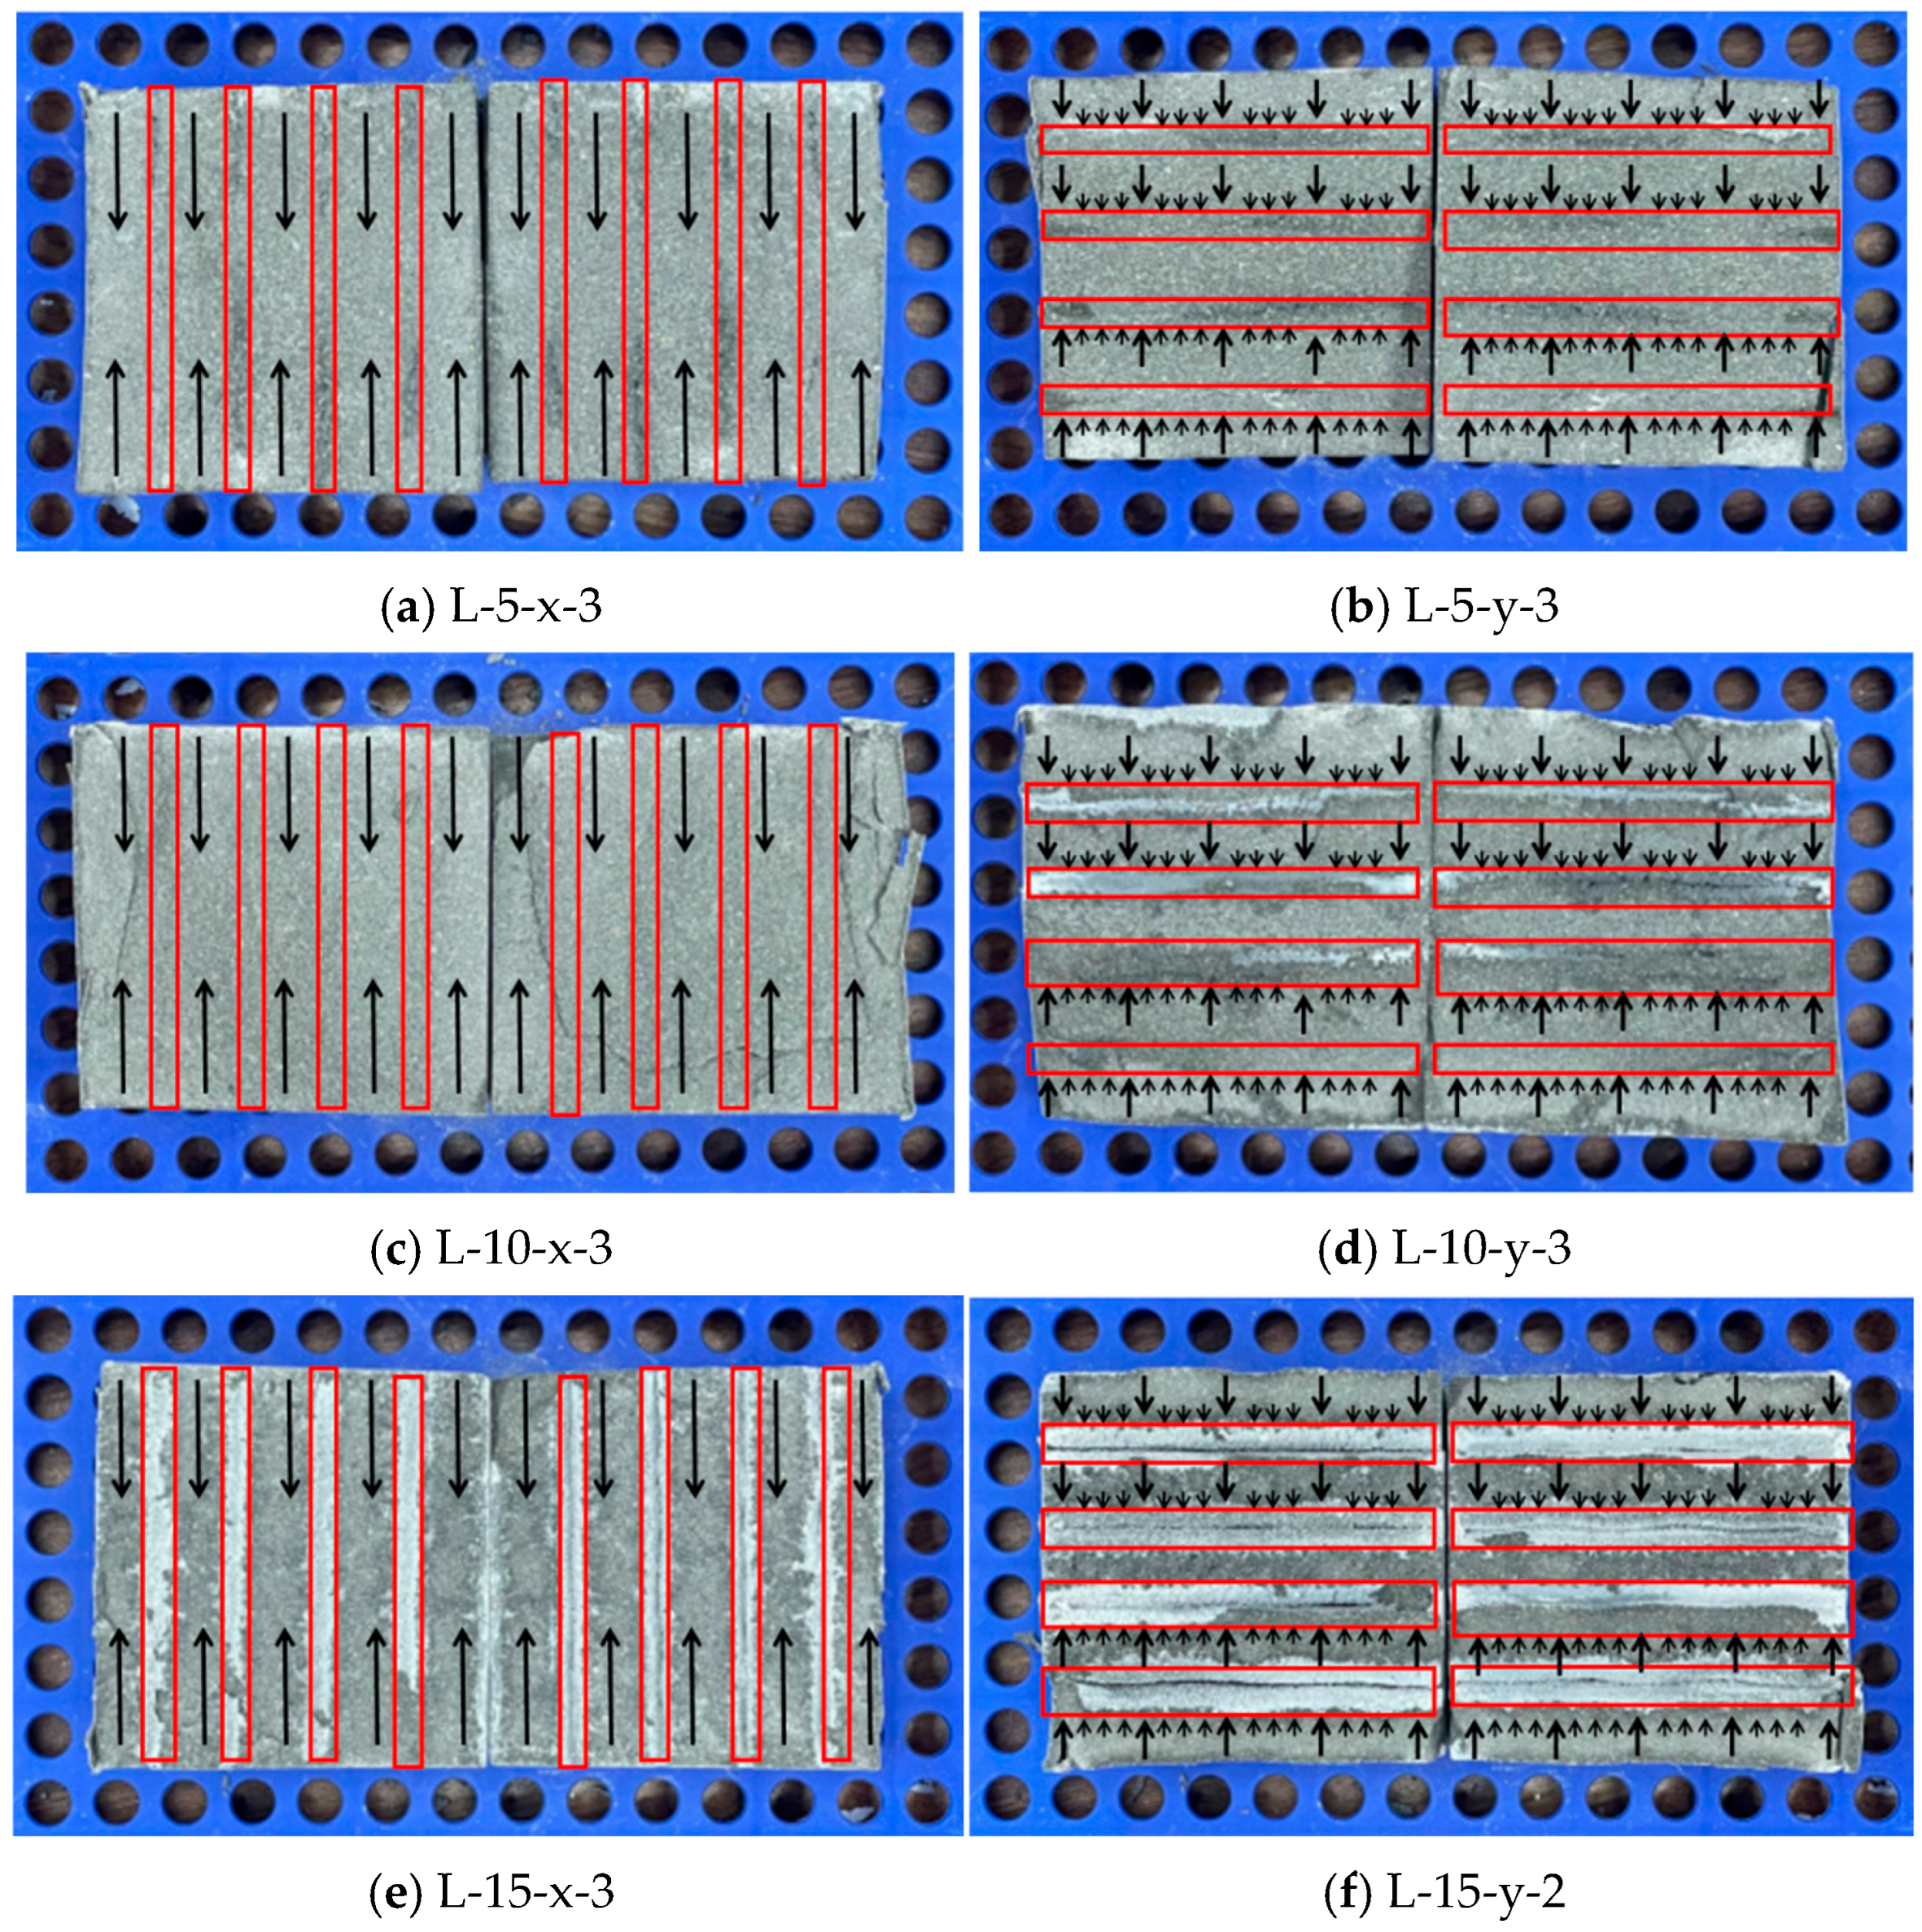
As shown in Figure 19, representative specimens with obvious cracks were selected from each series. The red boxes indicate the void-like gaps formed between adjacent printed layers, and the black arrows represent the direction of the applied shear force.
Figure 19.
Schematic diagram of interlayer interface force action. Note: The red boxes highlight void-like gaps between adjacent printed layers; the black arrows indicate the direction of the applied shear force.
Loading direction had a clear influence on the interlayer shear behavior of the 3DPC specimens. According to the test results, the x-direction specimens consistently exhibited higher shear strength than the corresponding y-direction specimens at the same nominal layer thickness. For the 5 mm, 10 mm, and 15 mm series, the average shear strengths of the x-direction specimens were 9.18 MPa, 7.01 MPa, and 4.88 MPa, respectively, whereas those of the y-direction specimens were 7.87 MPa, 5.29 MPa, and 2.68 MPa, respectively. The x-direction strength was therefore approximately 17%, 33%, and 82% higher than the corresponding y-direction strength. This result indicates that the interlayer shear behavior of 3DPC has evident directional dependence, and this directional difference becomes more pronounced as the nominal layer thickness increases.
When the specimen was loaded in the x direction, the shear force was applied parallel to the continuous extension direction of the printed filaments. Under this condition, the external load could be transferred from the loading end into the specimen along the printed strips, and the shear resistance was jointly provided by the printed mortar matrix and the interlayer bonding regions. Even if local weakly bonded zones or void-like gaps existed near the interlayer interface, the load could still be redistributed through adjacent intact bonded regions and the surrounding mortar matrix. Therefore, the x-direction specimens could maintain a relatively continuous load-transfer state before peak load. In this load-transfer mode, crack propagation needed to overcome both the shear resistance of the mortar matrix and the bonding resistance of the interlayer interface. As a result, the crack was less likely to directly penetrate along a single interlayer plane, and it more often propagated through the matrix or deflected locally near the interface before further extending into the mortar.
In contrast, when the specimen was loaded in the y direction, the shear force was applied perpendicular to the printing path. In this case, the load had to cross the printed filaments and the interlayer bonding regions rather than being transferred along the filament length. The edges of interlayer contact regions and local weak zones therefore became more vulnerable parts of the load-transfer path. Once local stress concentration developed near these weak regions, the load was less able to diffuse sufficiently through the surrounding material, and cracks could initiate more easily from these regions. With further loading, cracks tended to extend along or near the interlayer interface, and then locally deflect into the mortar matrix. This process made the y-direction failure more likely to show combined features of interfacial debonding and matrix shear damage.
The DIC observations are consistent with this load-transfer interpretation. For the x-direction specimens, the strain localization zones were generally related to a dominant crack path, indicating that the deformation before failure was mainly concentrated around the final fracture region. This suggests that the shear-transfer path remained relatively continuous before peak load. For the y-direction specimens, especially in the 10 mm and 15 mm series, the strain fields showed more obvious local concentration and discontinuity. This indicates that the shear-transfer process was more easily interrupted by interlayer weak regions, and that several local damage zones developed before the final crack was formed.
The influence of loading direction became more significant as the nominal layer thickness increased. At a layer thickness of 5 mm, adjacent layers were more sufficiently compressed during deposition, and the interlayer contact was relatively dense. Under this condition, although the x-direction strength was still higher than the y-direction strength, the difference between the two directions was limited. When the nominal layer thickness increased to 10 mm and 15 mm, the interlayer contact became less continuous, and the influence of void-like gaps and weakly bonded regions became more evident. Under y-direction loading, these weak regions were more easily activated because the shear force crossed the printing path and the interlayer contact regions. Therefore, the strength difference between the x and y directions increased with increasing nominal layer thickness.
Overall, the load-transfer path of the L-x specimens can be summarized as “continuous printed filaments–mortar matrix–interlayer bonding regions jointly resisting shear”. Its main characteristics are a relatively continuous load-transfer path, higher crack-propagation resistance, and greater participation of the mortar matrix. By contrast, the load-transfer path of the L-y specimens is closer to “preferential loading of weak interlayer-edge regions–local stress concentration–crack propagation near the interface”. Its main characteristics are a more discontinuous load-transfer path, earlier activation of interface-related defects, and easier crack development along low-strength regions.
4.2. Effect of Layer Thickness Based on Effective Shear Area
The nominal shear strength in the preceding analysis was calculated using the full shear area of 100 mm × 100 mm. However, for 3D-printed concrete, the nominal shear area does not necessarily represent the area that actually participates in shear transfer. Because the specimens were produced by extrusion through a circular nozzle, the deposited filaments were not ideal rectangular layers. Their cross-sectional shape was affected by material extrusion, gravity-induced spreading, and the contact pressure between adjacent layers. As the printed layer thickness increased, the squeezing effect between adjacent filaments became weaker, and the gaps or insufficiently fused regions between printed strips became more evident. As a result, the interlayer region contained both effective bonded areas and ineffective void-like regions, and the proportion of the ineffective regions tended to increase with increasing layer thickness. Therefore, using only the nominal shear area may overestimate the real contact area involved in interlayer shear transfer, especially for specimens with larger printed layer thickness.
To evaluate the influence of this factor, the effective shear area was estimated based on the post-failure morphology and plane-expanded fracture images. The nominal shear area of each specimen was 10,000 mm2. For the L-5 specimens, no obvious large ineffective contact region was observed on the fracture surface, and the effective shear area was therefore taken as 10,000 mm2. For the L-10 specimens, the ineffective area was estimated to be approximately 2000 mm2, and the effective shear area was about 8000 mm2. For the L-15 specimens, the ineffective area increased to approximately 4000 mm2, and the effective shear area decreased to about 6000 mm2. Compared with the L-5 specimens, the effective shear area of the L-10 and L-15 specimens decreased by approximately 20% and 40%, respectively. The formula for calculating the actual shear strength τm is as follows:
Pu is the ultimate shear load, and Am is the actual shear area. Am is obtained by subtracting the internal void area from the specimen shear area AL. The calculated results for each series of specimens are summarized in Table 11.
Table 11.
Summary of relevant test sample information.
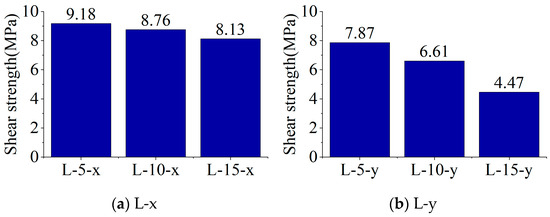
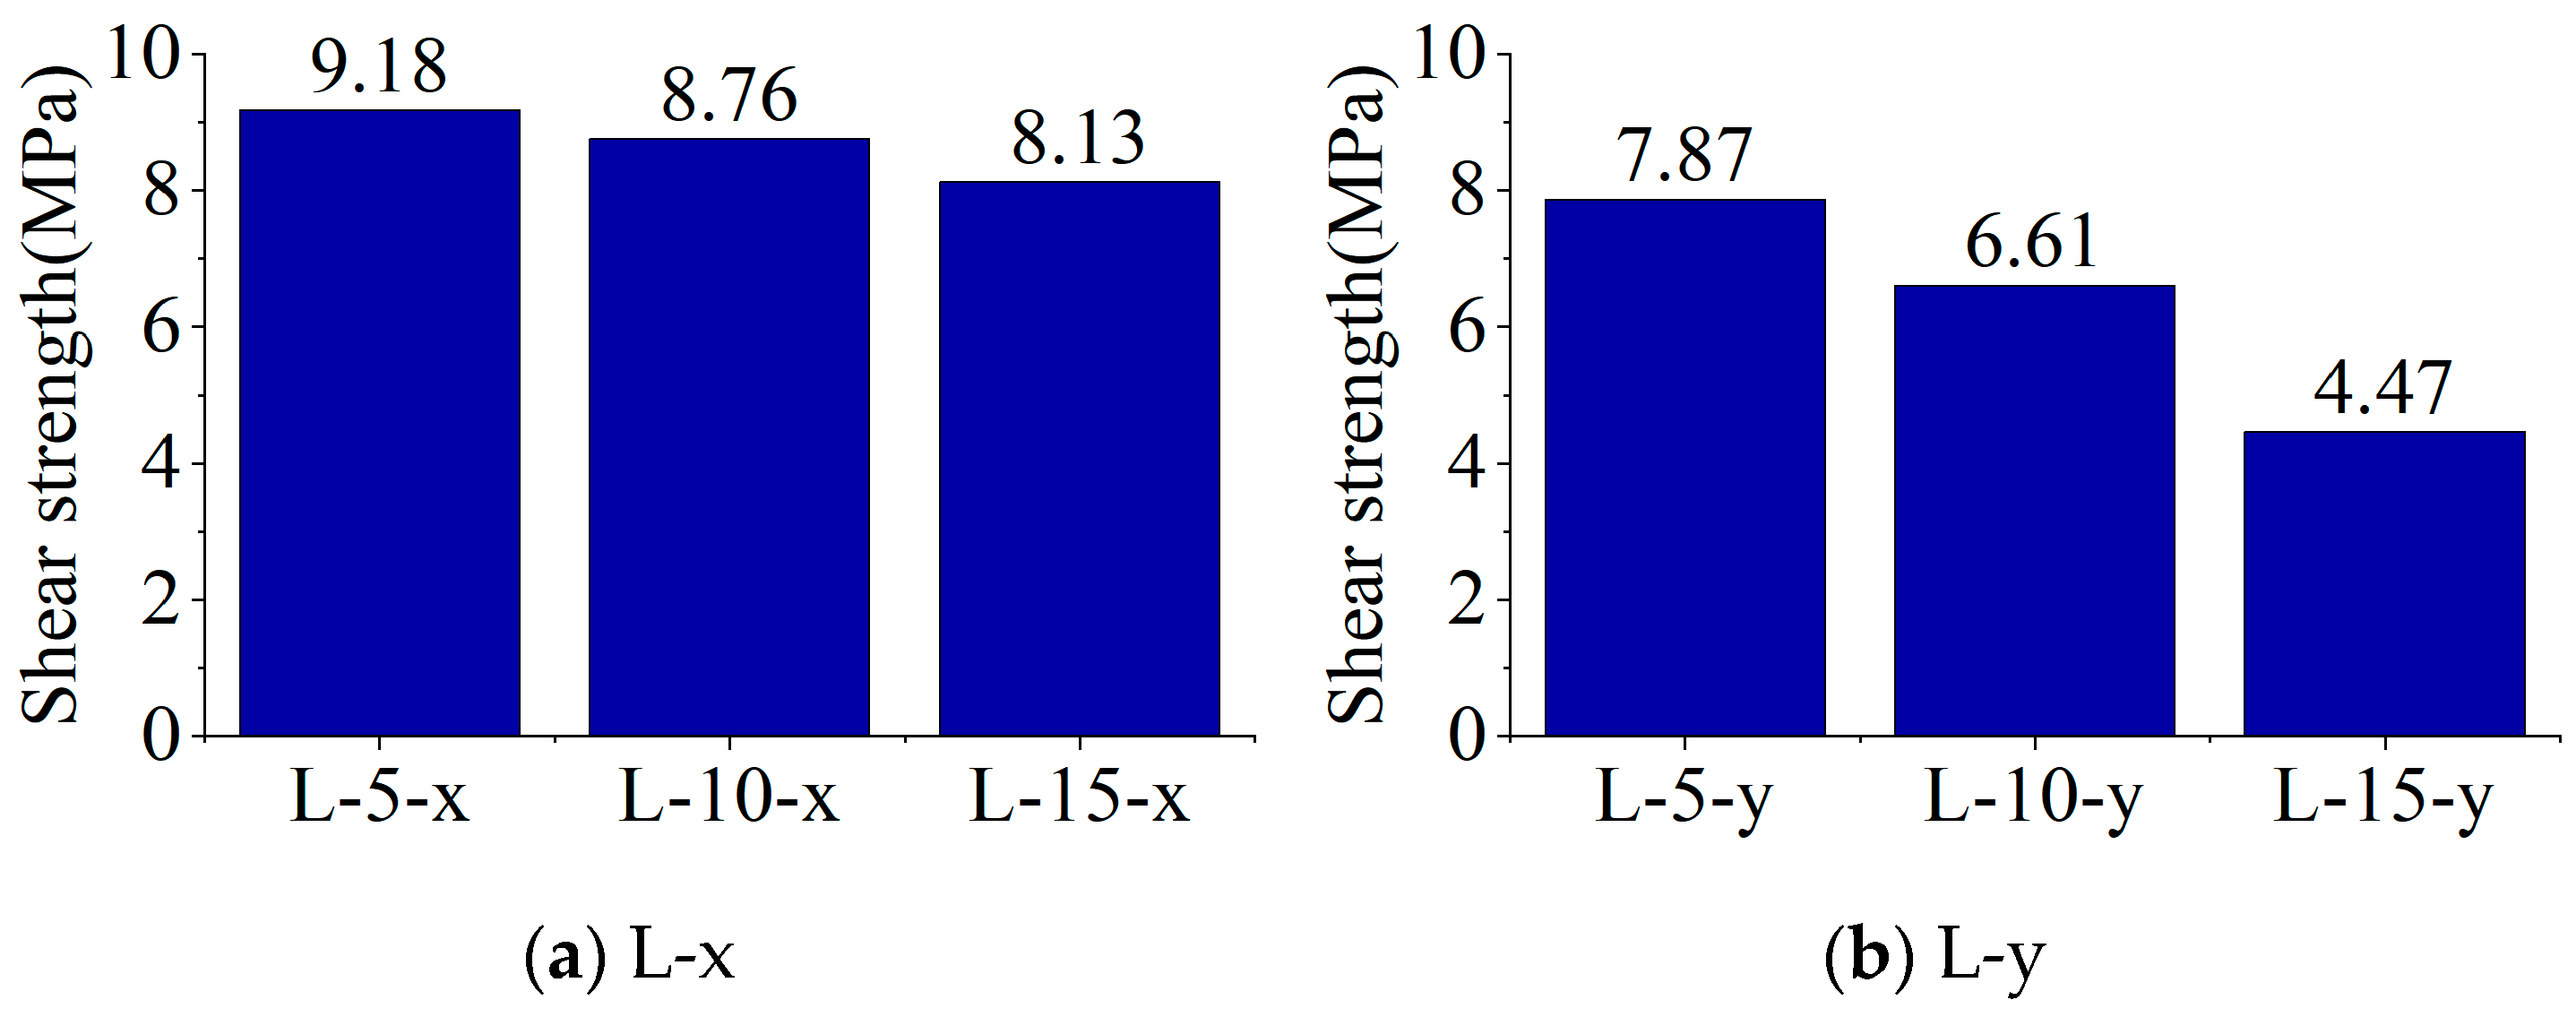
As shown in Figure 20a, after correcting the shear area, the calculated effective shear strengths showed a different trend from the nominal shear strengths. For the x-direction specimens, the effective shear strengths of L-5-x, L-10-x, and L-15-x were 9.18 MPa, 8.76 MPa, and 8.13 MPa, respectively. Compared with the nominal strength reduction, the decrease in the corrected strength was much smaller. This result indicates that the reduction in nominal shear strength of the x-direction specimens was largely associated with the loss of effective contact area. In other words, although the actual interlayer contact area decreased with increasing layer thickness, the remaining bonded regions still retained relatively high unit shear resistance.
Figure 20.
Strength of specimens with different printed layer thicknesses.
As shown in Figure 20b, for the y-direction specimens, the effective shear strengths of L-5-y, L-10-y, and L-15-y were 7.87 MPa, 6.61 MPa, and 4.47 MPa, respectively. Although the corrected strengths were higher than the corresponding nominal values, the decreasing trend was still obvious. Compared with L-5-y, the corrected strength of L-10-y decreased by approximately 16.0%, and that of L-15-y decreased by approximately 43.2%. This indicates that, for the y-direction specimens, the reduction in shear performance cannot be explained only by the decrease in effective shear area. The unit shear resistance of the effective bonded regions also decreased as the layer thickness increased.
This reduction in effective shear area is closely related to the forming mechanism of the printed layers. When the layer thickness was 5 mm, the deposited material was more strongly compressed during layer-by-layer deposition. The adjacent layers were squeezed more sufficiently, and the contact between layers was relatively dense. Under this condition, the interlayer region had a larger bonded area, stronger mechanical interlocking, and a more continuous shear-transfer path. As the layer thickness increased to 10 mm and 15 mm, the flattening and squeezing effect between adjacent layers weakened, making the interlayer contact less continuous. Consequently, more void-like regions and insufficiently fused areas were retained near the interlayer region, reducing the actual contact area between adjacent printed layers. This is reflected by the decrease in effective shear area from 10,000 mm2 to 6000 mm2. More importantly, the increase in layer thickness also changed the mechanical quality of the remaining bonded regions. As the interlayer contact became more discontinuous, the shear load had to be transmitted through separated bonded regions around ineffective void-like areas, resulting in a more uneven stress distribution and making local stress concentration more likely near the edges of ineffective regions. For the x-direction specimens, after excluding the influence of ineffective area, the corrected strengths of different layer-thickness groups became relatively close, indicating that the remaining effective bonded regions could still provide relatively stable shear resistance. For the y-direction specimens, however, the corrected strength still decreased markedly, showing that increasing layer thickness not only reduced the effective contact area but also weakened the shear-transfer efficiency of the remaining bonded regions.
5. Conclusions
In this study, the shear performance of different interlayer interfaces in 3DPC was experimentally investigated through direct shear tests. The failure mechanisms and shear capacity of specimens with varying layer thicknesses and loading orientations were systematically analyzed. Based on the experimental results and observations, the following conclusions can be drawn:
(1) The nominal layer thickness had a clear influence on the interlayer shear strength and filament contact state of 3DPC. When the layer thickness increased from 5 mm to 10 mm and then to 15 mm, the nominal average shear strength in the x direction decreased from 9.18 MPa to 7.01 MPa and 4.88 MPa, respectively. In the y direction, the corresponding values decreased from 7.87 MPa to 5.29 MPa and 2.68 MPa.
(2) Three typical failure modes were observed in the interlayer specimens: interfacial bonding failure, shear failure, and combined interfacial bonding–shear failure. Thin-layer specimens (5 mm) mainly failed by interfacial planar shear, whereas thicker layers (10–15 mm) developed mixed-mode failures characterized by splitting cracks and multi-directional crack propagation. Greater layer height introduces more voids and weaker bonding, promoting three-dimensional crack branching, which explains the greater scatter in their shear capacity and highlights the sensitivity of the interface to printing-induced heterogeneity.
(3) Loading direction had a significant effect on the interlayer shear behavior. At the same nominal layer thickness, the x-direction specimens consistently showed higher nominal shear strength than the corresponding y-direction specimens. The nominal average shear strength in the x direction was approximately 17%, 33%, and 82% higher than that in the y direction for the 5 mm, 10 mm, and 15 mm series, respectively. Under x-direction loading, the shear force was transmitted along the printed filaments, allowing the printed mortar matrix and interlayer bonding regions to jointly resist shear deformation. Under y-direction loading, the shear force crossed the printed path and more easily activated weak interlayer regions, which made local stress concentration more likely.
(4) The effective shear-area analysis showed that the nominal shear area did not fully represent the actual area involved in interlayer shear transfer. Compared with the L-5 specimens, the effective shear area of the L-10 and L-15 specimens decreased by approximately 20% and 40%, respectively. After area correction, the x-direction corrected shear strength decreased by approximately 4.6% and 11.4% for L-10-x and L-15-x, respectively, compared with L-5-x. For the y-direction specimens, the corresponding decreases were approximately 16.0% and 43.2%. The corrected strength still decreased with increasing layer height, indicating that thicker layers not only reduced the effective contact area but also weakened filament compaction and bonding quality.
Future experimental programs should separate variables such as layer thickness, specimen geometry, interface number, and deposition history by either varying specimen dimensions proportionally or testing single-interface specimens to isolate the true effect of layer thickness on bond quality.
Author Contributions
Conceptualization, C.S.; methodology, C.S.; formal analysis, C.S.; investigation, Z.W., Q.L. and A.S.; resources, C.S.; writing—original draft preparation, Z.W.; writing—review and editing, C.S.; visualization, Z.W.; supervision, C.S., A.S. and Q.L.; project administration, C.S.; funding acquisition, C.S. All authors have read and agreed to the published version of the manuscript.
Funding
This research was funded by the National Natural Science Foundation of China, grant number 52478187.
Data Availability Statement
The original contributions presented in this study are included in the article. Further inquiries can be directed to the corresponding author.
Conflicts of Interest
Research was conducted in the absence of any commercial or financial relationships that could be construed as potential conflicts of interest.
References
- Lim, S.; Buswell, R.A.; Le, T.T.; Austin, S.A.; Gibb, A.G.F.; Thorpe, T. Developments in construction-scale additive manufacturing processes. Autom. Constr. 2012, 21, 262–268. [Google Scholar] [CrossRef] [Scilit]
- Adaloudis, M.; Roca, J.B. Sustainability tradeoffs in the adoption of 3D Concrete Printing in the construction industry. J. Clean. Prod. 2021, 307, 127201. [Google Scholar] [CrossRef] [Scilit]
- Zhao, H.-S.; Lie, S.-T.; Zhang, Y. Fracture assessment of mismatched girth welds in oval-shaped clad pipes subjected to bending moment. Int. J. Press. Vessel. Pip. 2018, 160, 1–13. [Google Scholar] [CrossRef] [Scilit]
- Ngo, T.D.; Kashani, A.; Imbalzano, G.; Nguyen, K.T.Q.; Hui, D. Additive manufacturing (3D printing): A review of materials, methods, applications and challenges. Compos. Part B Eng. 2018, 143, 172–196. [Google Scholar] [CrossRef] [Scilit]
- Chen, B.; Zhao, X.; Qian, X. Voxel-based path-driven 3D concrete printing process simulation framework embedding interlayer behavior. Autom. Constr. 2024, 168, 105776. [Google Scholar] [CrossRef] [Scilit]
- Khoshnevis, B.; Hwang, D.; Yao, K.-T.; Yeh, Z. Mega-scale fabrication by contour crafting. Int. J. Ind. Syst. Eng. 2006, 1, 301–320. [Google Scholar] [CrossRef] [Scilit]
- Pessoa, S.; Guimarães, A.S.; Lucas, S.S.; Simões, N. 3D printing in the construction industry—A systematic review of the thermal performance in buildings. Renew. Sustain. Energy Rev. 2021, 141, 110794. [Google Scholar] [CrossRef] [Scilit]
- Baz, B.; Aouad, G.; Leblond, P.; Al-Mansouri, O.; D’Hondt, M.; Remond, S. Mechanical assessment of concrete–Steel bonding in 3D printed elements. Constr. Build. Mater. 2020, 256, 119457. [Google Scholar] [CrossRef] [Scilit]
- Pham, L.; Tran, P.; Sanjayan, J. Steel fibres reinforced 3D printed concrete: Influence of fibre sizes on mechanical performance. Constr. Build. Mater. 2020, 250, 118785. [Google Scholar] [CrossRef] [Scilit]
- Ivanova, I.; Ivaniuk, E.; Bisetti, S.; Nerella, V.N.; Mechtcherine, V. Comparison between methods for indirect assessment of buildability in fresh 3D printed mortar and concrete. Cem. Concr. Res. 2022, 156, 106764. [Google Scholar] [CrossRef] [Scilit]
- Marchment, T.; Sanjayan, J. Mesh reinforcing method for 3D Concrete Printing. Autom. Constr. 2020, 109, 102992. [Google Scholar] [CrossRef] [Scilit]
- Chung, S.-Y.; Stephan, D.; Elrahman, M.A.; Han, T.-S. Effects of anisotropic voids on thermal properties of insulating media investigated using 3D printed samples. Constr. Build. Mater. 2016, 111, 529–542. [Google Scholar] [CrossRef] [Scilit]
- Wang, L.; Jiang, H.; Li, Z.; Ma, G. Mechanical behaviors of 3D printed lightweight concrete structure with hollow section. Arch. Civ. Mech. Eng. 2020, 20, 16. [Google Scholar] [CrossRef] [Scilit]
- Hager, I.; Golonka, A.; Putanowicz, R. 3D Printing of Buildings and Building Components as the Future of Sustainable Construction? Procedia Eng. 2016, 151, 292–299. [Google Scholar] [CrossRef] [Scilit]
- Panda, B.; Paul, S.C.; Mohamed, N.A.N.; Tay, Y.W.D.; Tan, M.J. Measurement of tensile bond strength of 3D printed geopolymer mortar. Measurement 2018, 113, 108–116. [Google Scholar] [CrossRef] [Scilit]
- Geng, Z.; She, W.; Zuo, W.; Lyu, K.; Pan, H.; Zhang, Y.; Miao, C. Layer-interface properties in 3D printed concrete: Dual hierarchical structure and micromechanical characterization. Cem. Concr. Res. 2020, 138, 106220. [Google Scholar] [CrossRef] [Scilit]
- Di Carlo, T.; Khoshnevis, B.; Carlson, A. Experimental and numerical techniques to characterize structural properties of fresh concrete. In Proceedings of the ASME 2013 International Mechanical Engineering Congress and Exposition, San Diego, CA, USA, 15–21 November 2013; American Society of Mechanical Engineers: New York, NY, USA, 2013; p. V009T10A062. [Google Scholar]
- Siddika, A.; Mamun, M.A.A.; Ferdous, W.; Saha, A.K.; Alyousef, R. 3D-printed concrete: Applications, performance, and challenges. J. Sustain. Cem.-Based Mater. 2020, 9, 127–164. [Google Scholar] [CrossRef] [Scilit]
- Hwang, D. Experimental Study of Full Scale Concrete Wall* Construction Using Contour Crafting; University of Southern California: Los Angeles, CA, USA, 2005. [Google Scholar]
- Moelich, G.M.; Kruger, J.; Combrinck, R. Modelling the interlayer bond strength of 3D printed concrete with surface moisture. Cem. Concr. Res. 2021, 150, 106559. [Google Scholar] [CrossRef] [Scilit]
- Thamboo, J.A.; Dhanasekar, M.; Yan, C. Flexural and shear bond characteristics of thin layer polymer cement mortared concrete masonry. Constr. Build. Mater. 2013, 46, 104–113. [Google Scholar] [CrossRef] [Scilit]
- Wang, H.; Jin, K.; Tao, J. Improving the interfacial shear strength of carbon fibre and epoxy via mechanical interlocking effect. Compos. Sci. Technol. 2020, 200, 108423. [Google Scholar] [CrossRef] [Scilit]
- Javan, A.R.; Seifi, H.; Lin, X.; Xie, Y.M. Mechanical behaviour of composite structures made of topologically interlocking concrete bricks with soft interfaces. Mater. Des. 2020, 186, 108347. [Google Scholar] [CrossRef] [Scilit]
- Molotnikov, A.; Gerbrand, R.; Qi, Y.; Simon, G.P.; Estrin, Y. Design of responsive materials using topologically interlocked elements. Smart Mater. Struct. 2015, 24, 025034. [Google Scholar] [CrossRef] [Scilit]
- Hao, J.; Xu, L.; Wu, X.; Li, X. Analysis and modeling of the dowel connection in wood T type joint for optimal performance. Compos. Struct. 2020, 253, 112754. [Google Scholar] [CrossRef] [Scilit]
- Khandelwal, S.; Siegmund, T.; Cipra, R.J.; Bolton, J.S. Scaling of the elastic behavior of two-dimensional topologically interlocked materials under transverse loading. J. Appl. Mech. 2014, 81, 031011. [Google Scholar] [CrossRef] [Scilit]
- Dyskin, A.V.; Pasternak, E.; Estrin, Y. Mortarless structures based on topological interlocking. Front. Struct. Civ. Eng. 2012, 6, 188–197. [Google Scholar] [CrossRef] [Scilit]
- Rahul, A.V.; Santhanam, M.; Meena, H.; Ghani, Z. Mechanical characterization of 3D printable concrete. Constr. Build. Mater. 2019, 227, 116710. [Google Scholar] [CrossRef] [Scilit]
- Ma, G.; Salman, N.M.; Wang, L.; Wang, F. A novel additive mortar leveraging internal curing for enhancing interlayer bonding of cementitious composite for 3D printing. Constr. Build. Mater. 2020, 244, 118305. [Google Scholar] [CrossRef] [Scilit]
- Liu, Z.; Wang, Z.; Wang, L.; Zhao, X. Interlayer bond strength of 3D printing cement paste by cross-bonded method. J. Chin. Ceram. Soc. 2019, 47, 648–652. [Google Scholar]
- Ma, G.; Li, Z.; Wang, L.; Wang, F.; Sanjayan, J. Mechanical anisotropy of aligned fiber reinforced composite for extrusion-based 3D printing. Constr. Build. Mater. 2019, 202, 770–783. [Google Scholar] [CrossRef] [Scilit]
- D’Andrea, A.; Tozzo, C. Interlayer Shear Failure Evolution with Different Test Equipments. Procedia-Soc. Behav. Sci. 2012, 53, 556–567. [Google Scholar] [CrossRef] [Scilit]
- Liu, G.; Lu, W.; Lou, Y.; Pan, W.; Wang, Z. Interlayer shear strength of Roller compacted concrete (RCC) with various interlayer treatments. Constr. Build. Mater. 2018, 166, 647–656. [Google Scholar] [CrossRef] [Scilit]
- Tian, J.; Wu, X.; Zheng, Y.; Hu, S.; Du, Y.; Wang, W.; Sun, C.; Zhang, L. Investigation of interface shear properties and mechanical model between ECC and concrete. Constr. Build. Mater. 2019, 223, 12–27. [Google Scholar] [CrossRef] [Scilit]
- Zhao, Z.F.; Zhao, G.F.; Huang, C.K. Research on the tension shear behavior of the adhesion of young and old concrete. J. Build. Struct. 1999, 20, 26–31. [Google Scholar]
- Li, S.; Hung, N.-X.; Tran, P. Digital design and parametric study of 3D concrete printing on non-planar surfaces. Autom. Constr. 2023, 145, 104624. [Google Scholar] [CrossRef] [Scilit]
- Daneshvar, D.; Rabiei, M.; Gupta, S.; Najmeddine, A.; Prihar, A.; Moini, R. Geometric fidelity of interlocking bodies in two-component robotic additive manufacturing. In Proceedings of the RILEM International Conference on Concrete and Digital Fabrication, Munich, Germany, 4–6 September 2024; Springer Nature: Cham, Switzerland, 2024. [Google Scholar]

Disclaimer/Publisher’s Note: The statements, opinions and data contained in all publications are solely those of the individual author(s) and contributor(s) and not of MDPI and/or the editor(s). MDPI and/or the editor(s) disclaim responsibility for any injury to people or property resulting from any ideas, methods, instructions or products referred to in the content. |
© 2026 by the authors. Licensee MDPI, Basel, Switzerland. This article is an open access article distributed under the terms and conditions of the Creative Commons Attribution (CC BY) license.