


Abstract
Decarbonizing the built environment depends not only on improving operational efficiency but also on how supply is formed along the construction chain. Carbon pricing may reshape that process through upstream material costs, financing conditions, and project timing, yet evidence on the timing and stability remains limited. This study examines how carbon-price shocks are transmitted to construction activity in China and whether this transmission changed after the launch of the national emissions trading system (ETS) in July 2021. Using monthly data from January 2014 to October 2025, the analysis first applies additive Bayesian network (ABN) structure learning to identify links among carbon-market conditions, material costs, finance, and construction activity and then estimates a time-varying structural vector autoregression (TVP-SVAR) to trace dynamic responses across regimes. The results show that carbon-price shocks mainly depress housing starts and area under construction at medium horizons, especially around 6–12 months, with stronger contraction around the 2021 transition and easing later. Allowance trading volume responds positively on impact, but this sensitivity weakens in the post-2021 period. Forecast error variance decompositions further show that carbon-price shocks become an important source of medium- and long-horizon fluctuations. At the 12-month horizon, they account for 18.7% and 18.4% of the forecast-error variance of housing starts in the pre- and post-2021 regimes, and 13.7% and 10.8% of that of trading volume. Overall, the findings point to a project-cycle channel through which carbon pricing reshapes built-environment supply formation, with implications for procurement, transition finance, and the evaluation of carbon-market effectiveness in construction.
1. Introduction
Decarbonizing the built environment is not only about reducing operational energy use. It also depends on how the built environment is supplied—what materials are produced, how projects are delivered, and when construction begins. A large share of emissions is embedded upstream in construction activities and in the production and supply of carbon-intensive materials such as cement and steel. Recent synthesis work highlights the scale of this challenge: the buildings and construction sector accounts for a substantial share of global energy use and CO2 emissions, while cement- and steel-related emissions and construction waste remain persistent concerns [1]. In this context, construction activity is a direct part of the decarbonization problem, not simply a macroeconomic backdrop.
Carbon constraints are increasingly transmitted to this supply side through price signals and compliance costs. When carbon prices feed into energy inputs, material prices, and financing conditions, firms may adjust procurement, production plans, and the timing of project starts. The central question here is straightforward: through which links does a carbon price shock move along the construction supply chain, and how strongly does it translate into changes in construction-related activity?
China provides a useful setting for examining this issue because both policy and market institutions have been changing rapidly. The 2024–2025 Action Plan for Energy Saving and Carbon Reduction strengthened the policy basis for low-carbon adjustment in the building-materials industry and the building sector [2]. Carbon market regulation has also become more formalized, especially with the Interim Regulations on the Administration of Carbon Emissions Trading coming into effect on 1 May 2024 [3]. At the same time, updated government procurement policies for green buildings and green building materials make it more plausible that environmental constraints influence project decisions through costs, demand expectations, and access to finance [4,5]. Similar policy signals can also be observed internationally, including the strengthening of building-level and product-level rules in the EU and updated energy-efficiency requirements in California [6,7,8]. Together, these developments make China an appropriate setting for examining how carbon price shocks are transmitted to construction activity.
Testing this mechanism empirically is not straightforward. The relevant indicators form a high-dimensional and tightly connected system, spanning carbon-market conditions, input costs, construction activity, and financing conditions. Conventional specification often relies heavily on researcher judgment when deciding which variables and links to retain. This makes it difficult to justify system boundaries in a setting where causality may run in both directions: construction cycles can influence emissions demand and allowance-price expectations, while carbon prices can affect production, procurement, and investment through cost, substitution, and policy-expectation channels. A more transparent empirical strategy is therefore needed to reduce arbitrariness in variable selection while still allowing dynamic structural transmission to be identified.
To study this question, the paper proceeds in two steps. It first considers a broad candidate set covering carbon-market variables, input costs, financial conditions, and construction activity and lets the data identify the core links most relevant to carbon-price movements. It then traces how a carbon-price shock propagates through that reduced system and asks whether the response pattern changed with the transition to China’s national emissions trading system (ETS). The focus is therefore not on carbon prices as an isolated market outcome but on whether carbon-price signals are translated into observable adjustments in built-environment supply formation, especially project initiation, ongoing construction, and the timing of delivery. The rest of the paper is organized as follows. Section 2 reviews the literature. Section 3 describes the data and variables. Section 4 presents the empirical strategy. Section 5 reports the main results. Section 6 provides robustness checks. Section 7 discusses the implications for built-environment decarbonization. Section 8 concludes.
2. Literature Review
This section reviews the literature most relevant to carbon pricing and construction activity. It focuses on four issues: why construction activity is an appropriate outcome in the built-environment context, through which channels carbon price shocks may affect construction, what the existing evidence has shown, and why a dynamic structural framework is needed to address the remaining gaps.
2.1. Construction Activity Indicators Capture Built-Environment Supply Formation and Connect Embodied Carbon to the Supply Chain
A substantial share of built-environment emissions is embodied in upstream material production and on-site construction rather than in building operation alone. Life-cycle assessment studies consistently show that embodied energy use and greenhouse gas emissions are concentrated in the early stages of the building life cycle and become increasingly important as operational emissions decline [9,10,11,12]. They also show that estimated embodied carbon is sensitive to system boundaries, data sources, and methodological assumptions [11,12].
Against this background, construction activity provides a direct way to connect carbon-related constraints to the formation of built-environment supply. Indicators such as new starts and area under construction reflect when material demand is generated and how projects move through the construction process. Existing studies have examined carbon-related issues from the perspectives of building design and cost management, as well as carbon-price formation and market dynamics [13,14,15], but fewer studies use construction activity indicators as the main outcomes when examining how carbon-related shocks affect the supply side of the built environment. This gap matters because carbon constraints may influence not only emissions but also the timing and intensity of construction.
2.2. Carbon Price Shocks May Affect Construction Through Costs, Finance, Expectations, and Project-Cycle Adjustment
Carbon-price shocks may affect construction activity through a staged and mainly indirect transmission process. Prior studies show that carbon prices are shaped not only by allowance scarcity and compliance conditions but also by broader macroeconomic dynamics, energy-market conditions, inter-market relationships, and policy information [14,15,16]. In the current institutional setting, the construction sector is not directly exposed to carbon compliance obligations in the same way as covered emitting industries. The relevant mechanism is therefore less a direct compliance channel at the project level than a cost-and-finance pass-through channel that originates from carbon-intensive upstream sectors and then reaches construction decisions through procurement, financing, and project timing. This distinction is important because it implies that the response of construction activity is unlikely to be immediate. Instead, carbon-price shocks are expected to influence built-environment supply formation through lagged adjustments in input costs, financing conditions, and expectations.
The first pathway is the upstream cost channel. Carbon prices can alter the cost environment of energy- and material-intensive industries, especially where electricity, coal, cement, steel, and glass are closely connected to construction inputs. Existing evidence on emissions trading and carbon-intensive industries shows that carbon-related costs can be passed through to product prices, although the extent of pass-through differs across sectors and institutional settings [17,18]. When carbon-related costs are transmitted to producer prices, contractors and developers may face higher expected procurement costs, narrower project margins, or greater uncertainty in material purchasing. These pressures can affect tendering, procurement timing, and the willingness to initiate new projects. In this sense, housing starts provide an observable indicator of whether carbon-related cost signals are translated into project entry decisions, while area under construction reflects how such signals are absorbed within the ongoing construction pipeline.
The second pathway operates through financial conditions and risk pricing. Carbon-market movements are linked to energy-market risk spillovers and broader uncertainty conditions, and these relationships can vary over time [19,20]. Construction projects are capital-intensive and typically depend on external financing, staged payments, and expectations about future cash flows. Carbon-price shocks may interact with broader market risk, policy uncertainty, and lender assessment of transition exposure. If carbon-related cost uncertainty raises perceived project risk or tightens funding conditions, developers may postpone new starts, slow the pace of ongoing construction, or reallocate resources toward less exposed projects. The financial channel therefore provides a mechanism through which carbon-market signals can affect construction activity even when construction firms are not directly regulated by the emissions trading system.
The third pathway is the expectation and project-cycle channel. Construction decisions are forward-looking and involve long lead times between planning, procurement, financing, construction, and completion. Because carbon-price movements may contain information about energy costs, policy credibility, and transition-related uncertainty [14,15,16,20], they may change expectations about future material costs, regulatory credibility, and demand for low-carbon inputs. However, because procurement contracts, financing arrangements, and construction schedules cannot be adjusted instantly, the effect should appear more clearly at medium horizons than on impact. This project-cycle logic suggests that carbon-price shocks may first be absorbed through market and financial variables before becoming visible in housing starts and area under construction.
Taken together, these mechanisms imply that carbon pricing should not be evaluated only by immediate changes in trading volume or short-run construction indicators. The cited literature supports the plausibility of macro-energy linkages, cost pass-through, risk spillovers, and policy-uncertainty channels [14,15,16,17,18,19,20], while the direct construction response is examined empirically in this study through the ABN-informed TVP-SVAR framework. A more appropriate test is therefore whether carbon-price shocks are associated with systematic medium-horizon changes in the formation of built-environment supply. This provides the conceptual basis for using construction activity indicators as project-cycle outcomes and for tracing the transmission of carbon-price shocks through a dynamic system that includes carbon-market conditions, upstream costs, financial conditions, and construction activity.
2.3. Carbon Policy Is Broadly Effective, but Its Transmission to Construction Activity Remains Insufficiently Studied
A growing body of research shows that emissions trading can reduce emissions without producing uniformly large adverse effects on firm performance [21]. Related work also suggests that carbon market incentives can encourage cleaner technological change and longer-term industrial adjustment [22]. These findings provide broad support for the effectiveness of market-based climate policy.
At the same time, the Chinese context differs from more mature carbon markets, and the interpretation of carbon price signals may change across institutional stages. Research on the first compliance cycle of China’s national ETS highlights the role of market design and trading conditions in shaping price formation [23]. This implies that the economic meaning of carbon price shocks may not be stable over time.
For the construction sector, existing studies have examined life-cycle carbon costs under carbon policy, construction-related responses to emissions trading, carbon trading implementation, embodied carbon mitigation, green innovation, and policy-mix effects from engineering, industrial, and system perspectives [24,25,26,27,28,29,30]. Recent work has also examined interactions between carbon prices and China’s construction industry within a structural time-series framework [26]. Taken together, these studies confirm that carbon policy is relevant to construction-related emissions and the sector’s low-carbon transition, while also showing that sectoral responses are shaped by implementation constraints, heterogeneous policy effects, innovation responses, and cross-sector spillovers [27,28,29,30]. As a result, the dynamic effects of carbon price changes on new starts, area under construction, and related market activity remain insufficiently understood.
2.4. Existing Methods Are Informative, While a Regime-Aware Dynamic Structural Framework Helps Address the Remaining Gaps
Related empirical work mainly includes policy evaluation studies and reduced-form time-series analyses. The latter is widely used to characterize co-movements, volatility spillovers, and directional linkages across markets [31,32,33]. These approaches are informative, but they are less suited to identifying how different types of carbon price shocks are transmitted through a system that jointly involves costs, finance, carbon-market conditions, and construction activity.
A structural time-series framework is therefore more appropriate for the present question. Time-varying structural VAR models allow coefficients and shock variances to evolve over time, which is important when institutional change may alter both transmission patterns and shock importance [34,35]. In addition, changepoint detection offers a transparent way to identify structural breaks and avoid arbitrary sample partitioning [36,37].
A further issue concerns variable selection. In a construction–carbon–finance system, the number of potentially relevant variables is large, and conventional specification often depends heavily on researcher judgment. Additive Bayesian networks can help reduce this arbitrariness by extracting robust conditional dependence structures from a broader candidate set [38]. Used in this way, structure learning helps discipline system construction before dynamic estimation.
Overall, the literature still provides limited evidence that jointly addresses variable selection, institutional stage heterogeneity, and time-varying structural transmission in the construction–carbon market nexus. To address these gaps, this study combines additive Bayesian network (ABN)-based structure learning with a regime-aware time-varying parameter structural vector autoregression (TVP-SVAR) framework. The ABN stage is used to discipline variable selection in a high-dimensional system, while the subsequent structural analysis is used to trace how carbon-price shocks propagate across institutional stages and over different horizons.
3. Data and Variables
3.1. Sample, Data Sources, and Study Window
This study uses a monthly dataset that combines carbon-market, upstream cost, macro-financial, terminal-price, and construction-activity variables. The raw merged dataset covers January 2013 to October 2025. Because the early stage of China’s pilot carbon markets contains incomplete carbon-market trading records and several producer price indicators are also incomplete in 2013, the empirical analysis is conducted on a balanced monthly sample from January 2014 to October 2025. The final sample contains 142 monthly observations.
The carbon-market variables are carbon price and carbon allowance trading volume. To maintain comparability between the pilot-market period and the national ETS period, this study constructs unified national monthly series. During the pilot-market period, the series are compiled from seven pilot carbon markets, excluding Fujian. From July 2021 onward, national ETS transaction information is incorporated to represent the national market stage. Carbon price is measured in CNY/tCO2, while allowance trading volume is measured in tons. The carbon-price series is used to represent the market-wide carbon-cost signal, whereas trading volume is used to capture market activity and liquidity.
Construction activity is measured using three monthly area-based indicators published by the National Bureau of Statistics: housing starts, area under construction, and completed floor area. These variables capture different stages of the project cycle: project initiation, the ongoing construction pipeline, and project delivery. Because the research question concerns built-environment supply formation, housing starts and area under construction are treated as the main construction outcomes in the subsequent analysis.
The upstream cost channel is represented by producer price indicators related to energy and construction materials. These include electricity-related PPI, coal-related PPI, cement-related PPI, steel-related PPI, glass-related PPI, and the aggregate producer price index. These variables are retained in their published year-on-year index form. The macro-financial block includes the three-month Shibor, the RMB/USD exchange rate, and the VIX index, which capture funding costs, exchange-rate conditions, and global risk sentiment, respectively. The terminal-price environment is represented by a composite house-price index based on the price indices of new commercial housing in 70 large- and medium-sized cities.
An institutional regime dummy, denoted as DETS, is used to represent the transition from the pilot-market period to the national ETS period. It equals 0 from January 2014 to June 2021 and 1 from July 2021 onward. July 2021 is used as an institutional transition anchor rather than as evidence of an instantaneous structural break. This coding is used to define regime-aware carbon-price shock carriers in the later empirical framework.
Table 1 reports the definitions, units, and data sources of the variables.
Table 1.
Definitions, units, and data sources of the variables.
3.2. Variables and Measurement
The analysis begins with a broad set of candidate indicators covering carbon markets, cost conditions, macro-financial conditions, terminal prices, and construction activity. The final reduced system is selected later through structure learning, but the candidate variables are defined here.
The construction of the unified carbon-market series follows the need to maintain a consistent carbon-price signal across two institutional stages: the pilot ETS period and the national ETS period. During the pilot period, the carbon-price series is compiled from seven pilot carbon markets. Daily market information is first aggregated within each pilot market and then combined across pilot markets using trading-volume-based weights. This procedure gives greater weight to markets with higher trading activity and is intended to capture the market-wide carbon-cost signal rather than the price movement of a single pilot market.
From July 2021 onward, the national ETS is incorporated into the unified series using the same aggregation logic. The resulting carbon-price variable therefore represents a continuous monthly carbon-cost signal across the pilot-market and national-market stages. The trading-volume variable is constructed to capture the corresponding allowance-market activity and liquidity conditions. In the empirical analysis, both carbon price and trading volume are transformed using natural logarithms and then standardized before entering the ABN and TVP-SVAR models.
This construction strategy is used for comparability rather than to claim that all pilot and national carbon markets were institutionally identical. The pilot markets differed in coverage, liquidity, and trading rules, while the national ETS represented a new stage of market organization after July 2021. The unified series is therefore interpreted as a market-wide carbon-price signal suitable for national monthly time-series analysis, and the regime-aware design later allows the transmission of carbon-price shocks to differ before and after the national ETS transition.
The cost channel is represented by industry-level producer price indices (PPIs) published by the National Bureau of Statistics. The candidate set includes PPIs closely related to energy and construction-material costs, specifically electricity, coal, cement, steel, and glass. These series are kept in their published year-on-year index form.
Construction activity is measured using three monthly area-based indicators published by the National Bureau of Statistics: housing starts, area under construction, and completed floor area. These variables capture project initiation, the stock of ongoing construction, and final delivery, respectively. Because this study focuses on supply formation, housing starts and area under construction receive the greatest attention in the later analysis.
To reflect downstream price conditions, the study also uses a national composite house-price index based on the monthly price indices of new commercial housing in 70 large- and medium-sized cities. This variable is included to capture the terminal price environment faced by the construction supply chain rather than to proxy for construction activity itself.
A broader set of macro-financial variables is included to capture background conditions. These variables include the overall producer price index, the three-month Shibor, the RMB/USD exchange rate, and the VIX. Within the network framework, they are treated as background macro-financial conditions rather than as mechanical controls.
To represent institutional change, the study defines an ETS regime dummy, DETS, which equals 0 up to June 2021 and 1 from July 2021 onward. This variable captures the transition from the pilot-market period to the national ETS period and allows later stages of the empirical framework to account for institutional differences more explicitly.
3.3. Data Treatment
To improve comparability and numerical stability, the variables are processed before entering the empirical models. Natural logarithms are applied to strictly positive variables that are more naturally interpreted in proportional terms, including carbon price, allowance trading volume, housing starts, area under construction, completed floor area, and the composite house-price index. The producer price indices, Shibor, the RMB/USD exchange rate, and the VIX are retained in levels so that their original index, rate, or risk-sentiment meanings are preserved.
After the logarithmic transformation, all continuous variables are standardized using the sample mean and standard deviation over the balanced sample period. The institutional dummy DETS is not standardized and remains a binary variable. This treatment removes scale differences across variables and improves the numerical stability of the ABN estimation and the TVP-SVAR input construction, while preserving the economic interpretation of the variables as carbon-market, cost, financial, terminal-price, and construction-activity indicators.
The ABN-ready dataset excludes the date variable and contains only the standardized analytical variables and the institutional dummy. The TVP-SVAR input is then constructed from the ABN-informed reduced system. This sequential treatment ensures that the same cleaned and aligned monthly sample is used consistently across the structure-learning and dynamic-transmission stages.
4. Empirical Approach
4.1. Identification Strategy
This study adopts a two-stage empirical strategy to examine how carbon-price shocks are transmitted through built-environment supply formation. The two stages are designed to serve different but connected purposes. The ABN stage addresses the system-construction problem, while the TVP-SVAR stage addresses the dynamic-transmission problem. This distinction is central to the identification strategy.
In the first stage, ABN structure learning is used to discipline variable selection and to identify an empirically supported network backbone from a broader set of theoretically relevant variables. The construction–carbon–finance system contains many potentially connected indicators, including carbon-market variables, upstream cost indicators, financial conditions, terminal prices, and construction-activity measures. Estimating a dynamic structural model with all candidate variables would increase dimensionality and make the specification heavily dependent on researcher judgment. The ABN stage reduces this arbitrariness by identifying conditional dependence relationships around the carbon-price node. Its purpose is not to establish definitive causal directions but to provide a transparent and reproducible basis for selecting a compact and economically interpretable subsystem.
In the second stage, the TVP-SVAR model is estimated on the reduced system informed by the ABN backbone. This stage provides the dynamic structural analysis that the ABN alone cannot provide. Specifically, TVP-SVAR allows coefficients and shock variances to evolve over time, which is necessary when carbon-market institutions, policy credibility, market depth, and construction-sector exposure may change across the sample period. The model is then used to trace impulse responses and forecast error variance decompositions, thereby evaluating the timing, direction, persistence, and relative importance of carbon-price shocks.
The link between the two stages is therefore explicit. The ABN stage defines the empirically supported structure of the system and helps organize the variables into economically meaningful blocks. The TVP-SVAR stage uses this structured system to estimate regime-aware dynamic responses. In this sense, the ABN does not replace structural identification, and the TVP-SVAR is not specified independently of the network evidence. The combined framework is used to reduce ad hoc system construction while preserving the ability to examine time-varying shock transmission.
This design is particularly suitable for the present research question. If the objective were only to describe contemporaneous associations, the ABN stage would be sufficient. If the objective were only to estimate impulse responses, a conventional SVAR could be used. However, the question here requires both a transparent way to construct the construction–carbon–finance system and a dynamic framework capable of evaluating how transmission changes around the national ETS transition. The ABN-TVP-SVAR framework is therefore used as a sequential design: structure learning first, regime-aware dynamic transmission analysis second.
4.2. ABN-Based Structure Learning
4.2.1. Conceptual Model for ABN-Based Structure Learning
Before implementing the ABN structure-learning procedure, we define a conceptual model that maps the theoretical transmission mechanism into a set of observable nodes. The purpose of this conceptual model is to clarify what each group of variables represents and how the Bayesian network is used in this study. The ABN is not treated as a standalone causal model. Instead, it is used to identify conditional dependence relationships among theoretically relevant variables and to support the construction of a compact dynamic system for the subsequent TVP-SVAR analysis.
The candidate nodes are organized into five conceptual blocks. The first block is the carbon-market block, represented by carbon price and allowance trading volume. Carbon price captures the market-wide carbon-cost signal, while trading volume reflects market activity and liquidity. The second block is the upstream cost block, represented by producer price indicators related to energy and construction materials. These variables capture the cost environment through which carbon-related pressures may be transmitted to construction inputs. The third block is the macro-financial block, represented by funding-cost, exchange-rate, and risk-sentiment variables. This block captures broader financial conditions that may affect project initiation and delivery. The fourth block is the construction-activity block, represented by housing starts, area under construction, and completed floor area. These variables capture different stages of the project cycle. The fifth block is the terminal-price and institutional block, which captures downstream price conditions and the transition from the pilot carbon markets to the national ETS.
Within this conceptual model, a node represents an observable variable corresponding to one economic concept, while a directed edge in the learned DAG represents a conditional dependence relationship after accounting for the rest of the system. The direction of an edge is not interpreted mechanically as definitive causality. Rather, the retained edges are used to identify an empirically supported backbone that is consistent with the proposed transmission logic. This interpretation is important because the subsequent structural interpretation is provided by the TVP-SVAR stage, not by the ABN alone.
The ABN stage therefore performs a system-construction role. It reduces the arbitrariness of variable selection in a high-dimensional construction–carbon–finance system and identifies which variables form a connected and economically interpretable neighborhood around the carbon-price node. The selected network backbone is then used to guide the specification of the TVP-SVAR system, including the choice of core variables and the broad ordering of economic blocks.
Table 2 clarifies the input structure of the ABN stage. The ABN receives a broad set of theoretically relevant variables rather than only the variables eventually retained in the TVP-SVAR system. The purpose is to allow the structure-learning procedure to identify which variables form a stable and interpretable neighborhood around the carbon-price node. The output of the ABN stage is a directed acyclic graph that summarizes conditional dependence relationships among the candidate variables.
Table 2.
Inputs, transformations, and empirical roles in the ABN framework.
Table 3 summarizes how the ABN output is connected to the TVP-SVAR input. The ABN stage begins with a broad set of candidate variables and identifies a conditional-dependence backbone centered on carbon price. The TVP-SVAR stage then uses this backbone to construct a lower-dimensional dynamic system. CementPPI is added to the ABN-selected backbone because cement is a direct and carbon-intensive construction input, and its inclusion strengthens the representation of construction-material cost conditions. This design ensures that the TVP-SVAR specification is informed by both the empirical network evidence and the theoretical transmission mechanism.
Table 3.
From ABN structure learning to the TVP-SVAR baseline system.
4.2.2. Model Setup
Let denote the set of candidate variables. In the ABN framework, the joint distribution of is represented by a directed acyclic graph (DAG), in which each node is conditionally dependent on a set of parent nodes. The edges in the DAG are interpreted here as conditional dependence relationships after controlling for the rest of the system. They are used as evidence for system construction and transmission structure rather than as direct causal claims.
4.2.3. Structure Search and Sparsity Control
The DAG is selected by searching over admissible network structures using a score-based procedure. To avoid overfitting in a high-dimensional setting, the maximum number of parents per node is restricted. This imposes sparsity and helps preserve interpretability. The preferred network is chosen by balancing model fit and structural parsimony, so that the retained links form a connected and economically meaningful subsystem around the carbon-price node.
4.2.4. Role of the ABN Stage
The ABN stage serves two purposes. First, it identifies a stable subset of variables that are most closely linked to carbon-price movements within the broader construction-chain system. Second, it provides a transparent network backbone for the later structural analysis. The output of this stage is therefore a reduced system supported by conditional dependence evidence, rather than a full structural interpretation of all links.
4.3. Regime-Aware Shock Design Around the National ETS Transition
The launch of China’s national ETS in July 2021 is used in this study as an institutional transition anchor rather than as evidence of an instantaneous structural break. The transition from fragmented pilot markets to a national carbon market represents a clear change in market organization, policy visibility, and institutional expectations. However, the economic effects of this transition are unlikely to have been completed immediately in a single month. Market participants may learn gradually, compliance expectations may adjust over time, and carbon-price signals may be incorporated into financing, procurement, and project-timing decisions with a lag.
For this reason, the empirical design does not estimate two isolated subsamples before and after July 2021. Instead, it preserves the full monthly sample and splits the carbon-price variable into two regime-specific shock carriers, denoted as pre-transition and post-transition carbon-price shocks. This design allows the model to compare the transmission of carbon-price shocks across institutional regimes while maintaining a common information set and sufficient time-series variation for estimation.
The role of July 2021 is therefore to mark the beginning of a new institutional regime, not to impose the assumption that all transmission mechanisms changed discretely at that date. The regime-aware shock design is intended to capture differences in shock transmission associated with the national ETS transition while still allowing the TVP-SVAR coefficients and shock variances to evolve over time. This is consistent with the project-cycle interpretation of the study, because changes in carbon-price signals are expected to affect construction activity gradually through cost, finance, and expectation channels.
To assess whether the results depend on the exact month used as the transition marker, the robustness checks further consider alternative breakpoint settings around the national ETS launch. The purpose of this exercise is to verify that the main response patterns are not driven by a single mechanical date choice but reflect broader regime-aware transmission patterns around the institutional transition.
4.4. TVP-SVAR Specification
4.4.1. Time-Varying Reduced Form
Let denote the vector of endogenous variables selected from the ABN stage. The reduced-form dynamics are written as a time-varying VAR,
where the coefficients are allowed to evolve over time, and is the reduced-form innovation. This specification accommodates gradual structural change and shifting interactions among carbon prices, cost conditions, finance, and construction activity.
4.4.2. Structural Decomposition
The reduced-form innovations are mapped into structural shocks through a contemporaneous identification scheme with time-varying covariance structure. This allows both the transmission coefficients and shock variances to change over time, which is important in a setting where policy development, market depth, and volatility conditions are unlikely to remain constant over the full sample.
4.4.3. Ordering and Shock Interpretation
Structural interpretation requires a fixed variable ordering consistent with the transmission logic identified in the network stage. The ordering used in the baseline model follows the broad sequence from upstream cost conditions to carbon prices, financial conditions, construction activity, and market activity. Within this system, the main object of interest is the carbon-price shock. The aim is not to claim that every contemporaneous relation is uniquely known but to maintain a consistent and economically interpretable identification scheme across the baseline and robustness exercises.
4.5. Dynamic Responses and Variance Decomposition
The dynamic consequences of carbon-price shocks are evaluated in two ways. First, time-varying impulse response functions (IRFs) are used to trace how the direction, magnitude, and persistence of responses evolve across the sample period. This makes it possible to assess whether the transmission to construction activity becomes stronger or weaker around institutional transitions.
Second, forecast error variance decomposition (FEVD) is used to measure the relative importance of carbon-price shocks for fluctuations in the main variables over different forecast horizons. While IRFs describe the direction and timing of adjustment, FEVD indicates how much of the variation in construction activity, financial conditions, and carbon-market activity can be attributed to carbon-price shocks at short, medium, and long horizons. Taken together, these two tools provide complementary evidence on both transmission patterns and shock importance.
4.6. Robustness-Check Design
Several robustness checks are conducted to assess whether the main findings depend on specific modeling choices. These checks include alternative breakpoint settings around July 2021, alternative variable orderings within economically similar blocks, and alternative choices for the state-evolution window in the TVP-SVAR estimation. The purpose of these exercises is to verify that the baseline results do not hinge on a single implementation choice and that the main response patterns remain broadly stable across reasonable alternatives.
5. Empirical Results
5.1. ABN Results
5.1.1. Network Selection and Backbone Structure
Figure 1 reports the ABN model score across alternative maximum-parent settings. As the maximum number of parents increases, model fit improves, but the gain becomes much smaller at higher levels of complexity. The selected network therefore balances fit and parsimony rather than simply favoring the densest admissible structure.
Figure 1.
ABN model score across alternative values of the maximum number of parents. Notes: Black circles represent candidate maximum-parent settings examined during the ABN structure search, while the blue circle marks the selected setting for the baseline specification. The connecting line shows how the model score changes as the maximum number of allowed parents increases.
Figure 2 shows the selected DAG and reveals a coherent backbone centered on the carbon-price node. The retained structure links upstream price conditions, carbon-market variables, financial conditions, construction activity, and trading volume in a connected chain. In the baseline interpretation, the main seven-node backbone can be summarized as
Figure 2.
ABN backbone centered on the carbon-price node.
This pattern matters because it is not imposed ex ante. It emerges from the network search after conditioning on the rest of the system and therefore provides an empirical basis for reducing the high-dimensional candidate set to a smaller and more interpretable subsystem.
5.1.2. Parameter Evidence for the Key Links
The key edges in the retained backbone are supported by stable parameter estimates, as reported in Table 4. The 95% confidence intervals of the selected backbone links do not cross zero, indicating that the retained links are not driven by weak or unstable associations. These estimates provide parameter-level support for the network backbone used to construct the subsequent dynamic system.
Table 4.
Parameter estimates for the key ABN edges with 95% confidence intervals (MLE).
Three parts of the backbone are particularly relevant for the present research question. First, the upstream price block is connected to carbon price, which is consistent with the interpretation that carbon-price movements are embedded in broader energy and producer price conditions. Second, carbon price is linked to the financial interface through Shibor, supporting the role of funding conditions in the transmission mechanism. Third, the downstream construction segment links area under construction, housing starts, and trading volume, suggesting that project-cycle indicators and carbon-market activity are connected within the broader system.
These links should not be interpreted as direct causal effects. Their role is more specific: they show that the reduced system used in the TVP-SVAR stage is connected, economically interpretable, and statistically supported. In this sense, Table 4 provides the parameter evidence for the ABN-selected backbone, while the dynamic interpretation of carbon-price shocks is developed in the TVP-SVAR stage.
5.1.3. From the Seven-Node Backbone to the Eight-Variable TVP-SVAR System
The ABN stage identifies a seven-node backbone that spans the key modules of interest: upstream price conditions, carbon price, financial conditions, construction activity, and trading volume. This seven-node structure serves as the empirical core of the subsequent dynamic analysis.
For the baseline TVP-SVAR, the system is then expanded to eight variables by adding CementPPI to the ABN-selected backbone. This extension is introduced to better capture the upstream cost channel. While the ABN backbone captures an upstream cost channel through broader producer price conditions and coal-related costs, relying on a single construction-material proxy would make the cost block too narrow. CementPPI is therefore added to provide a more direct measure of construction-material cost conditions and to reduce measurement risk in the later structural analysis.
The final baseline system is thus an eight-variable specification built around the ABN-selected seven-node backbone plus one additional construction-material price variable. In this sense, the ABN is used to identify the backbone of the system, while the TVP-SVAR baseline adds CementPPI to strengthen the representation of the upstream cost channel.
5.1.4. Implication for the Dynamic Analysis
The ABN results provide the empirical bridge from the broad candidate system to the dynamic TVP-SVAR specification. As shown by the selected backbone, the carbon-price node is connected to upstream price conditions, financial conditions, construction activity, and trading volume. This pattern is consistent with the conceptual framework proposed earlier, in which carbon-price shocks are transmitted through cost and finance channels before becoming visible in project-cycle indicators.
The parameter evidence reported in Table 4 further supports the use of this backbone for system construction. The key edges have confidence intervals that do not cross zero, indicating that the retained links are not driven by weak or unstable associations. In this study, Table 4 is therefore not used as a structural causal table. Its role is to show that the ABN-selected subsystem is statistically supported, economically interpretable, and suitable for subsequent dynamic analysis.
The transition from the seven-node ABN backbone to the eight-variable TVP-SVAR system follows this logic. The ABN backbone identifies the empirical core of the system: upstream price conditions, carbon price, financial conditions, construction activity, and trading volume. CementPPI is then added to the baseline TVP-SVAR specification to strengthen the representation of construction-material cost conditions. This addition is theoretically motivated because cement is a direct and carbon-intensive construction input, and relying only on a broader upstream cost proxy would make the cost block too narrow for a construction-focused analysis.
The TVP-SVAR stage then takes the structured system forward by estimating how carbon-price shocks propagate dynamically over time and across institutional regimes. This means that the ABN and TVP-SVAR stages have distinct but sequential roles: the ABN stage disciplines system construction, while the TVP-SVAR stage provides the time-varying dynamic evidence. The interpretation of impulse responses and variance decompositions in the following section should therefore be read as structural dynamic evidence conditional on the ABN-informed system specification, rather than as direct causal claims from the network itself.
5.2. TVP-SVAR Results
5.2.1. Time-Varying Impulse Responses
Figure 3 and Figure 4 show that the effects of carbon-price shocks are not constant over the sample. The clearest pattern appears in the construction variables. Housing starts and area under construction remain predominantly below zero at medium horizons, especially around and , and the negative responses become more pronounced around the July 2021 transition before gradually easing later. This suggests that the contractionary effect of carbon-price shocks on construction activity is both lagged and time-varying rather than immediate and uniform.
Figure 3.
Time-varying impulse responses of housing starts to a carbon-price shock.
Figure 4.
Time-varying impulse responses of area under construction to a carbon-price shock.
Figure 5 shows a different response profile for trading volume. Its response to carbon-price shocks is generally positive, which indicates that price shocks are associated with stronger market activity, but the magnitude of that response weakens over time. The decline is most visible after the institutional transition, suggesting that the marginal effect of carbon-price shocks on trading activity became smaller as the market moved into a more mature national phase.
Figure 5.
Time-varying impulse responses of trading volume to a carbon-price shock.
The cost and financial variables also move around the transition, but these patterns play a more supporting role in the present interpretation. Since the time-varying IRF profiles do not report uncertainty bands, they are used here only as evidence on broad temporal patterns. The more formal comparison comes from the pre/post responses below.
5.2.2. Pre/Post Comparison Around the July 2021 Transition
Figure 6 sharpens the pre/post interpretation by contrasting the median impulse responses before and after July 2021 within a common framework. The construction variables display the same response direction in both regimes, but their medium-horizon magnitude and persistence differ. The key change is therefore one of strength and duration rather than sign reversal. This is consistent with the time-varying profiles, which point to stronger contraction around the transition and weaker responses later.
Figure 6.
Impulse responses to a carbon-price shock before and after July 2021. Notes: Solid lines denote PRE medians, and dashed lines denote POST medians. Light-gray shaded areas indicate PRE 5–95% intervals, while light-blue shaded areas indicate POST 5–95% intervals.
Trading volume again shows the clearest regime contrast. The post-2021 response is weaker than the pre-2021 response over most horizons, even though the response remains positive overall. The institutional shift therefore appears to have reduced the sensitivity of market activity to carbon-price shocks rather than eliminating the link altogether.
Because the uncertainty bands overlap at some horizons, these comparisons should not be read as sharp separation in a strict statistical sense. A more careful reading is that the transition changed the response amplitude and horizon structure of the system, especially for construction activity and trading volume.
Notes: Solid lines denote PRE medians; dashed lines denote POST medians; shaded areas indicate 5–95% intervals.
The numerical PRE/POST impulse-response estimates for Shibor, area under construction, housing starts, and trading volume at selected horizons are reported in Supplementary Table S2.
5.2.3. Forecast Error Variance Decomposition
Figure 7 and Figure 8 complement the IRFs by showing the cumulative FEVD shares of carbon-price shocks across forecast horizons. Throughout this subsection, FEVD values are interpreted as cumulative forecast-error variance shares unless otherwise noted. At short horizons, most variables remain dominated by their own innovations or by closely related neighboring shocks. At h = 1, own shocks account for 78.3%/77.8% of the variance of trading volume in the PRE/POST regimes, 83.9%/79.4% for area under construction, and 79.7%/66.9% for Shibor. For housing starts, short-run variation is driven mainly by the construction side: the contribution of shocks to area under construction reaches 69.9%/64.1%, whereas the contribution of housing-start shocks themselves is only 7.1%/6.1%. In this short-run window, the contribution of the carbon-price shock is generally small.
Figure 7.
Cumulative FEVD shares of the carbon-price shock across forecast horizons: PRE/POST comparison.
Figure 8.
Shock composition of cumulative FEVD at : PRE/POST comparison.
As the horizon lengthens, however, the contribution of carbon-price shocks rises markedly. At the 12-month horizon, carbon-price shocks explain 13.7%/10.8% of the forecast-error variance of trading volume in the PRE/POST regimes, 18.7%/18.4% for housing starts, 16.3%/17.3% for area under construction, and 14.7%/15.5% for Shibor. In all four cases, the carbon-price shock ranks among the main sources of medium-horizon variation. This pattern suggests that carbon-price shocks matter less as short-run disturbances than as drivers of medium-term uncertainty.
At longer horizons, the composition of variance sources shifts further, as summarized in Figure 8. At h = 20, the contribution of carbon-price shocks to trading volume declines after the transition, from 19.6% to 16.5%, even though it remains an important source of variation. By contrast, the role of carbon-price shocks becomes more prominent for area under construction and Shibor in the post-2021 regime. For area under construction, the carbon-price shock moves to the top rank after the transition; for Shibor, it also becomes the leading contributor at the long horizon.
Taken together, the FEVD results point to a reordering of importance rather than a uniform strengthening or weakening of carbon-price shocks throughout the system. After the transition, carbon-price shocks become less important for explaining trading volume but more central to the long-horizon variation of financing conditions and ongoing construction activity.
The numerical cumulative FEVD summary at selected horizons is provided in Supplementary Table S1.
5.2.4. Summary of the Evidence
The IRF and FEVD results support a consistent reading of the transmission mechanism. Carbon-price shocks do not primarily operate as short-run disturbances to construction activity. Their effects are more visible at medium horizons, where they weaken housing starts and area under construction, and their importance persists into longer horizons. At the same time, the institutional transition associated with the launch of the national ETS appears to have changed the structure of the system: the link to trading activity becomes weaker, while the links to financing conditions and construction activity remain economically meaningful. Read together with the conceptual discussion in Section 2, these response patterns are broadly consistent with gradual transmission through upstream costs, financing conditions, and project expectations. The effects of carbon-price shocks emerge more clearly at medium horizons than on impact.
6. Robustness Checks
6.1. ABN Robustness
To examine whether the network backbone depends on a single carbon-price specification, the baseline carbon-price variable is replaced by a split specification consisting of and , defined by the ETS regime dummy . The dummy is treated as exogenous and is constrained to enter both split nodes so that the regime definition remains transparent and reproducible. Re-estimating the MLE-ABN under this cpSplit design still yields a backbone that spans upstream cost conditions, financial conditions, construction activity, and market activity. This indicates that the core network structure does not rely on a single undivided carbon-price series.
Stability is further assessed using a STRATETS block bootstrap with a six-month block length and resamples. Table 5 reports only those adjacent edges of and whose bootstrap frequency is at least 0.95. Before the July 2021 transition, the stable parent edges of come from HP, ElecPPI, PPI, and DETS, while the stable child edges point to NS, Shibor, and VIX. After the transition, the stable parent edges of become more concentrated, including HP, ElecPPI, CementPPI, UC, Comp, and DETS, whereas the stable child edge mainly points to Vol. All retained adjacent edges appear in at least 299 out of 300 resamples, indicating that the local neighborhood of the carbon-price node is highly reproducible.
Table 5.
Stable adjacent edges of pre-transition and post-transition carbon-price nodes (bootstrap frequency , ).
6.2. TVP-SVAR Robustness
To assess whether the main TVP-SVAR results depend on specific modeling choices, the baseline specification is compared with three alternatives: an alternative breakpoint setting, an alternative ordering within the financial block, and a shorter training window. In each case, impulse responses are re-estimated for comparable PRE and POST states.
The results are consistent across these alternatives. First, the response of Vol to a carbon-price shock remains positive. Second, the responses of NS and UC remain negative. Third, the differences across alternative specifications mainly concern response magnitude rather than sign reversal. This indicates that the baseline conclusions do not hinge on a single implementation choice.
Figure 9 shows that the response of Vol remains positive under the alternative breakpoint setting, in which the transition date is moved from 2021M7 to 2021M6. The PRE responses under the two settings are very similar, while the POST response under the alternative breakpoint is somewhat weaker but still remains on the same side of zero.
Figure 9.
Robustness check for Vol: alternative breakpoint setting (2021M7 to 2021M6).
Figure 10 shows that the response of NS remains negative when the ordering within the financial block is adjusted. The ordering change affects the short- to medium-horizon magnitude but does not alter the sign or the overall pattern of adjustment.
Figure 10.
Robustness check for NS: alternative ordering within the financial block (PPI and Shibor swapped).
Figure 11 shows that when the training window is shortened from tau = 80 to tau = 70, the response of UC becomes somewhat milder, and the PRE profile becomes more sensitive, but the response remains negative in both PRE and POST states. This suggests that the training-window choice affects response amplitude more than qualitative inference.
Figure 11.
Robustness check for UC: shorter training window ().
Taken together, the robustness checks support the main findings reported in Section 5. The sign and broad dynamic shape of the responses remain stable across reasonable alternatives, even though some specifications lead to moderate differences in magnitude.
7. Discussion and Policy Implications
7.1. Interpreting the Main Findings in the Built-Environment Context
From a built-environment perspective, the main result is not that carbon pricing produces an immediate disruption to construction but that it gradually reshapes supply formation over the project cycle. In this study, housing starts and area under construction serve as observable indicators of when material demand is created and how projects accumulate in the delivery pipeline. Read in that way, the evidence points to a medium-horizon adjustment process: carbon-price shocks are associated with weaker new starts and slower ongoing construction most clearly around 6–12 months, while their effect on trading volume becomes less pronounced after the transition to the national ETS. Carbon pricing therefore appears to matter less as a short-lived market disturbance than as a signal that enters planning, procurement, financing, and phasing decisions. For the built environment, this distinction matters because many embodied-carbon outcomes are shaped before a project is delivered through choices over materials, timing, and funding rather than through immediate changes on site.
This reading also helps explain why a more mature carbon market should not be judged by trading volume alone. Once carbon-price signals become more familiar, the key issue is not whether trading activity remains highly sensitive to every price movement but whether those signals are strong enough and credible enough to be incorporated into project-level decision-making. In that sense, the relevant question for the built environment is whether carbon pricing begins to alter supply formation within a plausible project-cycle window, rather than whether it generates a visible short-run reaction in construction indicators.
7.2. Why the Effects Are Concentrated at Medium Horizons
The concentration of responses at 6–12 months is consistent with how construction projects are organized in practice. In the early stage of the national ETS, the construction sector is affected mainly through indirect exposure. Carbon price shocks are more likely to work through upstream materials, energy costs, and financing conditions than through direct compliance obligations at the project level.
This timing also reflects the structure of the construction process itself. Decisions on project initiation depend on updated expectations about costs, margins, and financing conditions, while procurement and contract adjustment typically take time. Energy and material cost changes are therefore unlikely to alter construction activity immediately. The same is true for substitution toward lower-carbon materials or methods, which often depends on technical standards, certification, supplier capability, and procurement arrangements. These frictions make medium-horizon responses more plausible than immediate ones.
A similar logic applies to area under construction. This is a stock variable, and ongoing projects are constrained by sunk costs, financing arrangements, and delivery schedules. Carbon price shocks are therefore more likely to slow project progress, alter phasing, or reduce new project entry than to generate abrupt short-run changes in ongoing construction. This helps explain why the effects are clearer in the medium term than at impact.
The stronger responses around the 2021 transition should also be interpreted cautiously. Some confidence bands overlap across horizons, and the FEVD captures the relative importance of shocks rather than directional causality. A more careful interpretation is that the transition period temporarily increased the sensitivity of the system to carbon-price signals, after which firms and markets gradually adjusted to the new institutional environment.
7.3. Implications for Policy Coordination
The results suggest that policy coordination in the built environment should be organized around the project cycle rather than short-run market fluctuations. Since construction activity responds mainly at medium horizons, policy evaluation should not rely too heavily on immediate changes in activity or trading volume.
Three implications follow. First, the effectiveness of carbon pricing for the construction chain depends on whether carbon prices remain interpretable and sufficiently predictable to enter planning, procurement, and financing decisions. Second, because the transmission mainly works through upstream materials and financing conditions, complementary policy support should focus on reducing adjustment frictions in design, procurement, and material substitution. This includes clearer standards for low-carbon materials and methods, more credible certification pathways, and procurement rules that help stabilize expectations for low-carbon inputs. Third, the post-2021 weakening of trading-volume sensitivity suggests that market activity alone is not a sufficient indicator of policy effectiveness once the market moves into a more routine phase of operation.
More specifically, green procurement can translate carbon-price signals into construction decisions by requiring low-carbon materials, supplier certification, and carbon-related evaluation criteria in tenders. Embodied carbon accounting can further strengthen this transmission by making material carbon footprints, project-level carbon budgets, and life-cycle carbon disclosure visible before construction begins. Low-carbon material substitution should therefore be treated as a project-cycle issue rather than only as a technology issue: cement, steel, glass, and other carbon-intensive inputs can be replaced or optimized only when standards, supplier capacity, certification, and procurement rules are aligned with financing and delivery schedules.
For the built environment, a more useful policy lens is therefore whether carbon pricing is being translated into observable adjustments in supply formation. In practical terms, this means paying attention to whether carbon-related cost signals are transmitted into relevant materials and energy inputs, whether construction activity adjusts within a plausible project-cycle window, and whether financial tools are available to smooth the cost of transition.
7.4. Distributional Trade-Offs in Construction-Sector Carbon Pricing
The results also imply distributional trade-offs across the construction supply chain. Carbon-price shocks are most likely to place pressure on actors with high exposure to energy- and material-intensive inputs, especially developers and contractors with fixed-price procurement commitments, thin margins, or limited ability to pass through cost increases. Upstream producers of carbon-intensive materials may also face higher transition pressure when carbon-related costs are capitalized into energy, cement, steel, and glass prices.
By contrast, firms and institutions able to internalize low-carbon adjustment earlier may be better positioned. Suppliers of certified low-carbon materials, contractors with stronger green procurement capability, and developers with access to transition finance may benefit from more predictable demand for low-carbon inputs. Financial institutions may also gain from improved carbon-risk pricing and new transition-finance products, provided that these instruments reduce adjustment costs rather than simply transferring them to construction firms.
For end users and public authorities, the trade-off is more indirect. Stronger carbon pricing may increase near-term cost pressure in some projects, but it can also improve long-term sustainability outcomes by encouraging lower embodied carbon, better material disclosure, and more credible decarbonization pathways. This means that policy design should not only ask whether carbon pricing reduces emissions but also how the costs and benefits of adjustment are distributed among developers, contractors, material suppliers, financiers, governments, and final users.
7.5. Green Finance and Long-Horizon Risk Transmission
At longer horizons, the contribution of carbon price shocks to the variance of financial conditions becomes more important. This suggests that after the launch of the national ETS, carbon-price signals became more tightly connected to the broader structure of financial uncertainty. The result should not be read as a simple directional causal claim but rather as evidence that carbon-market developments increasingly matter for how long-horizon risk is distributed across the construction chain.
This has two implications. For regulators, carbon-price scenarios may need to be incorporated more systematically into monitoring and stress-testing frameworks related to construction, property development, and upstream high-carbon suppliers. For financial institutions, the results point to the value of transition-finance instruments that can reduce medium-term adjustment costs, especially where project timing and cost recovery are sensitive to changing carbon-related inputs. In this sense, green finance is not only a channel for supporting low-carbon investment but also a mechanism for reducing the amplification of carbon-related shocks along the supply chain.
7.6. Limitations and Directions for Future Research
Several limitations should be noted. First, in the early phase of the national ETS, the construction sector is affected mainly through indirect exposure. The transmission patterns identified here therefore reflect a cost-and-finance channel more than direct compliance behavior. These patterns may change if construction-related emissions are priced more directly in the future.
Second, the construction indicators used here mainly reflect housing-related activity. Caution is therefore needed when extending the results to infrastructure construction or to project types with different procurement and financing structures. Third, the use of monthly data and a unified national carbon-price series inevitably masks regional and project-level heterogeneity, including differences in contract form, procurement rules, and local market conditions.
Future work could extend the present analysis in three directions. One is to combine higher-frequency carbon-market data with policy-event timing so that policy shocks can be separated more clearly from compliance-cycle effects. A second is to exploit regional variation in construction cycles, supply conditions, and carbon-market exposure. A third is to incorporate project-level information on procurement, contract types, material substitution, and delivery timing so that the links between pricing signals, financing conditions, and actual construction decisions can be identified more directly.
8. Conclusions
This study examines how carbon price shocks are transmitted through the construction supply chain in China and whether this transmission changes across institutional regimes. Using a balanced monthly sample from January 2014 to October 2025, it develops a unified empirical framework that combines additive Bayesian network (ABN) structure learning with time-varying structural vector autoregression (TVP-SVAR) analysis. The ABN stage is used to identify a reproducible core subsystem centered on the carbon-price node, while the cpSplit design and TVP-SVAR framework are used to trace regime-specific dynamic responses and the changing importance of shocks before and after the launch of the national ETS in July 2021.
Three conclusions emerge. First, carbon price shocks mainly affect construction activity at medium horizons rather than on impact. The clearest responses appear in housing starts (NS) and area under construction (UC), both of which show stronger contraction around the institutional transition and weaker responses later. Second, trading volume (Vol) responds positively to carbon price shocks, but this sensitivity declines after the transition, suggesting that the effect of price shocks on market activity becomes weaker in the more mature national-market phase. Third, from the perspective of forecast error variance decomposition, carbon price shocks remain an important source of medium- and long-horizon fluctuations, but their relative importance is reordered after the transition: their contribution to trading volume declines while their longer-horizon links with financing conditions and ongoing construction become more prominent.
The robustness checks support this interpretation. Across alternative breakpoint settings, variable orderings, and training-window choices, the direction and broad dynamic shape of the main responses remain stable, while the differences are mainly reflected in response magnitude rather than sign reversal. This suggests that the core findings do not depend on a single modeling choice.
The study makes three contributions to the built-environment literature. First, it shows that carbon pricing matters for built-environment supply formation, not only for emissions accounting or carbon-market performance: housing starts and area under construction respond most clearly within a 6–12 month project-cycle window rather than on impact. Second, it shows that the July 2021 transition is associated with a reorganization of transmission across the construction chain: the link to trading volume becomes weaker, while the medium- and long-horizon relevance of carbon-price shocks for ongoing construction and financing conditions remains substantial. Third, it provides a transparent empirical strategy for studying this type of transmission problem in a high-dimensional system by using the ABN stage to discipline system construction and the TVP-SVAR stage to trace time-varying structural responses.
Overall, the evidence indicates that carbon pricing reshapes built-environment supply formation in China mainly through medium-horizon adjustments across the project cycle, rather than through immediate market disruption.
Supplementary Materials
The following supporting information can be downloaded at: https://www.mdpi.com/article/10.3390/buildings16112097/s1, Table S1. Cumulative FEVD summary at selected horizons; Table S2. Numerical impulse responses to a carbon-price shock at selected horizons.
Author Contributions
Conceptualization, Y.O. and L.W.; methodology, Y.O.; software, Y.O.; validation, L.W. and F.Z.; formal analysis, Y.O.; investigation, Y.O.; data curation, Y.O.; writing—original draft preparation, Y.O.; writing—review and editing, L.W., F.Z. and Y.W.; supervision, L.W. and Y.W.; project administration, L.W.; funding acquisition, L.W. and Y.W. All authors have read and agreed to the published version of the manuscript.
Funding
This research was funded by the Guangdong Basic and Applied Basic Research Foundation, grant numbers 2026A1515010708 and 2021A1515110461, and the National Natural Science Foundation of China, grant number 72204058.
Data Availability Statement
The raw data used in this study were obtained from the public sources listed in Table 1. The processed data supporting the findings of this study are available from the corresponding author upon reasonable request.
Conflicts of Interest
The authors declare no conflicts of interest.
References
- United Nations Environment Programme (UNEP); Global Alliance for Buildings and Construction (GlobalABC). Global Status Report for Buildings and Construction 2024/2025. 17 March 2025. Available online: https://www.unep.org/resources/report/global-status-report-buildings-and-construction-20242025 (accessed on 5 March 2026).
- State Council of the People’s Republic of China. Notice of the State Council on Issuing the Action Plan for Energy Saving and Carbon Reduction (2024–2025) (Guofa [2024] No. 12). 2024. Available online: https://www.gov.cn/zhengce/content/202405/content_6954322.htm (accessed on 5 March 2026). (In Chinese)
- Ministry of Ecology and Environment of the People’s Republic of China. Interim Regulations on the Administration of Carbon Emissions Trading (State Council Decree No. 775). Published 5 February 2024; effective 1 May 2024. Available online: https://www.mee.gov.cn/zcwj/gwywj/202402/t20240205_1065850.shtml (accessed on 5 March 2026). (In Chinese)
- Ministry of Finance of the People’s Republic of China; Ministry of Housing and Urban-Rural Development of the People’s Republic of China; Ministry of Industry and Information Technology of the People’s Republic of China. Notice on Further Expanding the Scope of Government Procurement Supporting Green Building Materials to Improve Building Quality (Caiku [2024] No. 36). Dated 31 December 2024; posted 10 January 2025. Available online: https://www.ccgp.gov.cn/specialtopic/zfcgxqbz/xqbz/202501/t20250110_24045683.htm (accessed on 5 March 2026). (In Chinese)
- Ministry of Finance of the People’s Republic of China; Ministry of Housing and Urban-Rural Development of the People’s Republic of China; Ministry of Industry and Information Technology of the People’s Republic of China. Green Building and Green Building Materials Government Procurement Demand Standard (2025 Edition). Attachment 2 to the Notice on Further Expanding the Scope of Government Procurement Supporting Green Building Materials to Improve Building Quality (Caiku [2024] No. 36). December 2024. Available online: https://m.mof.gov.cn/czxw/202501/t20250110_3951449.htm. (In Chinese)
- European Union. Directive (EU) 2024/1275 of the European Parliament and of the Council of 24 April 2024 on the Energy Performance of Buildings (Recast) (Text with EEA Relevance). Official Journal of the European Union, OJ L, 2024/1275, 8.5.2024. Available online: https://eur-lex.europa.eu/eli/dir/2024/1275/oj (accessed on 5 March 2026).
- European Union. Regulation (EU) 2024/3110 of the European Parliament and of the Council of 27 November 2024 Laying Down Harmonised Rules for the Marketing of Construction Products and Repealing Regulation (EU) No 305/2011 (Text with EEA Relevance). Official Journal of the European Union, OJ L, 2024/3110, 18.12.2024. Available online: https://eur-lex.europa.eu/eli/reg/2024/3110/oj (accessed on 5 March 2026).
- California Energy Commission. 2025 Building Energy Efficiency Standards. Available online: https://www.energy.ca.gov/programs-and-topics/programs/building-energy-efficiency-standards/2025-building-energy-efficiency (accessed on 5 March 2026).
- Chastas, P.; Theodosiou, T.; Bikas, D. Embodied energy in residential buildings—Towards the nearly zero energy building: A literature review. Build. Environ. 2016, 105, 267–282. [Google Scholar] [CrossRef] [Scilit]
- Röck, M.; Saade, M.R.M.; Balouktsi, M.; Rasmussen, F.N.; Birgisdottir, H.; Frischknecht, R.; Habert, G.; Lützkendorf, T.; Passer, A. Embodied GHG emissions of buildings—The hidden challenge for effective climate change mitigation. Appl. Energy 2020, 258, 114107. [Google Scholar] [CrossRef] [Scilit]
- Minunno, R.; O’Grady, T.; Morrison, G.M.; Gruner, R.L. Investigating the embodied energy and carbon of buildings: A systematic literature review and meta-analysis of life cycle assessments. Renew. Sustain. Energy Rev. 2021, 143, 110935. [Google Scholar] [CrossRef] [Scilit]
- Pan, W.; Teng, Y. A systematic investigation into the methodological variables of embodied carbon assessment of buildings. Renew. Sustain. Energy Rev. 2021, 141, 110840. [Google Scholar] [CrossRef] [Scilit]
- Robati, M.; Oldfield, P.; Nezhad, A.A.; Carmichael, D.G.; Kuru, A. Carbon value engineering: A framework for integrating embodied carbon and cost reduction strategies in building design. Build. Environ. 2021, 192, 107620. [Google Scholar] [CrossRef] [Scilit]
- Chevallier, J. A model of carbon price interactions with macroeconomic and energy dynamics. Energy Econ. 2011, 33, 1295–1312. [Google Scholar] [CrossRef] [Scilit]
- Conrad, C.; Rittler, D.; Rotfuß, W. Modeling and explaining the dynamics of European Union Allowance prices at high-frequency. Energy Econ. 2012, 34, 316–326. [Google Scholar] [CrossRef] [Scilit]
- Kanamura, T. Role of carbon swap trading and energy prices in price correlations and volatilities between carbon markets. Energy Econ. 2016, 54, 204–212. [Google Scholar] [CrossRef] [Scilit]
- Cludius, J.; de Bruyn, S.; Schumacher, K.; Vergeer, R. Ex-post investigation of cost pass-through in the EU ETS—An analysis for six industry sectors. Energy Econ. 2020, 91, 104883. [Google Scholar] [CrossRef] [Scilit]
- Liu, S.Y.; Wang, M.; Zhou, P. Carbon pass-through in Chinese cement industry. Energy Econ. 2025, 144, 108413. [Google Scholar] [CrossRef] [Scilit]
- Balcılar, M.; Demirer, R.; Hammoudeh, S.; Nguyen, D.K. Risk spillovers across the energy and carbon markets and hedging strategies for carbon risk. Energy Econ. 2016, 54, 159–172. [Google Scholar] [CrossRef] [Scilit]
- Yan, W.; Cheung, A.W.K. Climate policy uncertainty and coal price effects on carbon price (TVP-VAR). Financ. Res. Lett. 2022, 48, 103400. [Google Scholar] [CrossRef] [Scilit]
- Dechezleprêtre, A.; Nachtigall, D.; Venmans, F. The joint impact of the European Union emissions trading system on carbon emissions and economic performance. J. Environ. Econ. Manag. 2023, 118, 102758. [Google Scholar] [CrossRef] [Scilit]
- Calel, R.; Dechezleprêtre, A. Environmental policy and directed technological change: Evidence from the European carbon market. Rev. Econ. Stat. 2016, 98, 173–191. [Google Scholar] [CrossRef] [Scilit]
- Li, J.; Yao, Y.; Wang, X. The first compliance cycle of China’s National Emissions Trading Scheme: Insights and implications. Carbon Neutrality 2022, 1, 24. [Google Scholar] [CrossRef] [Scilit]
- Luo, W.; Zhang, Y.; Gao, Y.; Liu, Y.; Shi, C.; Wang, Y. Life cycle carbon cost of buildings under carbon trading and carbon tax system in China. Sustain. Cities Soc. 2021, 66, 102509. [Google Scholar] [CrossRef] [Scilit]
- He, Q.; Wu, J.; Wu, Z.; Zhang, J.; Chen, X. Evolutionary game analysis of prefabricated buildings adoption under carbon emission trading scheme. Build. Environ. 2024, 249, 111121. [Google Scholar] [CrossRef] [Scilit]
- Xu, Y.; Xu, Z.; Zhou, Y.; Su, C.; Guo, L. Interactions between carbon prices and the construction industry in China: Evidence based on Network-SVAR. Build. Environ. 2022, 215, 108936. [Google Scholar] [CrossRef] [Scilit]
- Liu, Y.; Loo, B.P.Y. Carbon trading in the construction industry: A systematic review and a vigorous impact assessment framework to facilitate implementation. Environ. Impact Assess. Rev. 2026, 118, 108271. [Google Scholar] [CrossRef] [Scilit]
- Zhang, Y.-C.; Liu, J.-B.; Wang, S.-Y. The impact of carbon trading policy on embodied carbon emission in China’s construction industry: Evidence from a quasi-natural experiment. J. Clean. Prod. 2025, 522, 146354. [Google Scholar] [CrossRef] [Scilit]
- Zhang, W.; Hsu, S.-C.; Lee, C.-J.; Wei, H.-H. Responses of green innovation to carbon emission policies in China’s construction industry. Resour. Conserv. Recycl. 2025, 219, 108326. [Google Scholar] [CrossRef] [Scilit]
- Du, Q.; Li, Q.; Lu, C.; Ma, M.; Bai, L. The impact of combining differentiated carbon tax and emissions trading system on the construction sector: Based on the industry linkage perspective. Energy Build. 2025, 347, 116230. [Google Scholar] [CrossRef] [Scilit]
- Diebold, F.X.; Yilmaz, K. Measuring financial asset return and volatility spillovers, with application to global equity markets. Econ. J. 2009, 119, 158–171. [Google Scholar] [CrossRef] [Scilit]
- Diebold, F.X.; Yilmaz, K. Better to give than to receive: Predictive directional measurement of volatility spillovers. Int. J. Forecast. 2012, 28, 57–66. [Google Scholar] [CrossRef] [Scilit]
- Diebold, F.X.; Yilmaz, K. On the network topology of variance decompositions: Measuring the connectedness of financial firms. J. Econom. 2014, 182, 119–134. [Google Scholar] [CrossRef] [Scilit]
- Primiceri, G.E. Time varying structural vector autoregressions and monetary policy. Rev. Econ. Stud. 2005, 72, 821–852. [Google Scholar] [CrossRef] [Scilit]
- Cogley, T.; Sargent, T.J. Drifts and volatilities: Monetary policies and outcomes in the post WWII U.S. Rev. Econ. Dyn. 2005, 8, 262–302. [Google Scholar] [CrossRef] [Scilit]
- Killick, R.; Fearnhead, P.; Eckley, I.A. Optimal detection of changepoints with a linear computational cost. J. Am. Stat. Assoc. 2012, 107, 1590–1598. [Google Scholar] [CrossRef] [Scilit]
- Killick, R.; Eckley, I.A. changepoint: An R package for changepoint analysis. J. Stat. Softw. 2014, 58, 1–19. [Google Scholar] [CrossRef] [Scilit]
- Kratzer, G.; Lewis, F.; Comin, A.; Pittavino, M.; Furrer, R. Additive Bayesian Network Modeling with the R Package abn. J. Stat. Softw. 2023, 105, 1–41. [Google Scholar] [CrossRef] [Scilit]
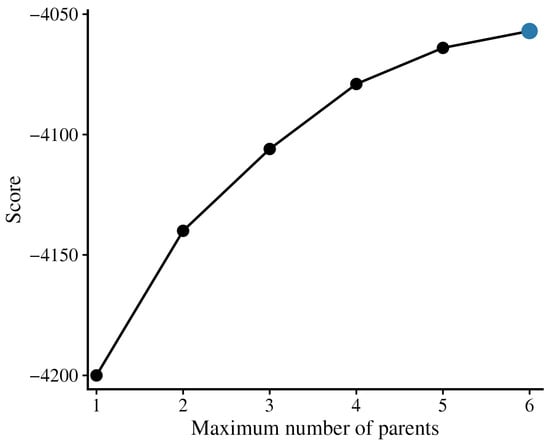
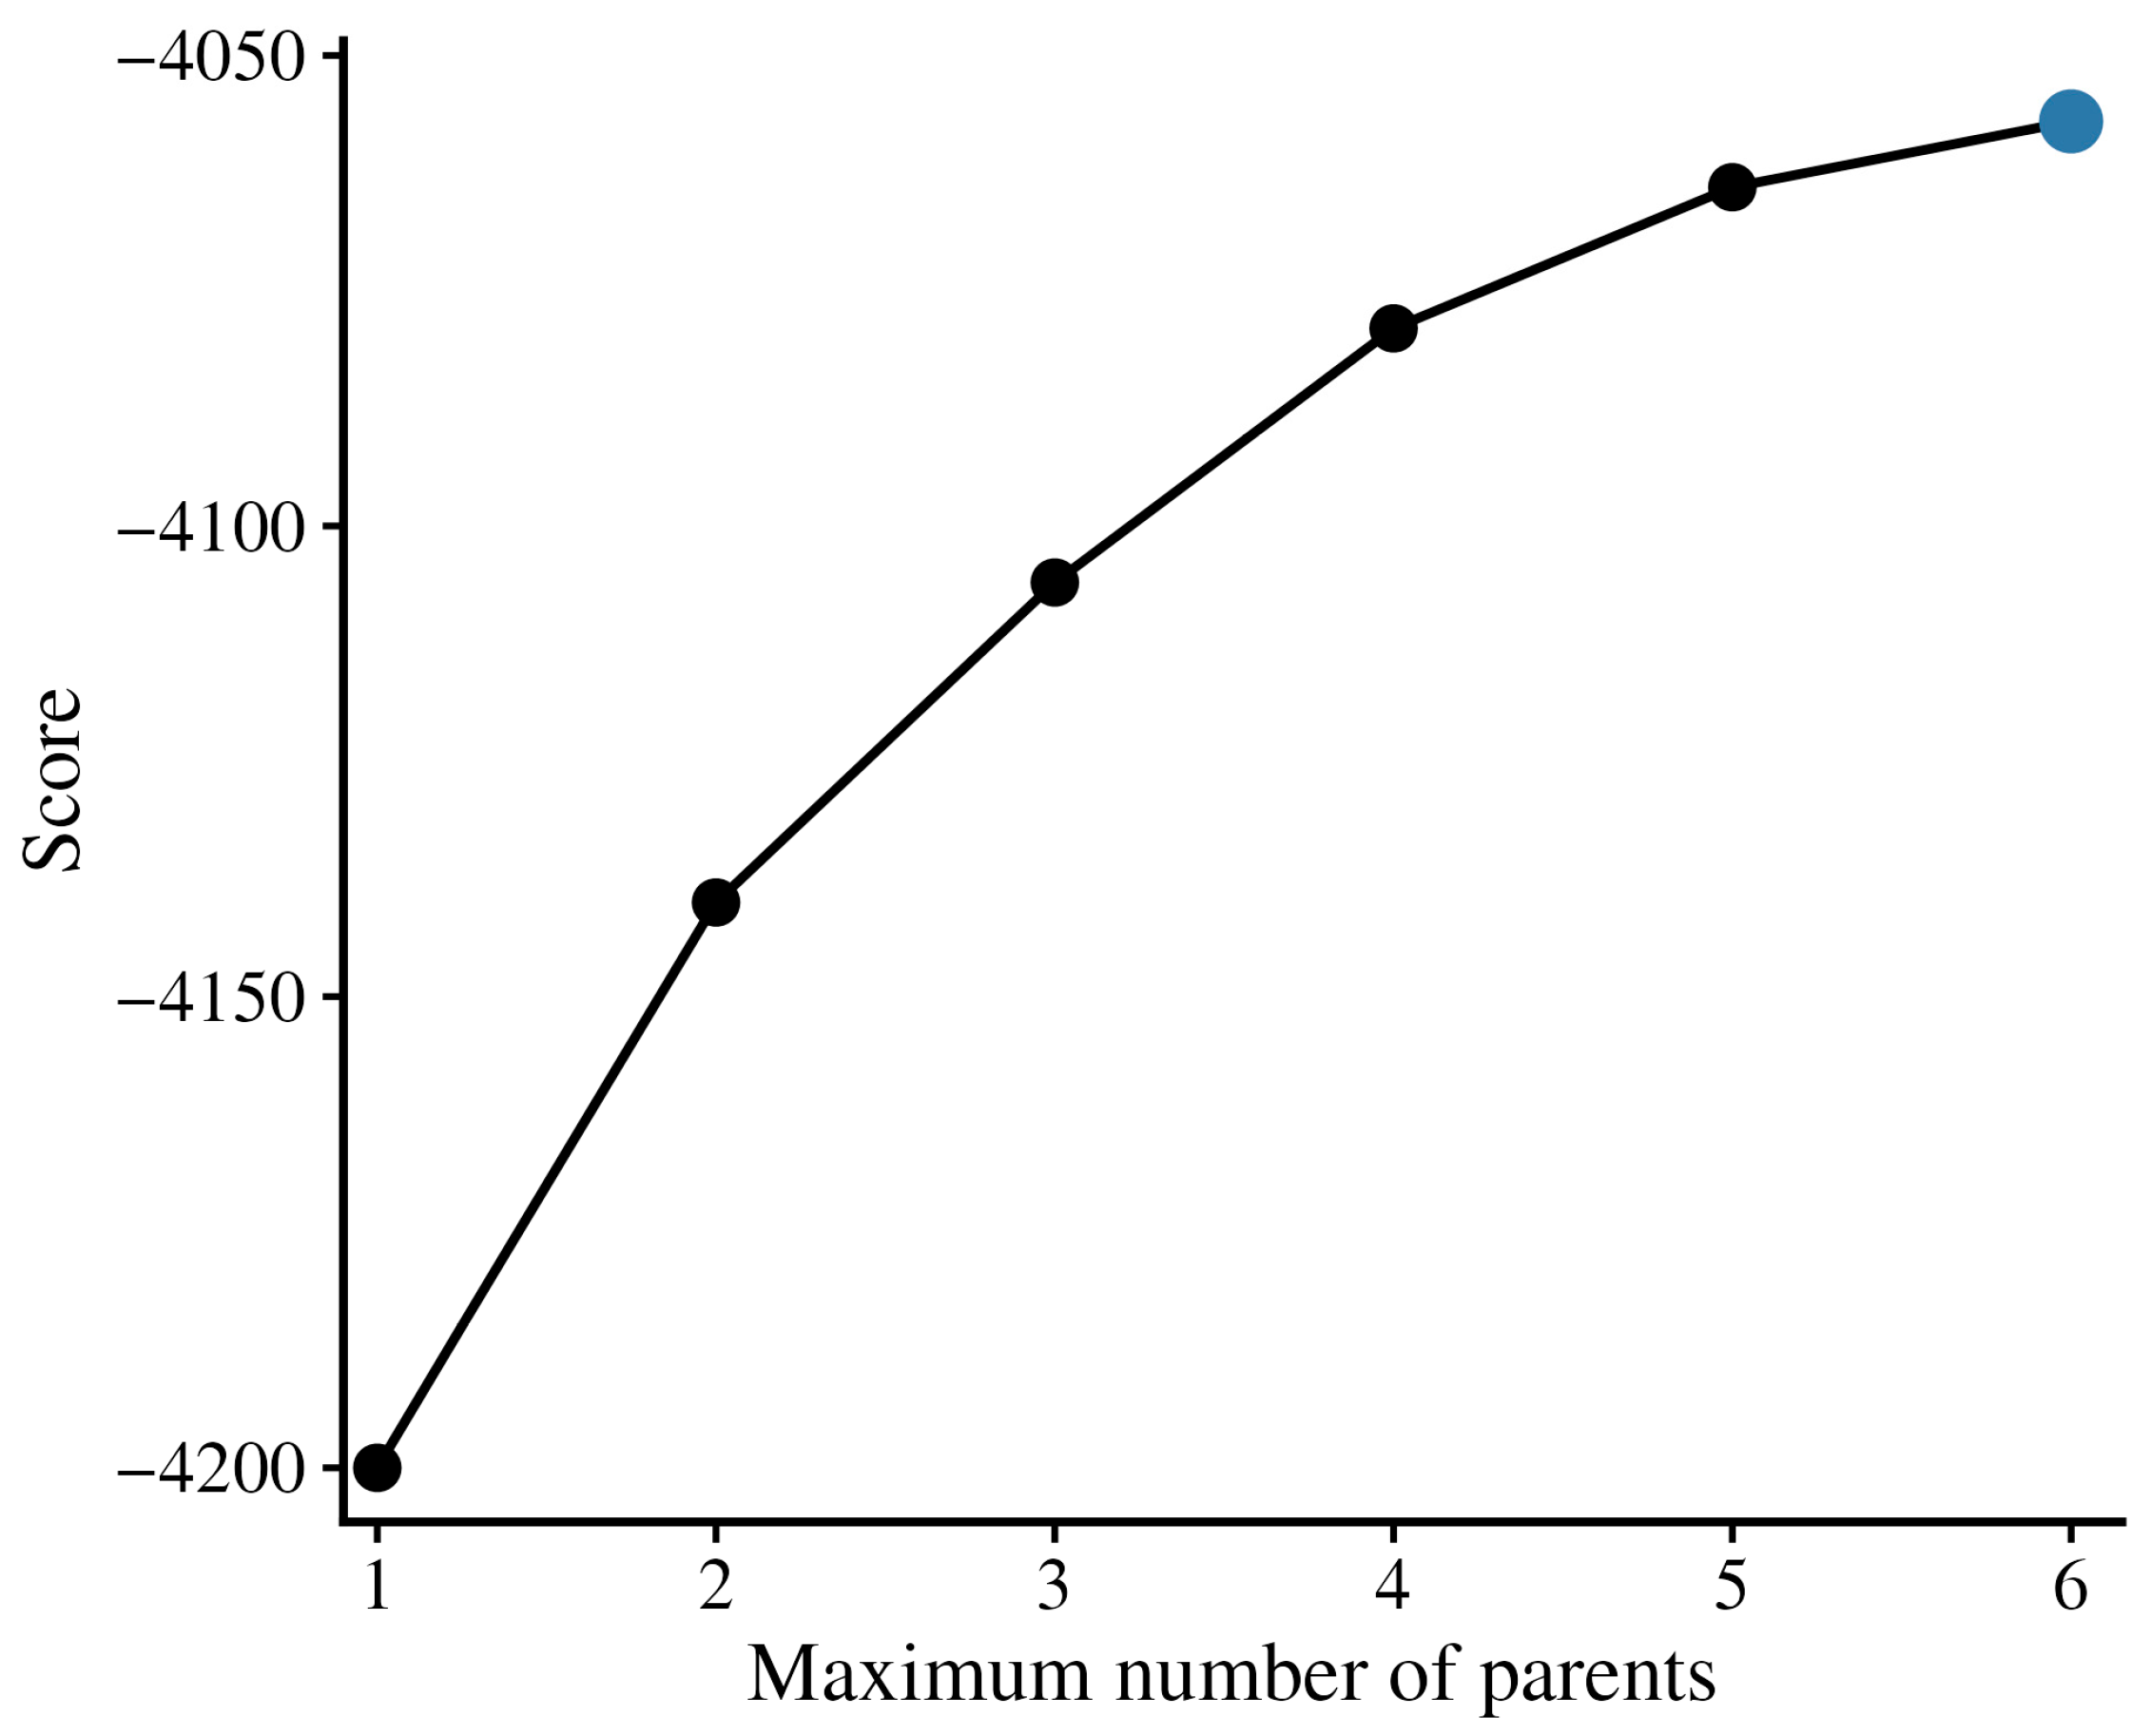
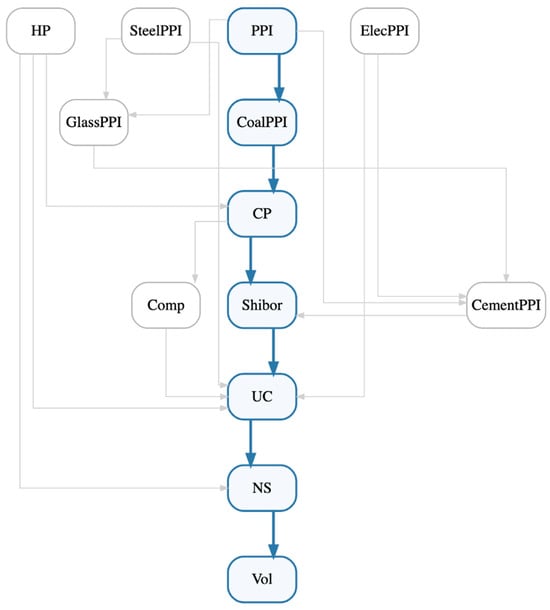
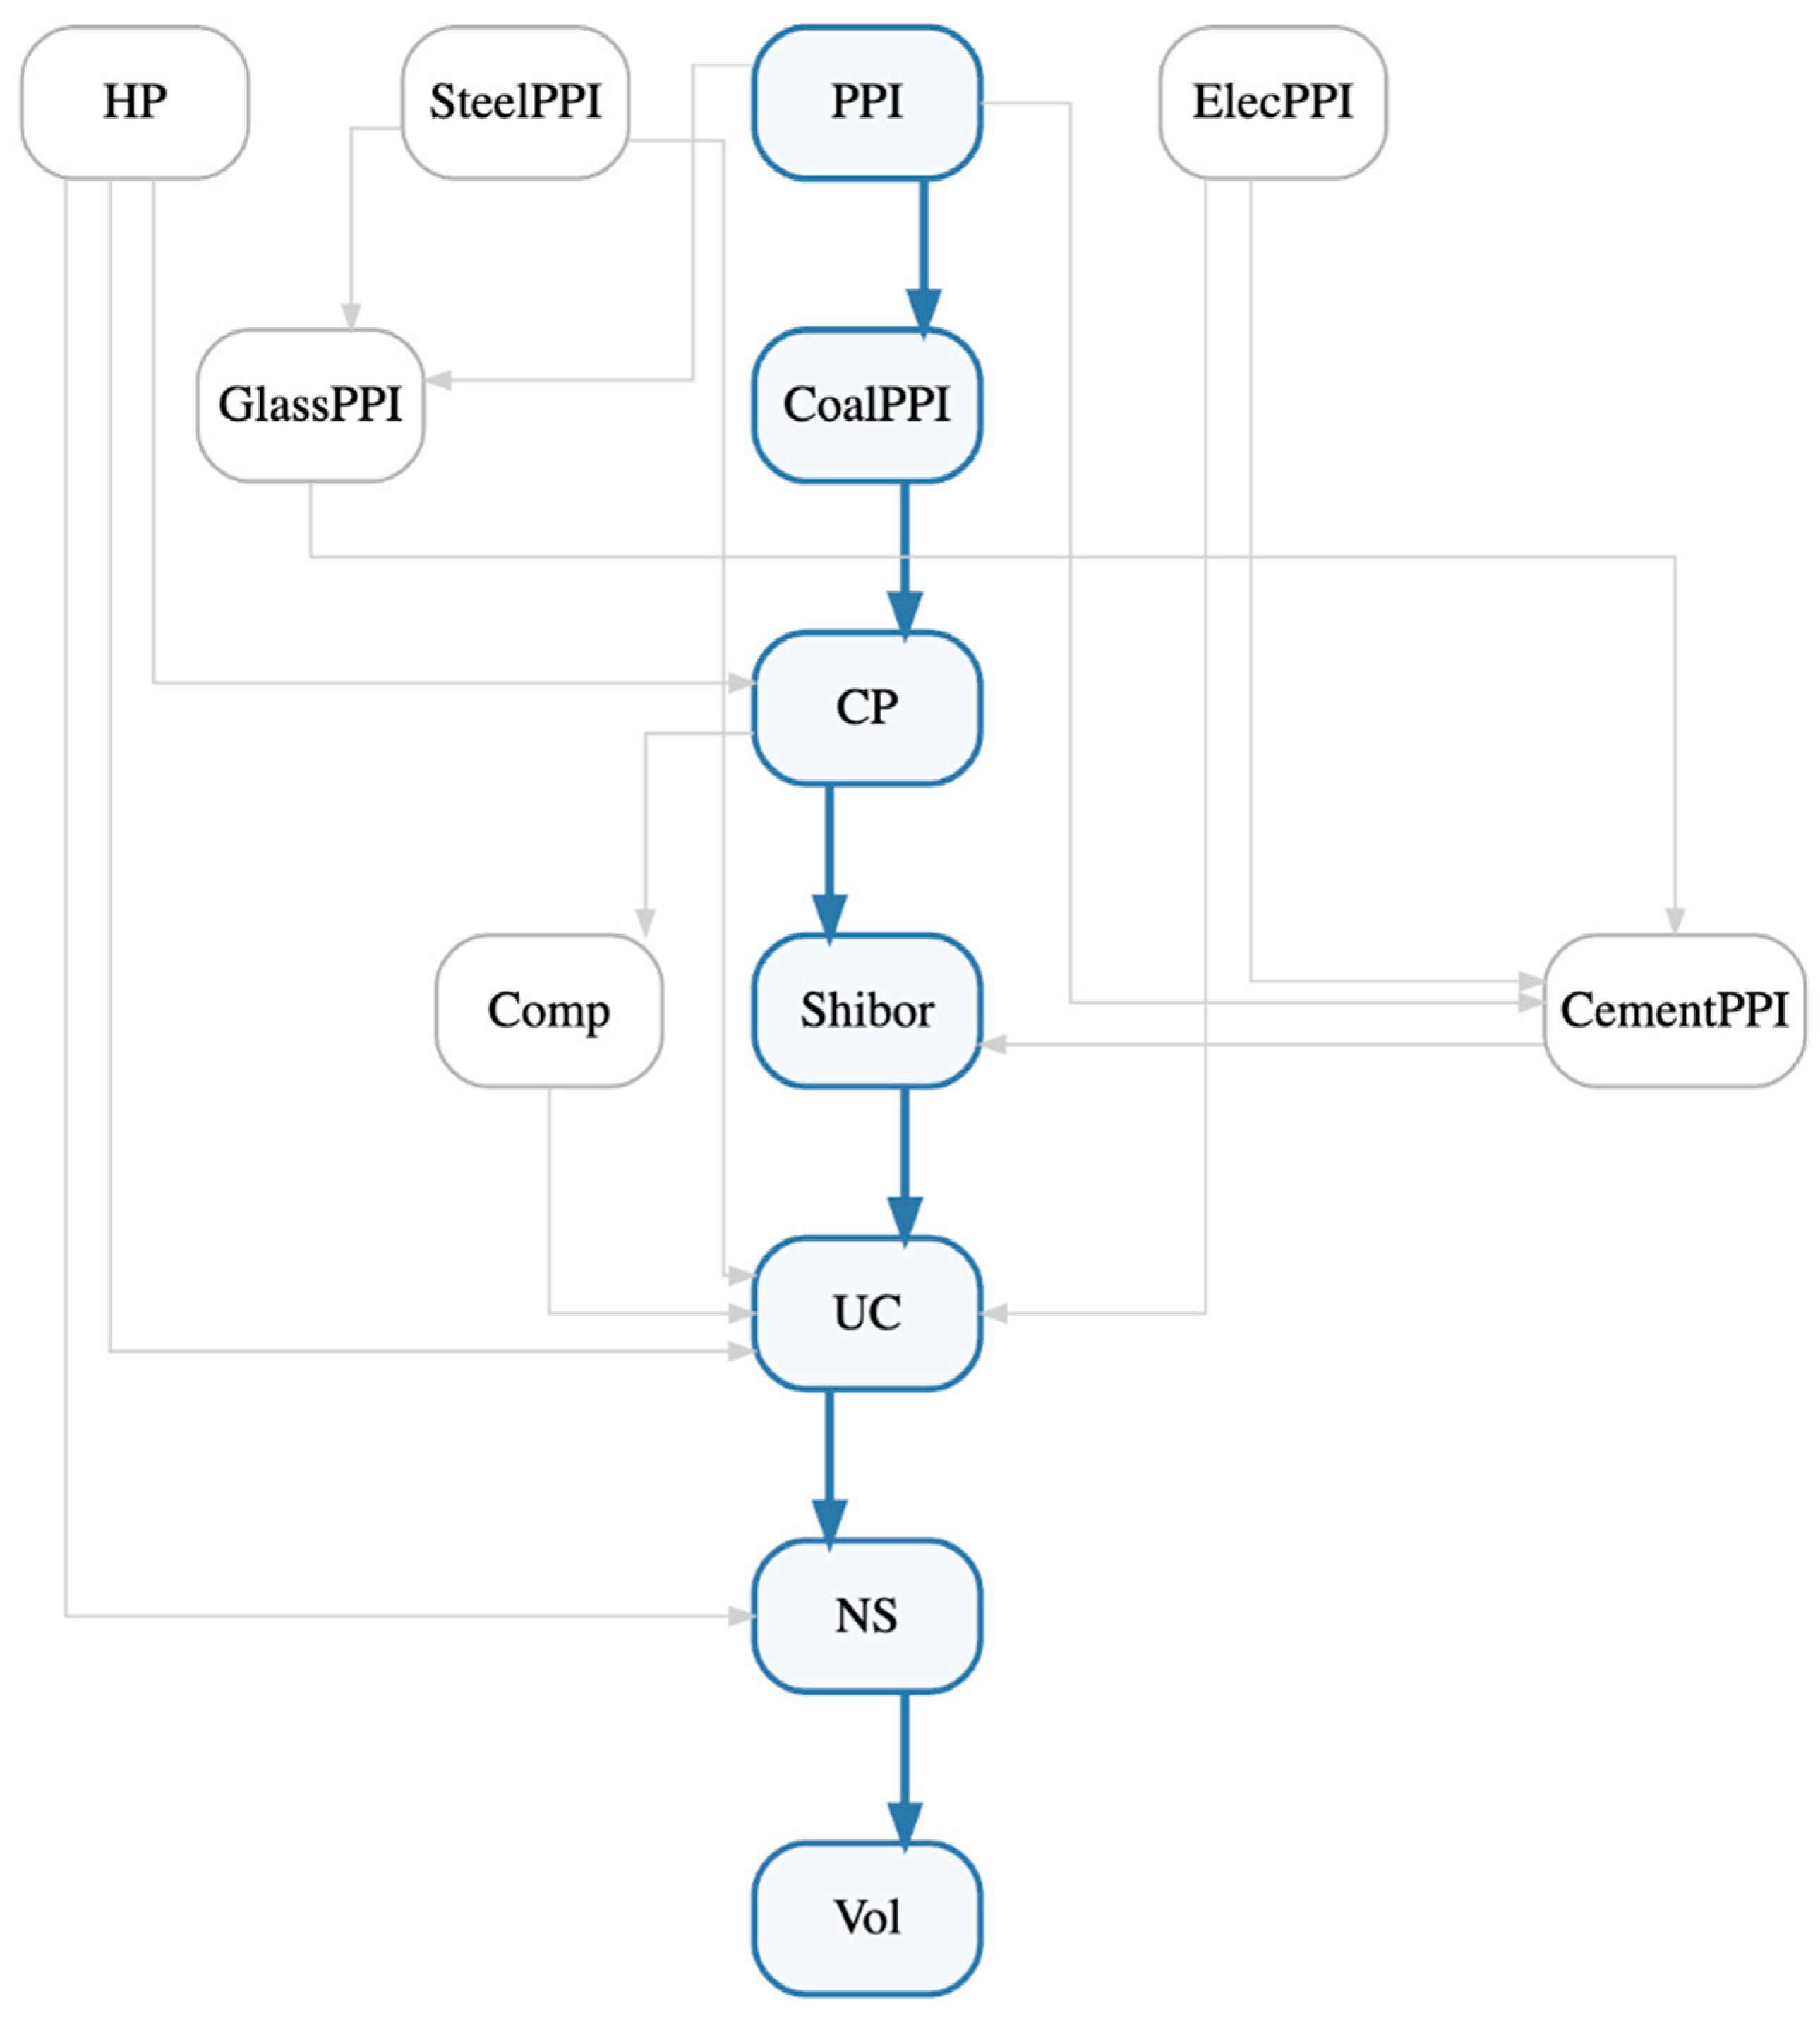
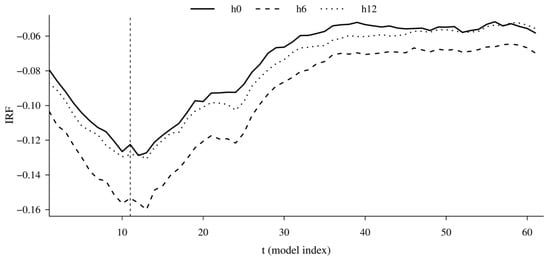
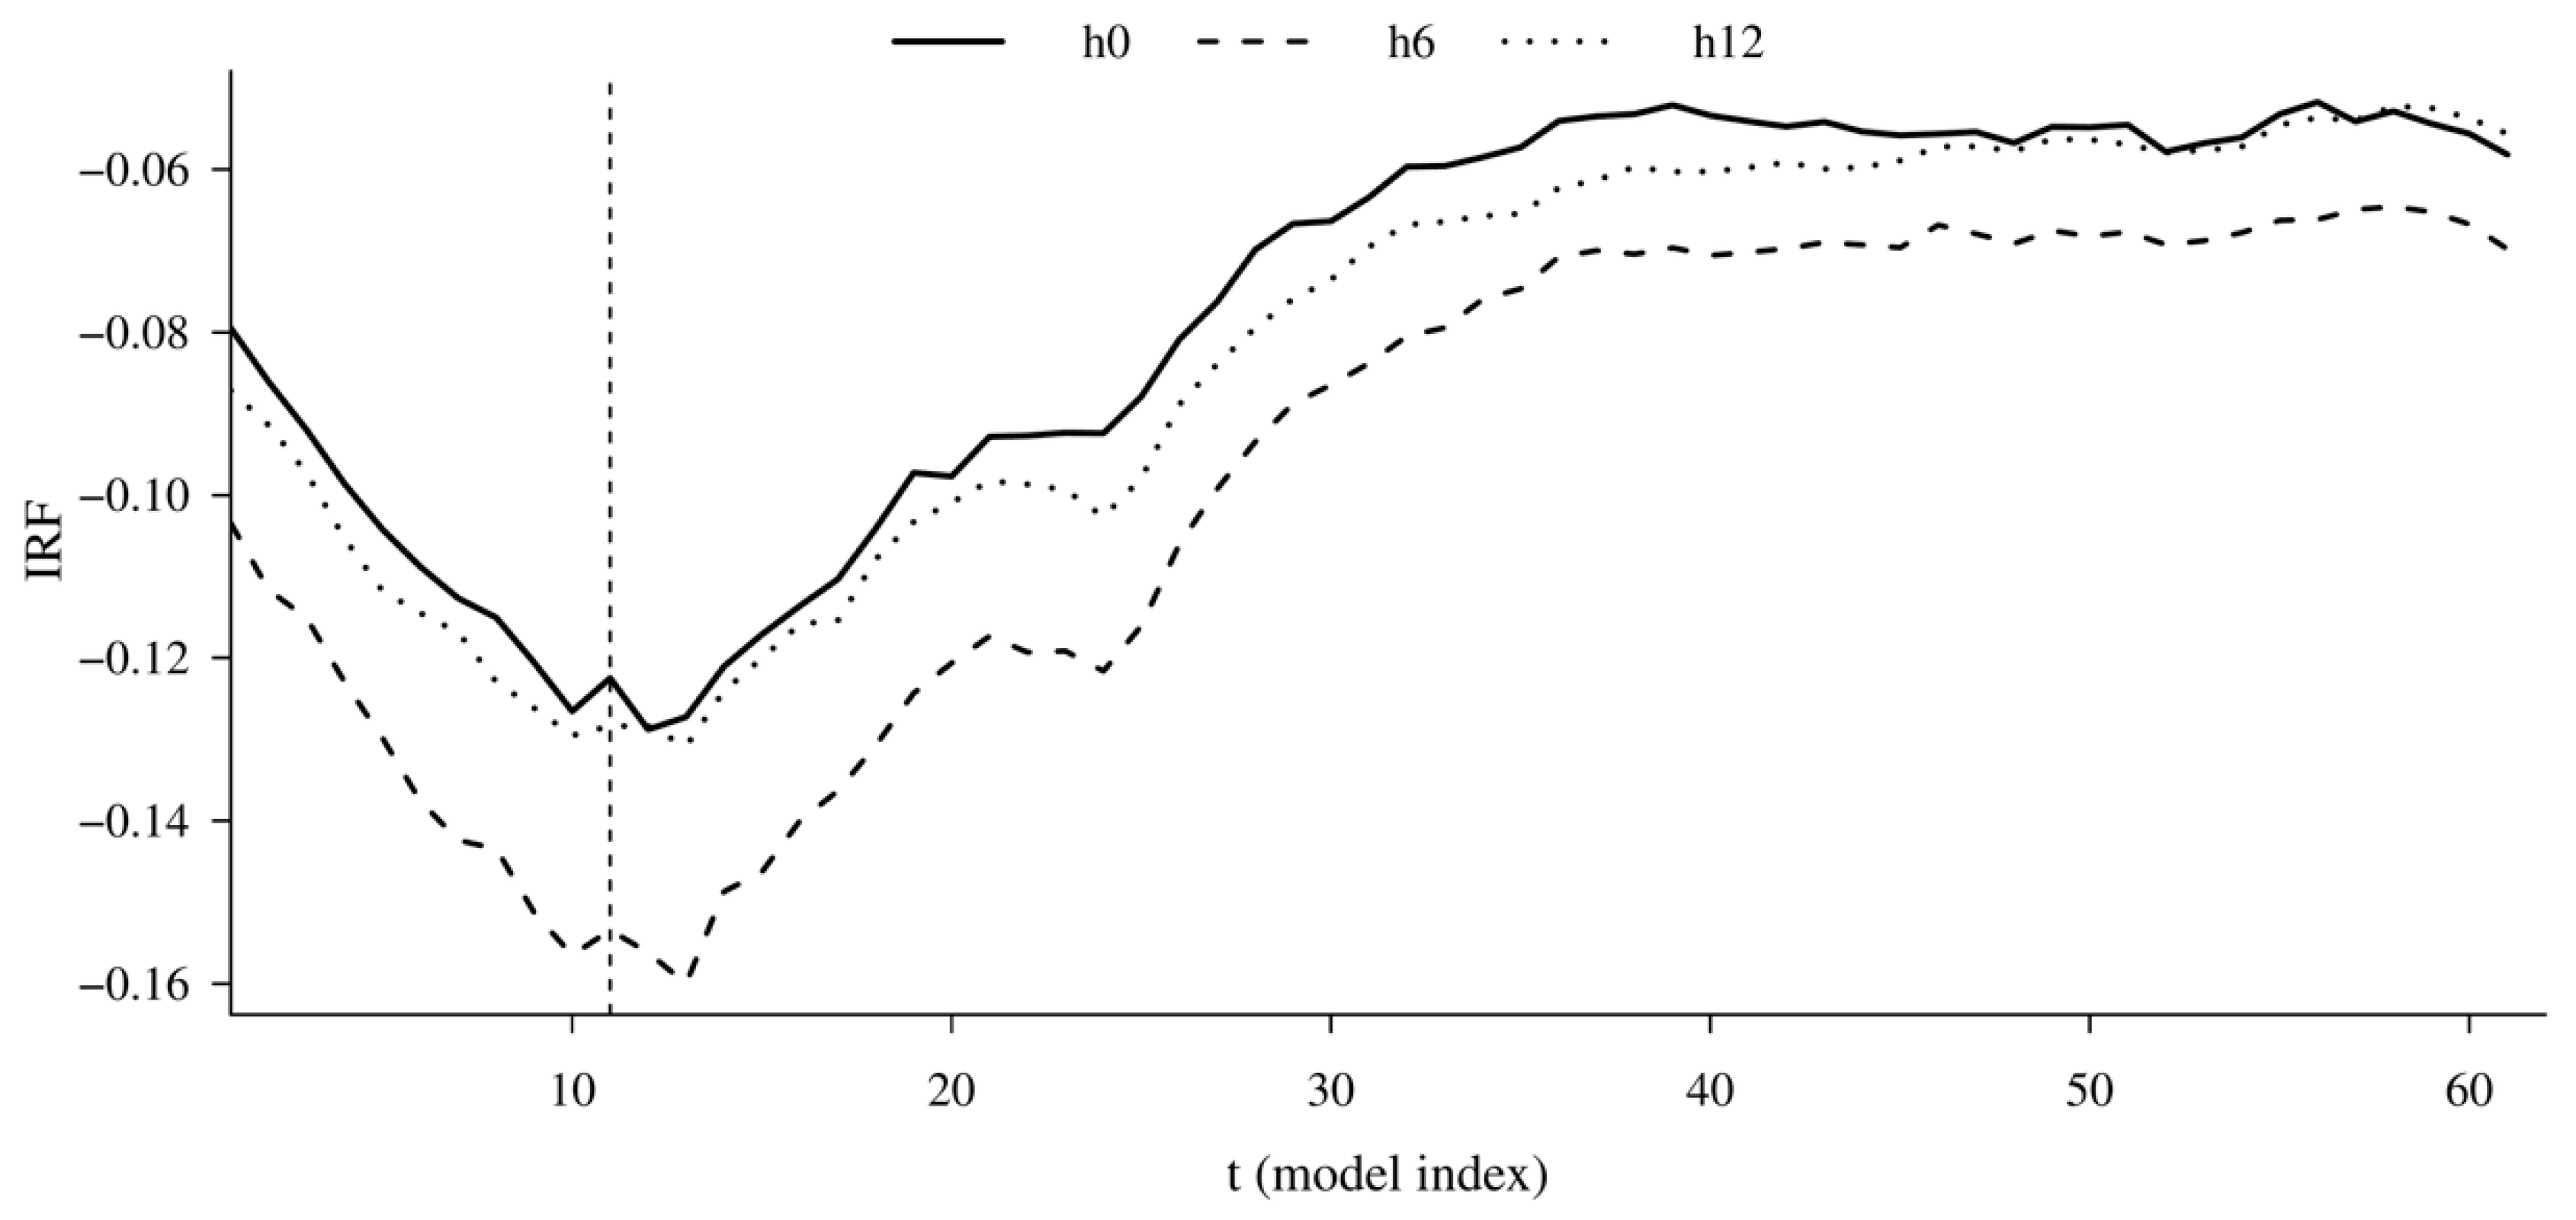
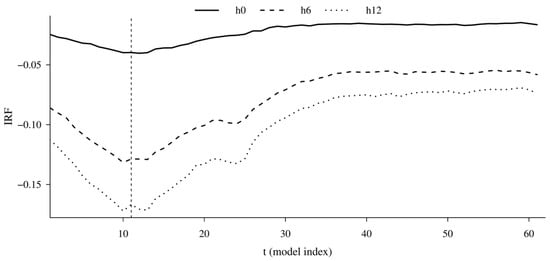
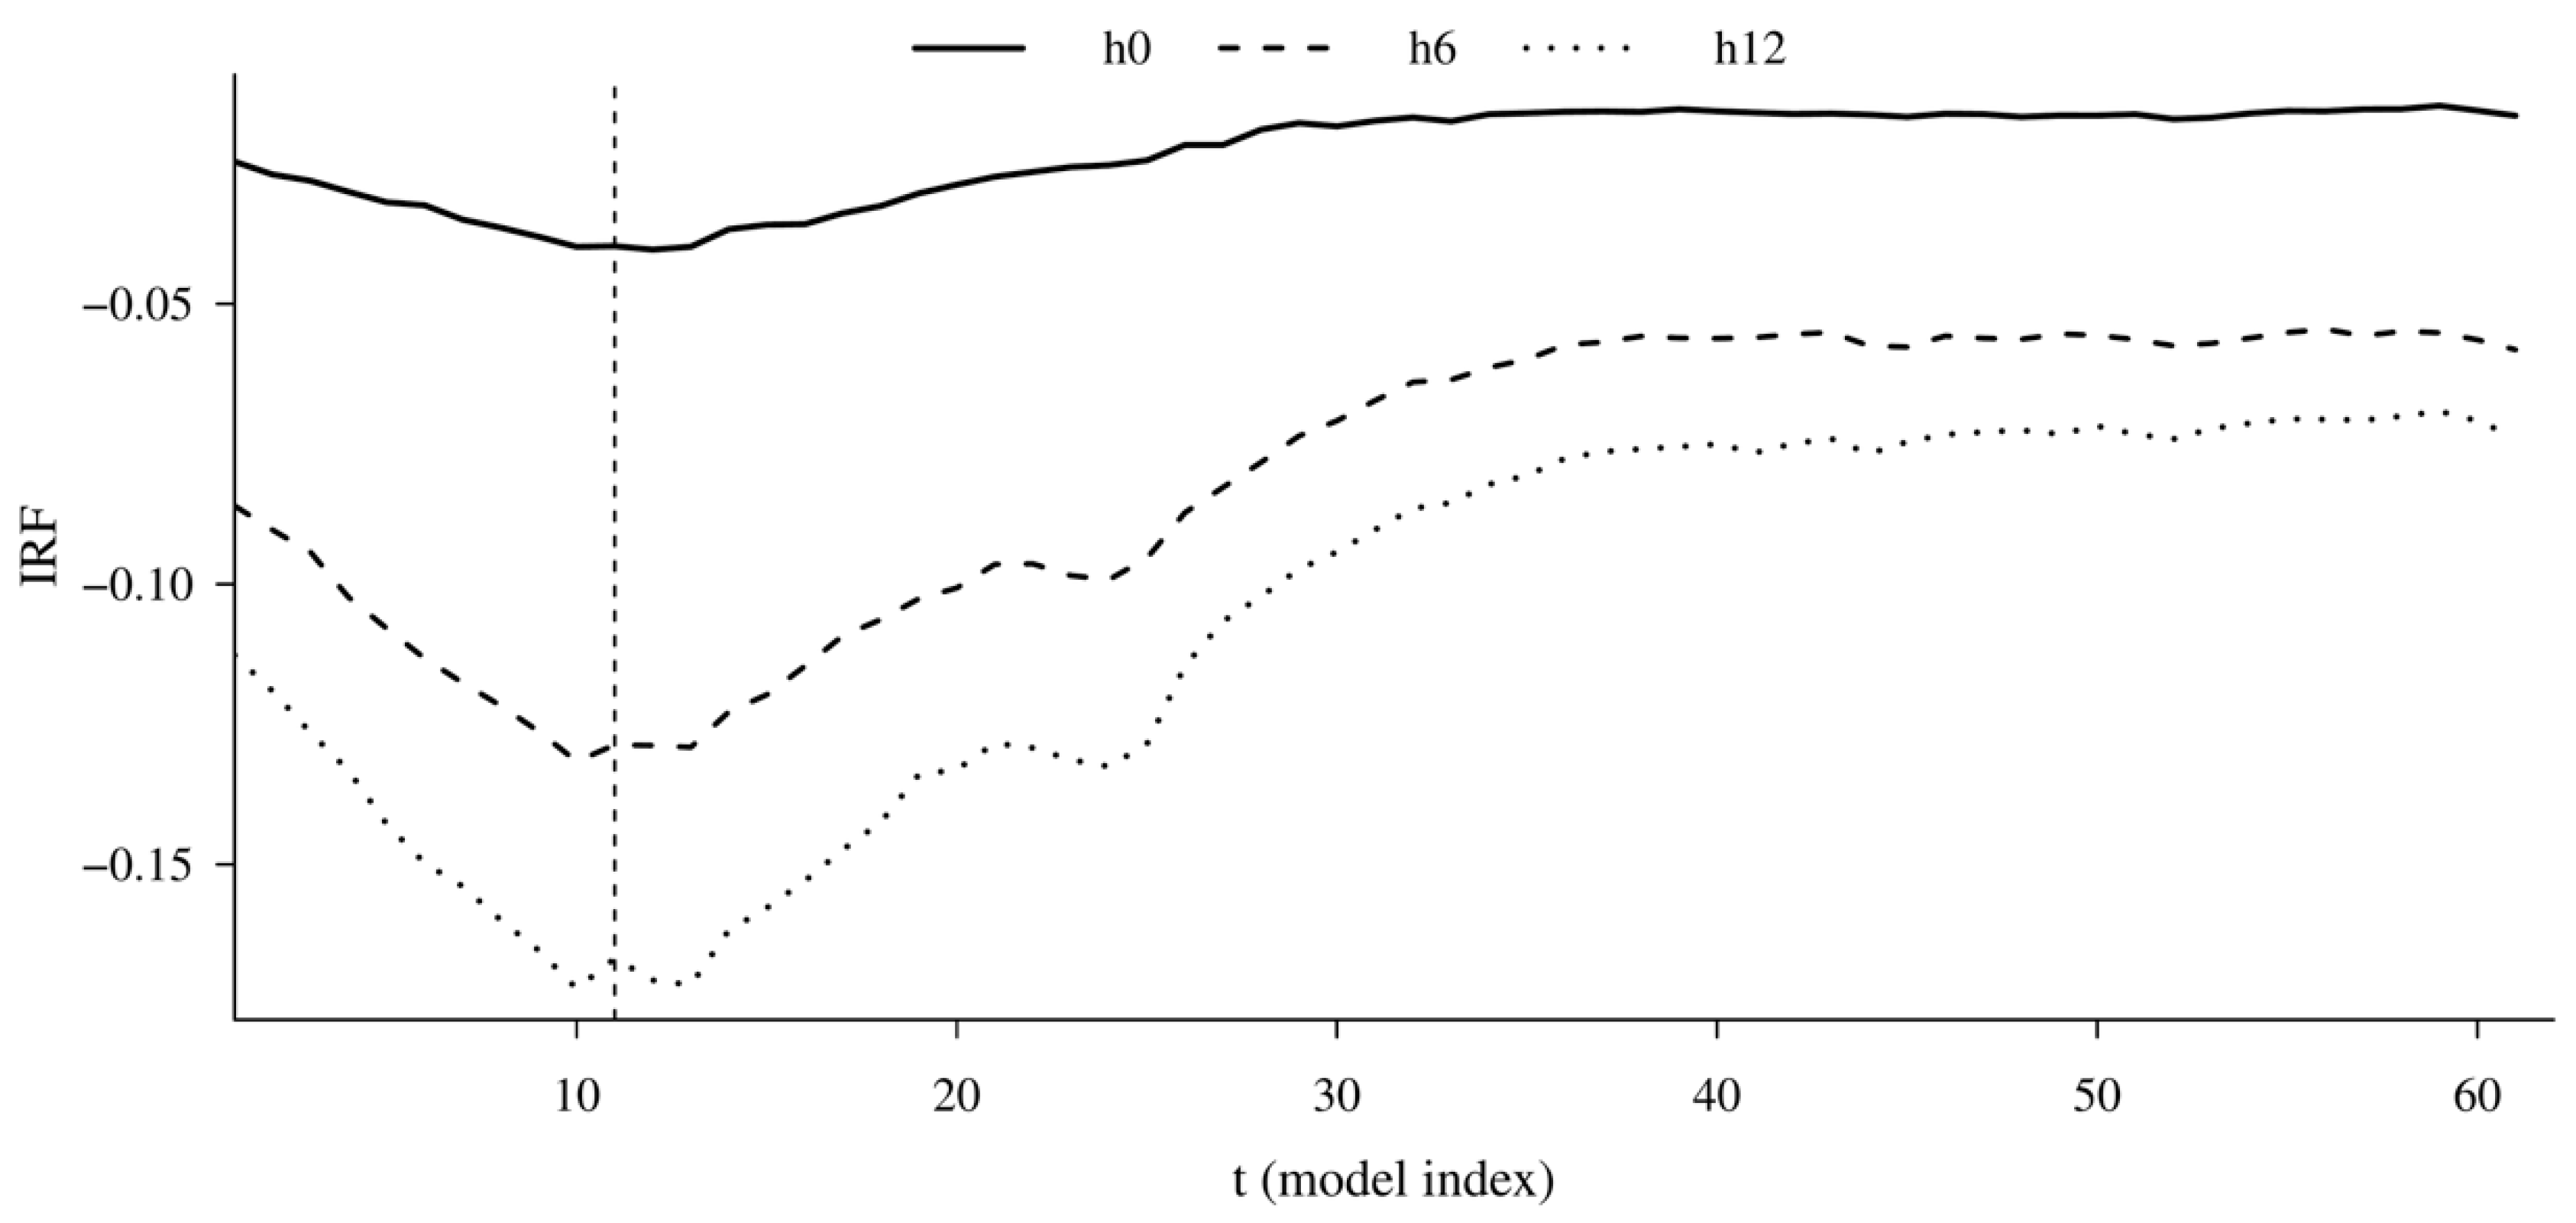
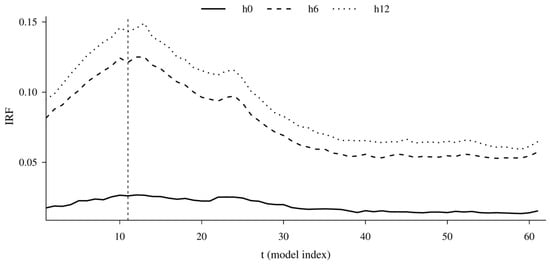
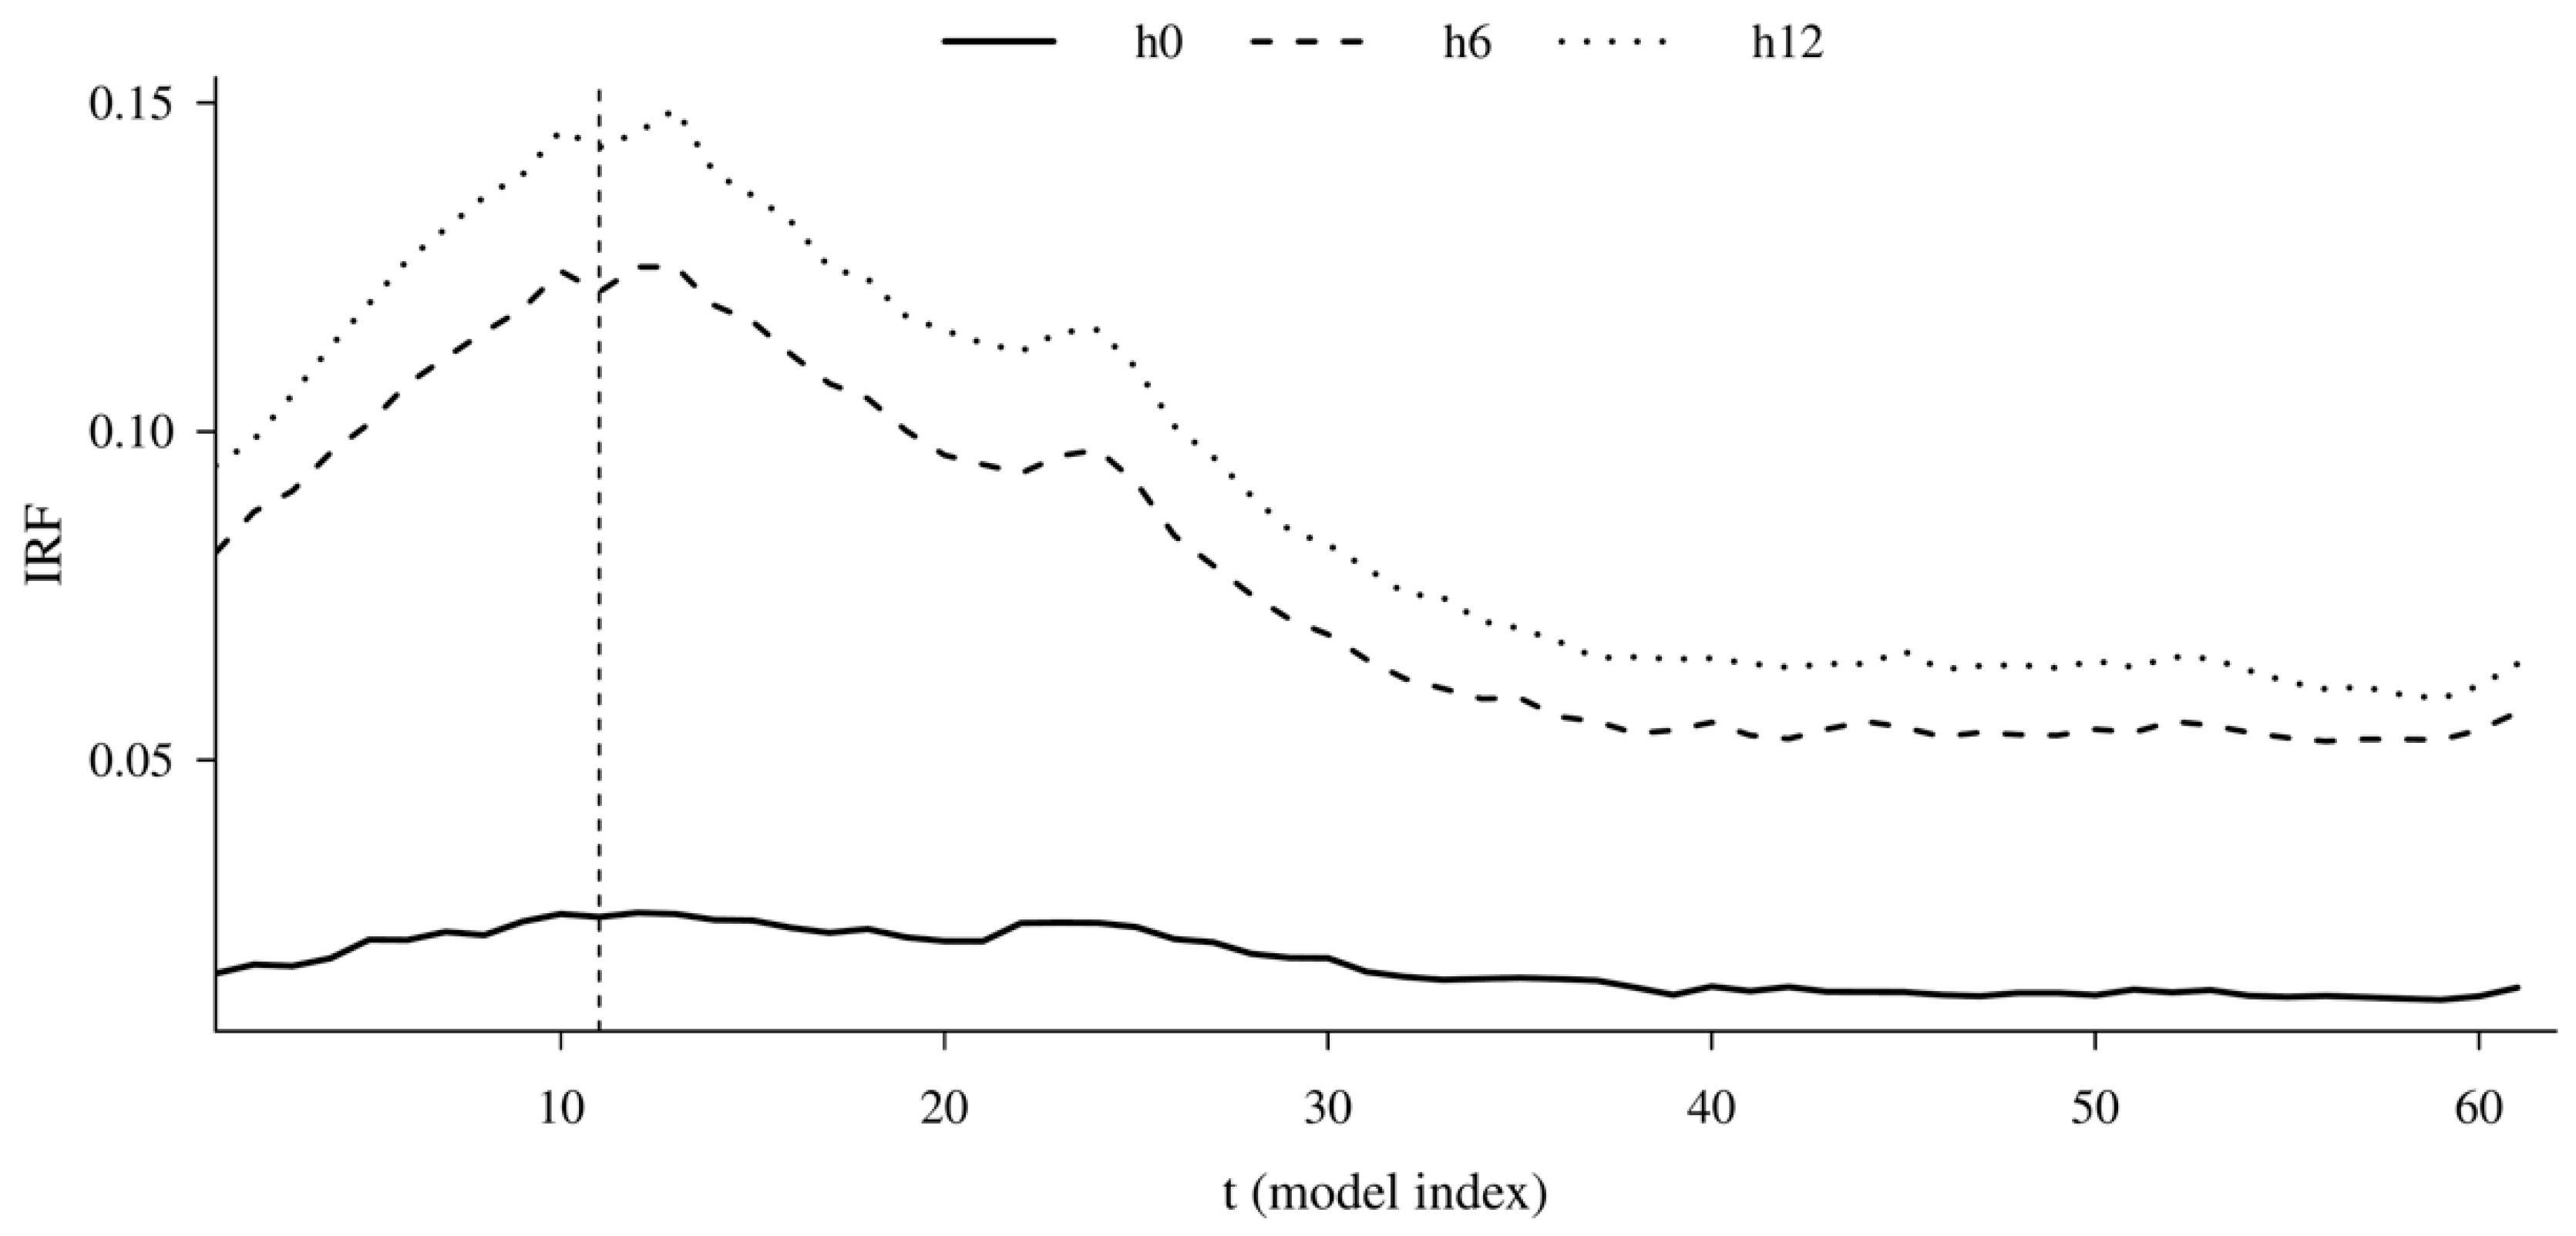
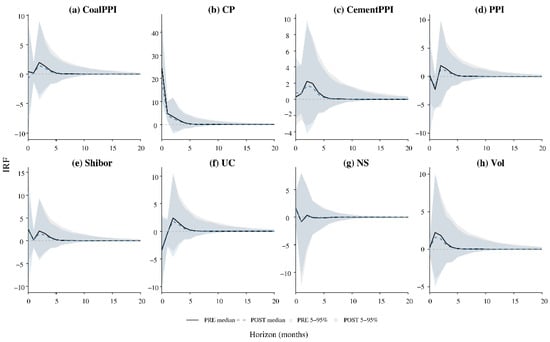
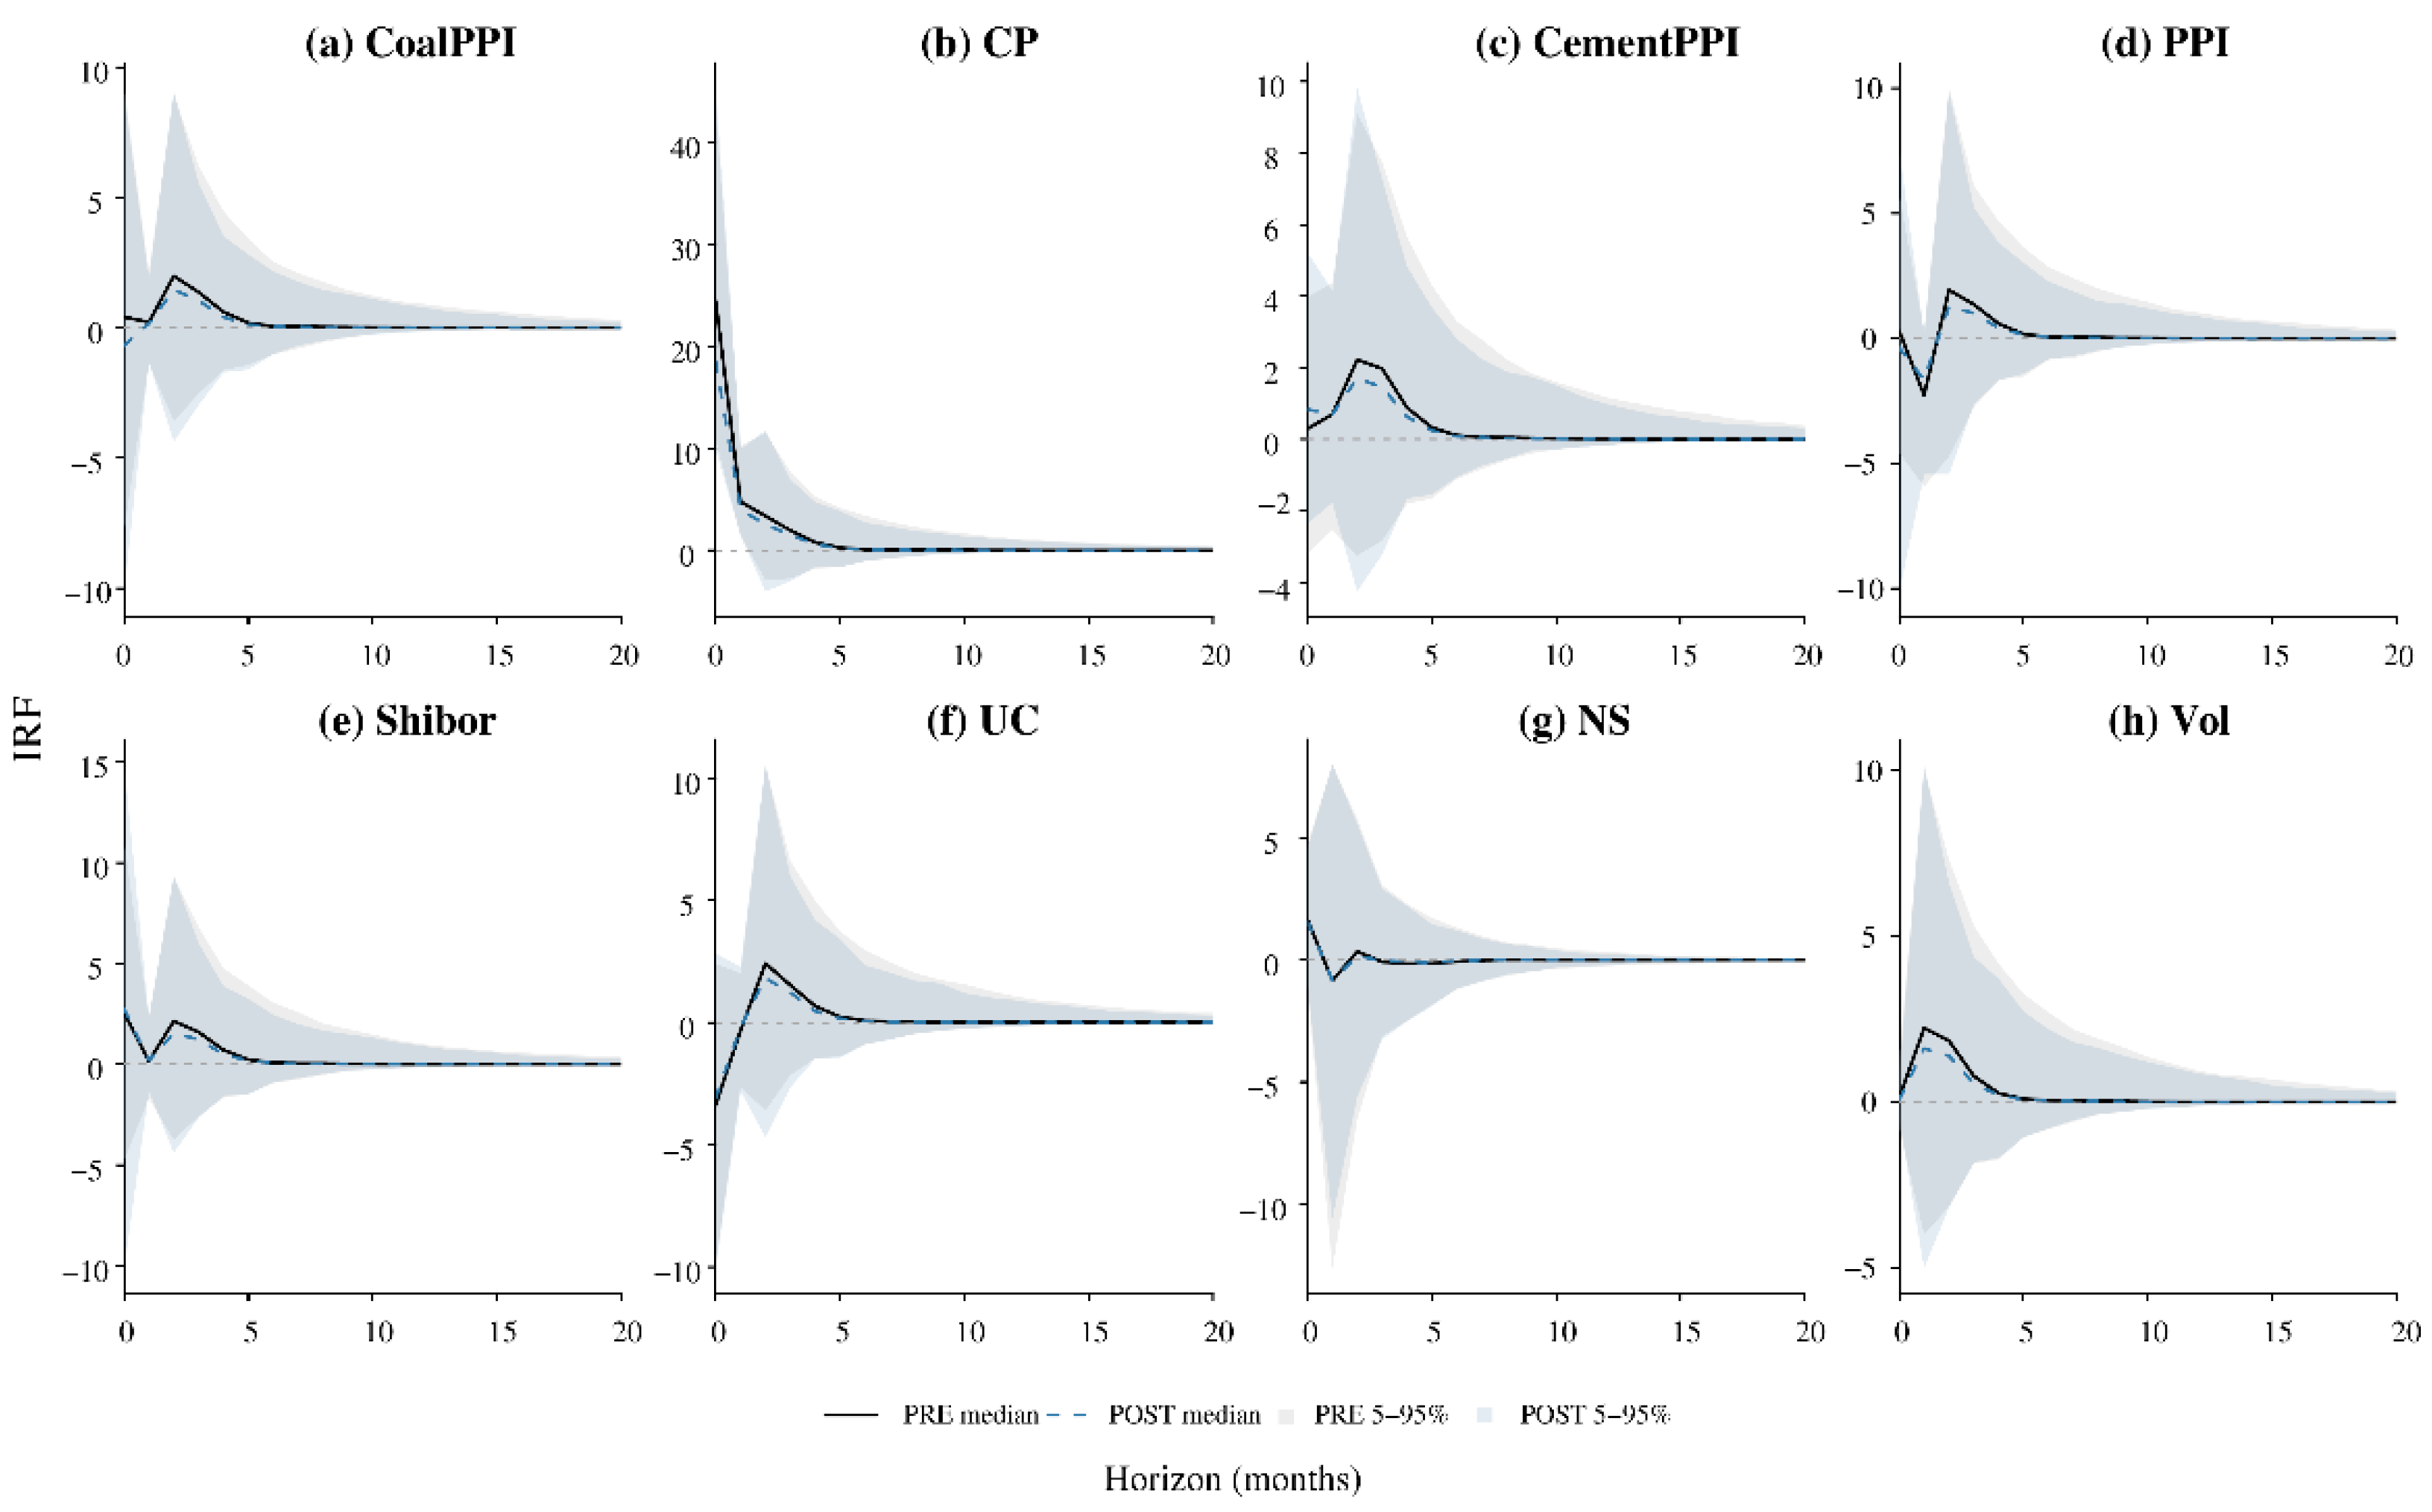
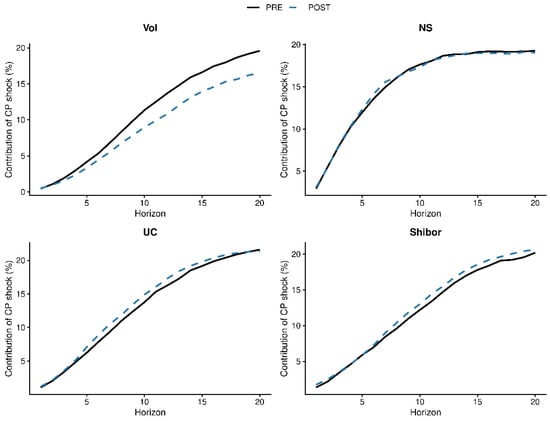
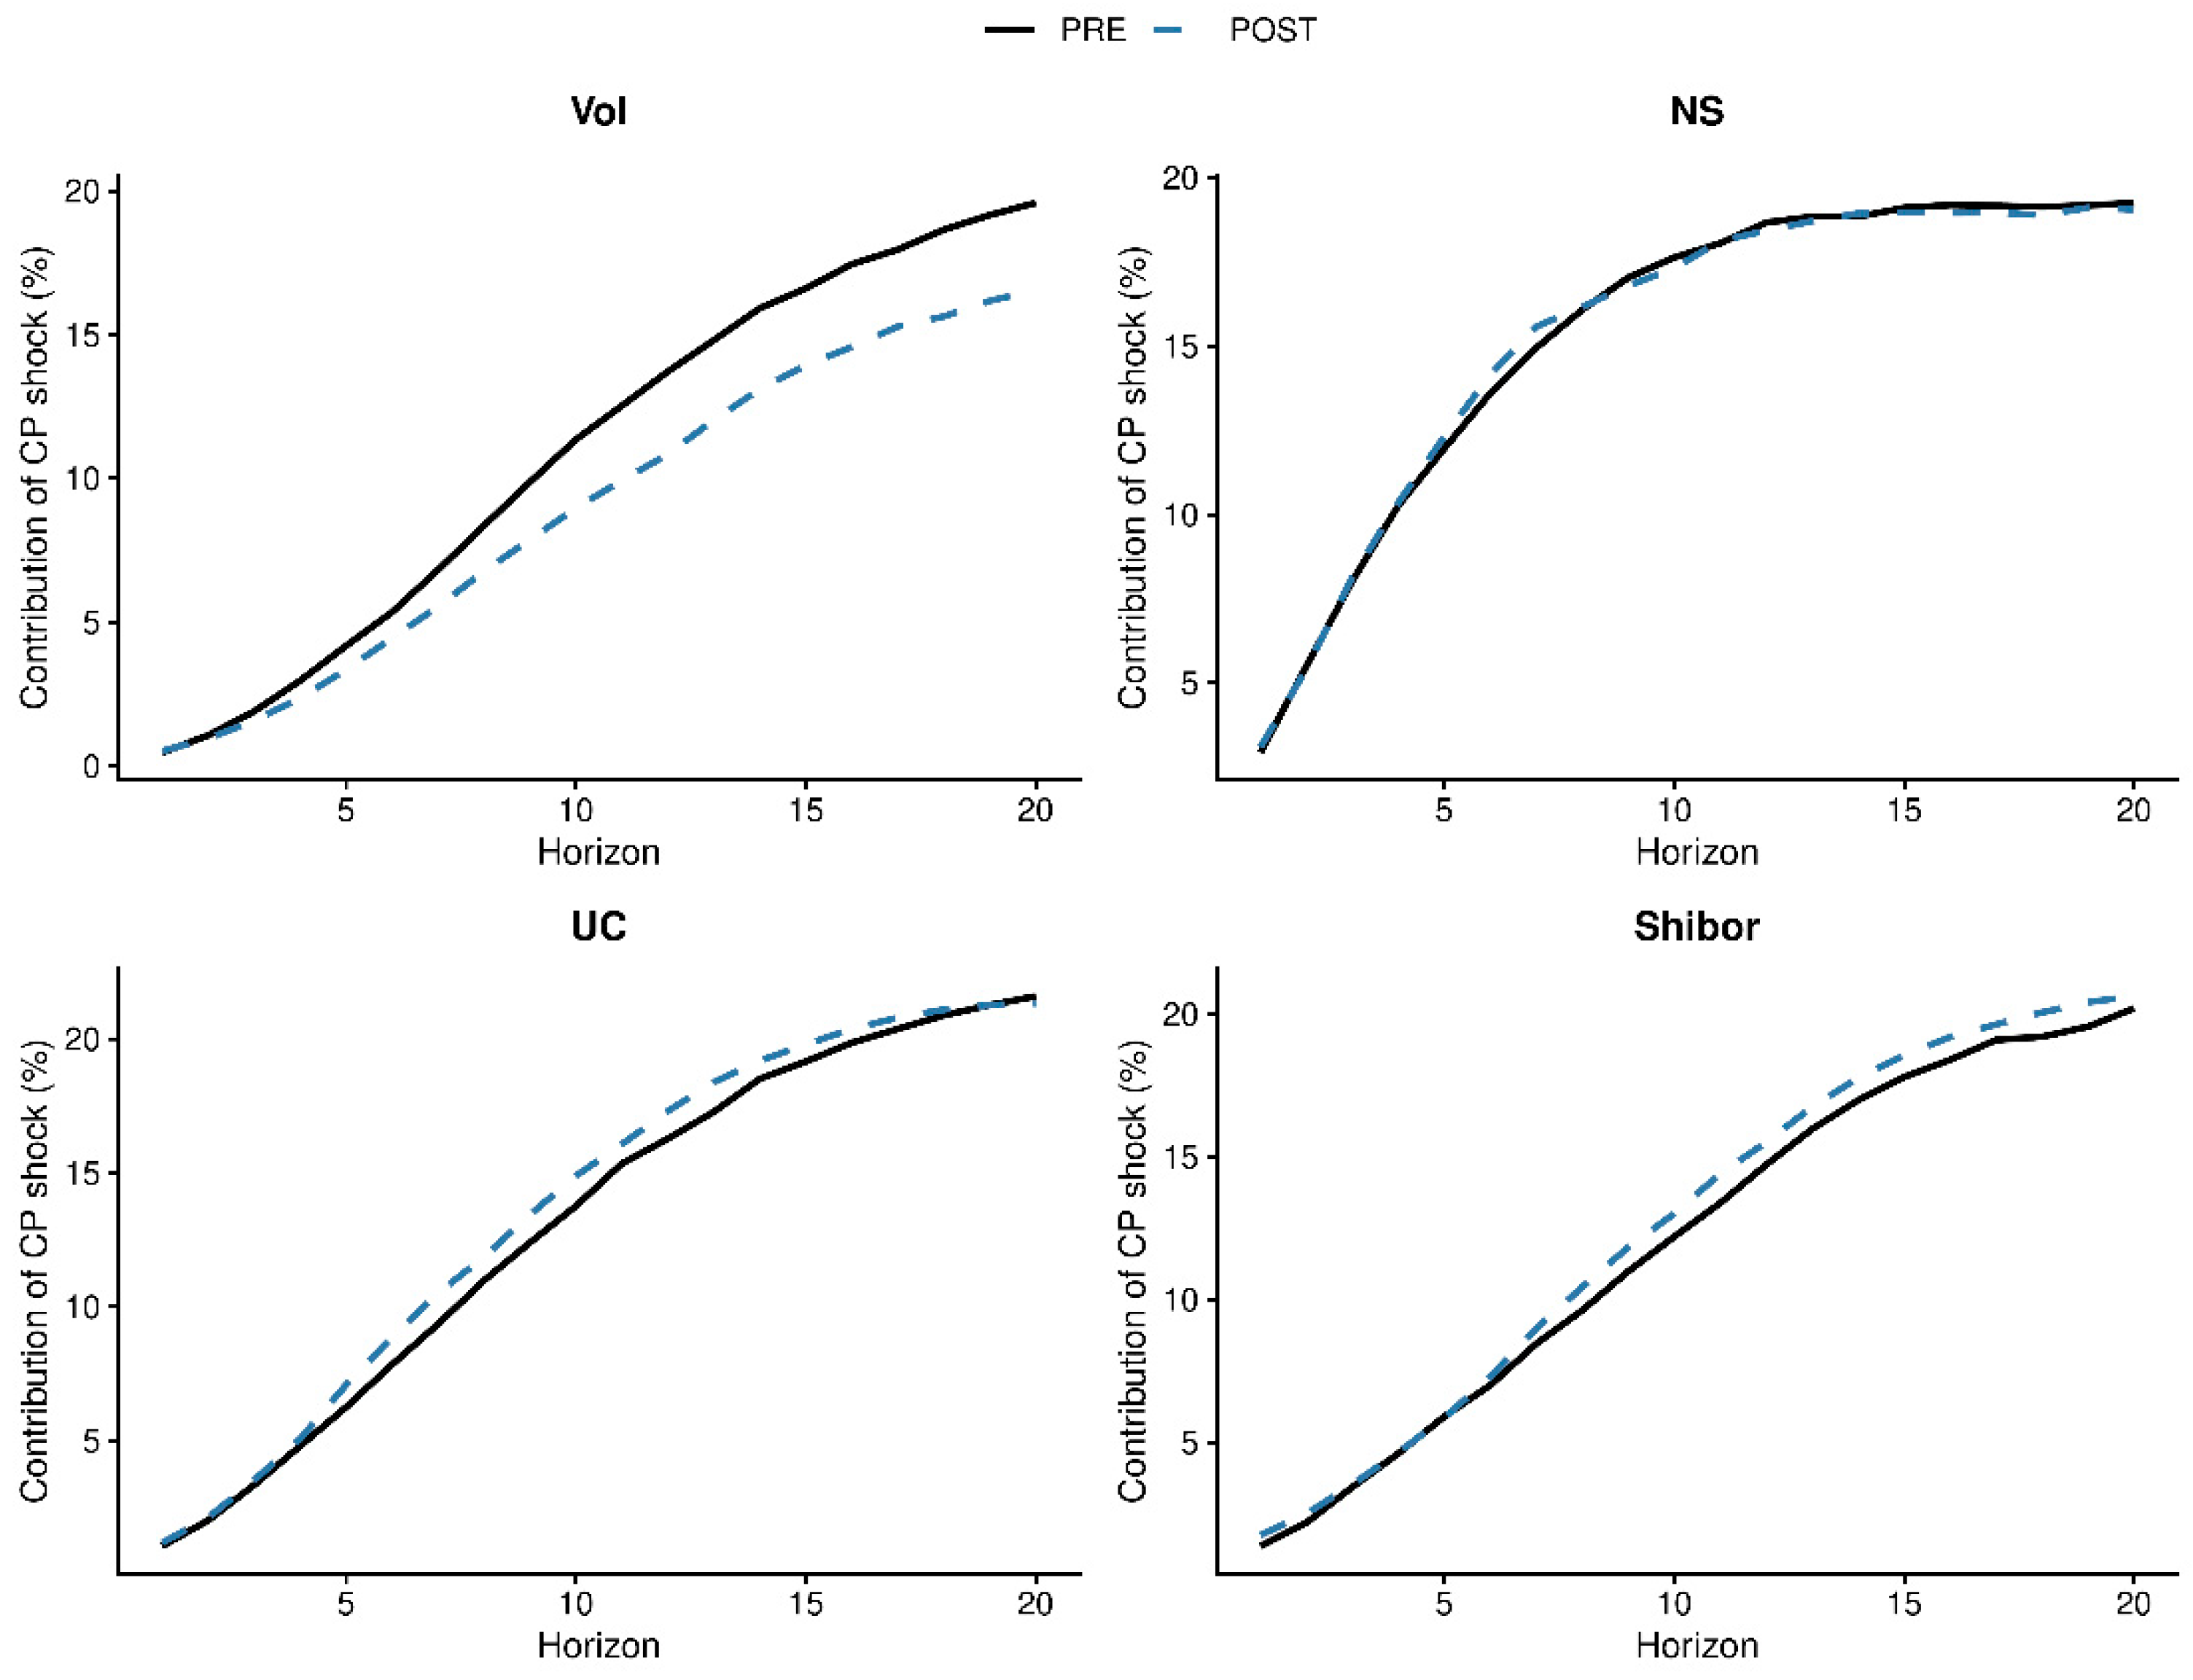
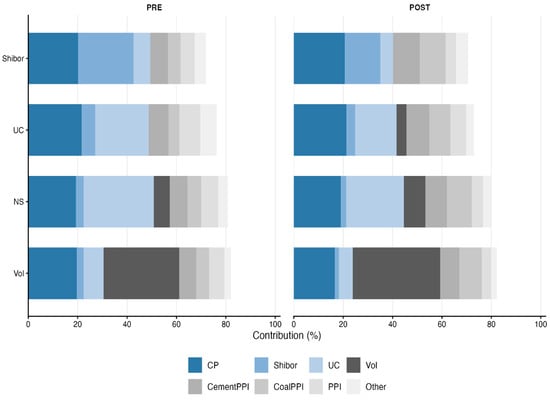
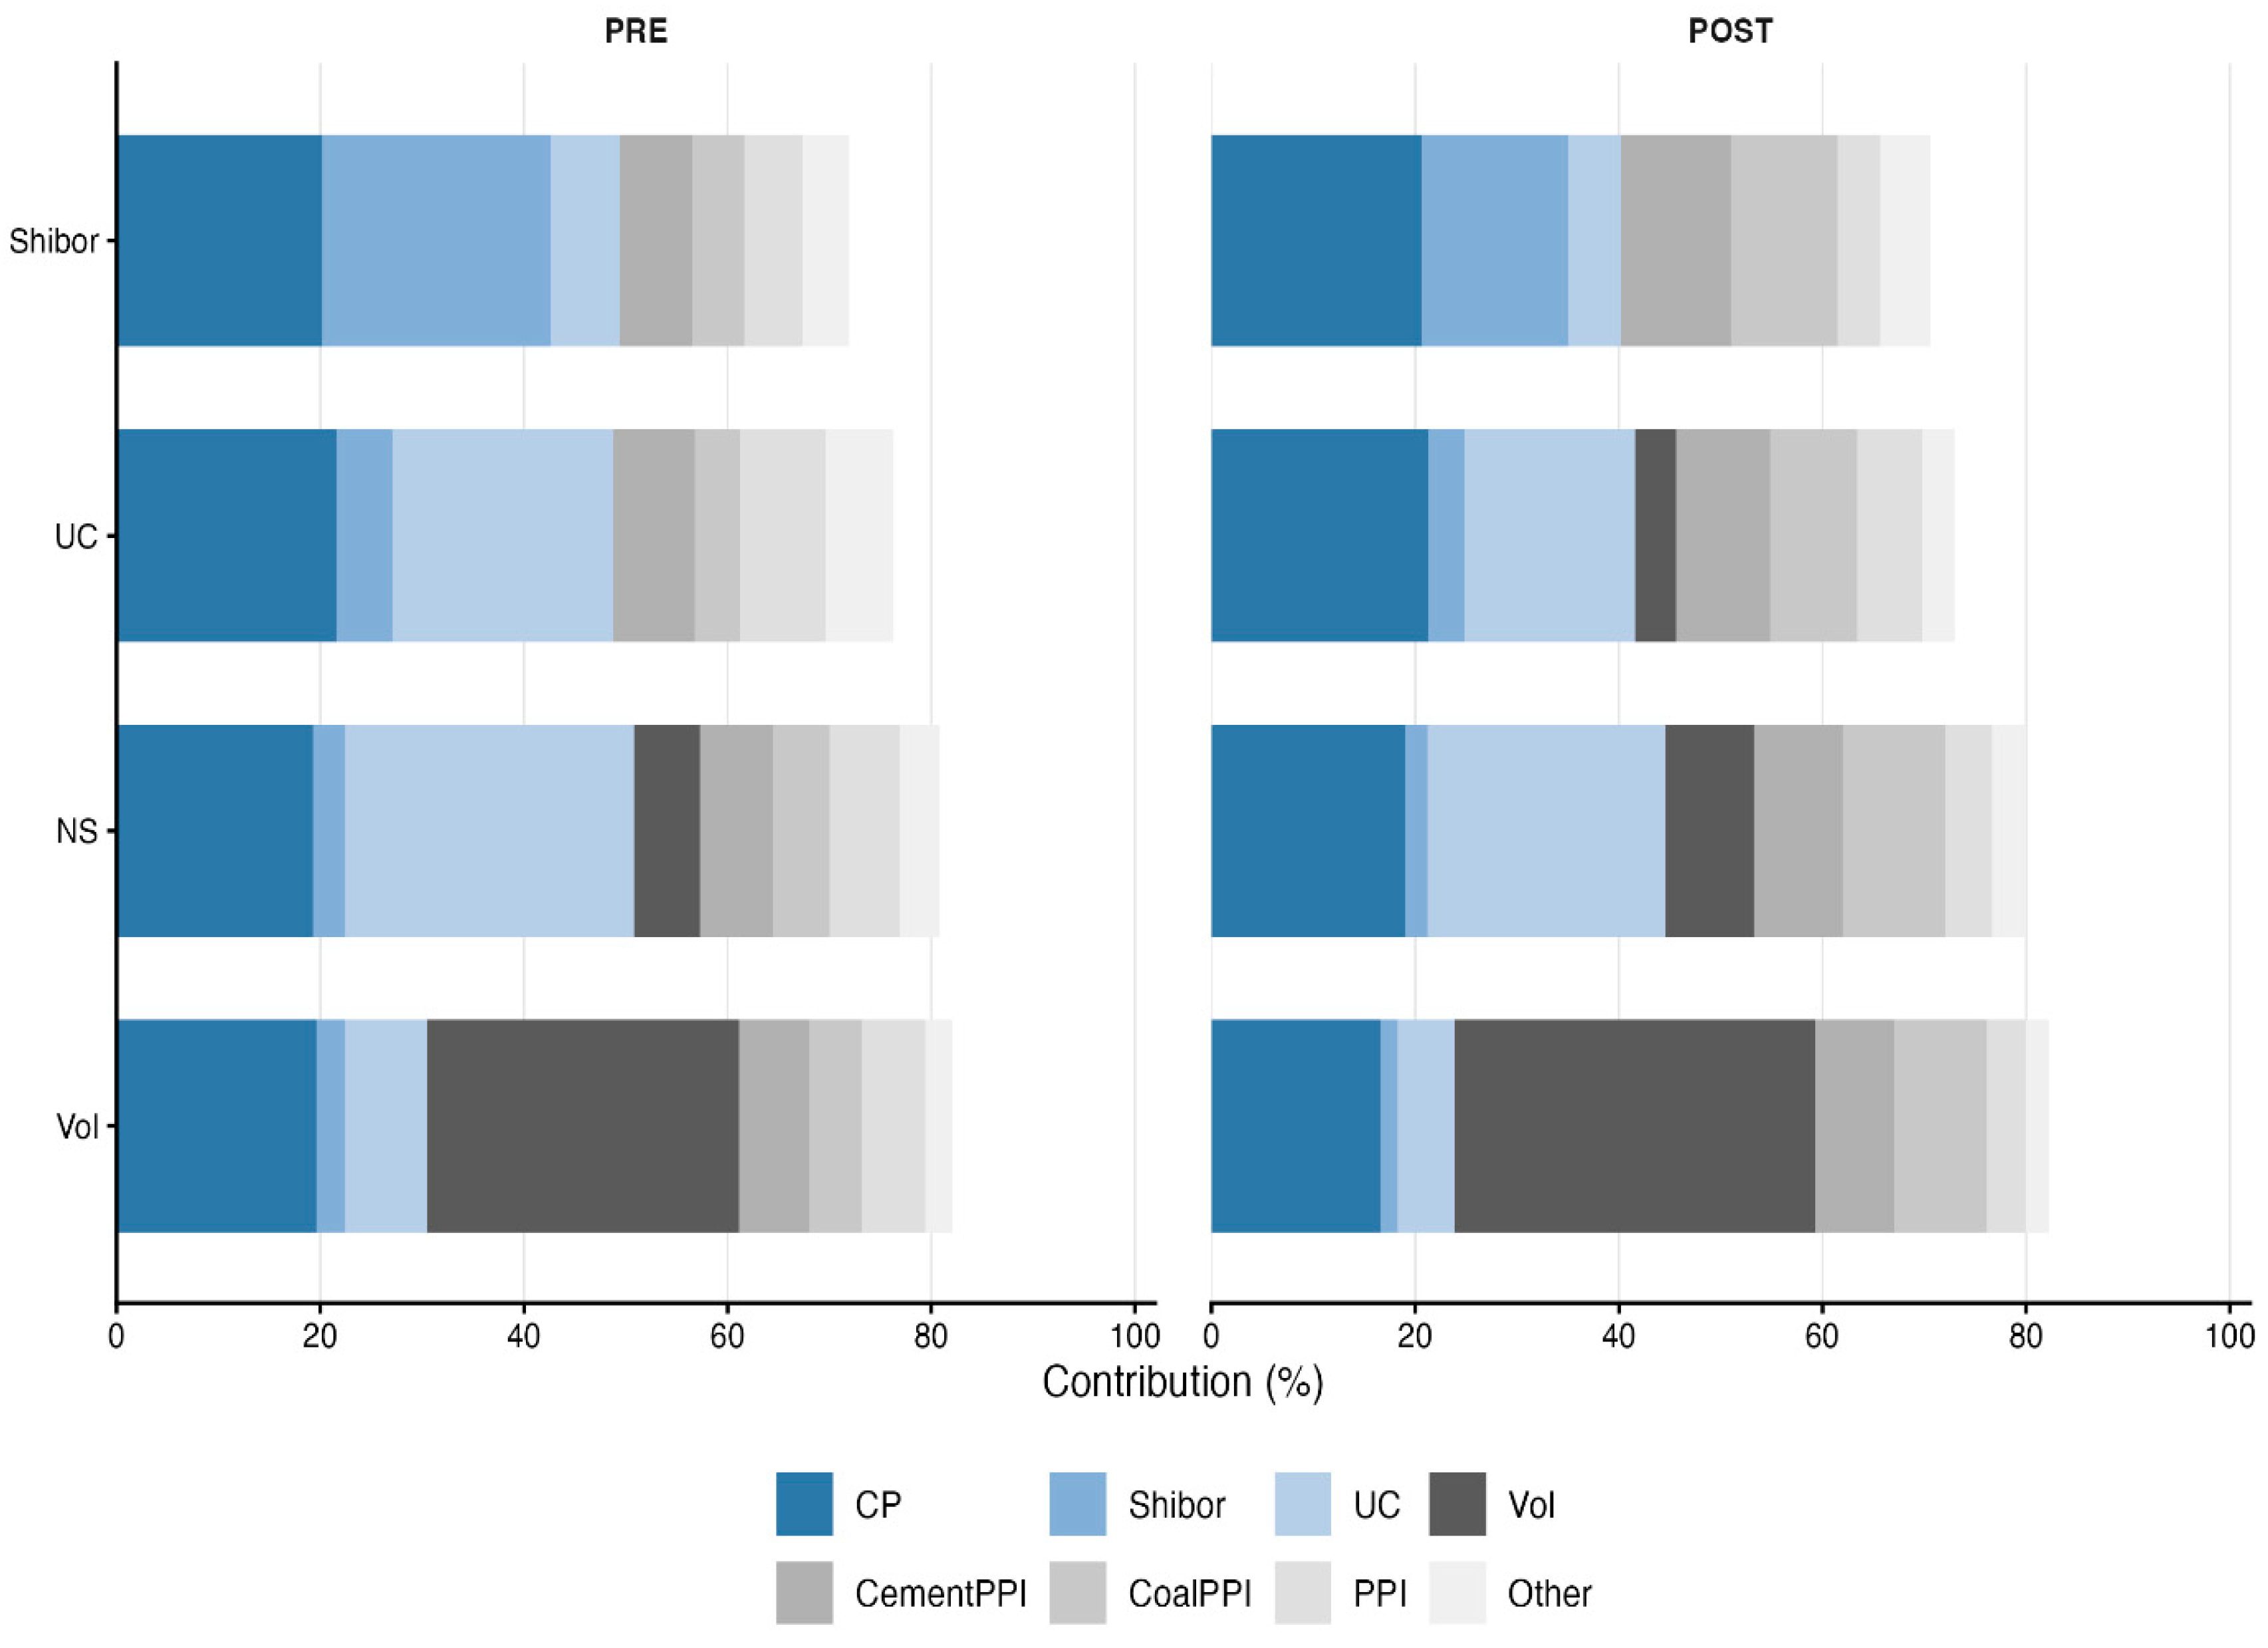
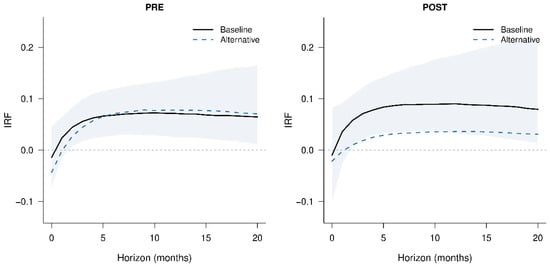
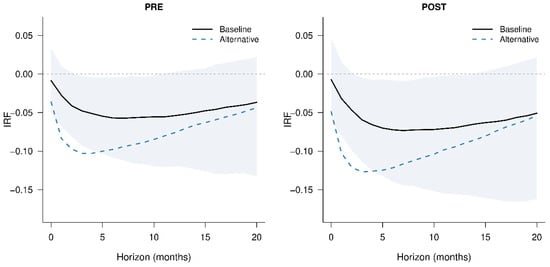
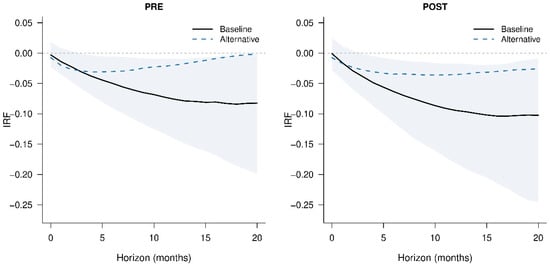
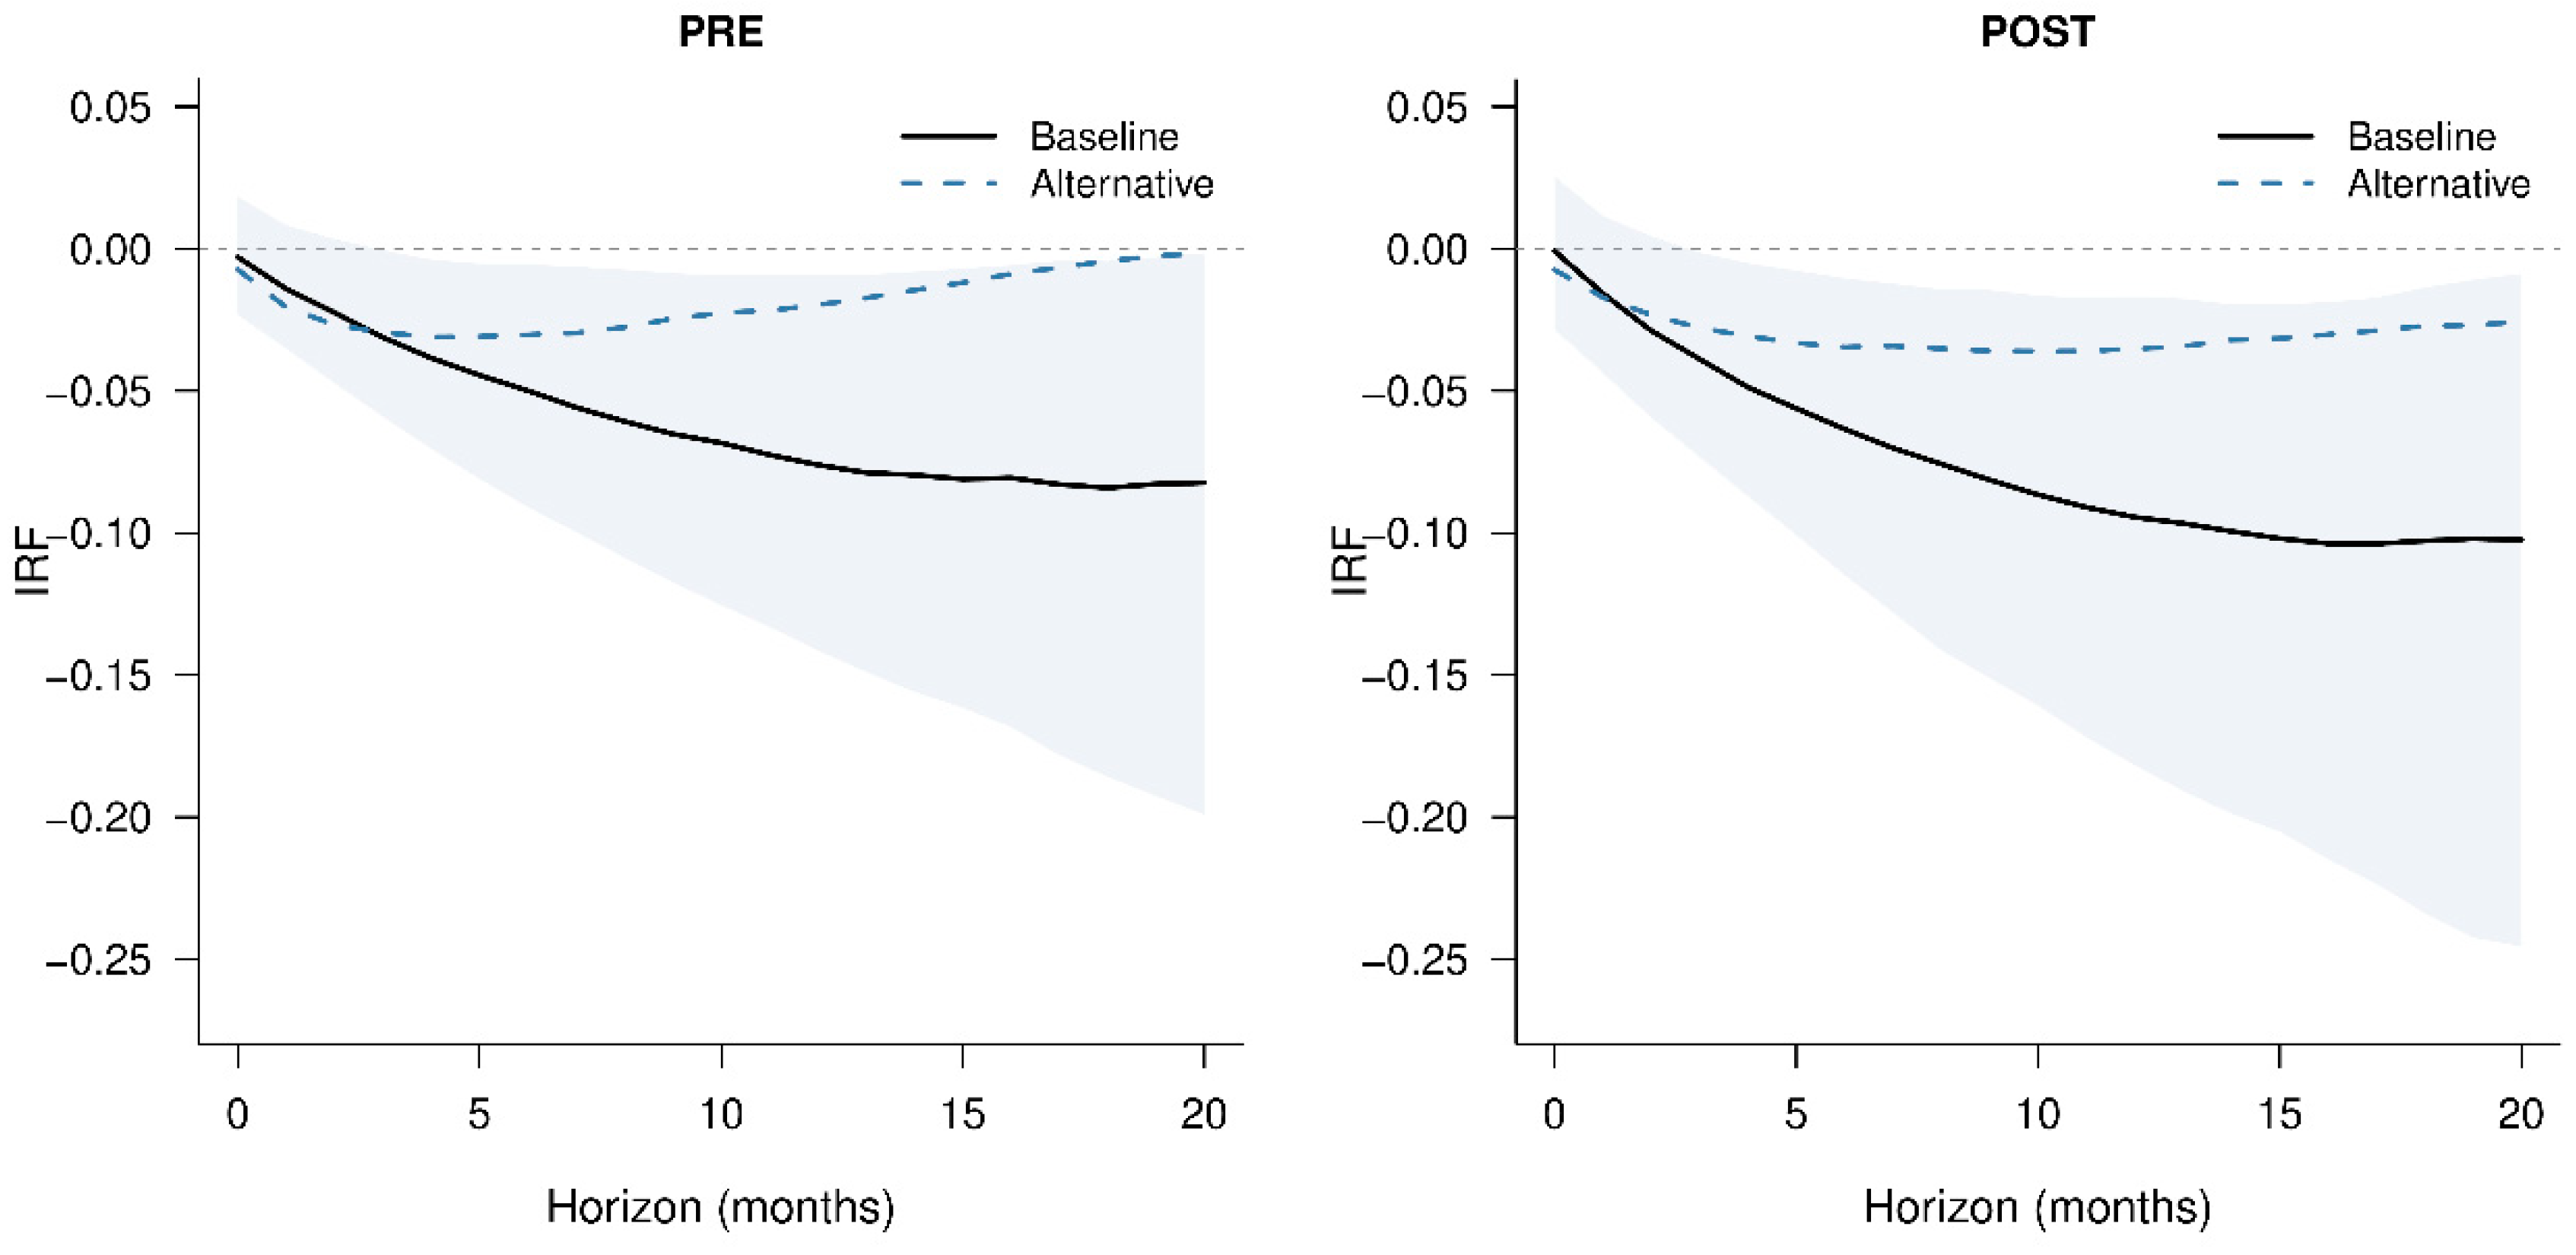

Disclaimer/Publisher’s Note: The statements, opinions and data contained in all publications are solely those of the individual author(s) and contributor(s) and not of MDPI and/or the editor(s). MDPI and/or the editor(s) disclaim responsibility for any injury to people or property resulting from any ideas, methods, instructions or products referred to in the content. |
© 2026 by the authors. Licensee MDPI, Basel, Switzerland. This article is an open access article distributed under the terms and conditions of the Creative Commons Attribution (CC BY) license.