


Abstract
Concrete structures frequently experience sustained loading during service, which may lead to crack propagation and eventual failure. In this study, three-point bending beams with heights of 200 mm and 300 mm were subjected to sustained load levels of 0.82, 0.84, and 0.86 of the peak load. The crack propagation process was monitored using the Digital Image Correlation (DIC) technique to capture full-field displacement and strain distributions. Analysis of the crack opening displacement (COD) and the fracture process zone (FPZ) revealed that concrete exhibits brittle fracture behavior under sustained loading, with the FPZ not fully developed at creep failure. The crack propagation process was further characterized into three stages. In the initial stage, crack development is mainly governed by viscoelastic deformation. In the intermediate stage, both viscoelasticity and the gradual decay of cohesive stresses within the FPZ contribute to crack growth. In the final unstable acceleration stage, crack propagation is dominated by cohesive stress degradation. Importantly, the crack length at creep failure closely matches the corresponding crack length on the descending branch of quasi-static loading, indicating a direct link between time-dependent creep fracture and quasi-static post-peak behavior. These results provide new insights into the time-dependent fracture mechanics of concrete, revealing the evolution of damage under long-term loading. The study emphasizes material behavior, including FPZ development and stage-wise crack propagation, offering a mechanistic understanding of creep fracture beyond the evaluation of measurement techniques.
1. Introduction
Concrete structures in service are frequently subjected to sustained loading, making it essential to investigate creep behavior to prevent sudden structural failure [1,2]. Various experimental techniques, such as strain gauges [3], X-ray imaging, and digital image correlation (DIC) [4], have been widely used to monitor creep deformation and crack development in concrete, among which DIC offers advantages for long-term measurements due to its non-contact nature and high stability [5].
Creep deformation is generally characterized by three distinct stages, governed by the coupled effects of viscoelastic deformation and crack propagation in concrete [6,7]. In the initial stage, the response is primarily dominated by viscoelastic behavior, while in the intermediate stage both viscoelastic deformation and crack propagation contribute to the deformation process. In the final stage, crack propagation becomes dominant, leading to accelerated deformation and eventual failure [8]. It is widely recognized that creep fracture is not purely a viscoelastic phenomenon but is controlled by the interaction between time-dependent deformation and progressive damage evolution [9,10]. Early studies based on the fictitious crack concept incorporated cohesive stress relaxation to describe crack growth under sustained loading [11]. Subsequent developments introduced rheological and micromechanical formulations to account for tension-softening behavior and its influence on crack propagation [12,13,14]. More recent studies have shown that creep fracture can be consistently interpreted within a viscoelastic-damage framework, in which microcrack initiation, growth, and coalescence lead to the formation of a fracture process zone (FPZ), where damage localizes and evolves over time [15,16,17]. As creep progresses, the gradual reduction of cohesive stresses within the FPZ governs crack propagation, eventually resulting in unstable fracture [7,15,18].
In this context, it is important to emphasize that crack propagation plays a decisive role in creep failure. If only viscoelastic deformation is considered, the creep lifetime of concrete will be significantly overestimated [19,20,21]. Therefore, it is essential to incorporate crack propagation mechanisms when analyzing creep behavior under sustained loading, particularly at high load levels [22]. Recent studies have further indicated that the static load–displacement curve provides an envelope for creep fracture behavior. Specifically, creep failure occurs when the displacement during creep reaches the corresponding value on the descending branch of the static curve at the same load level [18]. This observation provides a critical basis for establishing creep failure criteria and predicting the creep fracture lifetime of concrete. Despite these advances, several important issues remain insufficiently understood. In particular, the relationship between time-dependent crack propagation and the critical state of creep failure has not been fully clarified. Most existing studies focus either on deformation behavior or post-creep fracture response, while the direct characterization of crack evolution up to creep failure remains limited [23,24]. Recent studies have indicated that the static load–displacement curve may provide a useful reference for interpreting creep fracture behavior. Specifically, creep failure has been reported to occur when the displacement during creep approaches the corresponding value on the descending branch of the static curve at the same load level. However, this relationship should be regarded as conditional and dependent on specimen geometry, material properties, loading path, and environmental conditions. Therefore, further experimental evidence is still needed to examine whether a similar correspondence exists for crack length evolution under sustained loading.
In this study, the crack propagation behavior of concrete under sustained loading is investigated using digital image correlation (DIC). The evolution of crack length is continuously monitored throughout the creep process, and special attention is given to the relationship between the crack length at creep failure and that on the quasi-static descending branch. It should be noted that this relationship is examined within the specific experimental framework of the present study, including the selected TPB specimen geometries, load levels, material composition, and testing conditions. The results aim to provide experimental insight into the mechanism of creep fracture and to establish an empirical basis for assessing creep failure under similar conditions.
2. Experimental Programs
2.1. Specimen Preparations
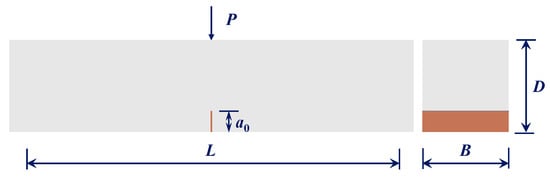
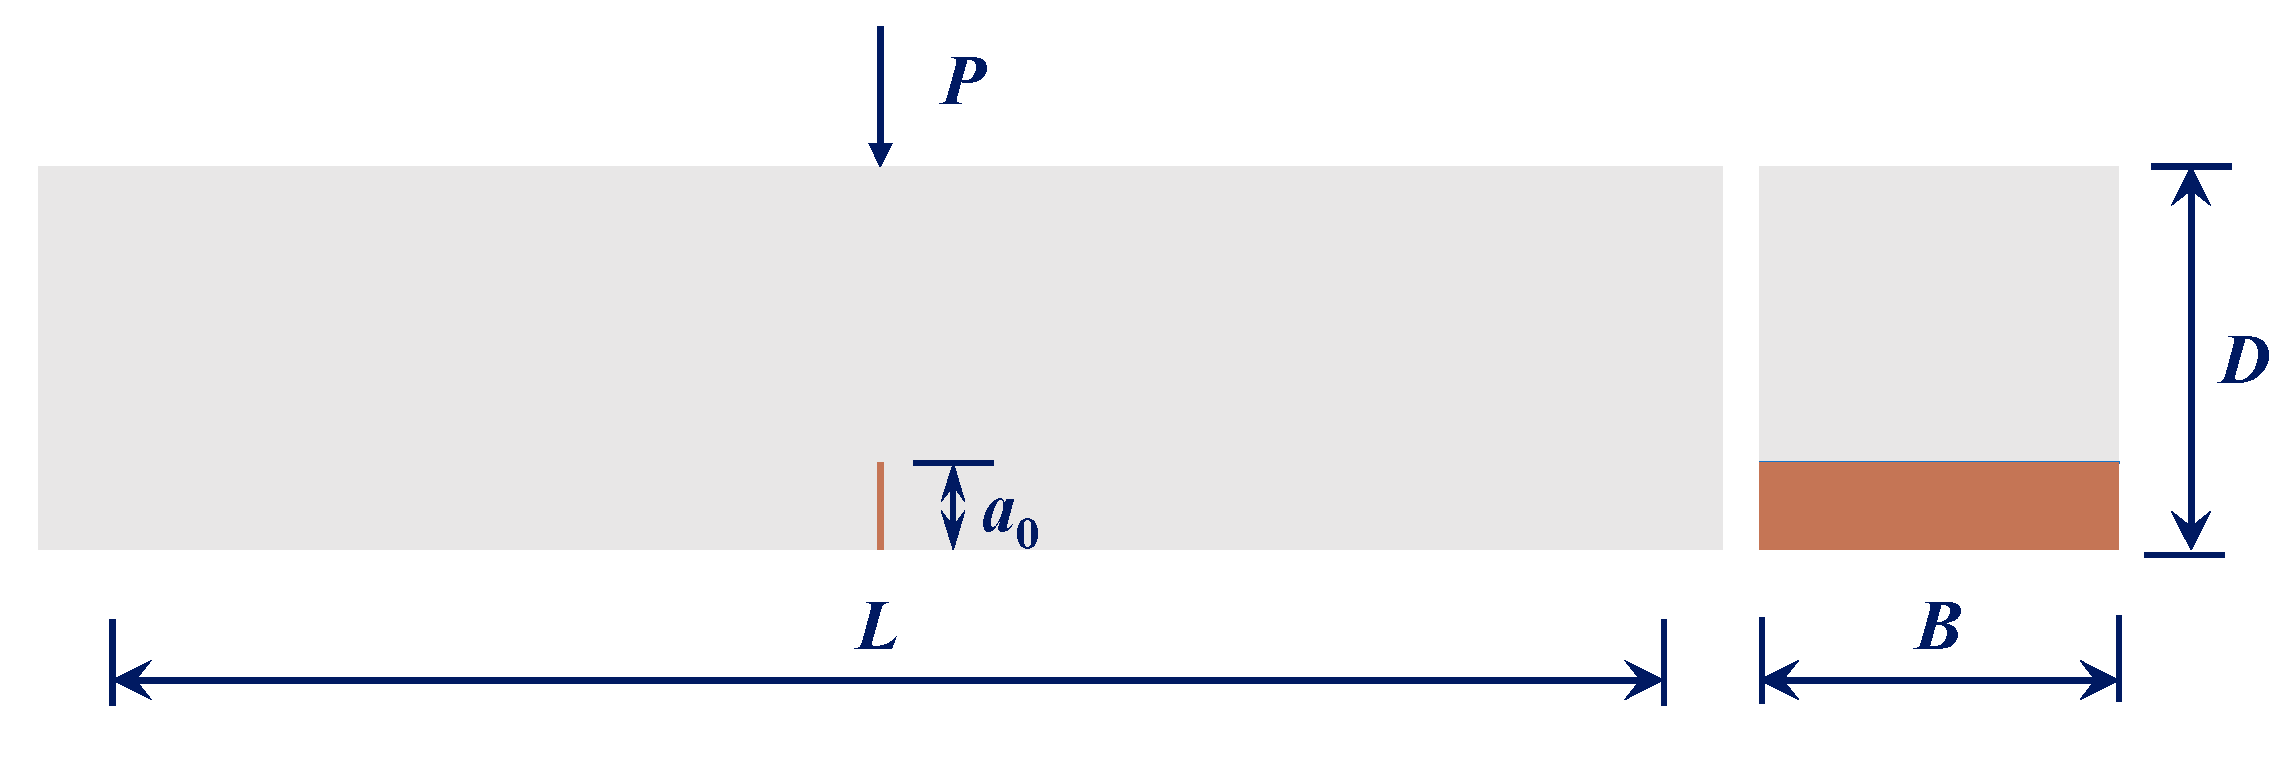
In this study, TPB beams were employed to investigate the concrete creep fracture behavior. Two specimen sizes were designed, each with a span-to-height ratio of 4.0 and an initial crack-to-height ratio of 0.3. A schematic diagram of the specimen geometry is presented in Figure 1, and Table 1 lists the dimensions, where L denotes the span, B the width, D the height, and a0 the initial crack length. The mix proportion was 325:195:696:1184 (cement: water: fine aggregate: coarse aggregate, kg/m3), using P.O 42.5 ordinary Portland cement, natural river sand, and crushed limestone (max size 10 mm) as coarse aggregate. In addition to the bending specimens, six cubic specimens (150 mm × 150 mm × 150 mm) were cast to determine the cubic compressive strength and split tensile strength, and three prismatic specimens (300 mm × 150 mm × 150 mm) were prepared to measure the modulus of elasticity and Poisson’s ratio. To eliminate the influence of strength development on creep deformation, all specimens were subjected to 8 months of curing prior to test to ensure stable material properties. Upon completion of curing, the average cubic compressive strength fc, split tensile strength ft, Poisson’s ratio, and modulus of elasticity Ec were measured as 49.70 MPa, 3.82 MPa, 0.20, and 34.41 GPa, respectively.
Figure 1.
TPB beam schematic.
Table 1.
Geometric dimensions of the specimen.
2.2. Quasi-Static Fracture Tests
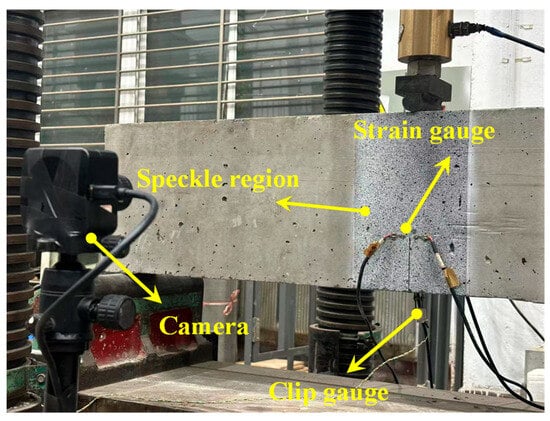
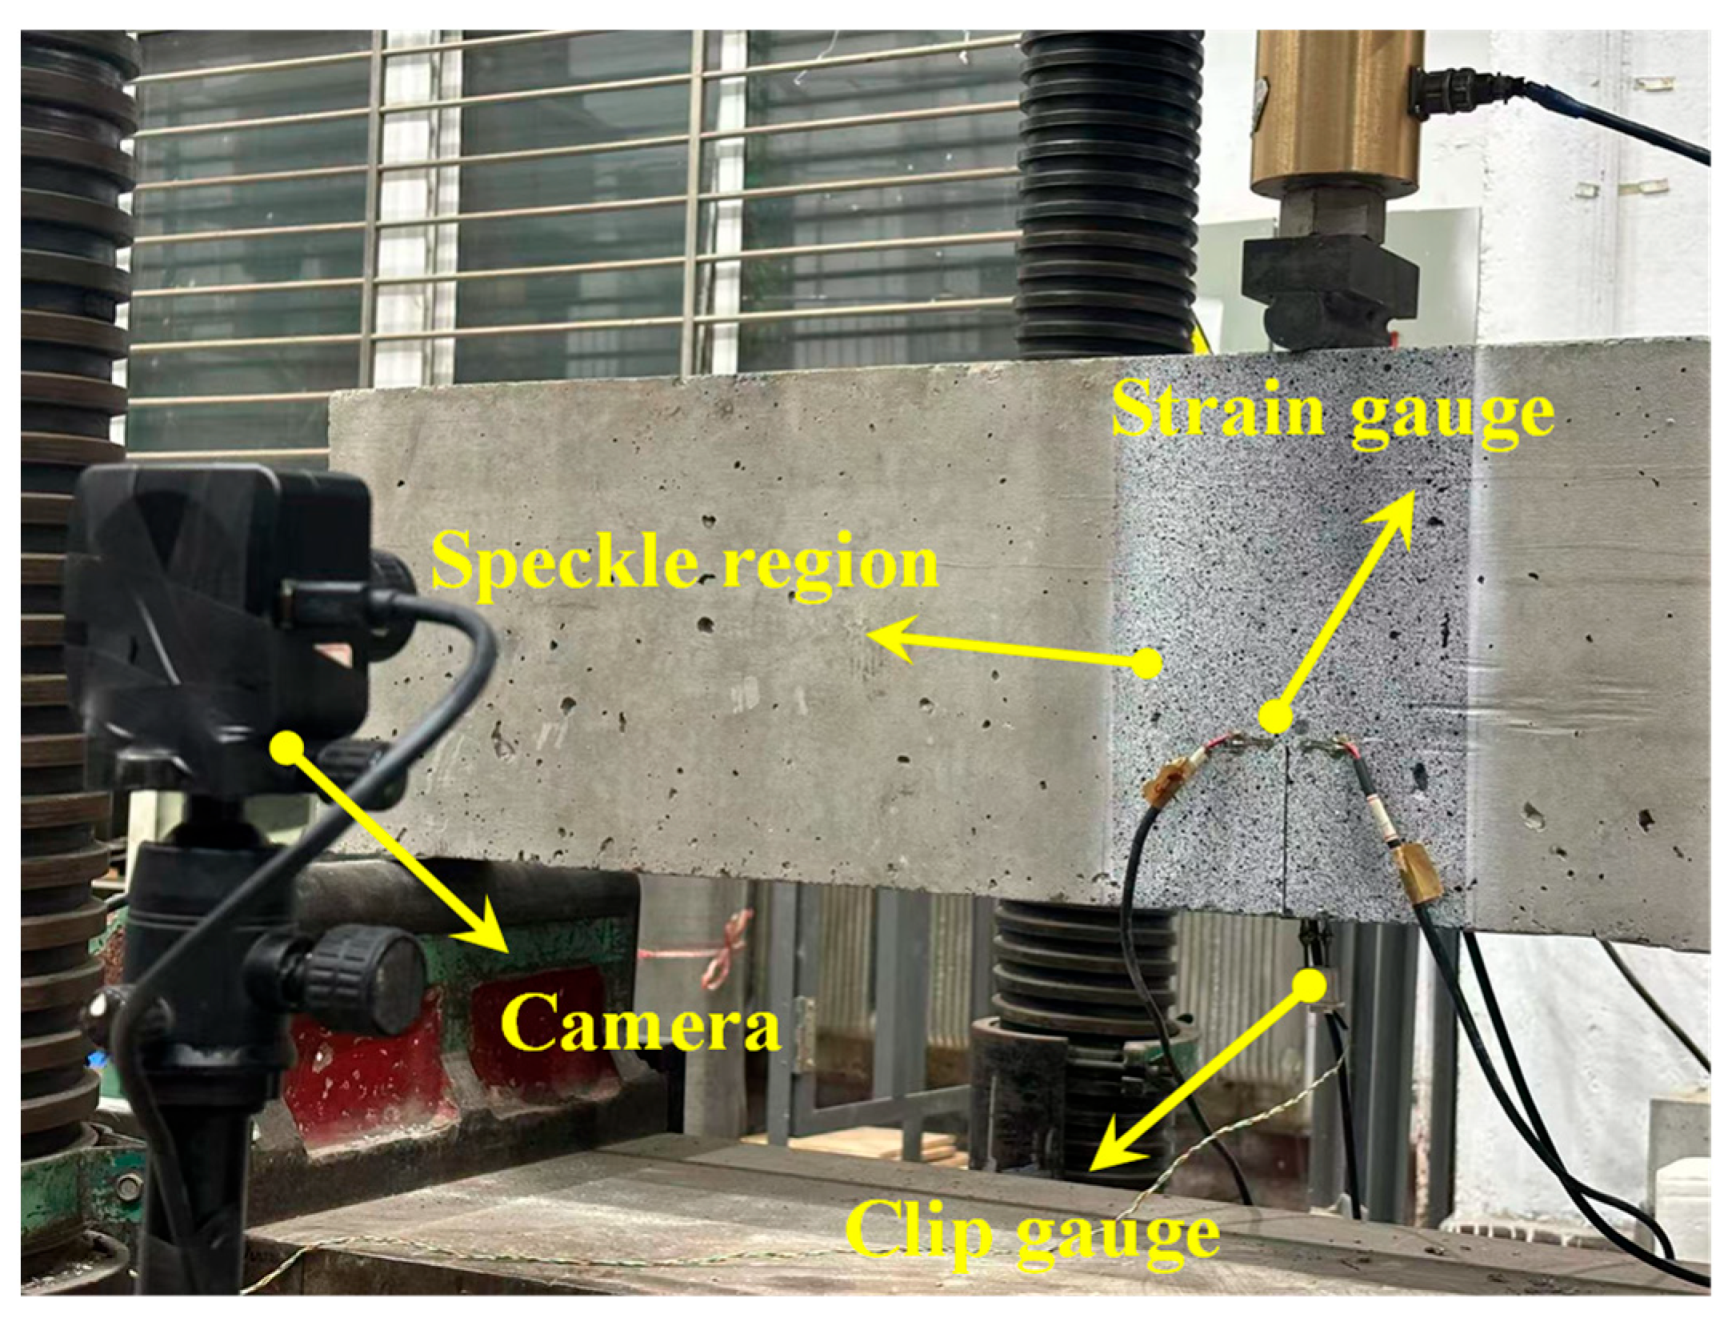
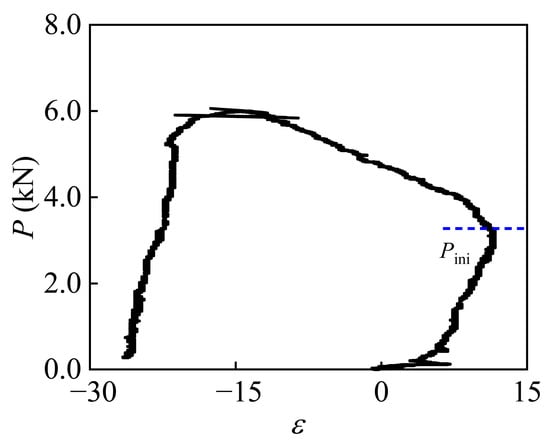
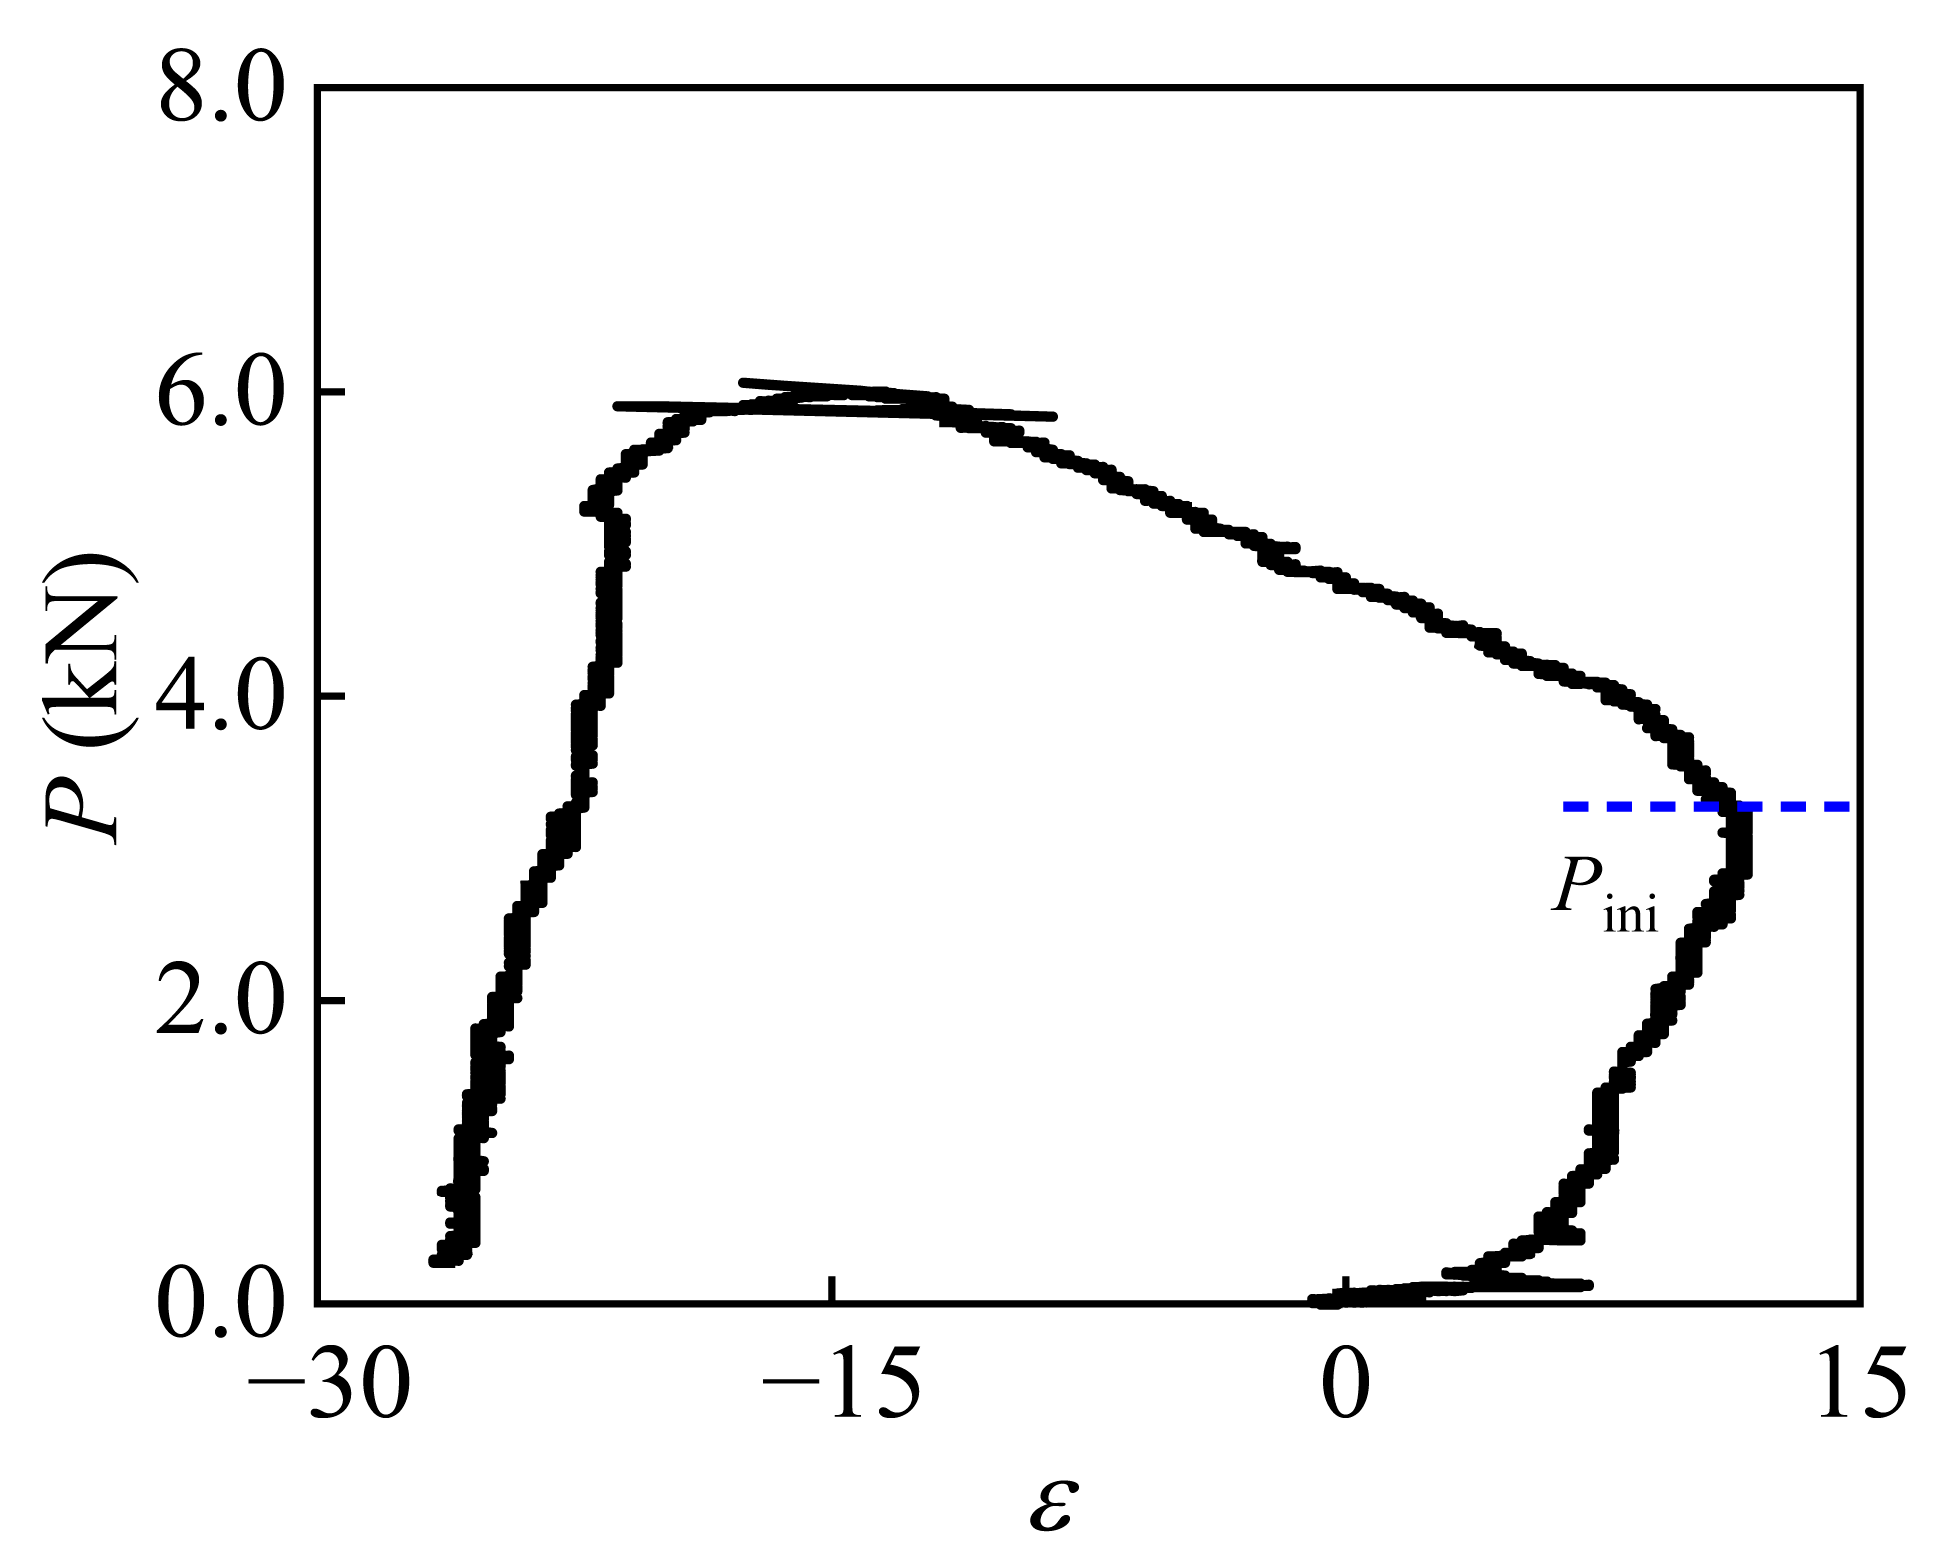
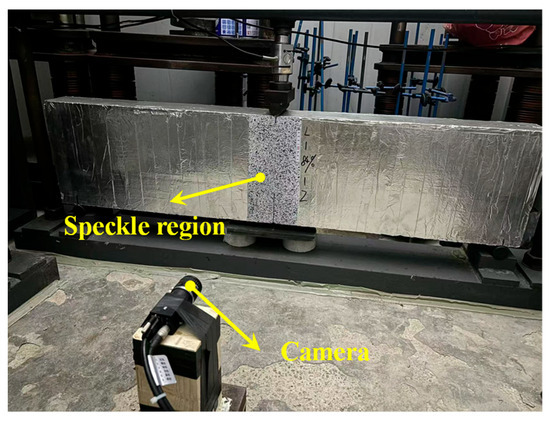
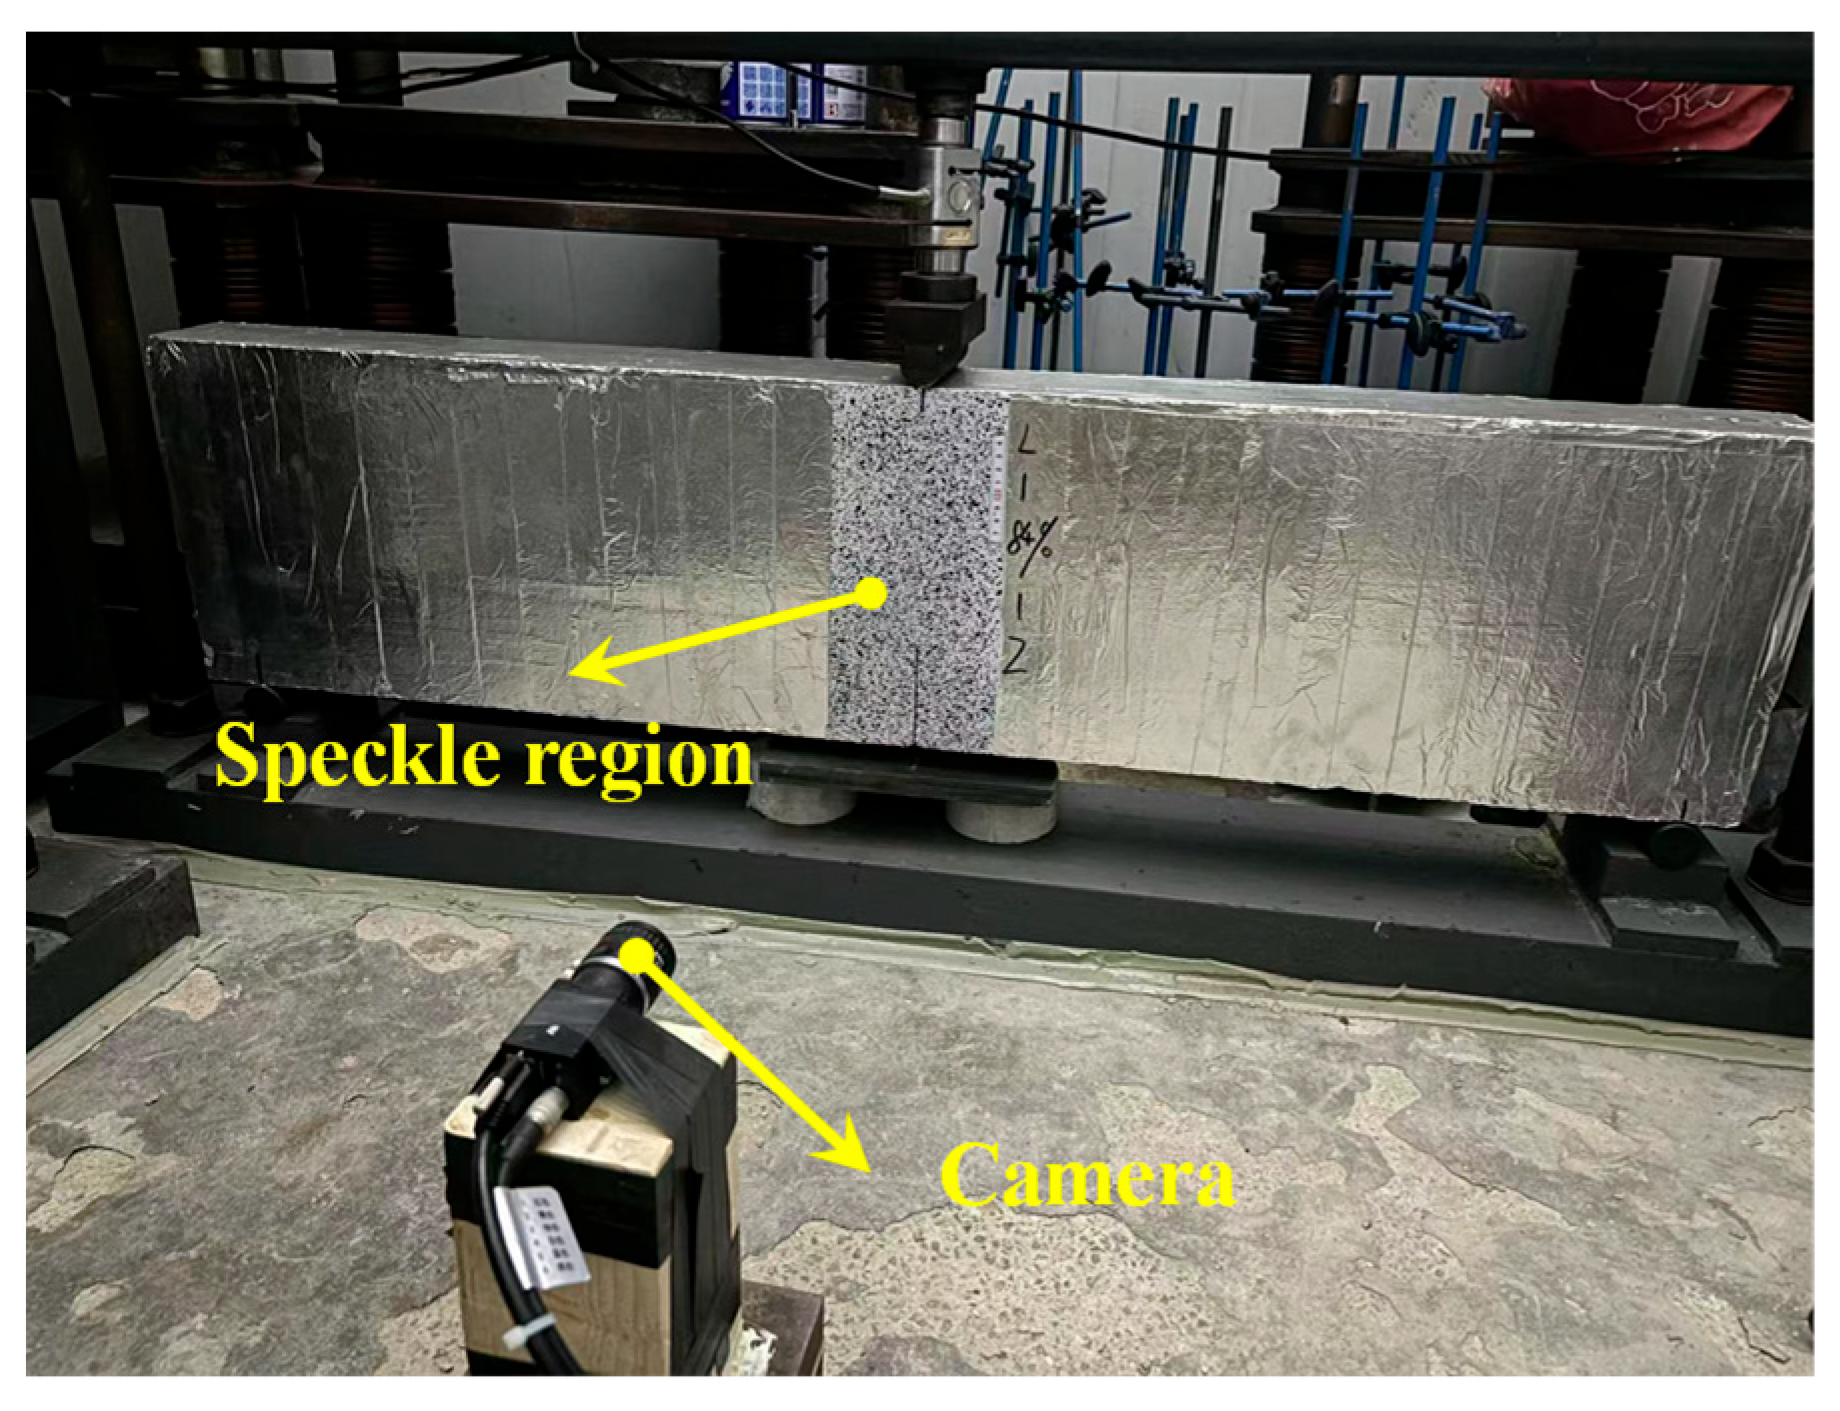
Quasi-static fracture tests were performed to obtain the peak load and post-peak fracture response of TPB beams with different sizes. A servo-hydraulic test machine with a capacity of 5000 kN and a load cell with a capacity of 50 kN were used. The tests were conducted under displacement control at a loading rate of 0.024 mm/min. It should be noted that displacement control alone does not universally guarantee stable post-peak behavior for concrete specimens. The stability of the post-peak response is also affected by the stiffness of the testing system, the loading rate, and the specimen size. In this study, the low loading rate and the closed-loop servo-hydraulic system were adopted to reduce the risk of unstable crack propagation. For both specimen sizes considered, namely S200 and S300, smooth load-crack mouth opening displacement curves with complete descending branches were obtained, indicating that stable post-peak crack propagation was achieved within the investigated size range. Nevertheless, the influence of specimen size on post-peak stability should be further examined when applying this testing method to larger specimens. The crack propagation process was monitored using the DIC technique. To determine the initial cracking load Pini, strain gauges were affixed 5 mm from each side of the initial crack tip, as shown in Figure 2. Upon cracking, the elastic strain energy accumulated near the initial crack tip was rapidly released, causing a significant drop in the strain. The Pini was determined based on the sudden strain drop observed in the load-strain curve, as illustrated in Figure 3.
Figure 2.
Test equipment.
Figure 3.
P-ε curve (the blue dashed line indicates the initial cracking load).
Prior to test, the specimen surface was prepared to generate high-contrast random gray-scale images. Using the initial crack as the symmetry axis, a 50 mm wide area on each side was sprayed uniformly with white paint. After drying, black paint was sprayed as scattered dots to form a random black-and-white speckle pattern. The DIC images were captured at a frequency of 2 Hz and analyzed using Vic-2D software (version 7). During image processing, the area of interest (AOI) was manually selected within the speckle region and divided into subsets of 30 × 30 pixels with a step size of 7 pixels for displacement calculation. Rigid body displacements were removed to enhance the accuracy of crack propagation length measurements.
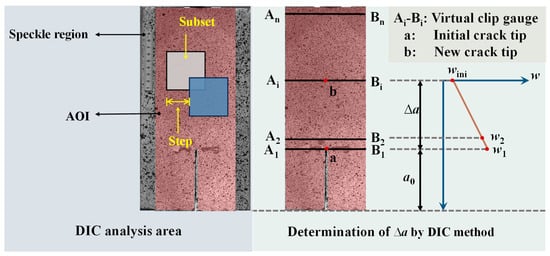
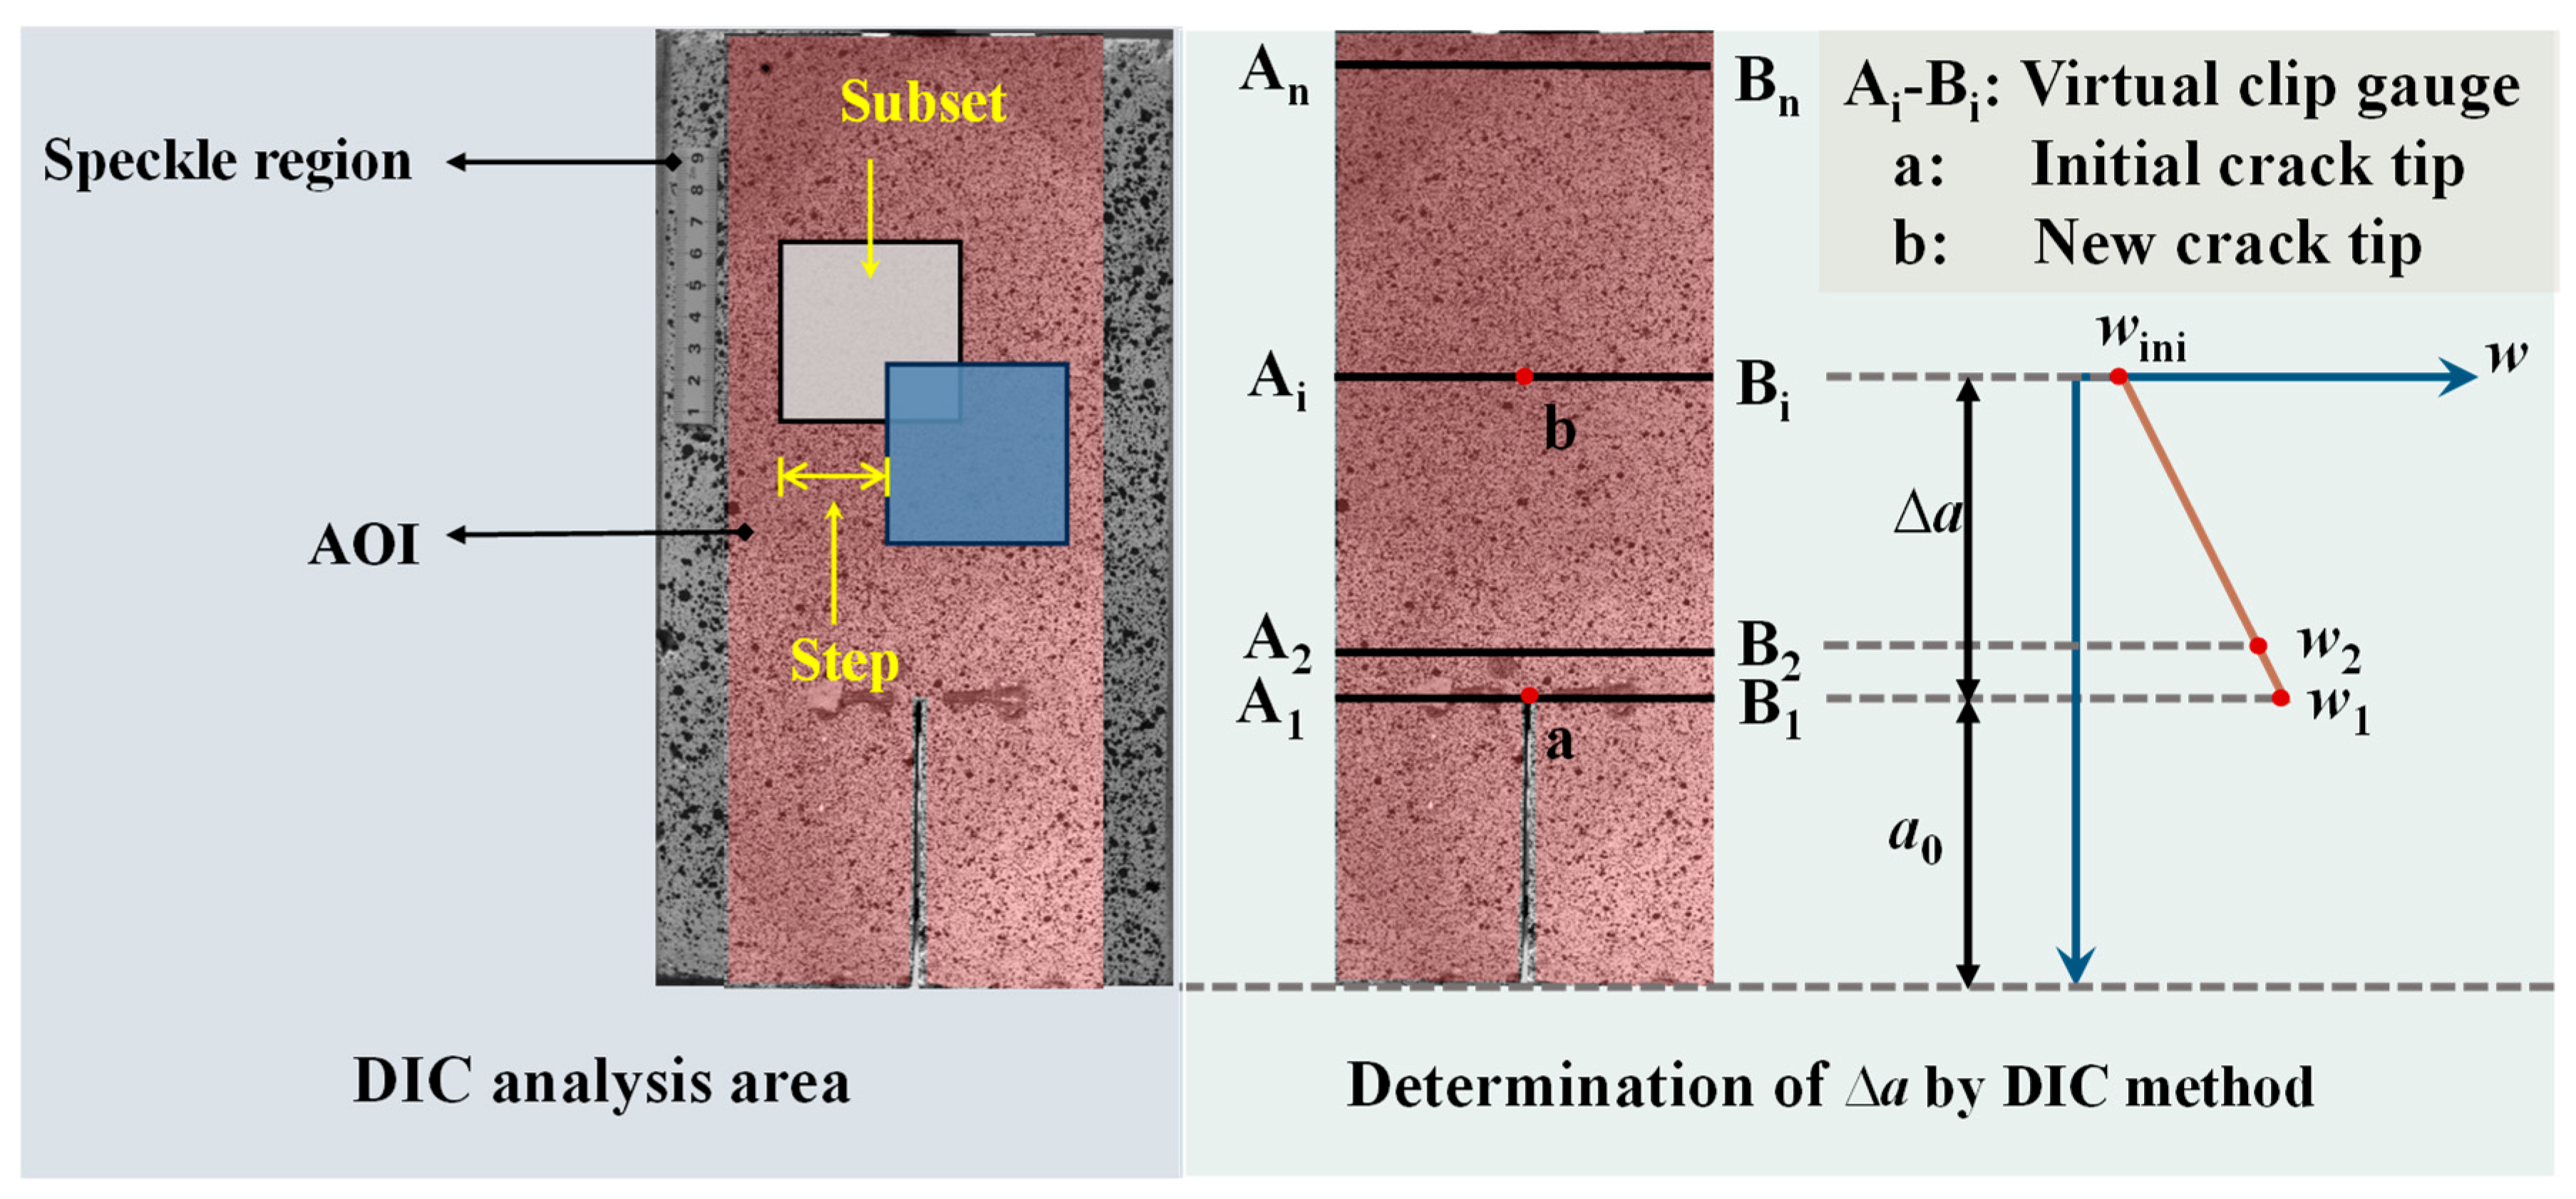
To extract the crack propagation length, virtual clip gauges were evenly spaced along the ligament direction starting from the initial crack tip in the DIC images. The gauges were spaced 2 mm apart with a gauge length of 5 mm, as shown in Figure 4. The crack tip opening displacement at crack initiation was defined as wini. For each frame, the location where the gauge reading equaled wini was identified as the current crack tip, and the distance from this point to the initial crack tip was recorded as the crack propagation length Δa.
Figure 4.
Schematic diagram for determining the crack propagation length by DIC (the arrows and labels in the figure indicate the DIC analysis area, AOI, subset, step, and virtual clip-gauge positions).
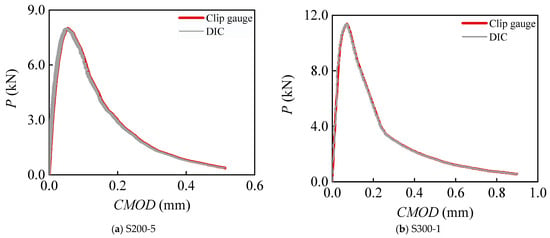
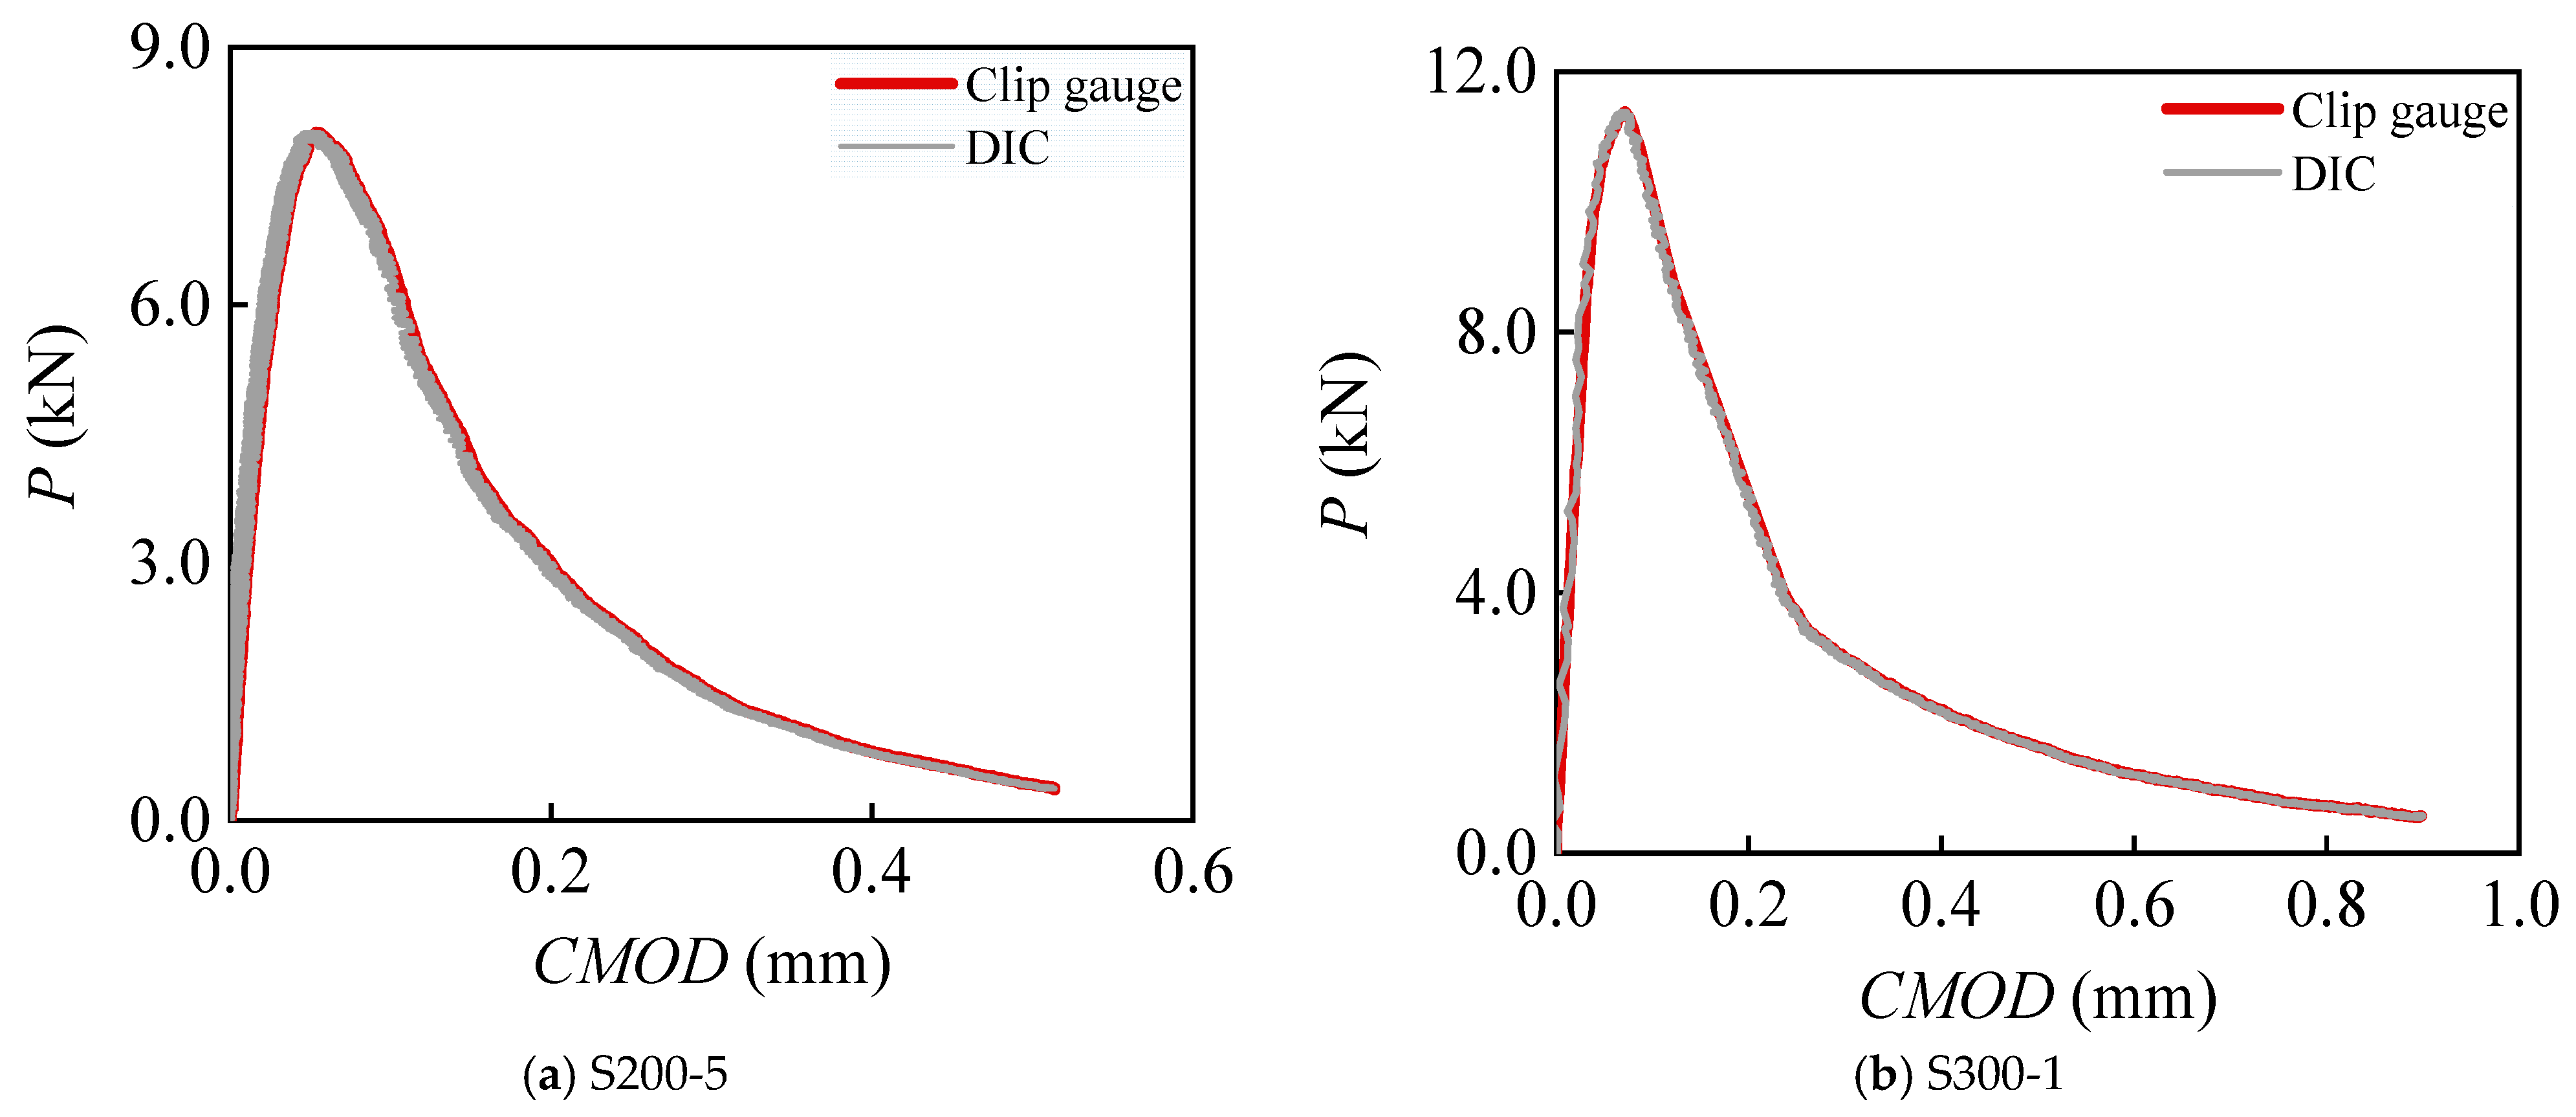
To verify the accuracy of DIC measurements for crack opening displacement, the clip gauge was also used to measure the crack mouth opening displacement (CMOD), as shown in Figure 2. Using specimens S200-5 and S300-1 as examples, the CMOD curves obtained by the DIC and clip gauge are presented in Figure 5. The close agreement between the two methods confirms that DIC can accurately measure the crack opening displacement of the specimens.
Figure 5.
P-CMOD comparison curves. Note: Different axis scales are used for the S200 and S300 subfigures due to the significant difference in response magnitude.
2.3. Creep Fracture Test
Creep fracture tests were conducted on two sizes of TPB beams at sustained load levels S = 0.82, 0.84, and 0.86 to study the crack propagation process. Here, S denotes the ratio of the sustained load Pc to the average peak load Pmax of specimens of the same size. Additionally, the specimen surfaces were wrapped in tinfoil to avoid the moisture exchange. A custom-designed loading device was employed, as shown in Figure 6. The sustained load was manually applied and maintained by tightening bolts. Load values were recorded daily at a fixed time throughout the entire creep test. Whenever the measured load dropped by more than 50 N, a manual adjustment was performed to restore the load to the target level. Each adjustment event, including the adjustment time and load recovery, was individually recorded, and the cumulative number of corrections per specimen was summarized. The load adjustment was carried out gradually to avoid introducing dynamic effects, ensuring that the loading condition remained quasi-static. This procedure ensured that the applied load remained stable and close to the target level throughout the creep test, thus maintaining the fidelity of the load history. All specimens were cured in a controlled environment at a temperature of 20 ± 2 °C and a relative humidity greater than 95% for a prolonged period prior to testing. After curing, the creep tests were conducted under laboratory conditions with a temperature of approximately 26 °C and a relative humidity of about 57%.
Figure 6.
Experimental set for the creep fracture test.
The crack propagation process was monitored using the DIC, and crack length was measured as in the quasi-static fracture tests. To evaluate the stability and noise level of the DIC system during long-term creep tests, a stationary speckle region far from the crack path was monitored. The displacement fluctuations in this region remained at a low and stable level throughout the test. The magnitude of the noise was significantly smaller than the crack opening displacement used for crack identification, indicating that its influence on crack detection is negligible. Considering the long duration of the creep tests, the loading device and camera was fixed to the test bench using solid adhesive to prevent positional shifts that could affect image stability. To further control potential errors in image acquisition, all tests were performed in a sealed laboratory under constant lighting conditions, thereby minimizing the influence of ambient light fluctuations on image processing accuracy. To ensure long-term stability, all tests were conducted in a sealed laboratory with stable environmental conditions. In addition, rigid body displacement correction was applied during DIC processing to eliminate potential long-term drift, and no noticeable drift was observed in the measured displacement data over time. Although the DIC method enables non-contact, full-field, and high-precision measurement of crack morphology, width, and surface strain, its accuracy depends on proper surface preparation and stable illumination conditions. Inappropriate speckle patterning or fluctuating light may introduce measurement errors, as detailed in the methodology. These factors should be considered when interpreting crack evolution results.
3. Results and Discussion
3.1. Quasi-Static Fracture Test Results
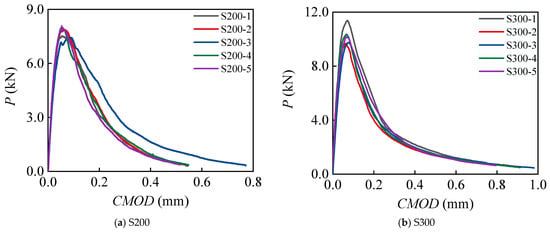
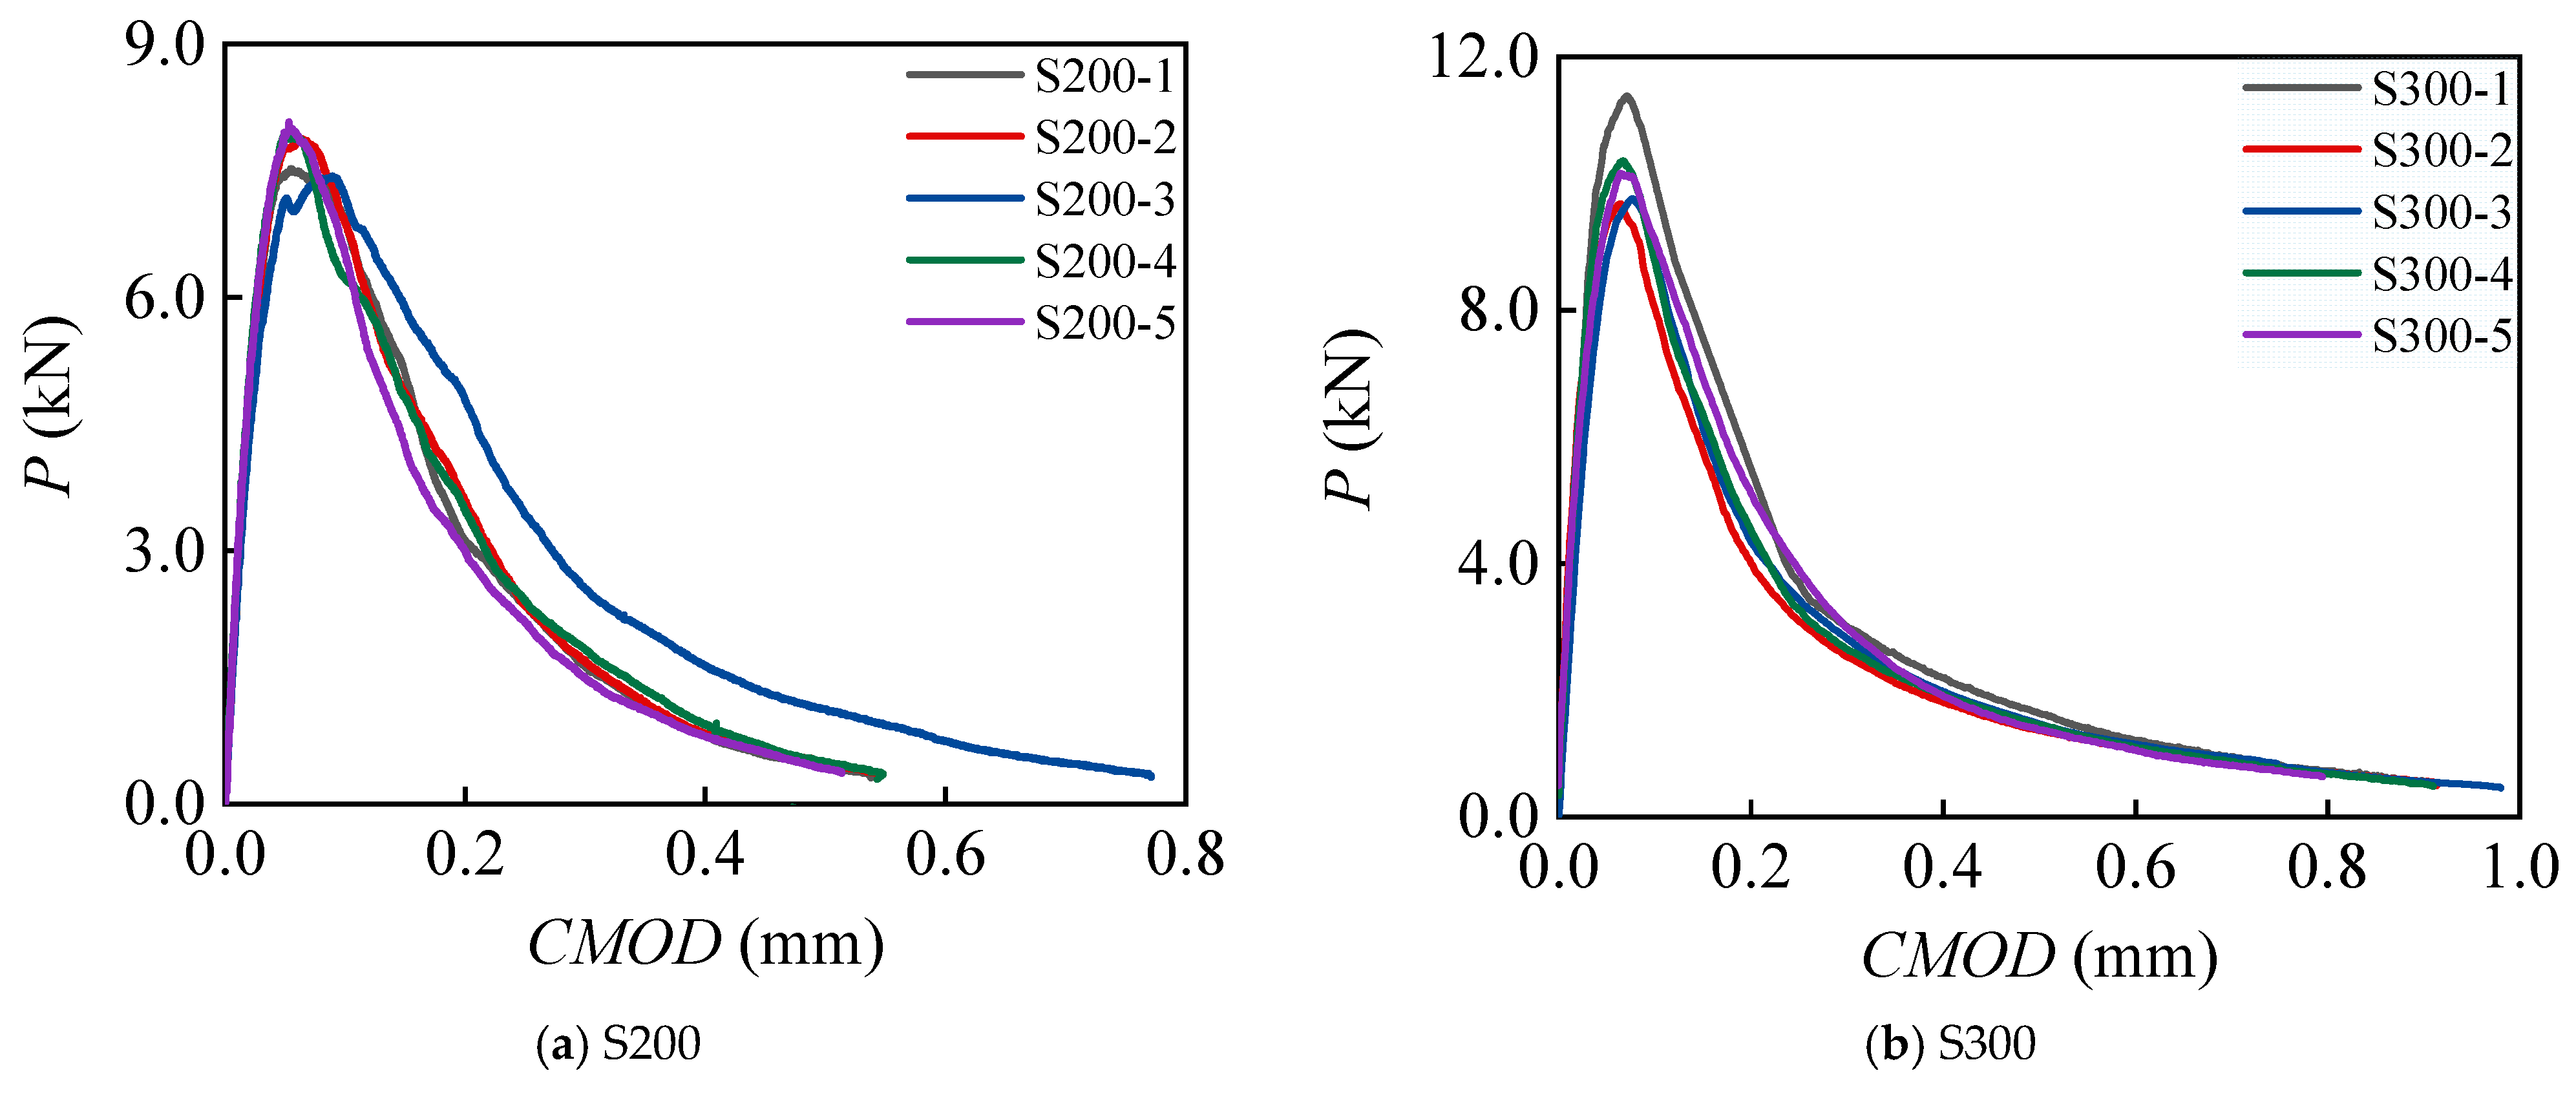
The load-crack mouth opening displacement (P-CMOD) curves of all specimens are presented in Figure 7. The corresponding peak load Pmax, initial cracking load Pini, fracture energy Gf, and critical crack opening displacement w0 are summarized in Table 2. The Gf and w0 were calculated based on the following formulas [25]:
where W0 is the work done by the external load, mg is the self-weight of the specimen, and δmax is the displacement at the loading point corresponding to the moment when the load drops to 5% of Pmax.
Figure 7.
P-CMOD curves of beams. Note: Different axis scales are used for the S200 and S300 subfigures due to the significant difference in response magnitude.
Table 2.
Results of static fracture tests.
As shown in the figure, the quasi-static test results of the TPB beams exhibit low dispersion, providing reliable data support for the subsequent creep fracture tests.
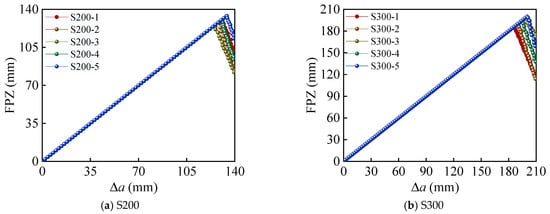
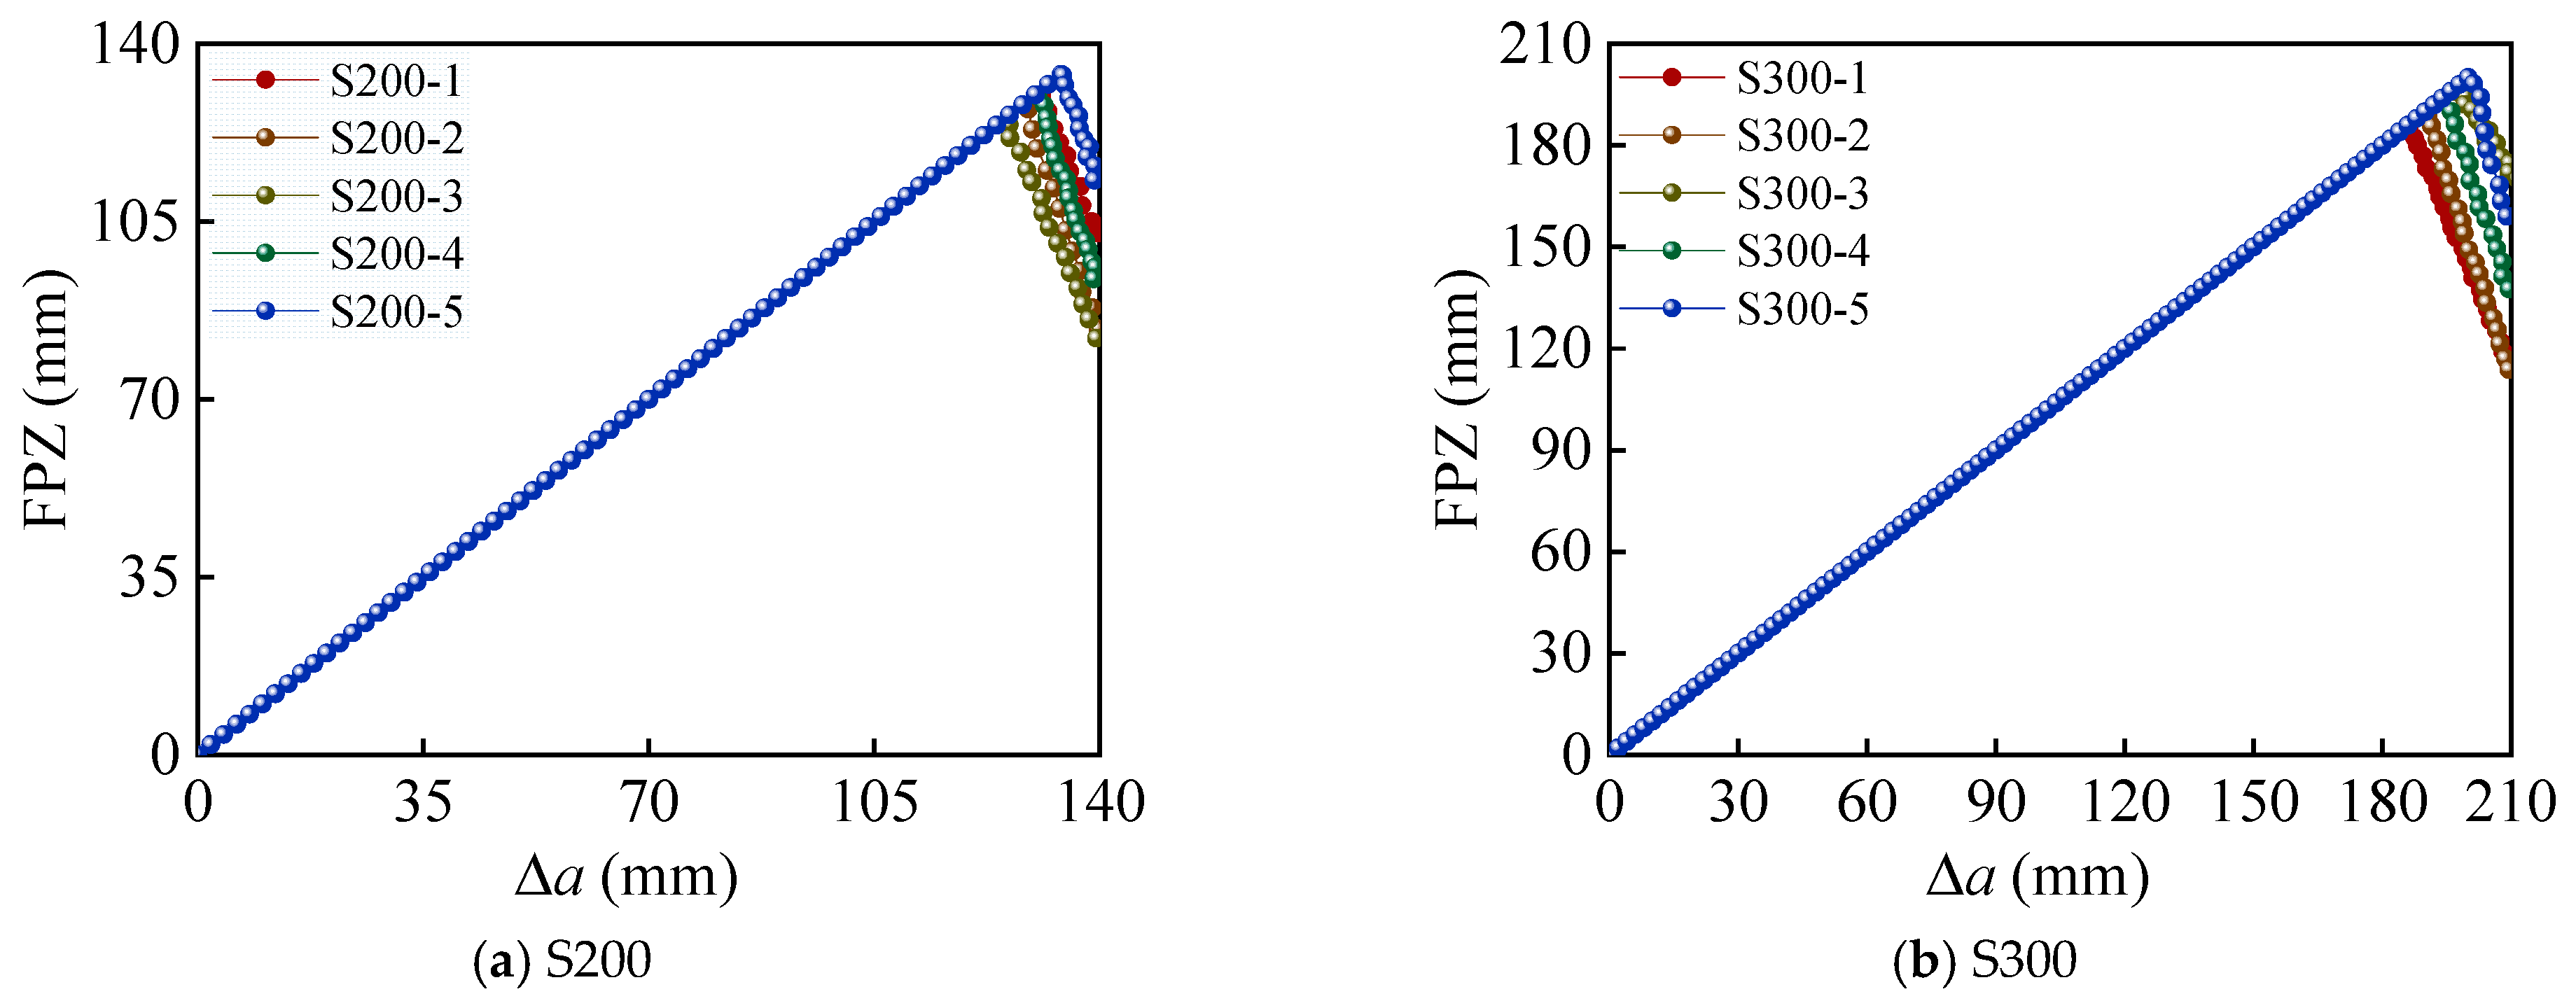
As shown in Table 2, the ratio of the Pini to the Pmax for both specimen sizes is approximately 0.60. To investigate the variation in the FPZ length during the quasi-static tests, Figure 8 presents the relationship between FPZ length and crack propagation length for beams with heights of 200 mm and 300 mm. The FPZ is defined as the region extending from the current crack tip to the position where the crack opening displacement COD reaches the critical value w0.
Figure 8.
FPZ length of beams. Note: Different axis scales are used for the S200 and S300 subfigures due to the significant difference in response magnitude.
Figure 8 shows that, during the quasi-static fracture tests, the FPZ length of the three-point bending beams initially increases and then decreases, with the complete FPZ forming in the later stage of the descending branch of the load–displacement curve.
3.2. Creep Fracture Test Results
The results of the creep fracture tests are summarized in Table 3. In the table, Pc represents the sustained load, tf is the creep fracture lifetime, and CMODf and af are the crack mouth opening displacement and crack length at the creep failure, respectively. The ratio af/D denotes the normalized crack length relative to the beam height.
Table 3.
Experimental results under sustained loading.
The standard deviations were added to quantify the variability of the experimental results. It can be observed that the creep fracture lifetime exhibits larger scatter than the static fracture parameters, CMODf, and crack length results. This scatter should be interpreted in relation to the crack growth history and specimen-specific response. Although the same nominal sustained load was applied within each group, the peak load of each individual specimen was not identical, leading to slight differences in the actual load level experienced by each specimen. In addition, small load corrections during long-term sustained loading, local heterogeneity of concrete, aggregate distribution near the crack path, and differences in the initial defect field may affect the rate of crack propagation. Therefore, specimens with similar nominal load levels may require different times to reach the critical fracture state. It is important to note that the large scatter in creep fracture lifetime does not necessarily imply a similarly large scatter in the failure state. As shown in Table 3, the values of CMODf, af and af/D are relatively consistent compared with tf. This suggests that the lifetime scatter is mainly associated with the time-dependent crack growth rate before failure, whereas the crack length at failure remains comparatively stable for specimens with the same size and load level. In other words, different specimens may follow different crack-growth histories but eventually approach a similar critical crack state. This observation supports the use of crack propagation history, especially the evolution of crack length, as a more physically meaningful variable for creep fracture assessment than lifetime alone. As shown in the table, for specimens of a given size, higher sustained load levels correspond to shorter creep fracture lifetime. The CMODf and af also decrease as the load level increases. Additionally, the ratio of crack length at the creep failure to specimen height remains consistent across different specimen sizes and is primarily governed by the sustained load level. This indicates that the extent of crack propagation in geometrically similar specimens is independent of size.
3.3. Crack Propagation Process of Concrete Under Sustained Loading
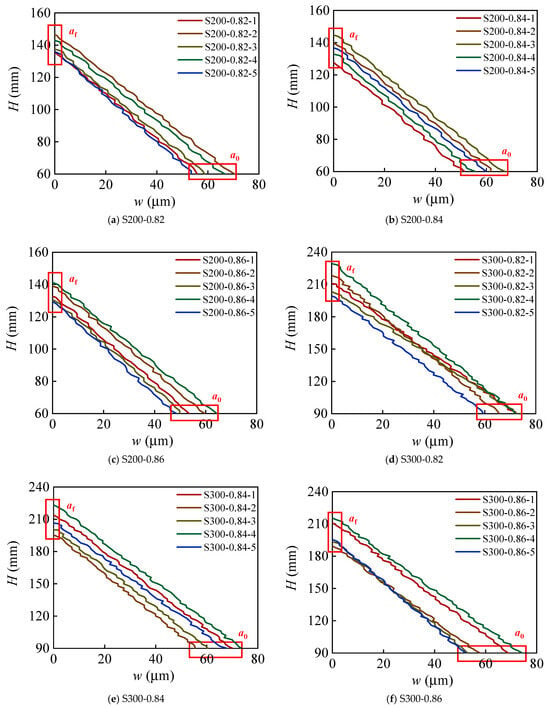
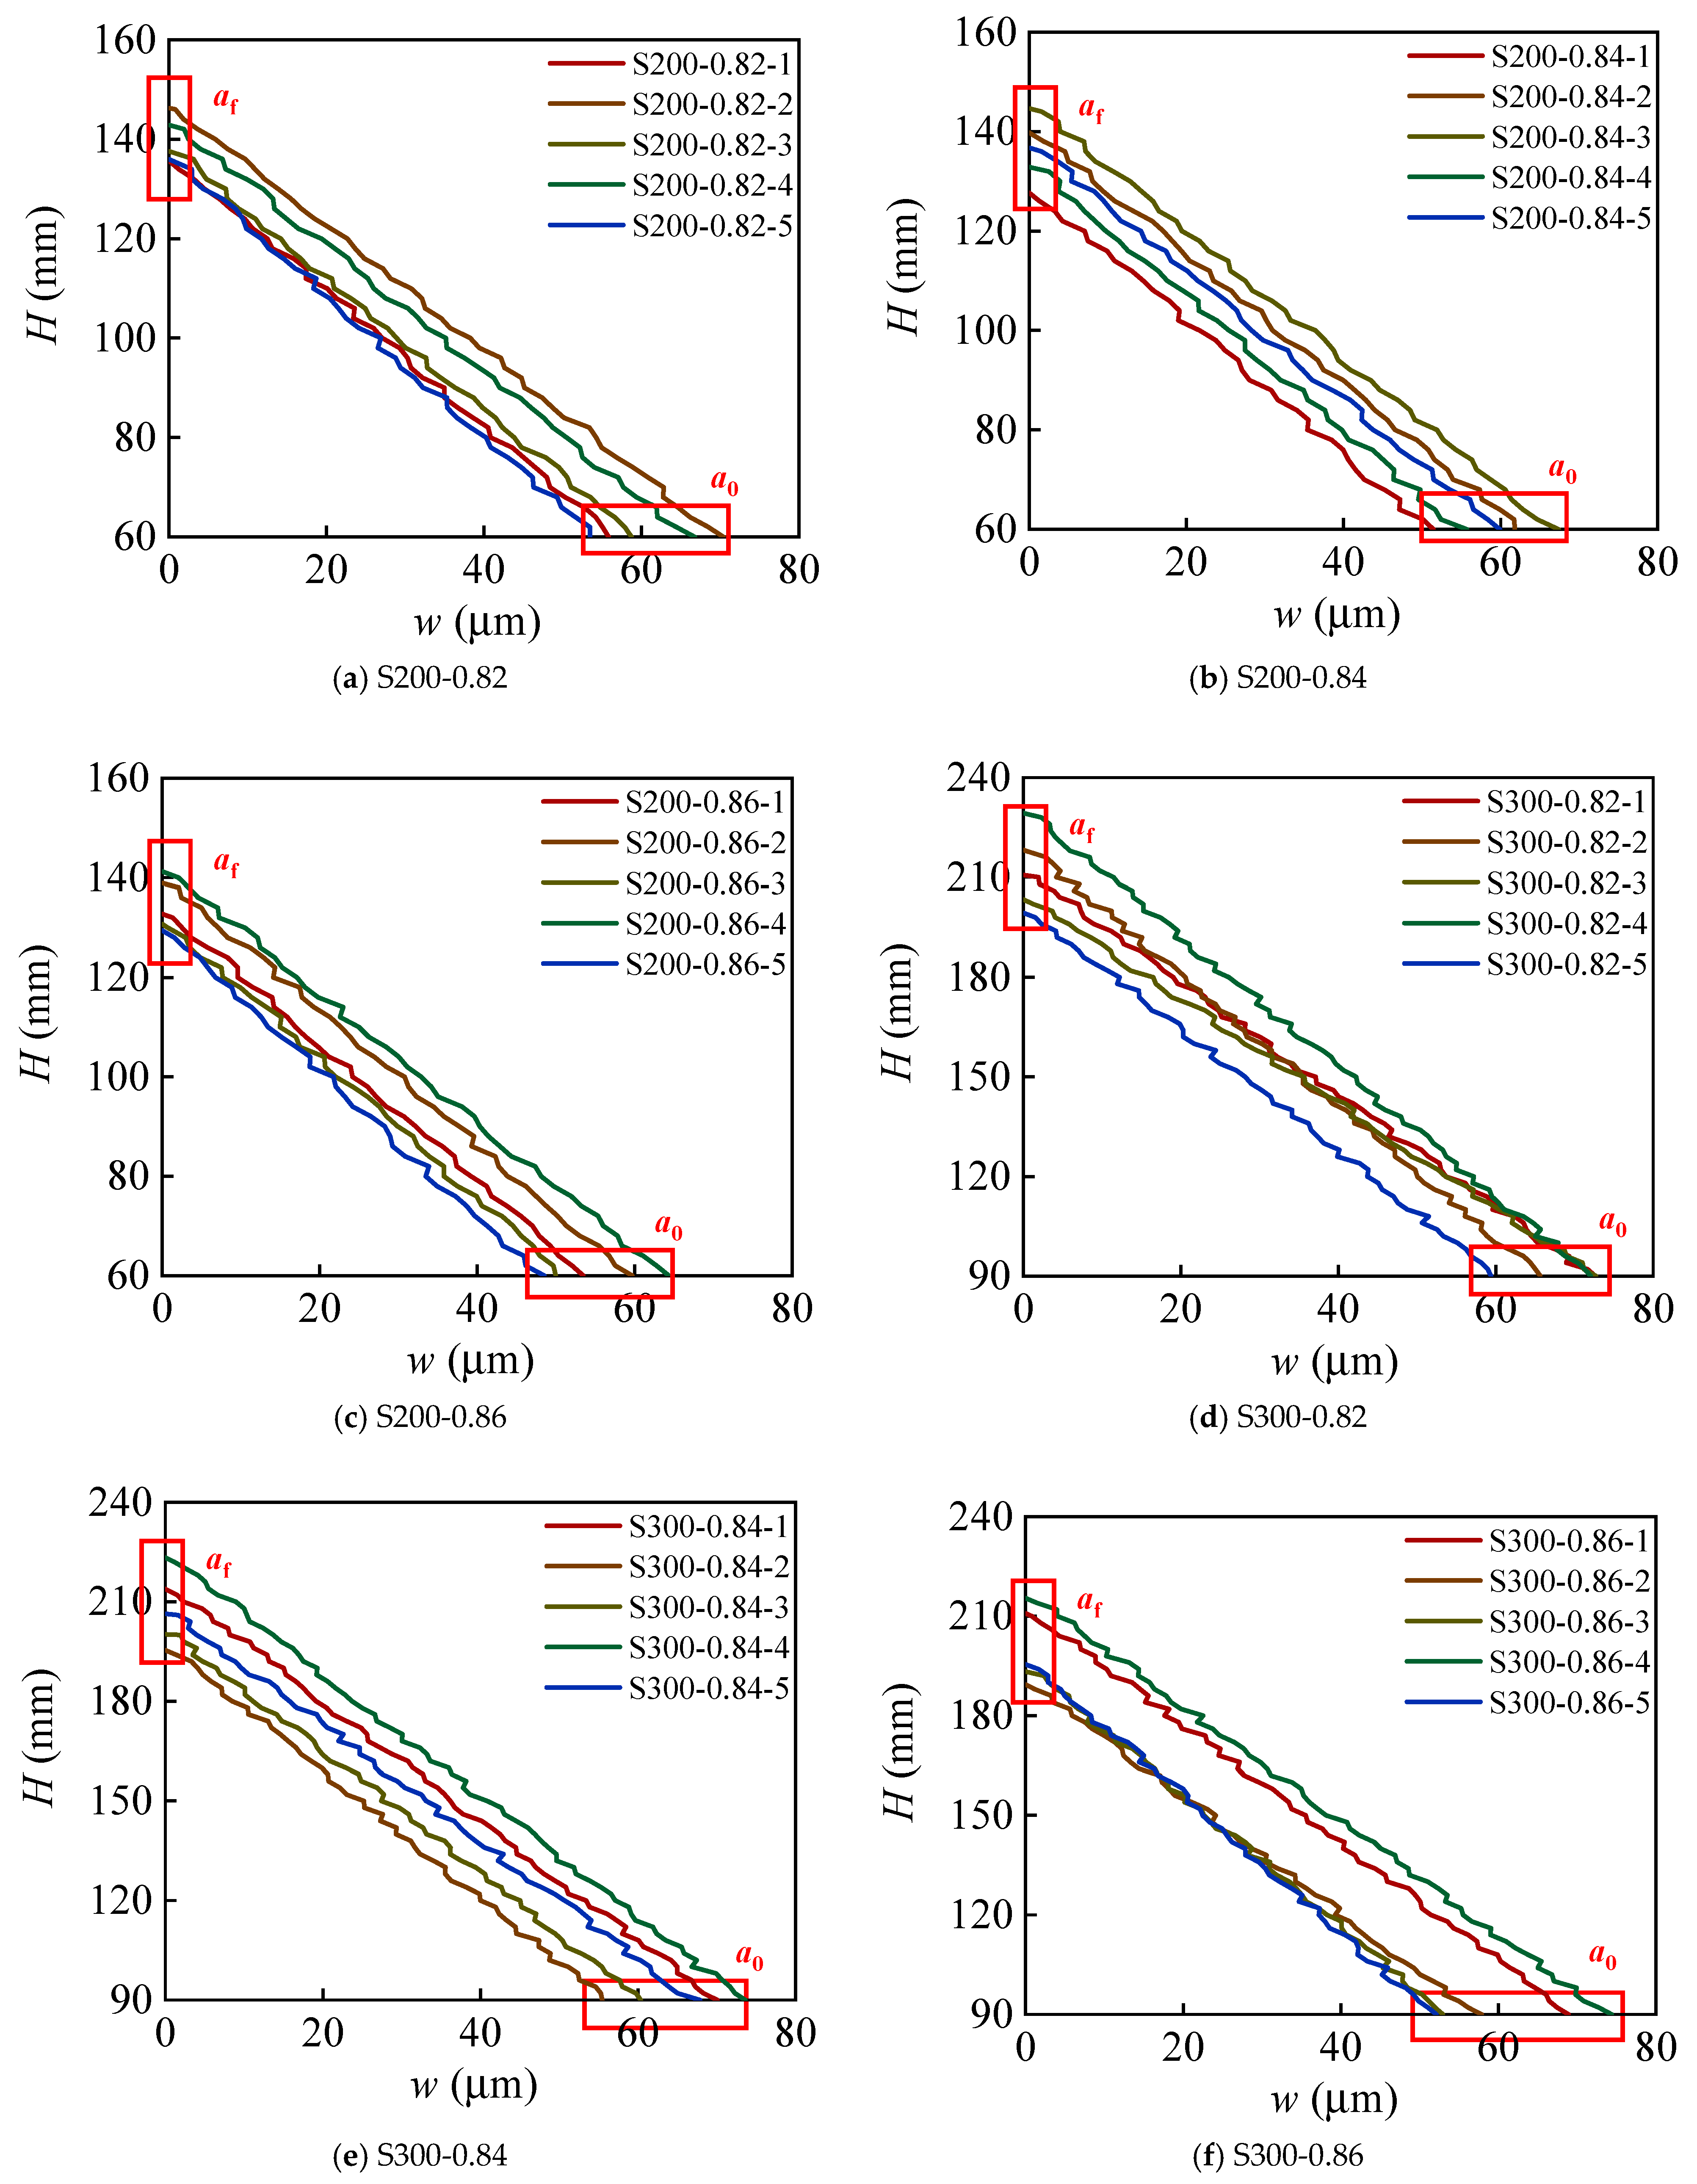
To obtain the crack propagation process of the specimens under sustained loading, virtual clip gauges were arranged along the ligament direction from the initial crack tip on the captured images using Vic-2D software, following the same method as in the quasi-static fracture test. Figure 9 presents the corresponding COD at various locations within the FPZ for each specimen at the creep failure. During the experiments, several factors were found to influence the accuracy of DIC measurements. These include the quality of surface preparation, stability of illumination, and camera alignment over long-term monitoring periods. Fluctuations in any of these factors can introduce measurement errors. Recognizing these challenges is important for ensuring reliable results and for understanding the practical limitations of applying DIC in long-term creep fracture studies.
Figure 9.
COD within the FPZ at the creep failure. Note: Different axis scales are used for the S200 and S300 subfigures due to the significant difference in response magnitude.
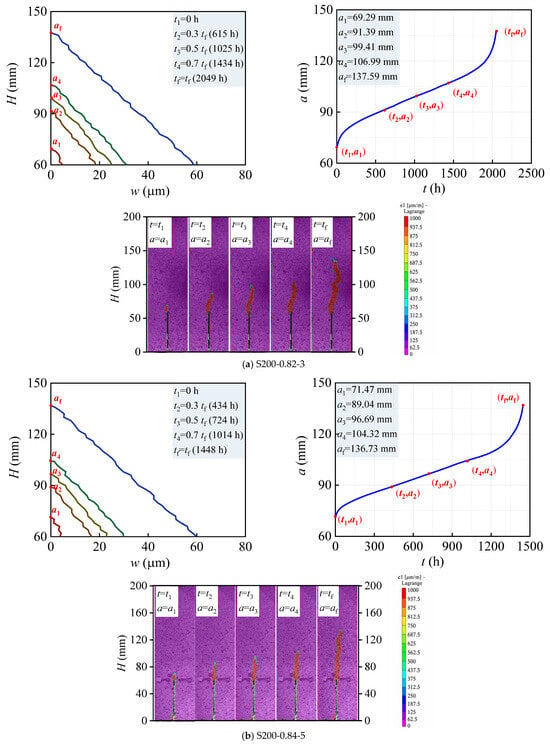
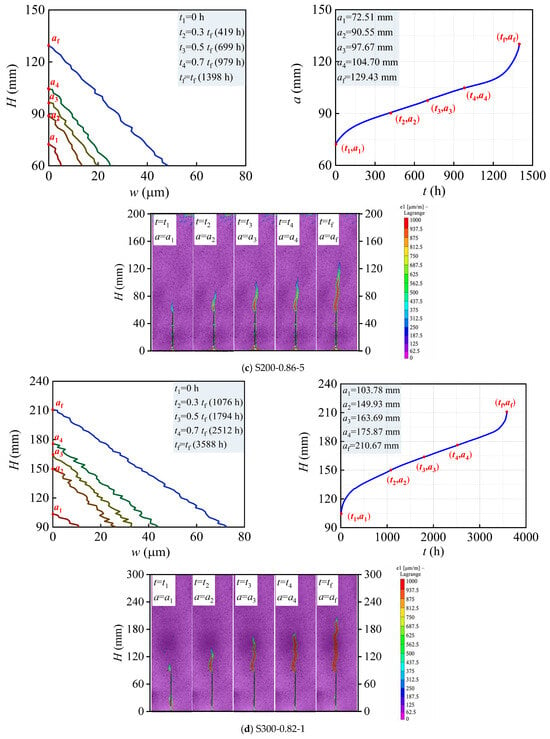
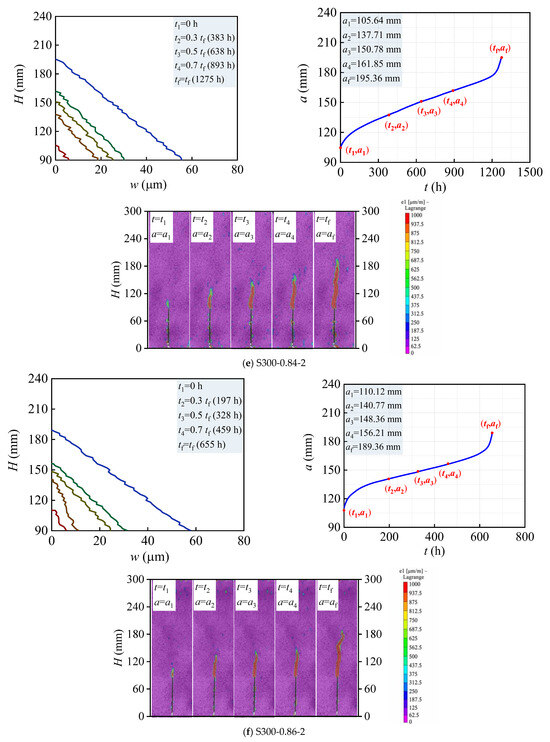
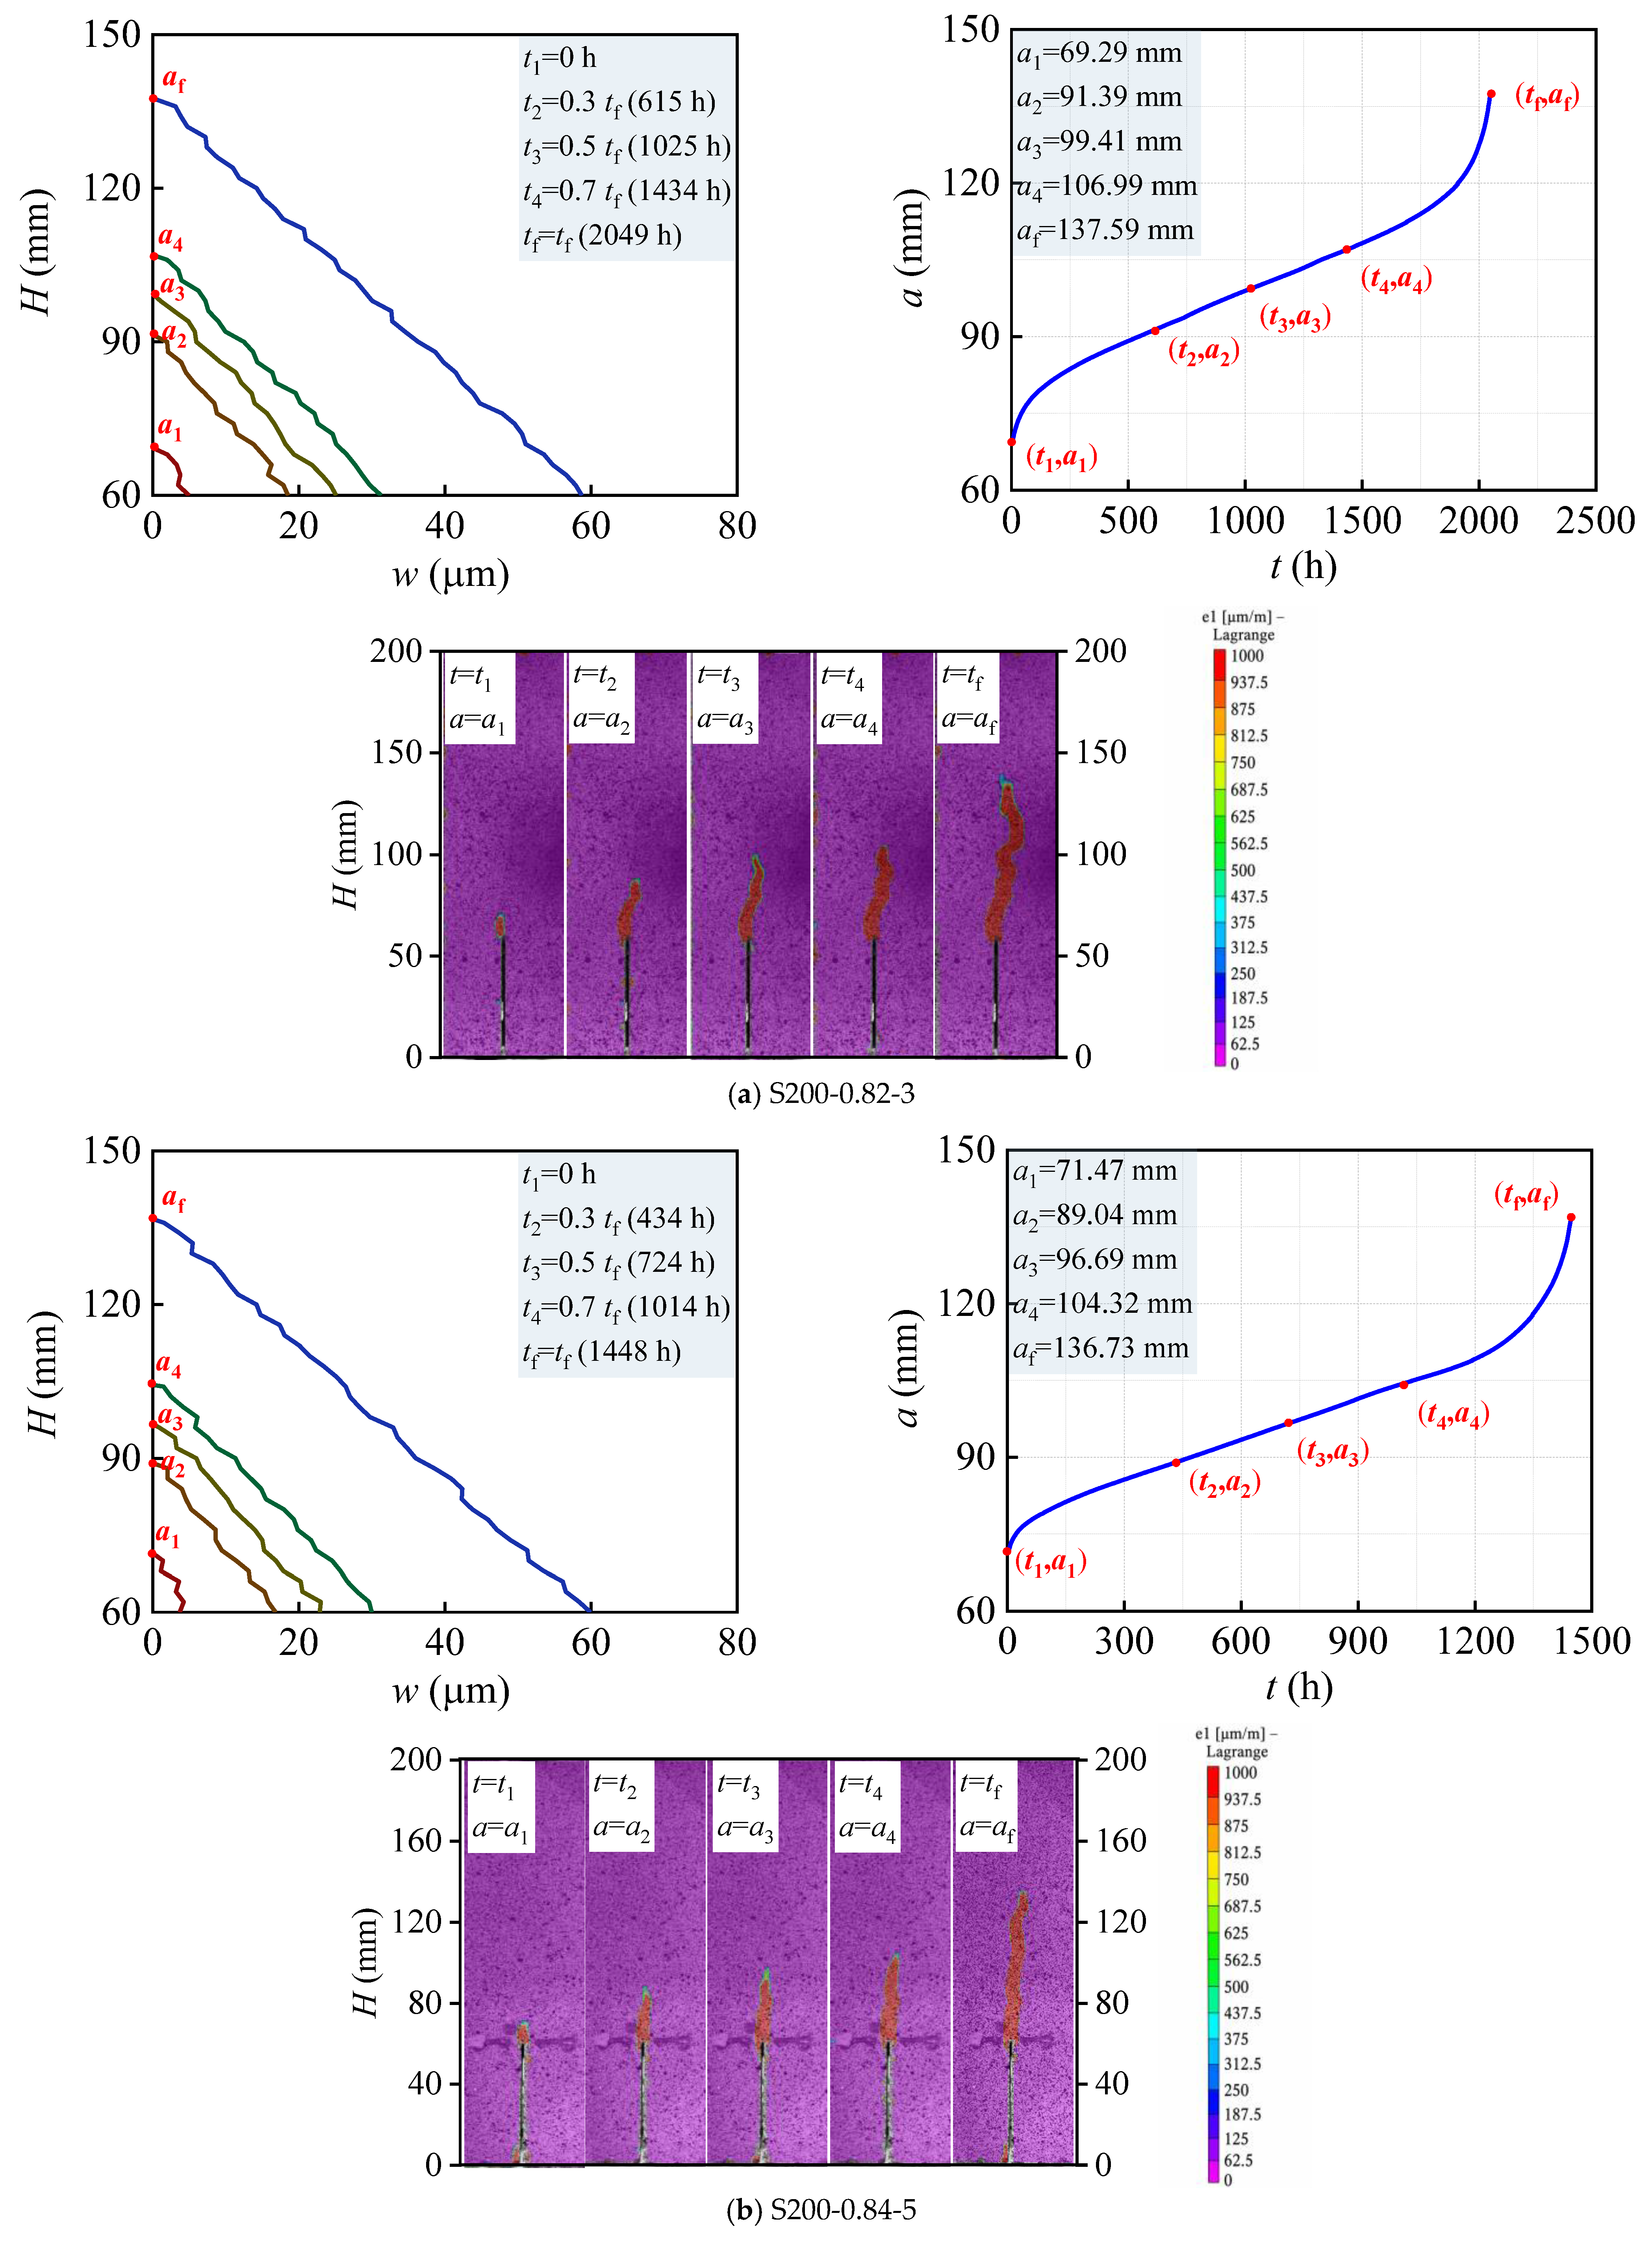
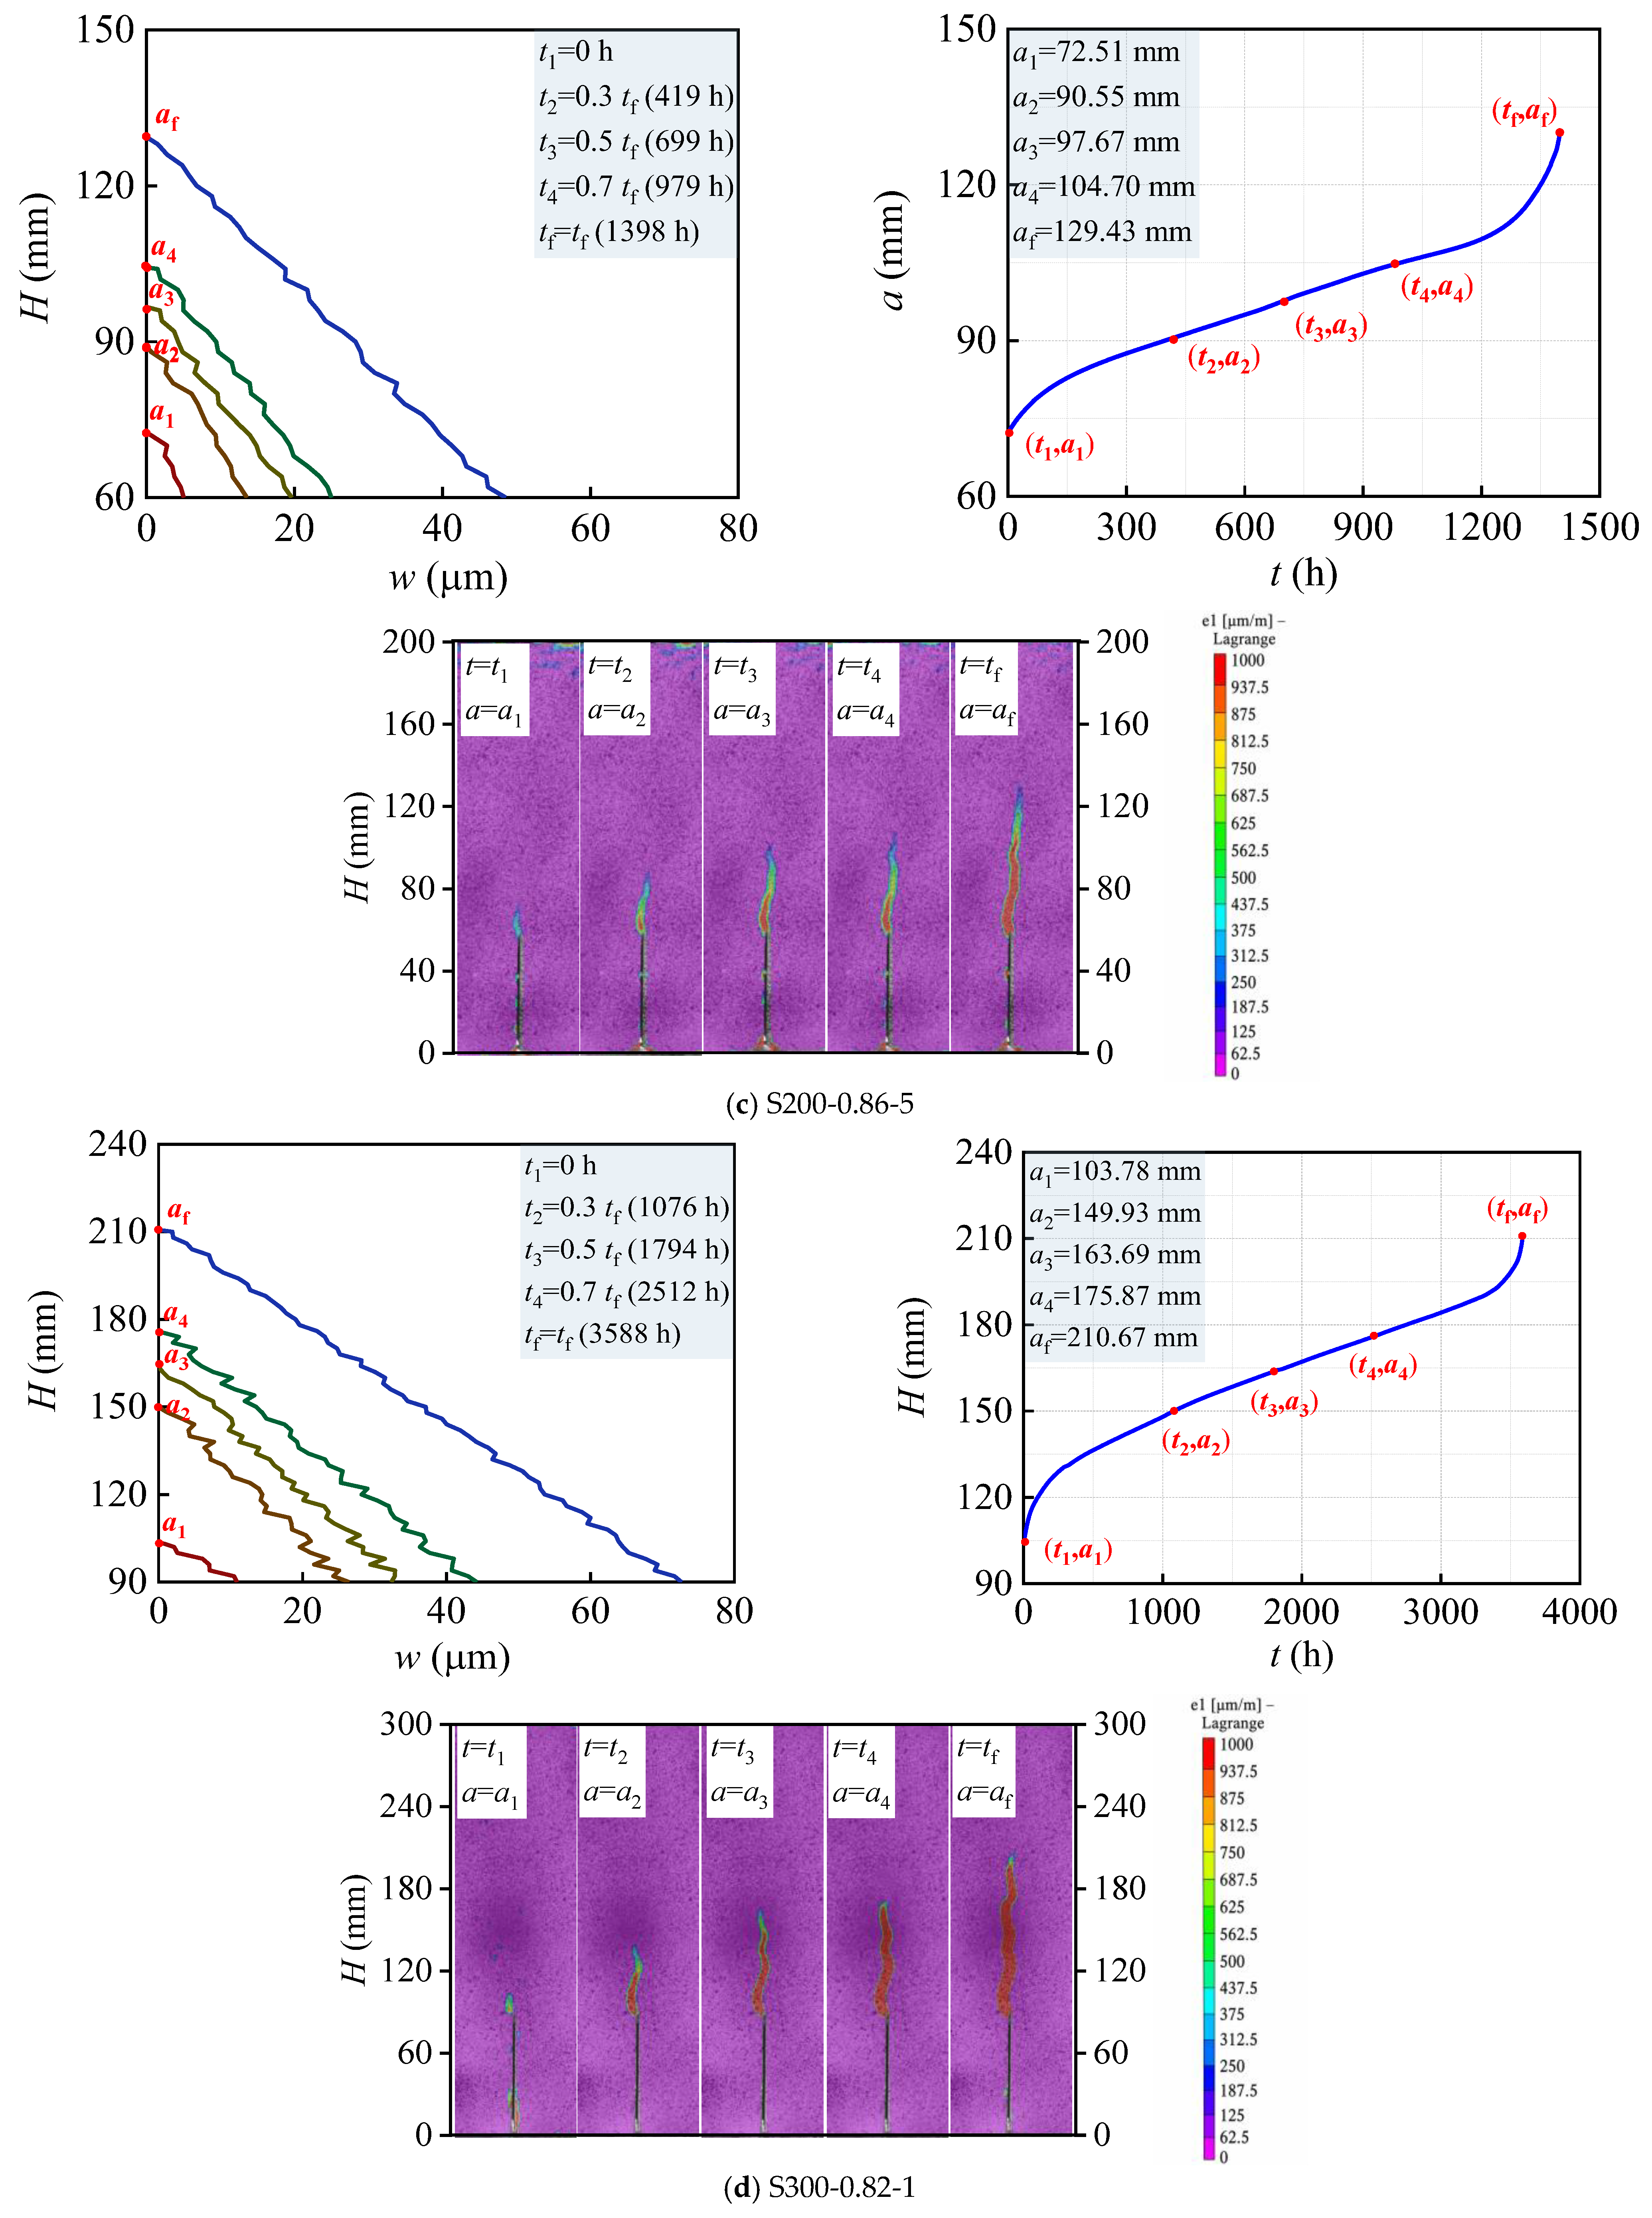
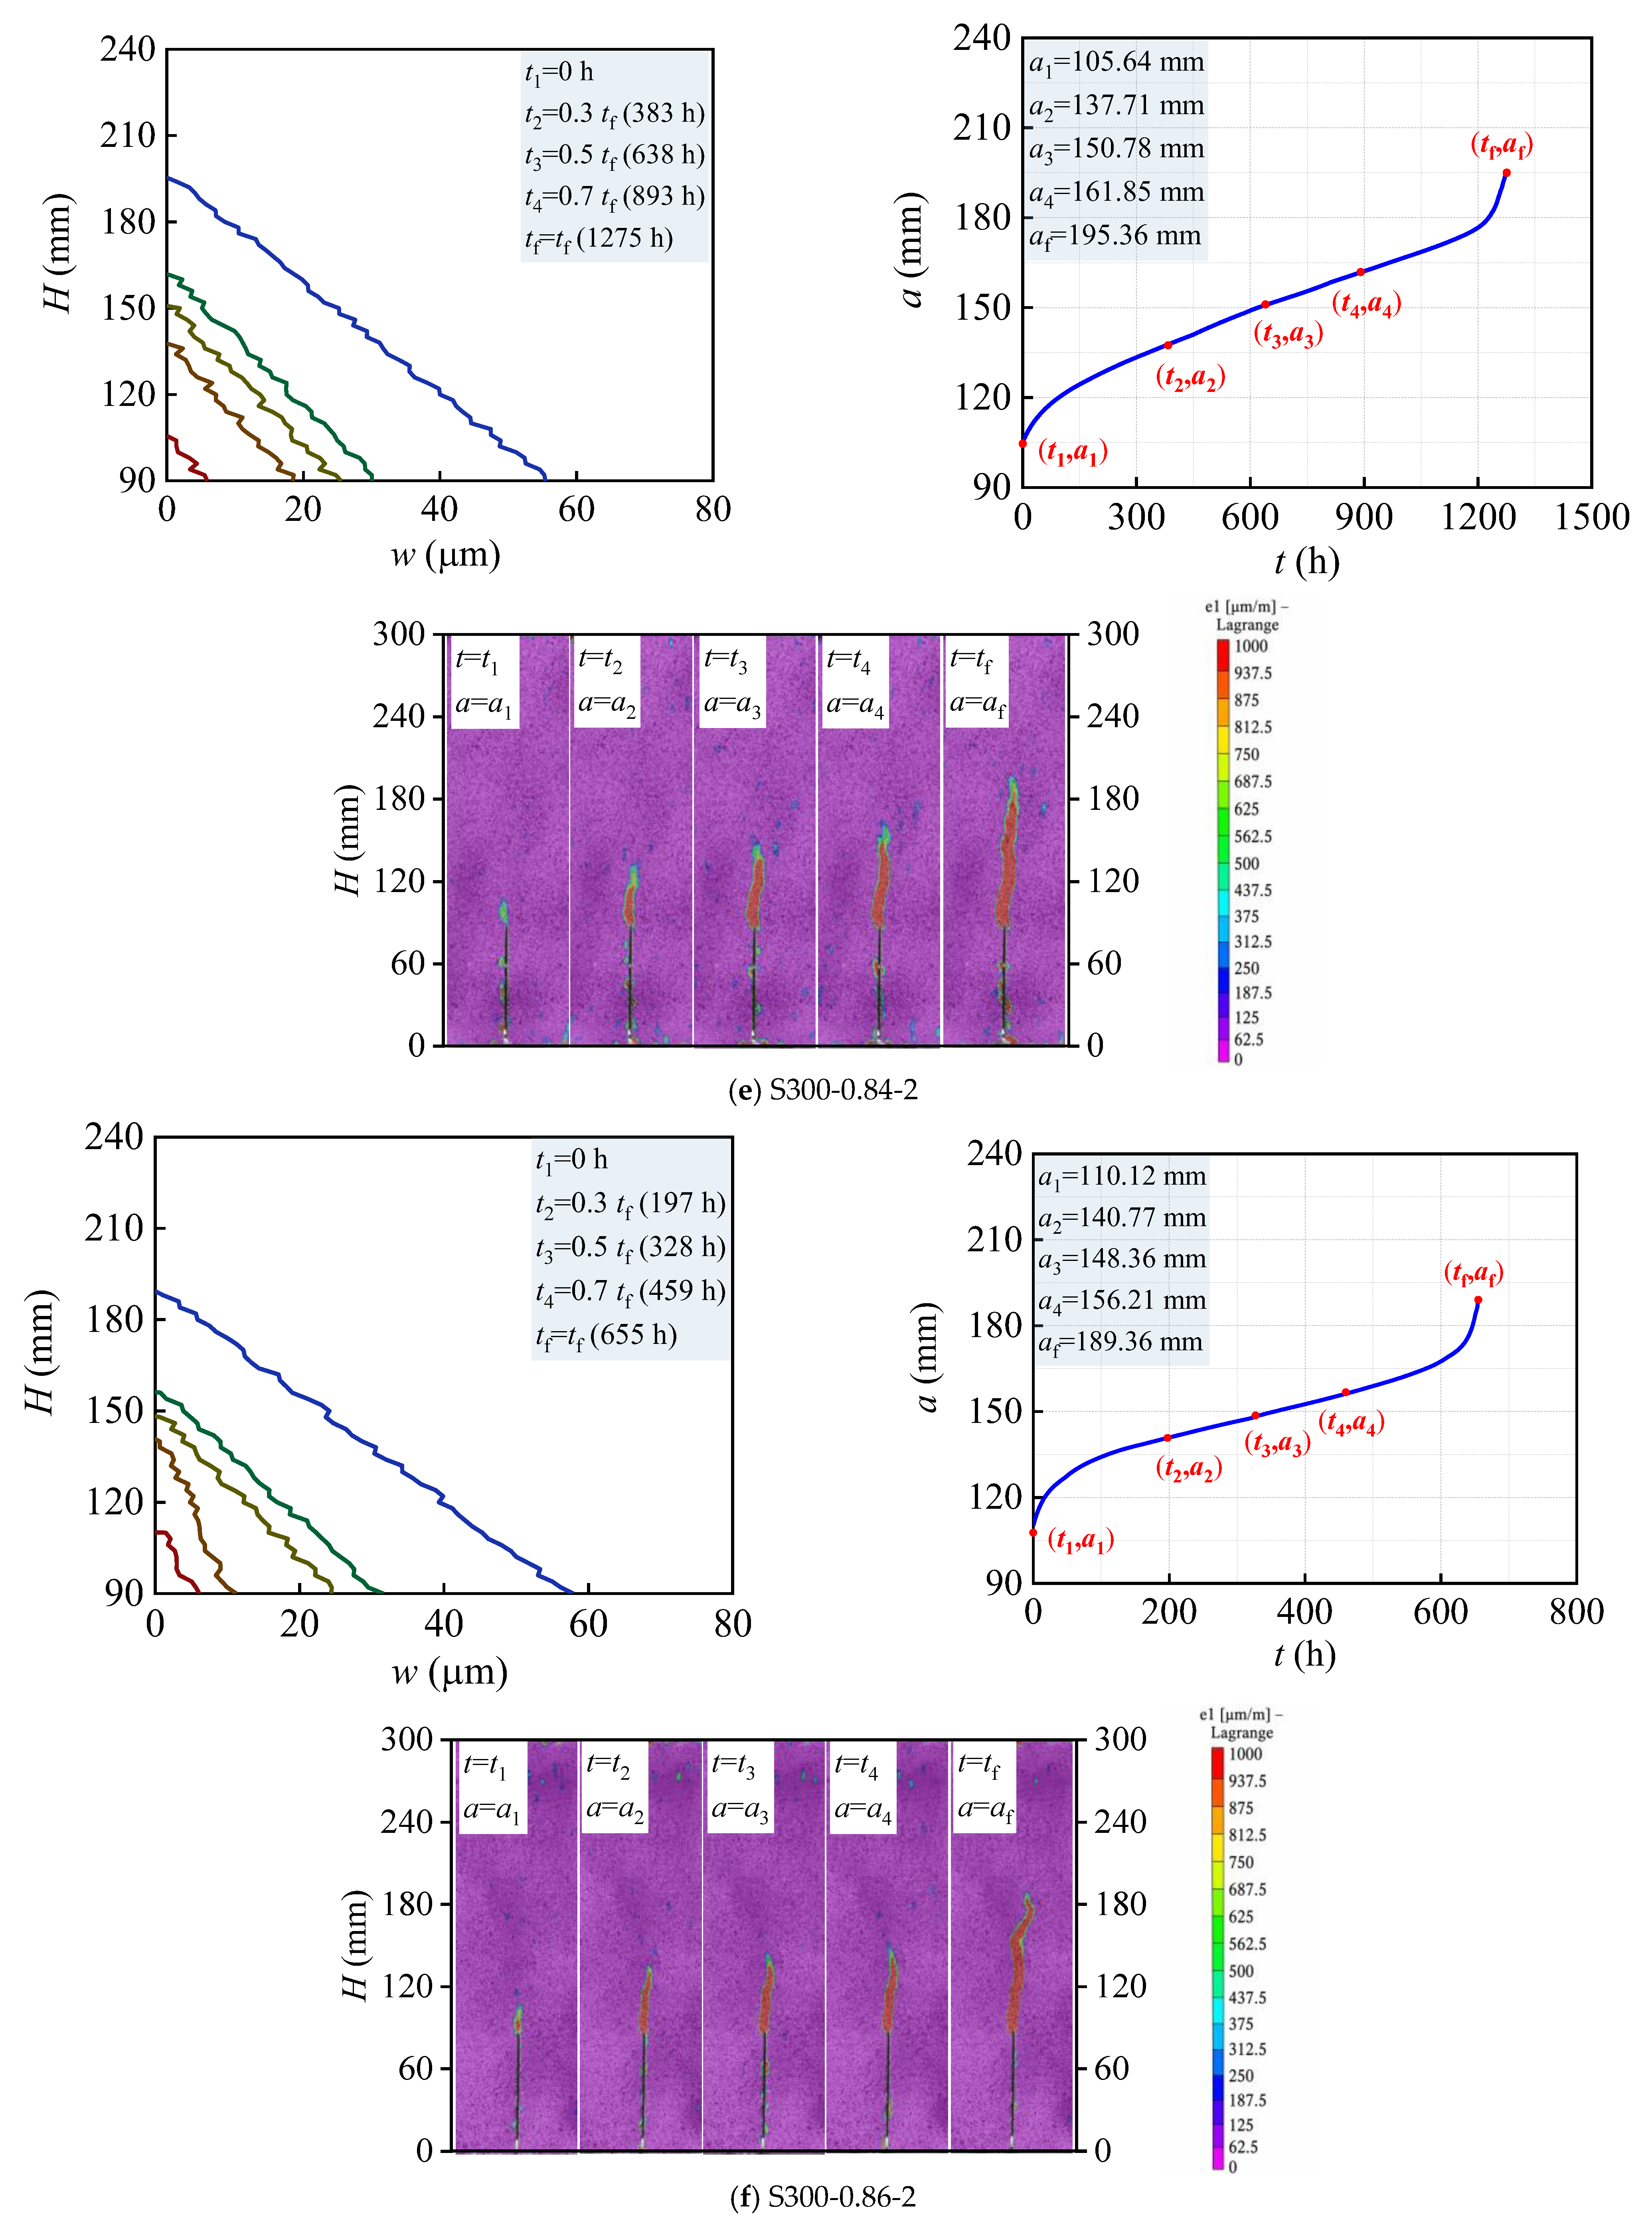
As shown in the figure, the COD within the FPZ at the creep failure exhibits an approximately linear distribution along the ligament direction. To further investigate the crack propagation process of specimens under sustained loading, Figure 10 presents the crack opening displacements and corresponding crack morphologies of specimens S200-0.82-3, S200-0.84-5, S200-0.86-5, S300-0.82-1, S300-0.84-2, and S300-0.86-2 at five representative time points: the beginning of creep loading (t = 0 h), 0.3tf, 0.5tf, 0.7tf, and tf. The contour plots represent the maximum principal strain (με), with a colour scale ranging from 0 to 1000 με. The strain field is shown for visualization of deformation localization. Crack identification is based on crack opening displacement (COD), rather than a strain threshold.
Figure 10.
Crack propagation morphologies of specimens. Note: Different axis scales are used for the S200 and S300 subfigures due to the significant difference in response magnitude.
The fracture process zone (FPZ) is considered complete when the crack opening displacement at the tip reaches the critical value corresponding to zero cohesive stress, i.e., when cohesive stresses are fully relaxed. Under sustained loading, the FPZ does not fully develop at creep failure, which explains the observed brittle-like fracture behavior. This phenomenon can be explained from a mechanical perspective. Under sustained high stress levels, the crack propagation is governed by both viscoelastic deformation and the gradual decay of cohesive stresses within the FPZ. As the cohesive stresses relax over time, the resistance to crack growth decreases, leading to an accelerated propagation of the macro-crack. In contrast, the development of the FPZ relies on the progressive formation and coalescence of micro-cracks, which requires a longer time scale. As a result, the macro-crack can propagate faster than the FPZ can fully develop, leading to creep failure before the formation of a complete FPZ. This indicates that the fracture process under sustained loading is dominated by time-dependent stress redistribution and cohesive stress degradation, resulting in a more brittle failure mode. This behavior contrasts markedly with that observed in the quasi-static fracture tests, where the FPZ length first increases and then decreases. It should be noted that the conclusion regarding the incomplete development of the FPZ at creep failure is based on the evolution of crack opening displacement and is not sensitive to the specific threshold value used for FPZ definition.
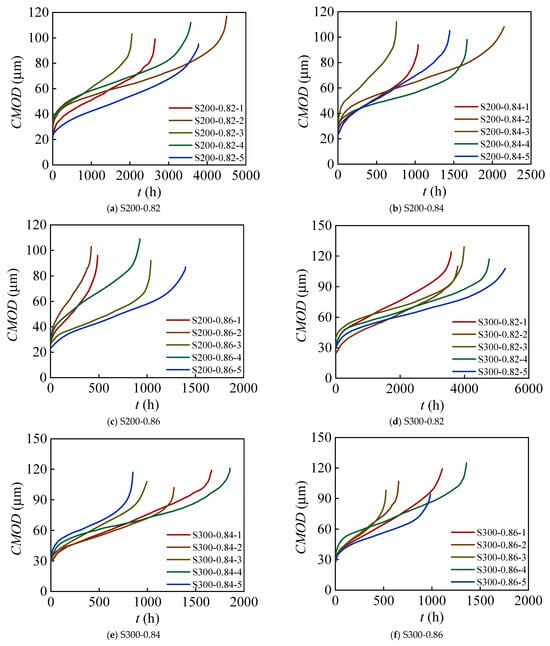
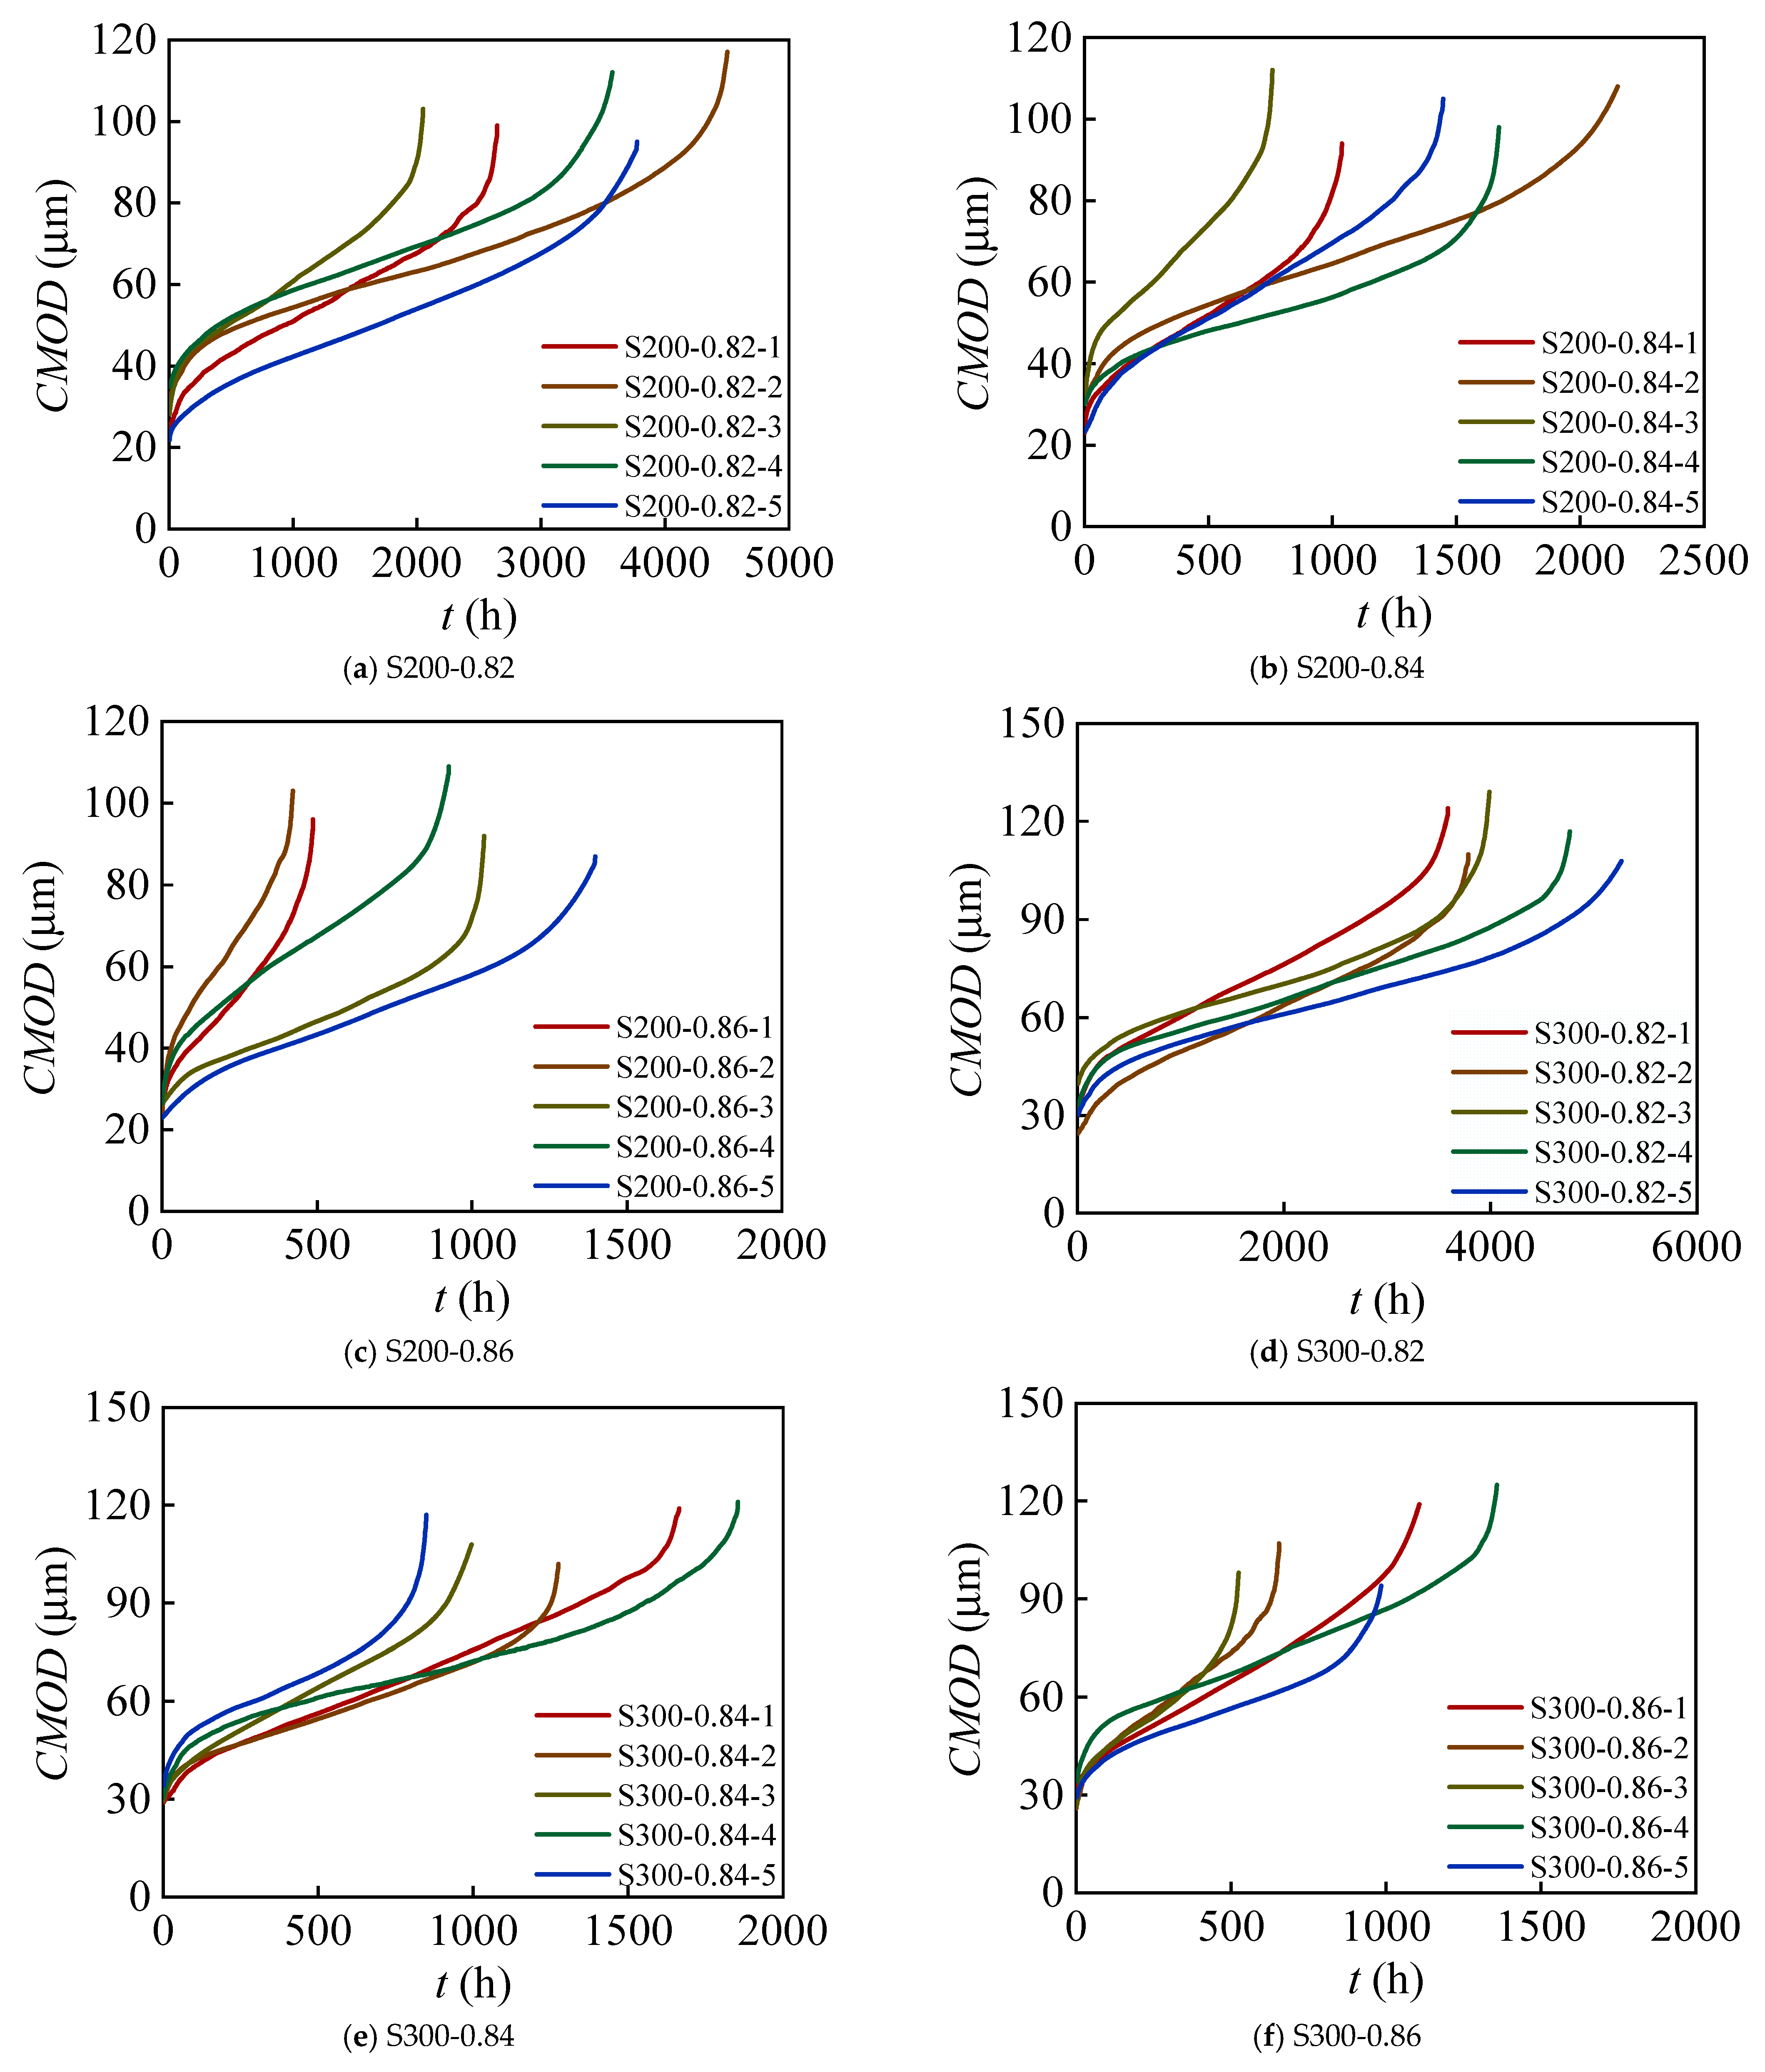
Figure 11.
CMOD-t curves.
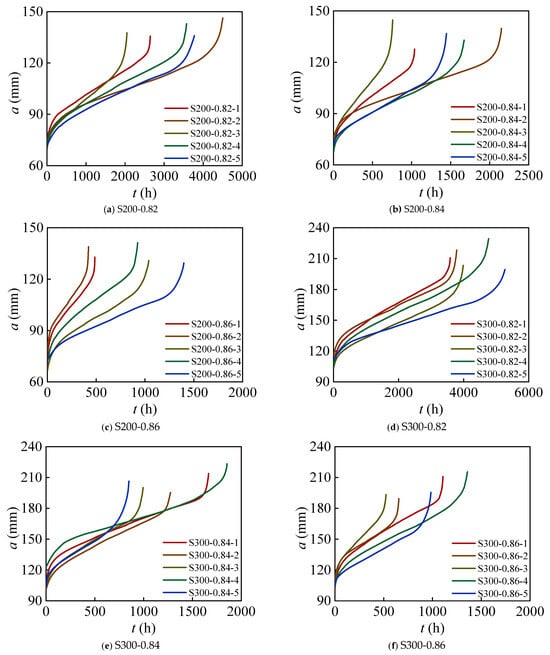
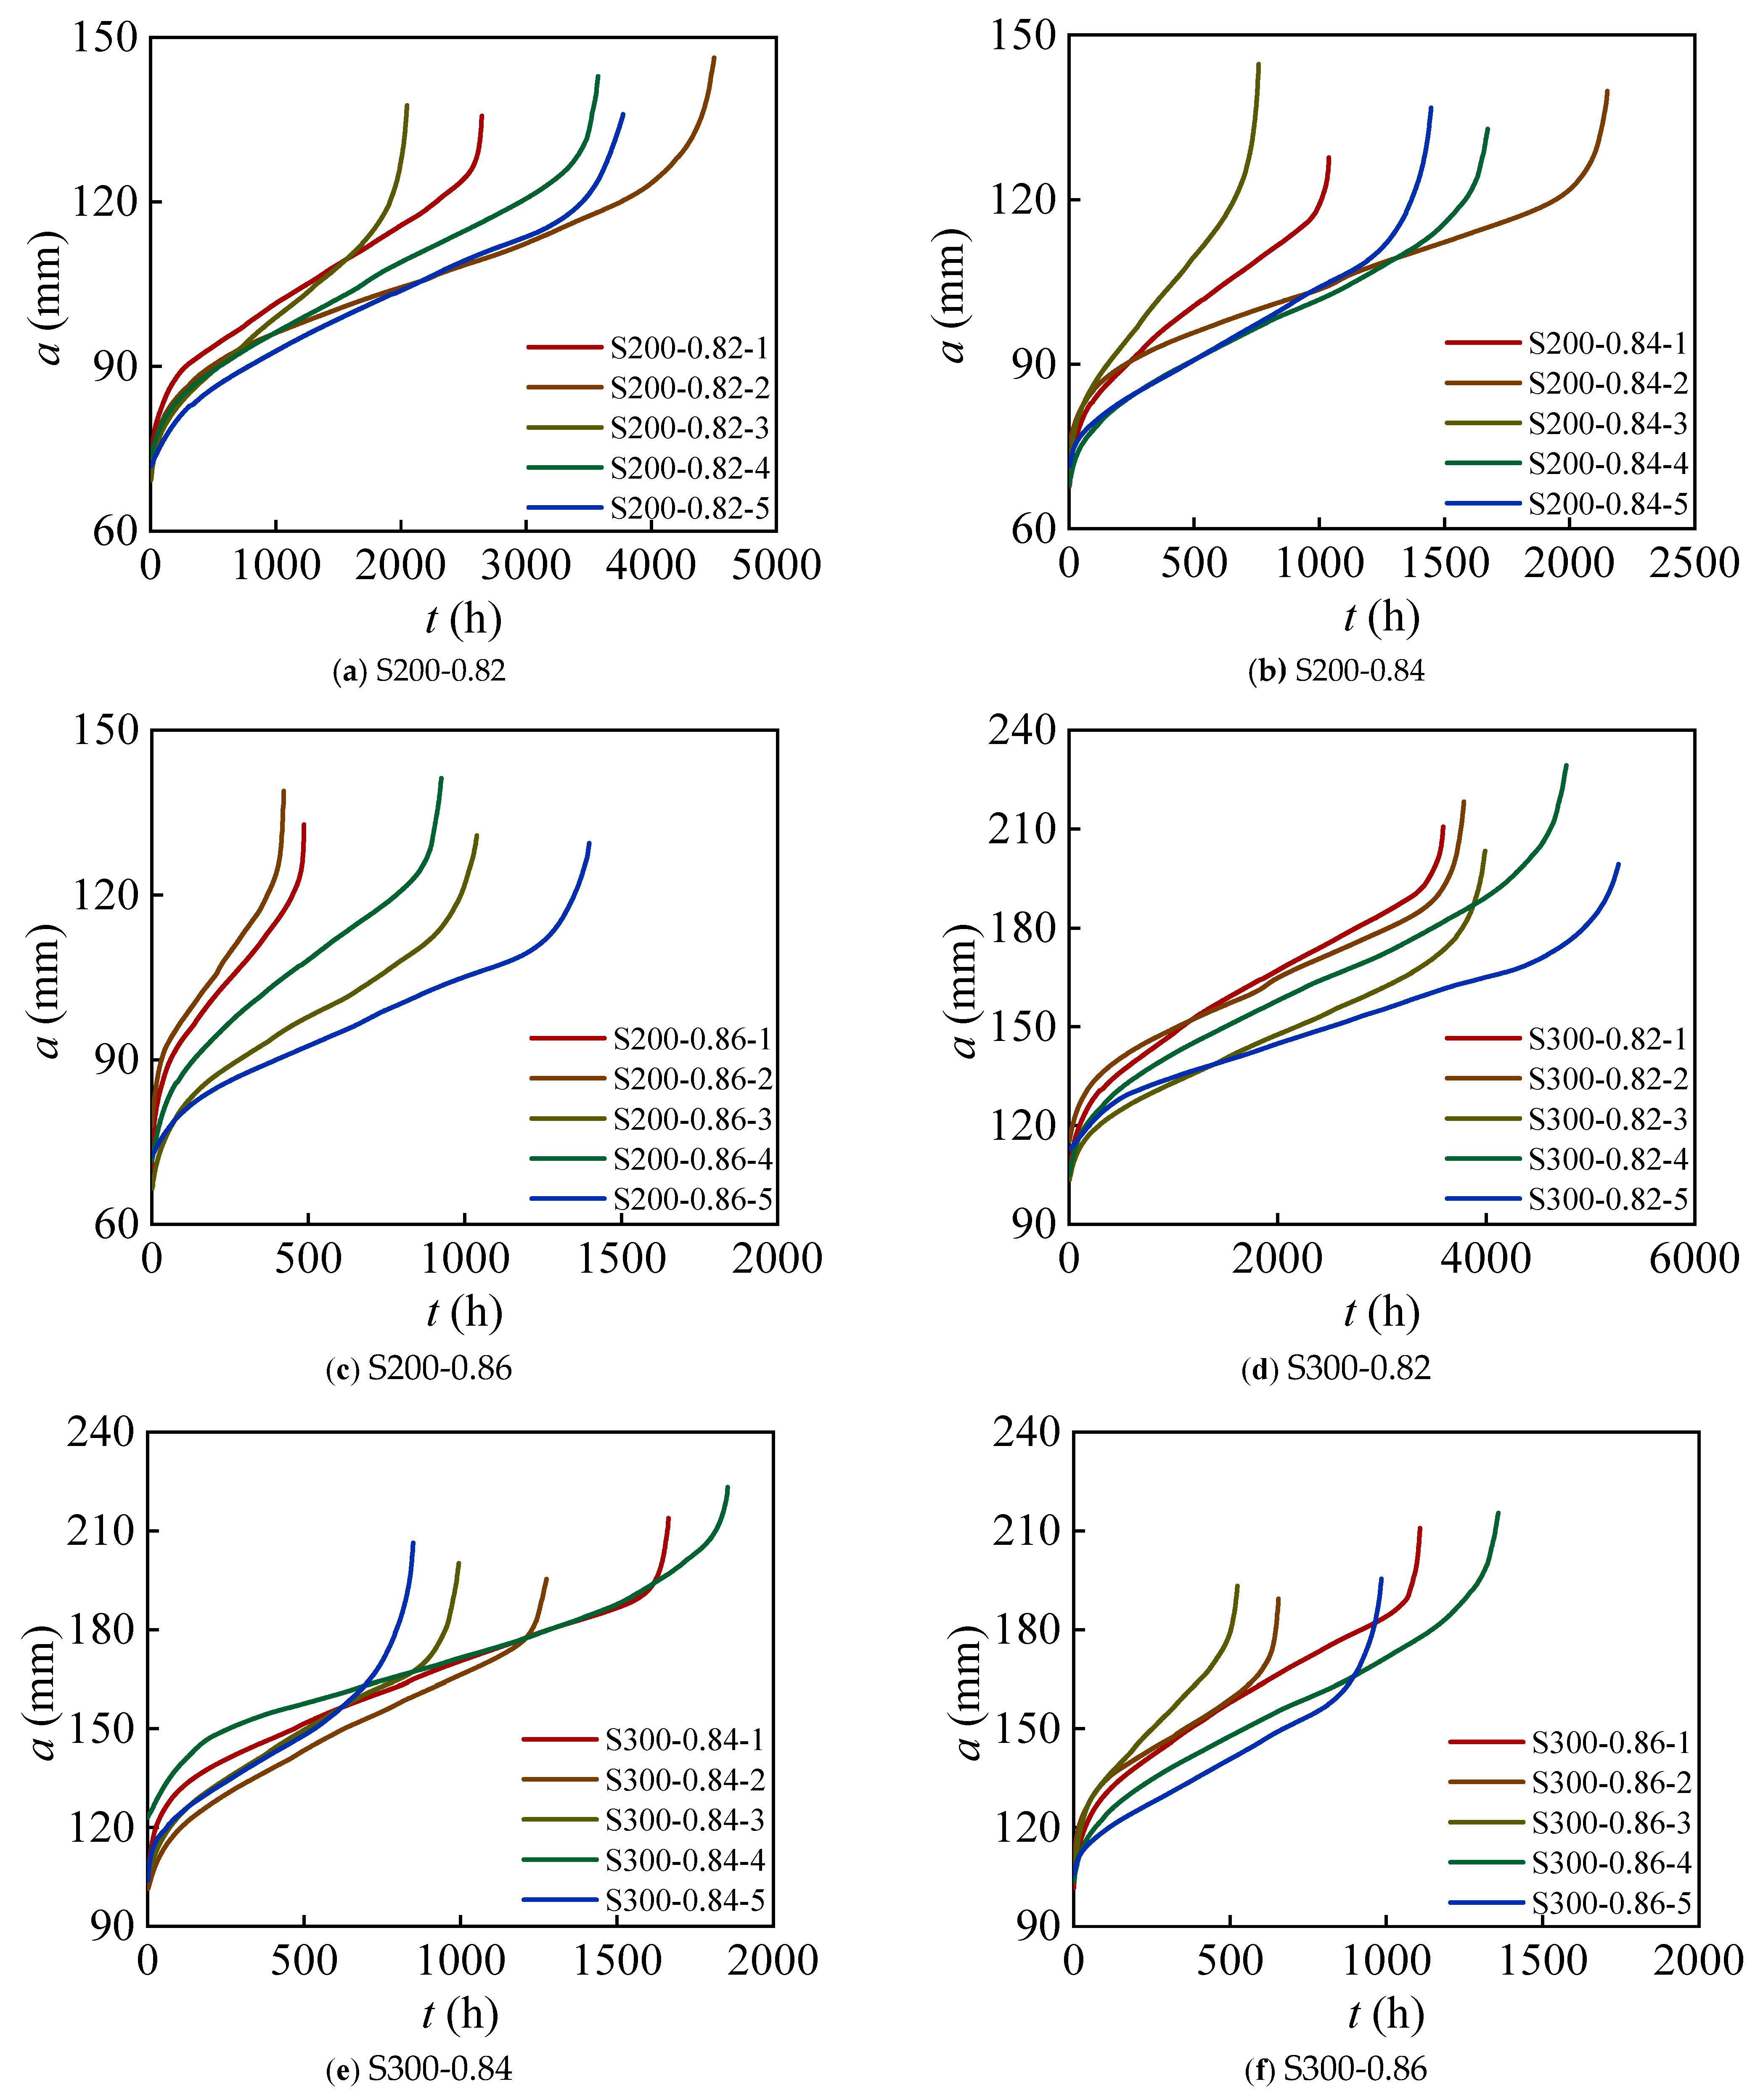
Figure 12.
a-t curves.
As shown in the figure, the crack propagation process can be divided into three stages according to the crack propagation rate. In the first stage, the crack opening displacement and crack length increase gradually, primarily governed by the viscoelastic properties of the concrete, which control the initial deformation under sustained load. In the second stage, the propagation occurs at an approximately constant rate, resulting from the combined effects of material viscoelasticity and the gradual decay of cohesive stresses within the fracture process zone (FPZ). Finally, in the third stage, the crack enters an unstable propagation phase, where the fracture is dominated by cohesive stress decay within the FPZ, leading rapidly to creep failure. This interpretation is consistent with previous related studies [8,26], in which the time-dependent evolution of cohesive stresses was identified as a key mechanism governing creep fracture behavior. The brittle-failure behavior observed under sustained loading can be interpreted within the framework of creep-damage evolution. Previous studies have shown that tertiary creep is associated with progressive microcracking and damage accumulation. During the creep process, damage gradually accumulates, leading to a reduction in stiffness and load-carrying capacity. Once the material resistance is sufficiently degraded, crack propagation becomes unstable, resulting in a rapid increase in crack length and sudden failure. Therefore, the brittle-like failure observed in the final stage can be understood as the instability stage following progressive damage evolution during tertiary creep.
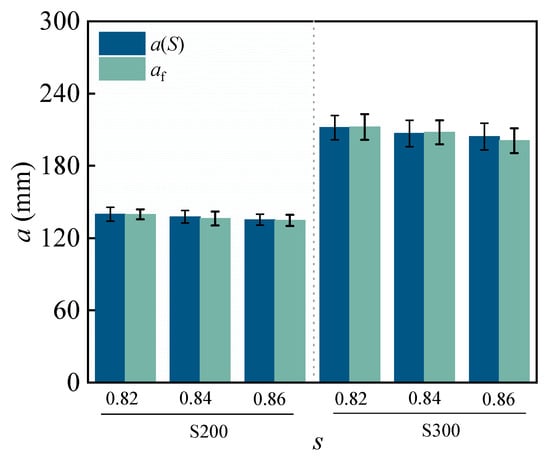
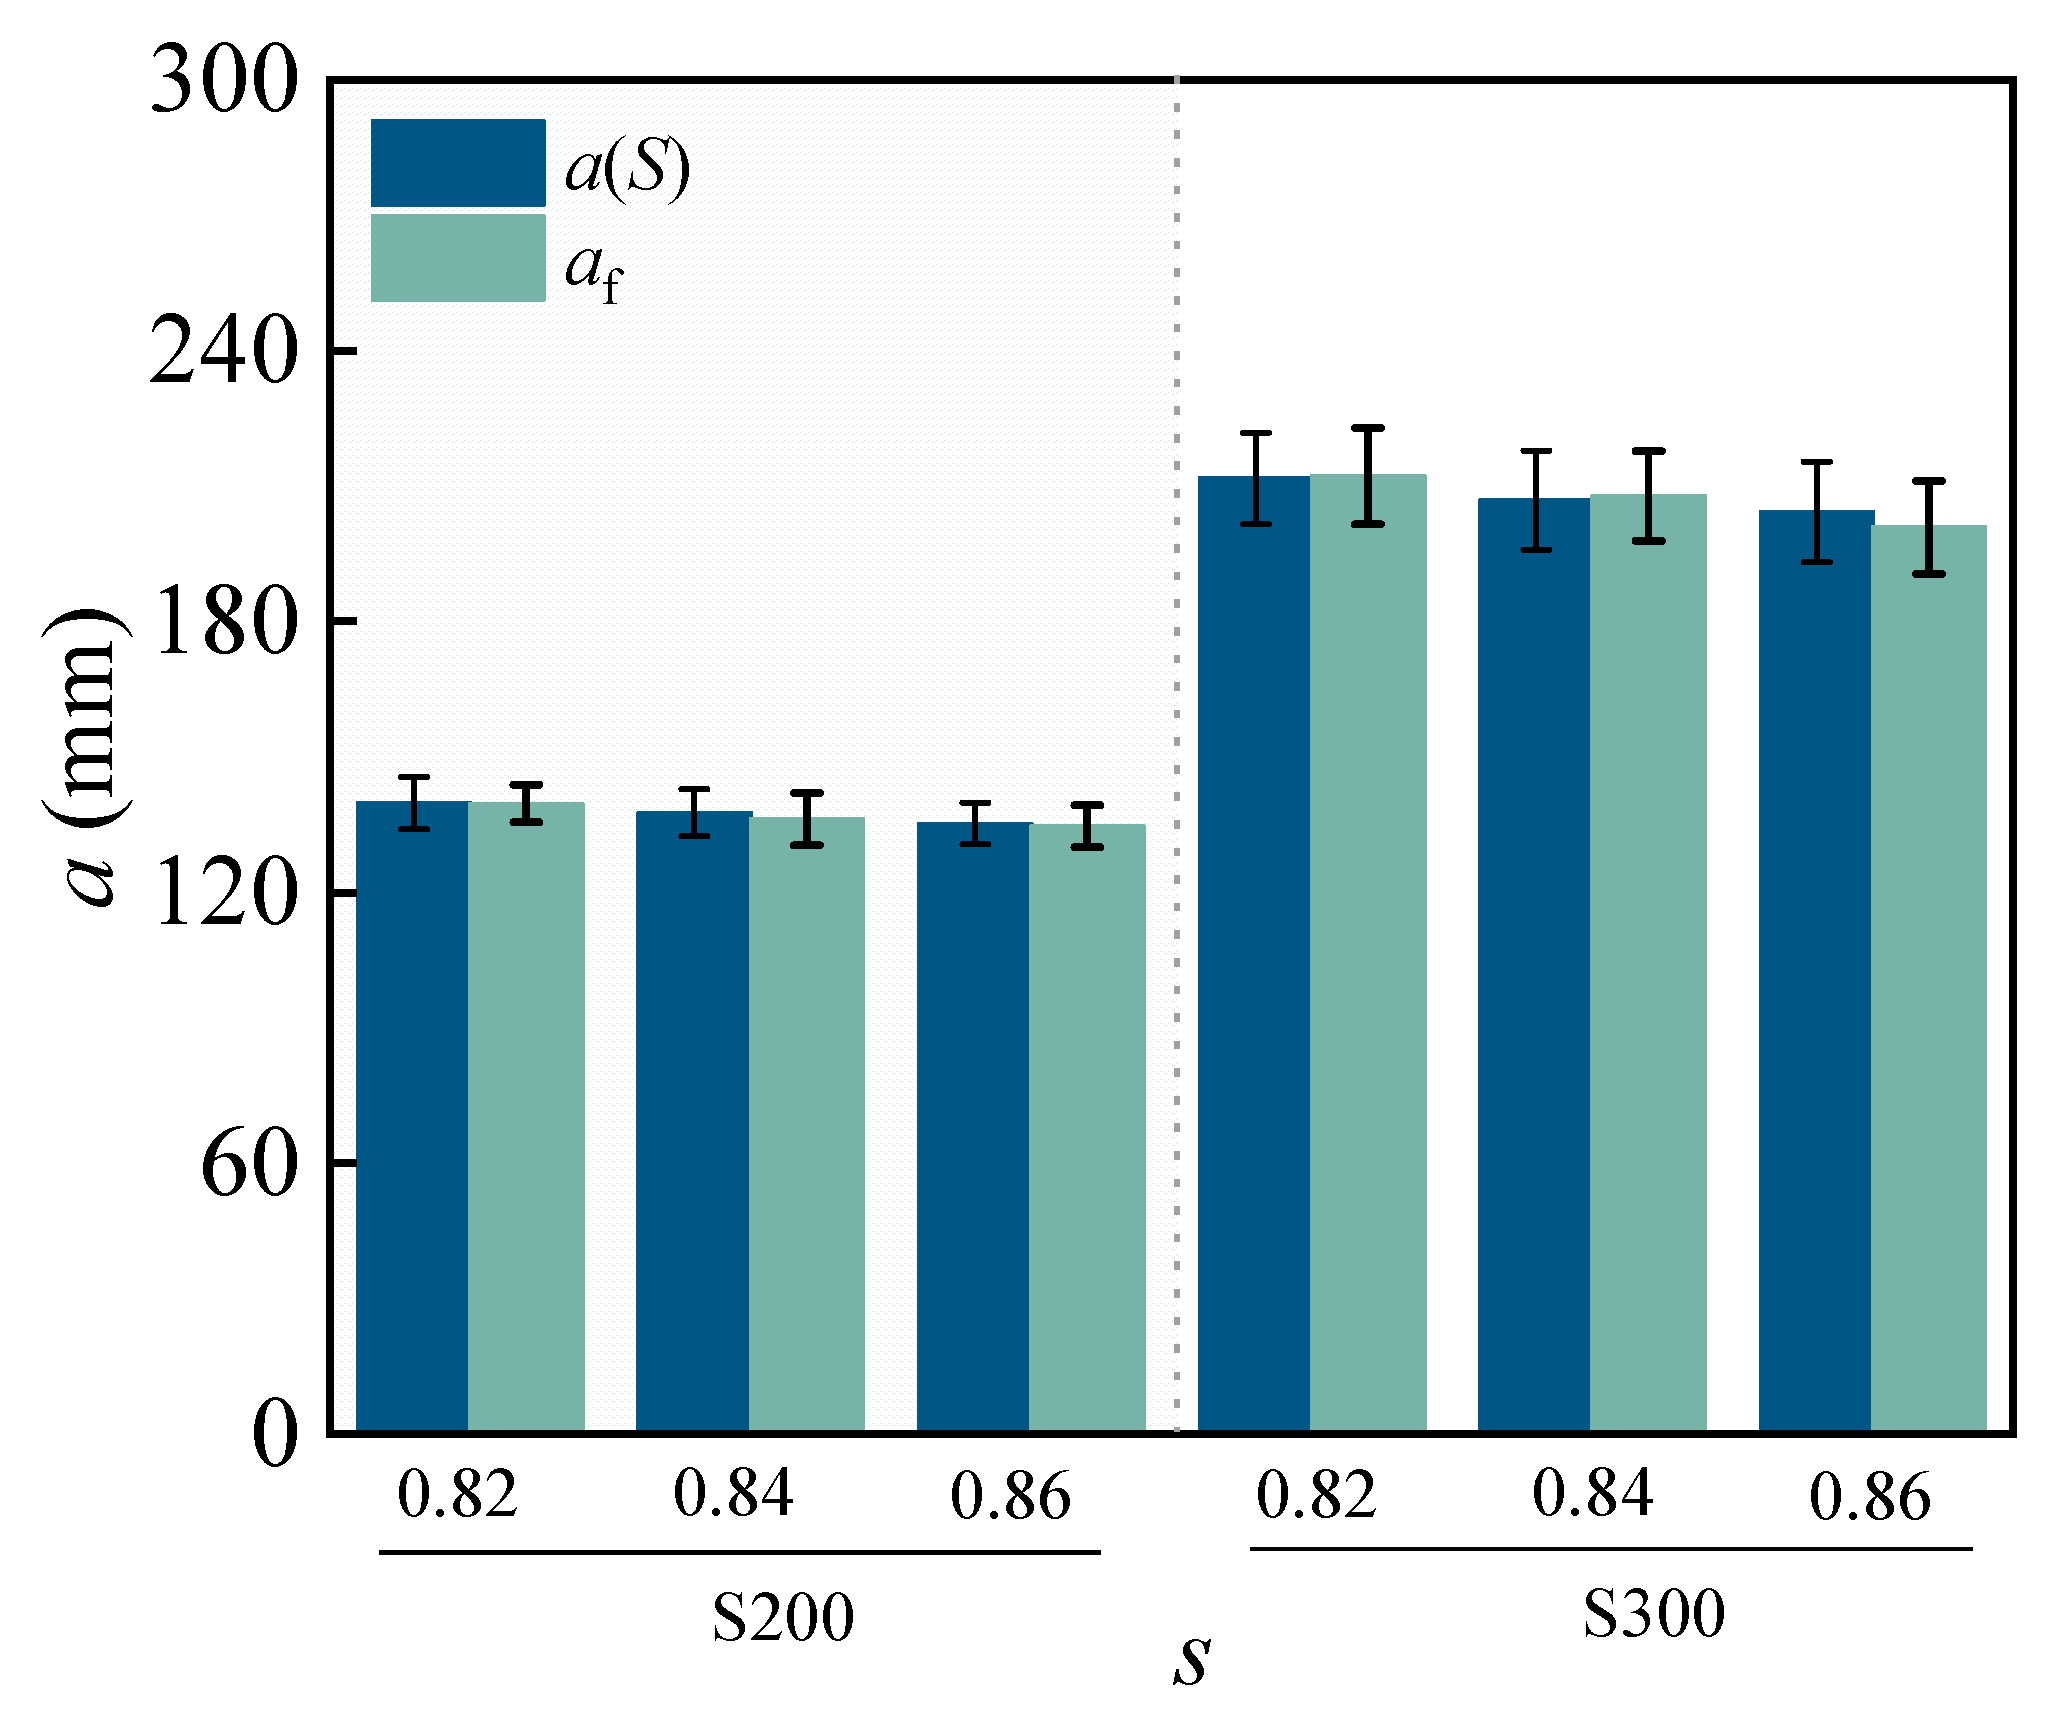
To further investigate the relationship between crack propagation length during creep and that under quasi-static loading, the crack length of TPB specimens at the creep failure under various sustained load levels and the crack length measured at the same load levels in the descending branch of the quasi-static fracture test are compared in this study. In the quasi-static fracture test, the crack lengths a(S), corresponding to each specimen reaching a specific load level in the descending branch, and the crack lengths af at the creep failure are presented in Table 4. Here, a (0.82) denotes the crack length when the load reaches 0.82Pmax in the descending branch of the quasi-static test, and af (0.82) represents the crack length at the creep failure under a sustained load level of 0.82. Figure 13 presents a comparison between the af observed at the creep failure and the corresponding crack lengths a(S) obtained in the quasi-static fracture test at equivalent load levels.
Table 4.
a(S) and af(S) for specimens (mm).
Figure 13.
Comparison between a(S) and af.
To quantitatively evaluate the relationship between the crack length at creep failure (af) and the corresponding crack length on the quasi-static descending branch (a(S)), a paired statistical analysis was conducted. The mean differences and the corresponding 95% confidence intervals for each load level are summarized in Table 5. It can be observed that the mean differences are close to zero and the confidence intervals include zero, indicating that there is no statistically significant difference between af and a(S). This agreement is consistently observed across different load levels. The residual scatter can be attributed to the inherent heterogeneity of concrete and the time-dependent evolution of cohesive stresses during creep. It should be emphasized that the comparison between the creep-failure crack length and the crack length on the quasi-static descending branch is made with respect to the quasi-static reference path obtained under the same experimental configuration and displacement-controlled loading condition. The descending branch is used here as a practical reference for the residual load-carrying capacity of the specimen. However, possible variations in post-peak crack evolution may occur under different control modes, loading rates, or testing system stiffness. Therefore, the observed correspondence between af and a(S) should be interpreted as valid within the present testing conditions, and further studies under different loading paths are needed to examine its generality.
Table 5.
Paired statistical comparison between a(S) and af(S) for specimen.
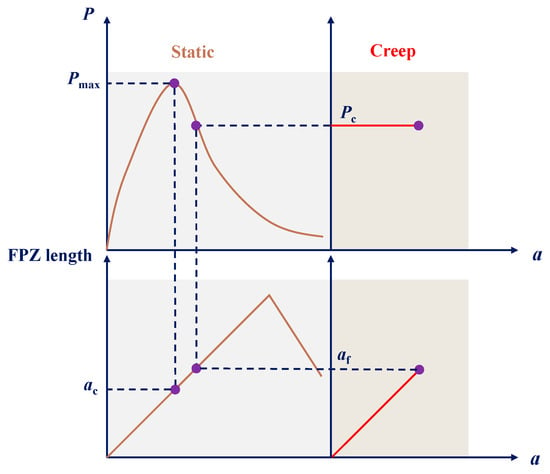
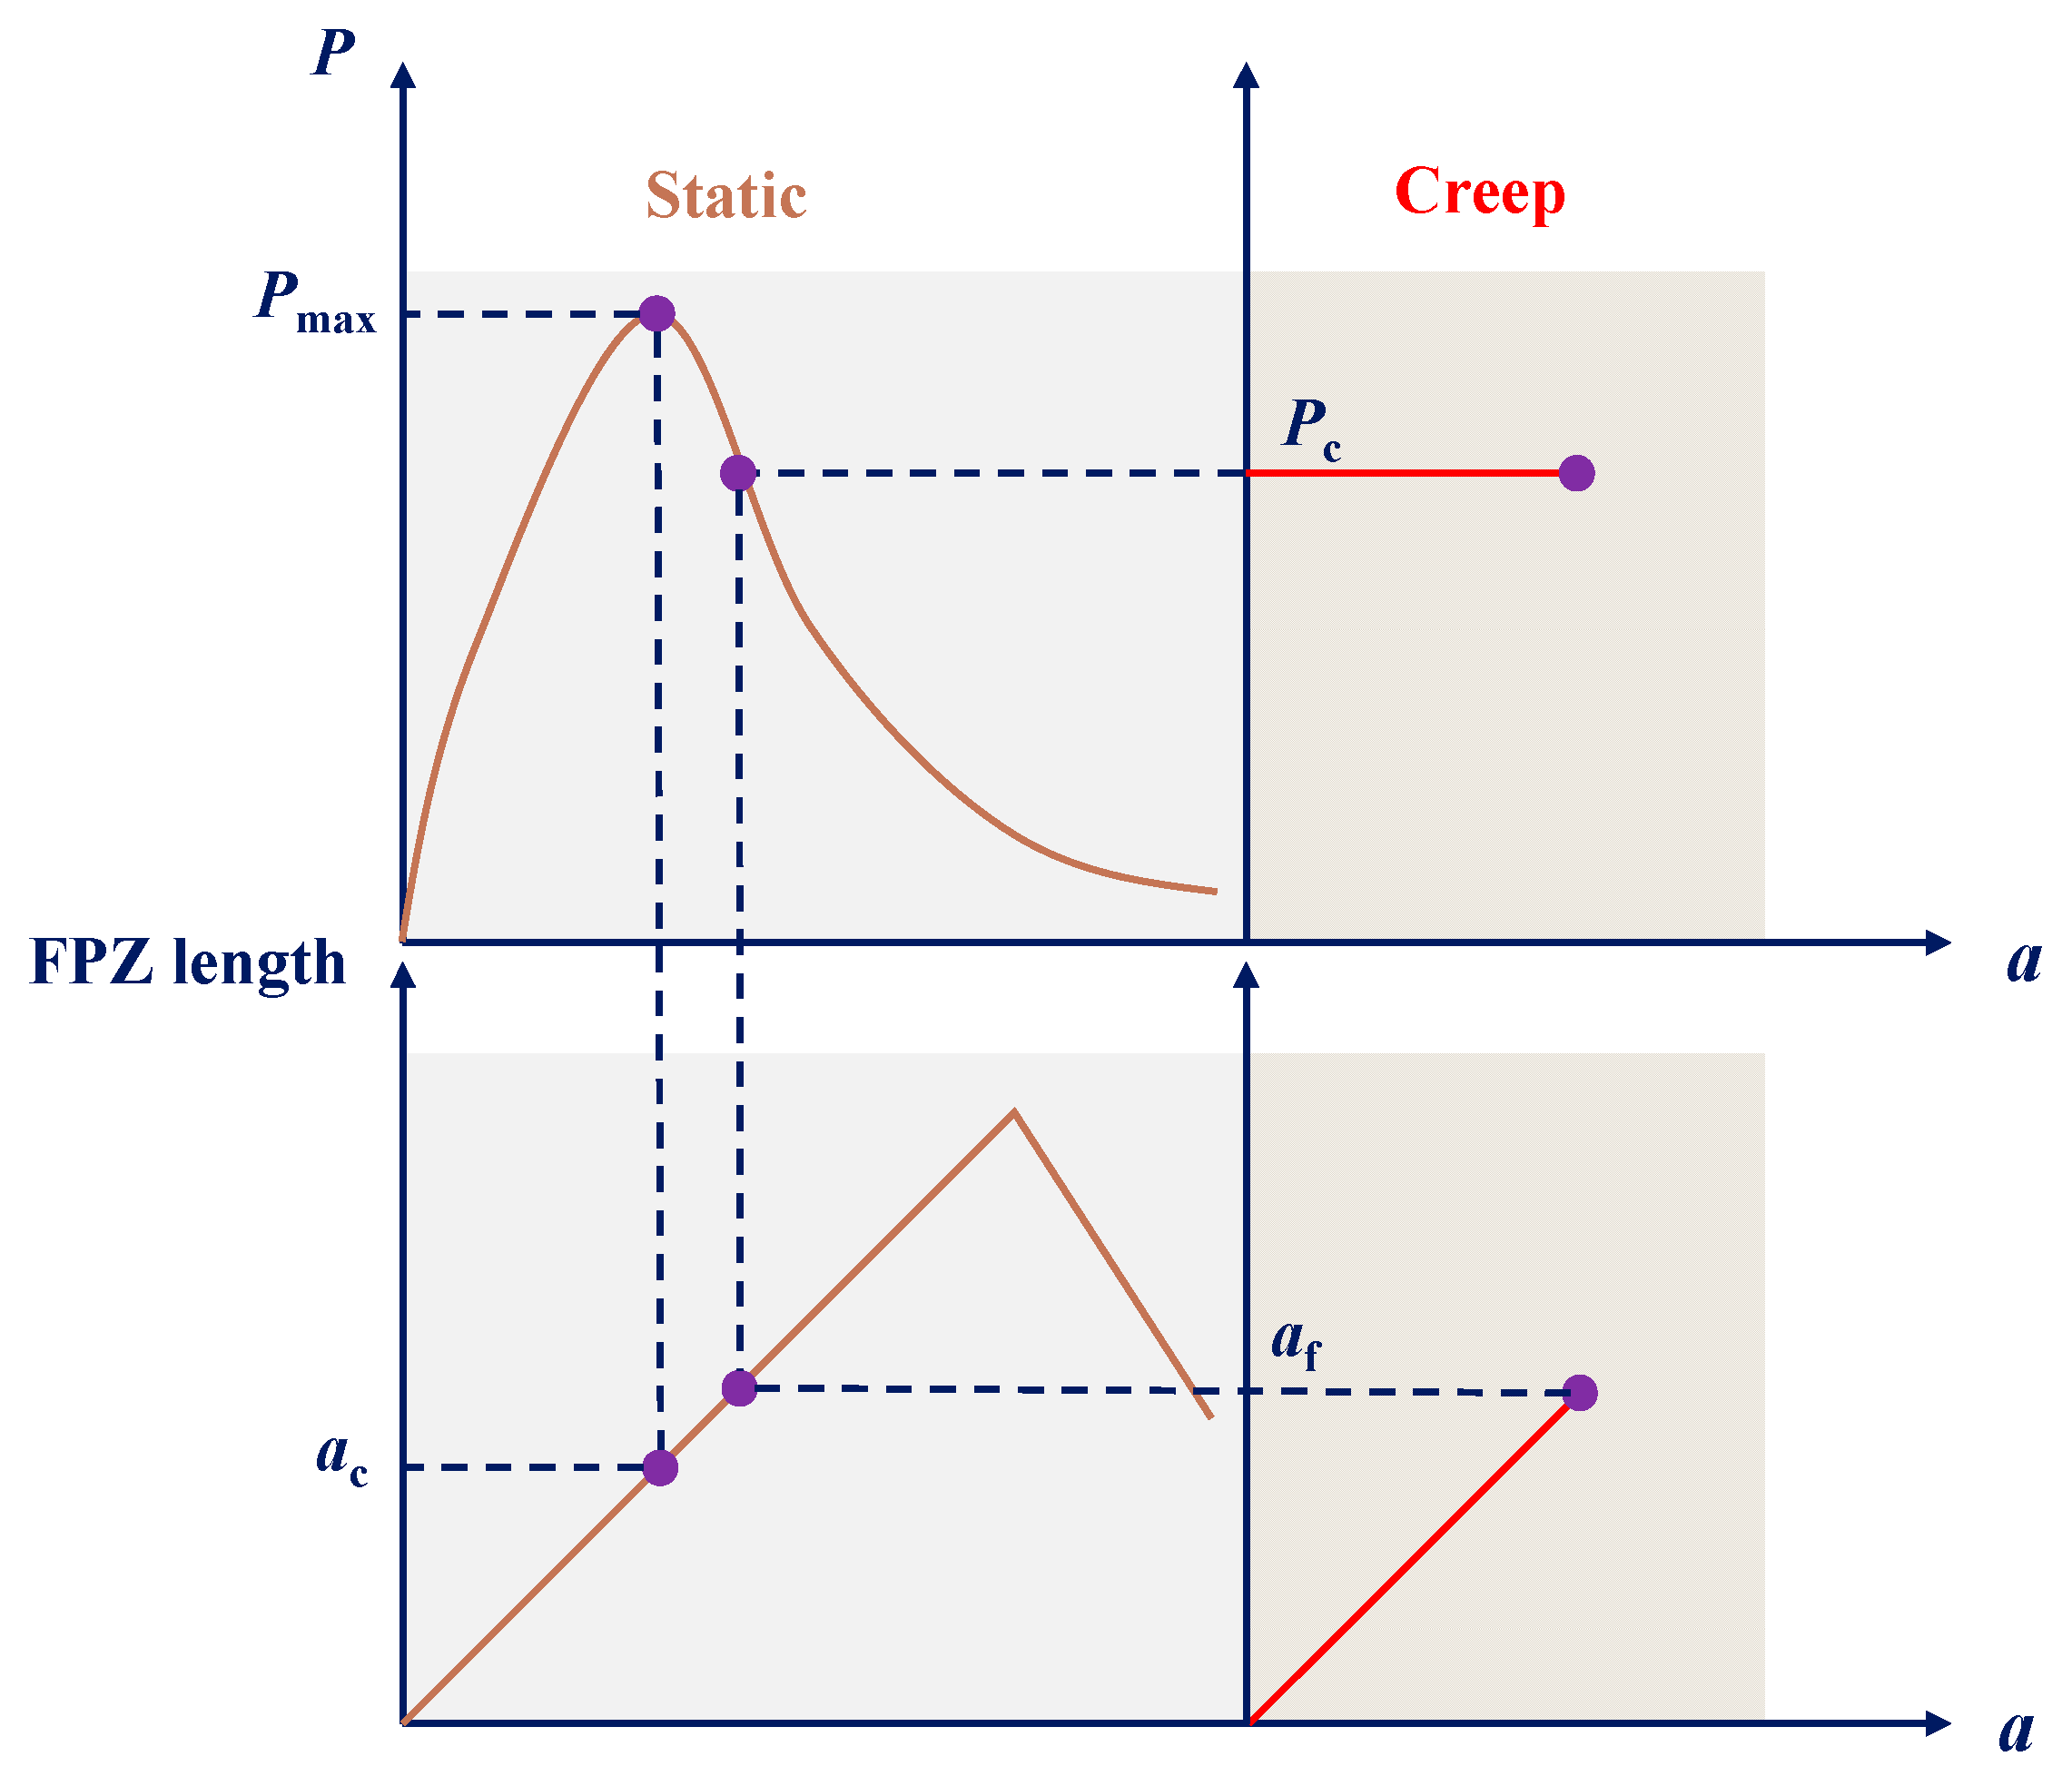
From the figure, it can be observed that the crack length at the creep failure is approximately equal to that under the corresponding load level of the quasi-static loading descent branch; i.e., when the crack length under sustained loading extends to that of the corresponding static loading descent branch, the specimen undergoes the creep failure, as shown in Figure 14. The correspondence between the crack length at creep failure and that on the quasi-static descending branch at the same load level can be interpreted from the perspective of load-carrying capacity and cohesive-fracture mechanics. In the quasi-static fracture test, the descending branch reflects the gradual reduction of load-carrying capacity as the crack propagates. For a given load level, the corresponding crack length represents the critical crack extension at which the specimen can only sustain that level of load. Under sustained loading, viscoelastic deformation and the gradual decay of cohesive stresses within the FPZ reduce the crack-growth resistance over time. As a result, the crack continues to propagate until the residual load-carrying capacity decreases to the applied sustained load. Therefore, creep failure occurs when the crack length reaches the crack length corresponding to the same load level on the quasi-static descending branch. This indicates that the creep fracture process can be regarded as a time-dependent approach to the same critical load-carrying state observed in quasi-static post-peak fracture.
Figure 14.
Relationship between creep fracture and static fracture (the solid line represents the quasi-static fracture reponse, and the dashed lines and marked points indicate the corresponding between the sustained load level and the crack length at creep failure).
This phenomenon suggests that the crack length corresponding to the descending branch of the quasi-static load–displacement curve can serve as a critical reference for assessing the state of the creep failure. Based on this, future studies may establish a creep lifetime prediction model that incorporates the crack propagation rate as a key variable. After obtaining the crack propagation process in real time through DIC method and other crack monitoring techniques, the model can be used to judge the state of the structure in service and warn the risk of creep failure in advance. Furthermore, the critical crack length may be adopted as a diagnostic parameter for evaluating crack stability and the residual service lifetime of concrete under sustained loading. This approach would provide both theoretical support and quantitative guidance for durability design and structural health monitoring of concrete structures.
It should be noted that the range of load levels considered in this study is limited. This is mainly due to the long duration required for creep fracture tests and the constraints of the experimental setup. Although the selected load levels capture the main characteristics of creep crack propagation, including the transition from stable growth to accelerated failure, the extension of the parametric range would further improve the generality of the conclusions. Future work will consider additional load levels to further validate the observed relationships. Although the crack propagation results obtained in the quasi-static fracture tests provide a useful reference for subsequent comparison with creep fracture behavior, it should be noted that the crack length evolution on the quasi-static descending branch is not necessarily a unique path-independent response. For quasi-brittle concrete, post-peak crack evolution may be influenced by the loading path, control mode, loading rate, testing system stiffness, and specimen size. Therefore, the crack length a(S) corresponding to a given load level on the quasi-static descending branch should be regarded as an experimentally determined reference value under the adopted displacement-controlled quasi-static loading condition, rather than as an intrinsic and universally unique critical state. Within the present experimental framework, the smooth post-peak crack propagation curves and the relatively low dispersion of the quasi-static test results indicate that this reference crack propagation path is reproducible for the investigated S200 and S300 specimens.
Previous creep fracture tests [27] on smaller specimens (height 100 mm) at load levels of 0.75, 0.80, 0.85, and 0.90 are presented for reference. Although the specimen size and load levels differ from the current S200/S300 tests, the trends in crack propagation and FPZ evolution are qualitatively consistent. Importantly, the finding that the crack length at creep failure approximately equals the crack length on the quasi-static descending branch (af ≈ a(S)) is observed in both the previous and current datasets (Table 6).
Table 6.
a(S) and af(S) for specimens with the height of 100 mm (mm).
It should be emphasized that the observed relationship between the crack length at creep failure, af, and the crack length on the quasi-static descending branch, a(S), is empirical and conditional. In the present study, af ≈ a(S) is observed for the investigated TPB specimens, load levels, material composition, and testing procedures. Therefore, this relationship should not be regarded as a universal fracture criterion independent of specimen geometry, loading path, control mode, environmental condition, or concrete type. Instead, it provides an experimentally observed correspondence within the specific framework of this study. From a mechanical perspective, this empirical correspondence may be interpreted in terms of residual load-carrying capacity and cohesive-fracture behavior. In the quasi-static fracture test, the descending branch reflects the gradual reduction of load-carrying capacity as the crack propagates. For a given load level, the corresponding crack length represents the crack extension at which the specimen can sustain that load along the adopted quasi-static loading path. Under sustained loading, viscoelastic deformation and time-dependent damage may gradually reduce the resistance to crack growth, allowing the crack to propagate toward a similar residual load-carrying state. However, this explanation should be regarded as a theoretical interpretation based on the observed crack evolution and cohesive-fracture concepts. In this study, cohesive stress degradation and internal damage evolution were not directly measured by independent techniques. Further studies combining DIC with additional measurements, such as acoustic emission, X-ray CT, or direct inverse identification of cohesive stress evolution, are needed to validate this mechanism more rigorously.
4. Conclusions
Three-point bending beams were used to conduct creep fracture tests at load levels of 0.82, 0.84, and 0.86. The crack propagation process was captured using the digital image correlation (DIC) method, and the crack opening displacement within the FPZ was measured. The crack mouth opening displacement and crack length throughout the loading duration were determined. The results were analyzed in comparison with the crack length under quasi-static loading. The main conclusions are as follows:
- (1)
- The crack propagation behavior of concrete under sustained loading reflects its time-dependent fracture mechanisms, characterized by brittle failure with an incompletely developed fracture process zone (FPZ). The crack opening displacement (COD) within the FPZ at creep failure exhibits an approximately linear distribution along the ligament direction.
- (2)
- The crack propagation process under sustained loading can be clearly divided into three stages, namely a decreasing-rate stage, a stable propagation stage, and an unstable acceleration stage. These stages correspond to different governing mechanisms: viscoelastic deformation dominates the initial stage, while the intermediate stage is controlled by the combined effects of viscoelasticity and cohesive stress decay within the FPZ, and the final stage is governed by cohesive stress degradation leading to rapid crack propagation and failure.
- (3)
- The crack length at creep failure corresponds to the crack length on the quasi-static descending branch at the same load level, indicating that creep fracture can be interpreted as a time-dependent evolution toward the same critical load-carrying state observed in quasi-static post-peak behavior. This also suggests that the crack length on the quasi-static descending branch can be used as a reference to assess and predict the critical state of creep failure.
Author Contributions
Methodology, X.H., H.W., H.G. and R.C.Y.; Validation, H.W.; Investigation, X.H., H.W., H.G., R.C.Y. and Z.W.; Writing—original draft, X.H. and Z.W.; Writing—review & editing, X.H. and Z.W.; Funding acquisition, Z.W. All authors have read and agreed to the published version of the manuscript.
Funding
This research was funded by National Natural Science Foundation of China grant number 52478565 and Visiting Researcher Fund Program of State Key Laboratory of Water Resources and Hydropower Engineering Science grant number 2024GG06.
Data Availability Statement
The original contributions presented in this study are included in the article. Further inquiries can be directed to the corresponding author.
Conflicts of Interest
The authors declare no conflict of interest.
References
- Han, X.; Wang, H.; Gao, H.; Zheng, J.; Yu, R.C.; Wang, Z.; Wu, Z. Fracture energy of concrete after sustained loading. Eng. Fract. Mech. 2024, 308, 110350. [Google Scholar] [CrossRef] [Scilit]
- Li, J.; Dong, W.; Zhang, B.; Zhou, X. Effects of creep recovery on the fracture properties of concrete. Theor. Appl. Fract. Mech. 2020, 109, 102694. [Google Scholar] [CrossRef] [Scilit]
- Yang, M.; Dong, W.; Yuan, W.; Zhang, B. Fracture properties of mixed mode I-II cracks in concrete after sustained loading. Eng. Fract. Mech. 2024, 309, 110394. [Google Scholar] [CrossRef] [Scilit]
- Dong, W.; Rong, H.; Wu, Q.; Li, J. Investigations on the FPZ evolution of concrete after sustained loading by means of the DIC technique. Constr. Build. Mater. 2018, 188, 49–57. [Google Scholar] [CrossRef] [Scilit]
- Yao, J.; Geng, Y.; Yuan, W.; Dong, W. Experimental and numerical investigations on rate-dependent fracture behavior of concrete-rock interface. Theor. Appl. Fract. Mech. 2024, 133, 104646. [Google Scholar] [CrossRef] [Scilit]
- Bažant, Z.P.; Xiang, Y. Crack growth and lifetime of concrete under long time loading. J. Eng. Mech. 1997, 123, 350–358. [Google Scholar] [CrossRef] [Scilit]
- Santhikumar, S.; Karihaloo, B.L. Time-dependent tension softening. Mech. Cohesive-Frict. Mater. 1996, 1, 295–304. [Google Scholar] [CrossRef]
- Gao, H.; Kuang, R.; Li, X. Time-dependent crack propagation in concrete under constant loading. Eng. Fract. Mech. 2022, 265, 108385. [Google Scholar] [CrossRef] [Scilit]
- Saliba, J.; Loukili, A.; Grondin, F.; Regoin, J.P. Identification of damage mechanisms in concrete under high level creep by the acoustic emission technique. Mater. Struct. 2014, 47, 1041–1053. [Google Scholar] [CrossRef] [Scilit]
- Omar, M.; Loukili, A.; Pijaudier-Cabot, G.; Le Pape, Y. Creep-Damage Coupled Effects: Experimental Investigation on Bending Beams with Various Sizes. J. Mater. Civ. Eng. 2009, 21, 65–72. [Google Scholar] [CrossRef] [Scilit]
- Yuan, W.; Dong, W.; Zhang, B.; Zhong, H. Time-dependent fracture behavior of rock-concrete interface coupling viscoelasticity and cohesive stress relaxation. J. Eng. Mech. 2023, 149, 04022100. [Google Scholar] [CrossRef] [Scilit]
- Barpi, F.; Valente, S. Creep and fracture in concrete: A fractional order rate approach. Eng. Fract. Mech. 2002, 70, 611–623. [Google Scholar] [CrossRef] [Scilit]
- Zijl, G.P.; Borst, R.; Rots, J.G. A numerical model for the time-dependent cracking of cementitious materials. Int. J. Numer. Methods Eng. 2001, 52, 637–654. [Google Scholar] [CrossRef] [Scilit]
- Van Zijl, G.; De Borst, R.; Rots, J.G. The role of crack rate dependence in the long-term behaviour of cementitious materials. Int. J. Solids Struct. 2001, 38, 5063–5079. [Google Scholar] [CrossRef] [Scilit]
- Barpi, F.; Ferrara, G.; Imperato, L.; Valente, S. Lifetime of concrete dam models under constant loads. Mater. Struct. 1999, 32, 103–111. [Google Scholar] [CrossRef] [Scilit]
- Karihaloo, B.; Santhikumar, S. Application of a visco-elastic tension-softening constitutive model to cracked and ageing concrete. Constr. Build. Mater. 1999, 13, 15–21. [Google Scholar] [CrossRef] [Scilit]
- Sathikumar, S.; Karihaloo, B.L.; Reid, S.G. A model for ageing visco-elastic tension softening materials. Mech. Cohesive-Frict. Mater. 1998, 3, 27–39. [Google Scholar] [CrossRef]
- Carpinteri, A.; Valente, S.; Zhou, F.P.; Ferrara, G.; Melchiorri, G. Tensile and flexural creep rupture tests on partially-damaged concrete specimens. Mater. Struct. 1997, 30, 269–276. [Google Scholar] [CrossRef] [Scilit]
- Yuan, W.; Dong, W.; Zhang, B.; Huo, J. Viscoelasticity-induced fracture behavior of rock-concrete interface after sustaining creep process. Cem. Concr. Compos. 2023, 136, 104901. [Google Scholar] [CrossRef] [Scilit]
- Dong, W.; Yuan, W.; Zhang, B.; Zhong, H. Energy-based fracture criterion of rock-concrete interface considering viscoelastic characteristics. J. Eng. Mech. 2022, 148, 04021155. [Google Scholar] [CrossRef] [Scilit]
- Li, J.; Dong, W.; Zhang, B.; Zhou, X. Prediction on crack propagation of concrete due to time-dependent creep under high sustained loading. J. Mater. Civ. Eng. 2022, 34, 04021451. [Google Scholar] [CrossRef] [Scilit]
- Li, J.; Dong, W.; Zhao, X.; Li, H. Investigation on fracture properties of concrete considering the viscoelastic characteristics. Constr. Build. Mater. 2024, 426, 136044. [Google Scholar] [CrossRef] [Scilit]
- Rong, H.; Dong, W.; Zhang, X.; Zhang, B. Size effect on fracture properties of concrete after sustained loading. Mater. Struct. 2019, 52, 16. [Google Scholar] [CrossRef] [Scilit]
- Dong, W.; Zhang, X.; Zhang, B.; Wu, Q. Influence of sustained loading on fracture properties of concrete. Eng. Fract. Mech. 2018, 200, 134–145. [Google Scholar] [CrossRef] [Scilit]
- Xu, S.; Reinhardt, H.W. Determination of double-K criterion for crack propagation in quasi-brittle fracture, Part I: Experimental investigation of crack propagation. Int. J. Fract. 1999, 98, 111–149. [Google Scholar] [CrossRef] [Scilit]
- Zhou, F.P. Time Dependent Crack Growth and Fracture in Concrete. Ph.D. Thesis, Lund University, Lund, Sweden, 1992. [Google Scholar]
- Han, X.Y.; Wu, Z.M.; Gao, H.B.; Zheng, J.; Yu, R.C. Tension-softening constitutive model of concrete under sustained loading. Constr. Build. Mater. 2024, 421, 135623. [Google Scholar] [CrossRef] [Scilit]

Disclaimer/Publisher’s Note: The statements, opinions and data contained in all publications are solely those of the individual author(s) and contributor(s) and not of MDPI and/or the editor(s). MDPI and/or the editor(s) disclaim responsibility for any injury to people or property resulting from any ideas, methods, instructions or products referred to in the content. |
© 2026 by the authors. Licensee MDPI, Basel, Switzerland. This article is an open access article distributed under the terms and conditions of the Creative Commons Attribution (CC BY) license.