


Abstract
Water and mud inrush represent some of the most catastrophic geological hazards encountered in tunnel engineering. Underground Magnetic Resonance Sounding (UMRS) holds significant potential for prospecting hydrogeological parameters within adverse geological bodies. The implementation of the method is limited, however, by the challenge of undesired frequency offsets between the assumed and true Larmor frequencies and poor signal-to-noise ratios in the tunnel environment. For the adaptation of UMRS to the tunnel environments, accurate modeling considering the off-resonance effects and magnitude enhancement of received signals is required. The traditional UMRS application assumes that on-resonance excitation is valid for any circumstance. Neglecting the effects of undesired frequency offsets produces a significant influence on amplitudes and phases of UMRS signals, as demonstrated by our models. Moving beyond the on-resonance excitation condition, we focus on a primary study of a novel multi-off-resonance excitation method using a broadband pulse, in which the off-resonance effects are exploited for improving signal magnitudes of UMRS. To implement the method we proposed, a new excitation pulse with several spectral peaks in a finite bandwidth is presented. Each spectral peak of the excitation spectrum contributes to the response voltage according to its spectral amplitude and offsets to Larmor frequency. The spectrum of the new excitation pulse can be modulated according to demands. The feasibility of the excitation pulse and method are supported by synthetic experiments using three different pulse parameters. Significant magnitude enhancement in the sounding curves is presented in the occurrence of undesired frequency offsets with different magnitudes. Furthermore, the method we proposed provides signal enhancement for the deeper water occurrence in the presence of an undesired frequency offset. We note that the present study is a theoretical and numerical proof-of-concept investigation. Experimental validation, including laboratory-scale physical model tests and field tunnel measurements, is planned as future work once suitable transmitter instrumentation becomes available.
1. Introduction
Underground magnetic resonance sounding (UMRS) [1,2] is a noninvasive tool directly providing the hydrogeological properties, e.g., water content, porosity, and permeability, of underground aquifers. Based on the theory of nuclear magnetic resonance (NMR), the principle of UMRS is similar to surface NMR [3] and NMR logging [4]. The UMRS involves transmitting, receiving and reference coils installed on the tunnel face (the excavation face of tunnel). An artificially monochromatic field BT is used to tip the magnetization M in the underground aquifers. This magnetization relaxes at the local Larmor frequency when immersed in the earth magnetic field B0. The initial amplitudes of the relaxation signals can indicate the distribution of the water content [5]. The relaxation time is related to the distribution of pore sizes [6]. When the two datasets are taken into account together, the partial water content can be directly estimated [7], which provides the distribution of not only the subsurface water content but also permeability. In the construction tunnel, the prospection for water and mud inrush can be characterized by the porosity and permeability of the surrounding rocks or geological body ahead of the tunnel face. For karst aquifers, high porosity and permeability are likely to be more common for young carbonates, such as Tertiary carbonate platforms of Florida, Yucatan and ocean islands. In these areas, an extensive exchange may occur between the matrix and conduit porosity [8], which can cause water inrush during excavation. When filled with clay with low permeability, water in fault and karst conduits will diffuse in clay. The filling material may flow like a fluid into tunnels under high water pressure, termed mud inrush disasters in the present study [9]. As such, UMRS is a powerful tool with the potential to prospect the adverse geological bodies that may cause the water or mud inrush in tunnels. To achieve reliable UMRS estimations, accurate modeling of off-resonance effects [10,11,12], high-resolution inversion methodology [7,12,13,14] and signal enhancement techniques specifically for tunnel environments [15] are required.
To implement UMRS, one crucial issue, the resonance condition, must be followed. Traditionally, the transmitting frequency wT is assumed to be equal to the Larmor frequency w0 at all locations in the tunnel zone. However, this assumption might be violated in the occurrence of a magnetic susceptibility contrast between the rock matrix and pore fluid [16], diurnally geomagnetic variation accounting some 10–40 nT [17], spatial variation resulting from local magnetic anomaly or sometimes instrumental imperfections. In addition, the short duration NMR signals limit the ability to resolve true w0 [11]. All of the above may result in an off-resonance response [10]. The off-resonance effects impact the amplitudes and phases of the receiving signal [10,11,12,18], leading to the prediction of “phantom” aquifers at depth, the underestimation of water content [10,11], and even unreliable estimation in the scenario where frequency offsets are larger than 5 Hz under the excitation of a standard 40 ms pulse [10]. Unfortunately, characterizing the spatial distribution of the Larmor frequency with accuracy is currently infeasible in surface and underground MRS. Thus, an excitation method that compensates for the frequency offsets and inversion methodology considering the varying geomagnetic field is required. Denys Grombacher et al. [19] compensated for the undesired offsets between the assumed and true Larmor frequencies by means of the frequency cycling method. Legchenko et al. [12] showed that the inversion of MRS data can be improved by taking into account variations in the Earth’s magnetic field (GMF). Grunewald et al. [20] introduced an adiabatic pulse to actually increase the signal amplitude of surface NMR. In addition, the enhancement of signal amplitudes is still required for UMRS applications. Otherwise, the signal-to-noise (S/N) ratio may be too low to decouple the UMRS responses from environmental noises.
The motivation of this paper is to develop an excitation method that overcomes off-resonance effects and provides signal enhancement for UMRS applications. We present a multi-off-resonance excitation method using a broadband pulse to mitigate the off-resonance effects. The excitation pulse we proposed can provide signal enhancement by coupling a series of off-resonance excitation. The spectral peaks in a broad bandwidth can adapt variations in Larmor frequency in degrees of large scale. This method is motivated by an off-resonance excitation method used in surface NMR, which can provide larger signal amplitudes [10] and improved spatial resolution of subsurface water content [14]. Our method is to provide signal enhancement using a broadband pulse producing several off-resonance responses that are coupled in the receiving channel. We present synthetic experiments for illustration and discussion about the feasibility and implementation of this method.
2. Background
2.1. UMRS Forward Modeling Considering Off-Resonance Effects
Hydrogen nuclei in bulk water undergo Larmor precession when immersed in geomagnetic field B0. Its angular frequency is |w0| = gp|B0| = 2pf0 where f0 denotes the Larmor frequency and gp is the gyromagnetic ratio for hydrogen protons. The UMRS pulses an oscillatory current in the transmitting coil installed on the tunnel face to generate a monochromatic field BT, termed the excitation field. The excitation frequency is fT = wT/2p, where wT is the angular frequency of BT. The time-dependent variation in net magnetization M under the interaction of the geomagnetic field B0 and the excitation field BT can be described by the Bloch equation [21]
where the Beff is given by [22]
which describes the effective field in a rotating frame that rotates at the excitation frequency wT. The orientation of the x- and z-axes are perpendicular and parallel to the direction of B0, respectively. Once the resonance condition is satisfied, the effective field becomes the excitation field itself. In practice, however, the effective field always has a z-axis component accounting for the magnitude of (w0 − wT)/gp because of the undesired frequency offset Dwud. During the excitation pulse, the nutation frequency of the magnetization M is given by the following [23]:
where Dw = w0 − wT is the offset of the local Larmor frequency from the excitation frequency. Following the excitation pulse of duration tp, and neglecting the relaxation during pulse (RDP) [24], the transverse magnetization is given by the following [11]:
The effective flip angle qeff is given by
and the tilt angle a illustrates the orientation of Beff in the rotating frame, according to [25]
The components my and mx are called in-phase and out-of-phase components, which are treated as the real and quadrature (imaginary) components of the UMRS response, respectively.
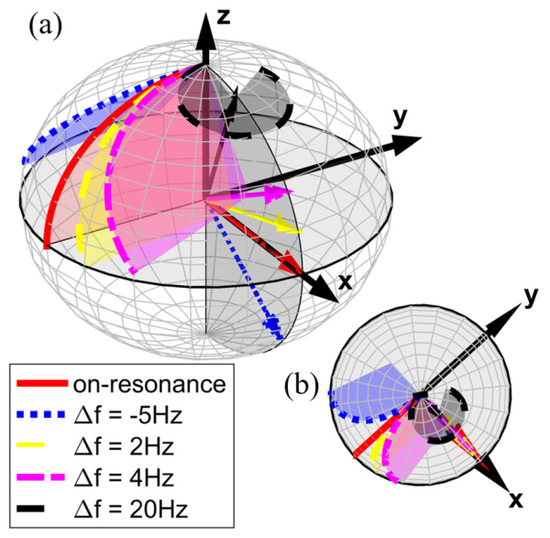
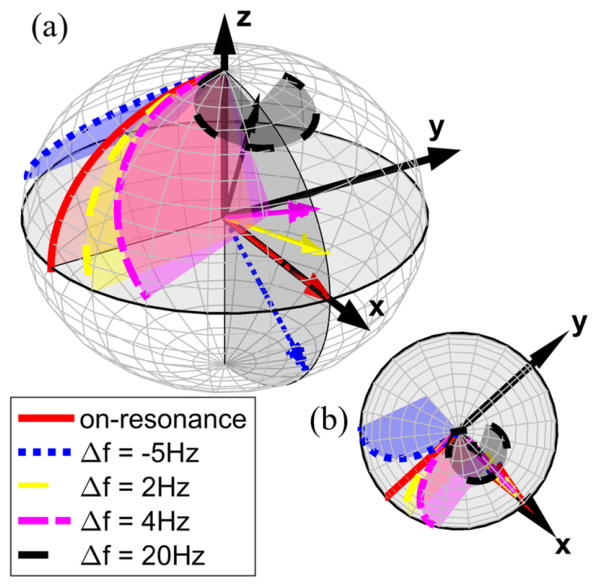
Figure 1 shows the trajectories of the magnetization vector in a rotating frame during the excitation pulse with different frequency offsets. The trajectories are solved analytically according to the general spin dynamics in the absence of diffusion and relaxation [23]. The frequency of this rotating frame is w0. The red solid line is the trajectory of the on-resonance condition, while the other dashed lines are the trajectories under off-resonance excitation. The signs of the z-components of Beff and mx alternate according to the sign of Dw in Equation (2), a phenomenon illustrated by the orientation variation in Beff in Figure 1. The transverse components of magnetization attenuate with an increasing frequency offset between the excitation frequency and true Larmor frequency. As such, the off-resonance effects impact the amplitude and phase of the UMRS response by means of varying the transverse magnetization vectors.
Figure 1.
Magnetization vector trajectories in a rotating frame under various frequency offsets. (a) Perspective view in a rotating frame during excitation; (b) plan view of (a).
Therefore, the kernel function of UMRS response, considering off-resonance effects but neglecting the RDP (justified in Section 3.3), is modified as follows
where q is the excitation pulse moment, I0 is the current amplitude of excitation pulse, and r(r) is the underground distribution of conductivity. The term zT,R is the signal phase corresponding to the transmitter and receiver loop geometry (Weichman et al., 2000 [3]). In addition, the transverse magnetization m⊥ and item are both complex numbers, which also determine the signal phase. The item is the components of BT that are orthogonal to the geomagnetic field B0, which is composed of corotating and counterrotating components [3]. In MRS, only the corotating component contributes to the response signal; the neglect of the counterrotating component will not produce an error. Thus, the effective tipping angle qeff is modified as follows
The tilt angle a is given by
where the orthogonal field is produced by two coordinated rotations according to Lin et al. [11].
where , , and are the rotation matrices. In this paper, we consider the MRS signals that follow the mono-exponential relaxation. Therefore, the initial amplitude of UMRS signals can be given by the following [3,26]:
The initial amplitudes are complex numbers, determined by the water content n(r) and the kernel function. Under off-resonance excitation, the phases of UMRS responses result from the loop geometry, the frequency offsets, and the conductivity of aquifers and surrounding rocks. As demonstrated in Equations (4) and (5), the impact of off-resonance effects on UMRS responses is dictated by both frequency offsets and the pulse duration tp. This functional dependence aligns with observations reported in surface NMR scenarios. For surface NMR with a standard 40 ms pulse, the estimation of the water contents is reliable when frequency offsets are smaller than 5 Hz, whereas in the situation of strong pulse moments or the presence of shallow water, the resultant out-of-phase magnetization components must be considered for practically any frequency offset [11]. In practice, the water content estimation receives the most significant impact in the presence of off-resonance excitation, whereas the relaxation time profiles are impacted to a lesser degree [19]. In addition, a further complication is the fact that the sizes transmitting and receiver loops are limited by the tunnel dimensions in the underground applications [15] and the UMRS response might be smaller than the surface condition. Under off-resonance excitation, the resulting low signal-to-noise ratio (SNR) can render the received signals ineffective for advanced geological prospecting.
2.2. Sensitivity of UMRS Response to Off-Resonance Effects
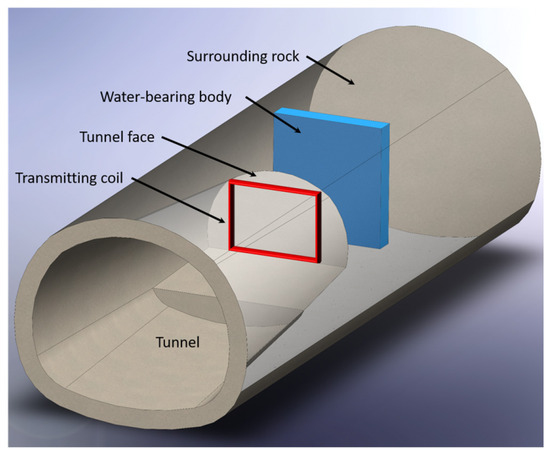
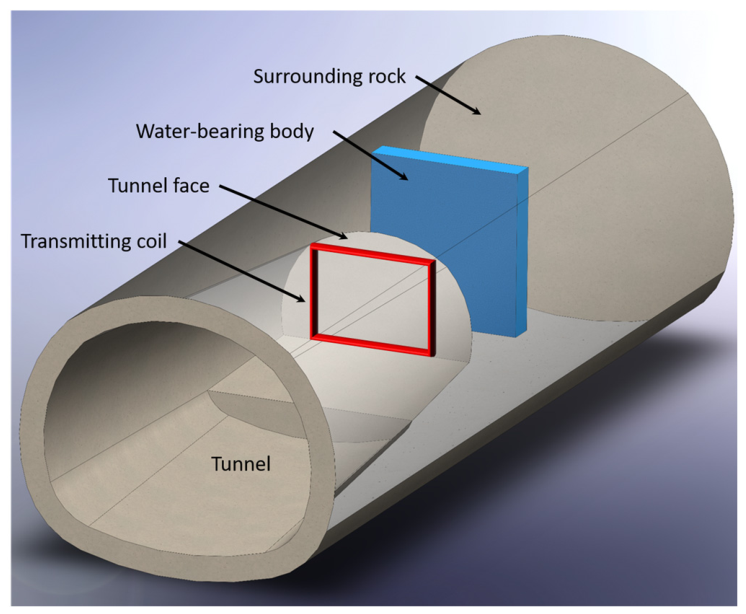
It is demonstrated in surface NMR that the off-resonance effects can cause the underestimation of water content profiles [10,14]. We next illustrate how the off-resonance effects impact the MRS response in the underground condition. Figure 2 shows the schematic of the UMRS modeling. In this paper, the transmitting coil we stimulated is a square loop installed on the tunnel face. The excitation field BT is stimulated by means of vector finite element methods (FEM). We assume that the distribution of pore sizes is homogeneous in the adverse geological bodies and the surrounding rocks. Thus, the response signal will follow the mono-exponential relaxation. Following Equation (7), we neglect the effect of RDP.
Figure 2.
Schematic illustration of UMRS implementation and water-bearing body detection in a tunnel.
To illustrate the impact of frequency offset and pulse duration on UMRS responses, a synthetic model was stimulated under two different excitation pulses [27]. The scale of the transmitting coil is 7 m × 7 m. The resistivity of the surrounding rocks is 500 W∙m, the water-bearing body resistivity is 50 W∙m, and the tunnel cavity resistivity is 108 W∙m. The tunnel section is 12 m × 8 m. The 12 m × 8 m tunnel section modeled in this study is representative of large-span transportation tunnels. Driven by a growing demand for underground space and advances in tunneling technology, the construction of super-large cross-section tunnels has become increasingly prevalent [28,29]. The size of the water-bearing body is 36 m × 36 m × 5 m, and its front face is 15 m from the tunnel face. This uniform layer represents a simplified configuration adopted for the purpose of proof-of-concept validation. The water content water-bearing body is set to be 80%. The selection of the 7 m × 7 m loop dimension is based on the following engineering considerations. First, tunnel geometry imposes a hard constraint on the deployable coil size; within the 12 m × 8 m tunnel cross-section, a 7 m × 7 m loop approaches the practical upper limit for convenient deployment while maximizing the coil area [30]. Second, the depth of investigation in MRS scales approximately with the coil dimension, and a 7 m loop provides a detection range of approximately 15–30 m, which meets the typical requirements for tunnel advance probing [31]. Third, this dimension is comparable to coil sizes validated in established UMRS studies [32].
We assume that the local Larmor frequency is 2500 Hz, the geomagnetic inclination and declination are 50° and −6°, and the UMRS responses are excited, respectively, using standard 40 ms pulses and 60 ms pulses. Figure 3 shows the response profile of the initial amplitudes corresponding to frequency offsets ranging from −20 Hz to 20 Hz. The off-resonance effects impact the response components in different ways. The on-resonance condition results in the maximal and the minimal value of the real and quadrature components, respectively. As the absolute values of Dw begin to increase, the value of real components (shown in Figure 3a,c) decrease to a minimal value, while the quadrature components (shown in Figure 3b,d) receive the maximal value at a certain frequency offset. In addition, off-resonance effects produce larger absolute response amplitudes (shown in Figure 3c,f) than the on-resonance condition, as long as a proper Dw is given. Thus off-resonance excitation can produce a stronger signal amplitude, which coincides with the surface NMR condition [10]. From Figure 3b,c, for the 40 ms pulse, the quadrature component and the absolute amplitude reach their respective maxima at a frequency offset of approximately ±10 Hz. This observation defines a signal enhancement window spanning from −10 Hz to +10 Hz, within which the off-resonance excitation yields a stronger signal than the on-resonance condition. This enhancement window serves as a key design constraint for the multi-off-resonance pulses developed in Chapter 3. In addition, given the same frequency offset, the longer pulse duration produces a more significant off-resonance effect by generating more significant value variation on both real and quadrature components. Thus, small frequency offset (less than 5 Hz) should also be considered practically under long pulse excitation [10].
Figure 3.
Initial amplitude response profiles as a function of frequency offset for different pulse durations. (a) Real component, 40 ms pulse; (b) quadrature component, 40 ms pulse; (c) absolute amplitude, 40 ms pulse; (d) real component, 60 ms pulse; (e) quadrature component, 60 ms pulse; and (f) absolute amplitude, 60 ms pulse.
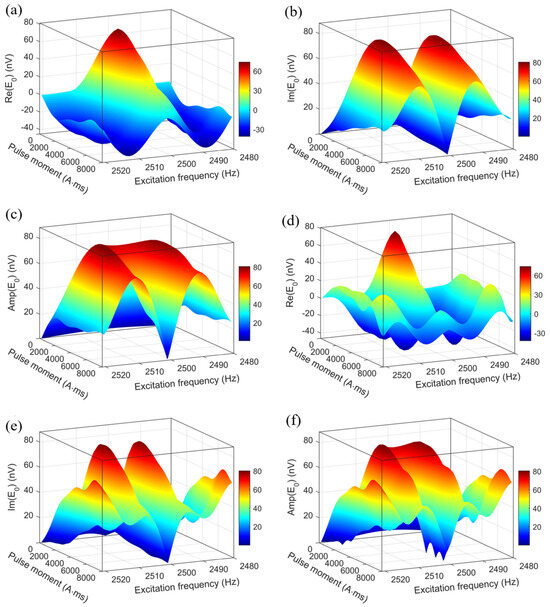
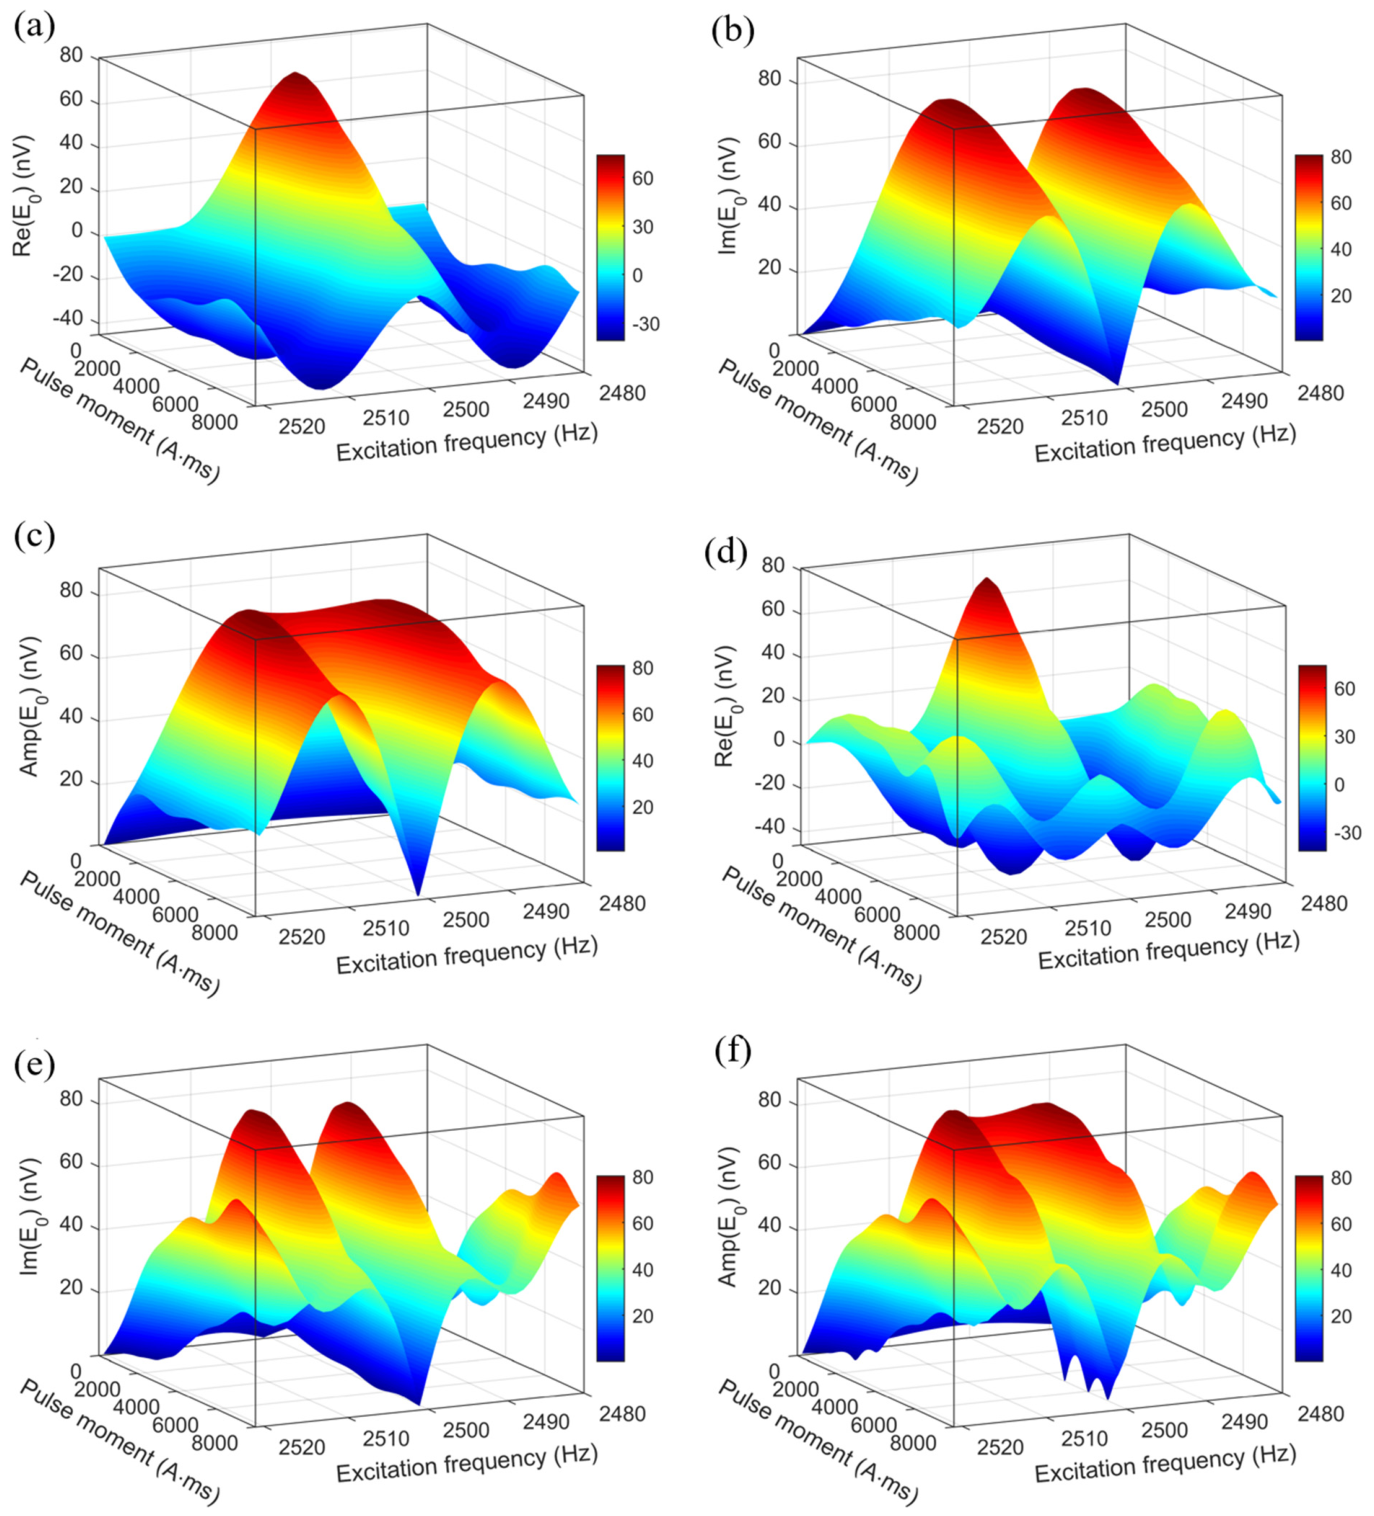
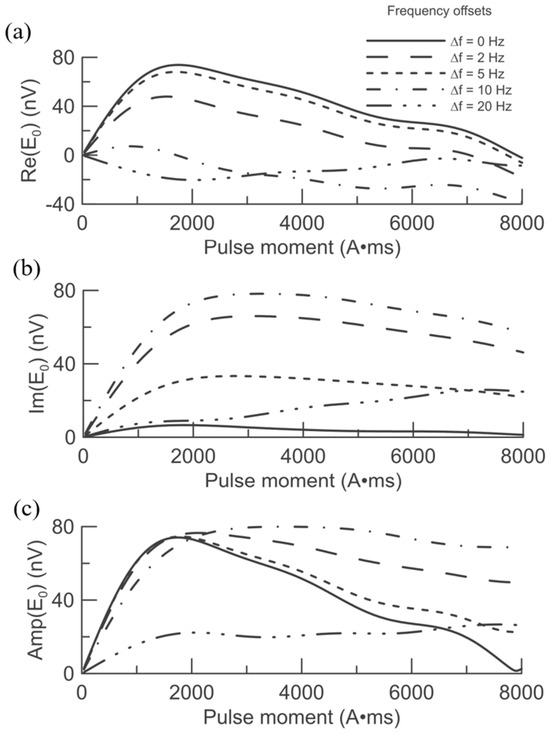
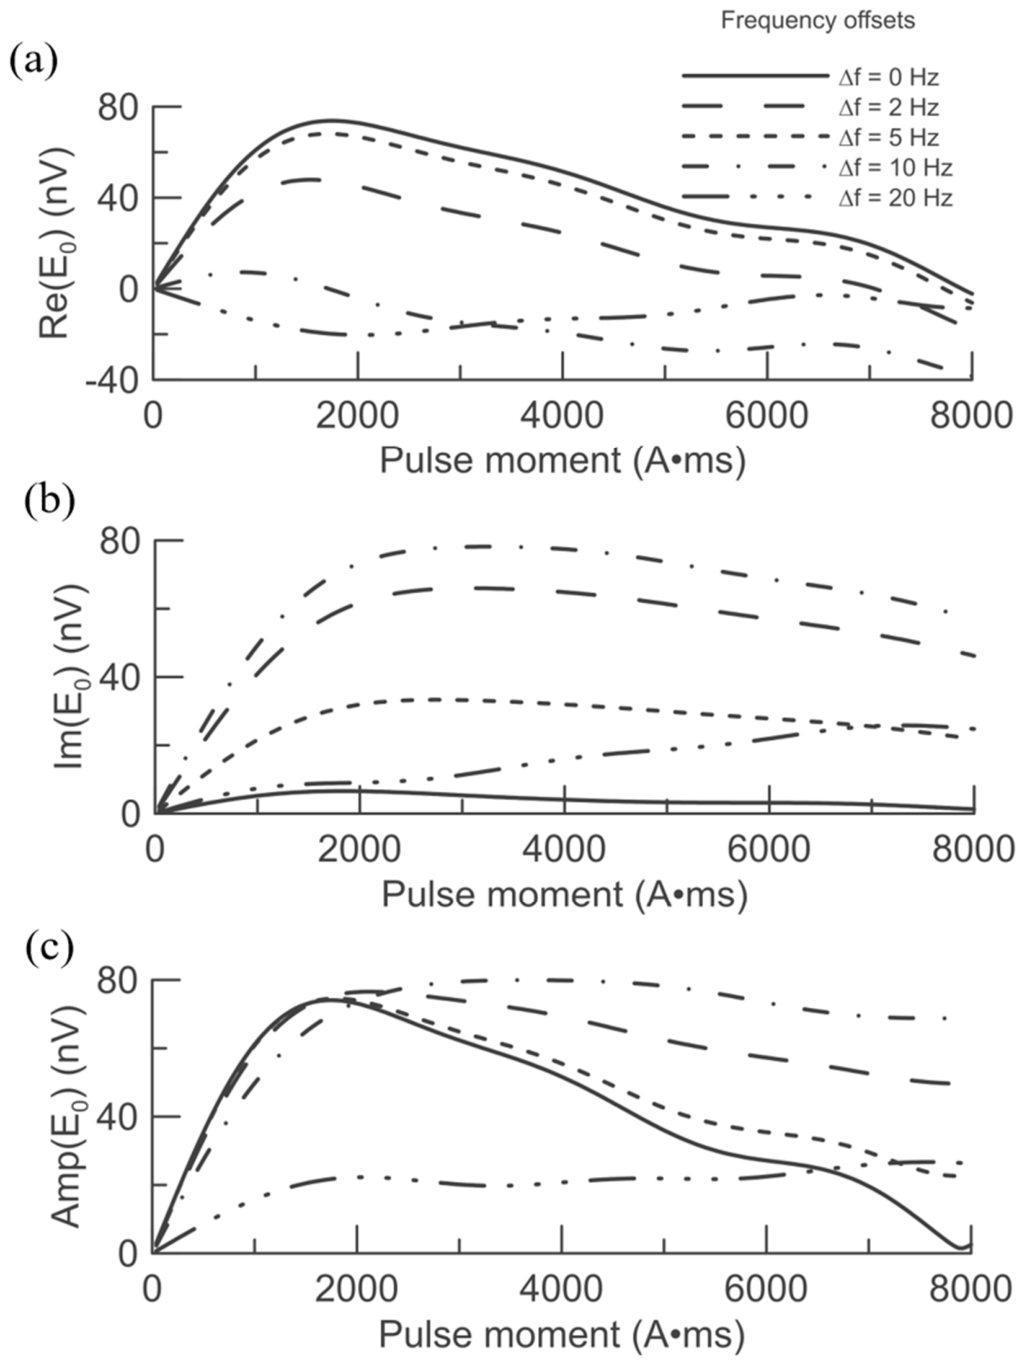
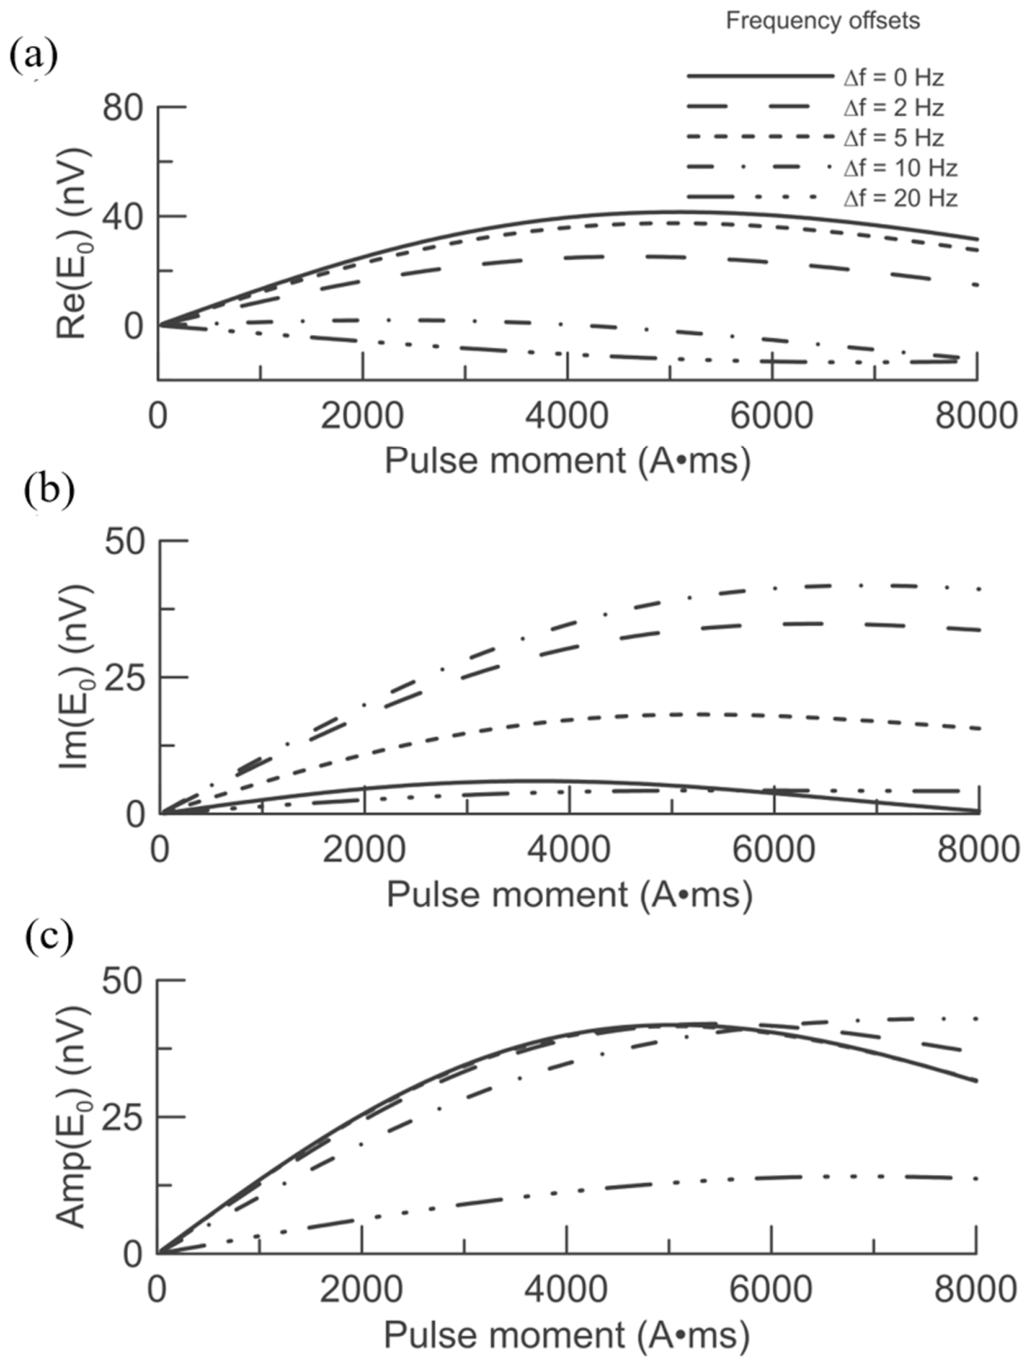
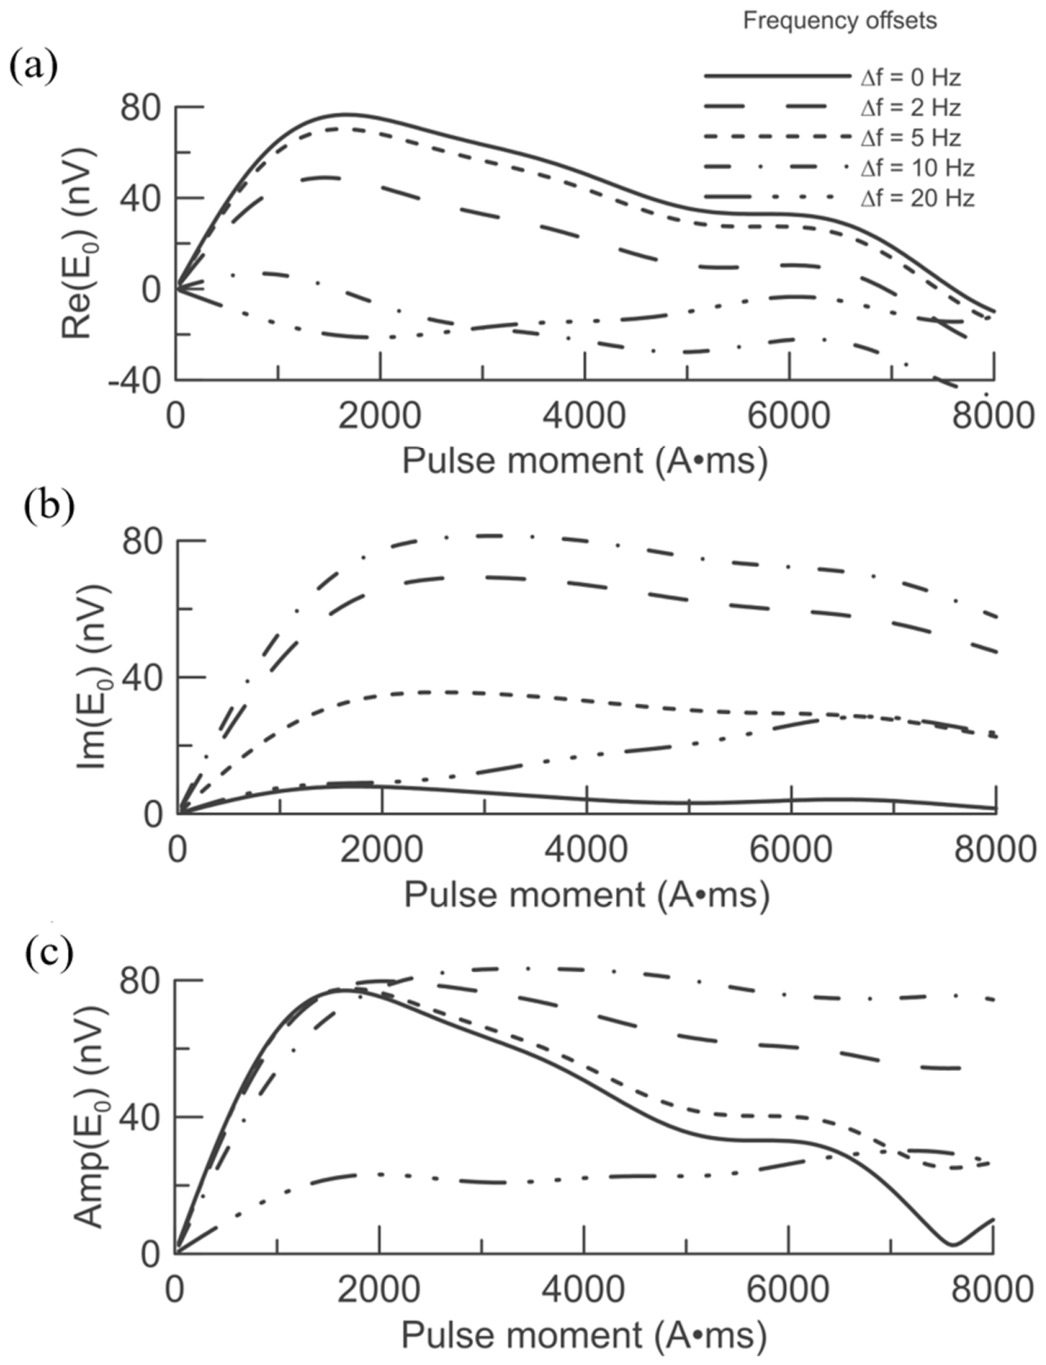
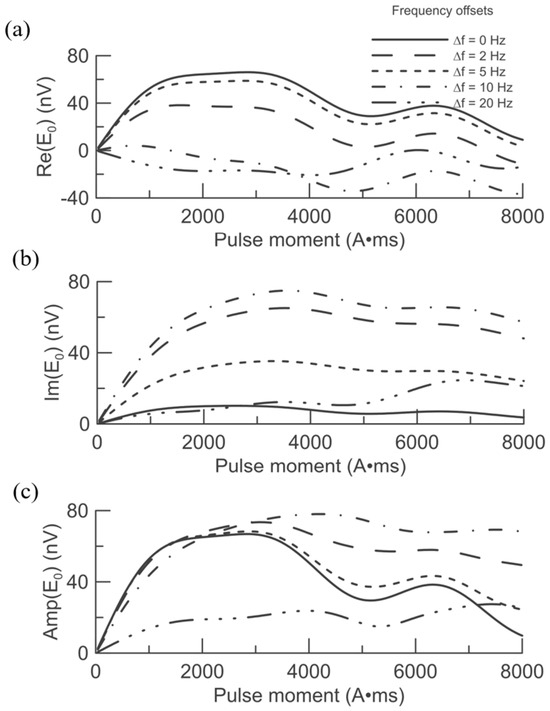
In the cases of surface NMR, the off-resonance effects produce a more significant impact on the presence of a shallow aquifer [10]. We illustrate the similar phenomenon in UMRS cases by showing two-forward modeling in Figure 4 and Figure 5. The parameters of the two models are the same except for the distance of the water-bearing body away from the tunnel face. The front face of the water-bearing body corresponding to Figure 4 is 15 m away from the tunnel face and the one corresponding to Figure 5 is 26 m away from the tunnel face. The remaining parameters are the same as those corresponding to Figure 3. The shallower water-bearing body exhibits a more pronounced reduction in real voltage compared with the deeper one. This reduction becomes particularly evident when the frequency offsets exceed 5 Hz. The response amplitudes of the shallower water-bearing body increase more significantly when pulsing strong excitation pulse moments.
Figure 4.
Sounding curves for the shallower water-bearing body (15 m): (a) real components, (b) quadrature components, and (c) total amplitudes.
Figure 5.
Sounding curves for the deeper water-bearing body (26 m): (a) real components, (b) quadrature components, and (c) total amplitudes.
Subsurface conductivity is also a factor impacting the signal phase and the reliability of the water content and porosity estimation [33,34,35]. This scenario is also considered in our UMRS models. Figure 6 and Figure 7 show the response, where the resistivities of the surrounding rocks are 1000 W∙m and 100 W∙m, respectively. The remaining parameters are the same as those used in Figure 4. Comparing the sounding curves in Figure 4, Figure 6 and Figure 7, we conclude that the rock conductivity impacts the UMRS voltages in the same way as the surface NMR condition. The response voltages in the conductive subsurface are smaller than those in the surrounding rocks with higher resistivity.
Figure 6.
Sounding curves in high-resistivity surrounding rock (1000 W∙m): (a) real components, (b) quadrature components, and (c) total amplitudes.
Figure 7.
Sounding curves in low-resistivity surrounding rock (100 W∙m): (a) real components, (b) quadrature components, and (c) total amplitudes.
3. The Multi-Off-Resonance Excitation Method Using Broadband Pulse
3.1. Transmitting a Pulse with Spectral Peaks in a Finite Bandwidth
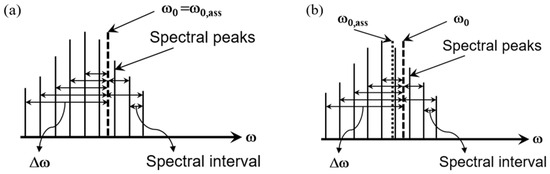
Figure 8 is the schematic of our motivation. An excitation pulse with several spectral peaks in a finite bandwidth is transmitted to produce multi-off-resonance excitation correspondingly. These spectral peaks can provide a series of off-resonance excitation according to the frequency offsets between the true Larmor frequency and their own frequencies, respectively. If the value of the local Larmor frequency equals one of the spectral peaks, the excitation pulse provides both the on-resonance and off-resonance excitation. The near-resonance excitation occurs as long as one of the spectral peaks approximately coincides with the local Larmor frequency. In the presence of an undesired frequency offset, the spectral peaks in a finite bandwidth can produce a series of off-resonance responses when the Larmor frequency lies between two spectral peaks of the excitation spectrum. To generate the pulse that we assumed, we proposed the excitation method as follows. The periodically bipolar square wave is used as a substitute for the sinusoid wave. The generation of the square wave can be achieved by power electronic components (like insulated gate bipolar transistor, IGBT).
Figure 8.
Conceptual mechanism of multi-off-resonance excitation for signal enhancement: (a) Larmor frequency coincides with a spectral peak and (b) Larmor frequency falls between two spectral peaks.
We assume the bipolar square wave s(wt) is
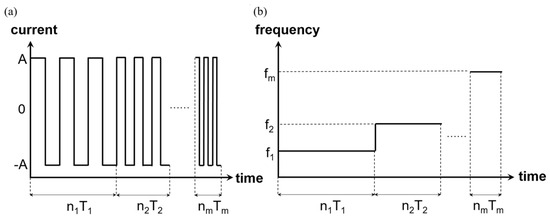
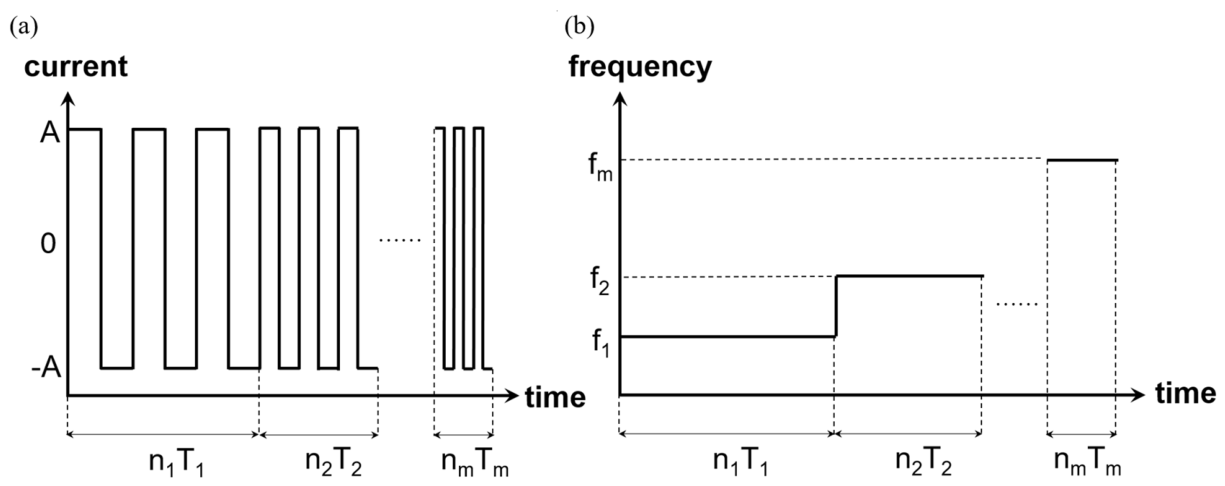
Then, the waveform of the new excitation pulse shown in Figure 9a is given by
where qm is the initial phase that aligns the pulse phase to be an integral multiple of 2p in the coming of the next pulse. The frequency variation shown in Figure 9b is
Figure 9.
Time-domain waveform and frequency–time relationship of the proposed pulse: (a) time-domain waveform; (b) frequency–time relationship.
The corresponding periods of f1, f2, f3, and fm are T1, T2, T3, and Tm. The numbers n1, n2, and nm are the cycle numbers of s1, s2, and sm. The period of the new excitation pulse is given by T = n1T1 + n2T2 + n3T3 + ∙∙∙ + nmTm. The number of transmitting frequencies m is expected to be odd. Then, the middle frequency of the m frequencies is set according to the assumed Larmor frequency w0,ass. Then, the rest of the frequencies are selected symmetrically on both sides of w0,ass. In our following illustration, the cycle numbers are set to be n1 = n2 = ∙∙∙ = nm = n, for convenience.
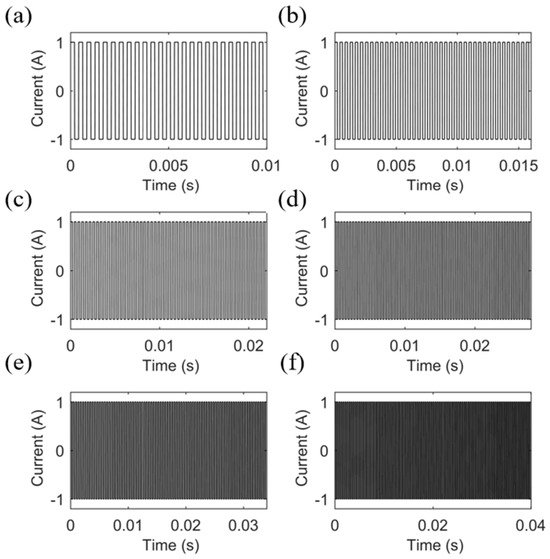
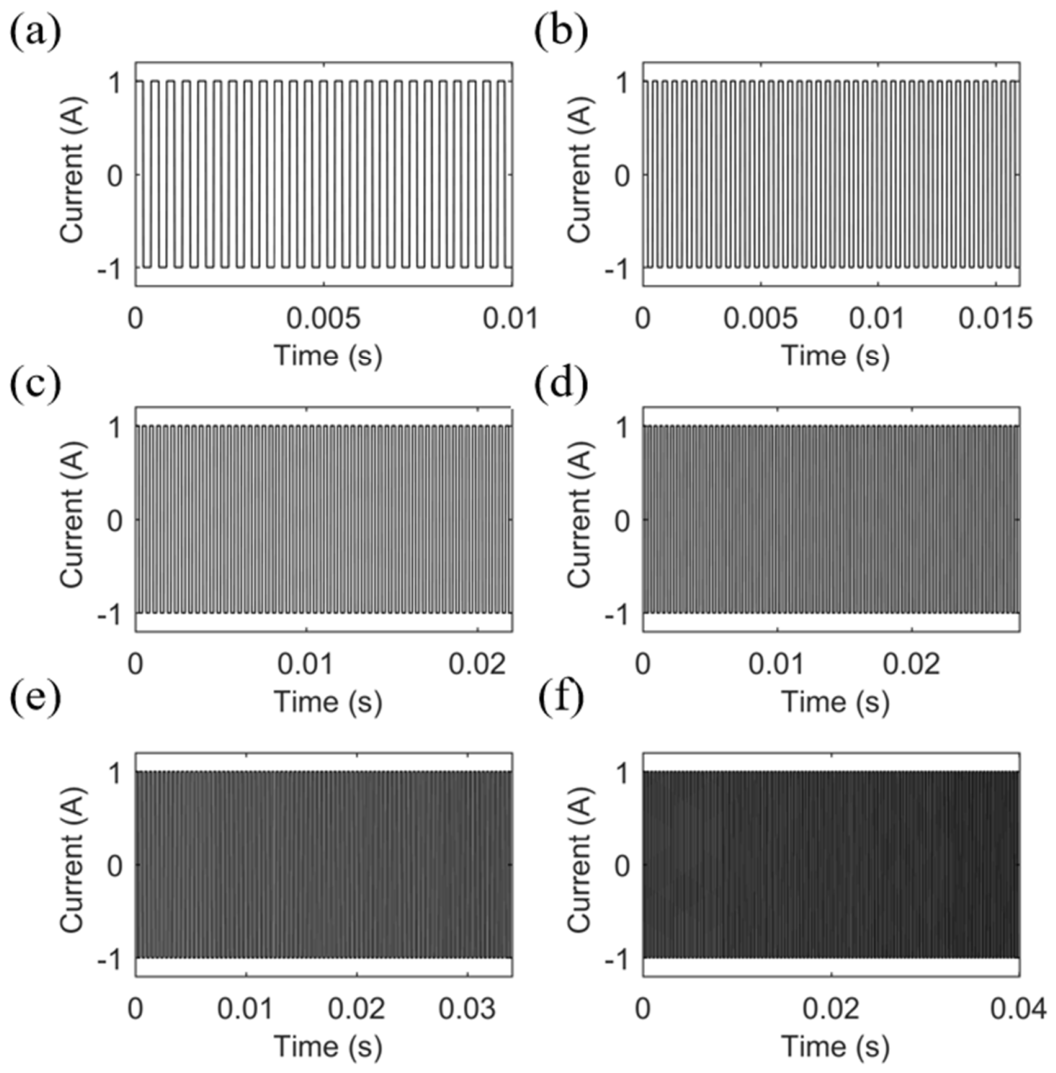
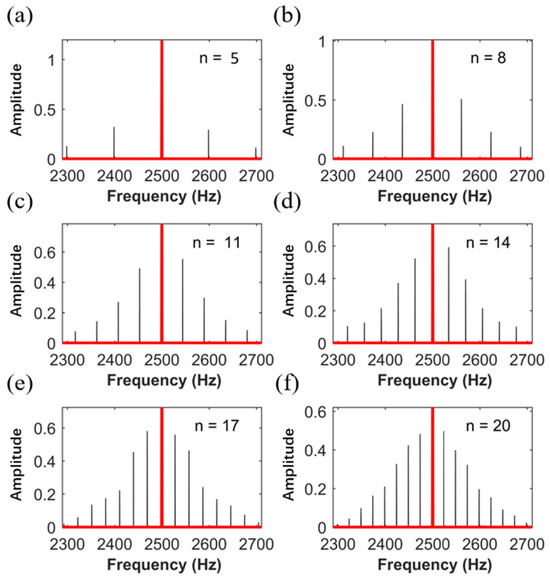
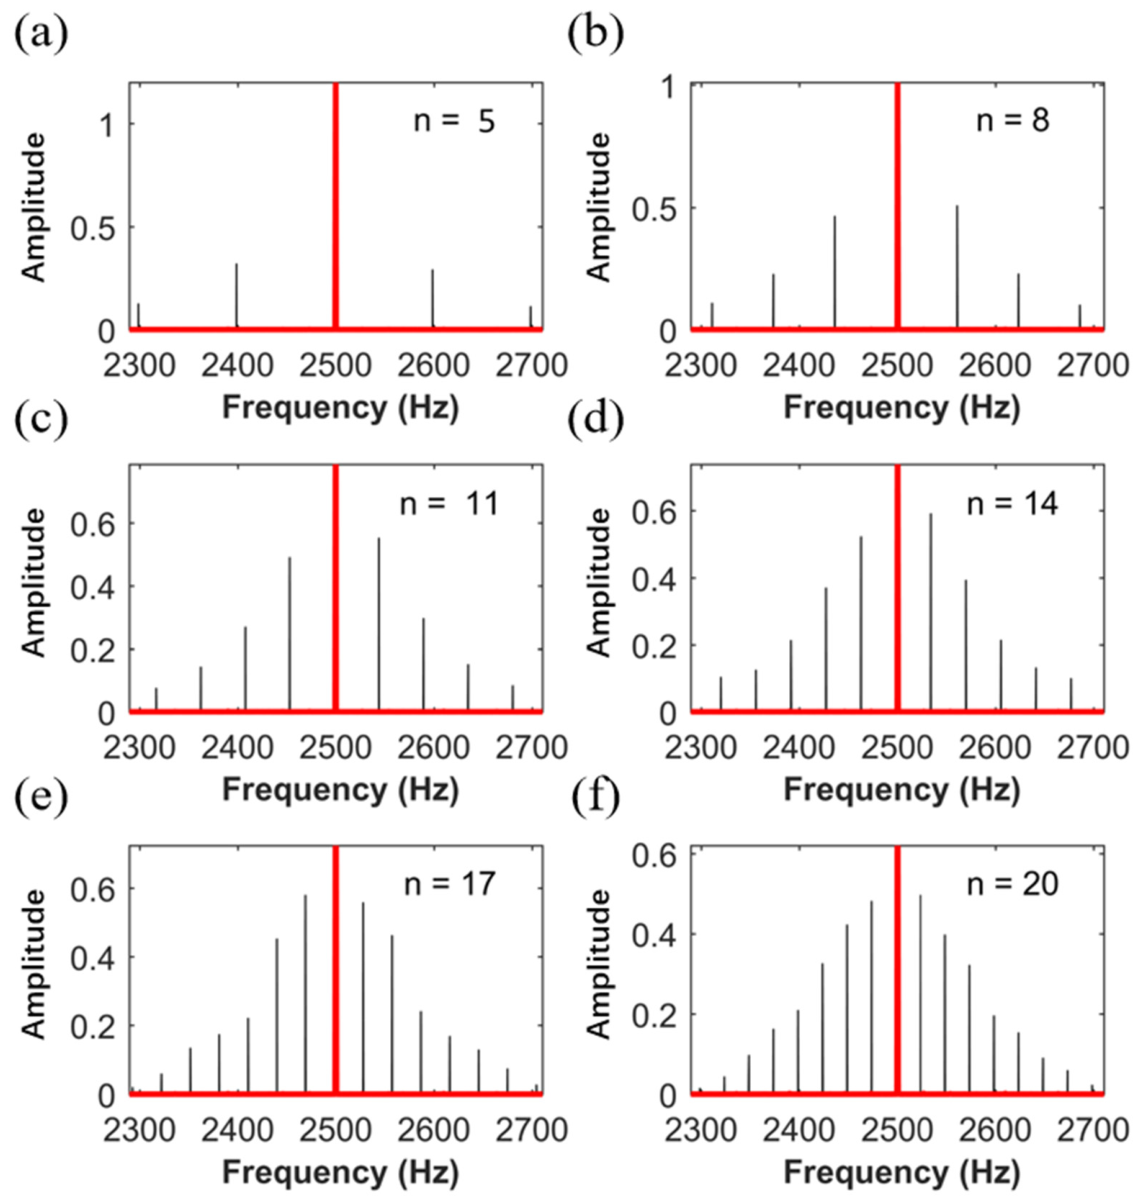
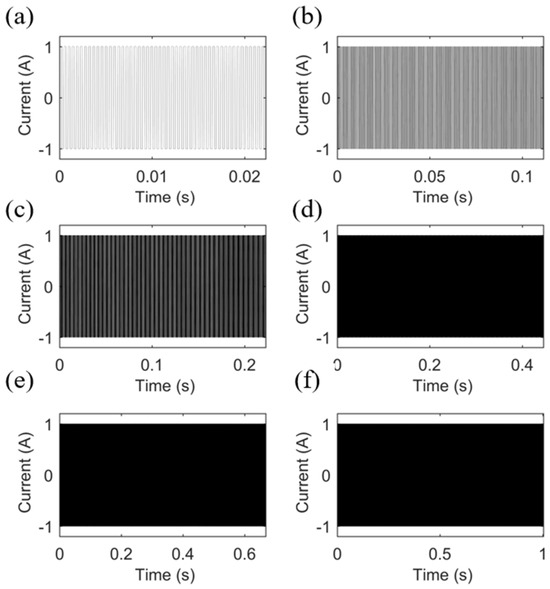
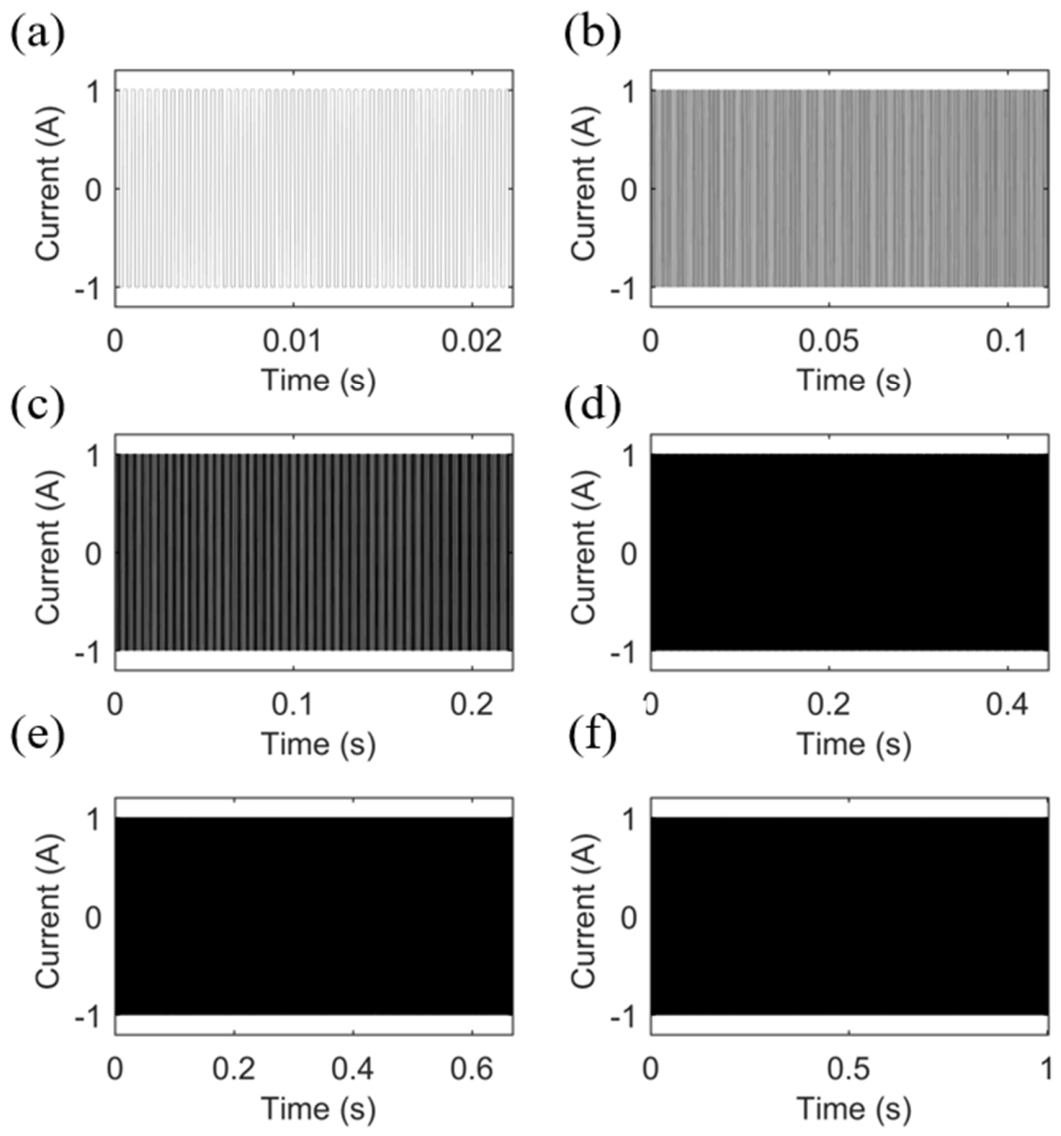
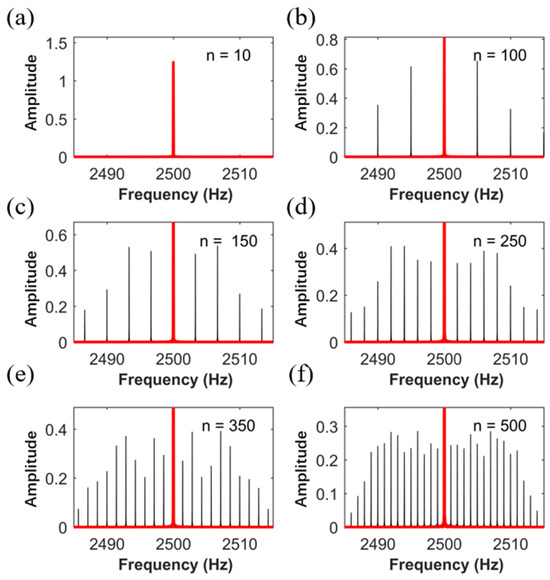
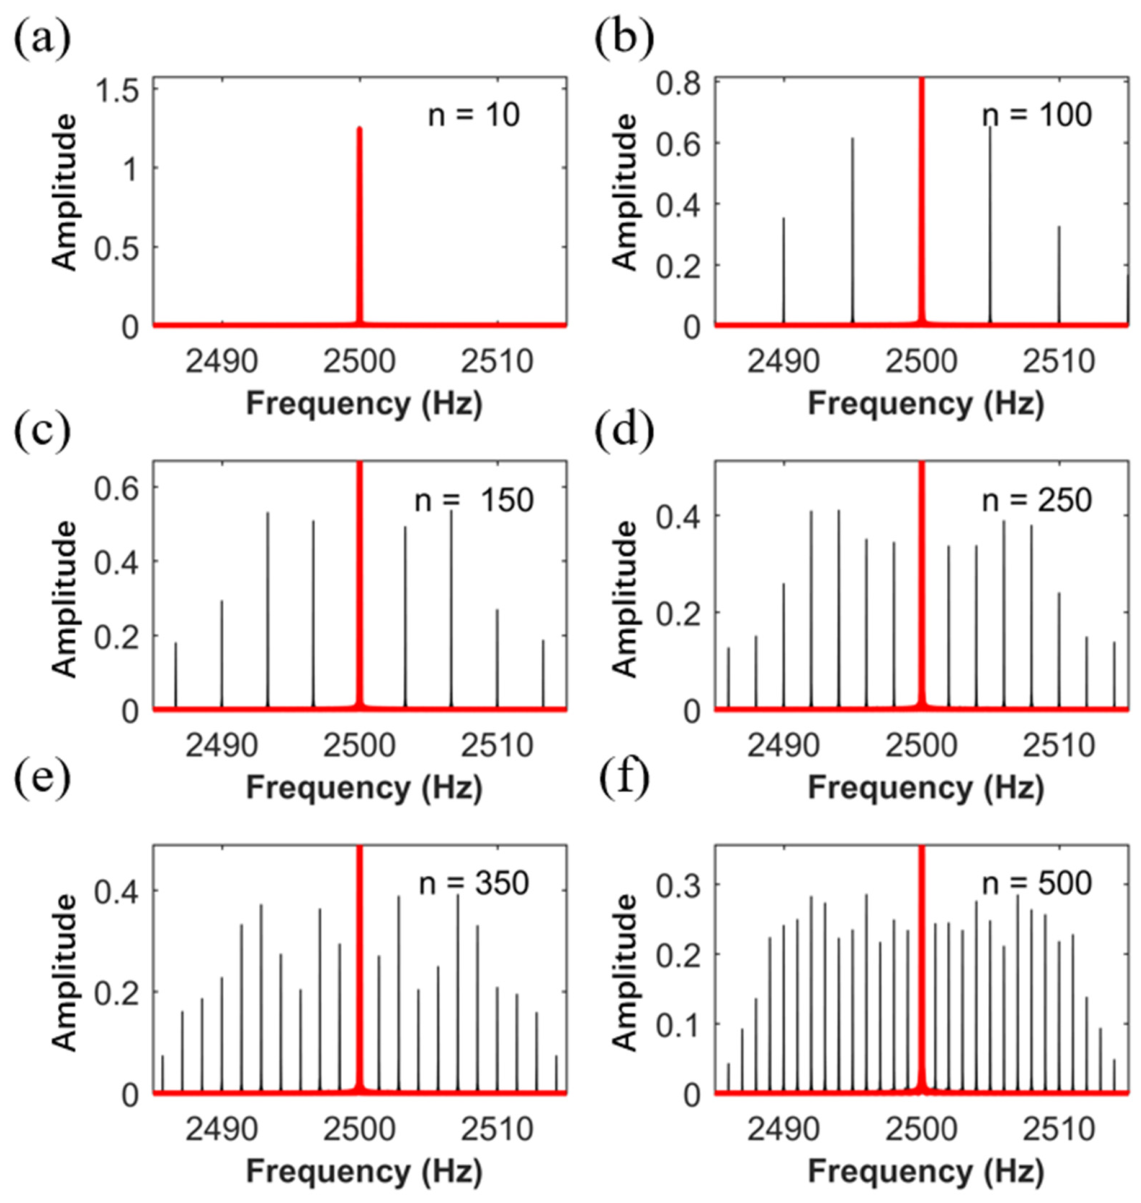
We next demonstrate the spectral properties of our new excitation pulse. According to the theory of harmonic analysis, the periodically bipolar square wave s(wt) contains only fundamental harmonic and higher harmonics in its frequency spectrum. The even harmonics are absent as long as the s(wt) is an odd function. We assume that the local Larmor frequency is 2500 Hz, and select four frequencies symmetrically with the interval of 30 Hz and 90 Hz. The waveforms and frequency spectra are shown in Figure 10 and Figure 11. The pulse durations we set are equal to the period T. As can be seen, the frequency spectra of the excitation pulse vary as the number of cycles n increases, which is shown in Figure 10 and Figure 11, respectively. The fundamental harmonic spectra in Figure 11 correspond to the waveforms in Figure 10, respectively. Given a proper cycle number, shown as Figure 11f, the spectral peaks of the transmitting spectrum spread in a finite band with normalized intervals. The observed spectral peaks are in the fundamental harmonic band. The red line illustrates where the assumed Larmor frequency is, and the black spectral peaks are the outcome of the excitation pulse. Our next illustration addresses this point. The spectral peaks at higher harmonics contribute less to off-resonance excitation. As a consequence, they can be neglected. Note that the spectral peaks in the middle of all this are quite close to the assumed Larmor frequency, which produces approximately on-resonance excitation in the absence of undesired frequency offset Dwud. Once the intervals of the transmitting frequencies decrease, the required cycle number n is expected (so does the pulse duration) to increase to spread the spectral peaks in a finite bandwidth. In addition, the intervals among the spectral peaks decrease as a consequence. Compared with Figure 10 and Figure 11, the scenario is shown in Figure 12 and Figure 13, where the transmitting intervals are 5 Hz.
Figure 10.
Time-domain waveforms of the excitation pulse with increasing number of cycles (n): (a) n = 5, (b) n = 8, (c) n = 11, (d) n = 14, (e) n = 17, and (f) n = 20.
Figure 11.
Fundamental harmonic frequency spectra corresponding to the waveforms in Figure 10: (a) n = 5, (b) n = 8, (c) n = 11, (d) n = 14, (e) n = 17, and (f) n = 20.
Figure 12.
Time-domain waveforms of the excitation pulse designed with narrow frequency intervals: (a) n = 10, (b) n = 100, (c) n = 150, (d) n = 250, (e) n = 350, and (f) n = 500.
Figure 13.
Frequency spectra of the excitation pulse corresponding to Figure 12: (a) n = 10, (b) n = 100, (c) n = 150, (d) n = 250, (e) n = 350, and (f) n = 500.
3.2. Multi-Off-Resonance Excitation Using Broadband Pulse
Off-resonance excitation can provide signal enhancement on the quadrature components and absolute magnitudes of the UMRS responses. Our goal is to take its advantage in pursuit of mitigating the impacts of undesired frequency offsets and improving received signal voltages. Equation (3) indicates that the nutation frequency during excitation is determined by the interaction of both geomagnetic (w0/gp) and excitation (wT/gp) fields. Thus, the spectral peaks of the excitation pulse can produce a superposed transverse magnetization torqued by the excitation field, which is given by
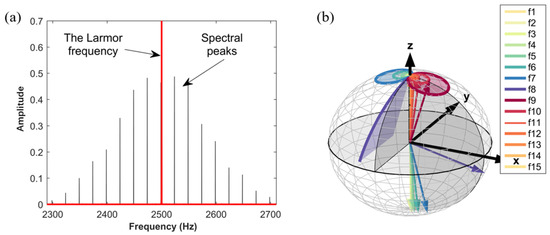
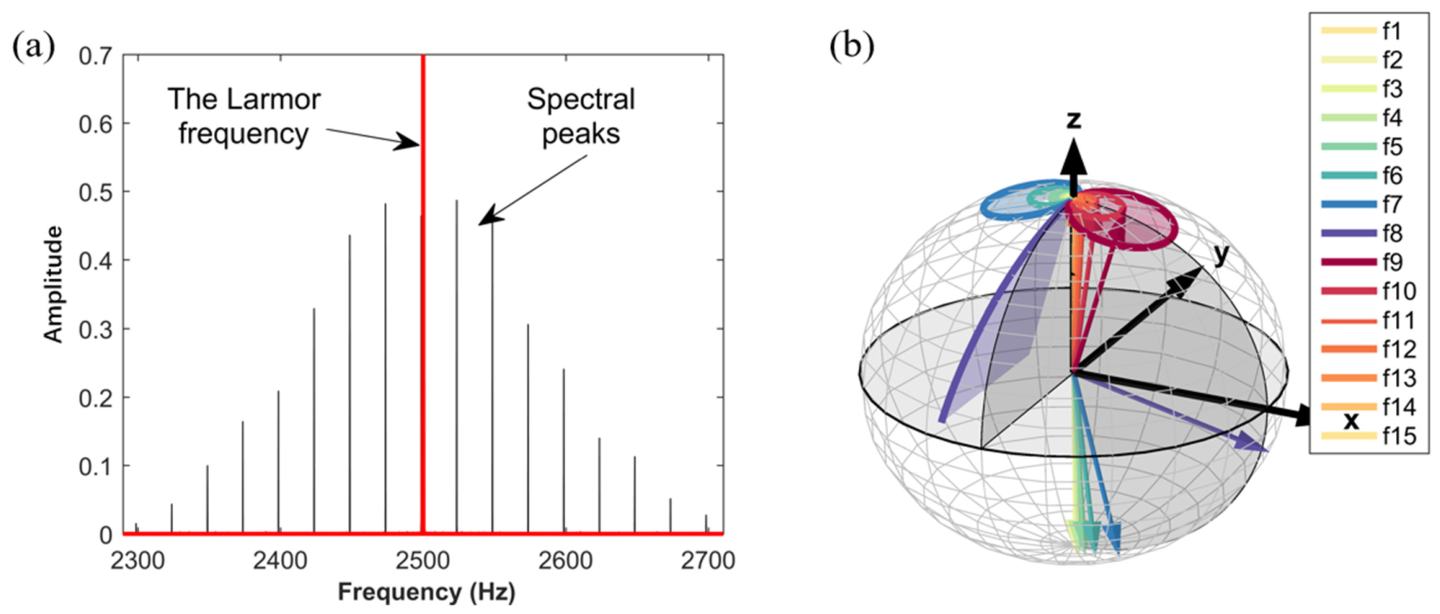
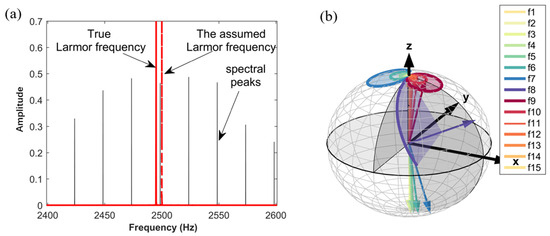
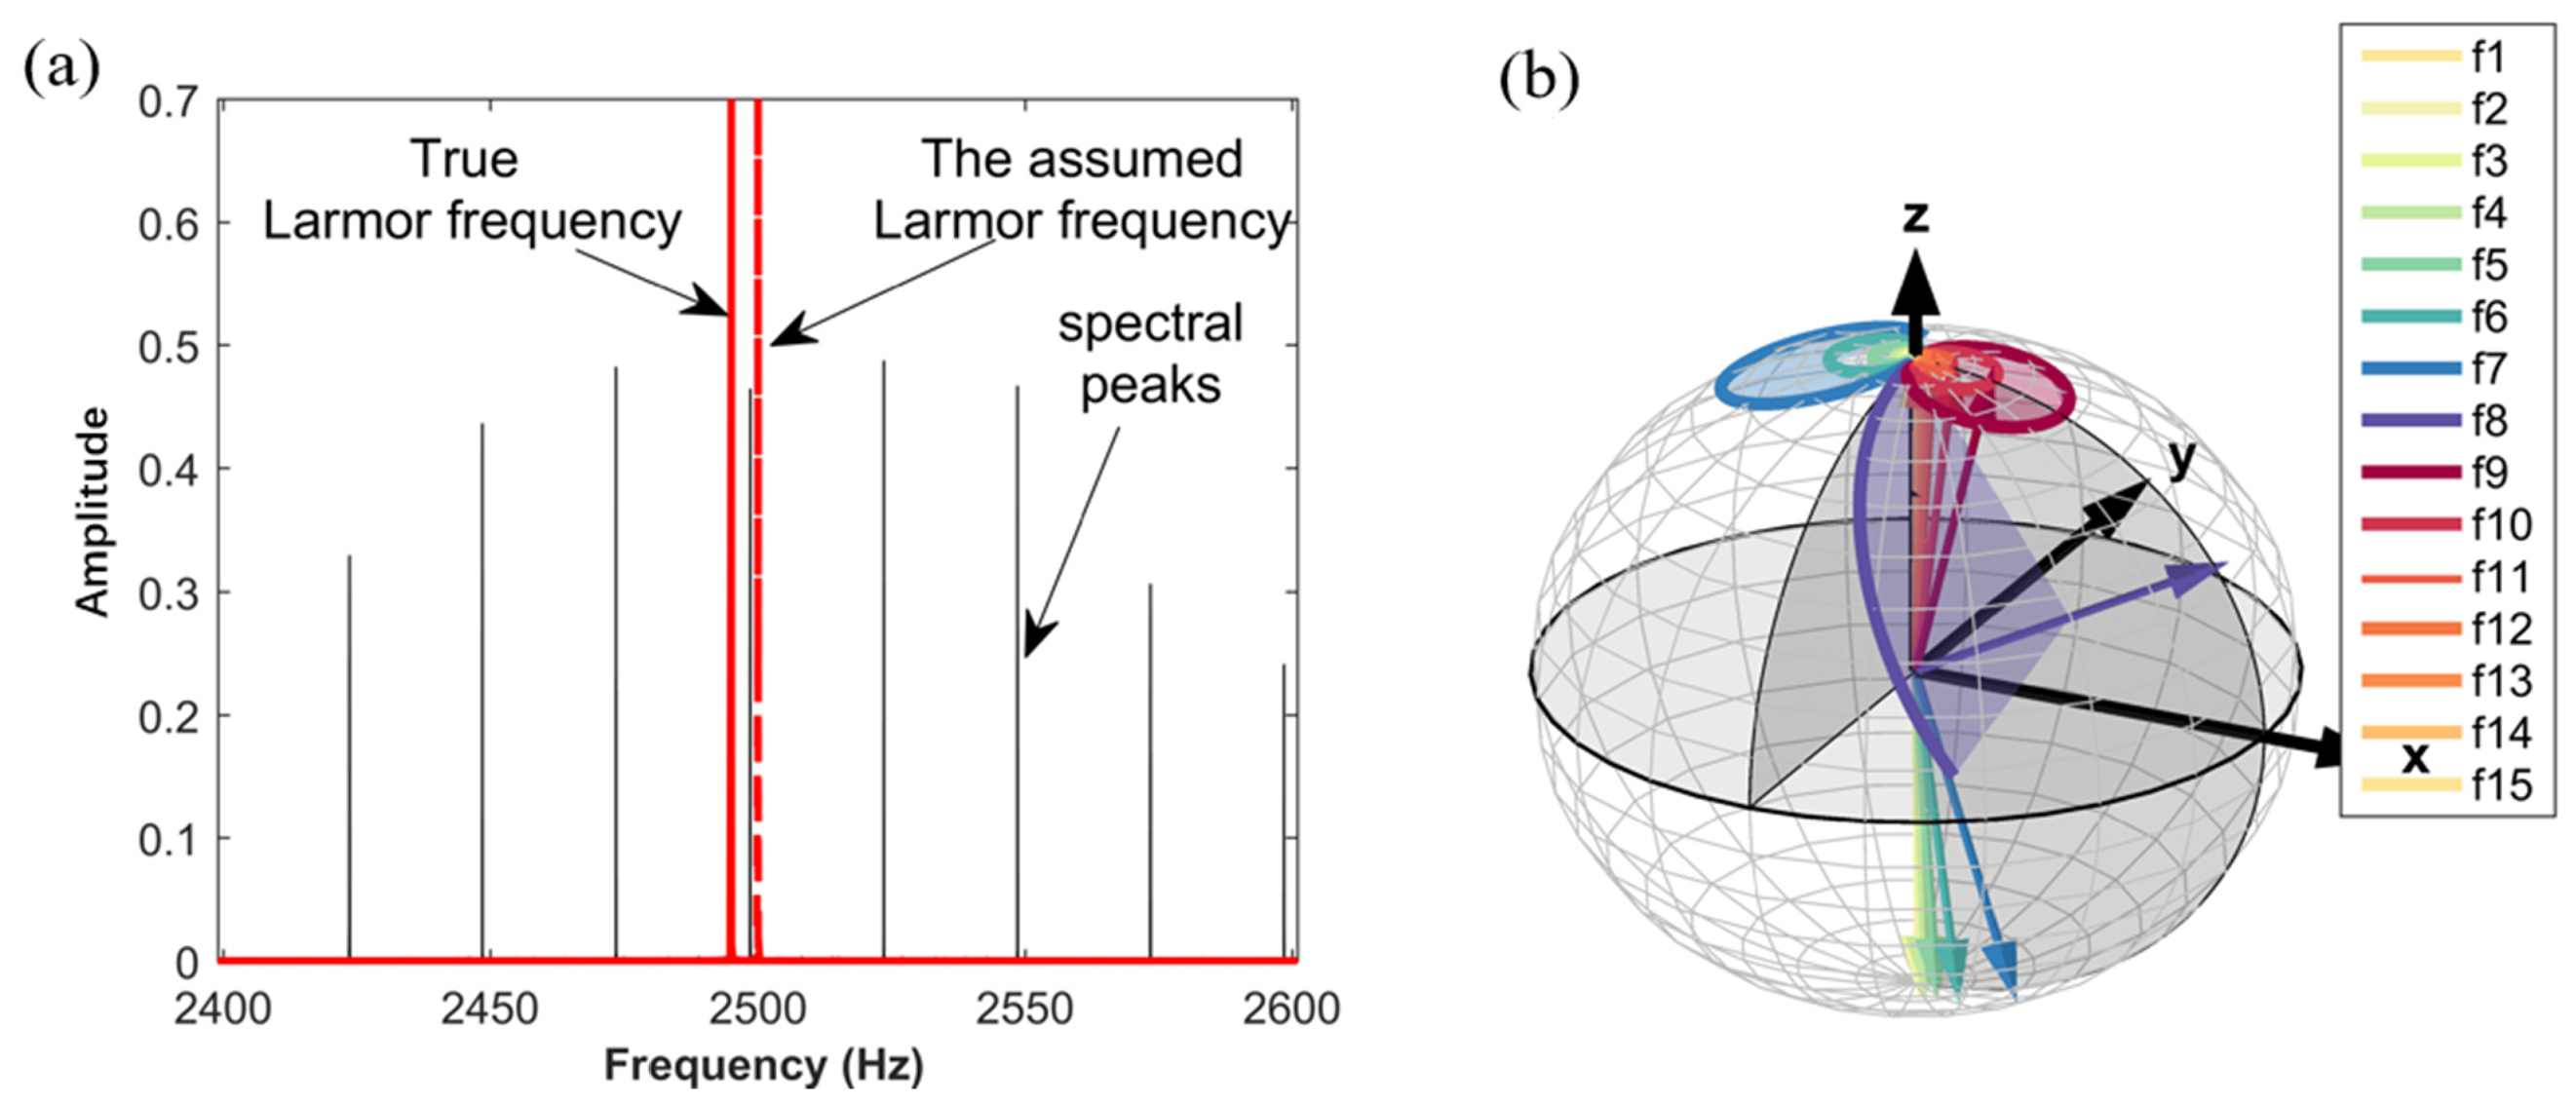
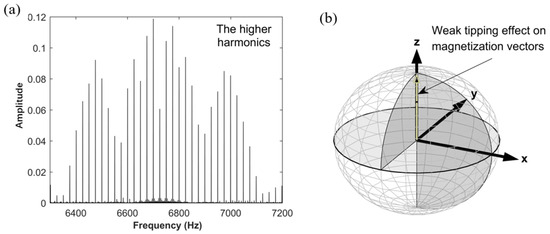
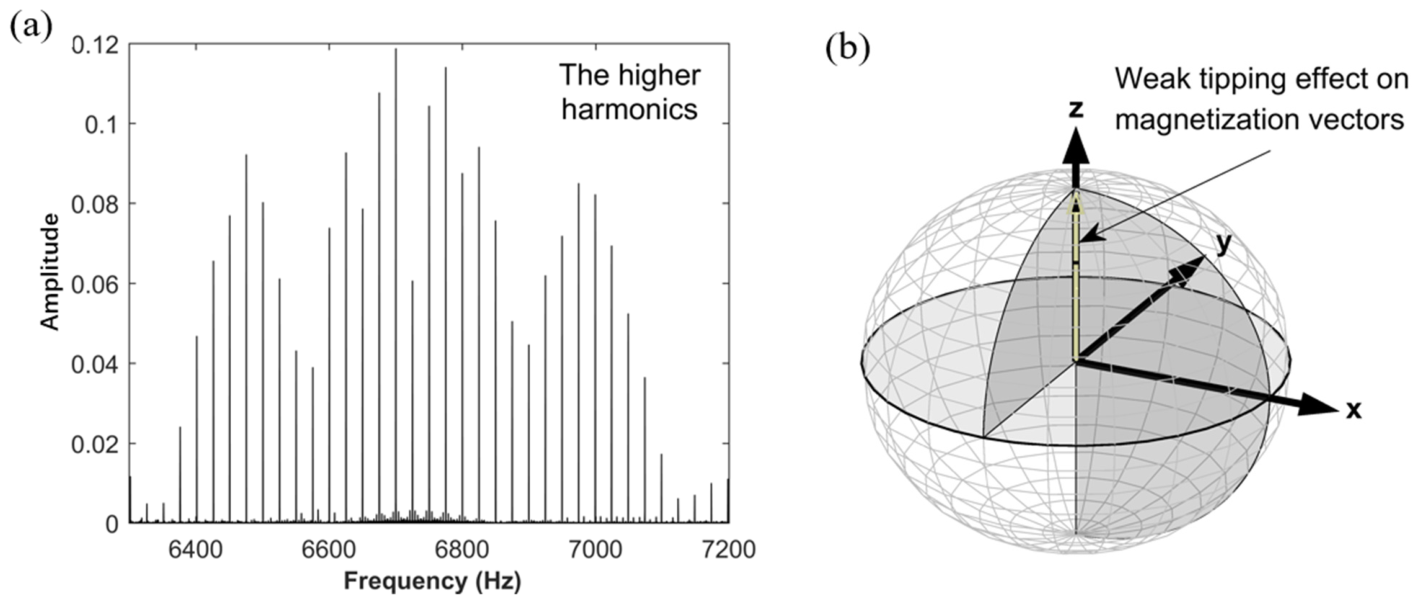
where k is the number of spectral peaks in the excitation spectrum. Following the termination of the excitation pulse, the precession frequency of the transverse magnetization is equal to the precession frequency of the individual spins, i.e., the nuclear Larmor frequency (Levitt, 2008 [22]). In the absence of the undesired frequency offset, Figure 14b shows the trajectories of magnetization vectors torqued respectively by the spectral peaks in Figure 14a. The transmitting frequencies and cycle number are the same as those in Figure 11f. The amplitudes of the spectral peaks are taken into consideration during stimulation. The true Larmor frequency we assumed is 2500 Hz, which coincides with one of the transmitting frequencies, f3. Figure 14b shows the scenario where the true Larmor frequency is equal to the one we assumed. The trajectories in the occurrence of 5 Hz undesired frequency offset are illustrated in Figure 15. As can be seen, the spectral peak f8 in Figure 14b and Figure 15b produces the largest effective tipping angle on transverse magnetization by satisfying the “near-resonance” condition in both the presence and absence of the undesired offset. The remaining spectral peaks produce a significant off-resonance response, which contributes to the final response following Equation (16). Concerning the higher harmonics of the new excitation pulse, the spectral amplitudes are lower than 0.12 (shown in Figure 16a), and the tipping effects can be neglected (shown in Figure 16b), considering their large frequency offsets and low spectral amplitudes.
Figure 14.
Magnetization trajectories under multi-off-resonance excitation without frequency offset. (a) Distribution of spectral peaks and (b) corresponding magnetization vector evolution.
Figure 15.
Magnetization trajectories under multi-off-resonance excitation with a 5 Hz offset. (a) Frequency spectrum and (b) resultant magnetization trajectories.
Figure 16.
Tipping effects of higher harmonics on magnetization vectors. (a) Spectra of higher-order harmonics and (b) weak tipping effect on magnetization vectors.
This observation can be understood quantitatively through the excitation dynamics. For each spectral component, its contribution to the excitation field is proportional to its normalized spectral amplitude . For higher harmonics, (Figure 16a), while the frequency offset is typically two orders of magnitude larger than that of the target peaks. Under such extreme off-resonance conditions, the large ratio of in Equation (6) causes the effective magnetic field to orient predominantly along the longitudinal direction. As described by the projection relationships in Equation (4), this orientation limits the projection of the magnetization onto the transverse plane, effectively suppressing the generation of transverse components and (Figure 16b). Consequently, the net contribution of these harmonics in Equation (16) remains negligible owing to the synergistic effect of the low excitation energy and unfavorable effective field orientation.
3.3. Selecting Optimal Intervals of Transmitting Frequencies
To select the optimal intervals of transmission frequency, the trade-off among three factors should be taken into account. Firstly, the amplitudes of spectral peaks should be large enough to ensure sufficient tipping torque on magnetization vectors. Secondly, maximizing the normalization of spectral amplitudes and narrowing the intervals among spectral peaks should both be considered. Spectral peaks with narrower intervals are more likely to satisfy a near-resonance condition when an undesired frequency offset is presented and the near-resonance condition provides increased quadrature and absolute sounding curves when the frequency offset is in the range of −10 Hz to 10 Hz for a 40 ms pulse duration (shown in Figure 3b,c). This ±10 Hz range indicates an enhancement window for off-resonance excitation. To increase the likelihood that at least one spectral peak falls within this window, the interval between adjacent peaks should generally not exceed this width. Meanwhile, field observations suggest that background Larmor frequency offsets can reach up to approximately ±5 Hz [10,11], indicating that the spectral peak spacing should be greater than about 5 Hz. Finally, the pulse duration plays an important role in determining the extent of off-resonance excitation [10,19], which should be seriously concerned. The significant influence of RDP on surface NMR data for pulse durations greater than 20% of the T2* relaxation times [24] is also valid for UMRS applications.
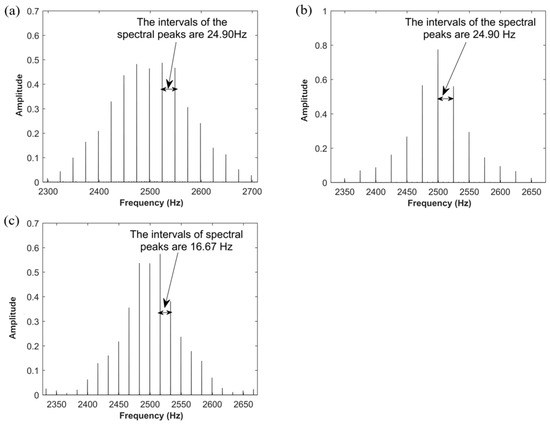
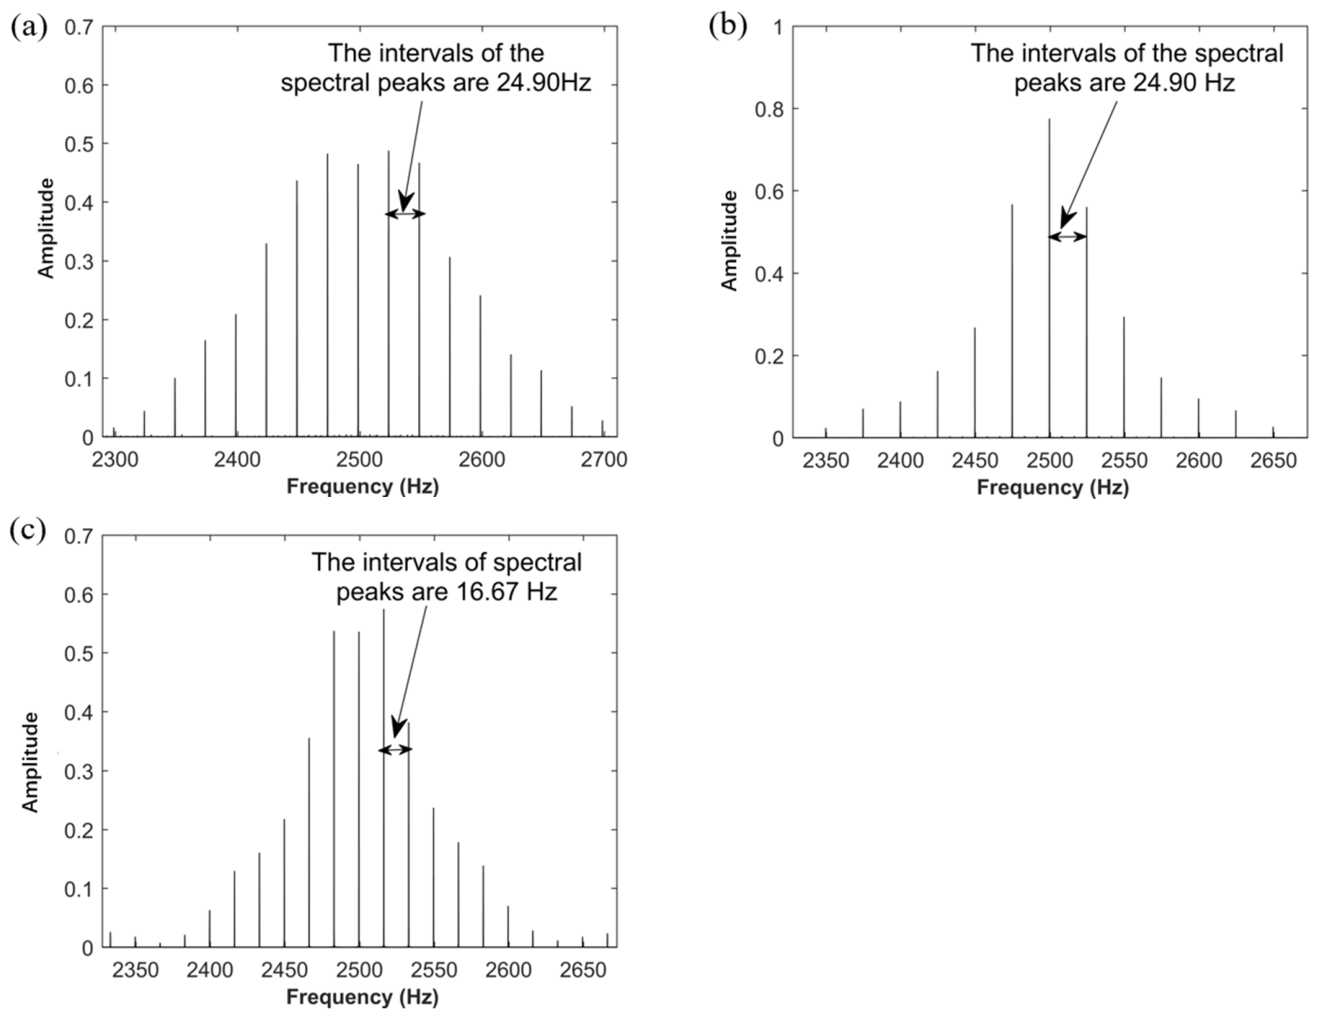
As is illustrated in Figure 10f, Figure 11f, Figure 12f and Figure 13f, the spectral intervals decrease from 24.90 Hz to 5 Hz at the cost of increasing the pulse duration from approximately 40 ms to 1 s. Furthermore, the relaxation process would not allow for any signal detection during such a long pulse duration, as Figure 12f presents. Thus, the cycle number n should be limited to a reasonable range. Concerning the target of advanced geological prospecting for adverse geological bodies (like water-bearing faults, karst caves filled with water or muddy water and fractured zone with water and gravel deposits), the observed T2* relaxation times are larger than 300 ms [6]. As such, the pulse time of our new excitation pulse must not be larger than 60 ms to avoid the significant influence of RDP, according to Walbrecker et al. [24]. It is noted that the 60 ms limit adopted here applies to the target formations with T2* > 300 ms [6,36]. For geological materials with shorter T2*, the maximum safe pulse duration would be correspondingly reduced according to the 20% RDP criterion [24]. With the pulse duration thus constrained and n = 20 for Pulses 1 and 2, the nominal frequency interval becomes the key adjustable parameter. As shown in Figure 10 and Figure 11, a nominal interval of 30 Hz with n = 20 produces a spectrum with reasonably defined peaks (Figure 11f). A narrower interval of 10 Hz would likely require a much larger n to achieve comparable definition (Figure 12 and Figure 13), resulting in a pulse duration well beyond the 60 ms limit. Therefore, 30 Hz was adopted as a practical nominal interval for this study. Note that the ±90 Hz value in Pulse 1 describes the total spectral span (distance from central to outermost peaks), rather than an adjacent peak interval. This broader span provides an additional margin against unexpectedly large background offsets. Under this circumstance, three types of excitation pulse are proposed in Table 1, with their frequency spectra shown in Figure 17. The durations of Pulses 1 and 2 are approximately 40 ms, which is valid for the adverse geological bodies mentioned above. Though the duration of Pulse 3 limits its ability to prospect adverse geological bodies with small pore sizes, the intervals of the spectral peaks are narrower than those of Pulses 1 and 2, which is more likely to provide a near-resonance excitation. The normalization of spectral amplitudes in Pulse 2 is not as good as in Pulses 1 and 3, but the strong spectral peak in the middle can increase the prospecting depth in the presence of small or no undesired frequency offset. Thus, the three pulses we proposed are useful under different circumstances, which is illustrated as follows. In summary, Pulse 1 provides broader spectral span for tolerance against larger offsets; Pulse 2 emphasizes signal enhancement via a strong central peak for small-offset scenarios; and Pulse 3 achieves denser spectral coverage by extending the pulse duration to the 60 ms limit. It is noted that these parameter sets represent feasible configurations identified through constrained numerical exploration, rather than a unique global optimum. The development of a formal multi-objective optimization framework for pulse parameter selection, including objectives such as signal enhancement maximization, pulse duration minimization, and spectral uniformity optimization, represents a promising direction for future work.
Table 1.
Optimized pulse parameters for multi-off-resonance excitation.
Figure 17.
Optimized frequency spectra for the three proposed broadband pulses. (a) Pulse 1, (b) Pulse 2, and (c) Pulse 3.
The pulse parameters in Table 1 are optimized to comply with the relaxation constraints of typical tunnel hazards. According to the field data in Lin et al. [6], the T2* for the adverse geological bodies investigated here (e.g., water-bearing fractured zones and fault zones) typically ranges from 300 ms to 600 ms. Applying the 20% safety criterion from Walbrecker et al. [24], the maximum allowable pulse duration for the most critical case (T2* = 300 ms) is calculated as . As shown in Table 1, our Pulse 3 (60.01 ms) reaches this conservative threshold, while Pulses 1 and 2 (approx. 40 ms) remain well within the safe zone. This quantitative alignment ensures that the RDP influence is minimized, justifying the simplified forward model used in Equation (7).
4. Results
4.1. Synthetic Experiments of Multi-Off-Resonance Excitation When w0,ass = w0
To demonstrate the advantages of our excitation method, synthetic experiments using the three pulses we proposed are presented. The model parameters in our synthetic experiments are shown as follows. The assumed Larmor frequency is 2500 Hz, with the geomagnetic inclination and declination being 50° and −6°, respectively. The resistivity of the surrounding rocks is 500 Ω∙m, in the analogy of porous limestone, which are the typical surrounding rocks for many water and mud inrush cases. A water-bearing fault is modeled in front of the tunnel face; its resistivity is 50 Ω∙m with the water content of 80%. The size of it is 36 m × 36 m × 5 m, which is the ordinary size of a water-bearing fault. A 7 m × 7 m transmitting square loop is installed on the tunnel face, and the loop geometry is coincident.
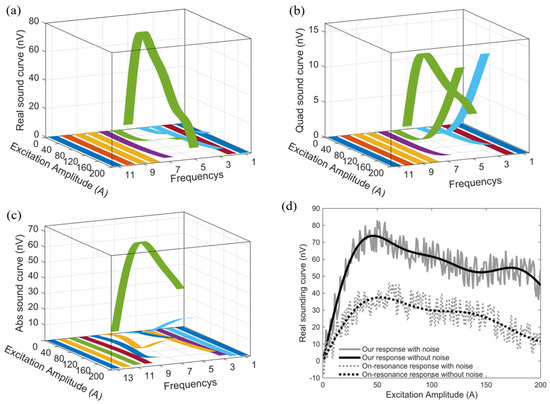
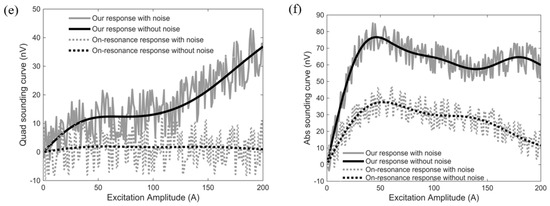
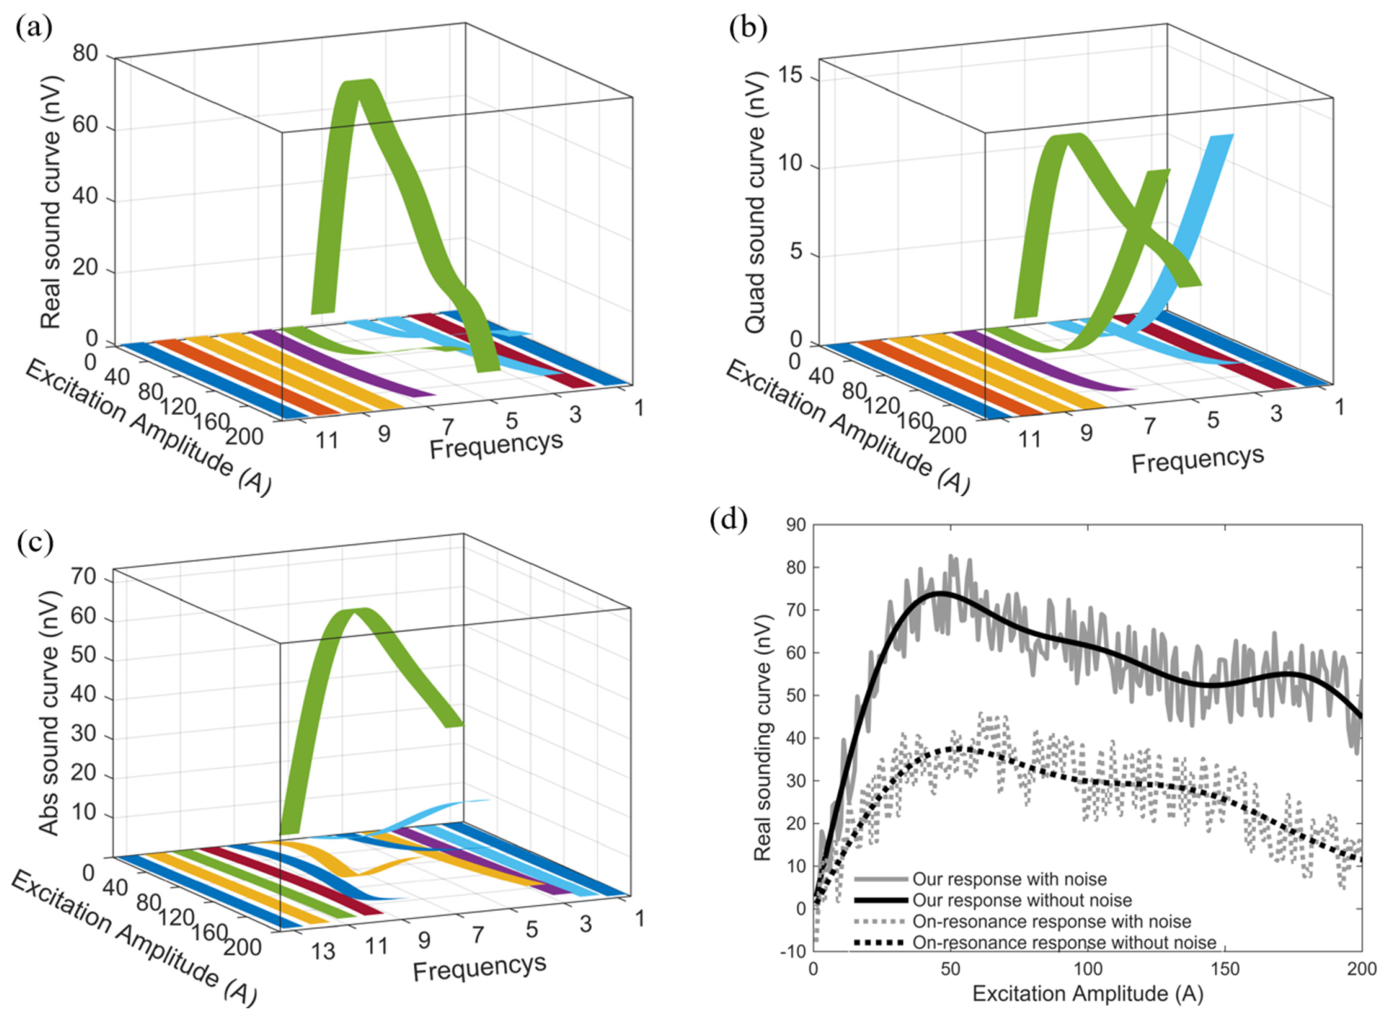
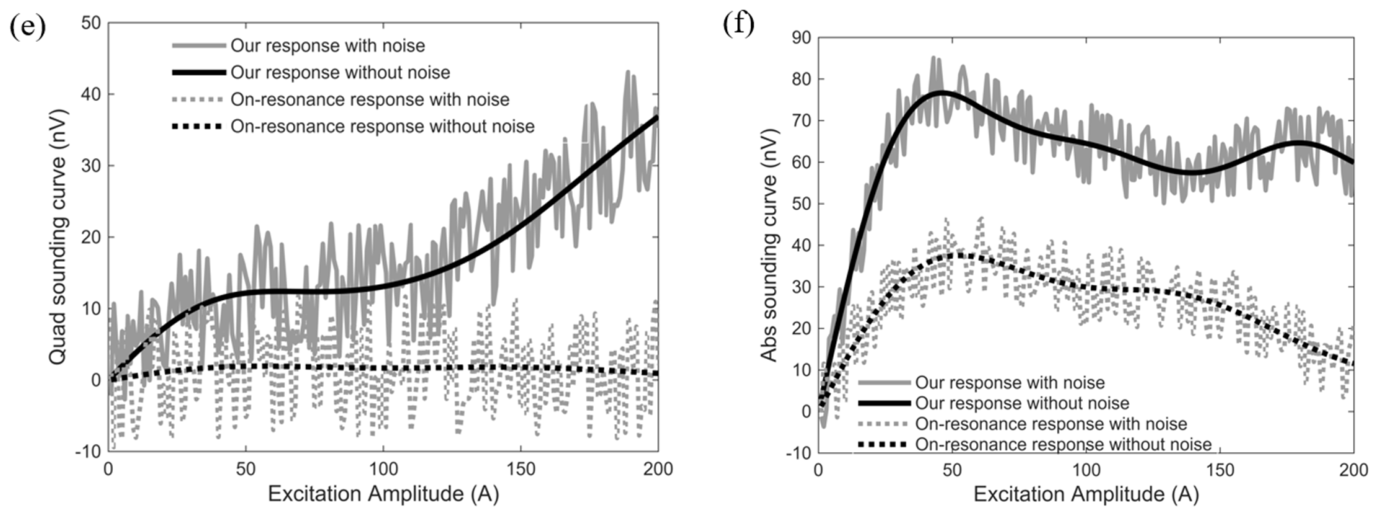
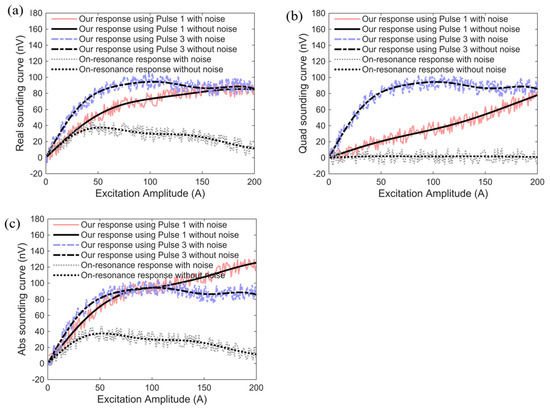
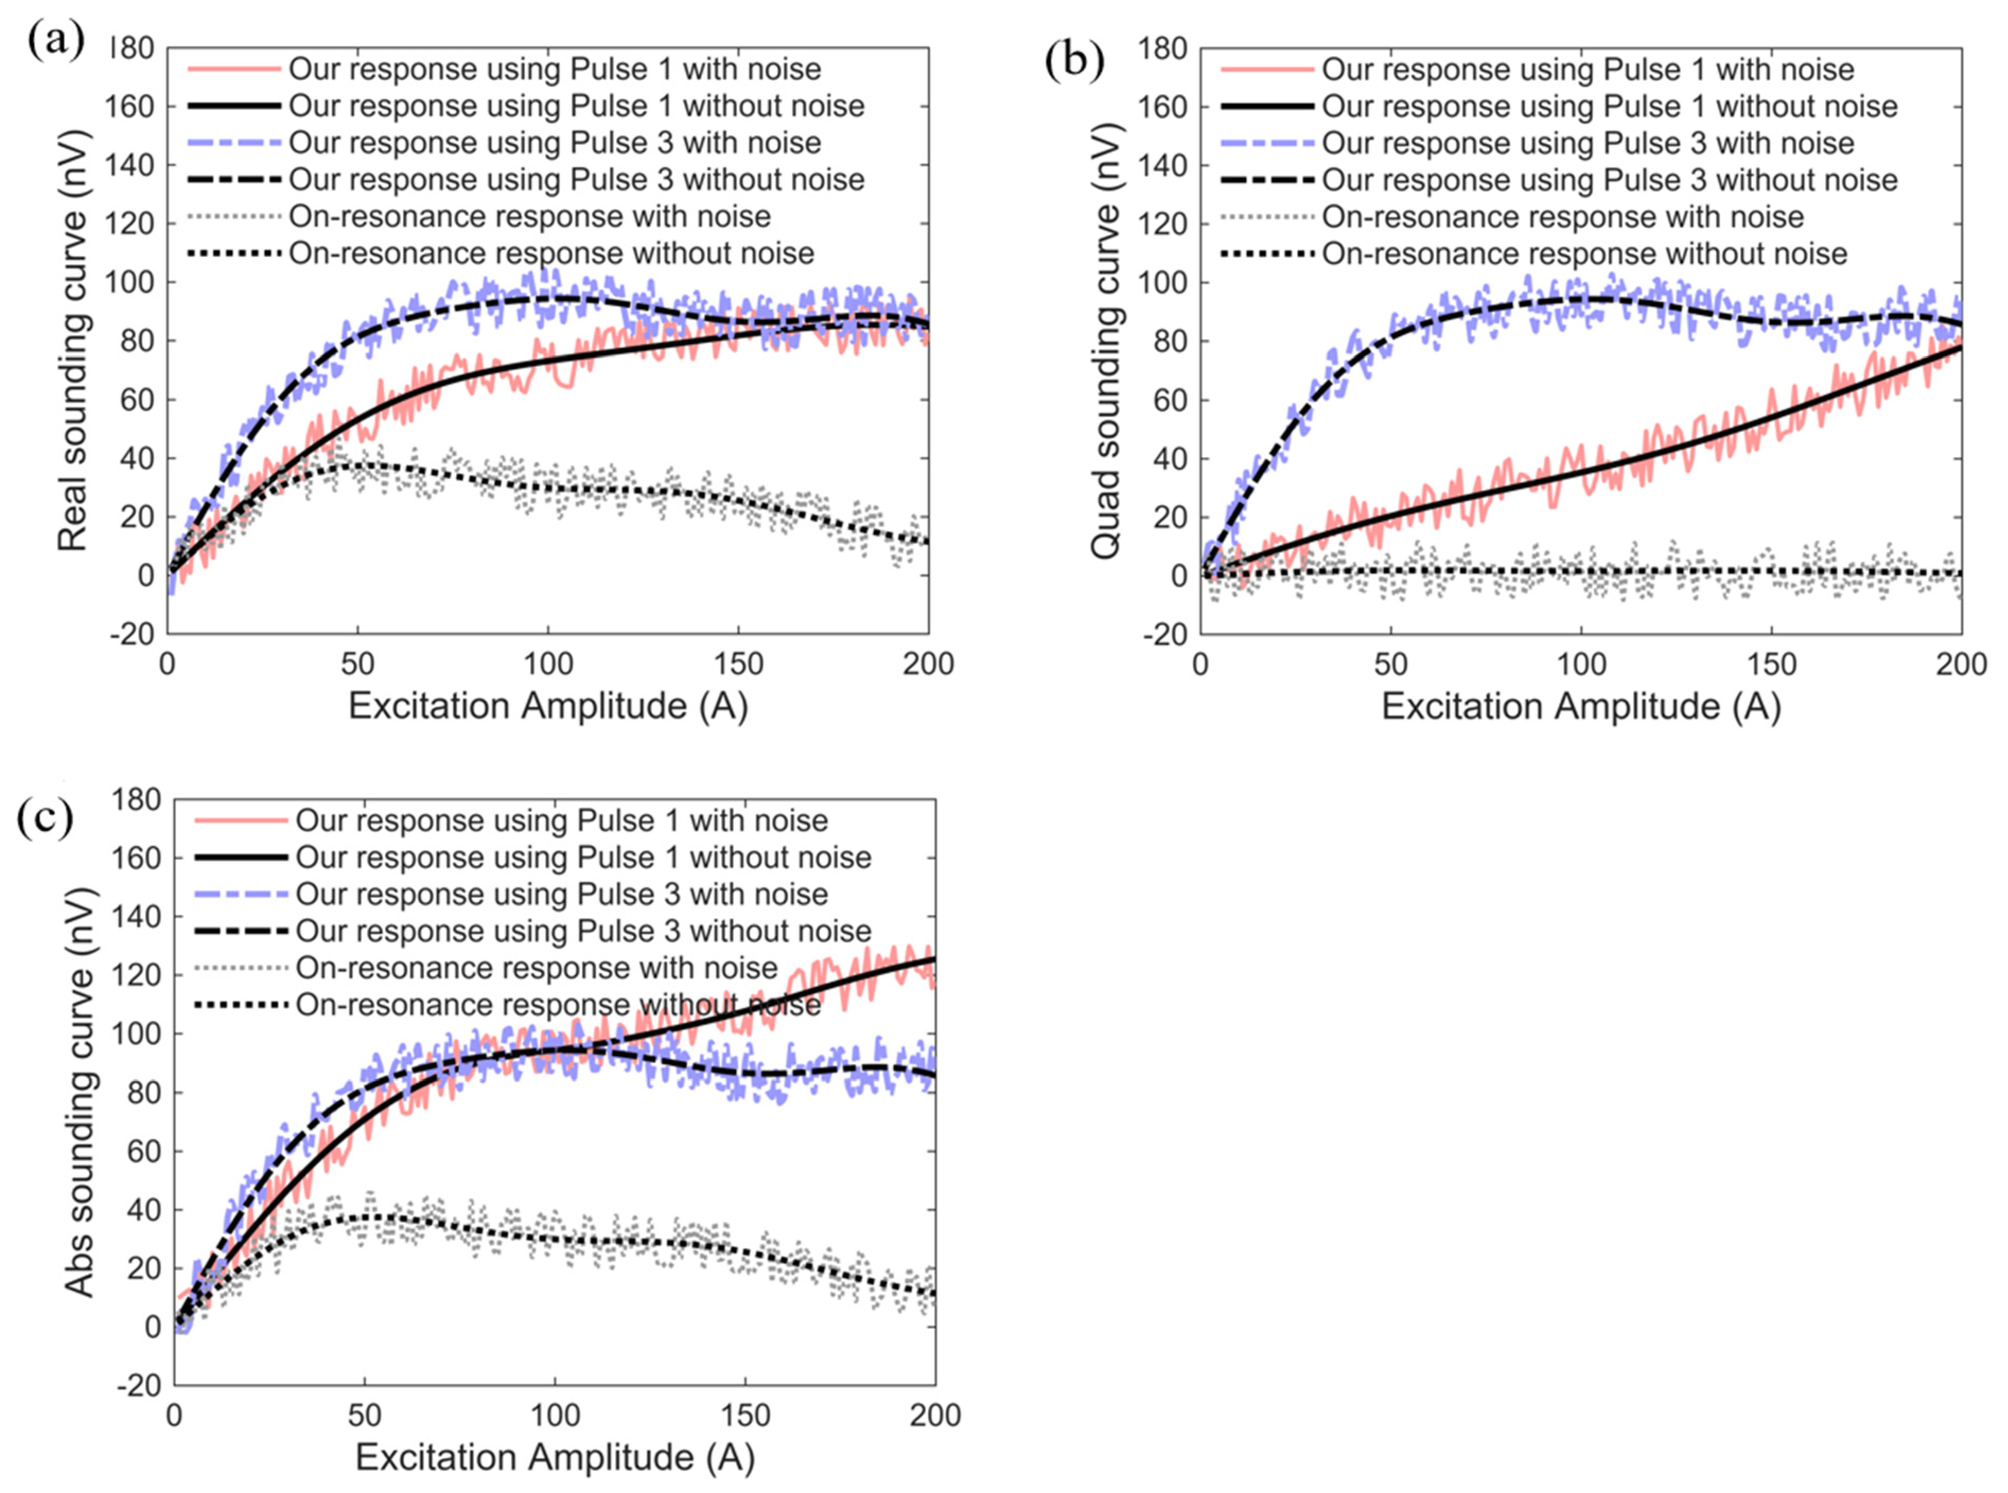
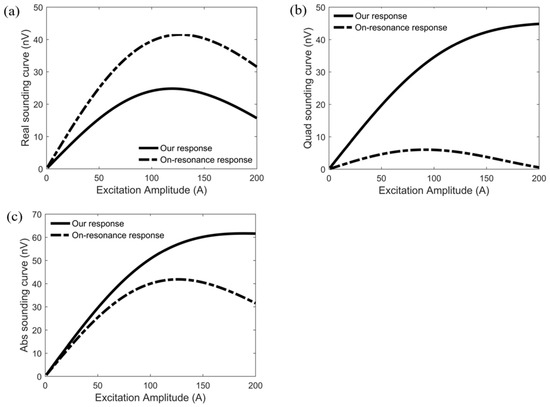
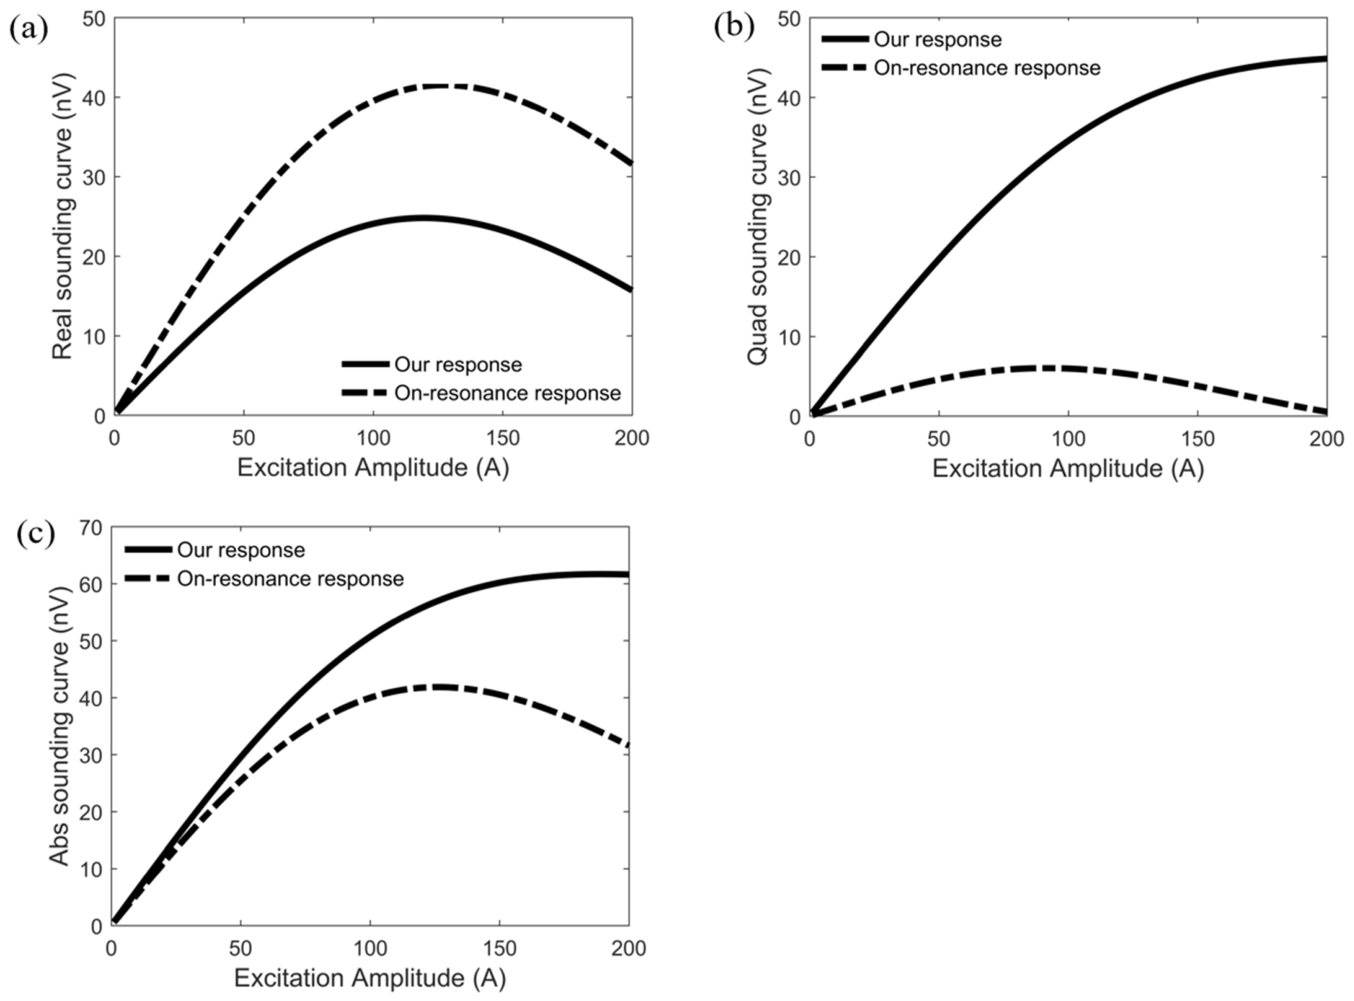
In scenarios where w0,ass = w0, Pulse 2 is expected to provide large magnitude of received signals. In the scenario where the front face of the water-bearing fault is located 15 m from the tunnel face, the sounding curves are shown in Figure 18. Figure 18a–c demonstrate the excitation effect of each spectral peak shown in Figure 17b. The received sounding curves are shown in Figure 18d–f. To testify the advantage of our pulse, the synthetic results were presented with 10% of white noise, which is shown by the gray lines in Figure 18d–f. Comparing the on-resonance response excited by a standard 40 ms pulse, our response provides an almost doubled signal magnitude for real and absolute sounding curves. Meanwhile, the responses from our pulses show better performance when 10% noise is given. The signal enhancement on quadrature sounding curves is the most significant (shown in Figure 18e) for two off-resonance excitations provided by the spectral peaks nearest to the middle one (shown in Figure 17b and Figure 18b). In addition, responses on the shallower fault excited by Pulses 1 and 3 are also presented in Figure 19. Significant signal enhancement is shown in real, quadrature and absolute sounding curves. The consistency of all three groups of sounding curves for the shallower 15 m deep water-bearing fault supports the feasibility of improving the UMRS signal magnitudes in tunnel. The sounding curves from our pulses maintain recognizability when 10% noise is given due to the obvious amplitude enhancement, which will provide a higher signal-to-noise ratio.
Figure 18.
Signal responses and sounding curves using Pulse 2 when 10% noise is given: (a) excitation effects of each spectral peak in Figure 17b on real components, (b) excitation effects of each spectral peak in Figure 17b on quadrature components, and (c) excitation effects of each spectral peak in Figure 17b on absolute value components; and (d) total real, (e) total quadrature, and (f) total absolute sounding curves compared with the on-resonance response when 10% noise is given.
Figure 19.
Comparison of sounding curves using Pulse 1 and Pulse 3 when 10% noise is given: (a) real, (b) quadrature, and (c) absolute sounding curves compared with the on-resonance response.
4.2. Synthetic Experiments of Multi-Off-Resonance Excitation in Occurrence of Undesired Offset
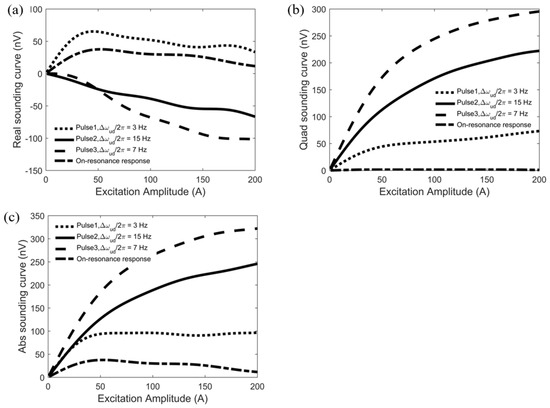
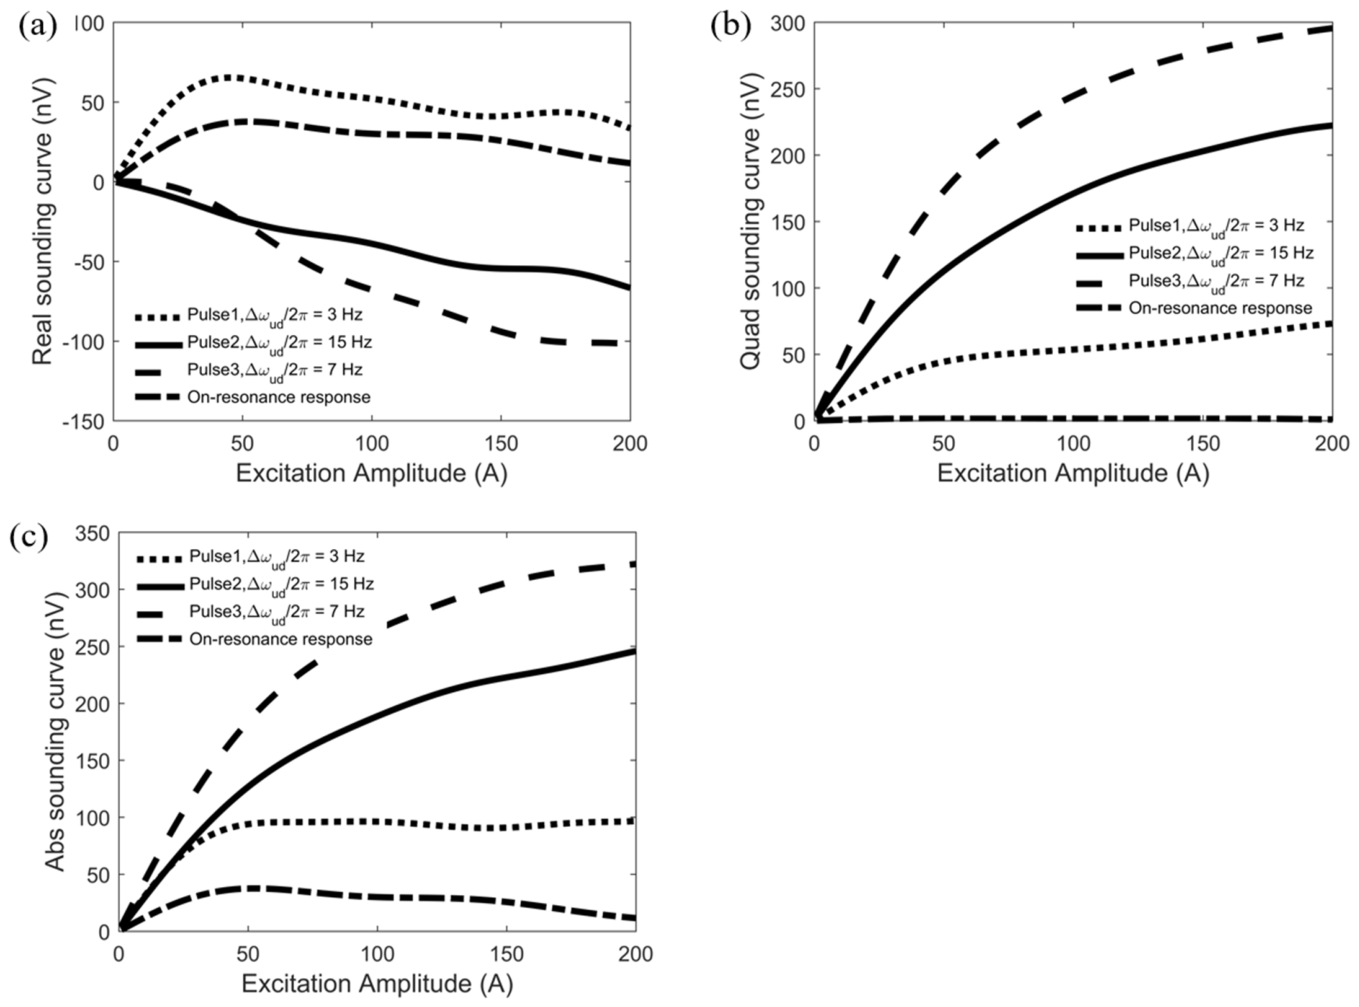
Synthetic experiments were conducted to demonstrate the benefits of our multi-off-resonance excitation in the presence of an undesired frequency offset, which is common and inevitable in most applications of surface and underground MRS. The undesired frequency offset is given as three levels: Δωud/2π = −3 Hz, Δωud/2π = 7 Hz, and Δωud/2π = 15 Hz. For the shallower 15 m deep water-bearing fault, the three pulses are tested under different Δωud. The response signals are shown in Figure 20. Firstly, Pulse 2 is used in the presence of the smallest undesired offset. Compared with the on-resonance scenario, a small undesired offset resulted in a near-resonance excitation corresponding to the middle spectral peaks (shown in Figure 17b), which produces enhanced magnitudes on quadrature and absolute sounding curves as a consequence. For Δωud/2π = −7 Hz, Pulse 3 is used for its narrow spectral intervals of 16.67 Hz. Together with the middle one, the spectral peak on the left side (shown in Figure 17c) provides near-resonance excitation. In Figure 20, significant signal enhancement is shown in real, quadrature and absolute sounding curves. Finally, for the largest offset, Δωud/2π = 15 Hz, Pulse 1 is used to demonstrate its advantages in signal enhancements. For the deeper 26 m deep water-bearing fault, Pulse 2 is expected due to the strong middle peaks in its spectrum. To test its feasibility, a −5 Hz undesired offset is given. The sounding curves are shown in Figure 21. Aside from the reduction in real sounding curves, the quadrature and absolute sounding curves receive signal enhancement as expected.
Figure 20.
Performance of Pulses 1–3 under various undesired frequency offsets: (a) real, (b) quadrature, and (c) absolute sounding curves compared with the on-resonance response.
Figure 21.
Detection of a deep water-bearing fault using Pulse 1 with a 5 Hz offset: (a) real, (b) quadrature, and (c) absolute sounding curves compared with the on-resonance response.
The results allow us not only to ignore the undesired frequency offsets in prospecting for shallow water-bearing bodies but also to receive the UMRS signal with a higher S/N ratio. For deeper prospecting issues, the method we proposed can provide signal enhancement in quadrature and absolute sounding curves in the presence of small undesired frequency offsets.
5. Discussion
The implementation of our proposed excitation method does not require increased survey time. The current signal acquisition scheme is valid for detecting the response signals. Through our synthetic experiments, the transmitting frequencies are given according to the local assumed Larmor frequency. Given a proper cycle number according to demand, the pulse duration is determined. Note that to get an expected frequency spectra, the number of cycles varies with different transmitting frequencies. This difference is slight enough, and will not increase the survey work. A numerical frequency analysis of an excitation pulse to be used can meet the demand. For example, if the assumed Larmor frequency is 2243 Hz and Pulse 1 is selected, the corresponding transmission frequencies are 2153, 2213, 2243, 2273, and 2333 Hz. To get the spectrum with the same shape and values with Figure 17a, the cycle number n should be set as 18, according to numerical frequency analysis. Then, different excitation currents are pulsed to generate a series of excitation pulse moments. While the present study is limited to synthetic simulations, laboratory-scale physical model tests and field tunnel measurements represent important directions for the future validation of the proposed method.
To generate the excitation pulse we proposed, the transmitter should be equipped with high-capacity capacitors, IGBTs and other power electronic devices and controlling circuits. High-capacity capacitors are used to generate a transmitting voltage of high magnitude and IGBTs are used to switch the transmitting waveform on and off by means of the H-bridge power drive circuits. The switching frequency should be controlled according to the transmitting frequencies of our proposed pulses. Given the hardware reactance, especially the inductance of coils, the waveforms of the transmitting pulse will suffer phase shifts and waveform distortion. However, as the higher harmonics are not effective in multi-off-resonance excitation, the waveform distortion of the low-pass effect caused by the hardware reactance can be neglected. In addition, substituting the s(wt) in Equation (13) with the sinusoidal pulse will not change the shape of the spectral peaks in the fundamental harmonic band. Furthermore, the phase shifts in the excitation pulse should be taken into account in the practical survey. In addition, high-powered transmitters are required to compensate for the limited coil size in the tunnel condition.
The additional hardware complexity associated with the proposed multi-off-resonance pulses represents a trade-off. The use of IGBT-based circuits and high-capacity capacitors may increase the initial equipment cost compared to a standard monochromatic transmitter. However, as demonstrated in Section 4.1 and Section 4.2, the signal amplitude enhancement achieved by these pulses can reduce the required stacking time in the field. In tunnel environments, where the measurement time is often constrained by construction schedules and safety regulations, this trade-off may be practically justifiable.
In practical tunnel applications, site-specific calibration would be needed to account for variations in the surrounding rock resistivity and other geological factors. A promising approach is to first constrain the subsurface resistivity structure using complementary geophysical methods such as transient electromagnetic (TEM) sounding, then incorporate this resistivity model into the UMRS kernel function during inversion to correct for conductivity-induced effects [34,35]. The enhanced signal amplitudes provided by the proposed pulses may facilitate such calibration, particularly in conductive environments where signal attenuation is more pronounced. This calibration workflow represents an important direction for future work.
To take advantage of the dataset provided by multi-off-resonance excitation, the new kernel function should be taken into account. As the consequence of multi-off-resonance excitation, the sounding curves contain the information about the undesired frequency offsets. Given the transmitting frequencies and actual excitation spectra, the assumed Larmor frequency might be set as the initial value for inversion iteration, then the true Larmor frequency should be set as one of the model parameters in the inversion of the observed data, which is of our future concern. A practical inversion framework for the proposed method could be built upon the QT inversion scheme [7], which directly inverts time-resolved datasets for subsurface water content and relaxation time distributions. In this framework, the standard on-resonance kernel would be replaced by the multi-off-resonance kernel function (Equation (7)) and the true Larmor frequency would be treated as an additional model parameter to be determined iteratively, following the approach demonstrated for varying geomagnetic fields [12]. One challenge in such an inversion is distinguishing phase variations caused by frequency offsets from those caused by environmental noise. Because the kernel function explicitly encodes the deterministic relationship between the frequency offset and signal phase, the inversion may be able to separate these contributions provided that there is an adequate signal-to-noise ratio. The development and validation of this inversion workflow remains an important direction for future work.
The present study has focused on the fundamental physics of multi-off-resonance excitation under idealized conditions. Practical deployment in tunnels will require consideration of additional environmental factors, including electromagnetic noise from construction equipment and the presence of metallic structures such as rock bolts and support elements [1,15]. Detailed noise modeling and field validation in realistic tunnel settings remain as directions for future work.
The approach presented here differs in its underlying philosophy: rather than compensating for or adapting to off-resonance conditions, it actively introduces a controlled set of frequency offsets to exploit the signal enhancement phenomenon. The intention is to ensure that at least one spectral component falls within the signal enhancement window identified in Section 2.2, regardless of the specific background offset present. Given the distinct design objectives and operational constraints of tunnel-based instrumentation, a direct quantitative comparison necessitates a standardized evaluation framework. Developing such a framework is reserved for a subsequent stage of this investigation.
From an instrumentation perspective, the proposed pulses would benefit from a distributed architecture that houses high-capacity power components remotely, while positioning only a compact H-bridge switching unit and a lightweight, segmented coil near the excavation face. Such an arrangement reduces spatial interference with construction activities and enhances operational safety. Recent developments in surface NMR instrumentation, such as the H-bridge-based steady-state transmitter reported by Gaikwad et al. (2025) [37], suggest that the core technology for generating high-power arbitrary waveforms in a compact form factor is feasible. While a complete engineering realization lies beyond the scope of the present proof-of-concept study, the modular approach outlined here provides a plausible pathway toward practical deployment.
It is also noted that the forward model (Equation (7)) accounts for the effects of formation conductivity through the frequency-domain resistivity distribution ρ(r) used in the computation of the magnetic fields BT and BR. The spectral energy of the proposed multi-off-resonance pulses is concentrated within a narrow band around the fundamental Larmor frequency (Figure 11 and Figure 17). Consequently, the quasi-static frequency-domain treatment remains appropriate for the scenarios considered in this study, as it effectively captures the principal effects of conductive media—namely attenuation, phase rotation, and elliptical polarization.
6. Conclusions
The synthetic results demonstrate a novel multi-off-resonance excitation approach using broadband pulses to enhance UMRS signal magnitudes. By moving beyond traditional on-resonance conditions, this method effectively utilizes off-resonance effects to improve the detection reliability in tunnel environments. To ensure feasibility for ahead geological prospecting, the pulse duration is optimized to within 60 ms to mitigate the RDP effects. The proposed three types of excitation pulses demonstrate significant signal enhancement for shallow water-bearing structures in front of the tunnel face. This enhancement is achieved even in the presence of frequency offsets, leading to a higher S/N ratio. Furthermore, for deeper water-bearing bodies, the multi-off-resonance method provides increased magnitudes in sounding curves, which is crucial for the early warning of water and mud inrush. These findings prove the feasibility of the proposed method in tunnel geotechnics, while future work focuses on the development of transmitting devices and inversion schemes. Future research will focus on developing specialized transmitting hardware and inversion schemes. Additionally, further validation will be conducted through laboratory-scale model tests and field measurements.
Author Contributions
L.Z.: Conceptualization, Methodology, Writing—original draft. S.D.: Software, Validation, Formal analysis. R.W.: Supervision, Project administration. All authors have read and agreed to the published version of the manuscript.
Funding
Natural Science Foundation of Shandong Province, grant number ZR2024QE150.
Data Availability Statement
The raw data supporting the conclusions will be made available by the authors on request.
Conflicts of Interest
The authors declare no conflicts of interest. The funders had no role in the design of the study; in the collection, analyses, or interpretation of data; in the writing of the manuscript; or in the decision to publish the results.
References
- Lin, J.; Jiang, C.D.; Lin, T.T.; Duan, Q.M.; Wang, Y.J.; Shang, X.L.; Fan, T.H.; Sun, S.Q.; Tian, B.F.; Zhao, J.; et al. Underground magnetic resonance sounding (UMRS) for detection of disastrous water in mining and tunneling. Chin. J. Geophys. 2013, 56, 3619–3628. [Google Scholar] [CrossRef]
- Zhao, Y.; Lin, J.; Jiang, C.; Yi, X. A theoretical study of underground magnetic resonance sounding for the advanced detection of water influxes in tunnels. J. Environ. Eng. Geophys. 2020, 25, 37–46. [Google Scholar] [CrossRef] [Scilit]
- Weichman, P.B.; Lavely, E.M.; Ritzwoller, M.H. Theory of surface nuclear magnetic resonance with applications to geophysical imaging problems. Phys. Rev. E 2000, 62, 1290–1312. [Google Scholar] [CrossRef] [Scilit]
- Coates, G.R.; Peveraro, R.C.A.; Hardwick, A.; Roberts, D. The magnetic resonance imaging log characterized by comparison with petrophysical properties and laboratory core data. In Proceedings of the SPE Annual Technical Conference and Exhibition, Dallas, TX, USA, 6–9 October 1991. Paper No. SPE-22723-MS. [Google Scholar] [CrossRef]
- Legchenko, A.V.; Shushakov, O.A. Inversion of surface NMR data. Geophysics 1998, 63, 75–84. [Google Scholar] [CrossRef] [Scilit]
- Schirov, M.; Legchenko, A.; Creer, G. A new direct non-invasive groundwater detection technology for Australia. Explor. Geophys. 1991, 22, 333–338. [Google Scholar] [CrossRef] [Scilit]
- Mueller-Petke, M.; Yaramanci, U. QT inversion—Comprehensive use of the complete surface NMR data set. Geophysics 2010, 75, WA199–WA209. [Google Scholar] [CrossRef] [Scilit]
- Martin, J.B.; Dean, R.W. Exchange of water between conduits and matrix in the Floridan aquifer. Chem. Geol. 2001, 179, 145–165. [Google Scholar] [CrossRef] [Scilit]
- Song, Z.; Jing, P.; Nie, L.; Mei, Z.; Jia, S.; Li, Z. Comprehensive identification and assessment of clastic rock and water-bearing breccia for water and mud inrush in tunnel: A case study. Tunn. Undergr. Space Technol. 2025, 155, 106156. [Google Scholar] [CrossRef] [Scilit]
- Walbrecker, J.O.; Hertrich, M.; Green, A.G. Off-resonance effects in surface nuclear magnetic resonance. Geophysics 2011, 76, G1–G12. [Google Scholar] [CrossRef] [Scilit]
- Grombacher, D.; Knight, R. The impact of off-resonance effects on water content estimates in surface nuclear magnetic resonance. Geophysics 2015, 80, E329–E342. [Google Scholar] [CrossRef] [Scilit]
- Legchenko, A.; Vouillamoz, J.M.; Lawson, F.M.A.; Alle, C.; Descloitres, M.; Boucher, M. Interpretation of magnetic resonance measurements in the varying Earth’s magnetic field. Geophysics 2016, 81, WB23–WB31. [Google Scholar] [CrossRef] [Scilit]
- Mohnke, O.; Yaramanci, U. Forward modeling and inversion of MRS relaxation signals using multi-exponential decomposition. Near Surf. Geophys. 2005, 3, 165–185. [Google Scholar] [CrossRef] [Scilit]
- Grombacher, D.; Walbrecker, J.O.; Knight, R. Imparting a phase during excitation for improved resolution in surface nuclear magnetic resonance. Geophysics 2014, 79, E329–E339. [Google Scholar] [CrossRef] [Scilit]
- Greben, J.M.; Meyer, R.; Kimmie, Z. The underground application of magnetic resonance soundings. J. Appl. Geophys. 2011, 75, 220–226. [Google Scholar] [CrossRef] [Scilit]
- Hürlimann, M.D. Effective gradients in porous media due to susceptibility differences. J. Magn. Reson. 1998, 131, 232–240. [Google Scholar] [CrossRef] [Scilit] [PubMed]
- Berckhemer, H. Grundlagen der Geophysik; Wissenschaftliche Buchgesellschaft: Darmstadt, Germany, 1990. [Google Scholar]
- Trushkin, D.V.; Shushakov, O.A.; Legchenko, A.V. Modulation effects in non-drilling NMR in the Earth’s field. Appl. Magn. Reson. 1993, 5, 399–406. [Google Scholar] [CrossRef] [Scilit]
- Grombacher, D.; Müller-Petke, M.; Knight, R. Frequency cycling for compensation of undesired off-resonance effects in surface nuclear magnetic resonance. Geophysics 2016, 81, WB33–WB48. [Google Scholar] [CrossRef] [Scilit]
- Grunewald, E.; Grombacher, D.; Walsh, D. Adiabatic pulses enhance surface nuclear magnetic resonance measurement and survey speed for groundwater investigations. Geophysics 2016, 81, WB85–WB96. [Google Scholar] [CrossRef] [Scilit]
- Bloch, F. Nuclear induction. Phys. Rev. 1946, 70, 460–474. [Google Scholar] [CrossRef] [Scilit]
- Levitt, M.H. Spin Dynamics: Basics of Nuclear Magnetic Resonance, 2nd ed.; John Wiley & Sons: Chichester, UK, 2008. [Google Scholar]
- Hürlimann, M.D. Diffusion and relaxation effects in general stray field NMR experiments. J. Magn. Reson. 2001, 148, 367–378. [Google Scholar] [CrossRef] [Scilit]
- Walbrecker, J.O.; Hertrich, M.; Green, A.G. Accounting for relaxation processes during the pulse in surface NMR data. Geophysics 2009, 74, G27–G34. [Google Scholar] [CrossRef] [Scilit]
- Freeman, R. Shaped radiofrequency pulses in high resolution NMR. Prog. Nucl. Magn. Reson. Spectrosc. 1998, 32, 59–106. [Google Scholar] [CrossRef] [Scilit]
- Trushkin, D.V.; Shushakov, O.A.; Legchenko, A.V. Surface NMR applied to an electroconductive medium. Geophys. Prospect. 1995, 43, 623–633. [Google Scholar] [CrossRef] [Scilit]
- Ye, R.; Wang, Y.; Li, S.; Lin, T.; Wan, L. UMRS data inversion using tempered Hamiltonian Monte Carlo method and its application to water detection in the tunnel. IEEE Trans. Geosci. Remote Sens. 2024, 62, 1–12. [Google Scholar] [CrossRef] [Scilit]
- Yuan, Y.; Yao, X.; Xiong, X.; Rui, C.; Zhang, J.L. Innovative engineering solutions for the crossing strait tunnel. Civ. Energy Res. 2026, 2, 1–18. [Google Scholar] [CrossRef] [Scilit]
- Song, S.; Li, S.; Liang, Y.; Huo, R.; Song, Z.; Miao, Z.; Song, Z. Study on construction mechanical effect and optimization of large-span variable cross-section of railway tunnel. Buildings 2023, 13, 2859. [Google Scholar] [CrossRef] [Scilit]
- Lin, J.; Zhang, J.; Yi, X.F. Design and experiment of small antenna for magnetic resonance sounding in underground applications. Chin. J. Geophys. 2017, 60, 4184–4193. [Google Scholar] [CrossRef]
- Lin, T.; Yang, Y.; Yi, X.; Jiang, C.; Fan, T. First evidence of the detection of an underground nuclear magnetic resonance signal in a tunnel. J. Environ. Eng. Geophys. 2018, 23, 77–88. [Google Scholar] [CrossRef] [Scilit]
- Lin, T.; Lin, X.; Teng, F.; Wan, L. Uncertainty analysis of UMRS parameters and its application for water detection in the tunnel. J. Appl. Geophys. 2020, 179, 104116. [Google Scholar] [CrossRef] [Scilit]
- Legchenko, A.; Ezersky, M.; Girard, J.F.; Baltassat, J.M.; Boucher, M.; Camerlynck, C.; Al-Zoubi, A. Interpretation of magnetic resonance soundings in rocks with high electrical conductivity. J. Appl. Geophys. 2008, 66, 118–127. [Google Scholar] [CrossRef] [Scilit]
- Legchenko, A.; Ezersky, M.; Camerlynck, C.; Al-Zoubi, A.; Chalikakis, K. Joint use of TEM and MRS methods in a complex geological setting. C. R. Geosci. 2009, 341, 908–917. [Google Scholar] [CrossRef] [Scilit]
- Behroozmand, A.A.; Keating, K.; Auken, E. A review of the principles and applications of the NMR technique for near-surface characterization. Surv. Geophys. 2015, 36, 27–85. [Google Scholar] [CrossRef] [Scilit]
- Peng, Y.; Keating, K. A laboratory study of the effect of clay, silt, and sand content on low-field nuclear magnetic resonance relaxation time distributions. Geophysics 2021, 86, WB1–WB8. [Google Scholar] [CrossRef] [Scilit]
- Gaikwad, N.B.; Liu, L.; Griffiths, M.P.; Grombacher, D.; Larsen, J.J. A high-duty-cycle transmitter unit for steady-state surface NMR instruments. Geosci. Instrum. Method. Data Syst. 2025, 14, 139–151. [Google Scholar] [CrossRef] [Scilit]

Disclaimer/Publisher’s Note: The statements, opinions and data contained in all publications are solely those of the individual author(s) and contributor(s) and not of MDPI and/or the editor(s). MDPI and/or the editor(s) disclaim responsibility for any injury to people or property resulting from any ideas, methods, instructions or products referred to in the content. |
© 2026 by the authors. Licensee MDPI, Basel, Switzerland. This article is an open access article distributed under the terms and conditions of the Creative Commons Attribution (CC BY) license.