


Abstract
Due to their proximity to track structures, over-track buildings in depot areas may experience adverse vibrations from train operations, which can negatively impact residential comfort and the performance of precision equipment. As the test line typically involves the highest train speeds within the depot and features distinct operating conditions such as constant-speed cruising, accelerating, and braking, this study aims to investigate the influence of different train operation modes on the vibration excitation of over-track high-rise buildings through field measurements at both the central and end sections of the test line. Three operational modes were examined, including cruising, accelerating, and braking. Vibration signals were systematically collected using sensors installed in the free field, on the ground above the building foundation, and at the bases of the shear walls. A time-varying frequency phenomenon was observed at measurement points on the ground above the foundation and at the shear wall bases during train acceleration and braking. Field data indicate that vertical vibrations in the free field at the end section of the test line were significantly greater than those at the middle section, whereas vertical vibrations at the shear wall bases were comparable between the two sections. Notable vibration transmission loss occurs as the vibration propagates into the building structure, with peak values reaching 20 dB at 80 Hz during cruising operations and 35 dB at 125 Hz during acceleration and braking. This study offers valuable insights for assessing train-induced vibration transmission into high-rise over-track buildings.
1. Introduction
With the accelerating pace of global urbanization, rail transit systems such as metros have become vital solutions to urban transportation challenges, owing to their high capacity and efficiency. However, environmental vibrations and noise generated by metro operations have raised increasing concerns [1,2,3]. These vibrations propagate through the soil to nearby buildings, not only affecting occupant comfort but also potentially interfering with precision instruments and posing long-term risks to structural safety [4,5,6,7]. As a distinctive form of urban spatial utilization, over-track buildings are constructed directly above metro depots or similar infrastructures. This configuration places the building in close proximity to rail lines, making vibration-related issues particularly significant [8].
Extensive research has been conducted worldwide on environmental vibrations induced by rail transit. Most studies focus on vibration generation mechanisms, propagation through soil, and their effects on buildings [9,10,11,12,13,14,15,16,17]. Tao et al. revealed variations in train-induced ground vibrations, quantified the associated propagation uncertainty, and provided a probabilistic assessment of amplification phenomena. Their proposed method helps determine the probability of vibration amplification during propagation and supports reliability analysis and site screening for building suitability assessment [18]. Qu et al. proposed a hybrid prediction methodology for subway-induced vibrations in far-field buildings, combining vehicle-track dynamics, 2.5D FEM, and Green’s functions. The study demonstrates that steel-spring floating slab tracks significantly reduce vibration levels in critical low-frequency bands, ensuring compliance with sensitive equipment standards [19]. Hao et al. performed field measurements of indoor vibration and noise in buildings near an urban transit line to establish baselines and evaluate mitigation measures such as rail grinding and speed reduction. The study showed that speed reduction leads to a concentration of vibration and noise energy around 50 Hz [20]. Furthermore, Chen et al. investigated vibration sources and transmission characteristics in metro depots by conducting field measurements at five representative sites in China. Integrated analysis indicated that vibration levels at inspection track columns ranged between 60 and 70 dB, while those in the throat area and test track reached 70–85 dB. In two-story depots with similar track and operational conditions, ground-floor vibration levels were 5–10 dB higher than those at the track level. Additionally, due to boundary effects at the top floor, vibrations propagating upward in over-track buildings undergo reflection and superposition, resulting in slower attenuation or even amplification with increasing floor height, particularly in low-rise, multi-span structures [21].
Various predictive models have also been developed for vibration responses in over-track buildings and structures near rail lines. Hu et al. integrated the train, track, and building into a unified system, proposing a vertical vibration prediction model for trains operating on building floors. Field measurements at an elevated metro depot showed good agreement between predicted and observed vibrations, enabling the model to forecast both foundation and floor vibrations [22]. Wang et al. established a fully coupled three-dimensional vibration prediction model for over-track buildings that considers pile–soil interaction. Their study revealed that, aside from track resonance, ballast mats achieved an insertion loss exceeding 10 dB above 40 Hz, though the damping effect diminished with increasing floor height [23]. Finite element modeling has also been widely adopted in vibration studies of metro over-track buildings [24,25,26]. Zou et al. combined field measurements, finite element modeling, and parametric analysis to explore vibration transmission mechanisms and mitigation strategies for over-track buildings subjected to metro trains on ramp lines. Results indicated that vertical vibrations are dominated by the P2 resonance (63 Hz) stemming from wheel-rail interaction, with notable high-frequency attenuation, though levels in lower floors still exceeded standards. Key influencing factors included train speed, slab thickness, and dynamic load positioning [27]. Wang et al. further developed a finite element model of the track–soil–depot system, idealizing the train as a series of spring-mass models and simulating train loads using measured rail acceleration. By incorporating a sub-model of the over-track building, they predicted vibration responses and evaluated the effect of vibration isolation bearings [28].
While progress has been made, existing research still lacks comprehensive consideration of the complex operational conditions typical of metro depots, and controlled field measurements of over-track building vibrations in such contexts remain scarce. This study addresses this gap by conducting systematic field measurements along both the central and end sections of a depot test line, which features the highest train speeds in the depot along with distinct operating modes including cruising, acceleration, and braking. Vibration data were simultaneously collected and compared at three key locations: the free field, the ground above the building foundation, and the bases of the shear walls in the high-rise over-track building. The findings are intended to support the assessment of train-induced vibrations in similar depot settings.
2. Description of the Test Site
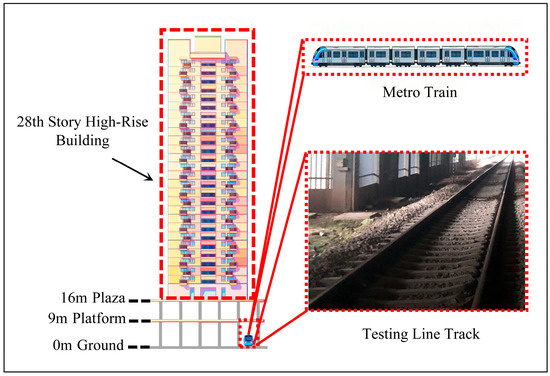
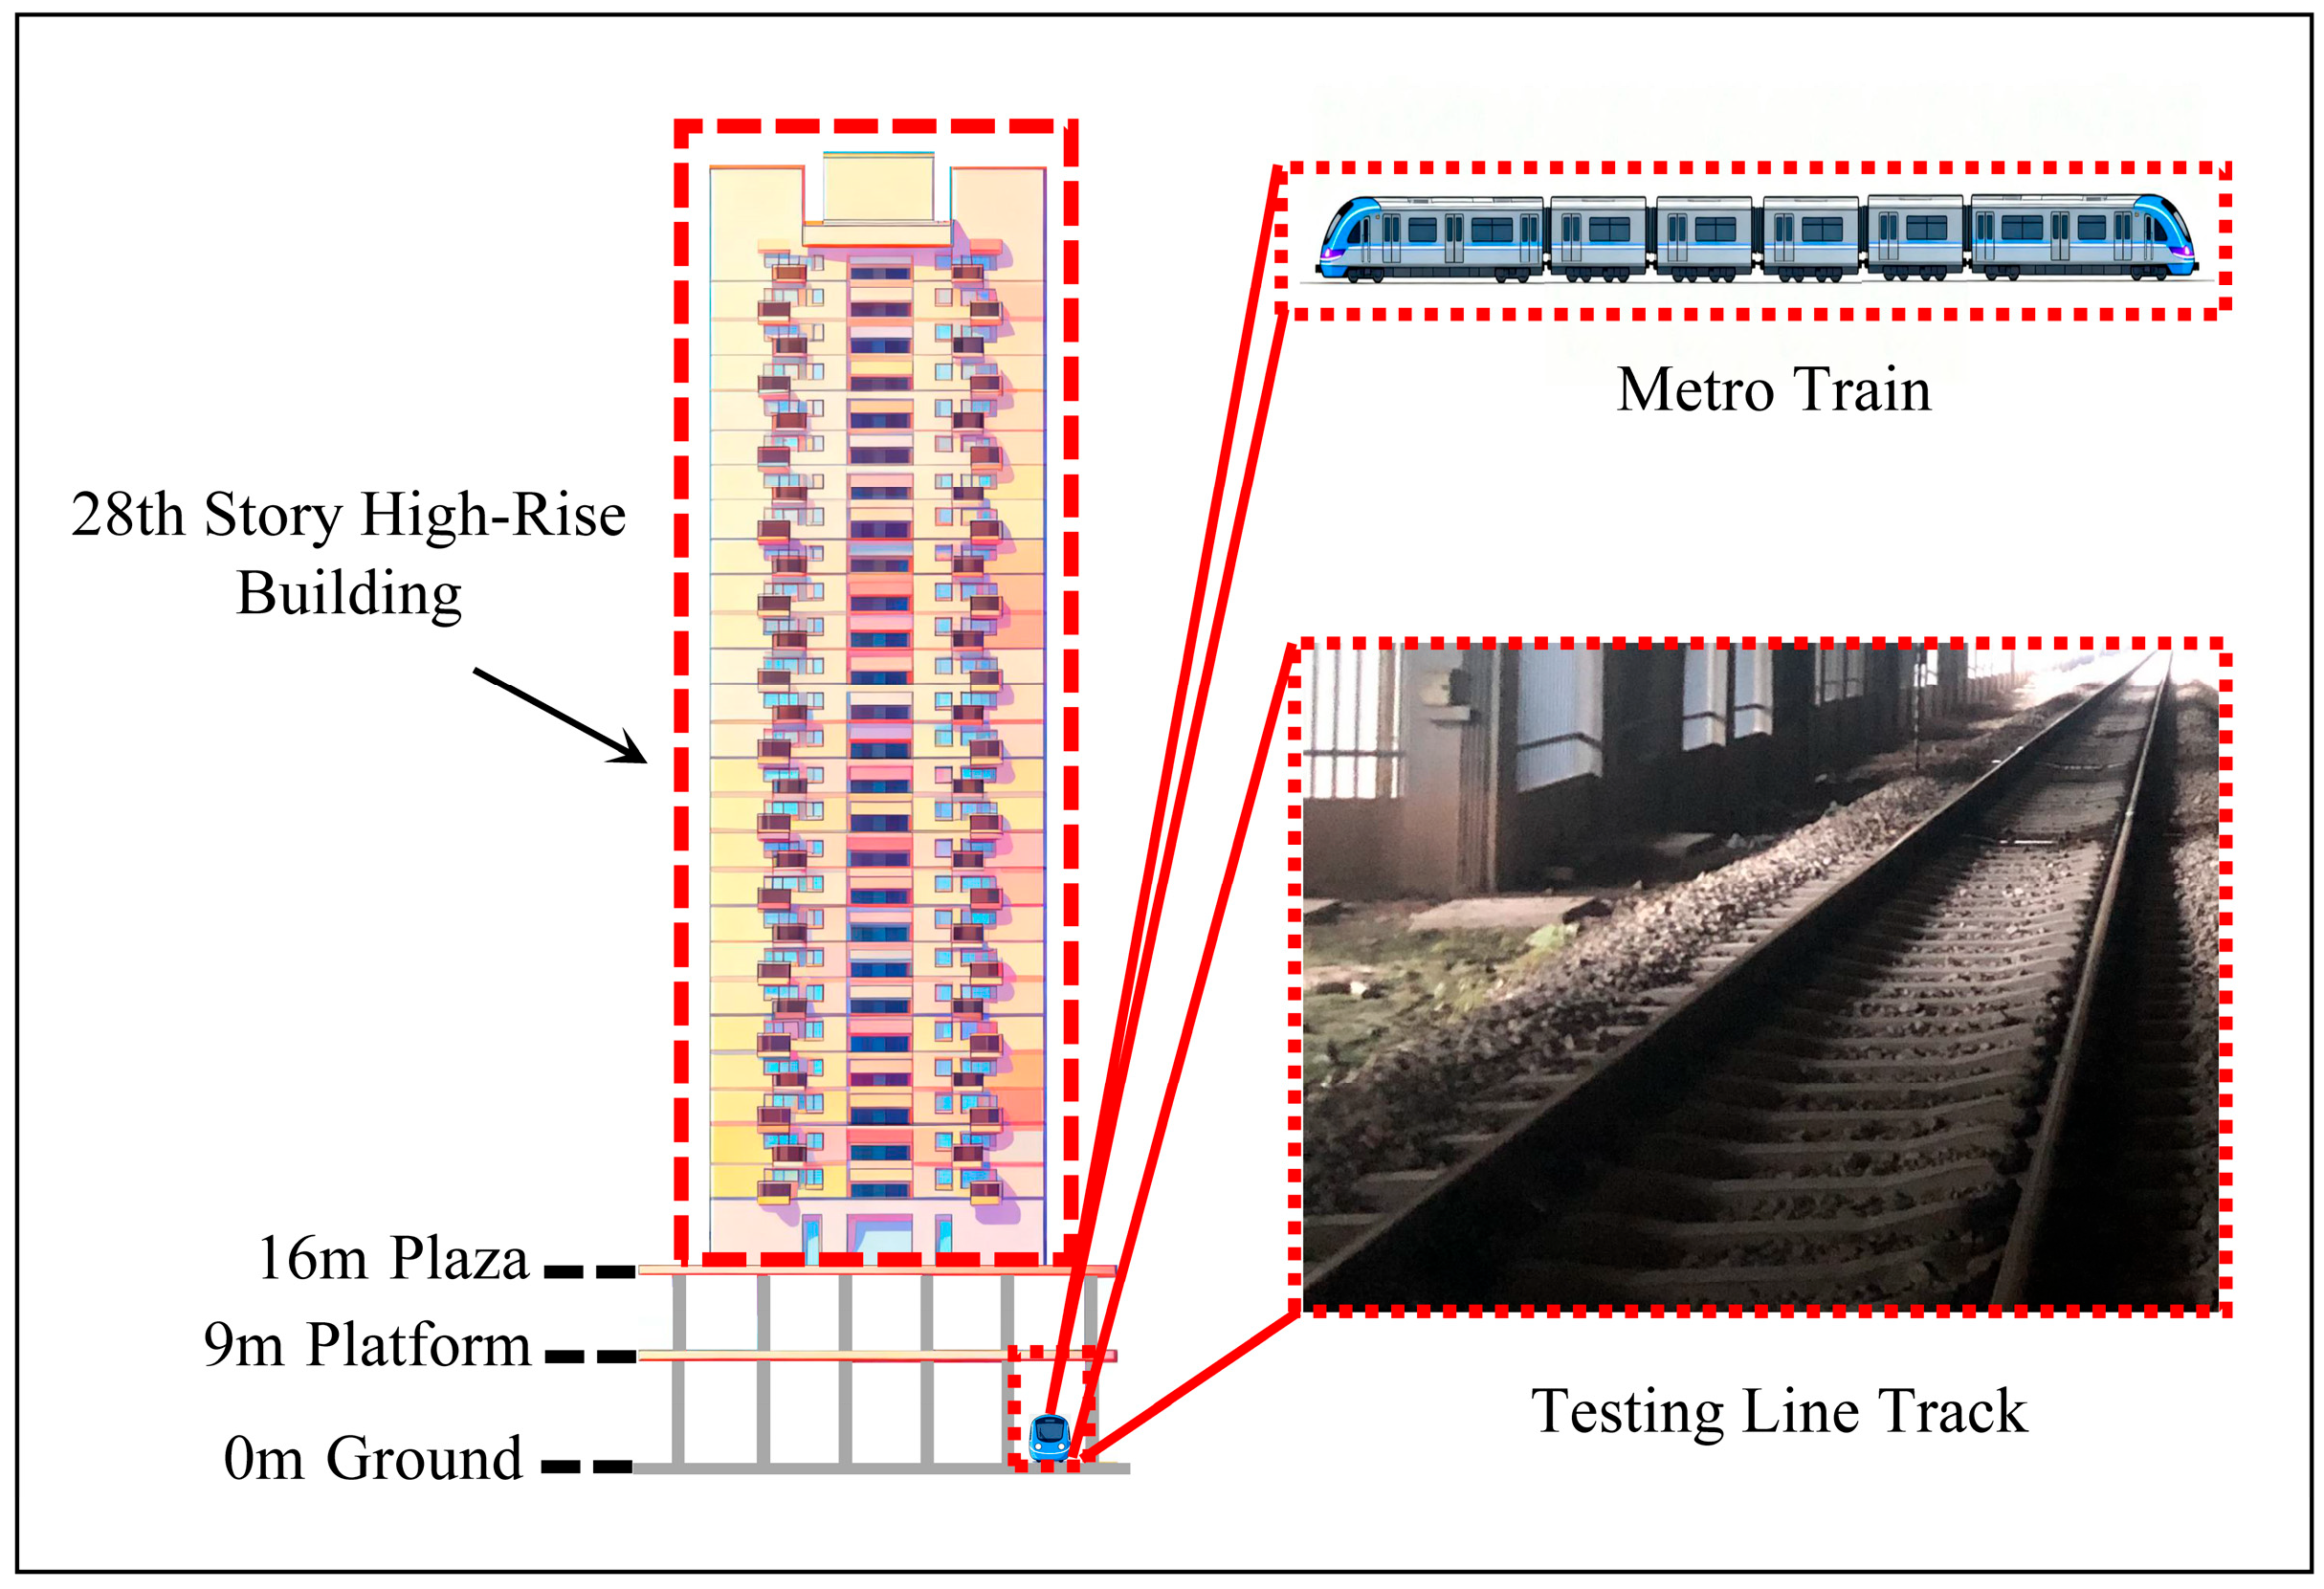
This section provides a detailed description of the test site. The elevation diagram of the spatial relationship between the test line and the high-rise building is shown in Figure 1.
Figure 1.
Elevation diagram of the spatial relationship between the test line and the high-rise building.
The test line consisted of a straight ballast track equipped with 60 kg/m continuous welded rails, concrete sleepers, a double-layer ballast bed, and elastic non-detachable rail fasteners, which together deliver excellent vibration damping performance. The width of the track structure was 4.3 m. The metro vehicle operating on this track was a Type A train comprising six 22 m long cars, each with a weight of 48,800 kg. During the experimental study, the maximum operating speed of the train was limited to 80 km/h. Given that the test line track was situated directly beneath the high-rise building and in close proximity to its supporting shear walls, the transmission of train-induced vibrations to the building structure warrants particular attention. Functionally, the level beginning at 9 m above ground is designated as the platform level, serving as a multi-functional zone. At 16 m above ground, the plaza level provides green space amenities. The test line is situated at ground level.
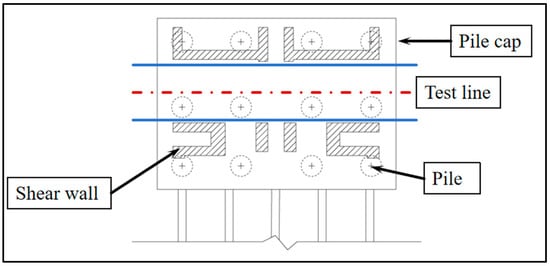
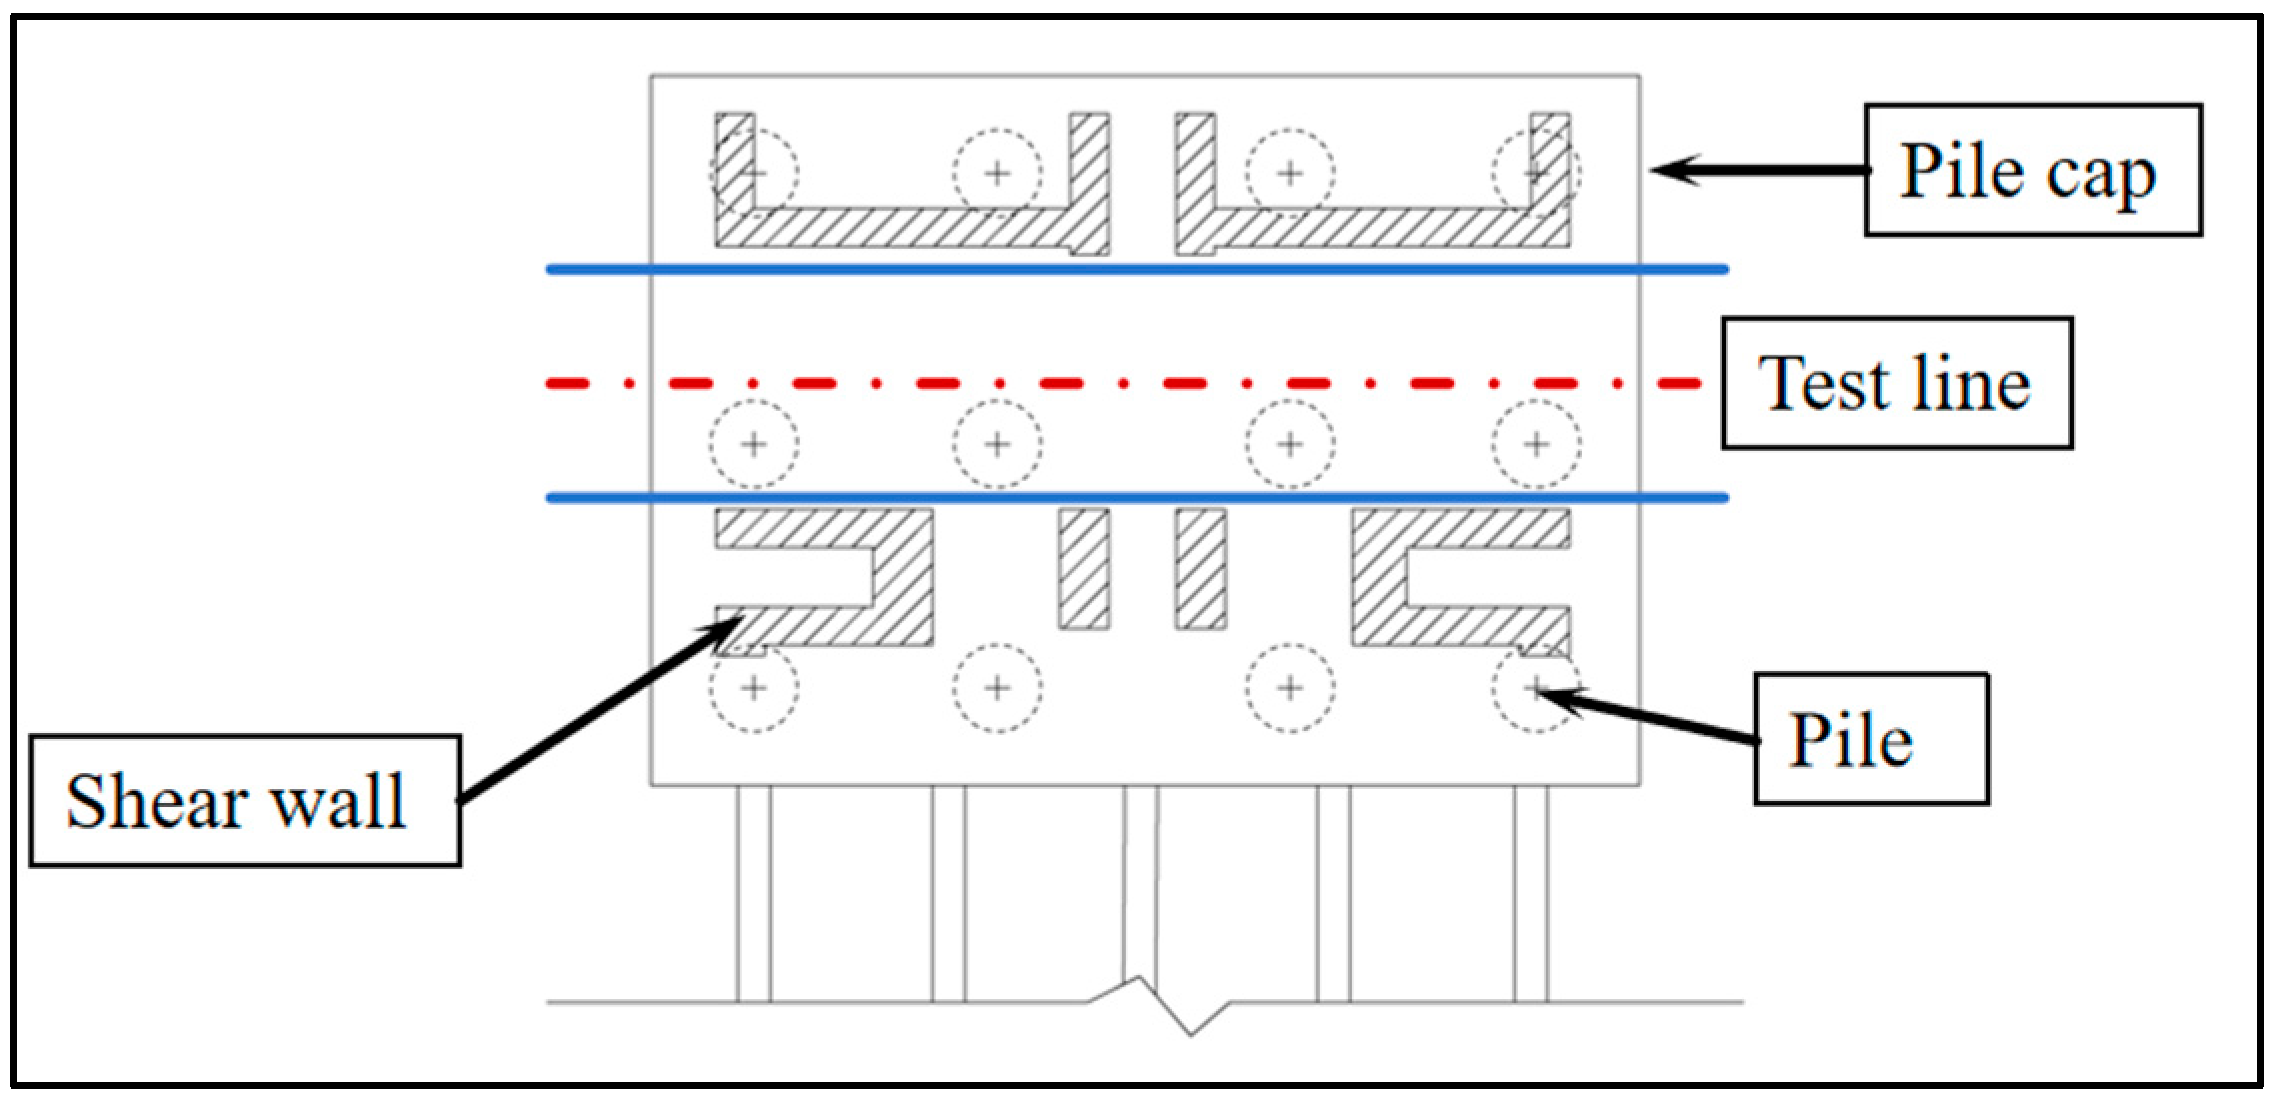
Figure 1 also illustrates the typical high-rise over-track building, which comprises 28 stories. The corresponding floor plan at the 0 m level, shown in Figure 2, demonstrates the spatial relationship between the deep foundations, shear walls, and test line. The building features a reinforced concrete load-bearing wall system supported by deep foundations with a pile diameter of 1.6 m. These piles are arranged in a grid pattern, spaced at 4.5 m parallel to the test track and 5.0 m in the perpendicular direction. The load-bearing shear walls extend continuously from foundation level to roof, constituting the primary structural support system for the high-rise building.
Figure 2.
Plan view of the test site.
3. Field Measurement
This section details the field investigation test plan, including measurement point layouts, instrumentation specifications, and signal processing procedures.
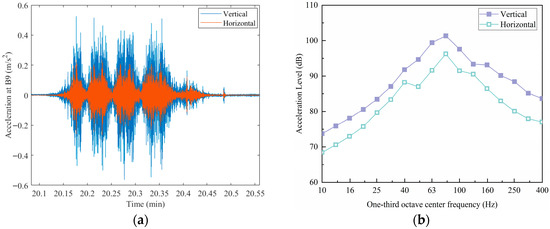
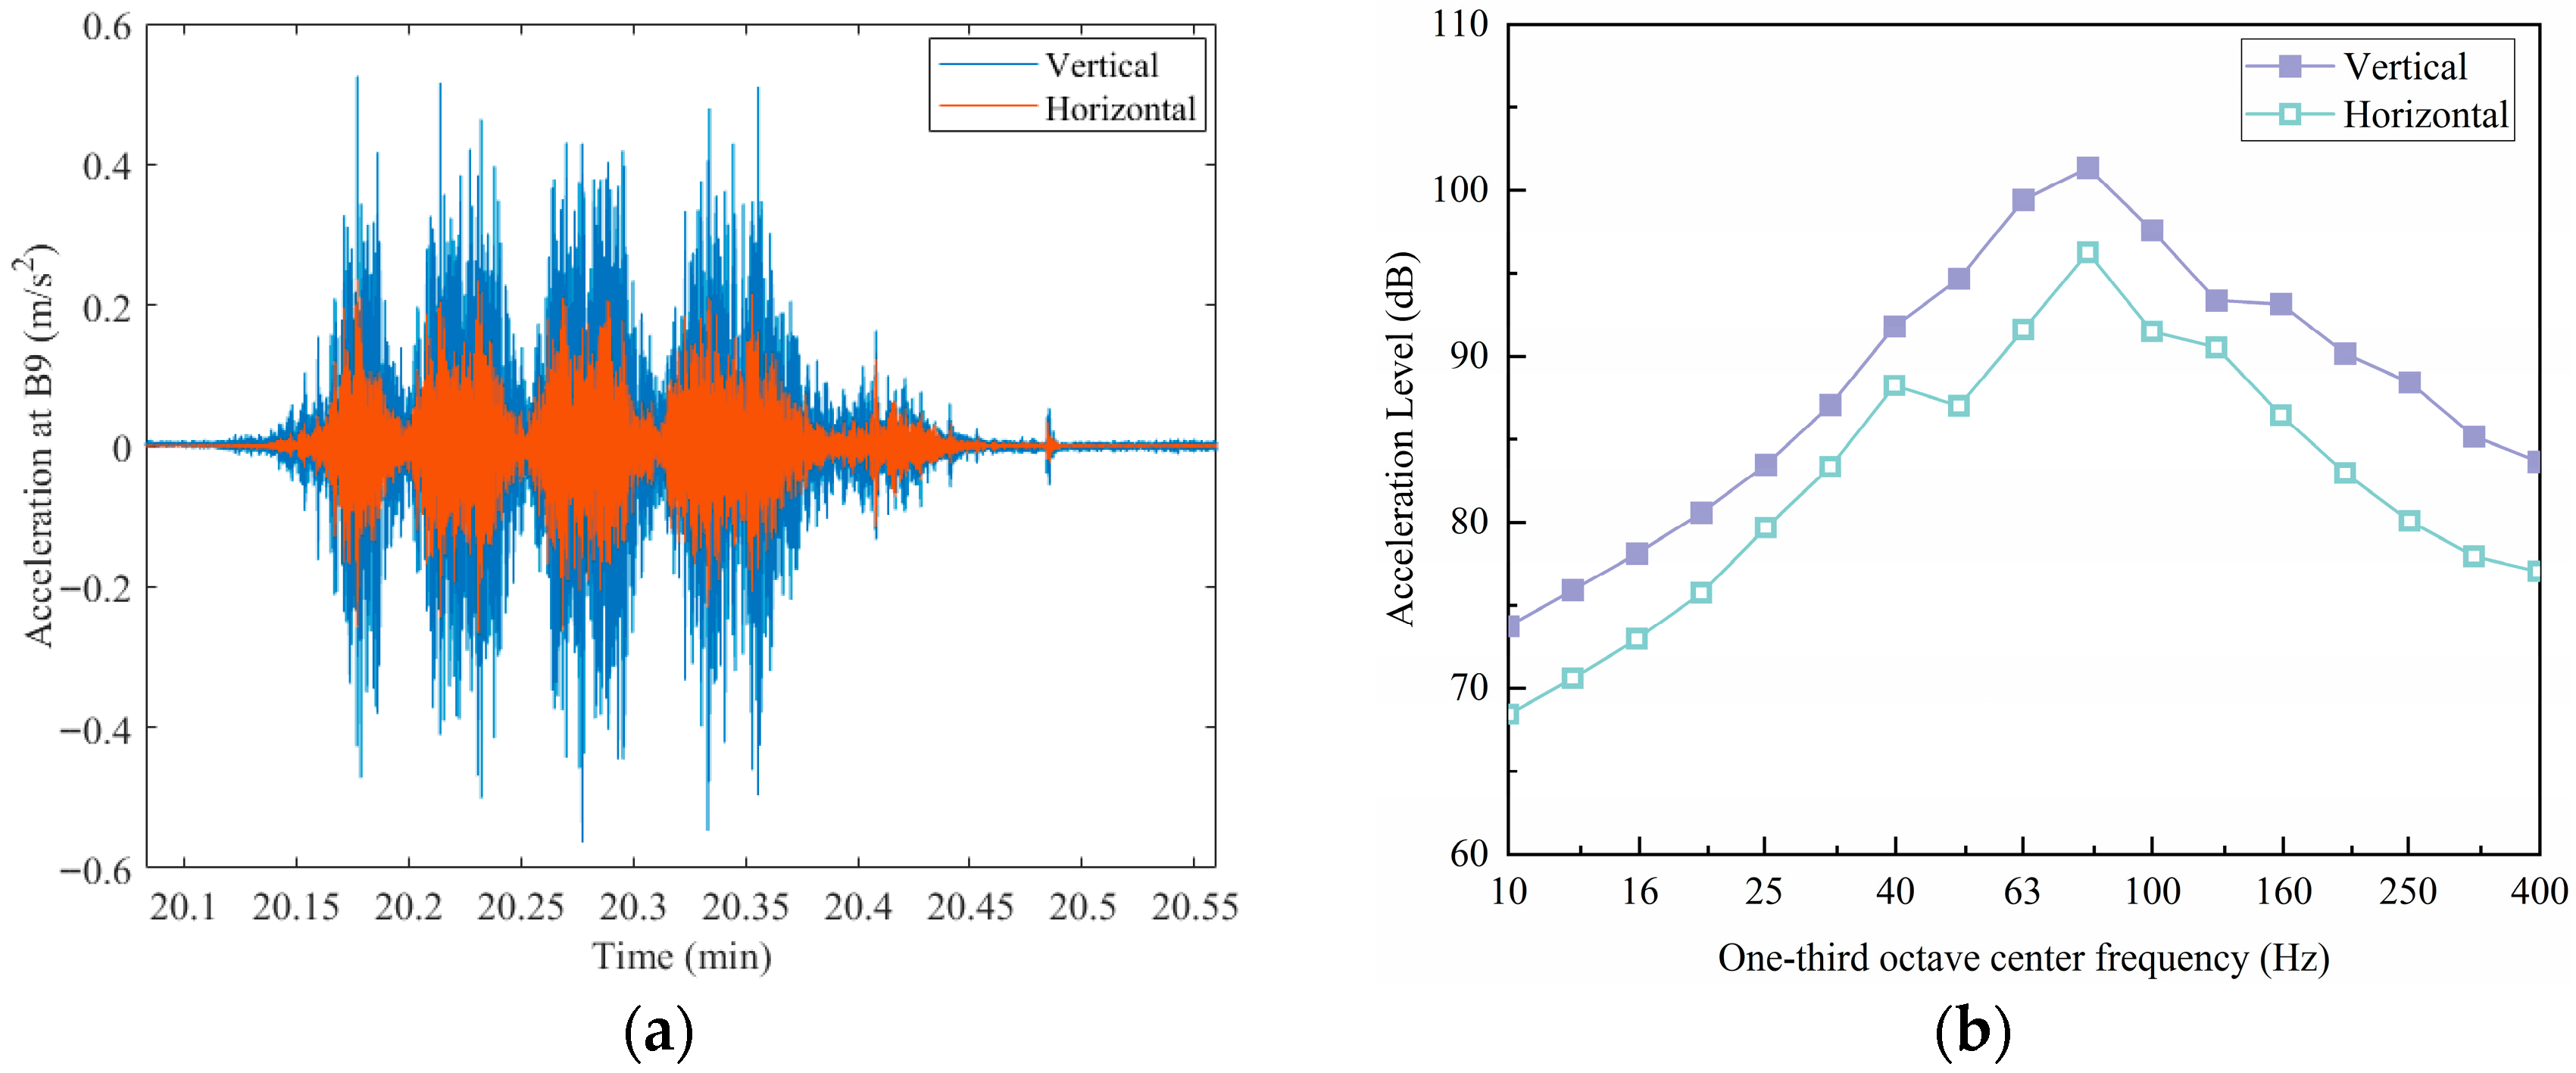
As illustrated in Figure 3, a comparison between the vertical and horizontal vibration acceleration levels in the free field indicates that the horizontal levels are 3–8 dB lower than the vertical levels across the one-third octave bands. In the dominant one-third octave band, the horizontal vibration acceleration level is 6.09 dB lower than the corresponding vertical level. Consequently, this study focuses primarily on vertical vibrations [21].
Figure 3.
Comparisons of vertical and horizontal vibrations in the free field. (a) Time-histories; (b) 1/3 octave band spectra.
3.1. Measurement Plan
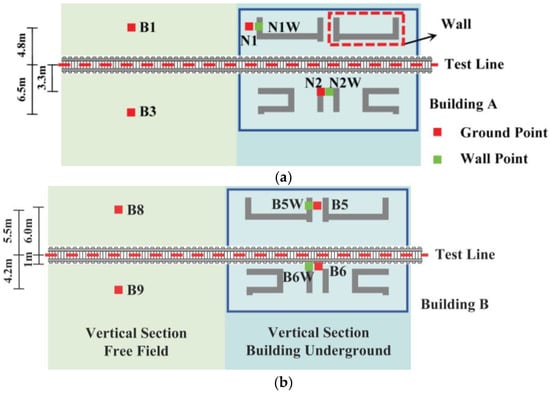
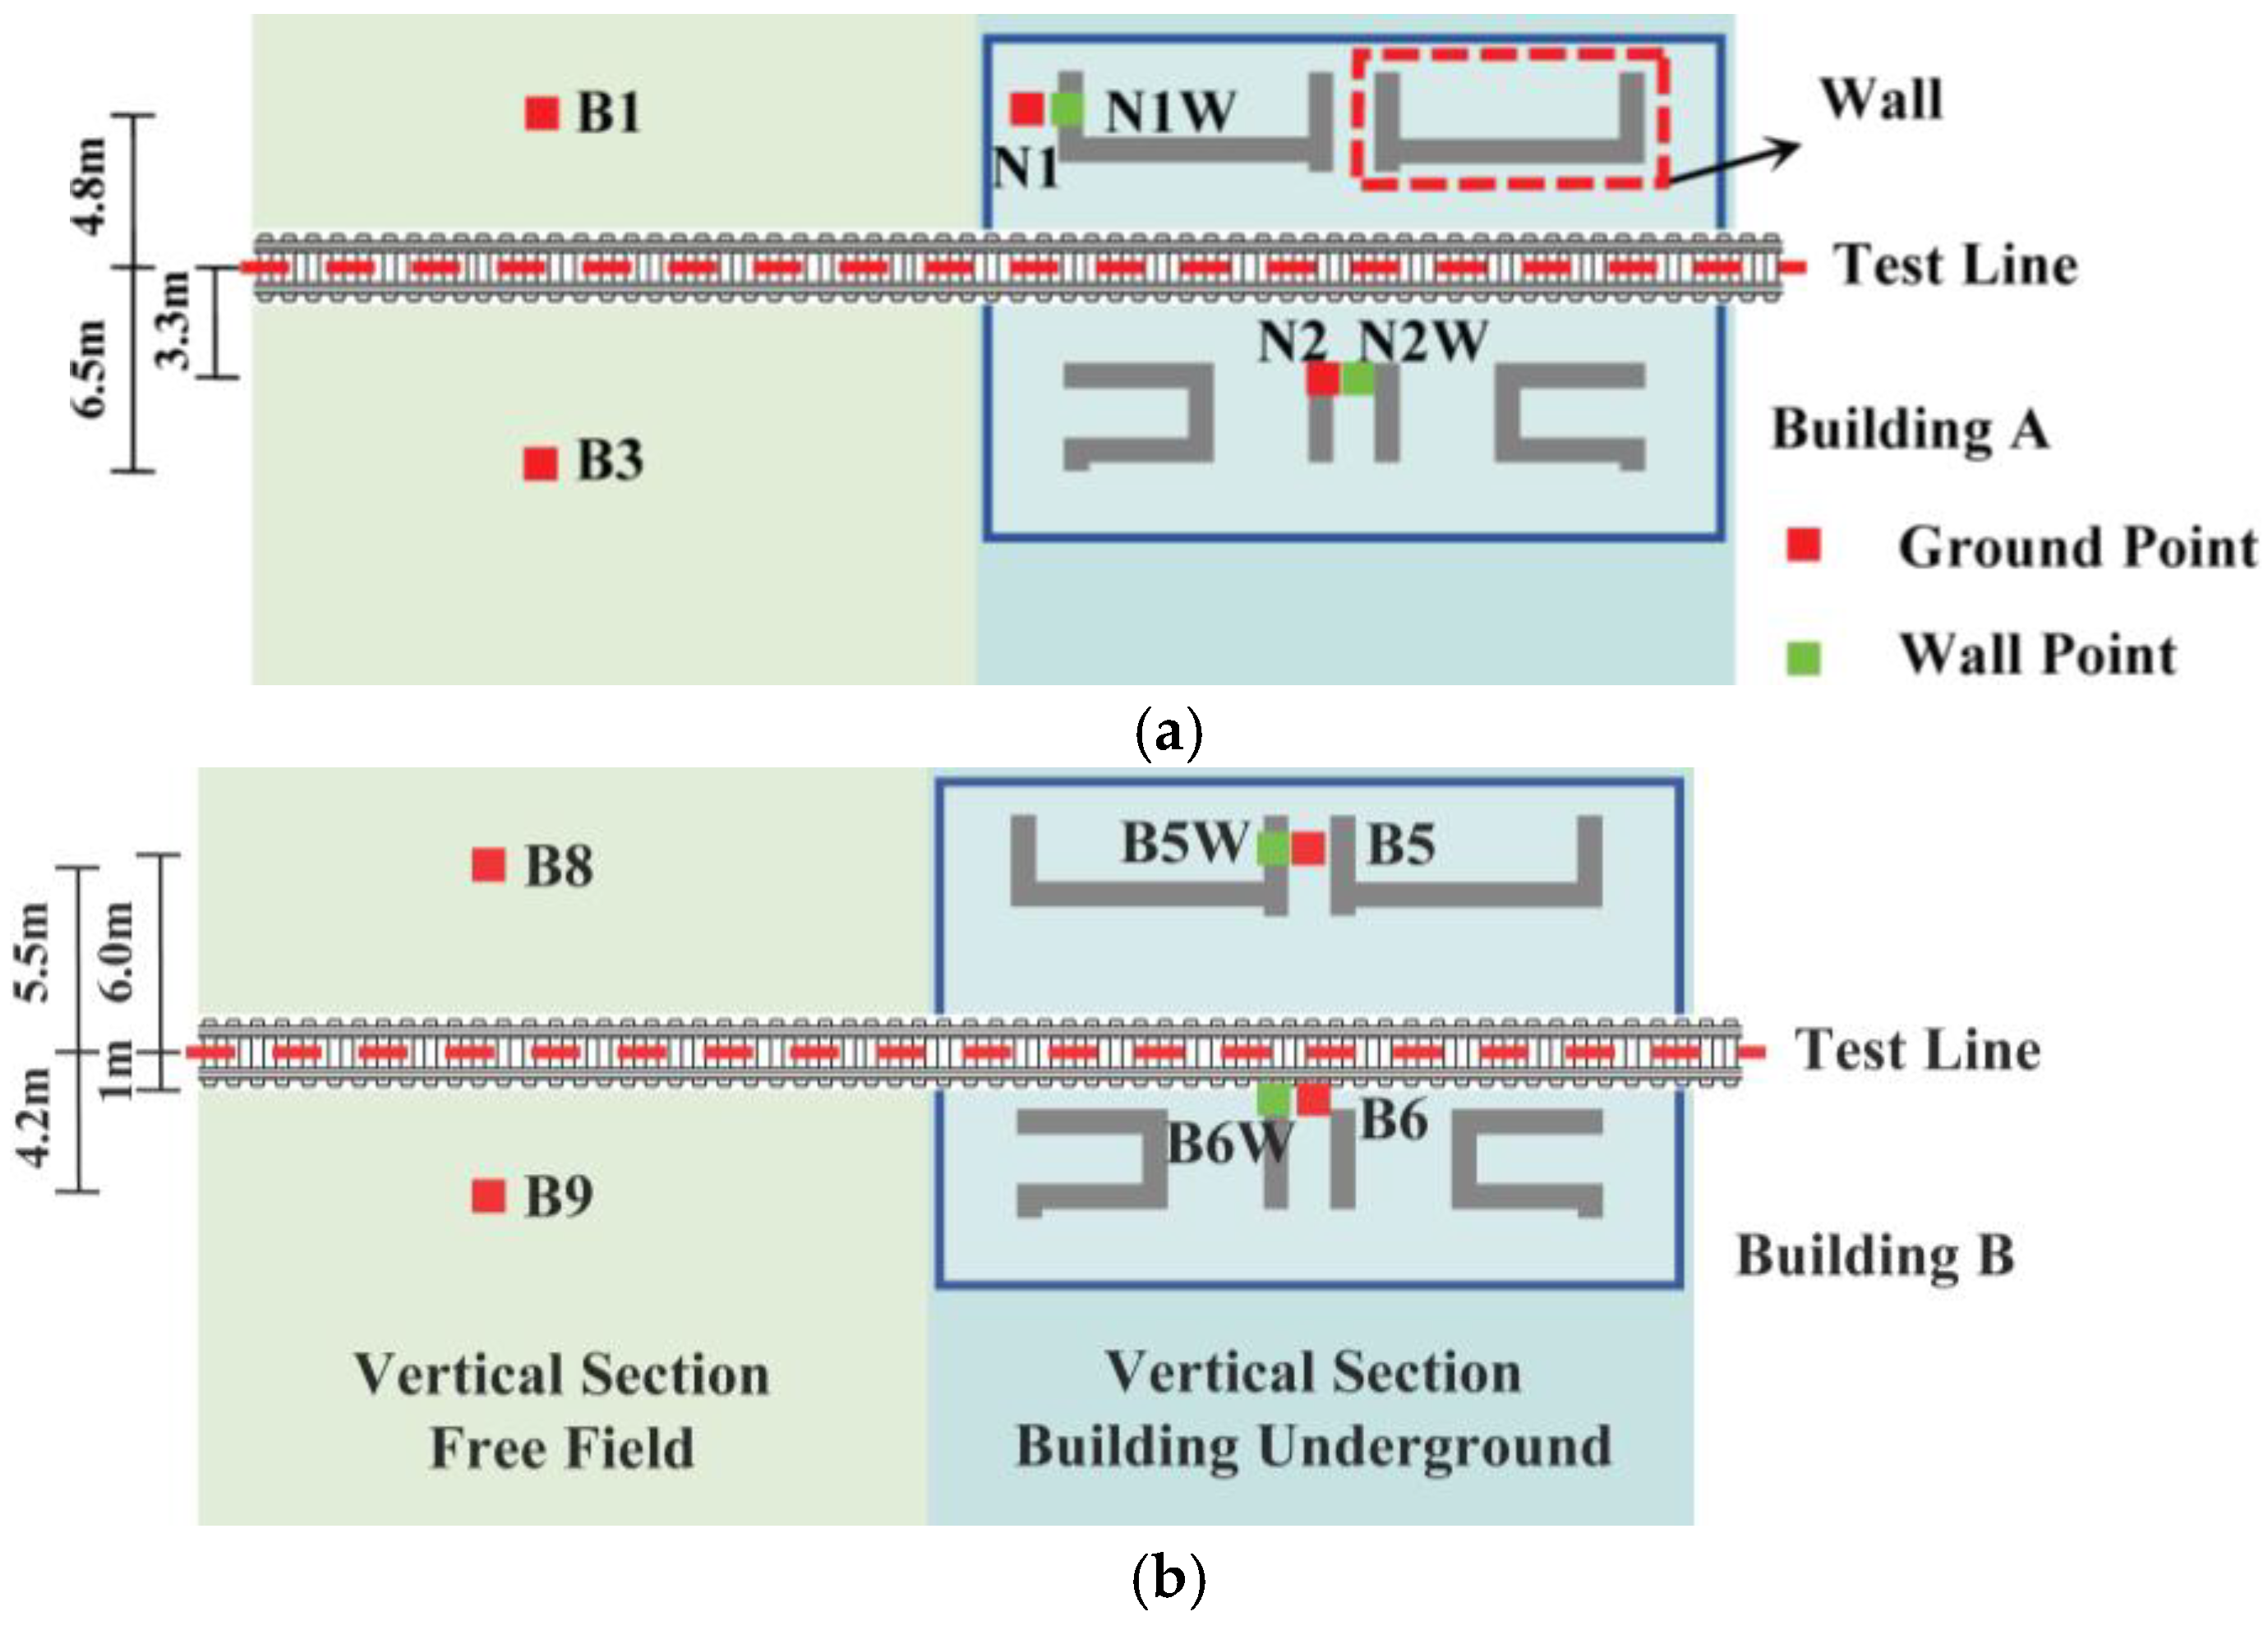
In this experimental study, two high-rise buildings along the test line were investigated. The building situated in the middle section of the test line, where trains operate in cruising mode, was designated as Building A. The building located at the end section, where trains undergo braking to a stop or accelerating upon departure, was designated as Building B. An identical empty train was operated repeatedly along the test line to collect vibration data. Figure 4 illustrates the measurement setups for both buildings. Accelerometers were installed at three types of locations: in the free field, on the ground above the building foundation, and at the bases of the shear walls. At the Building A site, ground measurement points included B1 and B3 in the free field, as well as N1 and N2 on the ground above the foundation. Shear wall points were designated N1W and N2W, with the suffix “W” indicating “Wall.” Similarly, at the Building B site, ground points comprised B8 and B9 in the free field, along with B5 and B6 above the foundation, while shear wall points were labeled B5W and B6W.
Figure 4.
Field measurement setups for Building A and Building B. (a) Setups for Building A: cruising section; (b) Setups for Building B: accelerating and braking section.
To provide a clear overview, Table 1 summarizes the train operating conditions, measurement locations, and the distance of each point from the track centerline. Among all measurement points, B3 was the farthest from the test line at a distance of 6.5 m, while B6 and B6W were the closest, both positioned 1.0 m from the track centerline.
Table 1.
Summary of measurement points.
3.2. Instrumentation and Train Operating Conditions
During the experimental study, data were recorded using a wireless data acquisition unit and a JM3873 acquisition system. The wireless unit was equipped with a built-in magnetoelectric accelerometer for vertical and horizontal measurements, and it supported an external third accelerometer. It featured 1 GB of storage capacity and a time synchronization accuracy of 1 ms. The sampling frequency used in this study was set at 1024 Hz, which, in accordance with the Nyquist theorem, supports a maximum analyzable frequency of 512 Hz [18]. For each measurement section, a total of six train passages were recorded and designated as P1 through P6. Data collection at all measurement points within each test section was synchronized.
Train speeds and their variations for the six passages in the cruising section are summarized in Table 2. The train cruising speed was derived from the time histories of vibration signals recorded at each measurement point, combined with the known train length. For each passage, the inversely calculated speeds from the four measurement points were averaged. The resulting standard deviation and coefficient of variation (COV) across the six recorded passages were 0.26 and 1.74%, respectively.
Table 2.
Train cruising speed for the measured train passages.
Similarly, in the acceleration and braking test section, the kinematic acceleration for each train passage was determined by first computing it at each measurement point and then averaging the results. This calculation was based on the average rate of velocity change during acceleration from standstill to cruising speed or deceleration from cruising to a full stop. As summarized in Table 3, kinematic acceleration values are presented in m/s2, with positive values corresponding to acceleration and negative values to braking. Passages P1, P3, and P5 represent braking conditions, whereas P2, P4, and P6 represent acceleration conditions. The kinematic acceleration magnitudes during train acceleration were observed to be slightly greater than those recorded during braking.
Table 3.
Kinematic accelerations for the measured train passages.
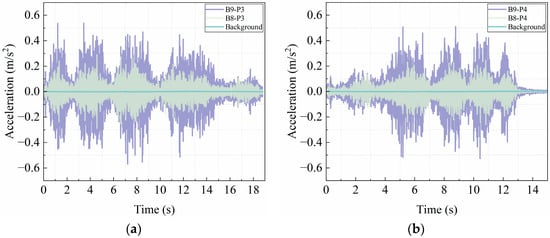
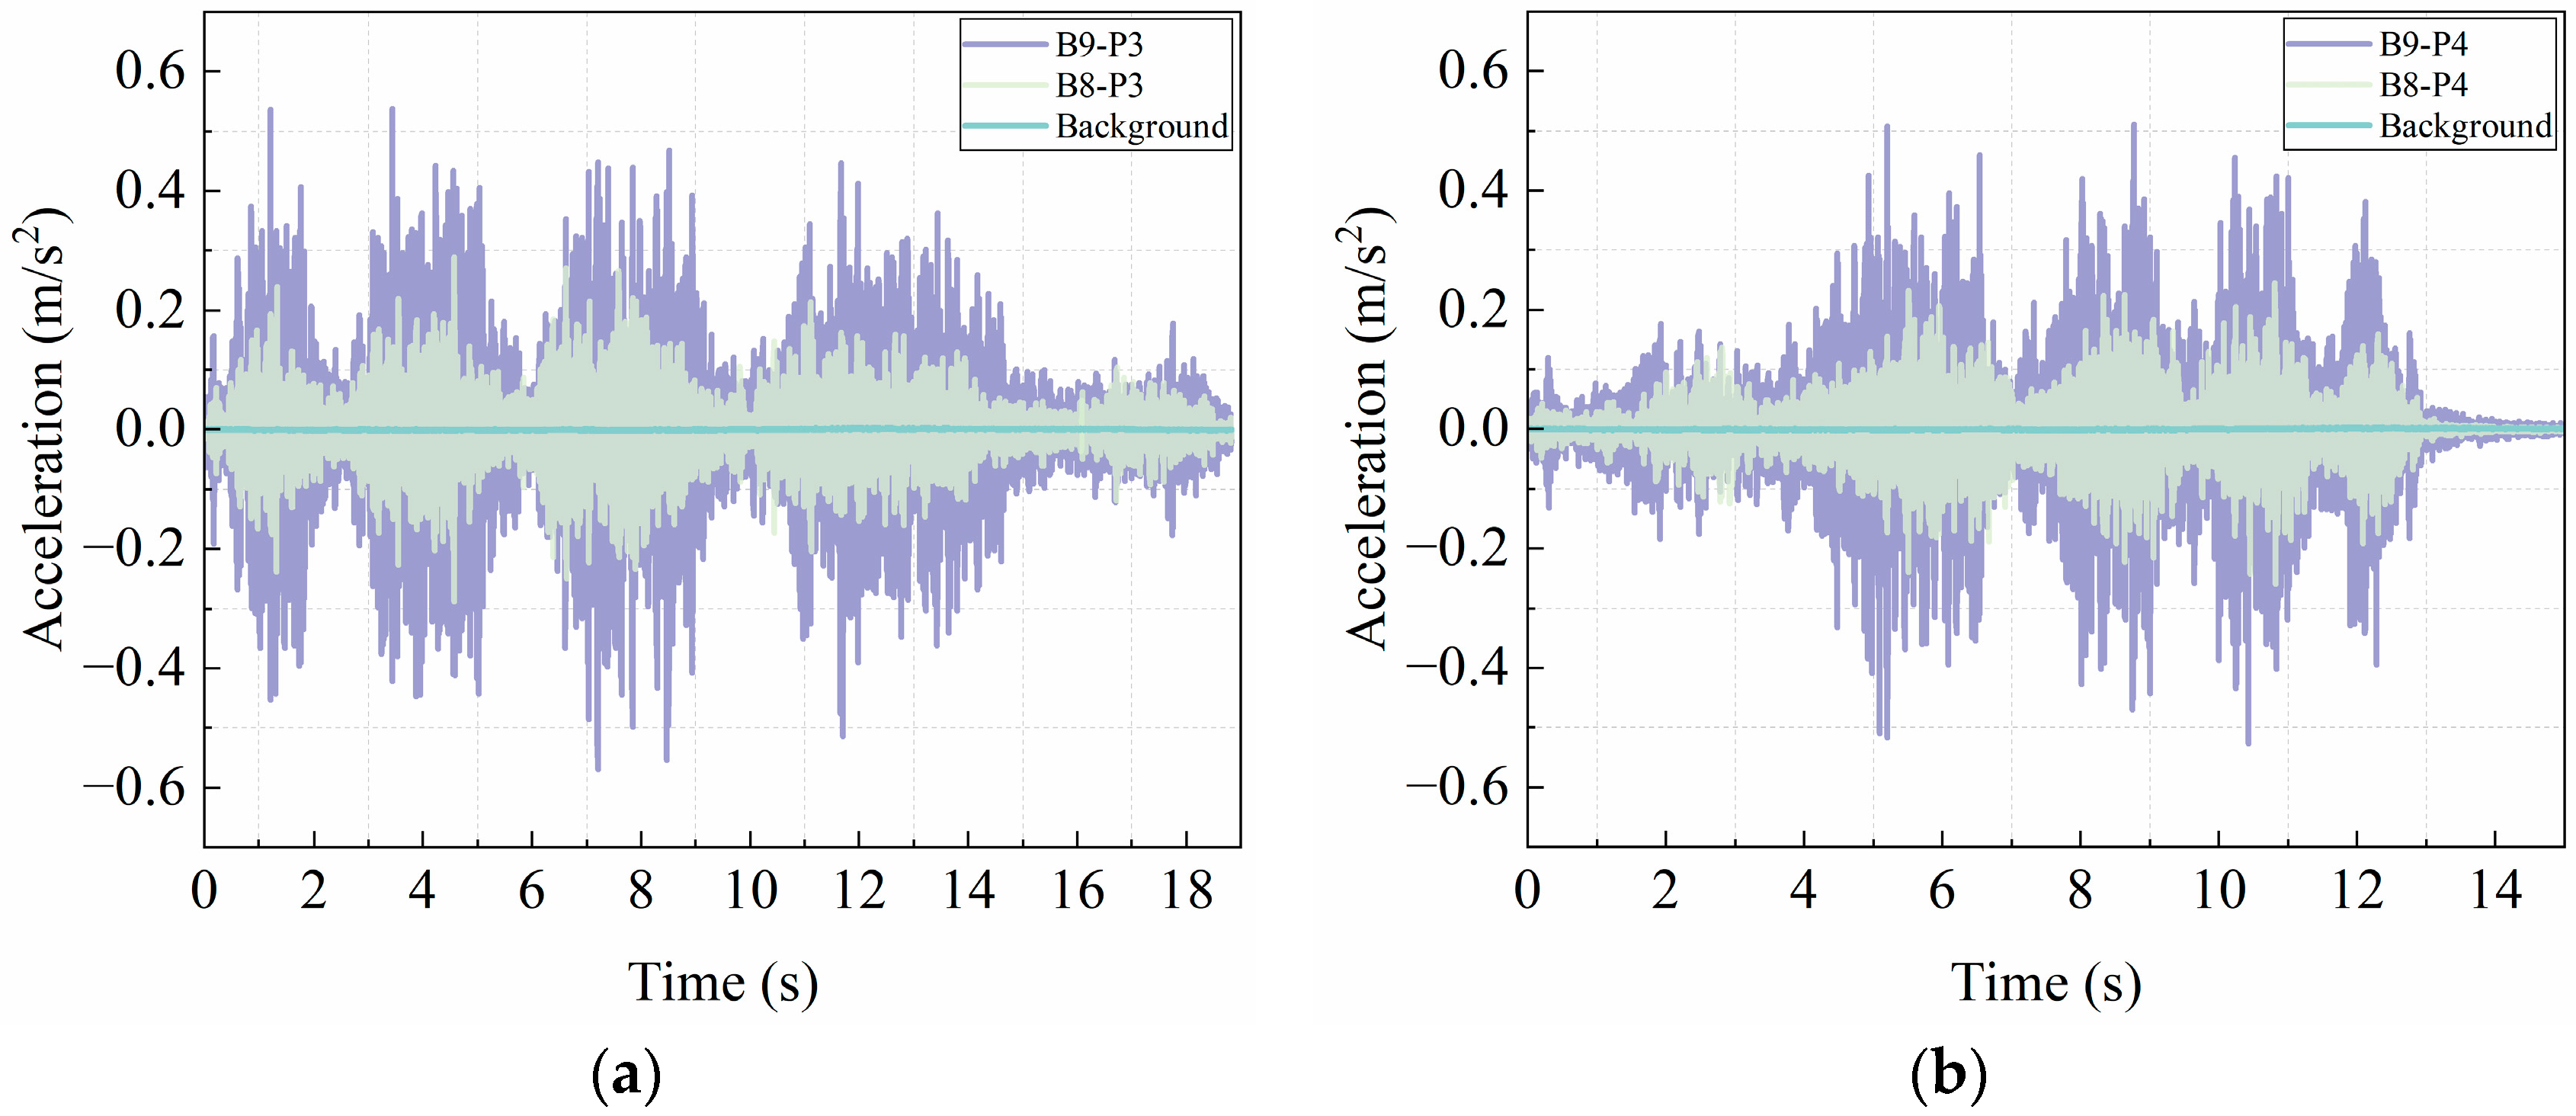
Figure 5 displays the time histories of vertical vibrations recorded at points B8 and B9, located 5.5 m and 4.2 m from the track, respectively. Figure 5a corresponds to passage P3 under braking conditions with an average kinematic acceleration of −0.63 m/s2, while Figure 5b represents passage P4 during acceleration with 0.95 m/s2. The waveforms clearly reflect the corresponding operational behaviors: for example, in Figure 5b, the train accelerates from standstill and reaches a constant speed of 9.63 m/s by t = 9 s. Vibration amplitudes at B9 exceed those at B8, consistent with its closer proximity to the track. The recorded signals exhibit high signal-to-noise ratio, confirming the reliability of the acquired data.
Figure 5.
Time histories of vertical vibrations at B8 and B9 in the free field during accelerating and braking. (a) Braking passage P3; (b) Accelerating passage P4.
4. Discussion
This section presents the analysis and discussion of field measurement results, focusing on characterizing train-induced vibrations at the two test sections under different operational conditions and examining vibration transmission from the ground to the shear walls of the high-rise over-track building. For clarity, the results are organized as follows: Section 4.1 discusses train-induced vibrations at the ground surface, Section 4.2 analyzes vibrations on the shear walls, and Section 4.3 examines the vibration transmission loss from ground to shear wall.
4.1. Vibrations at Ground Surface
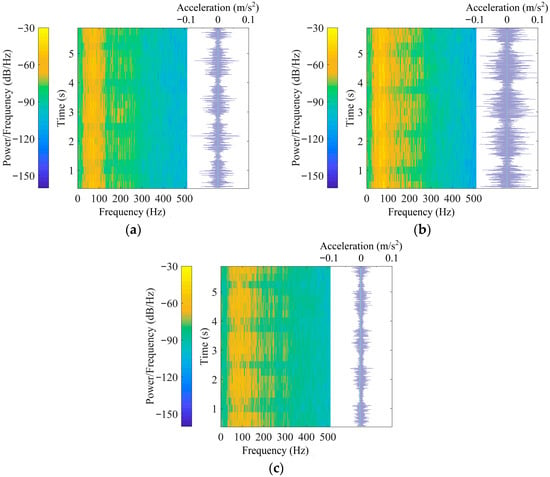
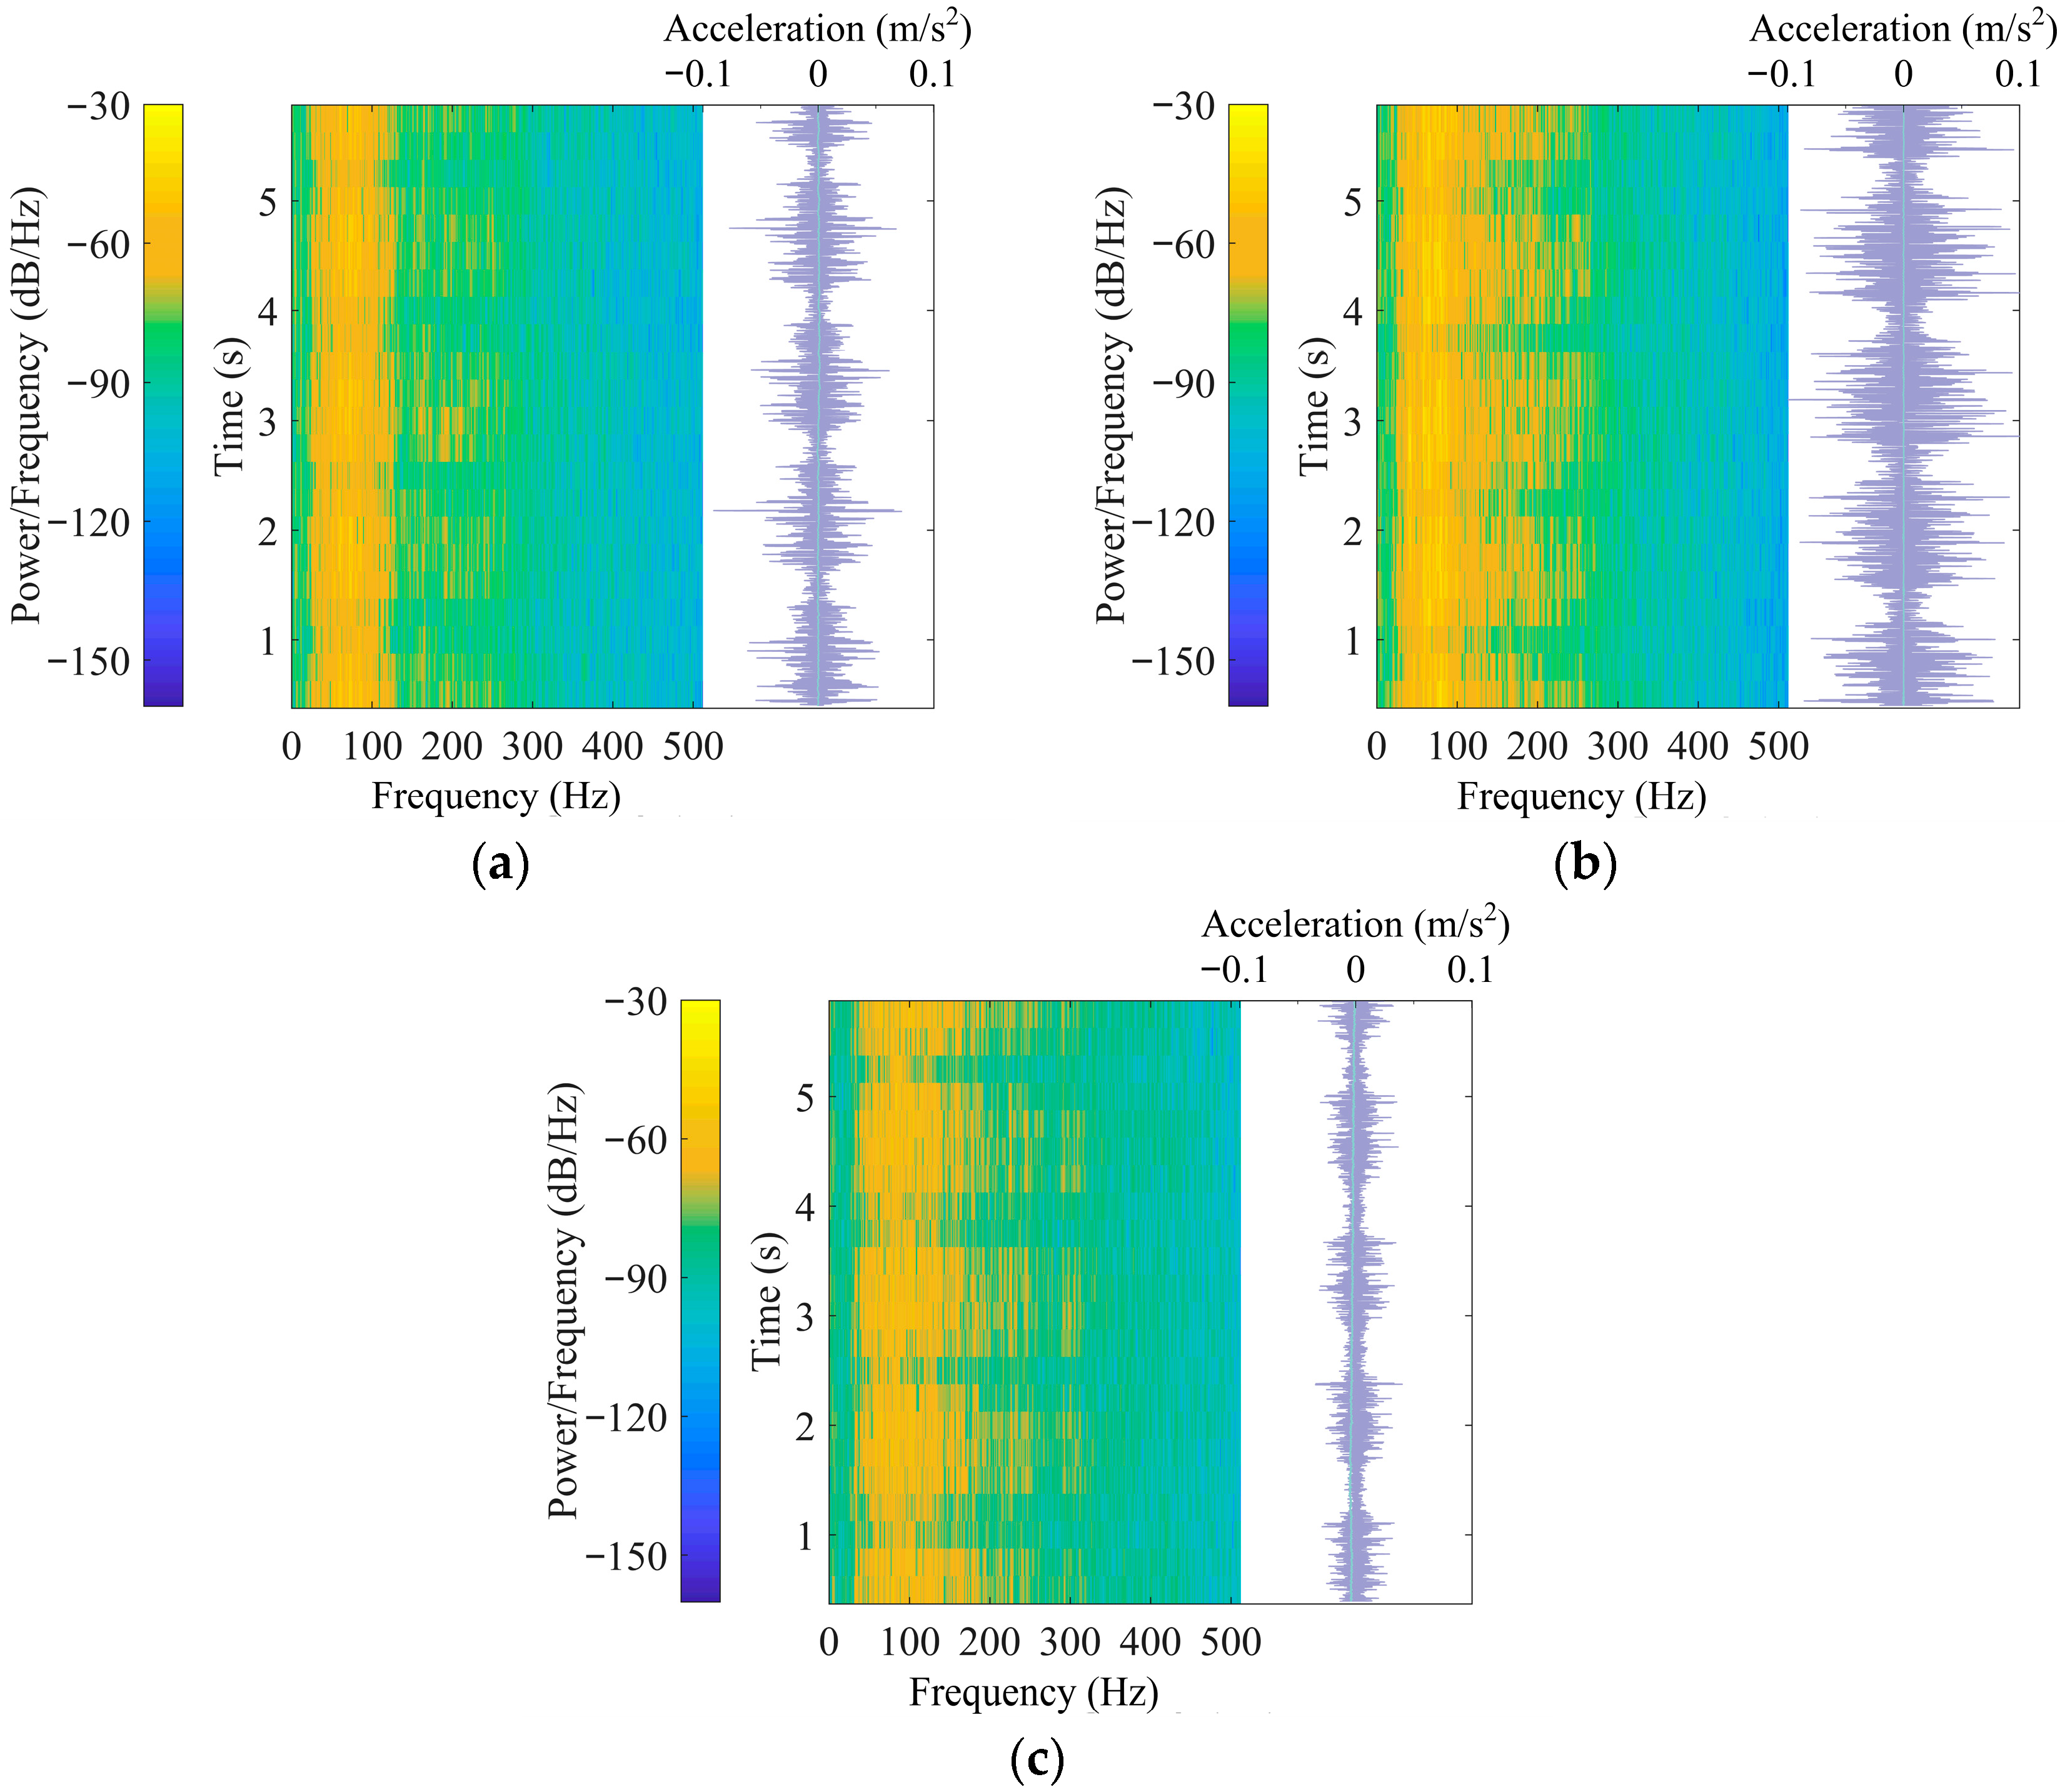
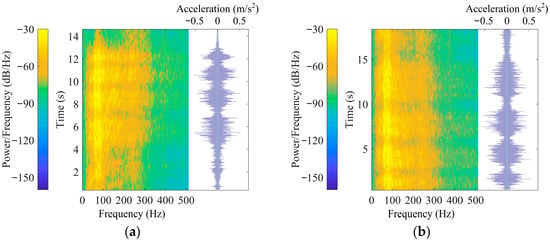
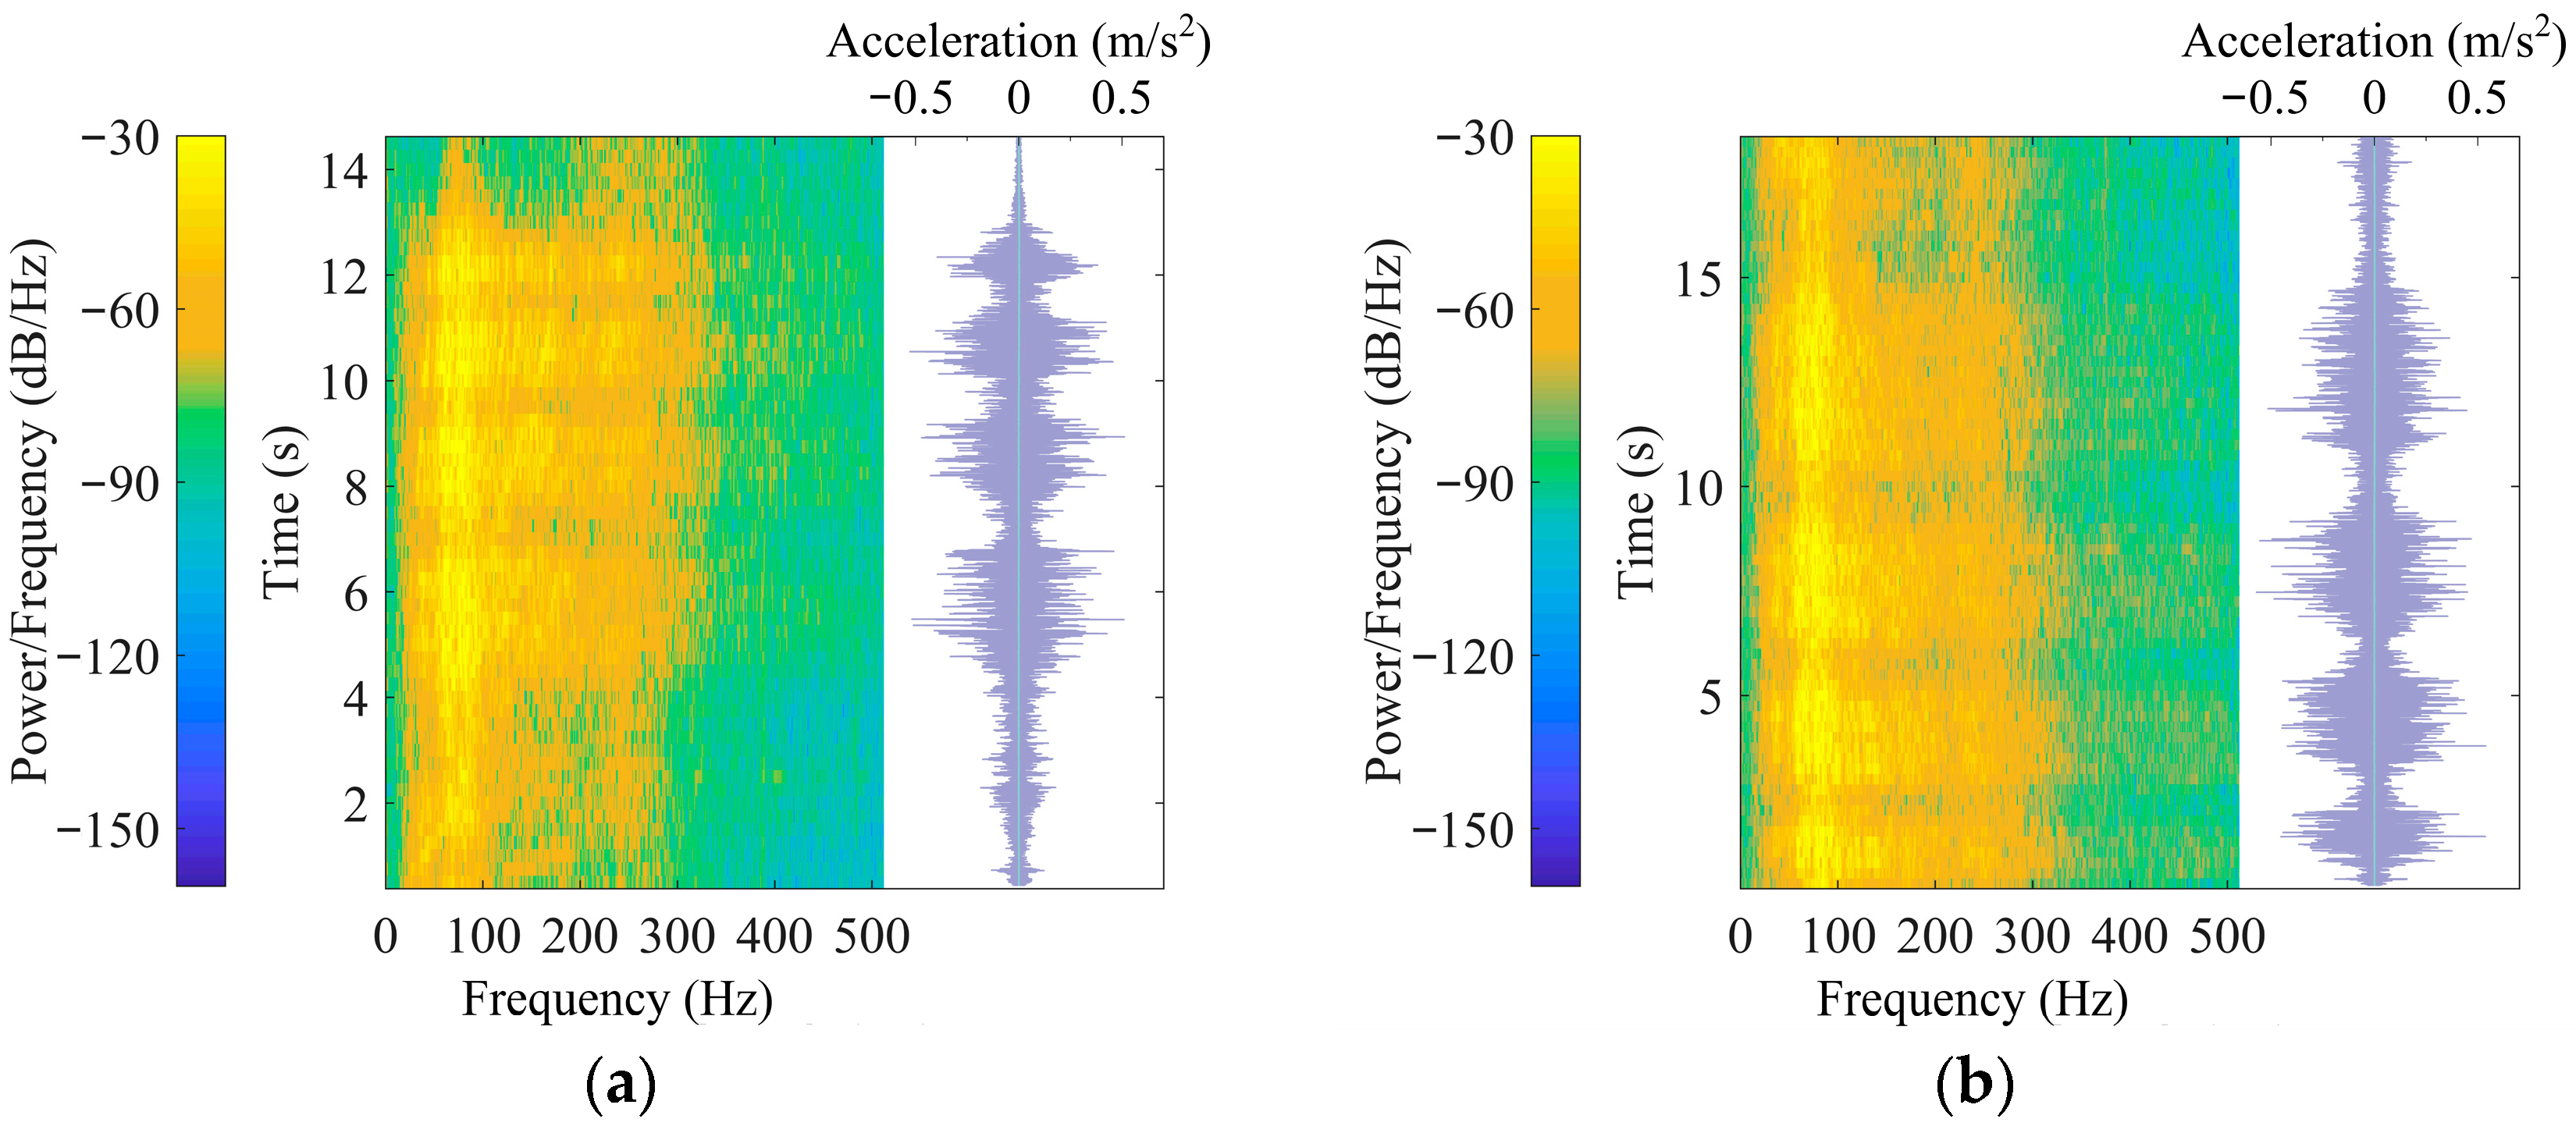
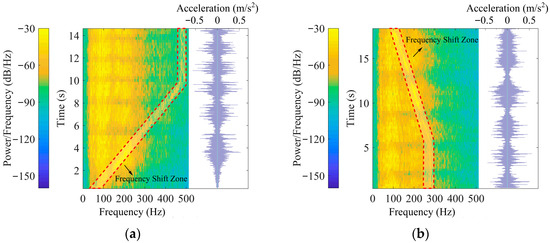
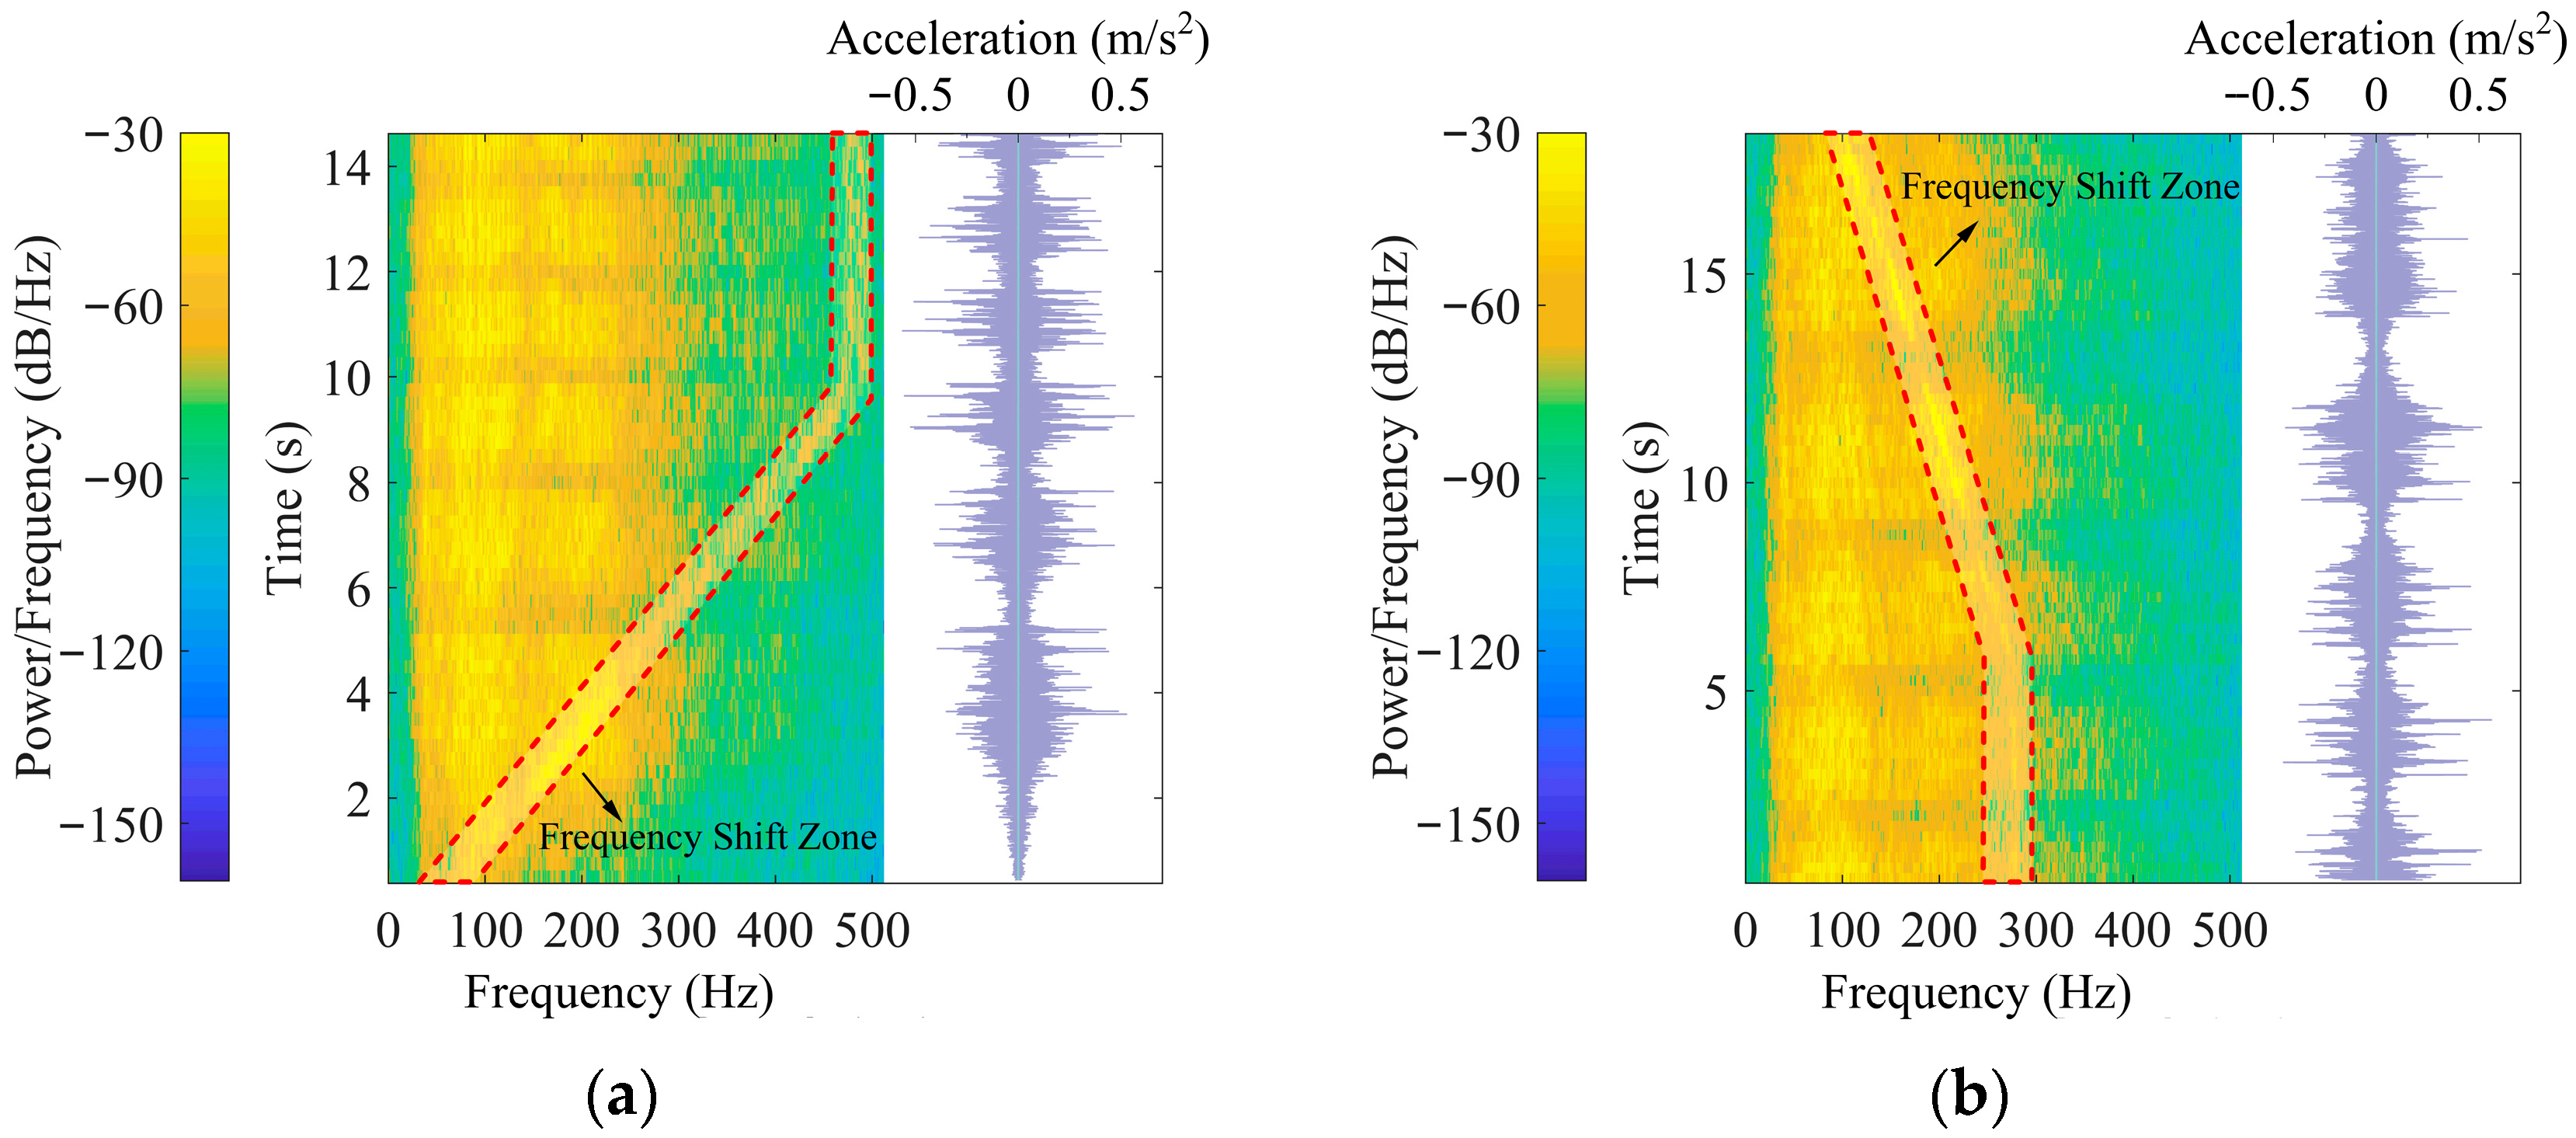
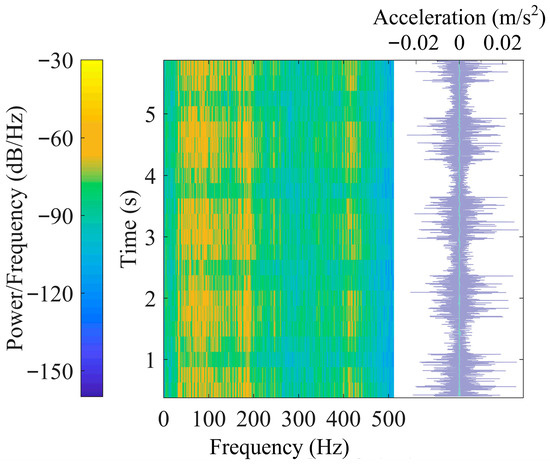
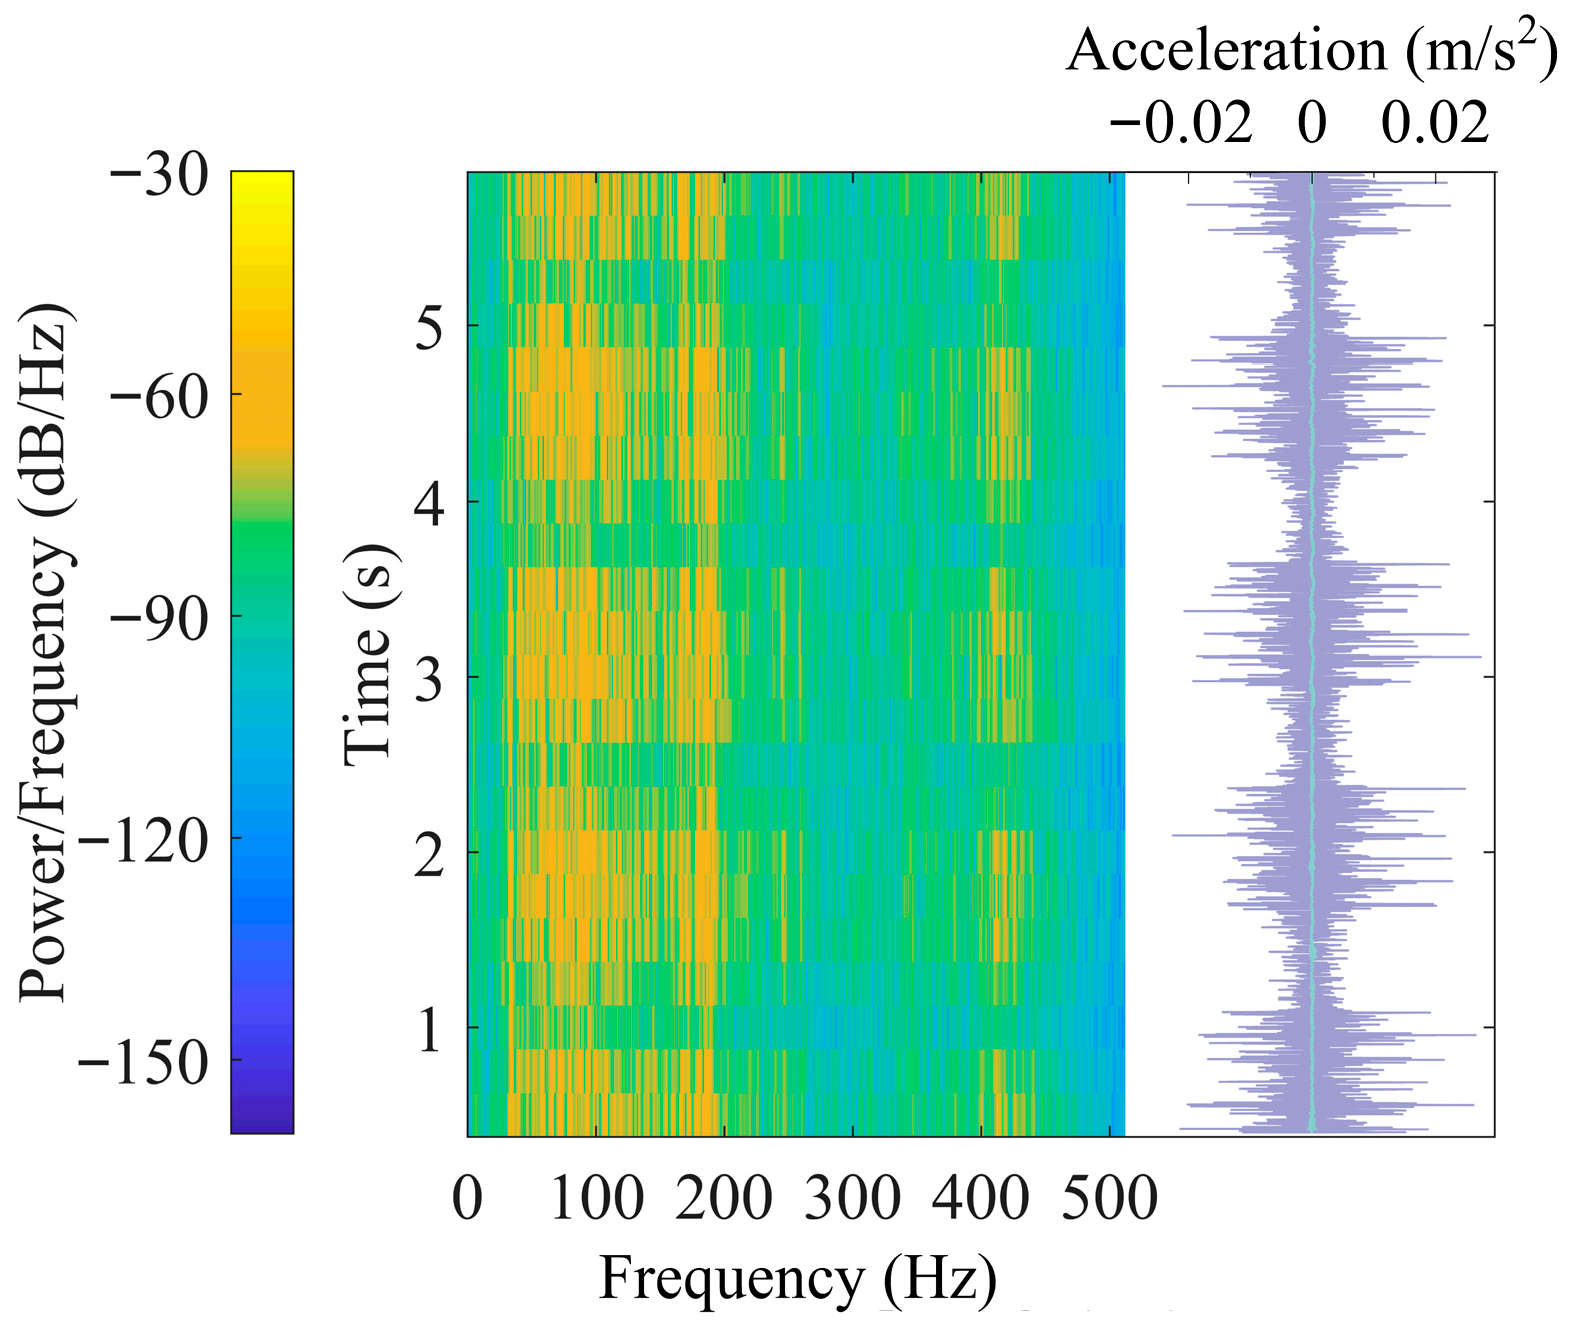
Figure 6, Figure 7 and Figure 8 presents the short-time Fourier spectra and corresponding time histories of vibrations measured at the ground surface. The analysis parameters were selected as follows: a Blackman window with a length of 1024 samples, 1024 FFT points, and an overlap of 768 samples. This configuration yields a frequency resolution of 1.0 Hz and a temporal resolution of 0.25 s. In all subplots, the left side shows the time-frequency representation, while the right side displays the vibration time history. For the time-frequency graphs, the horizontal axis denotes frequency (0–512 Hz), with the color bar on the left indicating the power spectral density (PSD) amplitude. The vertical axis represents time, progressing from bottom to top. In the time history plots, the top horizontal axis indicates the vertical acceleration amplitude, and the vertical axis shares the same temporal scale as the corresponding time-frequency graph.
Figure 6.
Short-time Fourier spectra and time histories of vibrations at ground surface (cruising). (a) Point B3 (P1): 6.5 m away; (b) Point B1 (P1): 4.8 m away; (c) Point N2 (P1): 3.3 m away.
Figure 7.
Short-time Fourier spectra and time histories of vibrations at B9 (4.2 m away from track). (a) Accelerating (P2): 1.02 m/s2; (b) Braking (P1): −0.56 m/s2.
Figure 8.
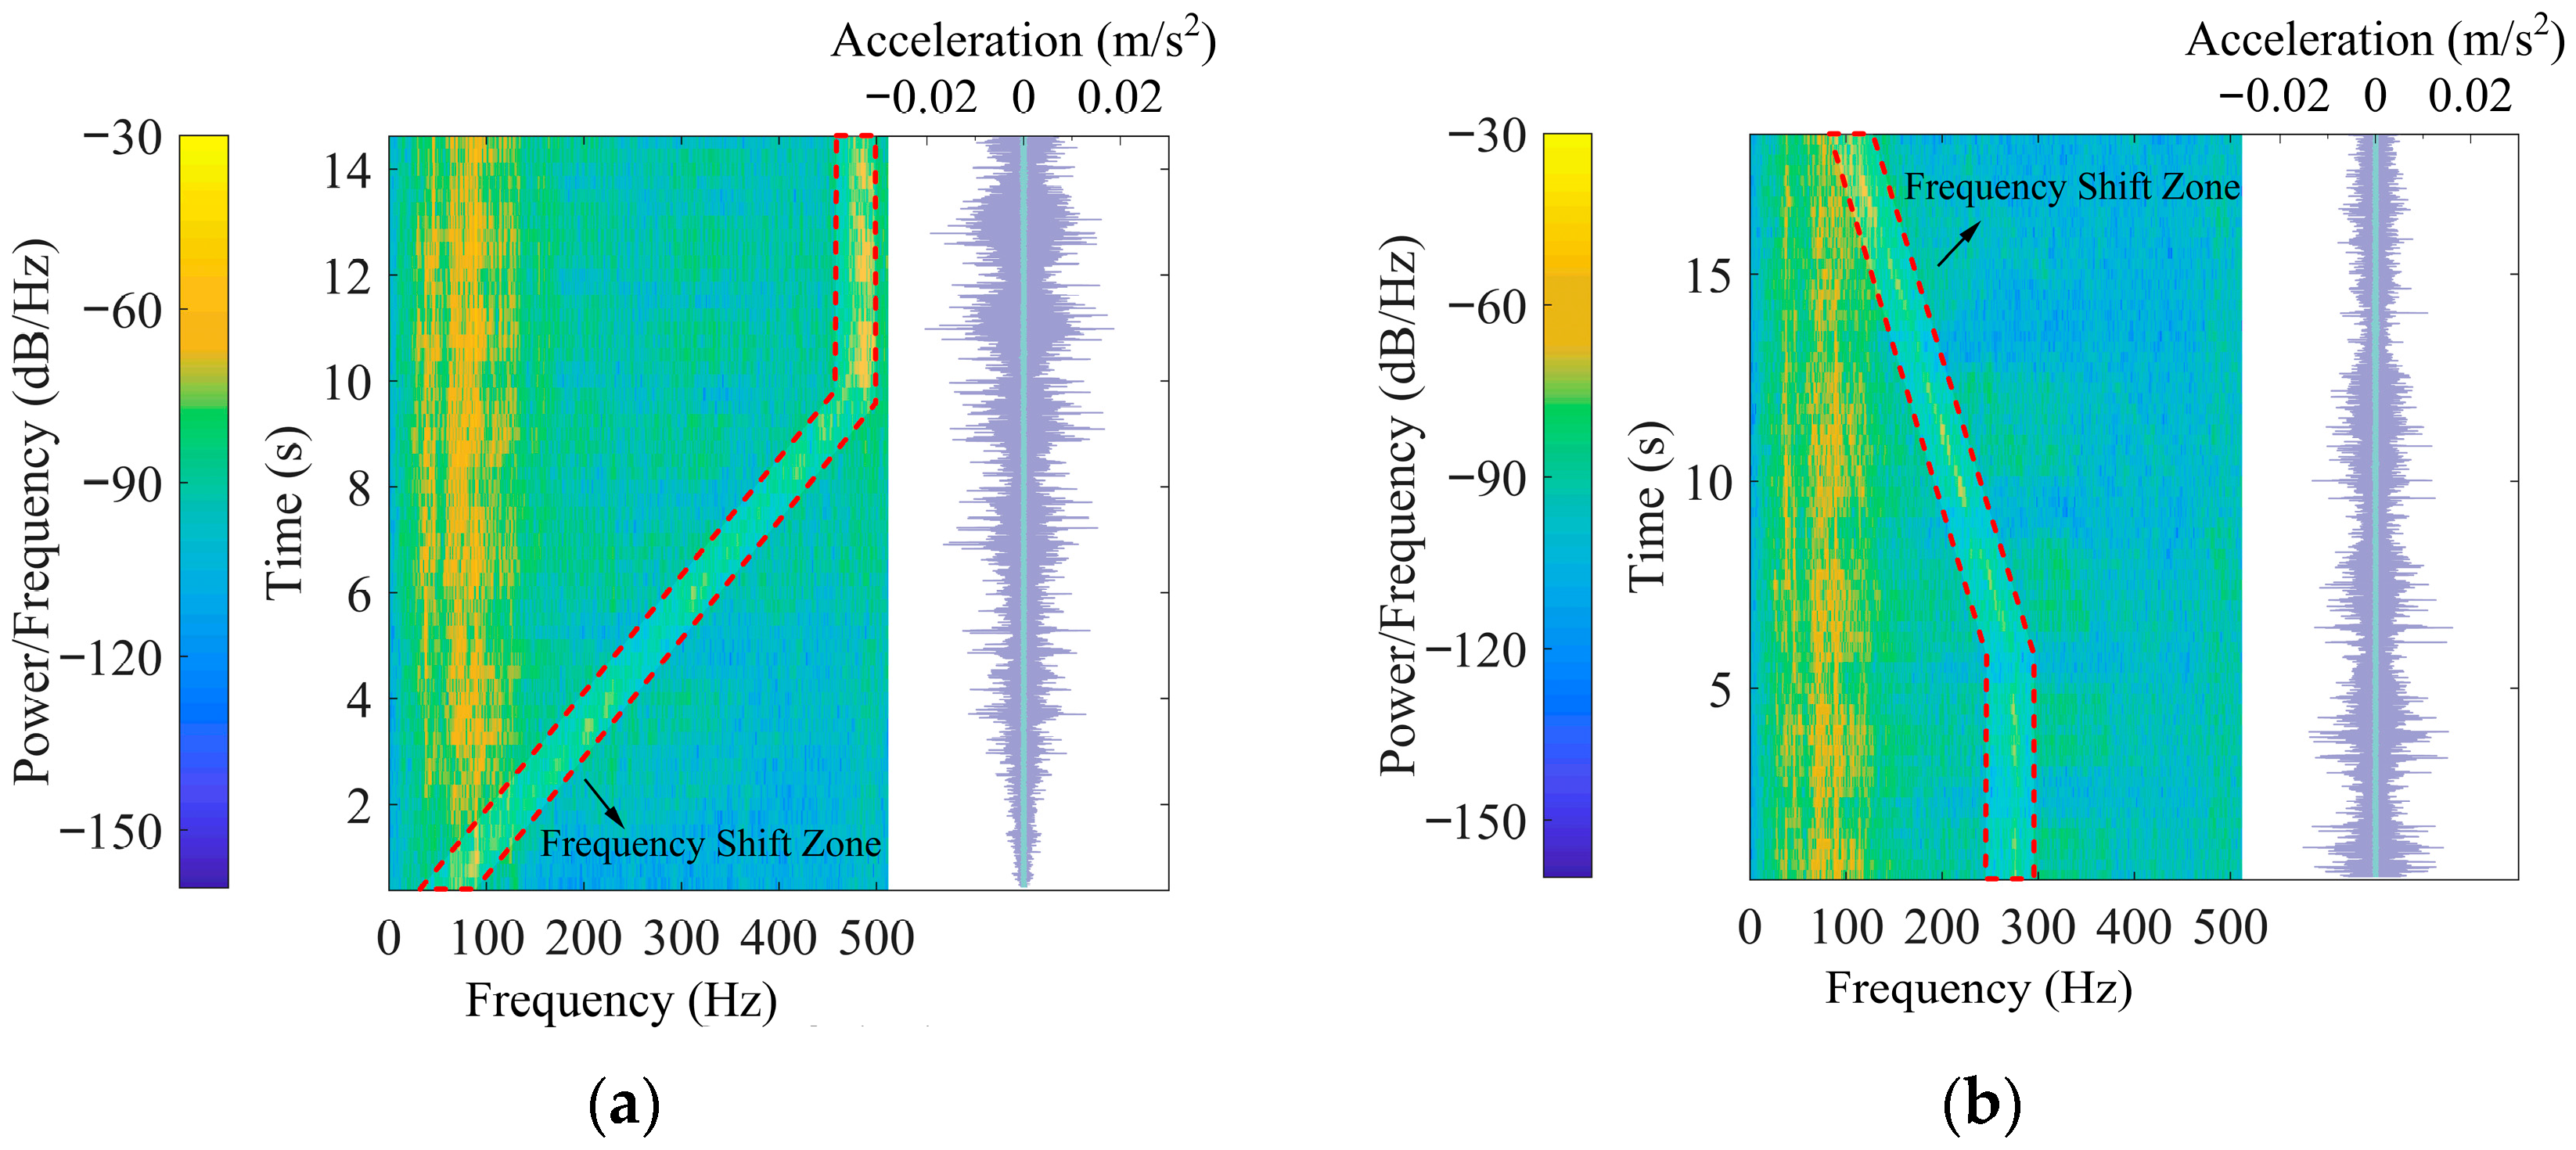
Short-time Fourier spectra and time histories of vibrations at B6 (1.0 m away from track). (a) Accelerating (P2): 1.02 m/s2; (b) Braking (P1): −0.56 m/s2.
Figure 6a–c present vibrations induced by train cruising operations. Specifically, Figure 6a corresponds to measurement point B3 located in the free field at 6.5 m from the track, while Figure 6c represents point N2 situated on the ground above the building foundation at a distance of 3.3 m from the track. Figure 6b corresponds to measurement point B1 located in the free field at 4.8 m from the track. Under cruising conditions, both ground vibration signals exhibit clear periodic fluctuations in their time-frequency distributions and time histories, corresponding to the successive passage of individual wheel sets. As shown in the acceleration time histories, 12 distinct peaks are visible, matching the configuration of 6 carriages with 12 bogies. The highly consistent time intervals between consecutive peaks reflect the repetitive dynamic loading generated by wheel sets passing the measurement points during cruising operation.
Figure 6 indicated that the dominant vibration frequencies at ground surface measurement locations during train cruising passages remained below 300 Hz. Waveforms recorded in the free field at points B3 and B1 displayed similar patterns, although the vibration amplitudes at B3, which is located farther from the track, were lower than those at B1. Frequency components within the 100–250 Hz range exhibited higher energy levels at the track-proximal location B1. Similarly, owing to its closer proximity to the vibration source, point N2 showed richer frequency components than B3, particularly in the higher frequency regions around 200 Hz and 300 Hz.
Figure 7a,b display the short-time Fourier spectra and corresponding time histories of train-induced vibrations at measurement point B9 in the free field, located 4.2 m from the track, under accelerating and braking conditions, respectively. The vibration in Figure 7a was induced by train accelerating at kinematic acceleration of 1.02 m/s2, while that in Figure 7b resulted from braking at kinematic acceleration of −0.56 m/s2.
Both accelerating and braking vibrations exhibit distinct operational characteristics when compared to cruising conditions. During train accelerating, the temporal separation between successive vibration peaks progressively decreases and stabilizes after approximately 10 s, indicating an initial accelerating phase followed by transition to cruising at around 34.56 km/h. At approximately 13 s, the last carriage passes the measurement point, and vibration levels return to background. Under braking conditions, peak intervals remain relatively consistent until about 6 s, after which they gradually lengthen, reflecting the transition from cruising to active braking.
Aside from waveform inversion, the time-frequency characteristics and vibration amplitudes under accelerating and braking are quite similar at the same location. Compared to the cruising section, the free-field vibrations in the accelerating and braking section were substantially higher. A comparison between Figure 6b and Figure 7 shows that, although the distances from the measurement locations to the track are comparable, the predominant frequency range broadens from 20–250 Hz during cruising operations to 10–330 Hz during accelerating or braking.
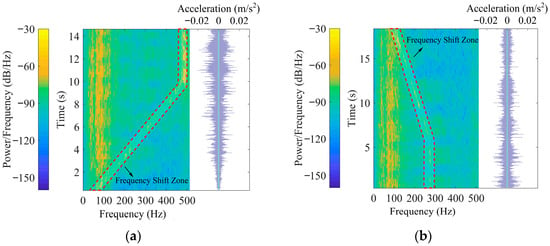
Figure 8a,b display the short-time Fourier spectra and corresponding time histories of train-induced vibrations at measurement point B6 on the ground above building foundation, located 1.0 m from the track, under accelerating and braking conditions, respectively. The vibration in Figure 8a was induced by train accelerating at 1.02 m/s2, while that in Figure 8b resulted from braking at −0.56 m/s2.
An interesting time-varying frequency phenomenon, characterized by inclined bright lines in the short-time Fourier spectra, is highlighted within the red dashed boxes in Figure 8. This phenomenon was observed in the test section during train acceleration and braking but did not occur during cruising operation. It was present both on the ground above the foundation and at the bases of the shear walls. Specifically, during the acceleration phase (0–10 s), frequencies increased from 100 Hz to 500 Hz. In contrast, during the braking phase beginning at 6 s, frequencies decreased from 290 Hz to 100 Hz.
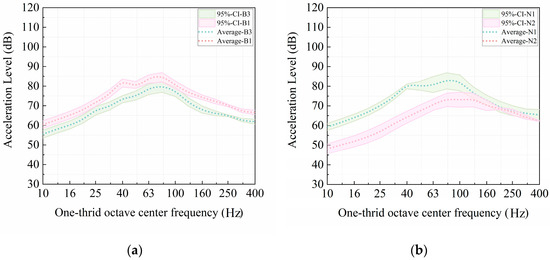
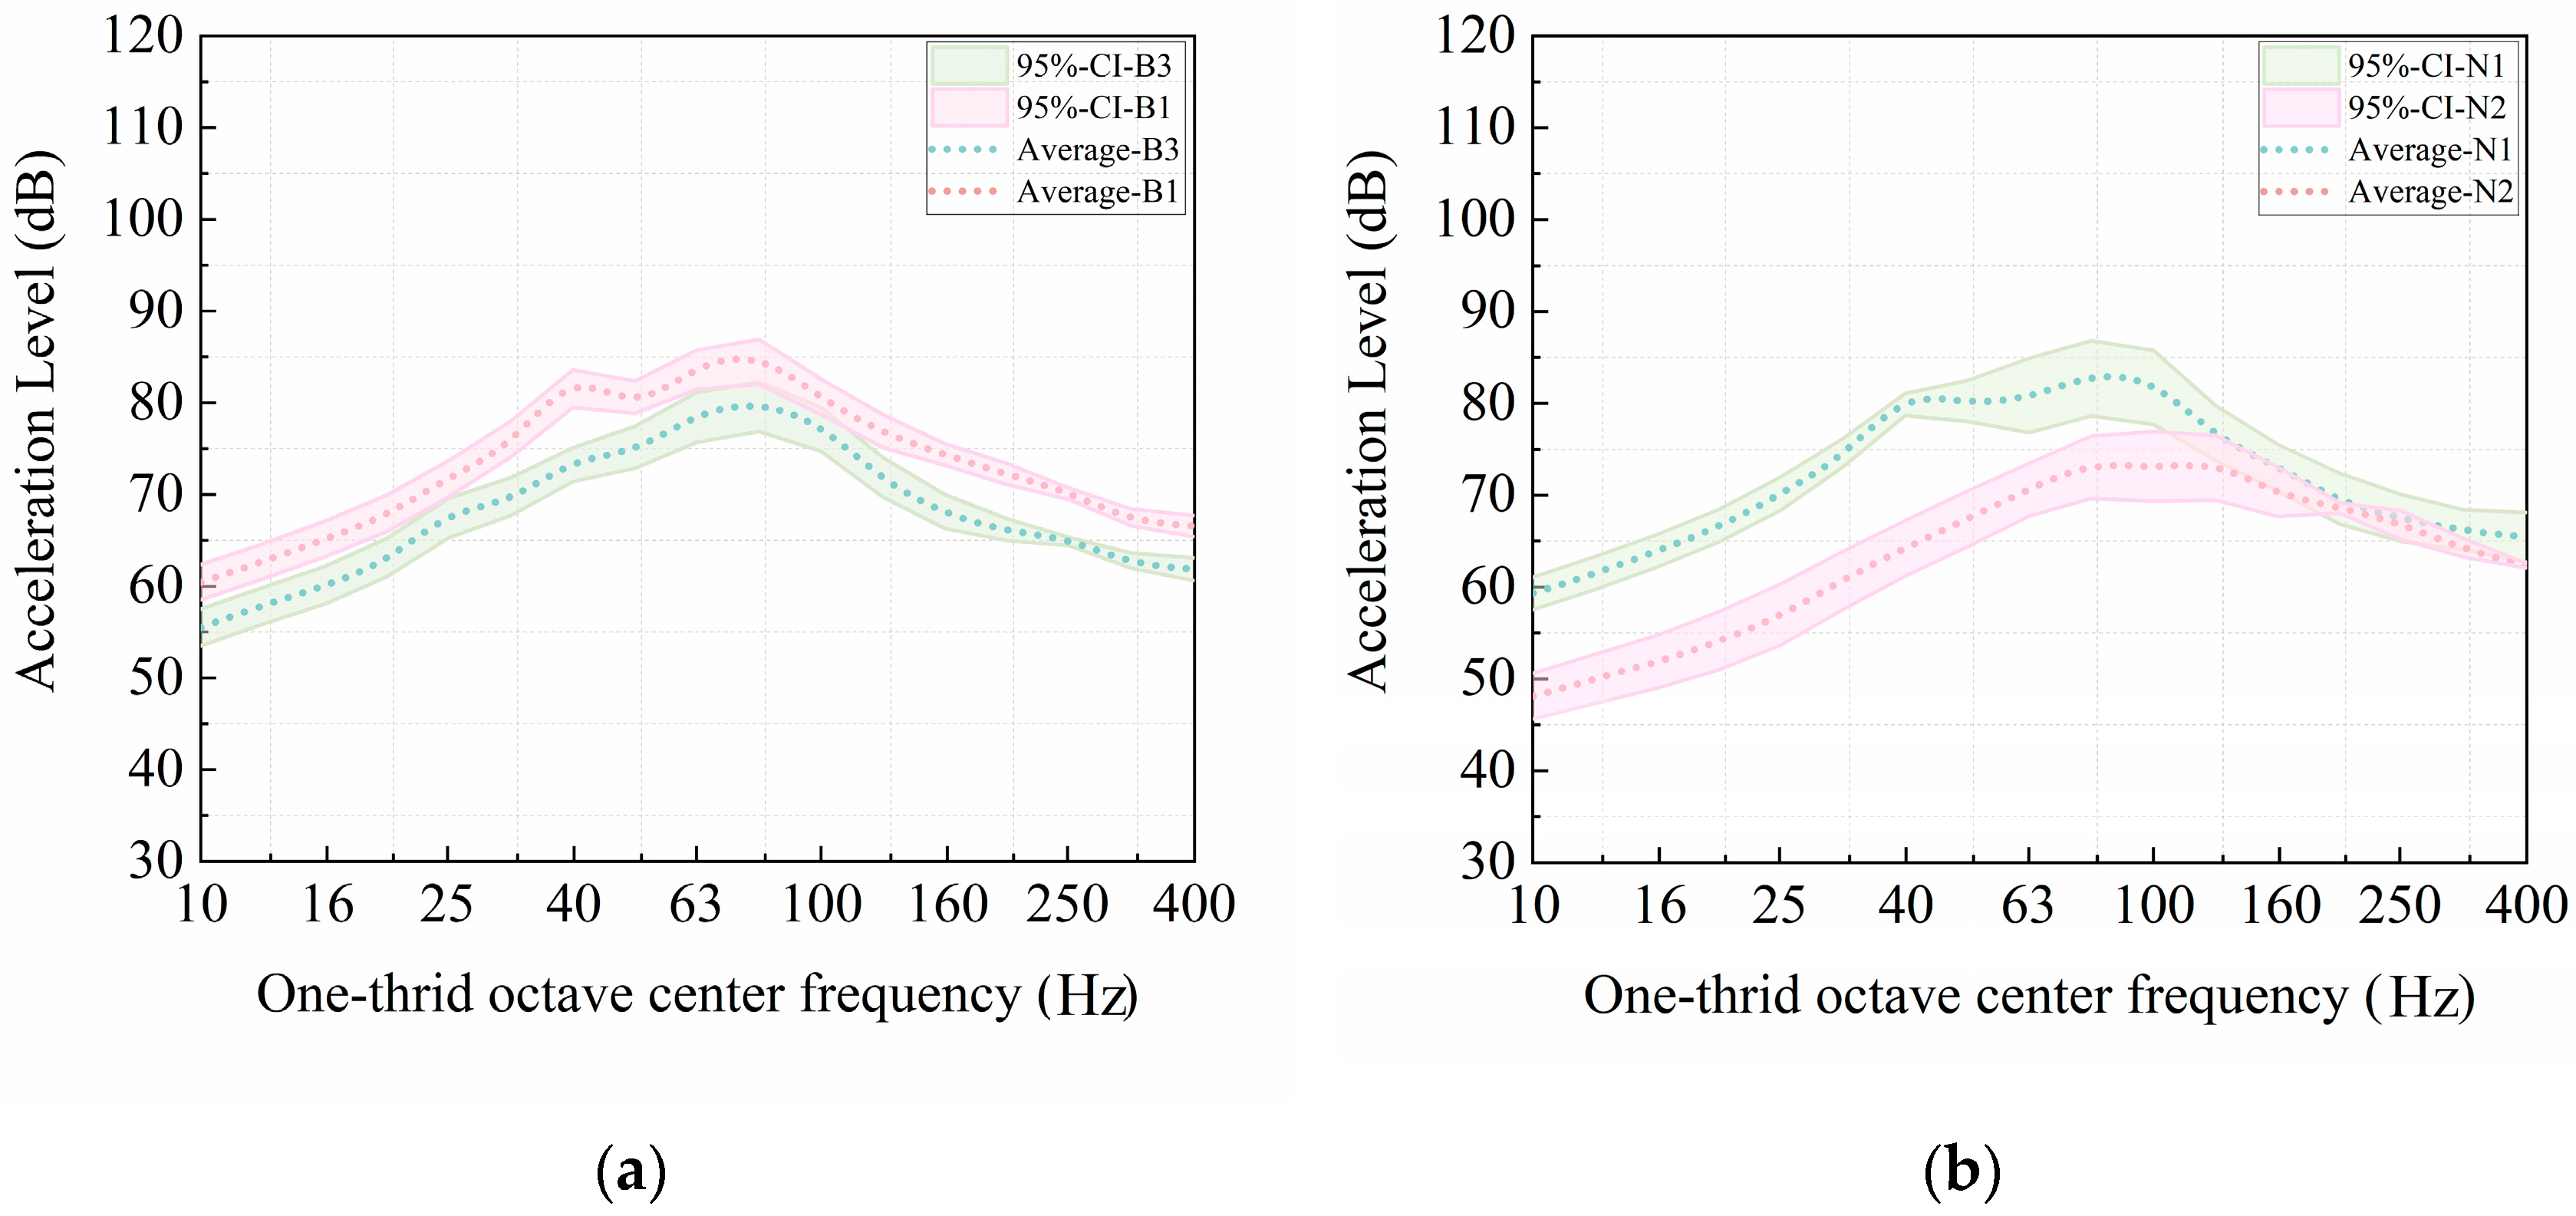
To compare train-induced vibrations in the free field and on the ground above the building foundation, Figure 9 presents one-third octave band acceleration levels measured during train cruising operations. The figure depicts both the averaged spectra from six train passages and the associated 95% confidence intervals, shown as shaded bands.
Figure 9.
One-third octave band spectra at measurement points in the free field and on the ground above the building foundation during train cruising operations. (a) In free field; (b) On ground above foundation.
Figure 9a displays the spectra for points B1 and B3, which are located in the free field at distances of 4.8 m and 6.5 m from the track, respectively. Both points exhibit acceleration peaks at 80 Hz, with maximum levels of 84.46 dB at B1 and 79.57 dB at B3. Figure 9b shows the corresponding spectra for points N1 and N2, situated on the ground above the building foundation at distances of 4.8 m and 3.3 m from the track, respectively. Peak acceleration levels occur at 80 Hz for N1 (82.72 dB) and at 100 Hz for N2 (73.15 dB).
The results indicate that the averaged acceleration levels at B1 in the free field and at N1 on the ground above the foundation are comparable, as both are positioned 4.8 m from the track, though the variation at N1 is larger than that at B1. In the free field, acceleration levels generally decrease with increasing distance from the track. Notably, for points on the ground above the foundation, despite being closer to the track, N2 exhibits lower vibration amplitudes than N1 within the 10–125 Hz frequency range. This suggests that vibration transmission on the foundation ground is more complex than in the free field, likely due to the influence of the building structures.
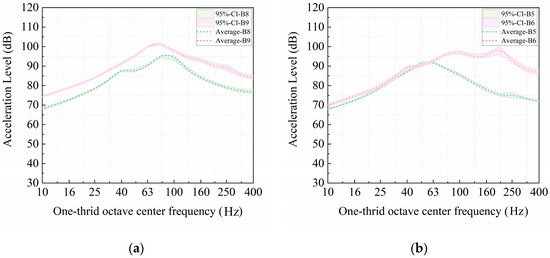
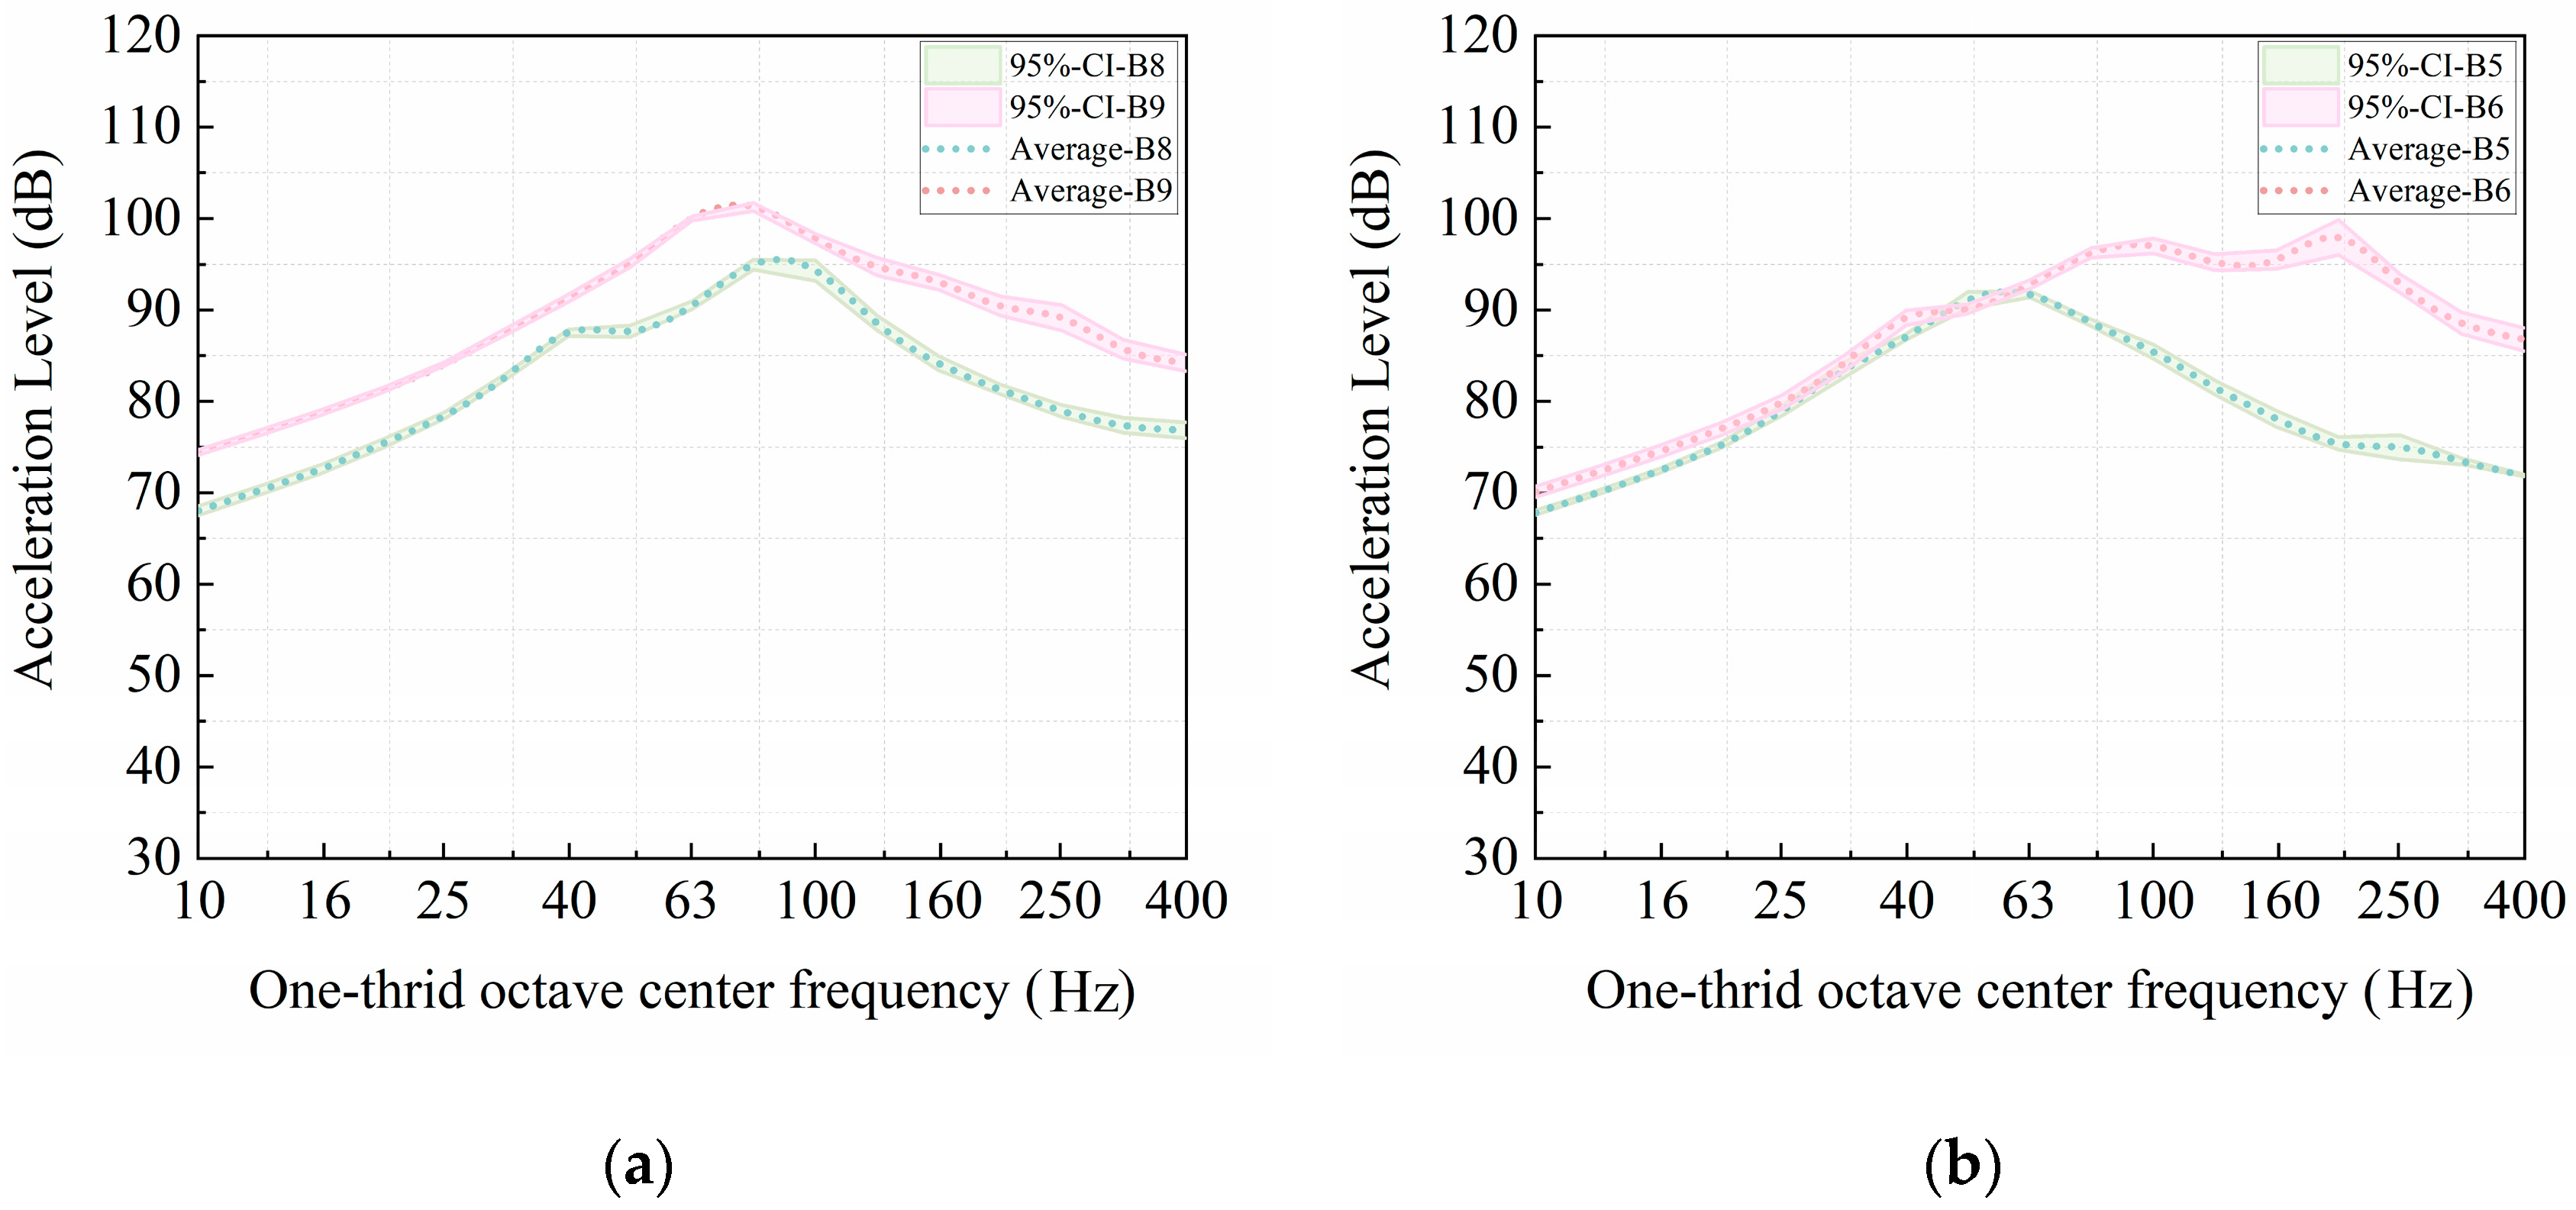
Following the same format as Figure 9 and Figure 10 presents one-third octave band acceleration levels measured during train acceleration and braking operations. Figure 10a shows the spectra for points B8 and B9, located in the free field at distances of 5.5 m and 4.2 m from the track, respectively. Both points exhibit acceleration peaks at 80 Hz, with maximum levels of 94.97 dB at B8 and 101.29 dB at B9. Figure 10b displays the spectra for points B5 and B6, situated on the ground above the building foundation at 6.0 m and 1.0 m from the track, respectively. Peak accelerations occur at 63 Hz for B5 (91.72 dB) and at 200 Hz for B6 (97.94 dB). The close proximity of point B6 to the track results in elevated frequency components above 80 Hz. Nevertheless, vibration amplitudes at B5 and B6 remain comparable in the frequency range below 63 Hz.
Figure 10.
One-third octave band spectra at measurement points in the free field and on the ground above the building foundation during train accelerating and braking. (a) In free field; (b) On ground above foundation.
A comparison between Figure 9a and Figure 10a indicates that in the free field, vibration levels consistently decrease with increasing distance from the track across the entire frequency range of interest. In contrast, on the ground above the foundation, the variation in vibration with distance to the track exhibits a more complex, frequency-dependent pattern, irrespective of the train operating condition.
Table 4 summarizes the peak one-third octave band acceleration levels recorded at ground surface measurement points of two test sections. A comparison of peak acceleration levels between B1 in the free field and N1 on the ground above the foundation shows that the variation is larger at B1 than at N1. Conversely, as illustrated in Figure 9, the frequency-dependent variation within the one-third octave band spectra is greater at N1 on the ground above the foundation than in the free field.
Table 4.
Peak acceleration levels at ground points for two test sections.
Furthermore, the variation in peak acceleration levels during cruising operations exceeds that during accelerating and braking operations. This is likely because the standard deviation of train speeds during cruising passages (Table 2) is substantially larger than that of the kinematic accelerations during accelerating or braking operations (Table 3). The higher variability in the excitation source (train speed) thus partially explains the larger standard deviation observed in the measured peak vibration levels within the cruising section.
As noted previously, vibrations at ground-level locations above the building foundation are influenced by the distance from the track and the presence of surrounding structures. To isolate the effects of different train operating conditions and local soil profiles, a comparative analysis was conducted between free-field measurement points situated at similar distances from the track. A paired t-test (α = 0.05) was performed to statistically evaluate the difference in maximum vibration levels between the two test sections. Specifically, the maximum vibration levels recorded at point B3 in the cruising section were compared with those at point B5 in the accelerating/braking section. The null hypothesis that the means of the two sample sets are equal was tested. The resulting p-value of 0.0029 is below the significance threshold of 0.05, leading to the rejection of the null hypothesis. This result statistically confirms that vibration levels in the accelerating/braking section are significantly higher than those in the cruising section.
4.2. Vibrations at Base of Shear Wall
Train-induced vibrations at the bases of the measured shear walls are analyzed in this section, representing the base excitations for the studied high-rise over-track buildings. Figure 11 presents the vibrations measured on the shear wall of the high-rise building at point N2W during train cruising operations. A comparison with the ground-level vibrations at point N2 in Figure 6c shows that while both locations exhibit similar waveform patterns, the vibration amplitudes at N2W on the shear wall are generally lower than those at N2 on the ground. An exception is observed around 410 Hz, where the shear wall displays higher power density. Additionally, the vibration spectra on the shear wall appear sparser than those on the ground, particularly within the 20–200 Hz frequency range.
Figure 11.
Short-time Fourier spectra and time histories of vibrations on shear wall (cruising).
Figure 12a,b display the short-time Fourier spectra and corresponding time histories of train-induced vibrations at measurement point B6W on the shear wall, located 1.0 m from the track, under accelerating and braking conditions, respectively. The vibration in Figure 12a was induced by train passage P2 accelerating at 1.02 m/s2, while that in Figure 12b resulted from train passage P1 braking at −0.56 m/s2.
Figure 12.
Short-time Fourier spectra and time histories of vibrations at B6W (1.0 m away from track). (a) Accelerating (P2): 1.02 m/s2; (b) Braking (P1): −0.56 m/s2.
The temporal characteristics of these signals under both accelerating and braking conditions exhibit similarities with those observed at the ground-level point, B6. By comparing Figure 8, Figure 9, Figure 10, Figure 11 and Figure 12, it was seen that the acceleration amplitudes at wall point B6W were significantly attenuated compared to that at the ground-level point B6. This amplitude reduction can be attributed to the considerable energy dissipation and notable filtering effects occurring along the vibration transmission path from the ground through the building’s foundation to the shear wall system.
The same time-varying frequency phenomenon observed in Figure 8b at ground-level point B6 also appears in Figure 12, particularly during the train braking operation illustrated in Figure 12b. During the braking phase starting at 6 s, frequencies similarly decrease from 290 Hz to 100 Hz.
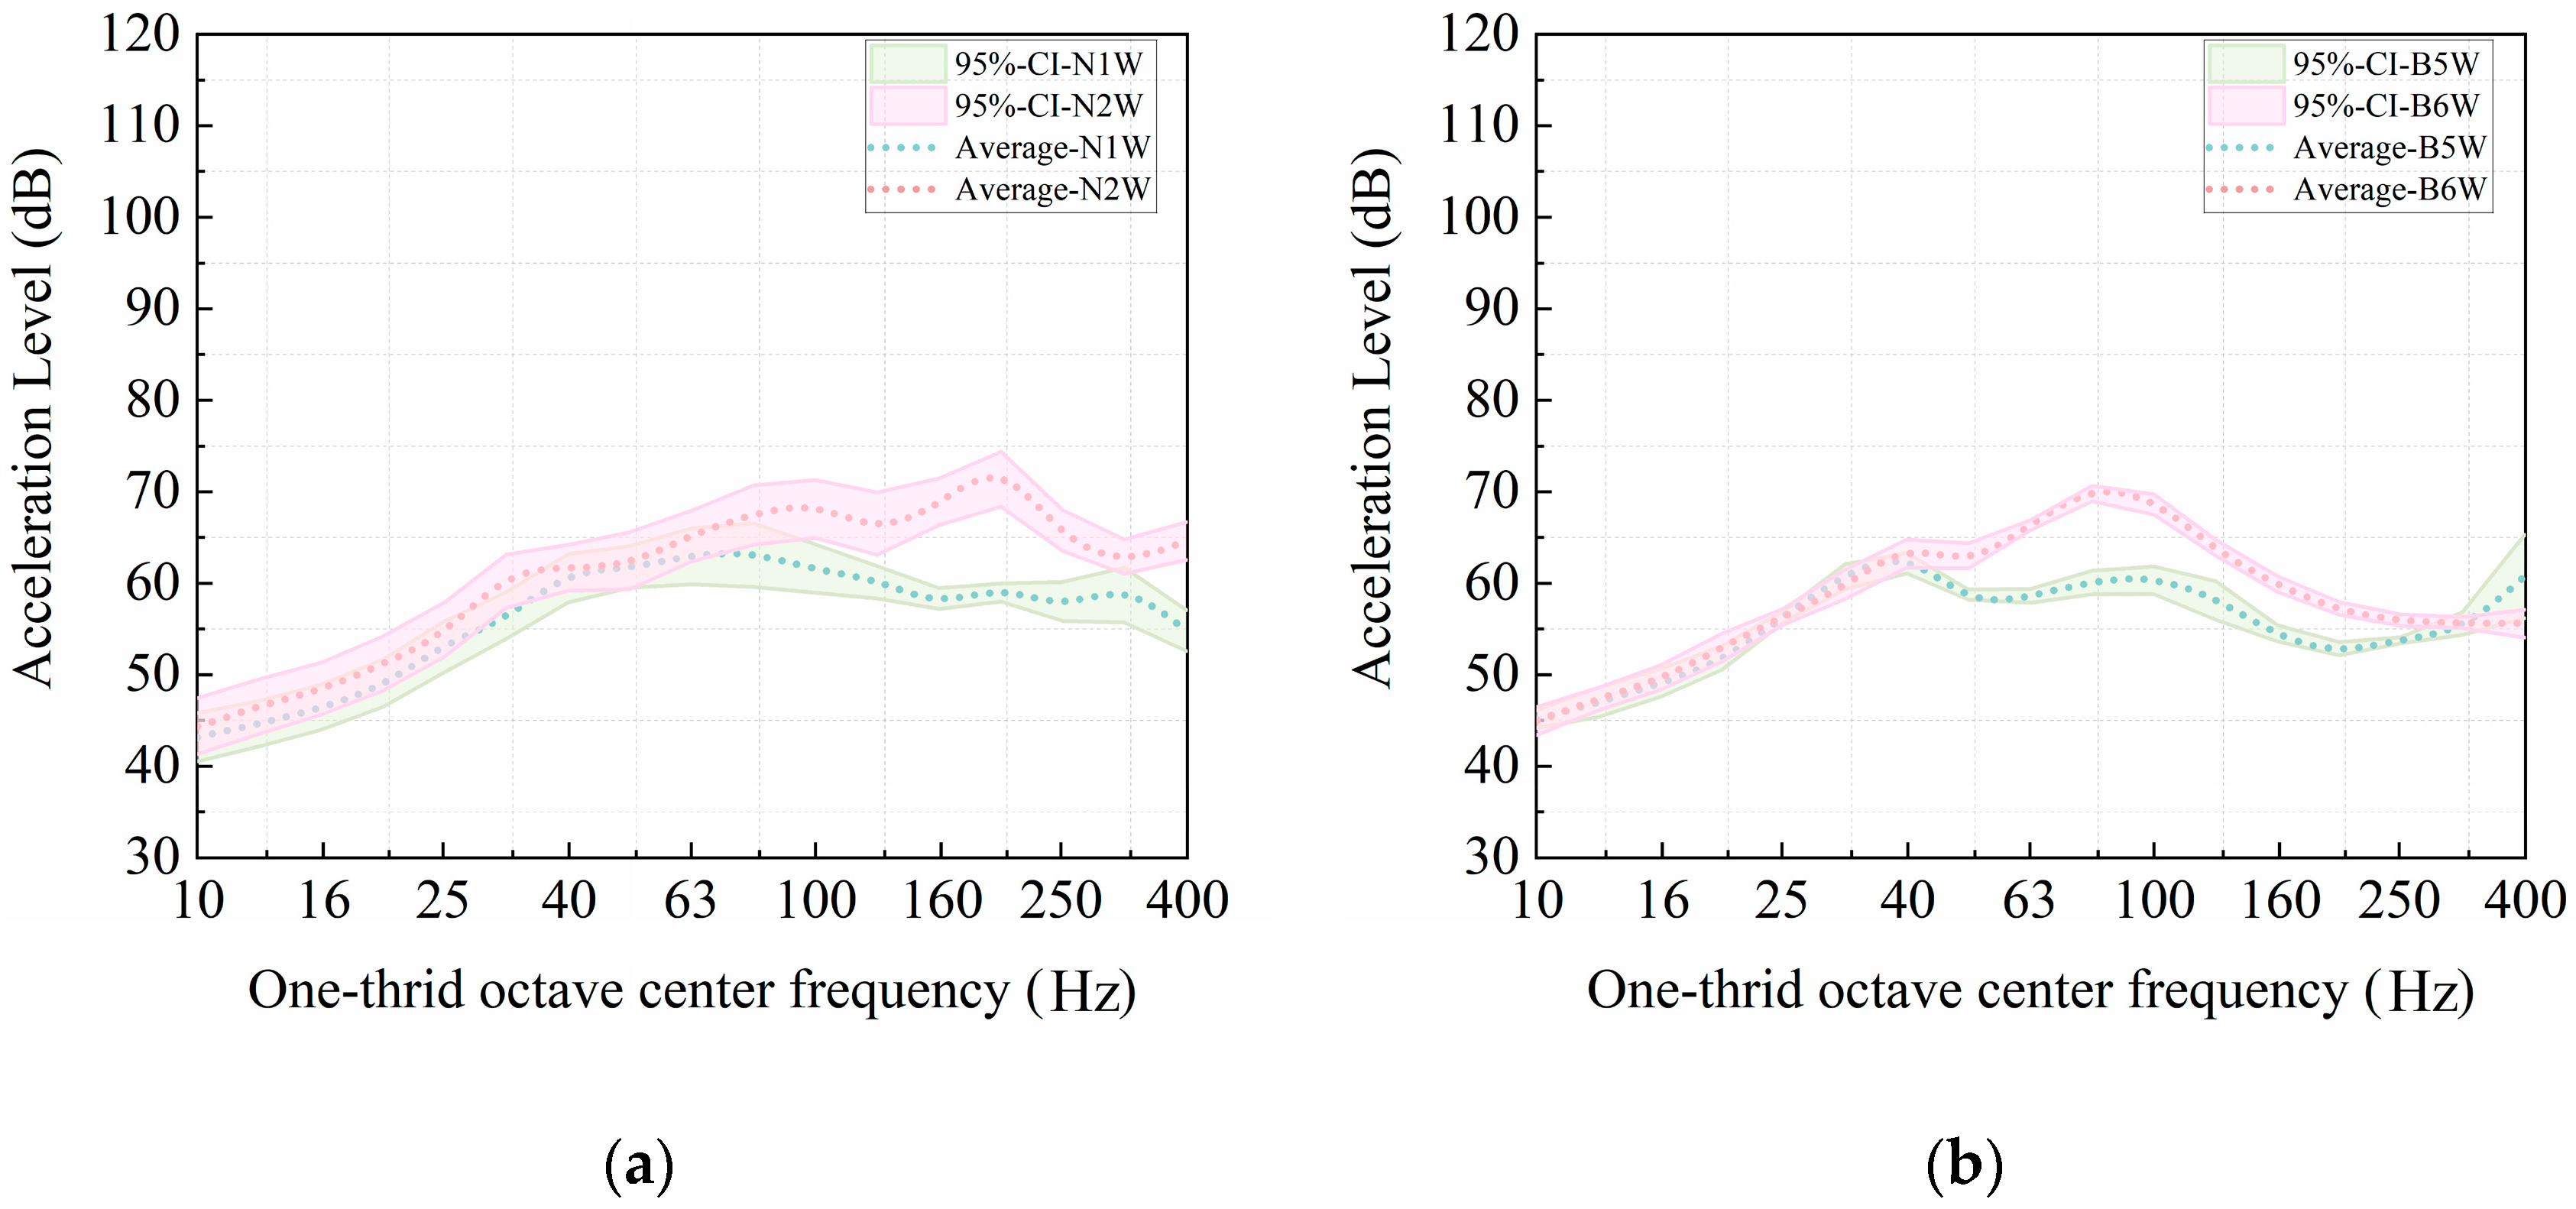
Figure 13 presents the one-third octave band spectra at the bases of shear walls. Figure 13a presents the vibration spectra for points N1W and N2W on the shear walls during train cruising operations, located at 4.8 m and 3.3 m from the track, respectively. Peak accelerations occur at 80 Hz for N1W (63.07 dB) and 200 Hz for N2W (68.40 dB). Figure 13b shows the corresponding spectra for points B5W and B6W during accelerating and braking conditions, situated on the shear walls at 6.0 m and 1.0 m from the track, respectively. These points exhibit peak accelerations at 40 Hz for B5W (62.20 dB) and 80 Hz for B6W (69.80 dB). It was found that the vibration amplitudes on the shear walls remain comparable across the two sections. In contrast, ground-level vibrations exhibit a significant difference between the two sections, as shown in Figure 9 and Figure 10, with notably larger ground-borne vibrations in the accelerating/braking section compared to the cruising section.
Figure 13.
One-third octave band spectra at the bases of shear walls for the two test sections. (a) Cruising; (b) Accelerating and braking.
Table 5 summarizes the peak one-third octave band acceleration levels recorded at the shear wall base points in the two test sections. Both Figure 13 and Table 5 indicate that the variation of vibrations at the shear wall base is larger in the cruising section than in the accelerating/braking section, which aligns with the trend observed for ground-level vibrations.
Table 5.
Peak acceleration levels on shear wall points for two test sections.
A paired t-test (α = 0.05) was conducted to statistically evaluate the difference in maximum vibration levels between the two sections. Specifically, the maximum vibration levels at point N1W in the cruising section were compared with those at point B5W in the accelerating/braking section. Testing the null hypothesis that the means of the two sample sets are equal yielded a p-value of 0.8207, which exceeds the significance threshold of 0.05. Thus, the null hypothesis cannot be rejected, statistically confirming that vibration levels at the shear wall bases are comparable between the accelerating/braking and cruising sections.
4.3. Transmission Loss from Ground to Shear Wall
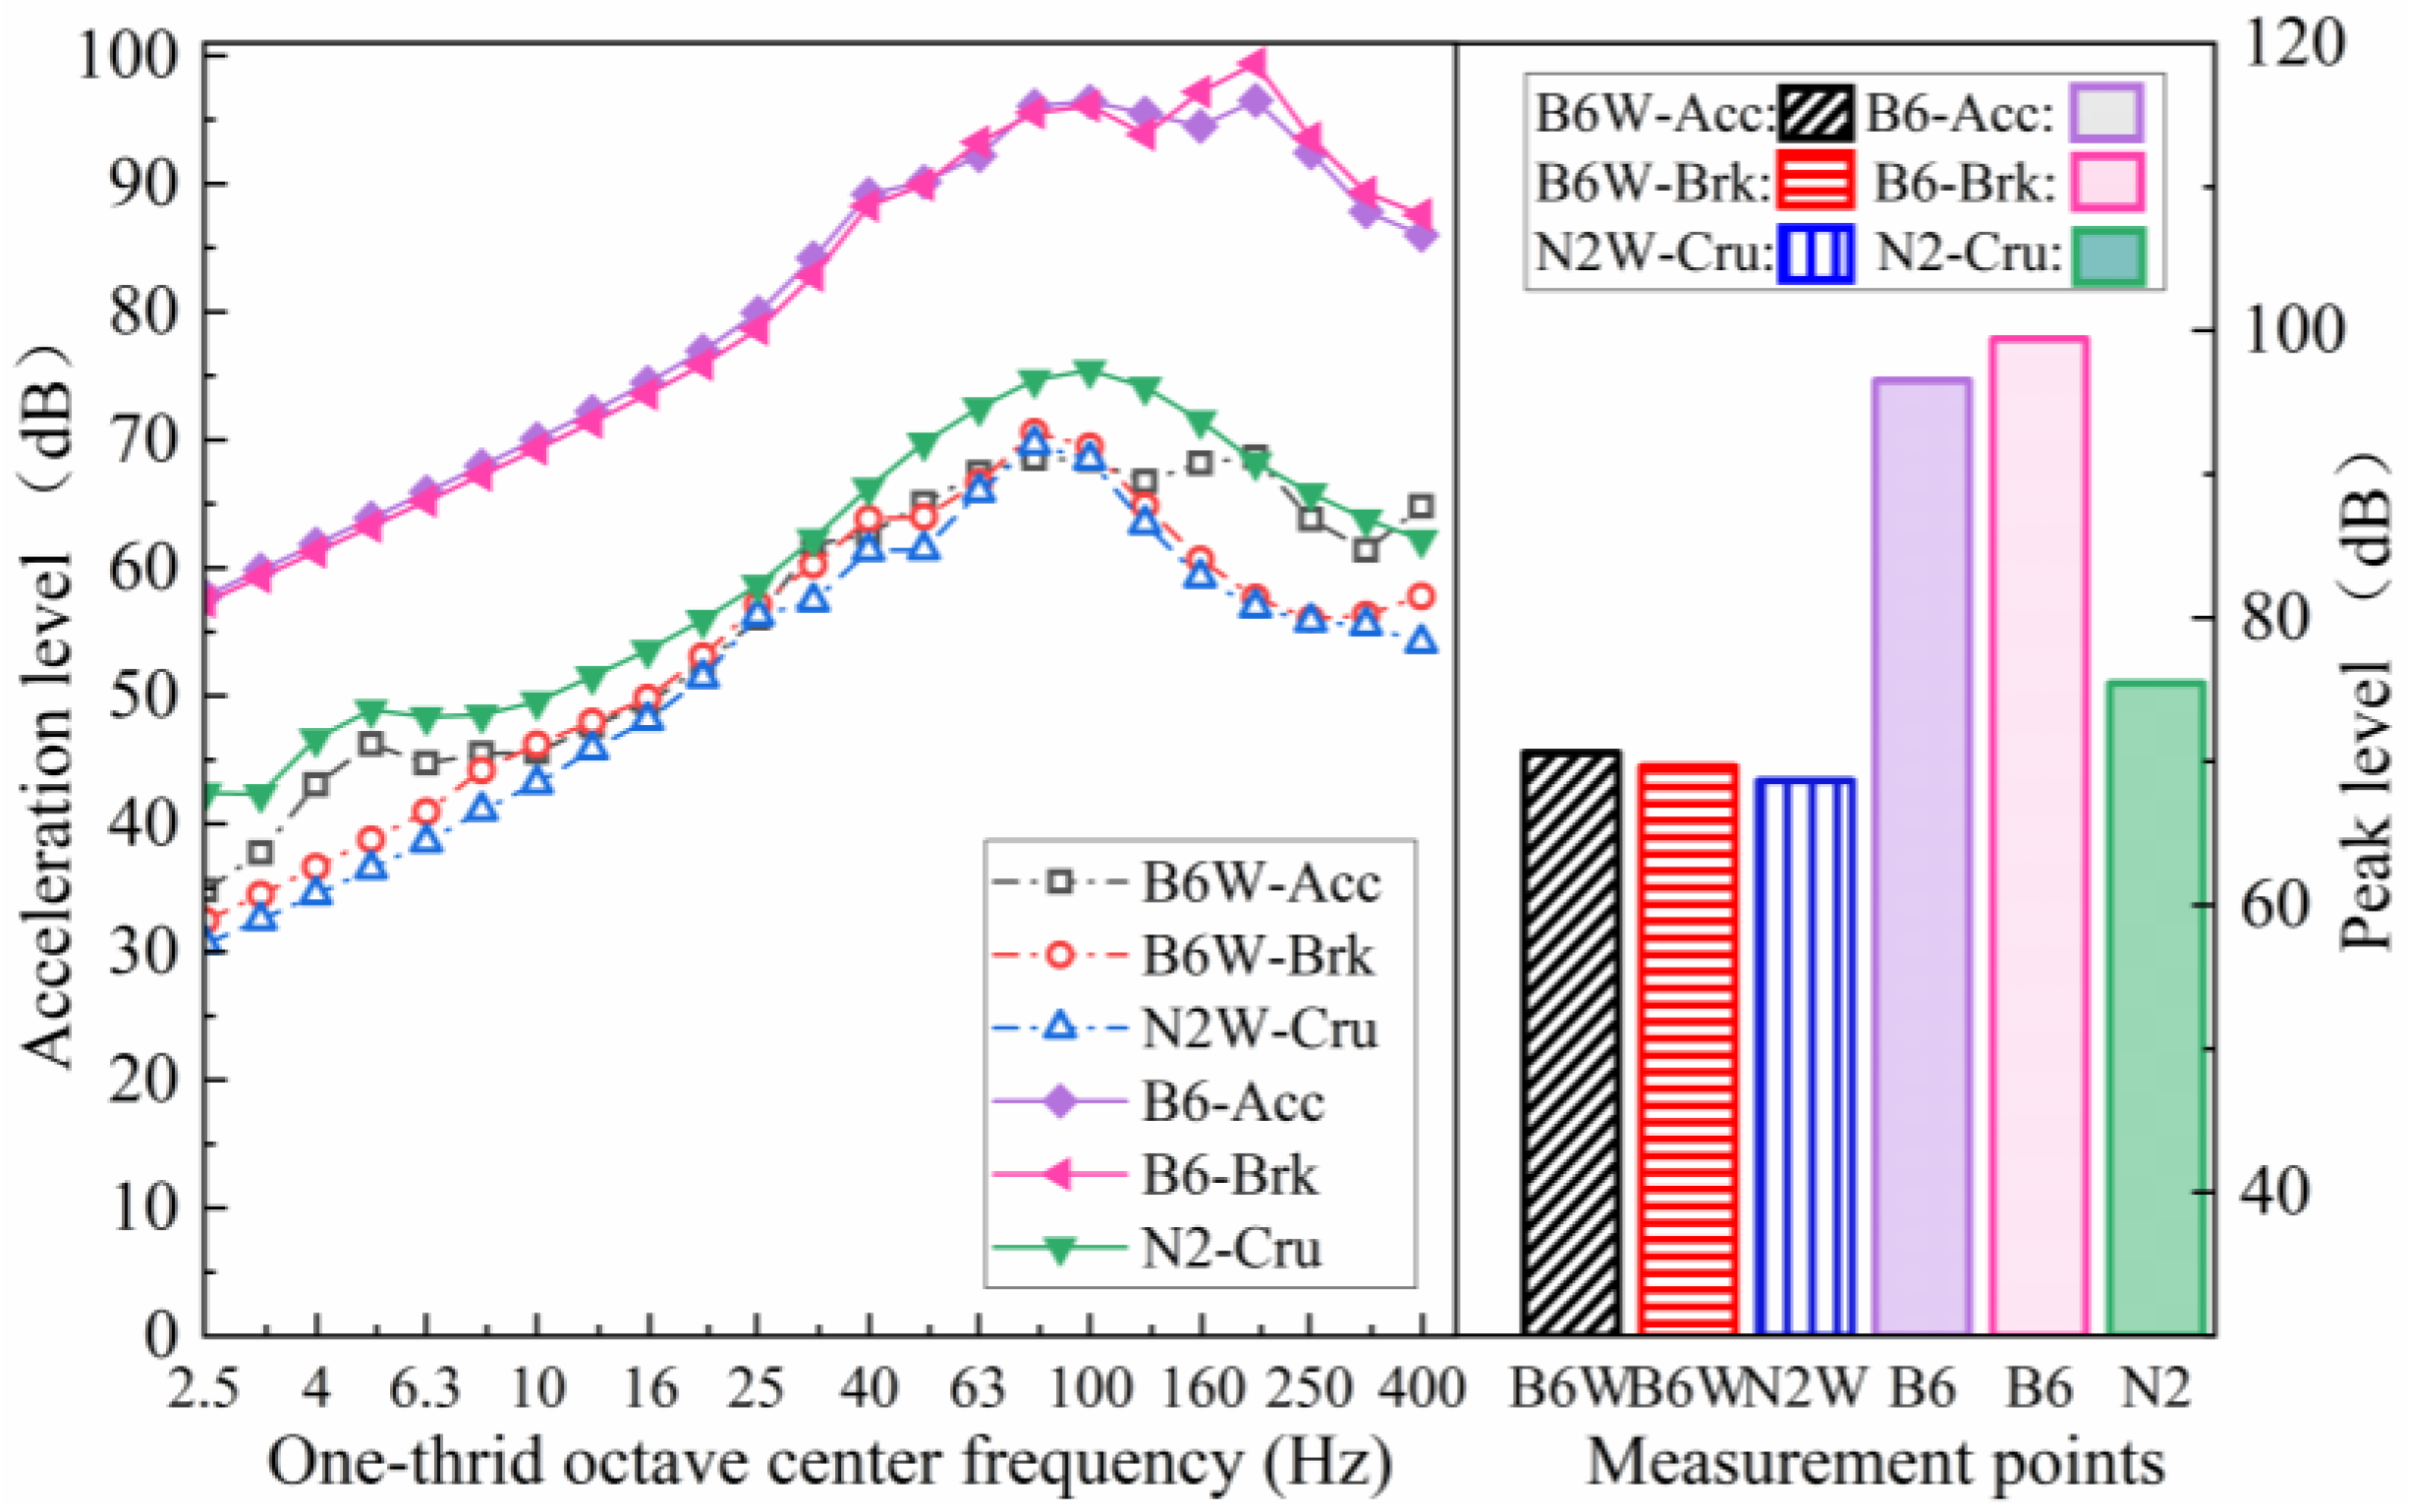
This section examines the vibration differences between the ground and the bases of the shear walls. Figure 14 compares ground and shear wall vibrations using one-third octave band spectra and corresponding peak acceleration levels. A comparison of co-located measurement points (B6 vs. B6W, N2 vs. N2W) indicates consistently higher vibration levels on the ground than on the corresponding shear walls. Moreover, a comparison between shear wall measurement points (B6W and N2W) shows comparable vibration levels despite variations in train operating conditions and distance from the track. This suggests that the base excitation energy transmitted to the high-rise buildings along the test line remains relatively consistent across the two test sections. Consequently, the vibration difference between the ground and the shear wall base is larger in the accelerating/braking section than in the cruising section.
Figure 14.
Comparison of vibrations between the ground and shear walls.
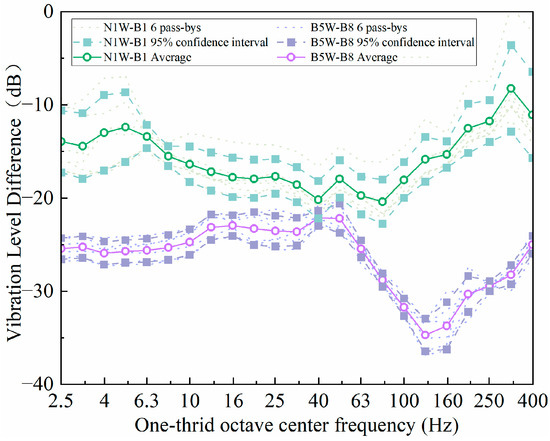
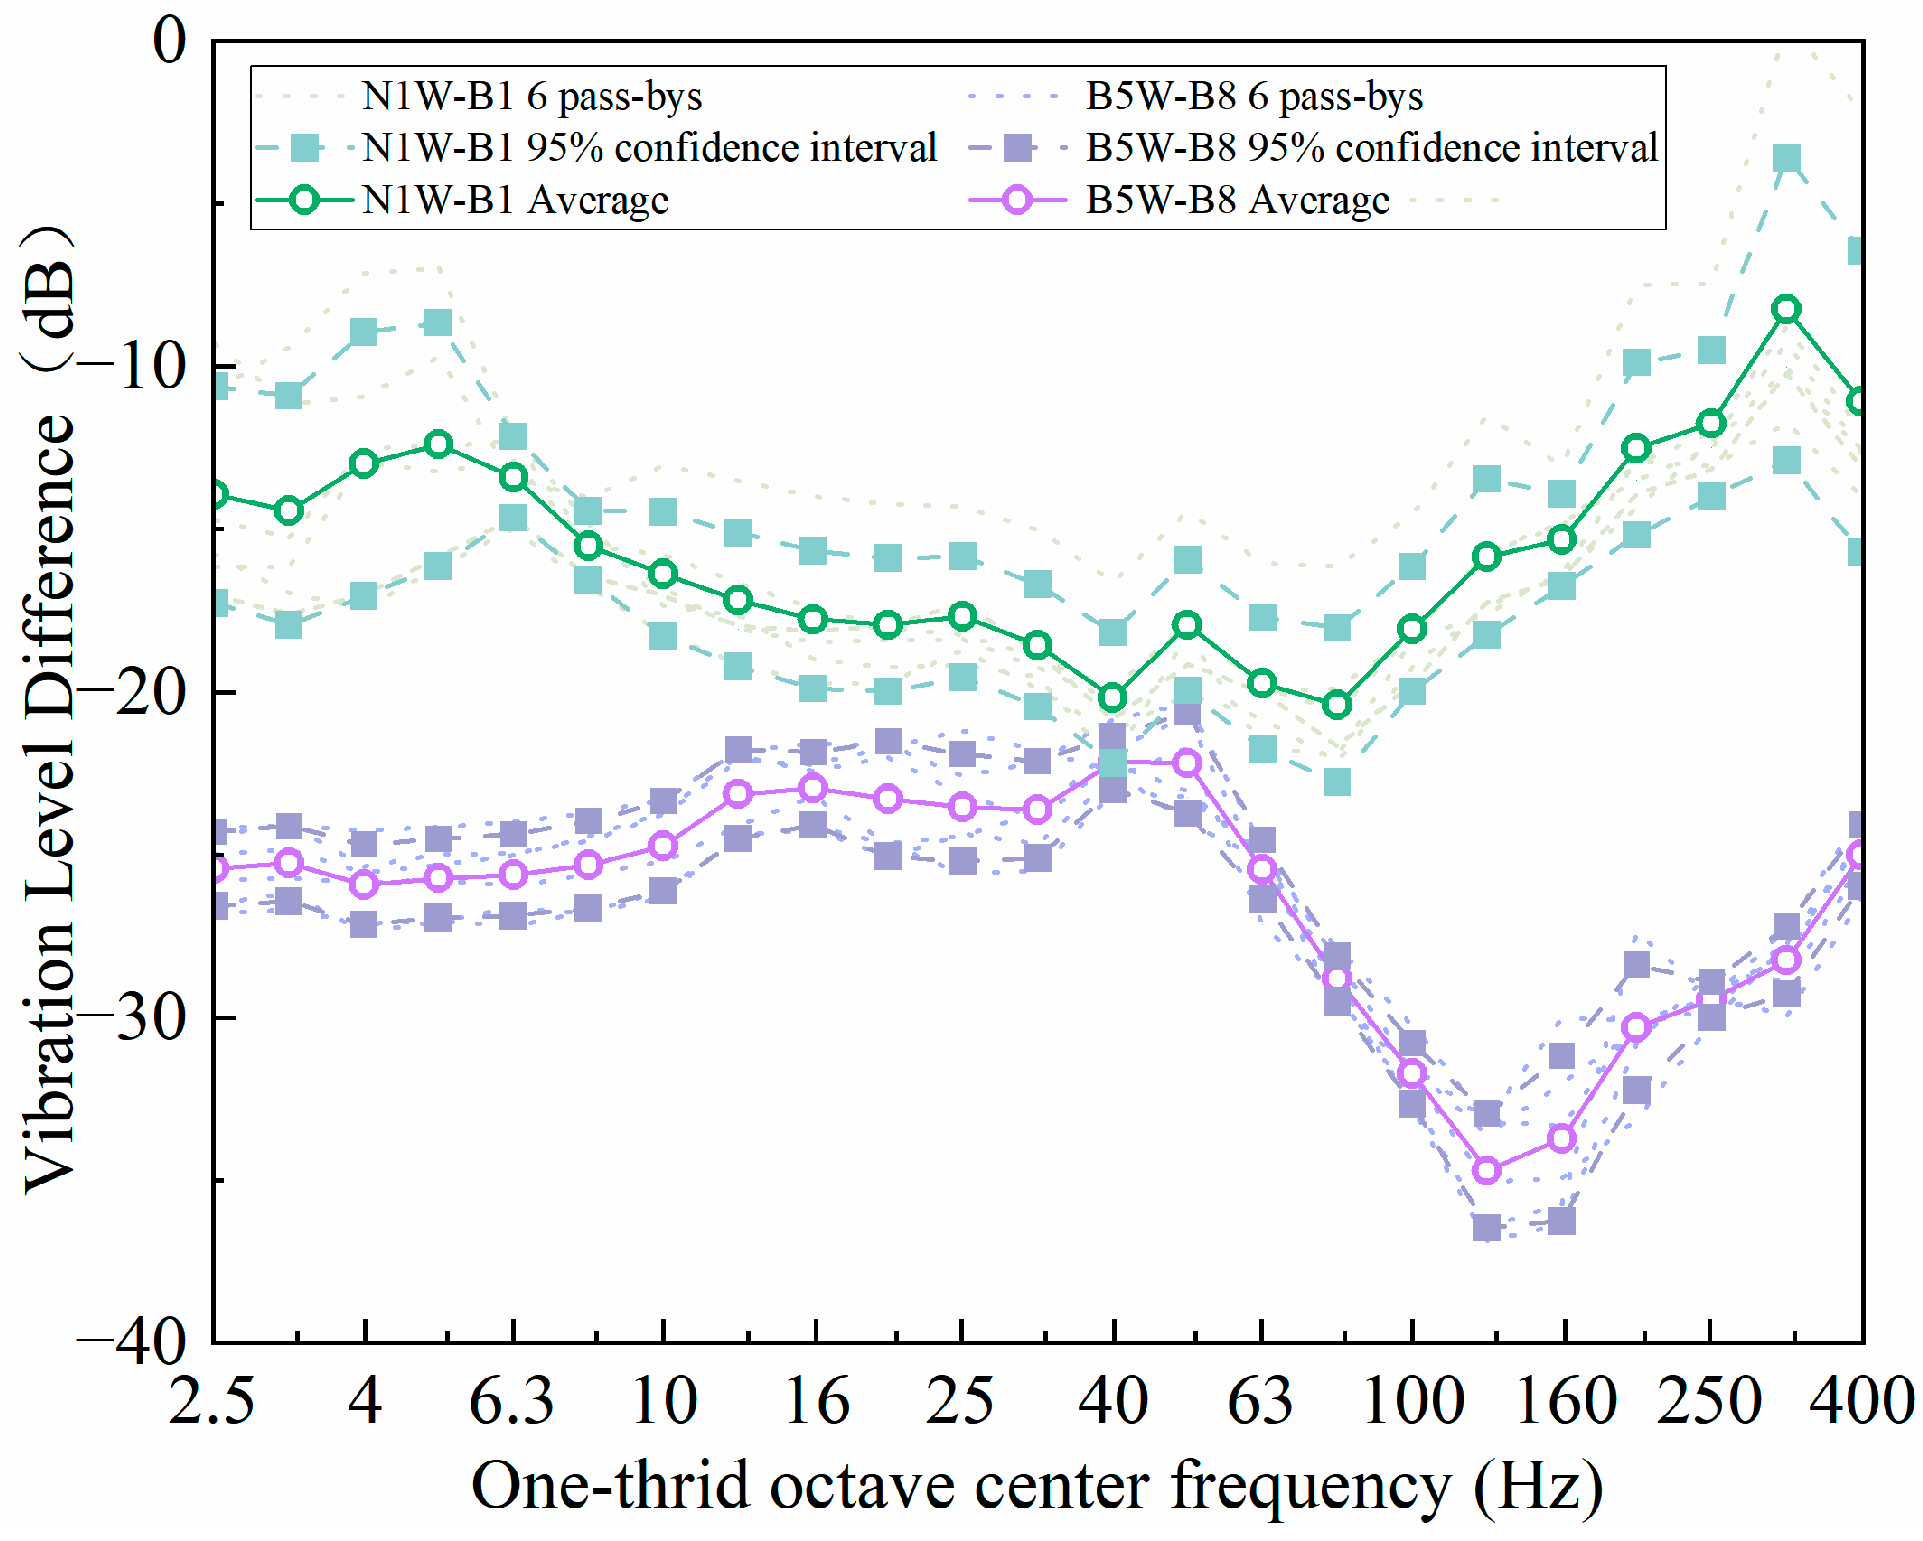
To clearly illustrate the differences in vibration between the free field and the bases of the shear walls, Figure 15 presents the vibration transmission loss for both test sections. In this study, transmission loss is defined as the difference between vibration levels at the shear wall bases and those in the free field, calculated according to the following formula [27]:
where and denote the measured accelerations (m/s2) in the one-third octave band at the ground location and the shear wall base, respectively.
Figure 15.
Vibration transmission loss from free field to shear wall.
The maximum transmission loss reaches 20 dB at 80 Hz during train cruising and 35 dB at 125 Hz during accelerating and braking. As identified in Section 4.1, train-induced vibrations in the free field of the accelerating/braking section contain more high-frequency components. The greater transmission loss observed in Figure 15 suggests that the high-rise building structure acts as a high-frequency filter. Consequently, the influence of train operations is primarily reflected in ground vibrations rather than in the structural response at the shear wall bases. The underlying mechanism of this high-frequency filtering effect will be further investigated in future work.
4.4. Numerical Assessment of the Effect of Soil Profile Variations
This study aims to investigate the differences in vibrations induced by train cruising on the mid-section of the test line and those caused by train accelerating or braking at the terminal section. Although the train’s dynamic characteristics and track parameters remained consistent throughout the tests, and both buildings were constructed using standardized structural designs, suggesting minimal differences in track and building structures between the two test areas, the approximately 100 m straight-line distance between the buildings means that potential site-specific influences cannot be entirely ruled out. Therefore, this section develops a finite element model (FEM) to numerically evaluate the influence of site differences on train-induced vibrations.
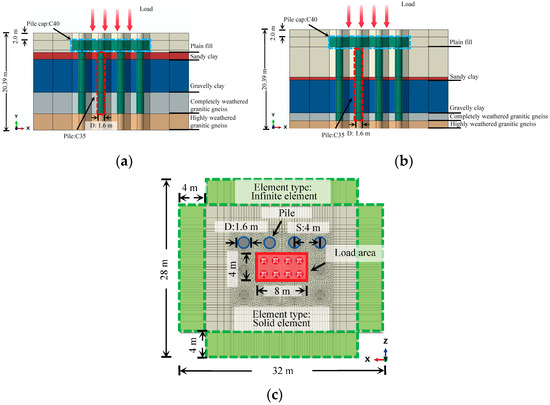
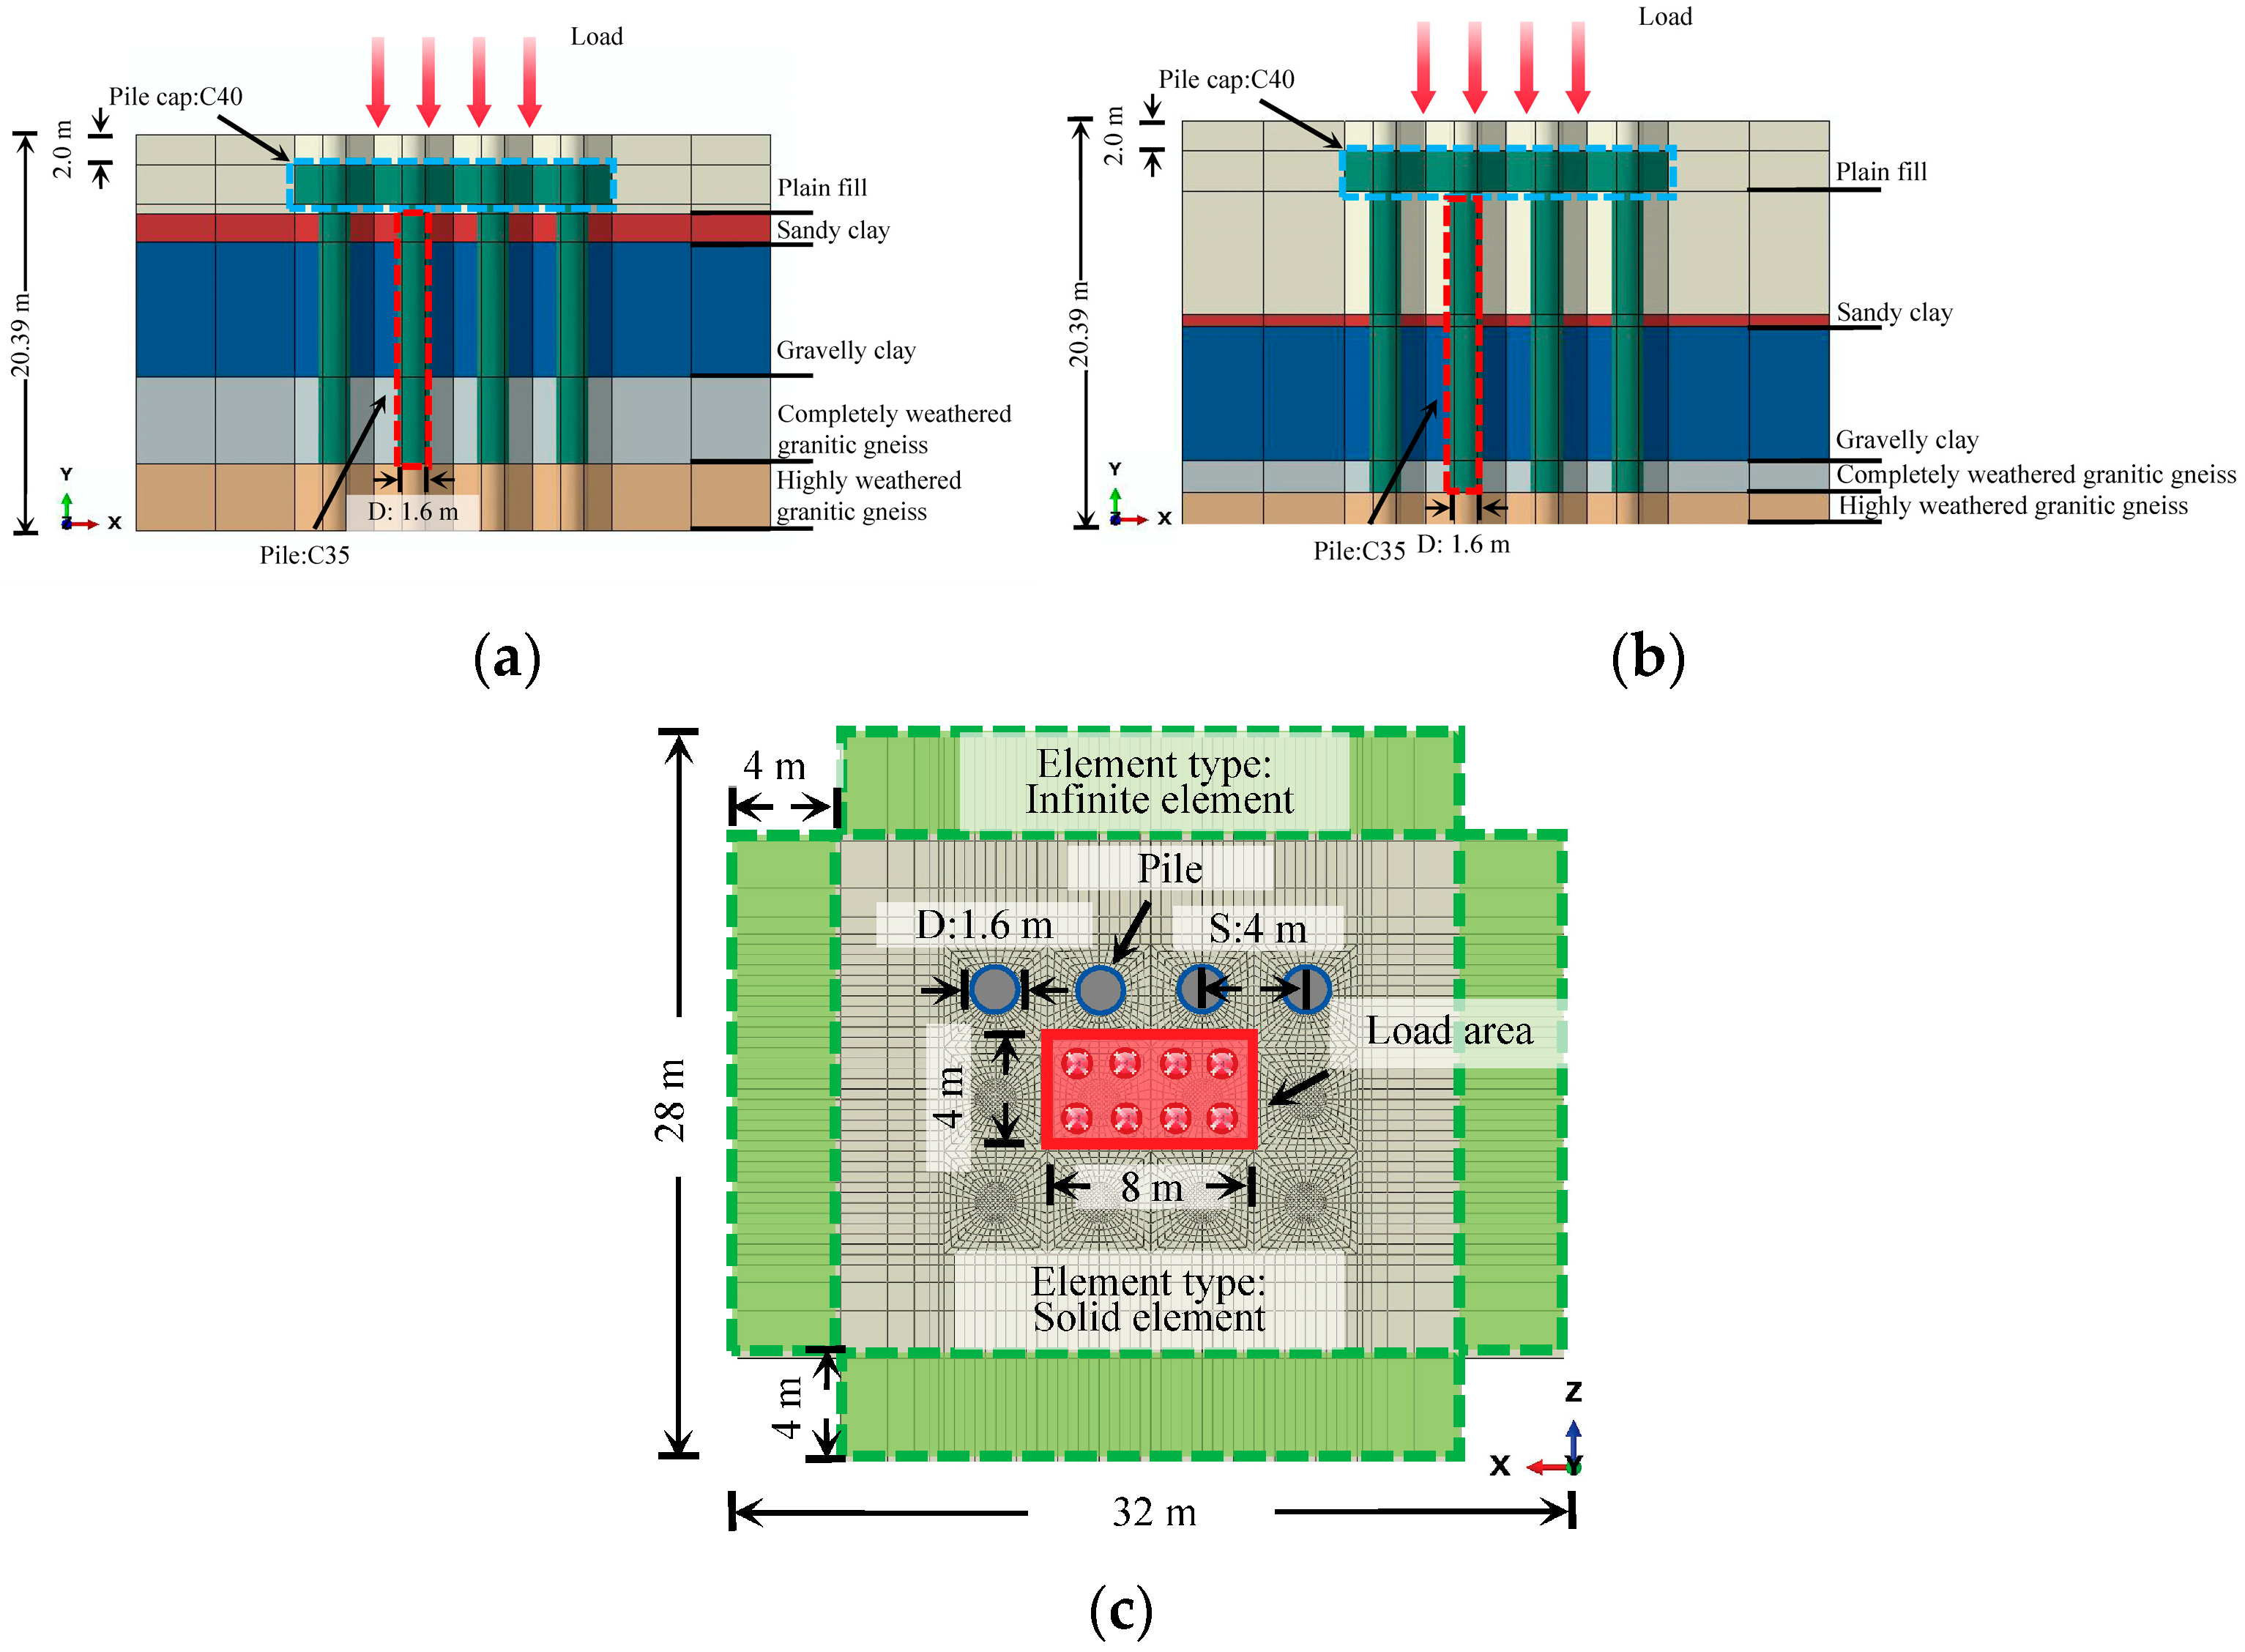
The soil profiles and corresponding geotechnical parameters for Building A and Building B are detailed in Table 6. While the types of soil layers beneath the two sections are identical, they differ in layer thickness. Moreover, the soil layer thickness beneath each building is not uniformly distributed. For the purpose of finite element modeling, the soil strata are simplified as horizontally layered, as illustrated in Figure 16.
Table 6.
Soil profile and key geotechnical parameters.
Figure 16.
FEM for the assessing effect of soil profile variations. (a) Cross section of FEM at Building A site; (b) Cross section of FEM at Building B site; (c) Plan view of the FEM.
The objective of the FEM in this section is to compare the differences in ground vibration responses resulting from variations in soil layer distribution. Therefore, the excitation is applied as a harmonic surface stress with an amplitude of 1000 Pa, and a steady-state dynamic analysis step is adopted. At this stage, a complex vehicle-track dynamic coupling model for simulating train accelerating or braking conditions to compute wheel-rail contact forces has not been established, while this will be addressed in future work.
As shown in Figure 16, the established FEM measures 32 m × 28 m × 20 m, with a surface loading area of 8 m × 4 m. The pile foundation consists of 12 piles, each with a diameter of 1.6 m. The pile cap is embedded 1.5 m below the ground surface and measures 16 m × 12 m × 2 m. Both the pile cap and piles are constructed using C35-grade concrete.
Based on calculations, the compression wavelength in the plain fill layer at 100 Hz is 1.3 m. Accordingly, the element size within the foundation zone of the FEM is set to 0.2 m [29]. The model for Building A comprises 199,966 solid elements and 16,011 infinite elements, while that for Building B consists of 237,522 solid elements and 17,582 infinite elements.
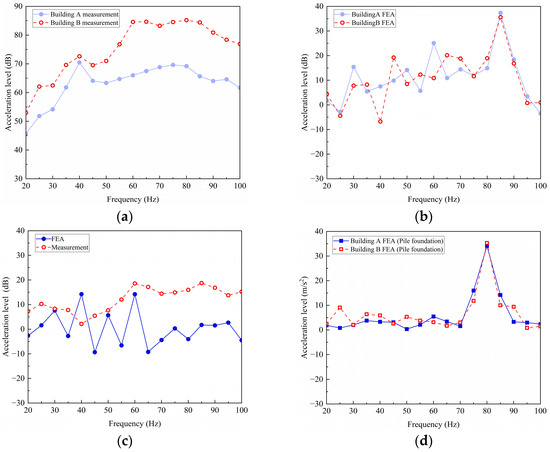
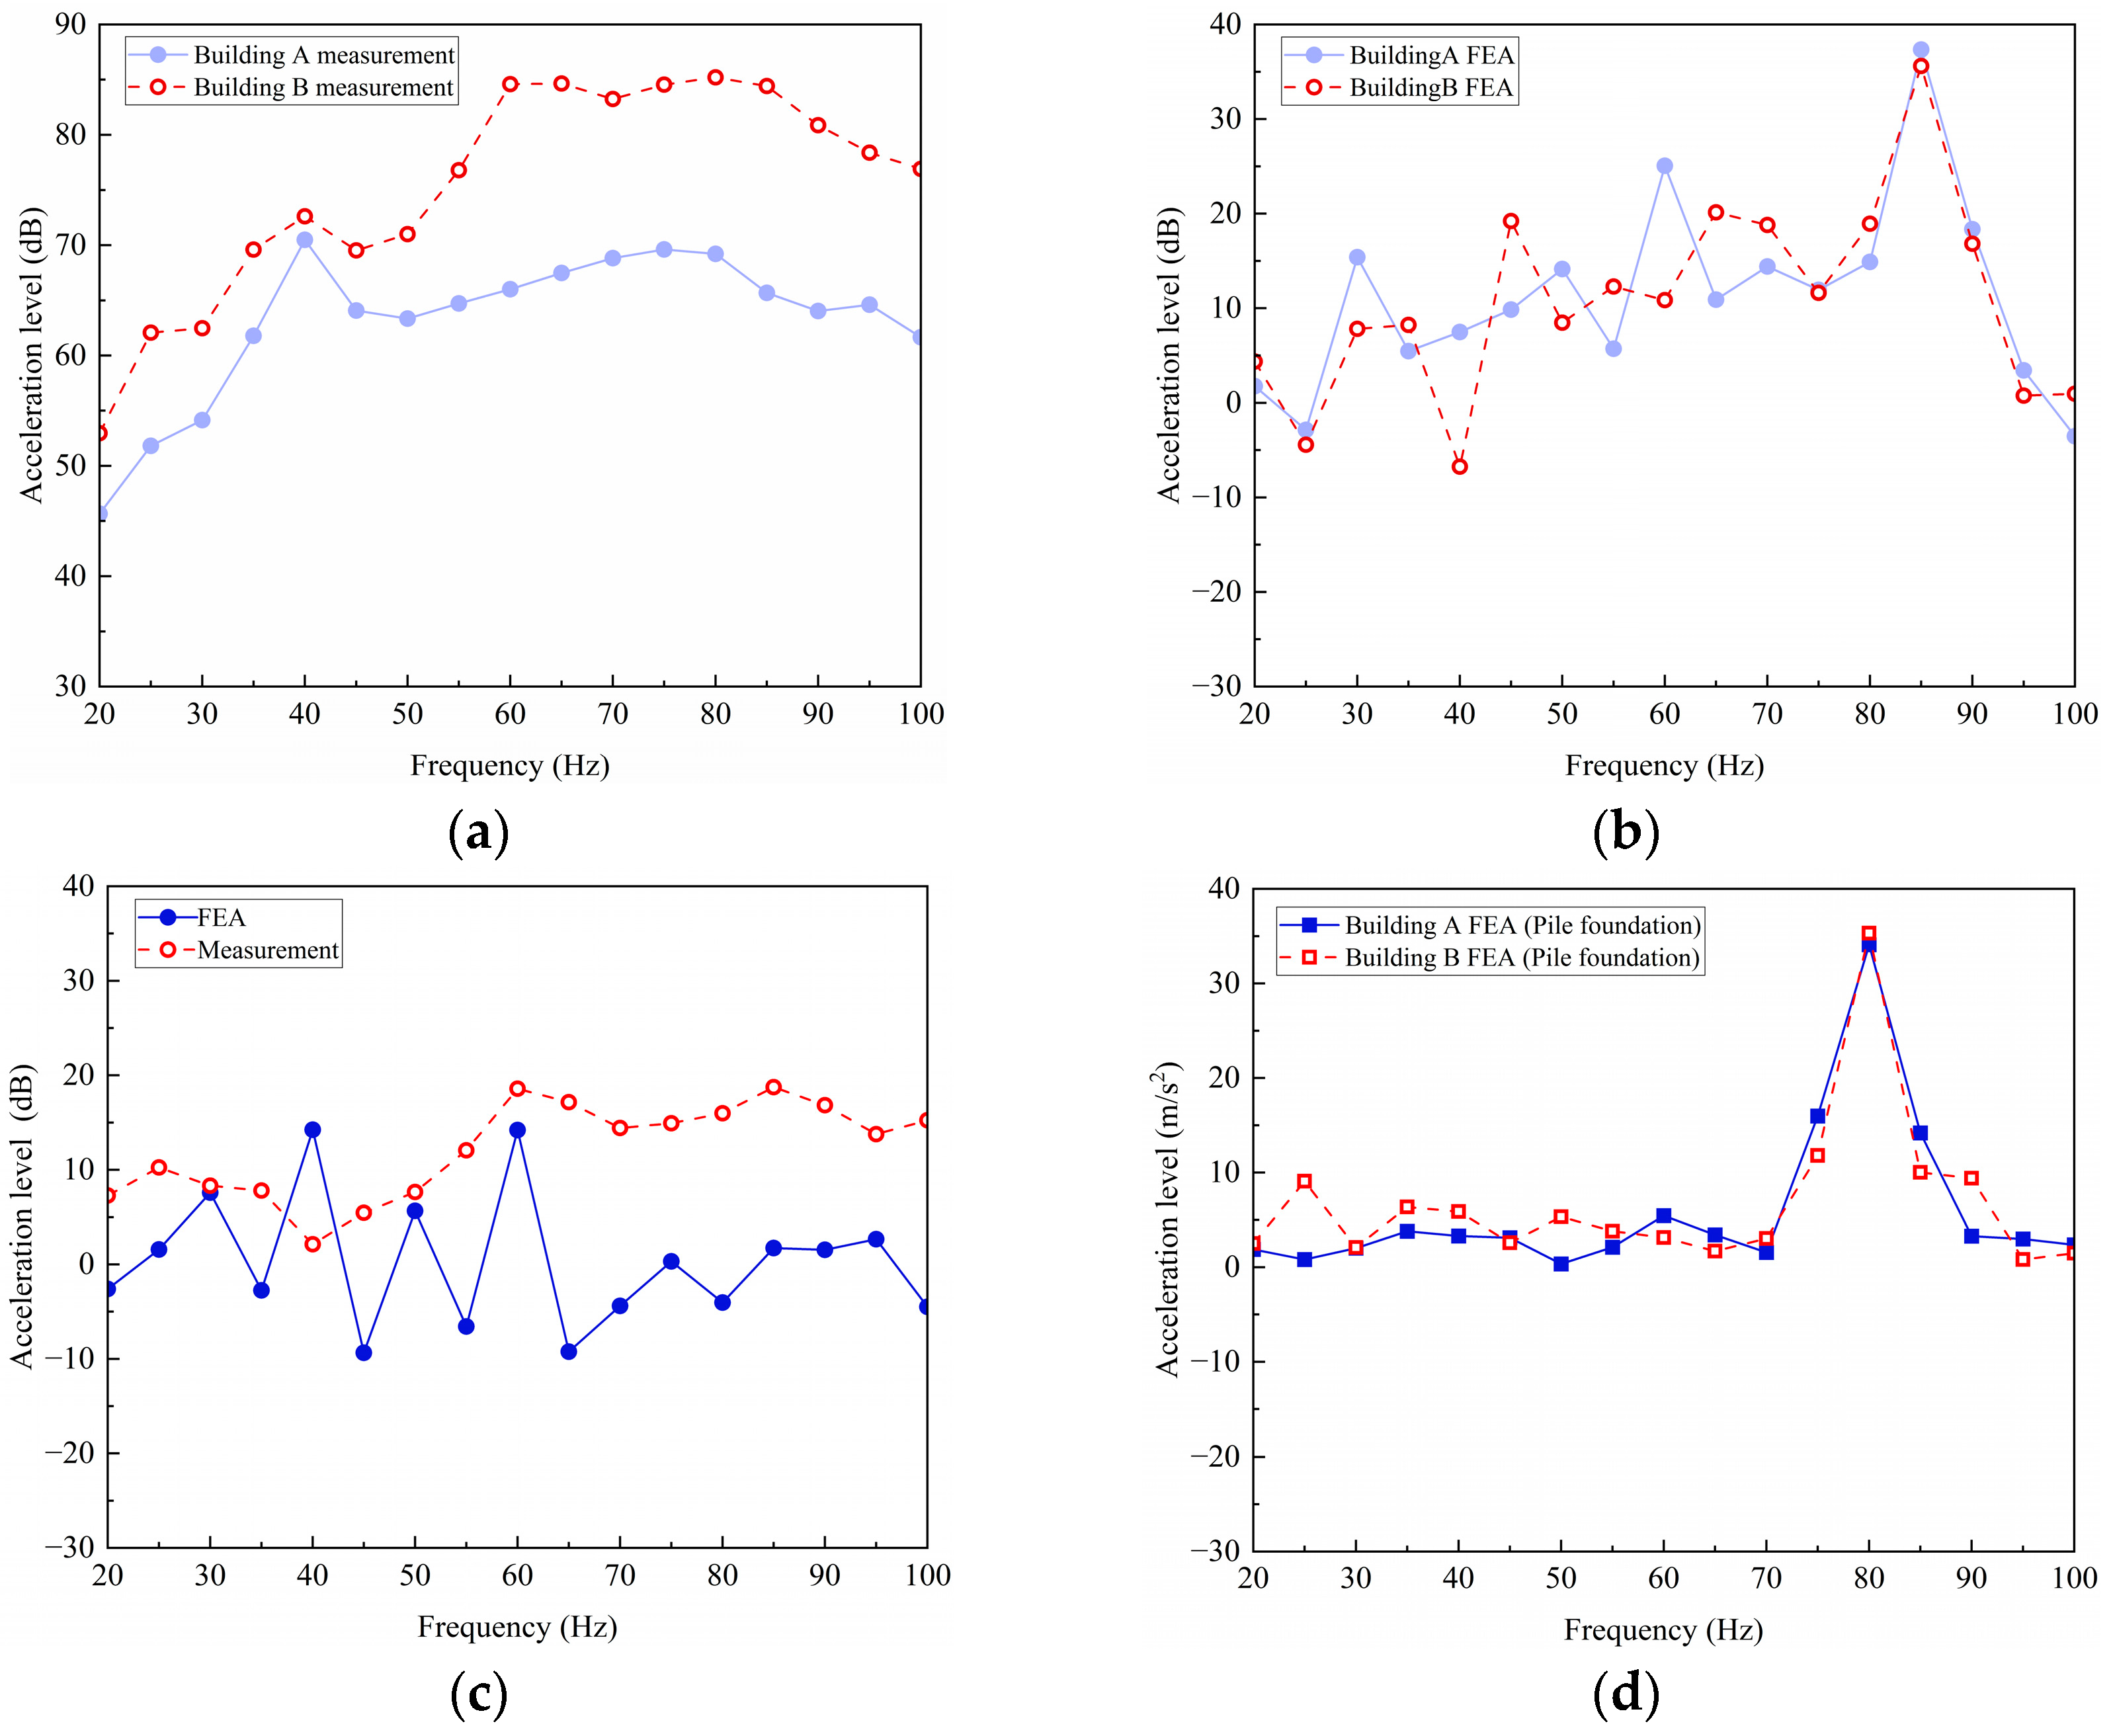
Figure 17a compares the narrow-band vibration acceleration spectra in the 20–100 Hz range for measurement point B1 of Building A (located 4.8 m from the track centerline) and point B9 of Building B (located 4.2 m from the track centerline). Despite their similar distances from the track, the vibration acceleration at B1 during train cruising is notably lower than that at B9 during train acceleration and braking. This difference is particularly pronounced in the 50–100 Hz frequency range, exceeding 20 dB, which aligns with the earlier analysis.
Figure 17.
Comparison of acceleration levels between two test sections. (a) Measured free field spectra between two test sections; (b) FEM-predicted free field spectra between two test sections; (c) Free field spectra difference; (d) FEM-predicted above-foundation surface spectra between two test sections.
Figure 17b compares the computed narrow-band acceleration spectra from the free field FEM of Building A and Building B, at locations 4.8 m and 4.2 m from the loading center, respectively. The results indicate that the differences between the two models are generally small, especially above 70 Hz. Figure 17c compares the measured and FEM-predicted acceleration level differences between the two test sections. It can be observed that, above 65 Hz, the measured difference is significantly larger than the FEM-predicted difference, exceeding 10 dB in the high-frequency range. Furthermore, Figure 17d compares the narrow-band acceleration spectra at the ground surface above the embedded building foundations, at equal distances from the loading center for two test sections. The results show that, with the foundations included, the differences in ground vibration response between the two sites are further reduced compared to the free field case in Figure 17b. This finding provides indirect quantitative support for the influence of different train operating conditions (cruising vs. accelerating/braking) on ground-borne vibration along the test line. Future work will involve refining the simulation model and conducting additional field tests to further investigate the specific effects of train operating conditions.
5. Conclusions
This study investigated the differences in vibrations induced by train cruising in the middle section of a test line and those generated by train acceleration or braking at the terminal section. Ground-borne vibrations and structural responses at the base of shear walls in high-rise over-track buildings were measured and analyzed. The main findings are as follows:
- (1)
- In the free field, ground surface vibrations followed a consistent attenuation trend with increasing distance from the track. In contrast, vibrations near ground-level positions above building foundations were notably affected by surrounding structures.
- (2)
- A time-varying frequency phenomenon was observed at measurement points on the ground above the foundation and at shear wall bases during train acceleration and braking, particularly during braking. Future work will utilize theoretical analysis and numerical simulation to explore the underlying mechanisms of this phenomenon.
- (3)
- Field measurements indicated that vertical vibrations in the free field at the terminal section were significantly greater than those in the middle section, whereas vertical vibrations at shear wall bases were comparable between the two sections. Finite element analysis was used to numerically assess the effect of soil profile variation. It was demonstrated that soil profile variation alone was inadequate to fully explain the observed differences in ground-borne vibration between the two test sections.
- (4)
- Considerable vibration transmission loss was observed as vibrations propagated into the high-rise building structure, with peak losses reaching 20 dB at 80 Hz during cruising and 35 dB at 125 Hz during acceleration and braking.
The findings and conclusions of this study are based on a specific configuration comprising a single test line within one depot, two structurally identical high-rise over-track buildings, and a defined train and track system. While this controlled setup enabled a focused investigation into vibration differences between train operating modes, the generalizability of results to other site conditions requires further validation. Future research will specifically address the influence mechanisms of train acceleration and braking on elevated ground-borne vibrations and the associated vibration transmission into and within high-rise buildings.
Author Contributions
Formal analysis and writing—original draft preparation, Z.T.; validation and writing—review and editing, Y.C.; conceptualization, methodology, and writing—review and editing, H.W.; methodology and writing—review and editing, Q.L.; Resources and data curation, Y.W.; Formal analysis, investigation and data curation, H.L.; Formal analysis and writing—review and editing, J.L.; Formal analysis and software, L.S. All authors have read and agreed to the published version of the manuscript.
Funding
This research was funded by the National Natural Science Foundation of China under grants 52408475.
Data Availability Statement
Data will be made available from the corresponding author upon reasonable request.
Conflicts of Interest
The authors declare that the research was conducted in the absence of any commercial or financial relationships that could be construed as a potential conflict of interest.
Abbreviations and Terminology
The following abbreviations and terminology are used in this manuscript:
| B1/B3/B8/B9 | Measurement points located on the ground surface in the free field. |
| N1/N2/B5/B6 | Measurement points located on the ground surface above the foundation. |
| N1W/N2W/B5W/B6W | Measurement points located at bases of shear walls. |
| Free field | An area unaffected by structural reflections or wave modifications. |
| Ground above foundation | The ground surface immediately overlying the building foundation. |
| Shear wall | Vertical structural elements designed to resist lateral loads. |
| Test line | A designated track in the metro depot used for controlled experimental train operations under specific conditions. |
| Transmission loss | The reduction in vibration energy between two points, quantified in decibels (dB) as the logarithm of the ratio of response amplitudes. |
References
- Diao, M. Does Growth Follow the Rail? The Potential Impact of High-Speed Rail on the Economic Geography of China. Transp. Res. Part A Policy Pract. 2018, 113, 279–290. [Google Scholar] [CrossRef] [Scilit]
- Ingvardson, J.B.; Nielsen, O.A. Effects of New Bus and Rail Rapid Transit Systems–An International Review. Transp. Rev. 2018, 38, 96–116. [Google Scholar] [CrossRef] [Scilit]
- Wu, H.; Zhang, W.; Liu, Z.; Bai, X.; Huang, J.; Huang, J.; Wu, Z. Generation and Characteristics of Construction Noise in Rail Transit Engineering Enclosure Structures. Buildings 2024, 14, 970. [Google Scholar] [CrossRef] [Scilit]
- Connolly, D.P.; Marecki, G.P.; Kouroussis, G.; Thalassinakis, I.; Woodward, P.K. The Growth of Railway Ground Vibration Problems—A Review. Sci. Total Environ. 2016, 568, 1276–1282. [Google Scholar] [CrossRef] [Scilit]
- Zhao, K.; He, B. The Impact of New Subway Construction on the Commuting Methods and Time Utilization of Residents Along the Line: A Comparison Before and After the Completion of the Subway in Kunming City. ISPRS Int. J. Geo-Inf. 2025, 14, 258. [Google Scholar] [CrossRef] [Scilit]
- Yuan, B.; Huang, X.; Li, R.; Luo, Q.; Shiau, J.; Wang, Y.; Yuan, J.; Sabri, S.M.M.; Huang, S.; Liao, C. Dynamic behavior and deformation of calcareous sand under cyclic loading. J. Soil Dyn. Earthq. Eng. 2025, 199, 109730. [Google Scholar] [CrossRef] [Scilit]
- Yuan, B.; Huang, Q.; Xu, W.; Han, Z.; Luo, Q.; Chen, G.; Yuan, J.; Zhang, Q.; Sabri, S.M.M. Study on the interaction between pile and soil under lateral load in coral sand. Geomech. Energy Environ. 2025, 42, 100674. [Google Scholar] [CrossRef] [Scilit]
- Li, W.; Liu, W. A Novel Formulation for Transfer Path Identification and Vibration Prediction in the Over-Track Building Induced by Trains. Environ. Sci. Pollut. Res. 2023, 30, 52732–52748. [Google Scholar] [CrossRef] [Scilit]
- Cui, G.; Tao, X.; Wang, F.; Chen, X. An Idea to Simulate the Environmental Vibration Caused by Urban Rail Traffic. In Proceedings of the 2010 International Conference on Optoelectronics and Image Processing, Haikou, China, 11–12 November 2010; pp. 208–213. [Google Scholar]
- Wang, F.; Tao, X.; Zheng, X. Inversion of Excitation Source in Ground Vibration from Urban Railway Traffic. Sci. China Technol. Sci. 2012, 55, 950–959. [Google Scholar] [CrossRef] [Scilit]
- Tao, X.; Zheng, X.; Xing, Q. Virtual Inversion of Environment Vibration Sources Caused by Rail Traffic in Urban Areas. In Proceedings of the 14th International Conference on Urban Transport and the Environment, Malta, 22–24 September 2008; WIT Press: Southampton, UK, 2008; pp. 385–393. [Google Scholar]
- Wang, L.; Ping, W.; Zhao, C.; Liu, D.; Ke, W. An experimental study on the characteristics of vibration source in urban rail transit turnouts. Proc. Inst. Mech. Eng. Part F J. Rail Rapid Transit 2019, 234, 945–957. [Google Scholar] [CrossRef] [Scilit]
- Qu, S.; Yang, J.; Zhu, S.; Zhai, W.; Kouroussis, G.; Zhang, Q. Experimental Study on Ground Vibration Induced by Double-Line Subway Trains and Road Traffic. Transp. Geotech. 2021, 29, 100564. [Google Scholar] [CrossRef] [Scilit]
- Zhou, Y.; Ma, K.; Chen, P.; Lu, D.; Wu, H. Investigations on Train-induced Vibration and Vibration Control of an Over-track Building Using Thick-layer Rubber Bearings. Struct. Des. Tall Spec. Build. 2022, 31, e1898. [Google Scholar] [CrossRef] [Scilit]
- Zhou, Y.; Zhang, Z.; Vassiliou, M.F. Mechanical Properties of Thick Rubber Bearings Used in Over-Track Buildings. In World Conference on Seismic Isolation; Springer: Cham, Switzerland, 2022; pp. 345–356. [Google Scholar]
- Takei, Y.; Yamada, S.; Izumi, Y.; Fujii, K. Application of Seismic and Vibration Isolation Structure System to Design of Over-Track Buildings. Q. Rep. Rtri 2007, 48, 50–57. [Google Scholar] [CrossRef] [Scilit]
- Yan, W.; Zhang, Y.; Ren, M.; Feng, J.; Nie, H.; Chen, J. In Situ Experiment and Analysis of Environmental Vibration Induced by Urban Subway Transit. J. Beijing Univ. Technol. 2006, 32, 149–154. [Google Scholar]
- Tao, Z.; Zhang, D.; Tu, D.; He, L.; Zou, C. Prediction of Train-Induced Ground-Borne Vibration Transmission Considering Parametric Uncertainties. Probabilist. Eng. Mech. 2025, 79, 103731. [Google Scholar] [CrossRef] [Scilit]
- Qu, S.; Yang, J.; Zhu, S.; Zhai, W.; Kouroussis, G. A hybrid methodology for predicting train-induced vibration on sensitive equipment in far-field buildings. Transp. Geotech. 2021, 31, 100682. [Google Scholar] [CrossRef] [Scilit]
- Hao, Y.; Qi, H.; Liu, S.; Nian, V.; Zhang, Z. Study of Noise and Vibration Impacts to Buildings Due to Urban Rail Transit and Mitigation Measures. Sustainability 2022, 14, 3119. [Google Scholar] [CrossRef] [Scilit]
- Chen, Y.; Feng, Q.; Liu, Q. Experimental Study on the Train-Induced Vibration Characteristics in the over-Track Buildings of Metro Depots. J. Build. Eng. 2025, 111, 113523. [Google Scholar] [CrossRef] [Scilit]
- Hu, J.; Zou, C.; Liu, Q.; Li, X.; Tao, Z. Floor Vibration Predictions Based on Train-Track-Building Coupling Model. J. Build. Eng. 2024, 89, 109340. [Google Scholar] [CrossRef] [Scilit]
- Wang, S.; Cao, Z.; Xu, Y.; Xiao, Z.; Yuan, Z.; Cai, Y.; Gou, C. Prediction and Mitigation of Train-Induced Vibrations of Over-Track Buildings on a Metro Depot: Field Measurement and Numerical Simulation. J. Vib. Control 2023, 29, 5413–5426. [Google Scholar] [CrossRef] [Scilit]
- Zhang, K.; Wang, Y.; Chen, Y.; Qiu, S.; Yi, H.; Yang, J. Investigation of the Axial-Bearing Mechanism of Single and Group Squeezed Branch Piles in Soft Soil Combining Field Measurements and Numerical Modeling. Int. J. Geomech. 2025, 25, 04025225. [Google Scholar] [CrossRef] [Scilit]
- Di, G.; Li, H.; Guo, J. Predicting the Influence of Vibration from Trains in the Throat Area of a Metro Depot on Over-Track Buildings. Appl. Sci. 2024, 14, 8598. [Google Scholar] [CrossRef] [Scilit]
- Jing, M.; Lu, F.; Chen, Y.; Li, Y.; Gao, S.; Zhang, R. Research on the Vibration Response and Control Technologies for Buildings above the Metro Depot. J. Build. Eng. 2025, 109, 112908. [Google Scholar] [CrossRef] [Scilit]
- Zou, C.; Zhao, Y.; Luo, W.; Guo, W.; Shen, Z. Dynamic Coupling Mechanisms and Hybrid Mitigation of Vibration Transmission in Metro Depot Climbing Lines. Constr. Build. Mater. 2025, 492, 142873. [Google Scholar] [CrossRef] [Scilit]
- Wang, T.; Jiang, B.; Sun, X. Train-Induced Vibration Prediction and Control of a Metro Depot and Over-Track Buildings. Buildings 2023, 13, 1995. [Google Scholar] [CrossRef] [Scilit]
- Langer, P.; Maeder, M.; Guist, C.; Krause, M.; Marburg, S. More than six elements per wavelength: The practical use of structural finite element models and their accuracy in comparison with experimental results. J. Comput. Acoust. 2017, 25, 1750025. [Google Scholar] [CrossRef] [Scilit]

Disclaimer/Publisher’s Note: The statements, opinions and data contained in all publications are solely those of the individual author(s) and contributor(s) and not of MDPI and/or the editor(s). MDPI and/or the editor(s) disclaim responsibility for any injury to people or property resulting from any ideas, methods, instructions or products referred to in the content. |
© 2025 by the authors. Licensee MDPI, Basel, Switzerland. This article is an open access article distributed under the terms and conditions of the Creative Commons Attribution (CC BY) license (https://creativecommons.org/licenses/by/4.0/).