Abstract
Precast concrete with a moment-resisting frame with hybrid beam–column connections (HBC), which is featured by inelastic deformation induced by opening and closing of the interface between precast beam and column, has been emphasized in recent years. Precast concrete frame structures with HBC are difficult to simulate because current numerical models usually adopt multiple elements to simulate contact surfaces, resulting in complexity, low computational efficiency, and a difficult modeling process. To explore the opening and closing behavior of the interface of the hybrid beam–column connection, a refined multi-spring model (MSM) with only two gap elements whose position and capacity is determined by a simple advanced section analysis method is proposed. The proposed multi-spring model, which is obviously with high computational efficiency, is able to tracking accurately the change in compressive zone height of the interface between precast beam and column and count in “beam elongation effects”. The proposed model was employed to simulate four prestressed precast beam–column connections. The accuracy of the analytical model was validated by examining three aspects: global mechanical performance, stress in prestressed tendons, and compression zone depth.
1. Introduction
Compared with conventional monolithic concrete structures, precast concrete systems are advantageous in product quality, cost efficiency, and speed of construction [1,2,3,4,5]. Precast concrete frame systems with hybrid beam–column connections are widely used and commonly accepted in main design codes worldwide.
Many scholars have conducted a large number of test studies on hybrid connections, increasing the understanding of HBC [6,7,8,9,10,11].
In precast frames with HBC, the inelastic deformation demand is concentrated at and provided by the opening and closing of the beam–column interface. A variety of numerical models, including macro-models (lumped plasticity model, MSM) and micro-models (Solid model), have been proposed to predict the behavior of hybrid connections with different levels of complexity [3,12,13,14,15,16,17,18,19,20]. Lumped plasticity models are used widely with good accuracy and low computational cost, but it is difficult to simulate “beam elongation effect”, the shift in the neutral axis, or many other characteristics that reflect the joint’s true behavior.
MSM can be used to analyze the rocking behavior and capture the beam elongation effects of HBC, and such an approach has been widely used to model hybrid connections. In this model, the joint itself was assumed to remain rigid, while the beams and column elements were assumed to remain elastic. Inelastic action was supposed to concentrate in the grout (at the beam–column interface) and mild steel bars. Truss elements were used to model the reinforcing steel, while a prestressing element was used to prestress the joint and gap elements together, which were evenly spaced along the height of the interface and used to represent the grout (at the beam–column interface) behavior [17,18,19,20,21].
Refined Solid Model: In this approach, concrete members are modeled using solid elements. Ordinary reinforcement and prestressing tendons are modeled with truss or beam elements. At the connections, the reinforcement elements are either rigidly connected to the concrete elements or connected using interface elements to simulate bond-slip behavior. The initial prestress is also commonly applied via the temperature-induced contraction method or the initial stress method [15,22,23,24,25,26]. The main advantage of this model type is its ability to establish a highly detailed representation of the connections, where all components are explicitly modeled. However, its drawbacks include complex model construction, lower computational efficiency, and less robust numerical stability.
In MSM, the number of springs significantly influences the model’s accuracy. To enhance accuracy, it is generally necessary to configure a sufficient number of springs. However, this leads to a substantial increase in the number of model elements, which compromises computational efficiency and stability [16,19,27]. The conventional multi-spring models often determine the location and mechanical properties of interface springs through purely mathematical integration schemes (e.g., Gaussian, Lobatto). This approach suffers from two fundamental deficiencies:
- Lack of Physical Clarity: The springs lack a direct correspondence to identifiable physical mechanisms (e.g., concentrated compression zone, discrete shear transfer). This obscures the model’s interpretation and hinders its utility for guiding design.
- Numerical Inefficiency: The proliferation of springs required by these methods often leads to numerical instability and significant computational cost, limiting the model’s practicality for large-scale or dynamic analysis.
Therefore, a critical scientific problem remains: How to develop a multi-spring modeling framework that moves beyond mathematical abstraction to one grounded in clear physical mechanics, while simultaneously achieving superior computational robustness and efficiency for prestressed precast connections?
The overarching goal of this study is to develop, validate, and demonstrate a refined MSM for prestressed precast concrete connections that explicitly links the model’s parameters to physical components and behaviors, thereby offering enhanced interpretability, numerical stability, and computational efficiency compared to existing integration-based approaches.
The proposed refined MSM that utilizes only two compression-only spring elements to simulate the mechanical behavior of the compression zone at the interface, with a clear physical interpretation, and significantly improves computational efficiency. A section analysis method is employed to determine the positions and weighting factors of the two gap elements. Numerical simulations of multiple tests demonstrate that the results closely match experimental data in terms of overall mechanical performance, mild steel reinforcement strain, prestressed tendon stress, and the center of compression. These findings confirm the validity of the proposed model.
2. Methodology
2.1. Methodological Scheme
Problem Definition and Scoping
- (1)
- Objective: To develop a mechanically clear and computationally efficient MSM for prestressed precast concrete connections.
- (2)
- Scope Definition: The model focuses on simulating the key behavioral aspects of the connection, including the concrete compressive zone, the unbonded prestressing tendon, and the interface shear transfer.
Critical Review of Existing Approaches
- (1)
- Analysis of Conventional Multi-Spring Models: Examine models that use Gaussian/Lobatto integration to determine spring locations and properties. Identify their core limitations:
- (2)
- Lack of Physical Meaning: Spring Distribution and properties are derived mathematically, not from physical material behavior.
- (3)
- Numerical Instability: A relatively large number of springs is required to obtain sufficiently accurate analysis results. However, an excessive number inevitably increases model complexity, raises modeling workload, and introduces computational convergence issues.
Identification of Research Gap: The need for a model where spring location and properties are directly linked to the connection’s physical mechanics, with the goal of achieving the most accurate calculation results with the fewest springs.
Conceptualization of the proposed Model
- (1)
- Core Innovation: Replace the numerous, mathematically defined springs with a minimal set of macro-scale springs, each with a distinct physical role.
- (2)
- Spring System Definition: This paper develops a section analysis method (SAM) to determine the distribution of the spring and the mechanical property for each gap element is derived from the mechanical property of the scope of concrete it represents.
The key steps of the model development are shown in Figure 1. The detailed modeling methodology is described below.
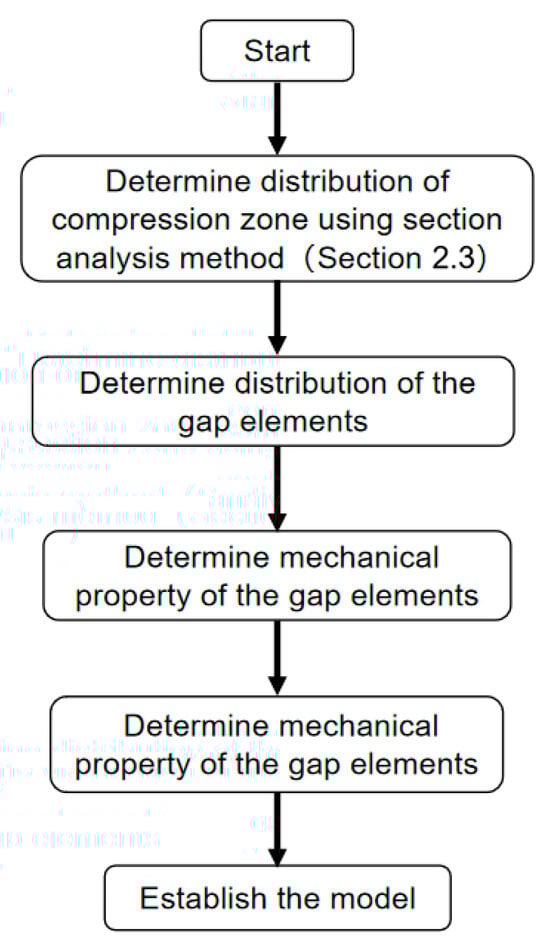
Figure 1.
The key steps of the model development.
2.2. Principle
The opening and closing of the beam–column interface under external forces, as the HBC undergoes deformation, is the primary cause of structural nonlinear behavior.
The nonlinear behavior of HBC is primarily generated by the opening/closing of its contact interfaces. Therefore, the model must be capable of accurately simulating the stress and strain distribution at the joint interfaces. The length of the inner lever arm (distance from reinforcement to compression center) at the contact interfaces should be accurately simulated, which is proportionate to the capacity of HBC. With increasing loading, the neutral axis moves from infinity into the contact interface and decreases in size with increasing gap opening; finally, with the crushing of the edge concrete, the compression zone increases in size. Figure 2 shows that two gap elements in the compression area (the proposed model in this paper, hereinafter referred to as model 2) can simulate the shift in the neutral axis more accurately than one gap element (model 1). In model 2, with two suitable locations and mechanical property gap elements, the simulated neutral axis firstly moves from outside the contact interface into the contact interface, and the compression center moves downward into the scope between F1 and F2; with the loading increasing, the F1 begins to decline, and the compression center begins to move upward (shown in Figure 2c). The key to model 2 lies in defining the positions and weightings of the two gap elements to accurately simulate the mechanical performance of the contact surface and the position of the compression center.
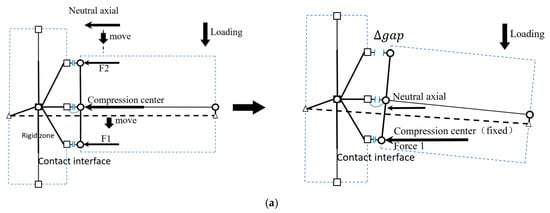
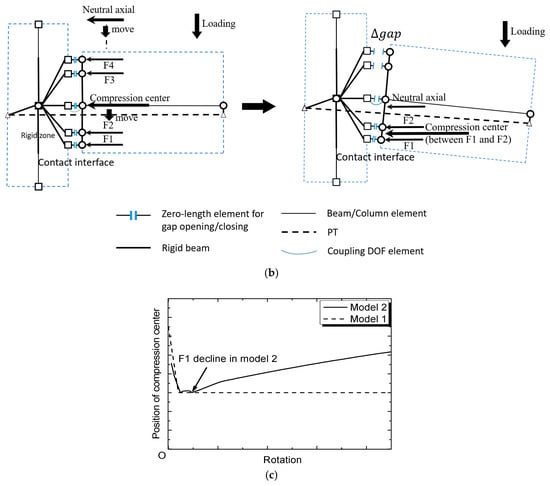
Figure 2.
Shift in the compression center (numerically simulated); (a) model 1 (one spring for compression zone); (b) model 2 (two springs for compression zone); (c) position of compression center.
2.3. Section Analysis Method for Distribution and Mechanical Property of the Gap Elements
The key to the proposed model lies in how to define the positions and weightings of the two gap elements to accurately simulate the mechanical performance of the contact surface.
In reference [19], Gaussian integration and Lobatto integration are used to determine the spring positions and mechanical properties. However, this method, which relies solely on mathematical derivation to determine the spring positions and mechanical properties, lacks clear physical significance. Additionally, it requires the setup of three or more pairs of springs. An excessive number of springs will inevitably increase the complexity of the model and lead to numerical stability issues.
To accurately simulate the variation in the height of the compression zone on the contact surface of the connection during forward loading, this paper develops a section analysis method (SAM), which is developed based on the cross-section analysis method proposed in Reference [28]. This program can solve for the bending moment capacity and the height of the compression zone of the contact surface under a given rotation angle.
The SAM employs the section strip analysis method (Figure 3) to analyze the mechanics of the contact surface. Based on the mechanical properties of steel reinforcement and concrete, force equilibrium and moment equilibrium are utilized to analyze the sectional stress state.
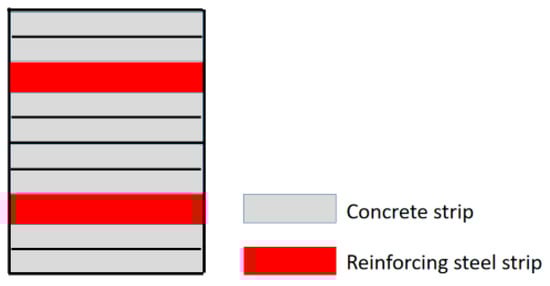
Figure 3.
Schematic diagram of section strip division.
The procedure is as follows (Figure 4):
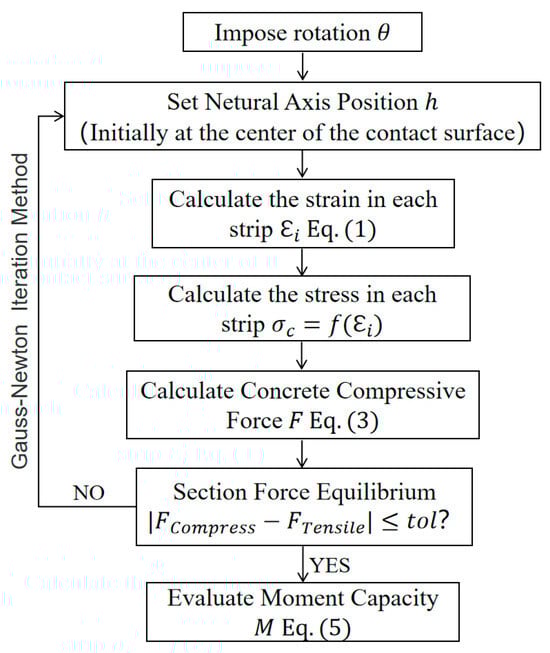
Figure 4.
Flowchart of the SAM.
After determining the height of the compression zone, the position of the resultant force point in the concrete compression zone is solved using the following method:
Assuming the rotation angle of the beam–column contact surface is θ (Figure 5), the compression zone is divided into n equal segments, with the height of each segment denoted as h1, h2, h3, …, hi, …, hₙ. The distance from the center point of each segment to the neutral axis is C1, C2, C3, …, Ci, …, Cₙ, and the deformation development range of each segment is Lₚ (plastic zone length). The strain of each segment is then given by the following:
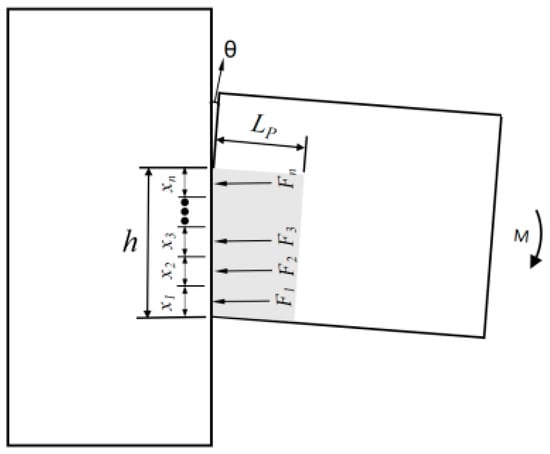
Figure 5.
Force diagram of the compression zone of the contact surface.
Once the strain is known, the stress can be determined based on the uniaxial constitutive relationship of concrete.
The resultant force of the compression zone is calculated as follows:
where b denotes the width of the beam section at the joint.
The resultant moment is given by the following:
The distance from the point of resultant force to the neutral axis is as follows:
The plastic hinge length at the beam end is taken as h/3 [29]. The constitutive relationship of concrete is modified to account for the confining effect of stirrups, and the stress–strain curve of confined concrete is determined with reference to [30]. Using the aforementioned algorithm, the variation in the height of the concrete compression zone and the relationship between the position of the resultant force in the concrete compression zone (distance from the beam bottom) of the contact surface and the rotation angle are calculated, as shown in Figure 5.
The SAM is used to determine the position of the height of the compression zone and the resultant force. The minimum distance from the resultant force point of the compression zone to the bottom edge of the section is assumed to be h1, and the position of the neutral axis at the maximum sectional deformation (θ = 0.05) is h2.
In the model, the minimum distance from the resultant force point of the compression zone to the bottom edge of the section corresponds to the location of spring C7-B7. Therefore, this spring is positioned at h1. Since the spring represents the mechanical properties of the concrete within the area centered at its location, it represents the concrete within the area extending to a distance of 2h1 from the bottom.
The maximum height of the neutral axis is h2. Thus, the total area represented by springs C6-B6 and C7-B7 corresponds to the concrete within the area extending to a distance of h2 from the bottom. The distance from spring C6-B6 to the bottom edge of the section is calculated as follows (shown in Figure 6):
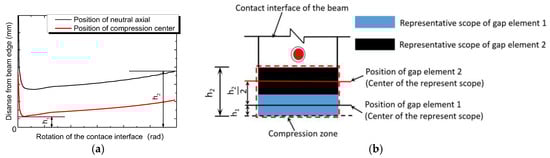
Figure 6.
Determination of the position of gap elements: (a) section analysis results; (b) distribution of springs.
The mechanical property of each gap element is derived from the mechanical property of the scope of concrete it represents. Details of the model will be introduced in Section 2.2.
3. Experiment and Numerical Model
3.1. Experiment
Tests were conducted on four specimens of Unbonded Post-Tensioned Precast beam–column connections [4]: two exterior precast connections and two interior precast connections. The model is shown in Figure 7 and Figure 8. Reinforcement information is in Table 1. Quasi-static tests were carried out to investigate the hysteretic behavior, stiffness, bearing capacity and deformation capacity of the beam-to-column dry connection assembled by post-tensioned tendons under slow reversed cycle loading.
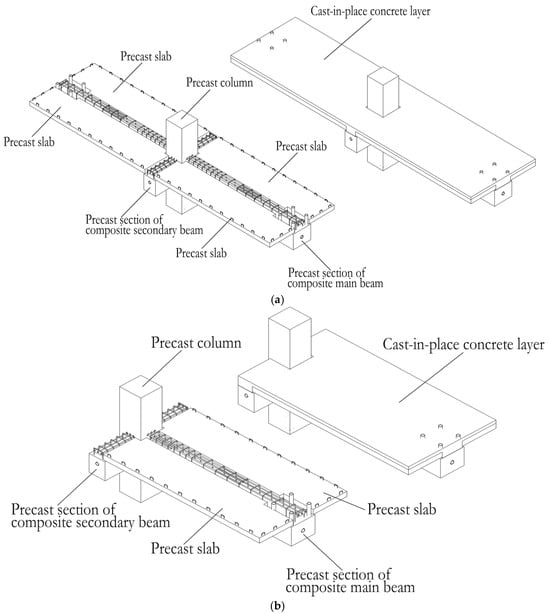
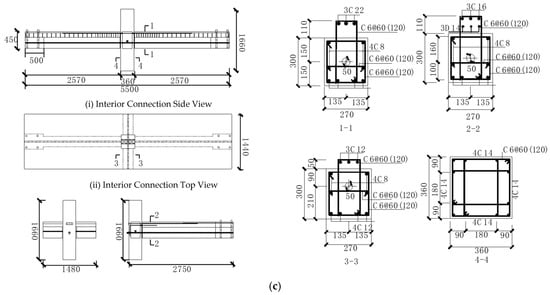
Figure 7.
Connection specimens: (a) interior connection; (b) exterior connection; (c) reinforcement drawing.
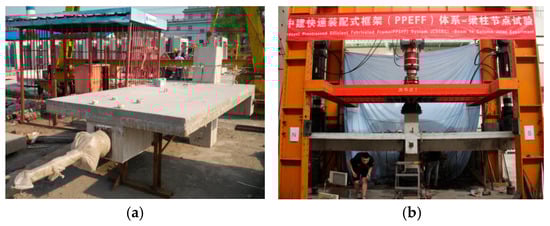
Figure 8.
Connection test: (a) specimen fabrication; (b) specimen loading.

Table 1.
Test specimens.
3.2. Numerical Model
The proposed numerical model was developed using OpenSees 3.3.0 [31], as shown in Figure 9.
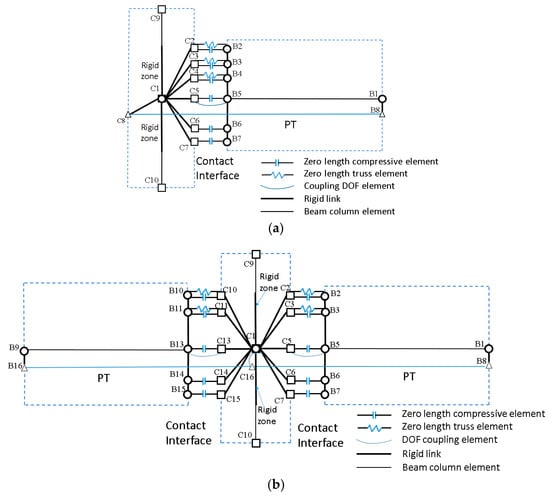
Figure 9.
Numerical model: (a) exterior joint; (b) interior joint.
- (1)
- Zero-length elements with compression-only material properties (gap elements) are adopted to simulate the opening/closing behavior of the contact interface.
- (2)
- Truss element with STEEL02 [32] material (assigned initial strain), which takes isotropic hardening and Bauschinger effect into consideration, is used to simulate PT.
- (3)
- Distribution reinforcement in slab, energy dissipation mild-steel are all simulated by zero-length elements using STEEL02 material. CONCRETE02 [33] material is used to simulate the concrete, transverse confinement effect is accounted [34]. The length of the truss element in this model () is different from the actual length of unbonded reinforcement in test (), so the material properties and area of the elements require modification (Kim, 2002) [18] using Formula (7).where , are the area and yielding strength of the mild steel in the numerical model; , are in test.
- (4)
- Vertical coupling restraint is applied to limit the shear slip between C5 and B5, neglecting shear slip between the precast beam and column.
- (5)
- In the links of C2-B2 and C10-B10, two elements are used: one zero-length element (assigned Concrete01 material with compression-only material properties) to simulate the contact interface and one zero-length element to simulate the behavior of rebar in the slab.
- (6)
- Two zero-length elements are used to model the compressive behavior of the contact interface and mild energy dissipation steel for C3-B3 and C11-B11 links.
- (7)
- Shear reinforcement in exterior connections is simulated by a zero-length element (assigned Hysteretic material) between C4 and B4. Noting that the bond length of shear reinforcement is 15d (d is the diameter of rebar), which is shorter than the anchorage length, the force-displacement relation of the zero-length element is derived from the bond–slip relation between concrete and rebar.where s stands for slip displacement, and f(s) is the bond–slip relation between concrete and rebar [35].
- (8)
- In the links of C6-B6, C14-B14, C7-B7, and C15-B15, zero-length elements with compression-only material properties (gap elements) are used to simulate the contact interface. According to the section analysis method, the minimum position of the compression center is 56 mm (take A3 for example); setting gap element 1 (Figure 10) at this position simulates the compressive zone with 112 mm high at the bottom of the contact interface. (C6-B6, C14-B14) is designed to simulate the rest concrete when the scope of the compressive zone exceeds the representative scope of gap element 1. For A3, the position of gap element 2 is (188 − 112)/2 + 112 = 150. Where 188 mm is the calculated height of the compression zone using the section analysis method (shown in Figure 10). The mechanical property for C6-B6, C14-B14, C7-B7, and C15-B15 is derived from the mechanical property of the scope of representative concrete element with the length of h/3 (the length of the plastic zone is h/3 (Chong et al., 2012) [29], where h is the beam section height). The length of the truss element in this model () is different from the actual length of the plastic zone, so the material properties and area of gap elements require modification (Kim, 2002) [18] using Formula (9).where , are the area and constitutive relationship of the concrete material in the numerical model; , are in test.
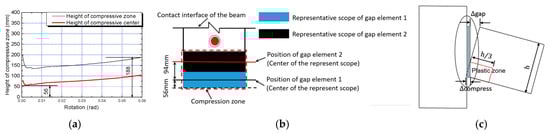 Figure 10. Position of the gap elements (C6-B6, C14-B14, C7-B7, and C15-B15): (a) section analysis results; (b) distribution of gap elements; (c) plastic zone.
 - (9)
- Figure 11 shows the position of gap elements between C2-B2, C10-B10, C3-B3, and C11-B11. The mechanical property of the gap elements is derived from the mechanical property of the representative concrete. The rest scope of the interface is simulated by the gap elements between C5-B5 and C13-B13.
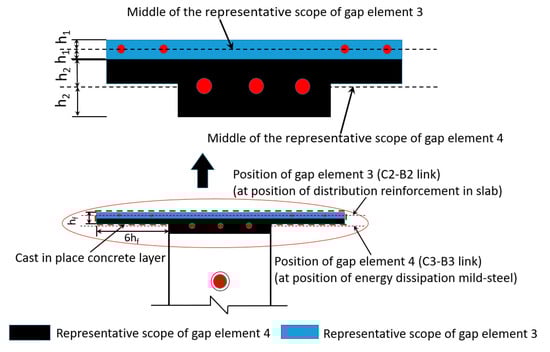 Figure 11. Position of the gap elements (C2-B2, C3-B3, C10-B10, C11-B11).
4. Experimental Validation
4.1. Validation of Skeleton Curves
As can be seen from Figure 12, the skeleton curve of the exterior joint is asymmetric. This is due to the asymmetric reinforcement in the upper and lower parts of the beam section. For the interior joint, although the reinforcement in the upper and lower parts of the beam section is asymmetric, the overall reinforcement is symmetric when considering both the left and right sides under column-top loading. Therefore, the skeleton and hysteretic curves of the interior joint exhibit symmetric characteristics.
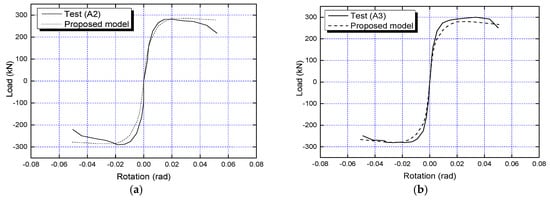
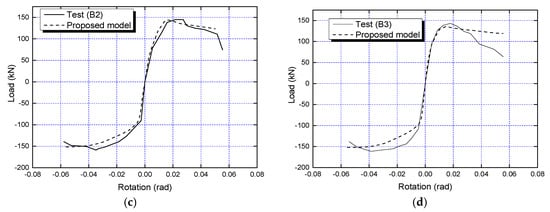
Figure 12.
Validation of the proposed model: skeleton curves: (a) A2; (b) A3; (c) B2; (d) B3.
The test and calculation results for exterior joints B2 and B3 reveal the following features: Due to the effect of prestressing, the joint exhibits elastic behavior before cracking at the interface. After the interface cracks, the sectional stiffness decreases. During positive loading (where the upper reinforcement of the section is in tension), since the prestressed tendons are located in the middle and lower parts of the section, the cracking moment at the interface is relatively small. After cracking, due to the contribution of the ordinary reinforcement and the slab distribution reinforcement, the joint’s stiffness does not decrease significantly but gradually reduces until the reinforcement yields. During negative loading (where the upper reinforcement of the section is in compression), since the prestressed tendons are located in the middle and lower parts of the section, the cracking moment at the interface is larger. After the section cracks, the neutral axis shifts upward, resulting in a significant reduction in sectional stiffness.
Under positive loading, as the bending moment increases, the stress in the ordinary reinforcement gradually increases, subsequently yielding and entering the strain-hardening stage. Throughout this process, the joint’s load-bearing capacity continues to increase until the concrete in the compression zone reaches its maximum compressive capacity. After this point, the compressive capacity of the concrete enters the descending branch, the resultant point of the compression zone moves upward, the lever arm between the tensile and compressive resultants decreases, and the joint’s load-bearing capacity begins to decline.
Under negative loading, because the prestressed tendons do not yield and due to the contribution of the slab, the height of the concrete compression zone is relatively small and less prone to crushing. Even under large deformations, the joint’s negative load-bearing capacity continues to increase until the concrete in the compression zone eventually crushes, leading to a slight decline in the negative load-bearing capacity.
4.2. Validation of Hysteretic Behavior
Due to the prestressing tendons remaining essentially in the elastic state, the hysteretic curves of the joints exhibit a significant pinching effect. For the exterior joints, no residual deformation is observed during negative loading, while the interior joints overall display a pronounced pinching effect. The ordinary reinforcement is arranged in the upper part of the joint. During loading, after the ordinary reinforcement yields and enters the plastic state, it provides a strong energy dissipation capacity. Therefore, under positive loading, the hysteretic curves of the joints enclose a larger area, indicating higher energy dissipation capacity. Under negative loading, the prestressing tendons remain elastic, resulting in limited energy dissipation capacity. Consequently, the area enclosed by the hysteretic curves is relatively small, reflecting lower energy dissipation capacity.
As can be seen from Figure 13, under positive loading, the multi-spring model calculates the joint bearing capacity in better agreement with the test results. This indicates that the compressive spring skeleton curve derived in this study can accurately simulate the failure mechanism of the concrete in the compression zone. Under negative loading, the calculated bearing capacity is comparable to the test results, but the occurrence position shows some discrepancy. Overall, the hysteretic curves calculated by the model agree well with the experimental results.
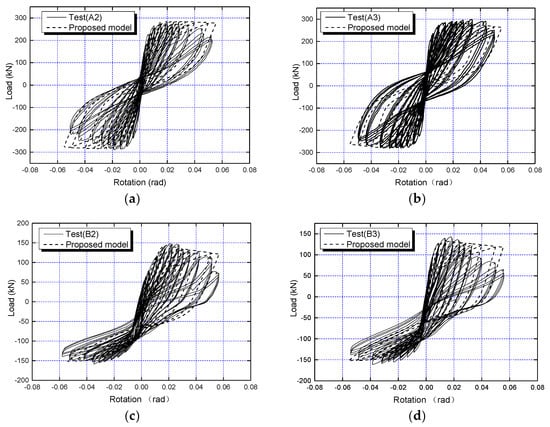
Figure 13.
Validation of the proposed model: hysteretic behavior: (a) A2; (b) A3; (c) B2; (d) B3.
4.3. Validation of the Stress of PT
To further investigate the accuracy of the model, the calculated stresses in the prestressing tendons were compared with the experimental results, as shown in Figure 14. As can be seen from Figure 14, the calculated results for joints A2 and B3 show good agreement with the test data, while some discrepancies exist between the calculated results and the test data for joints A3 and B2. Overall, the calculated stresses in the prestressing tendons match the experimental results well.
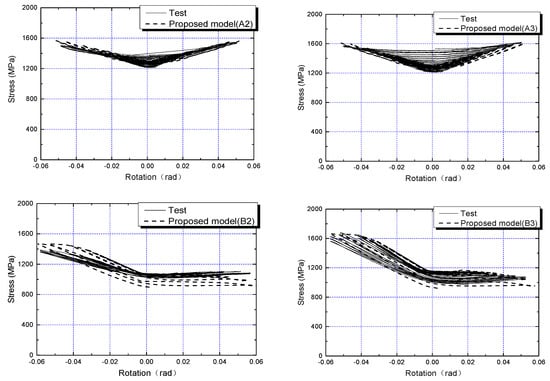
Figure 14.
Validation of the proposed model: stress of prestressed tendon.
4.4. Validation of the Shift in Compression Center at Contact Interface
To further validate the accuracy of the analytical model, this study takes joints A3 and B3 as examples to compare the calculated and experimental values of the compression zone height during positive loading.
Using test data, including the moment of the interface, stress of prestressed tendon, and rotation of the interface, the position of the compression center and stress of mild steel are calculated according to force equilibrium and moment equilibrium on the contact surface. The whole procedure can be summarized as follows.
- Impose a rotation and obtain the moment based on test results (Figure 15);
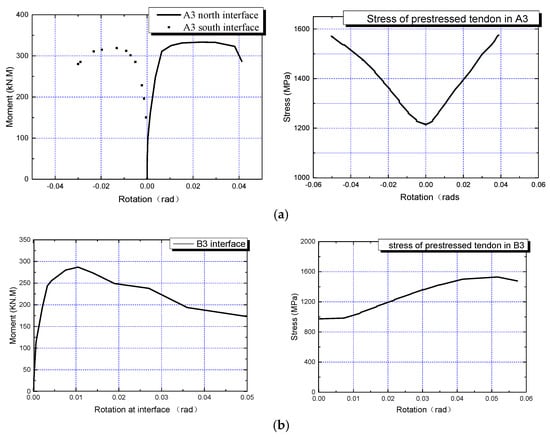 Figure 15. Rotation of the contact interface and stress of PT. (a) A3 test; (b) B3 test.
 - Guess an initial neutral axis position; calculate the strain of concrete in the compression zone using the section analysis method, evaluate corresponding compression force , and calculate the position of compression center ;
- Calculate the tensile force of the prestressed tendon according to the section rotation and measurement;
- Calculate the tensile force of mild steel based on the section equilibrium.
- Evaluate moment capacity;are the distances from the neutral axis to the mild steel and prestressed tendons, respectively;
- Does ?Yes, Go to Step 7;No, Revise neutral axis position and go to Step 2.
- End.
Figure 16 presents the experimental and calculated results of the compression zone height for joints A3 and B3. As shown in Figure 15, the proposed model can effectively simulate the process where the height of the compression zone at the contact interface initially decreases to a minimum and then increases with the growing drift angle. The simulated compression zone height shows good agreement with the experimental results.
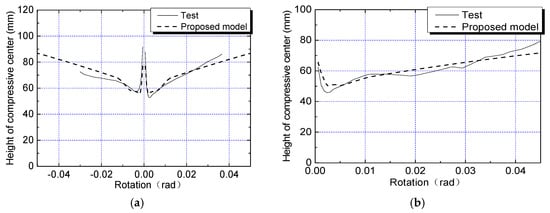
Figure 16.
Comparison of the compression center position between simulation and test. (a) A3; (b) B3.
4.5. Comparison of Different Models
The proposed model in this paper was compared with other commonly used models in terms of computational efficiency, model complexity, computational efficiency, simulation of neutral axis position, and simulation of compression zone height. The comparison results are shown in Table 2.
Table 2.
Comparison between the proposed model and other models.
5. Conclusions
This paper investigates the stress state at the contact surface of prestressed precast beam–column joints and establishes a multi-spring analytical model, where two compression springs are used to simulate the mechanical behavior of the compression zone at the contact surface. An SAM for the contact surface was developed to determine the height of the compression zone and the location of the resultant force point, thereby defining the positions and mechanical properties of the springs to accurately simulate the stress state of the contact surface. The proposed model was applied to numerically analyze four test specimens. The results indicate the following.
The load-bearing capacity of the specimens analyzed using the proposed model correlates well to the experimental results. Under positive loading, the calculated hysteretic curves show good agreement with the test results, whereas under negative loading, some discrepancies are observed, primarily manifested as smaller enclosed areas of the calculated hysteretic curves and lower energy dissipation capacity. The calculated stresses in the prestressed tendons generally align well with the experimental results.
The compression zone height of the specimens under positive loading was simulated. The results demonstrate that the proposed model can effectively capture the process where the compression zone height at the contact surface initially decreases to a minimum and then increases with the increasing displacement angle. The simulated compression zone height matches well with the experimental results.
In summary, the proposed model can accurately simulate the mechanical behavior of HBC using a relatively small number of elements. It particularly excels in capturing the mechanical mechanisms and load-bearing performance of the interface under loading, providing a scientific analytical method for the precise simulation of such joints. With its simple construction, high computational efficiency, and strong accuracy, the model offers significant advantages in simulation precision and computational stability compared to conventional engineering models (such as the plastic hinge model and ordinary MSM), making it well-suited for practical engineering applications.
Author Contributions
Conceptualization, H.Q.; methodology, H.Q.; software, M.Z.; program code and validation, H.Q. and J.Q.; investigation, H.Q.; resources, J.Q.; data curation, Z.Z.; writing—original draft preparation, H.Q. and M.Z.; writing—review and editing, J.Q.; supervision, J.Q.; project administration, J.Q.; funding acquisition, J.Q.; Experimental verification, Z.Z. All authors have read and agreed to the published version of the manuscript.
Funding
This work was supported by the Hebei Natural Science Foundation (Grant No. E2024508038, Funder: Jie Qin); National Key R&D Program (of China) (Grant No. 2023YFC3011903, Funder: Jie Qin); and Fundamental Research Funds for the Central Universities (Grant No. ZY20240208; Funder: Hu Qi).
Data Availability Statement
The original contributions presented in this study are included in the article. Further inquiries can be directed to the corresponding author.
Conflicts of Interest
The authors declare no conflicts of interest.
References
- Lu, Z.; Fan, Q.; Tian, W.; Li, J. Seismic performance analysis of steel frame installed with prefabricated external walls and new connection type. J. Build. Eng. 2024, 84, 108471. [Google Scholar] [CrossRef]
- Qi, H.; Qin, J.; Zhang, W.; Zhang, M. Theoretical Analysis Model of a New Post-Tensioned, Unbonded, Prestressed Beam–Column Connection. Buildings 2025, 15, 2823. [Google Scholar] [CrossRef]
- Li, J.; Fan, Q.; Lu, Z.; Wang, Y. Experimental study on seismic performance of T-shaped partly precast reinforced concrete shear wall with grouting sleeves. Struct. Design Tall Spec. Build. 2019, 28, e1632. [Google Scholar] [CrossRef]
- Pan, P.; Wang, H.S.; Guo, H.S.; Liu, K.; Wang, D.Y.; Qi, H.; Gen, J. Experimental study of seismic performance of unbonded post-tensioned pre-stressed beam-to-column dry connections. J. Build. Struct. 2018, 39, 46–55. (In Chinese) [Google Scholar] [CrossRef]
- Senel, S.M.; Kayhan, A.H.; Palanci, M.; Demir, A. Assessment of Damages in Precast Industrial Buildings in the Aftermath of Pazarck and Elbistan Earthquakes. J. Earthq. Eng. 2024, 1–30. [Google Scholar] [CrossRef]
- Huang, L.; Zhou, Z.; Clayton, P.M. Experimental and numerical study of unbonded post-tensioned precast concrete connections with controllable post-decompression stiffness. Struct. Design Tall Spec. Build. 2021, 30, e1847. [Google Scholar] [CrossRef]
- Li, D.B.; Xie, L.Y.; Li, W.L.; Chai, Y.K.; Li, H.C.; Liu, Y.M.; Gao, J.X.; Xiang, R. Experiment study on seismic performance of two-story double-span assembled monolithic prestressed concrete frame. Build. Sci. 2022, 38, 1–9. (In Chinese) [Google Scholar]
- Guo, H.; Shi, P.; Qi, H.; Wu, B.; Pan, P.; Li, L.; Wang, D. Full-scale experimental study on post-tensioned prestressed precast frame structures. J. Build. Struct. 2021, 42, 119–132. (In Chinese) [Google Scholar]
- Wu, C.X.; Lie, W.C.; Wu, C.G. Study on seismic performance and hysteretic model of rotational damper for energy-dissipative precast concrete joints. Eng. Mech. 2023, 40, 15. (In Chinese) [Google Scholar] [CrossRef]
- Li, L.; Li, C.; Hao, H. Experimental Study on Seismic Behavior of a New Separately-Anchored Self-Centering Beam-Column Connection. Earthq. Eng. Struct. Dyn. 2025, 54, 747–767. [Google Scholar] [CrossRef]
- Feng, S.; Yang, Y.; Xue, Y.; Yu, Y. A post-tensioned hybrid beam-column connection with a web friction device: Experimental study and theoretical analysis. J. Build. Eng. 2021, 43, 103–105. [Google Scholar] [CrossRef]
- Fenwick, R.C.; Megget, L.M. Elongation and Load Deflection Characteristics of Reinforced Concrete Members Containing Plastic Hinges. New Zealand Soc. Earthq. Eng. 1993, 26, 28–41. [Google Scholar] [CrossRef]
- EI-Sheikh, M.; Sause, R.; Pessiki, S.; Lu, L.-W. Seismic Behavior of Unbonded Post-Tensioned Precast Concrete Frames. PCI J. 1999, 44, 72–89. [Google Scholar] [CrossRef]
- Palermo, A.; Pampanin, S.; Carr, A.J. Efficiency of Simplified Alternative Modelling Approaches to Predict the Seismic Response of Precast Concrete Hybrid Systems. In Proceedings of the fib Symposium, Budapest, Hungary, 23–25 May 2005. [Google Scholar]
- Haishen, W.; Marino, E.M.; Pan, P. Design, testing and finite element analysis of an improved precast prestressed beam-to-column joint. Eng. Struct. 2019, 199, 109661. [Google Scholar] [CrossRef]
- Qian, H.; Li, Z.; Pei, J.; Kang, L.; Li, H. Seismic Performance of Self-centering Beam-Column Joints Reinforced with Superelastic Shape Memory Alloy Bars and Engineering Cementitious Composites Materials. Compos. Struct. 2022, 294, 115782. [Google Scholar] [CrossRef]
- Qi, H.; Shen, Y.; Guo, H.; Zhang, W.; Lu, Z. The fiber hinge model for unbonded post-tensioned beam-column connections. Struct. Des. Tall Spec. Build. 2024, 33, e2176. [Google Scholar] [CrossRef]
- Kim, J. Behavior of Hybrid Frames Under Seismic Loading. Ph.D. Thesis, University of Washington, Seattle, WA, USA, 2002. [Google Scholar]
- Carr, A.J. Ruaumoko (Inelastic Dynamic Analysis Software); Department of Civil Engineering, University of Canterbury: Christchurch, New Zealand, 2004. [Google Scholar]
- Feng, S.; Yang, Y.; Xue, Y.; Yu, Y. Study on design and numerical investigation of post-tensioned hybrid beam-column connection with web friction device. J. Build. Eng. 2025, 100, 111775. [Google Scholar] [CrossRef]
- Ma, L.; Shi, Q.; Wang, B.; Tao, Y.; Wang, P. Research on design and numerical simulation of self-centering prefabricated RC beam-column joint with pre-pressed disc spring devices. Soil Dyn. Earthq. Eng. 2023, 166, 107762. [Google Scholar] [CrossRef]
- Saeidzadeh, M.; Chenaghlou, M.R.; Hamed, A.A. Experimental and numerical study on the performance of a novel self-centering beam-column connection equipped with friction dampers. J. Build. Eng. 2022, 52, 104338. [Google Scholar] [CrossRef]
- Ding, Y.; Xu, W.; Wang, J.; Chen, Y.; Du, X.; Shen, B.; Zhao, Z. Experimental investigations on prefabricated interlocking prestressed tendon composite joint and its application to beam-column connection. J. Build. Eng. 2024, 95, 110140. [Google Scholar] [CrossRef]
- Wang, Z.; Zhu, J.; Qin, H.; Lu, J.; Tian, J. Study on influencing factors of hysteretic performance of cantilever fully-bolted prefabricated beam-column joint. J. Build. Eng. 2024, 95, 108324. [Google Scholar] [CrossRef]
- Ji, J.; Qi, P.; Jiang, L.; Zhang, Z.; Chu, X.; Li, Y. Numerical study on the seismic behavior of novel precast prestressed SRC composite frames with fiber-reinforced ECC cast-in-place joints. Structures 2025, 71, 108024. [Google Scholar] [CrossRef]
- Yin, L.; Zhu, Y.; Cai, X.; Xu, Z.; Zhang, J. Seismic performance of self-centering precast concrete buckling-restrained braced frame sub-assembly. J. Build. Eng. 2025, 107, 112690. [Google Scholar] [CrossRef]
- Tong, C.; Wu, J.; Zakari, M.; Gao, Y. Hysteretic behavior of a new precast concrete interior beam-to-column joint with a controllable bending moment. J. Build. Eng. 2021, 45, 103557. [Google Scholar] [CrossRef]
- Pampanin, S.; Priestley, M.J.N.; Sritharan, S. Analytical Modeling of the Seismic Behaviour of Precast Concrete Frames Designed with Ductile Connections. J. Earthq. Eng. 2001, 5, 329–367. [Google Scholar] [CrossRef]
- Chong, X.; Meng, S.; Pan, Q. Experimental Study on Seismic Performance of Post-Tensioned Prestressed Precast Concrete Beam-Column Assemblages. Tumu Gongcheng Xuebao 2012, 45, 38–44. (In Chinese) [Google Scholar] [CrossRef]
- Qi, H.; Li, Y.; Lv, X. Study of Uniaxial Mechanical Behavior of Concrete Confined with Hoops. Build. Struct. 2011, 41, 79–82. (In Chinese) [Google Scholar] [CrossRef]
- Mckenna, F.; Fenves, G.L. Open System for Earthquake Engineering Simulation (OpenSees); Pacific Earthquake Engineering Research Center, University of California: Berkeley, CA, USA, 2013. [Google Scholar]
- Filippou, F.C.; Popov, E.P.; Bertero, V.V. Effects of Bond Deterioration on Hysteretic Behavior of Reinforced Concrete Joints; Report No. EERC 83-19; Earthquake Engineering Research Center, University of California: Berkeley, CA, USA, 1983. [Google Scholar]
- Yassin, M.H.M. Nonlinear Analysis of Prestressed Concrete Structures Under Monotonic and Cycling Loads. Ph.D. Thesis, University of California, Berkeley, CA, USA, 1994. [Google Scholar]
- Mander, J.B.; Priestley, M.J.N.; Park, R. Theoretical Stress-Strain Model for Confined Concrete. J. Struct. Eng. 1988, 114, 1804–1826. [Google Scholar] [CrossRef]
- GB 50010-2010; Code for Design of Concrete Structures. Architecture & Building Press: Beijing, China, 2010.
Disclaimer/Publisher’s Note: The statements, opinions and data contained in all publications are solely those of the individual author(s) and contributor(s) and not of MDPI and/or the editor(s). MDPI and/or the editor(s) disclaim responsibility for any injury to people or property resulting from any ideas, methods, instructions or products referred to in the content. |
© 2025 by the authors. Licensee MDPI, Basel, Switzerland. This article is an open access article distributed under the terms and conditions of the Creative Commons Attribution (CC BY) license (https://creativecommons.org/licenses/by/4.0/).