


Abstract
In this study, mold and moisture risk of external walls were investigated based on the six different wall types (block bims 1-2-3-4, hollow brick, and aerated concrete) and three different insulation materials (hemp wool, aerogel blanket, and extruded polystyrene). During the examinations, uninsulated and insulated external walls were taken into account according to moisture and mold growth depending on dew point temperatures. While calculating the optimum insulation thickness for uninsulated wall, degree-day and life cycle total cost methods were used. The natural gas, coal, and electricity were accepted as an energy source for heating and electricity was used for cooling. In the study, Izmir, Balikesir, Ankara, Kayseri, and Erzurum cities were selected to represent five climate zones according to Turkish insulation standard (TS 825). As a result of the calculations, the highest values of optimum insulation thickness were found in hemp wool and hollow brick for the electricity energy sources. It was determined as 0.118 m in Izmir and 0.202 m in Erzurum. For the insulated wall, the lowest indoor humidity value, where mold and moisture formation occur, was determined as 78% for Izmir and 69% for Erzurum.
1. Introduction
The highest energy consumption in Turkey is in the buildings and service sectors. Thus, insulation applications to decrease the energy consumption of buildings are crucial. Although the initial investment cost of insulation materials is high, it reduces the use of fossil fuels throughout the life of the building and prevents damage to the building envelope. The insulation applied correctly to buildings prevents moisture damage and mold damage that may occur in the building envelope in the future and creates comfortable living spaces for human health [1].
While calculating the appropriate insulation thickness, thicker insulation reduces heat dissipation but also increases insulation cost and investment cost. Therefore, it is important to determine the insulation thickness that minimizes the total insulation cost and energy consumption over the life of the building [2]. For this reason, the concept of optimum insulation thickness has emerged. The optimum insulation thickness takes into account both the initial cost of the application and the energy savings achieved throughout the life cycle of the material. Optimum insulation thickness is the value providing minimum total life cycle cost [3].
Moisture damage and mold damage that may occur in the building envelope are caused by moisture condensation depending on the indoor and outdoor environment. Perspiration, also called condensation, damages materials, reduces thermal resistance, and increases the overall heat transfer coefficient, causing undesirable events such as increased heat loss [4]. The basic condition for no condensation in the insulation is that the wall surface temperature is higher than the dew point temperature. As it is known, the ambient air contains some water vapor depending on the temperature and relative humidity ratio, and this water vapor condenses on cold surfaces [5].
Silica aerogels, which have just started to be used as insulation material, are silica-based dry gels with low weight and great insulation performance. Besides, aerogel has high porosity (80–99.8%), low density, and thermal conductivity (0.014 W/(m K)). Silica aerogels are a modern alternative to traditional insulation due to thermal performance properties [6]. Hemp has attracted the most attention among bio-based thermal insulation materials [7]. Hemp thermal insulation material has not yet been linked to a standard. Hemp is produced from hemp plant fibers and post-harvest parts [1].
In the building industry, the evaluation of heat transfer is crucial to examine the building elements performances. The heat transfer between the wall and its surroundings, indoor and outdoor, and physical phenomena are examined by means of the convective and radiative coefficient. Information about these coefficients is very important for the correct evaluation of heat distributions on building facades [8].
When the literature was examined, Özer and Özgünler [1] examined the commonly used thermal insulation materials and revealed their properties. Then, performance evaluation was made on the wall sections with the Arıoğlu Method, which is a selection method based on the systems approach. Ziapour et al. [2] determined the optimum insulation thickness for the composite prefabricated wall block using the degree-day method with the life cycle. They made cost analyses for the provinces of Ardabil, Tehran, and Khuzestan in Iran. The optimum insulation thickness was calculated for only heating, only cooling, and both heating and cooling periods. Extruded polystyrene (EXP) was used as the insulation material. As an energy source, natural gas was used in the winter and electricity in the summer. Cuce et al. [3] investigated the optimum thermal insulation thickness and environmental effects of aerogel for the climatic conditions of Nottingham, England. The dependencies of annual energy cost and energy savings on insulation thickness for five different energy sources were determined. The effects of degree-day and present value factors on optimum aerogel thickness were investigated. The cavity walls filled with air gaps and aerogel were used in the study. In the study of Yamankaradeniz [4], minimization of the thermal insulation thickness was applied by considering the condensation on the outer walls. It is explained that as the temperature, relative humidity of the indoor environment, and the relative humidity of the outdoor environment increase, the required thickness of the thermal insulation material will increase, and the required thickness will decrease with the increase in the outdoor temperature. The amount of water vapor passing through the wall layers will vary according to the internal and external conditions and the thickness of the insulation. Kaya and Oğuz [5] gave detailed information about the selection of suitable materials for installation insulation in their study. Ibrahim et al. [6] investigated application of silica aerogels on new buildings and retrofits of existing buildings. Near Chambery in France, they built an experimental house that was applied on its external surface. In their study, besides the experimental measurements, simulations were made for the numerical model with the help of EnergyPlus. Optimum thickness was used for rendering of structural components with silica aerogel insulating. Optimization was done based on cost. 1.2–1.5 °C temperature difference was detected between the simulation and measurement results. Life cycle cost analysis was used while calculating the optimum insulation thickness for hemp wool. Degree-day calculations were made based on the sol-air temperature. Optimum insulation thickness is calculated for both heating and cooling periods. Dlimi et al. [7] examined the use of hemp as an insulation material for external building walls in Meknes for the use of cannabis grown in Morocco for centuries in the building industry. Based on the life cycle cost analysis, they determined the optimum thickness, energy savings, and payback period. They analyzed various thermal parameters such as optimum air gap thickness and heat transfer rates. The dynamic thermal behavior of the exterior walls insulated with hemp wool was investigated. Evangelisti et al. [8] studied in detail the convection and radiation heat transfer components. They compared the heat transfer coefficients by applying conventional correlations from literature. The differences between the standard convection and radiation heat transfer coefficients in the literature are shown between the building walls and the outdoor environment using velocity, temperature, heat flow measurements, and other measurements. Huang et al. [9] investigated a new aerogel superinsulation material for the energy conservation application of buildings. They took a typical office building with a humid subtropical climate as a model and found it to take advantage of the optimum economic thickness. In addition, they compared the super-insulating material aerogel with commonly used expanded polystyrene, extruded polystyrene, foamed polyurethane, and fiberglass. The optimum insulation thickness is calculated for both heating and cooling periods. While calculating the optimum insulation thickness, the P1–P2 method was used. Coal, natural gas, and LPG are used as energy sources in the winter and electricity in the summer. The shale hollow brick, aerated concrete, and reinforced concrete were accepted as the external wall building material. Kurekci [10] determined the optimum insulation thicknesses needed in 81 provinces of Turkey. Calculations are made for four different energy sources and five different insulation materials (extruded polystyrene, expanded polystyrene, glass wool, rock wool, and polyurethane). Bricks were used as building materials and coal, natural gas, fuel–oil, and LPG were used as energy sources in winter and electricity in summer. Optimum insulation thicknesses are made for only heating period, only cooling period, and both heating and cooling periods. While calculating the optimum insulation thickness, life cycle cost analysis and degree day were used. Tükel et al. [11] proposed a new approach based on thermoeconomic analysis for the reclassification of Turkey’s climate zones. For this purpose, in the study, 80 provinces of Turkey, 5 regions were reclassified according to the fuzzy c-means clustering method according to 27 different optimum insulation thickness properties calculated for each province. In the study, brick, aerated concrete, and reinforced concrete were used as wall building material. Natural gas, coal, and fuel oil were taken as the energy source. Heat pump is used for heating and electricity is used for cooling. Extruded polystyrene (XPS), expanded polystyrene (EPS), and Rockwool were used as insulation material. The optimum insulation thickness calculations for the wall were made according to the life cycle cost analysis method. The optimum insulation thickness was found for only heating, only cooling and both heating and cooling periods. Ozel [12] numerically investigated the thermal, economic, and environmental effects of optimum insulated building walls in Kars province under dynamic thermal conditions for two different wall structures and two different insulation materials (Extruded polystyrene (XPS) and Expanded polystyrene (EPS)). In the study, sol-air air temperature including solar radiation was used in degree day calculations. Optimum insulation thickness calculations were made according to life cycle analysis and degree days. While the optimum insulation thickness is found only for the heating period, coal is used as the energy source. Dombayci et al. [13] calculated the optimum insulation thickness of the external wall for five different energy sources and two different insulation materials (expanded polystyrene and rock wool) for Denizli, Turkey. Optimization was made based on life cycle cost analysis. For Alghoul et al. [14] in Libya, the effect of electricity price on residential heating and cooling energy consumption and insulation thickness was examined. In the study, research was conducted to predict potential savings and affect the problem of large energy losses from space cooling and heating. Uygunoğlu and Keçebaş [15] performed an economic analysis to estimate the optimum thickness, savings, and payback period of the wall material that minimizes the total and energy consumption costs. Bims with one, two, three, and four rows of spaces, hollow brick, and aerated concrete were used as wall materials. The optimum building material thickness was determined according to life cycle cost (LCC) analysis and degree day values. Coal, natural gas, fuel–oil, and electricity are used as energy sources in winter. The winter period has been taken into account for the optimum building material thickness. Afyonkarahisar city in Turkey was chosen for the optimum building material thickness. Lopez-Arce et al. [16] explain that moldy and mold-free dwellings are related to environmental parameters, the inner surface of the walls, and the surrounding weather conditions. They provide recommendations for critical values of certain surface and ambient air parameters for the control and prevention of surface condensation and mold growth in residential buildings. Insufficient insulation in the building envelope, uneven heat distribution, unsuitable humidity, and insufficient ventilation show significant effects on mold formation. In the study, a simple building moisture index (BMI) and a systematic procedure are presented for possible causes of mold growth. Thus, they explain that it will help find more cost-effective solutions to existing moisture and mold problems in buildings. Boroń and Marszałek [17] investigated criteria for the protection of building envelopes against mold growth. The temperature factor has been adopted as the most important criterion to assess the envelope risk. The study was conducted for the critical months for 61 regions in Poland. They explained that the partial pressure of water vapor in the indoor environment depends on the partial pressure of the water vapor in the outdoor air, the air exchange rate in the indoor environment, the volume of the indoor environment and the humidity in the indoor environment. Wang et al. [18] studied hydrothermal models of ventilated and non-ventilated roofs to provide roof design recommendations. Attic ventilation rate, attic air leakage rate, and air infiltration rate evaluated their effects on the hydrothermal performance of attic floors. Mold growth index was used in sheathing as a performance indicator. Cho et al. [19] analyzed the effect of energy efficiency measurement packages that improve hydrothermal and energy performance using infrared thermography images and building simulation. Hydrothermal and energy performances were analyzed separately for office and museum. It has been determined that the thickness of the insulation or additional insulation reduces the formation of mold. It has been shown that the energy consumption of buildings will decrease when the risk of mold formation is reduced. DesignBuilder based on the Energy-Plus-based simulation program is used for energy models of historic buildings such as museums. In his study, Arısoy [20] examined the calculation methods of moisture gain and the necessary data for this calculation. Dehumidifier device types, features, selections, and comparisons were made. Kon et al. [21] investigated the use of hemp as an insulating material in envelopes such as external walls, ceilings, and floors in terms of thermal comfort. In the study, thermal comfort analysis was investigated according to the heat transfer coefficient calculated based on the optimum insulation thickness and the values recommended in TS 825. Lewandowski and Lewandowska-Iwaniak [22] have made a new classification of insulation materials in terms of their use in the ecological passive construction industry. They accepted the conductivity of thermal and solar energy as criteria. Saafi and Daouas [23] conducted energy and economic analyzes to demonstrate the benefits of phase change materials when integrated into building envelopes under the Tunisian climate. Bruno R. et al. [24], in their study, showed differences for the same samples with air gap with the experiments carried out in a climate chamber using the heat flux meter method on three different samples of commercial reflective panels in an unventilated air gap. In their study, Mirsadeghi et al. [25] gave a comprehensive overview of a large number of models for calculating convection heat transfer coefficient applied in building energy simulation programs with various assumptions. Different models were used for building energy simulation programs to find the convection heat transfer coefficient on the external surfaces of the buildings. They showed that the convection heat transfer coefficient can change the building energy consumption by significantly affecting the indoor temperatures, thermal comfort status, and indoor relative humidity of the buildings. Joudi et al. [26] investigated the effect of surface heat radiation properties of steel cladding material on the energy efficiency of buildings, depending on their different external solar reflectance and internal thermal reflectance properties. Evangelisti et al. [27] conducted a review of existing correlations for calculating sky emission and sky temperature under different climatic conditions. Models are applied for different locations of the world to highlight differences such as sky emission and sky temperatures. Li et al. [28] presented a new and comprehensive model for the estimation of long-wave radiation for clear and cloudy sky conditions. The calculation of open sky emission was made depending on the outdoor air temperature, relative humidity, dew point temperature, and partial pressure of water vapor. Kon and Caner [29] investigated the different wall types and two different insulation materials based on the mold and moisture formation. In literature, saturation pressure and partial pressure difference between indoor and inside wall surface was taken into account in mold and moisture risk. In this study, calculations were made depending on the optimum insulation thickness for the city of Balikesir. Aydin and Biyikoğlu [30] determined the optimum insulation thickness of the residential in Turkey with life cycle cost analysis for reference buildings and calculated the energy need according to the standards. Expanded polystyrene (EPS) was used as insulation material for the wall, extruded polystyrene (XPS) for the floor, and glass wool for the ceiling. Optimum insulation thickness is calculated for wall, floor, and ceiling.
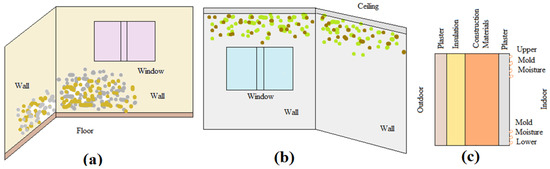
Numerous studies have been conducted in the literature for mold formation for the external walls. However, there are no studies on the risk of mold and moisture formation based on the optimum insulation thickness. As known, mold and moisture formation in the building envelope causes the deterioration of the building envelope’s properties such as thermal resistance. Mold and moisture formation is an issue that has been studied in terms of both heat and mass transfer. It is necessary to pay great attention to the energy consumption of these buildings. For the risk of mold and moisture formation, the dew point temperature calculated based on the indoor relative humidity is the basic parameter. If the wall inner surface temperature rises above the dew point temperature of the indoor environment, mold and moisture begin to form on the wall surface (Figure 1). The temperature of the inner surface of the wall depends on the heat transfer coefficient of the wall.
Figure 1.
The mold and moisture formation on the wall (a), ceiling (b), and wall layers (c).
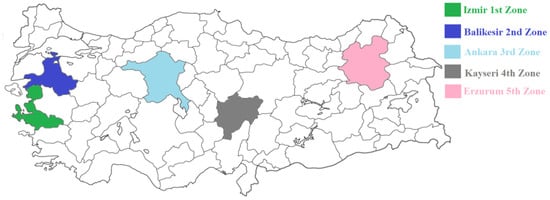
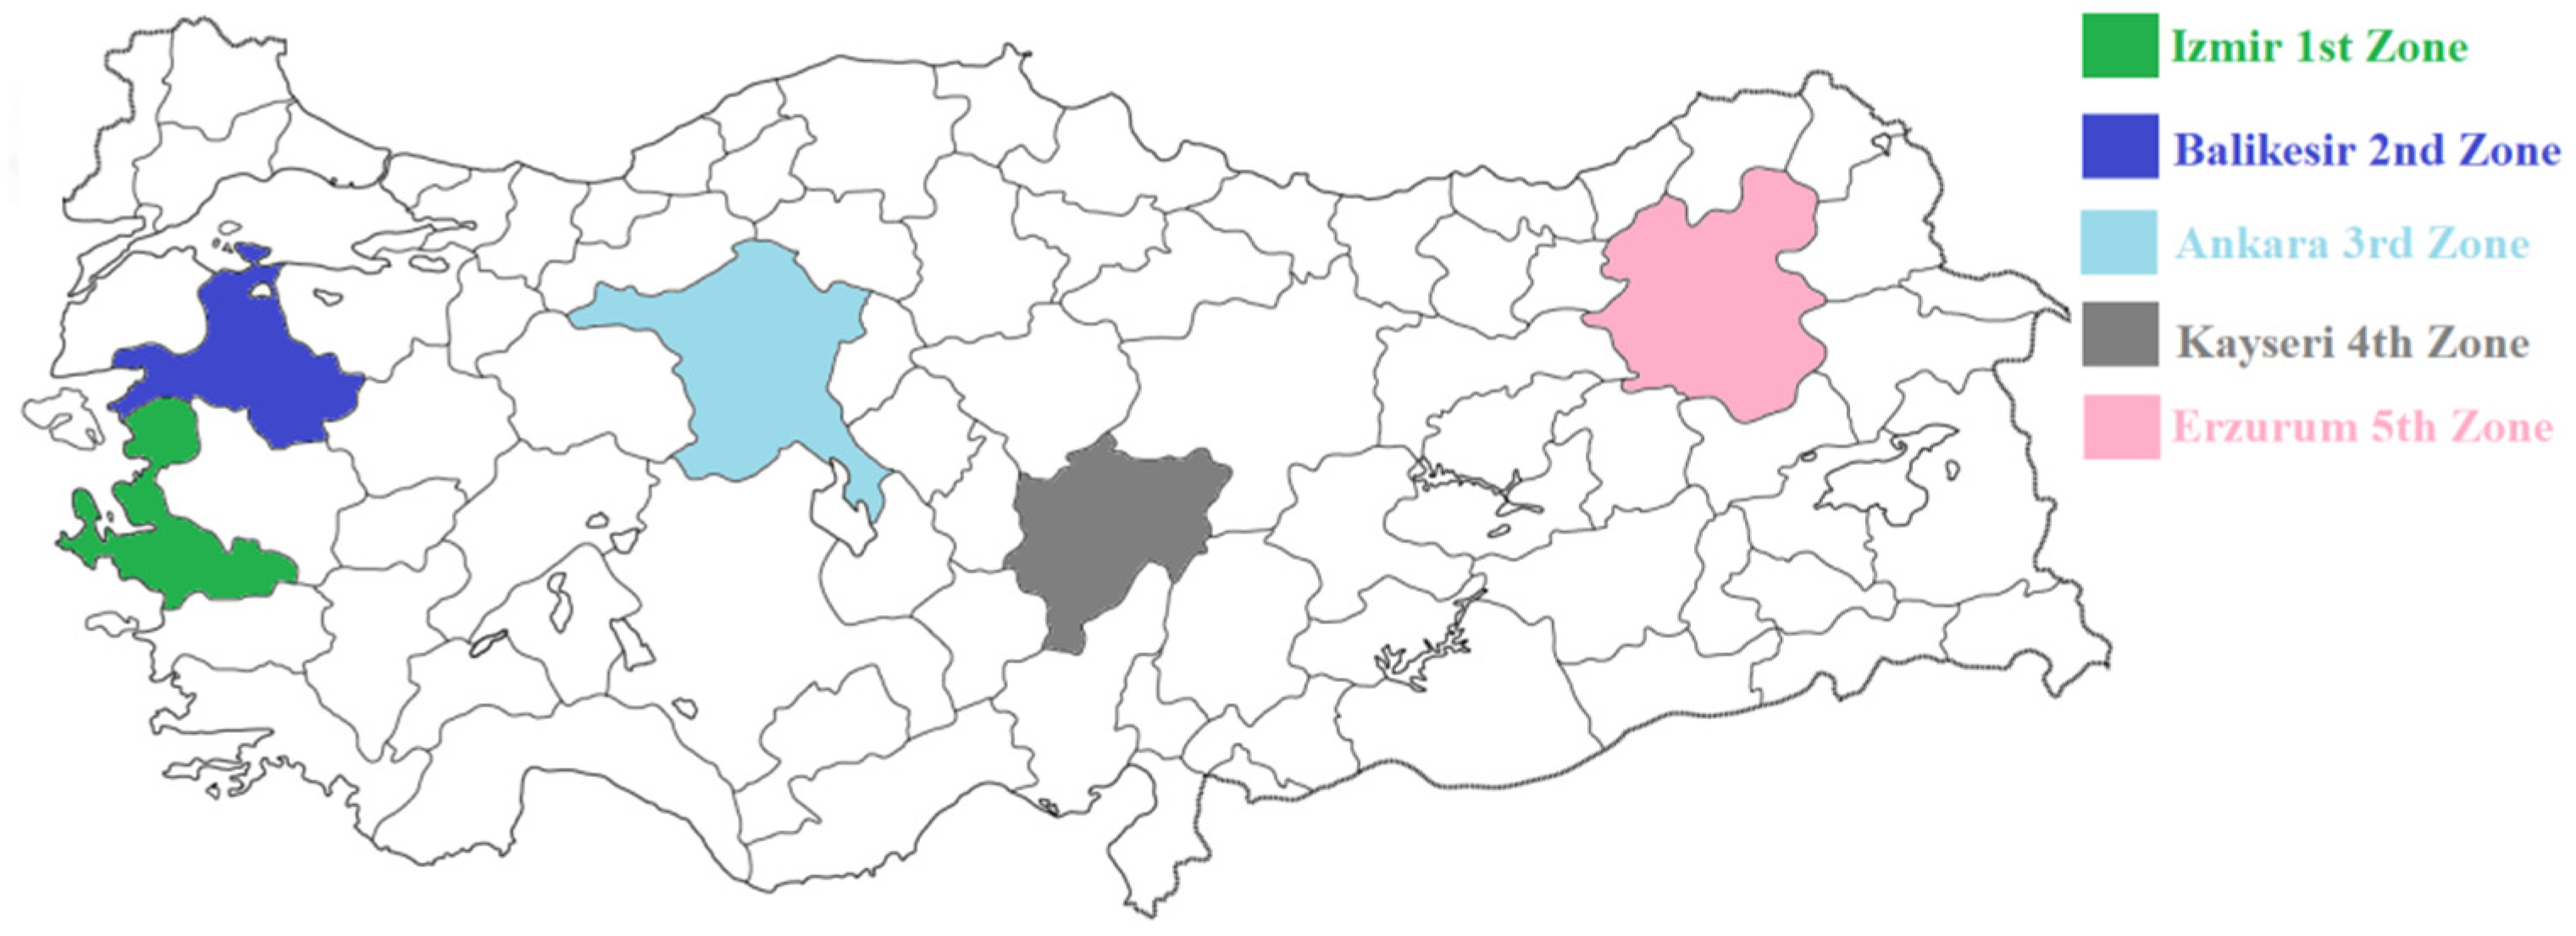
The aim of the study is to examine the risk of mold and moisture formation of external walls according to three different insulation materials with different properties for cities selected to represent five different climate zones according to Turkish Insulation Standard (TS 825) [31] (see Figure 2). In the study, the risk of mold and moisture was compared for an uninsulated and insulated external wall. An optimum insulation thickness wall is used for the insulated wall. While finding the optimum insulation thickness, the combined heat transfer coefficient of the interior and exterior surfaces, where the convection and radiation heat transfer coefficient is together, was calculated. In the literature, the optimum insulation thickness calculations and the combined heat transfer coefficients of the interior and exterior surfaces are taken as constant values for all climates. In this study, combined heat transfer coefficients were calculated separately for the cities selected to represent each climate zone. Hemp wool is a natural insulation material with an average thermal conductivity coefficient and a low cost, and aerogel is a newly developed insulation material with high cost and low heat transmission coefficient. Extruded polystyrene (XPS), on the other hand, is an insulation material that is widely used in the artificially produced building sector and has an average heat transmission coefficient and cost. In addition, investigations were made on how adequate the optimum insulation thickness is in terms of mold and moisture formation. While calculating the wall heat transfer coefficient, the annual average meteorological values of the selected cities were used. Minimum temperature and humidity values were used for January, which is the coldest month of the cities selected for the risk of mold and moisture formation. January has the highest risk of humidity and mold formation due to the external meteorological conditions. The study aims to examine the humidity and mold formation that will occur due to the insulation of the external walls of the selected cities for each climate zone in the context of building energy consumption, to determine the optimum insulation thickness for each climate zone, especially depending on the surface combined heat transfer coefficient coefficients for each climate zone. Calculation of optimum insulation thicknesses and comparison of newly used and widely used insulation materials in terms of their effects on mold and moisture formation will make a significant contribution to the literature.
Figure 2.
Selected cities according to five different climate zones in Turkey [31].
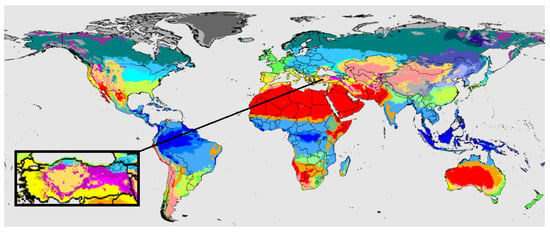
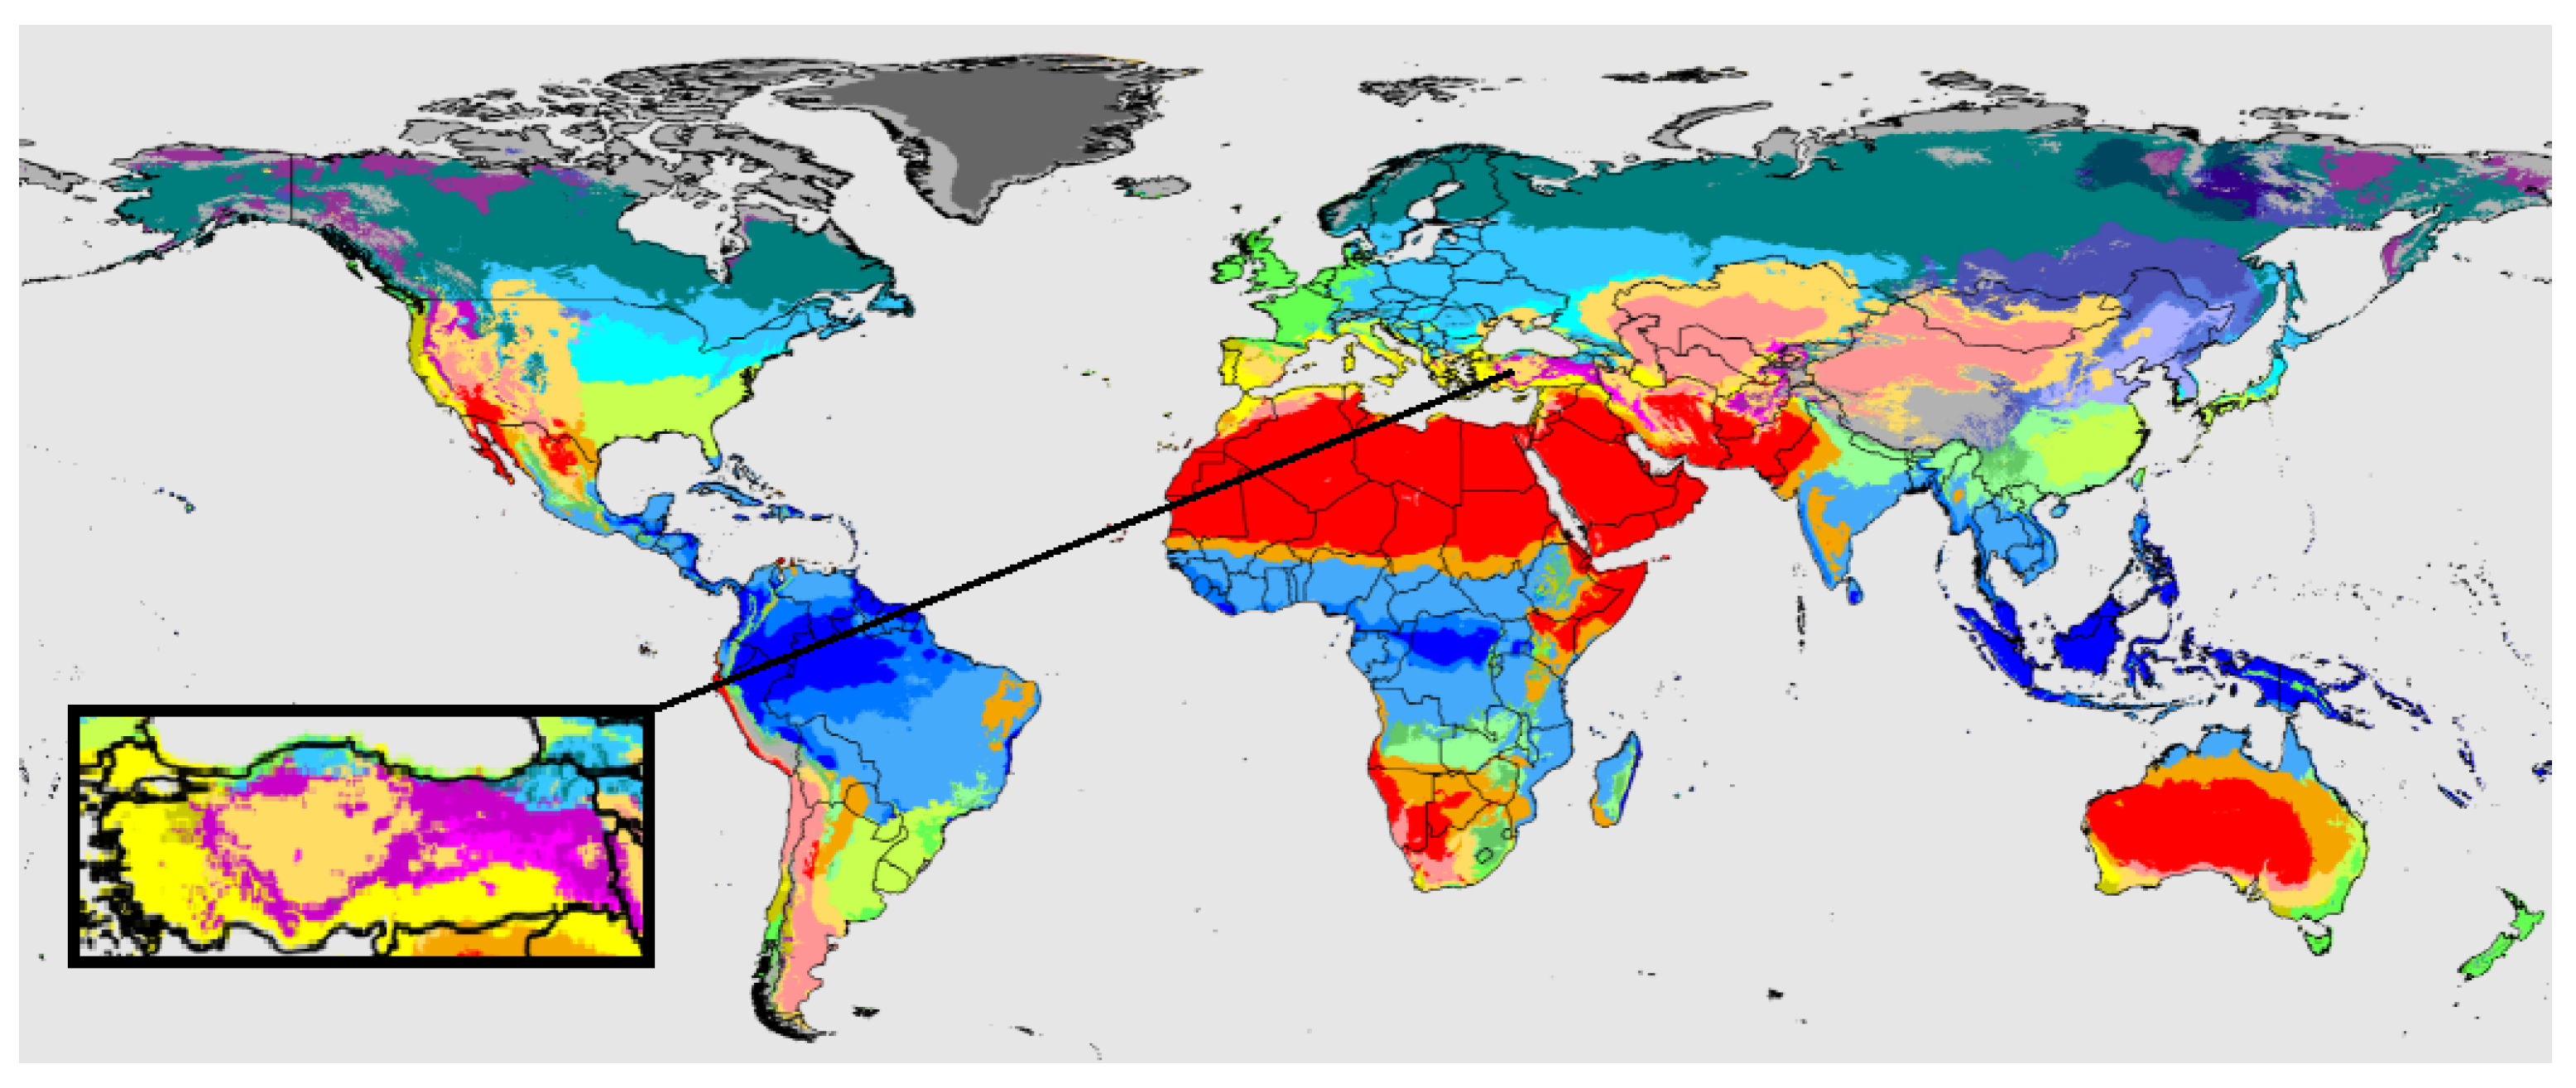
At the same time, this paper provides an important contribution from an international perspective. When the Köppen climate classification map is examined, it is seen that the climate regions of Turkey represent many regions of the world [32]. For this reason, it can be said that the study is suitable not only for Turkey but also for the whole world (see Figure 3).
Figure 3.
Worldwide locations with similar climate of Turkey [32].
2. Methodology
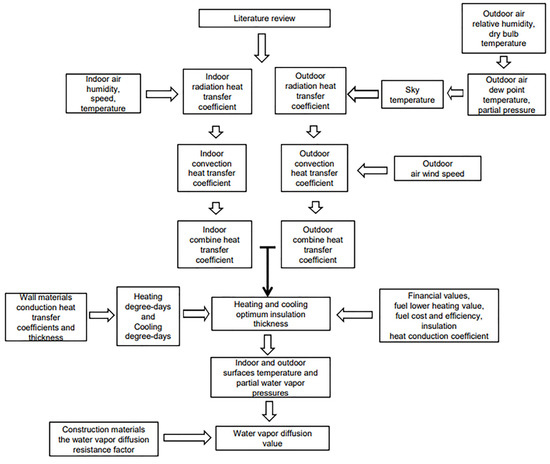
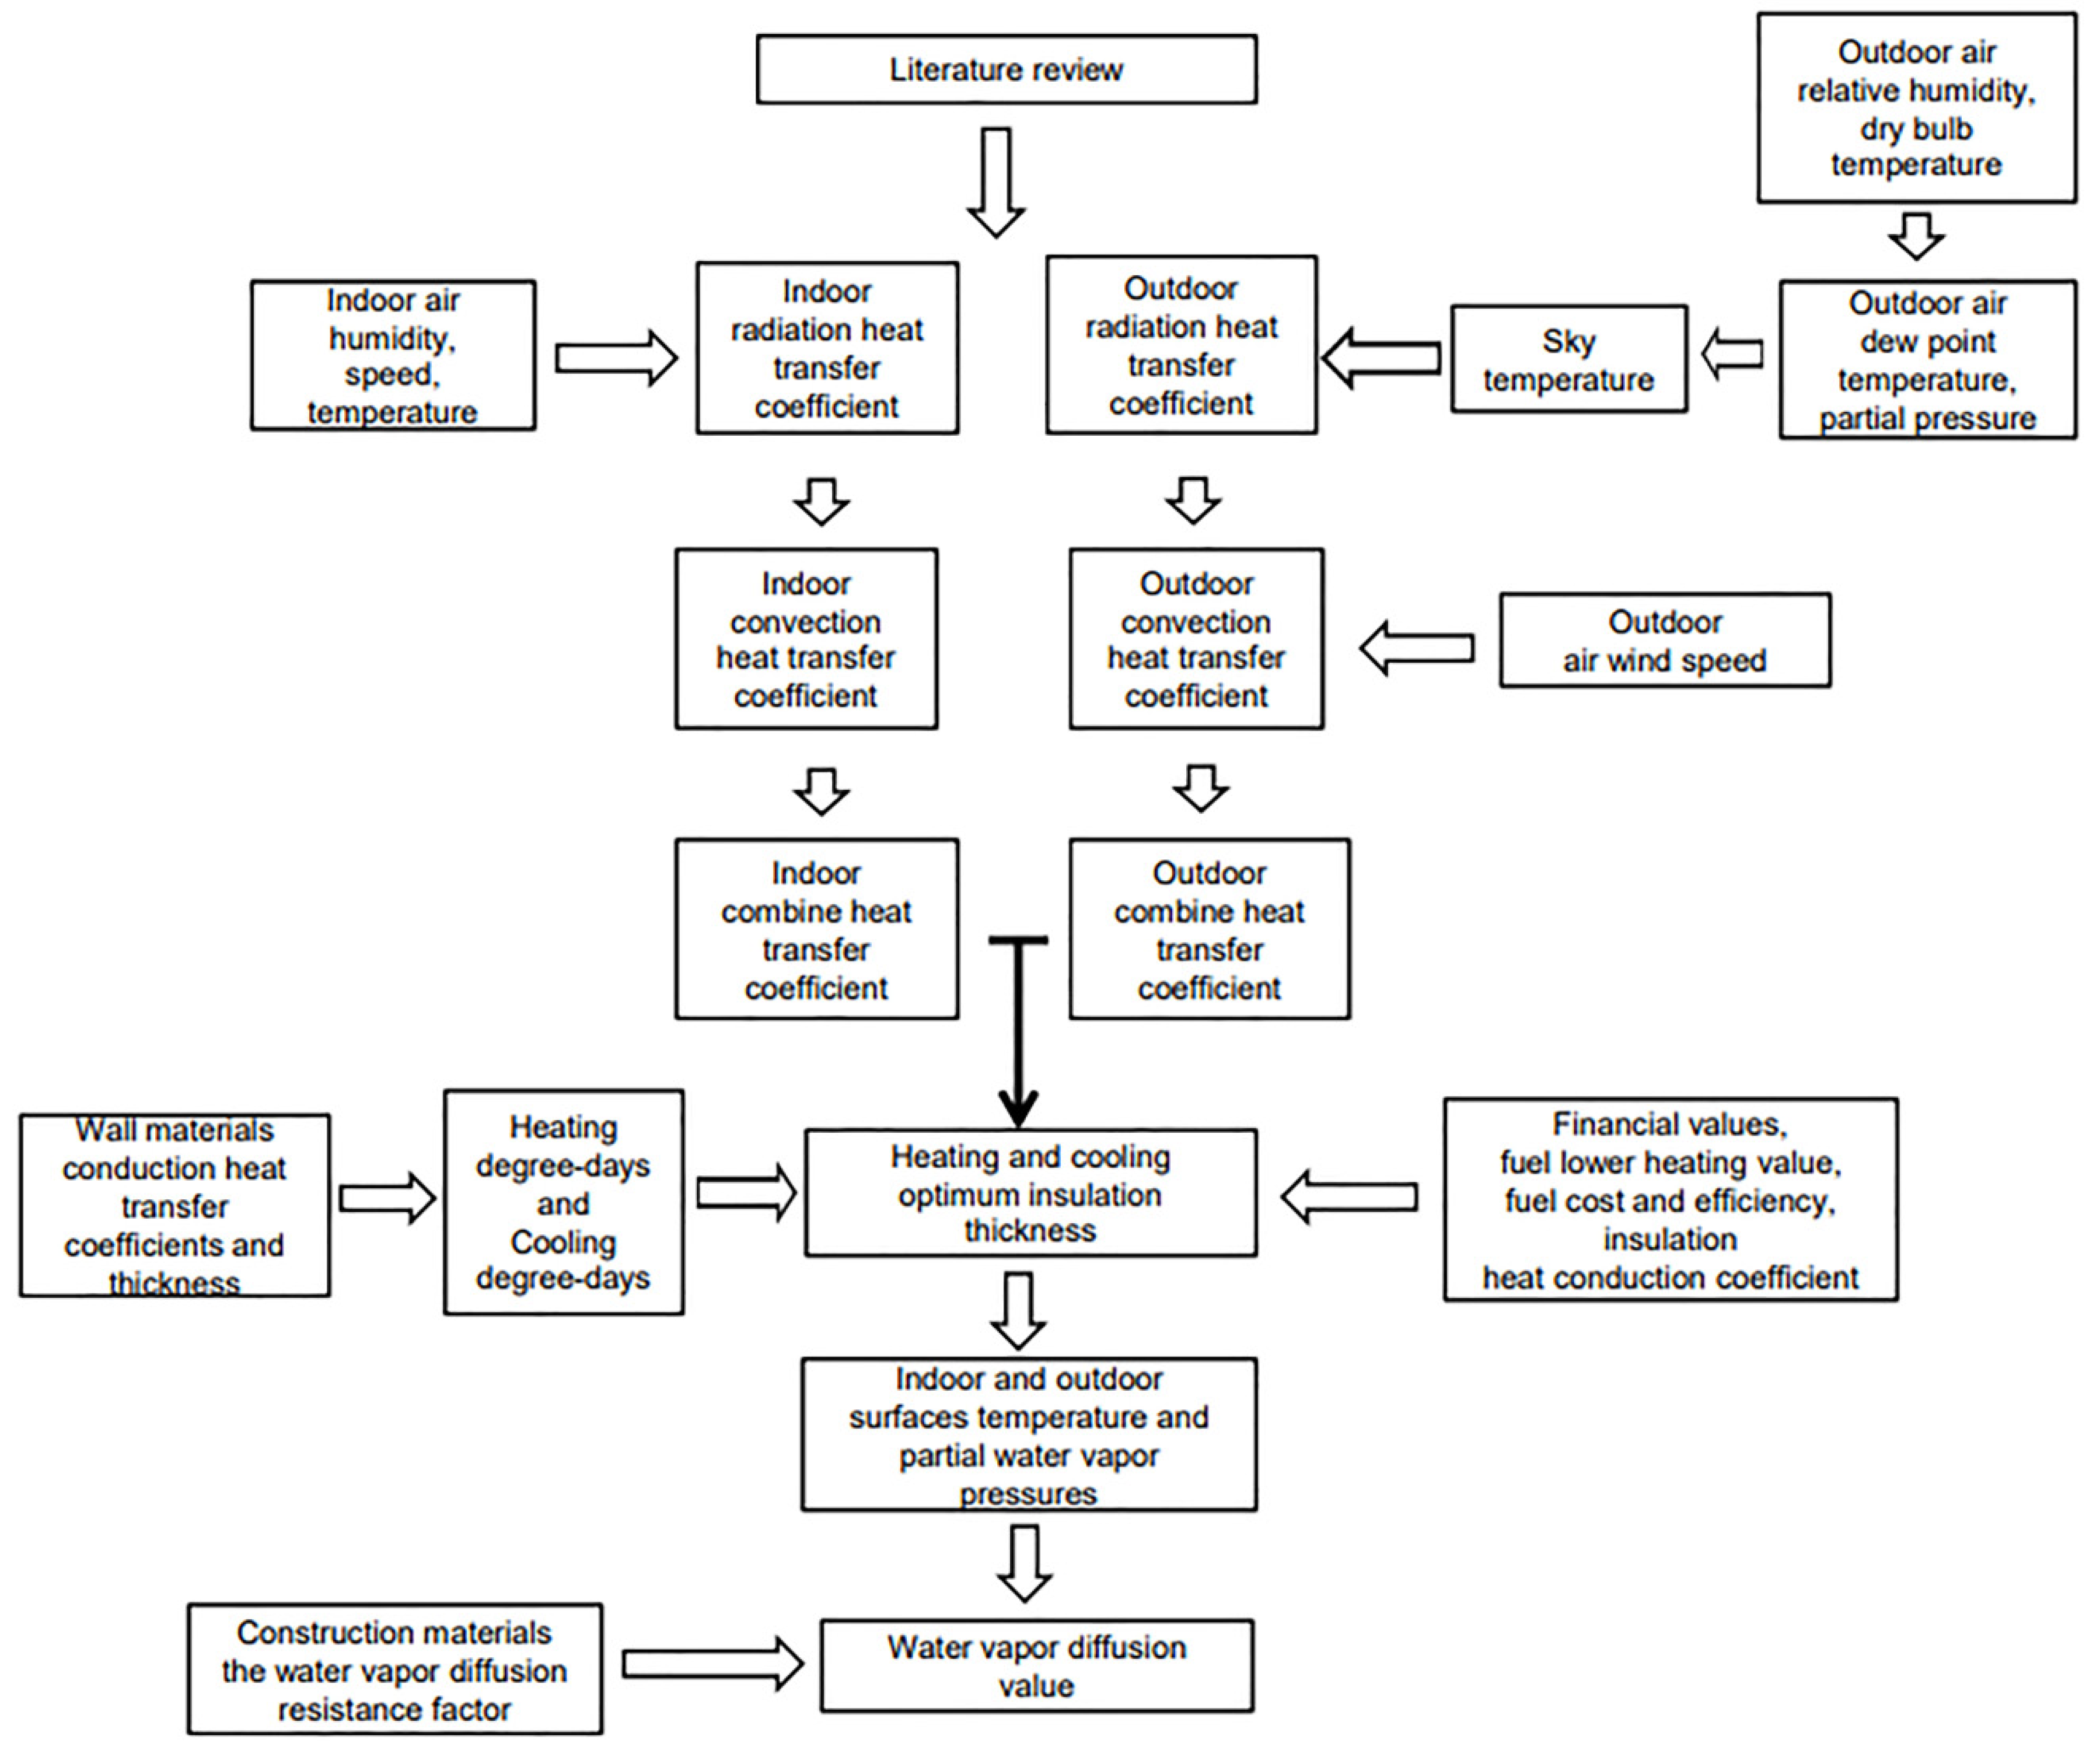
The research methodology is based on the calculation of mold and moisture formation for external walls with six different walls (block bims 1-2-3-4, hollow brick, and aerated concrete) and three different insulation materials (hemp wool, aerogel blanket, and extruded polystyrene). During the calculations, uninsulated and insulated walls were taken into account depending on dew point temperatures. The natural gas, coal, and electricity are for heating, and electricity is used for cooling as an energy source. In the study, Izmir, Balikesir, Ankara, Kayseri, and Erzurum cities were selected to represent five climate zones (Figure 2) according to Turkish insulation standard [31]. As a result, the research methodology is given in Figure 4.
Figure 4.
Study conceptual framework of the study.
In the calculations, firstly, indoor and outdoor convection and radiation heat transfer coefficients were calculated for the cities representing each climate zone, depending on the different meteorological parameters of each city. Thus, the overall heat transfer coefficients were determined for the indoor and outdoor environments. The optimum insulation thicknesses were calculated depending on the conduction heat transfer coefficient, financial values, fuel, and cost of insulation materials based on the heating and cooling degree-days for each city. With this insulation thickness, the necessary relative humidity values were found for the formation of mold and moisture on the inner surface of the wall. During the calculations, uninsulated and insulated walls were taken into account depending on dew point temperatures. The temperature value and partial water vapor pressure values in each layer formed with different wall properties were calculated. By determining the wall and insulation materials water vapor diffusion resistance factor, the water vapor diffusion values that will occur on the wall have been determined.
2.1. Radiative Heat Transfer Coefficient Calculation
εclear−sky is the emissivity during clear sky conditions
Here Tdp is dew point temperature.
Here, φ is outdoor relative humidity, Pv, partial pressure of water vapour at outdoor temperature. εclear−sky is clear sky emissivity. Sky temperature (Tsky) can be calculated with below formula
Here, Tout is the outdoor air temperature [8,27,28,33,34]. The radiation heat transfer coefficient equation for indoor area is
Here εi is indoor emissivity (It is accepted as 0.90 for light colored surface). The equation of the outdoor radiation heat transfer coefficient [22,23,25,33].
2.2. Convective Heat Transfer Coefficient Calculation
Reynold number for the forced convective heat loss
Nusselt number for the forced convective heat loss for vertical surfaces,
Grashof number for the free convective heat loss,
Rayleigh number for the free convective heat loss,
Here, ρ is gravitational acceleration, β (1/Ta) is coefficient of volume expansion, Ta is indoor and outdoor temperature average, Tsurf is surface temperature, Tout is outdoor temperature, l is surface length, ʋ is kinematic viscosity, V is wind velocity, and Pr is Prandtl number [8,22,24,25,26,27,28,33,34].
The free convective heat loss for vertical surfaces,
The equation of convection heat transfer coefficient for both indoor and outdoor
where λair is the conduction heat transfer coefficient of air and L is the height of the wall. The equation of convection and radiation heat transfer coefficient for indoor combined heat transfer coefficient [33]
The equation to calculate combined heat transfer coefficient [22,33]
In the study, all annual average meteorological values were accepted for the convection and radiation heat transfer coefficient calculation.
2.3. Optimum Insulation Thickness Calculation
The heat loss from unit area of wall
The heat loss for heating season
The heat loss from unit area for cooling season,
Wall total heat transfer coefficient can be calculated from below formula
Annual energy consumption for the heating period
Annual energy consumption for the cooling period
Annual fuel cost for the heating period,
Annual fuel cost for the cooling period,
Cost of the insulation,
Calculation of PWF [6,23];
If i > g; real interest rate,
If i < g; real interest rate,
Present worth factor,
Here, Rt,w is total thermal resistance of uninsulated wall, Rin is surface thermal resistance based on the indoor combine heat transfer (both convection and radiation heat transfer), Rout is surface thermal resistance based on the outdoor combine heat transfer (both convection and radiation heat transfer), xins is insulation thickness, and λins is the conduction heat transfer coefficient of insulation material [2,3,10,12,13,14,30].
Where i is the inflation rate, g is the interest rate, and N is life (taken as 10 year). The equation of total cost for both heating and cooling [2,3,10,12,13,14,21]
The optimum insulation thickness equation is achieved when the total cost equation, in which the heating and cooling period is taken together, is derived according to xins and equalized to zero.
Here, Cf is energy source price for the heating period, Hu is the fuels’ lower heating value, η is the heating system efficiency, Ce is the electricity price for cooling period, COP is the cooling system performance coefficient.
2.4. Relative Humidity Calculation for Mold Formation on the Wall Surface
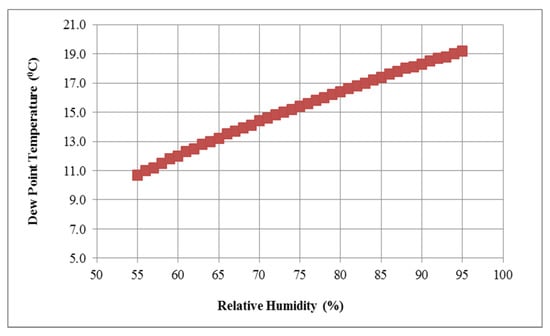
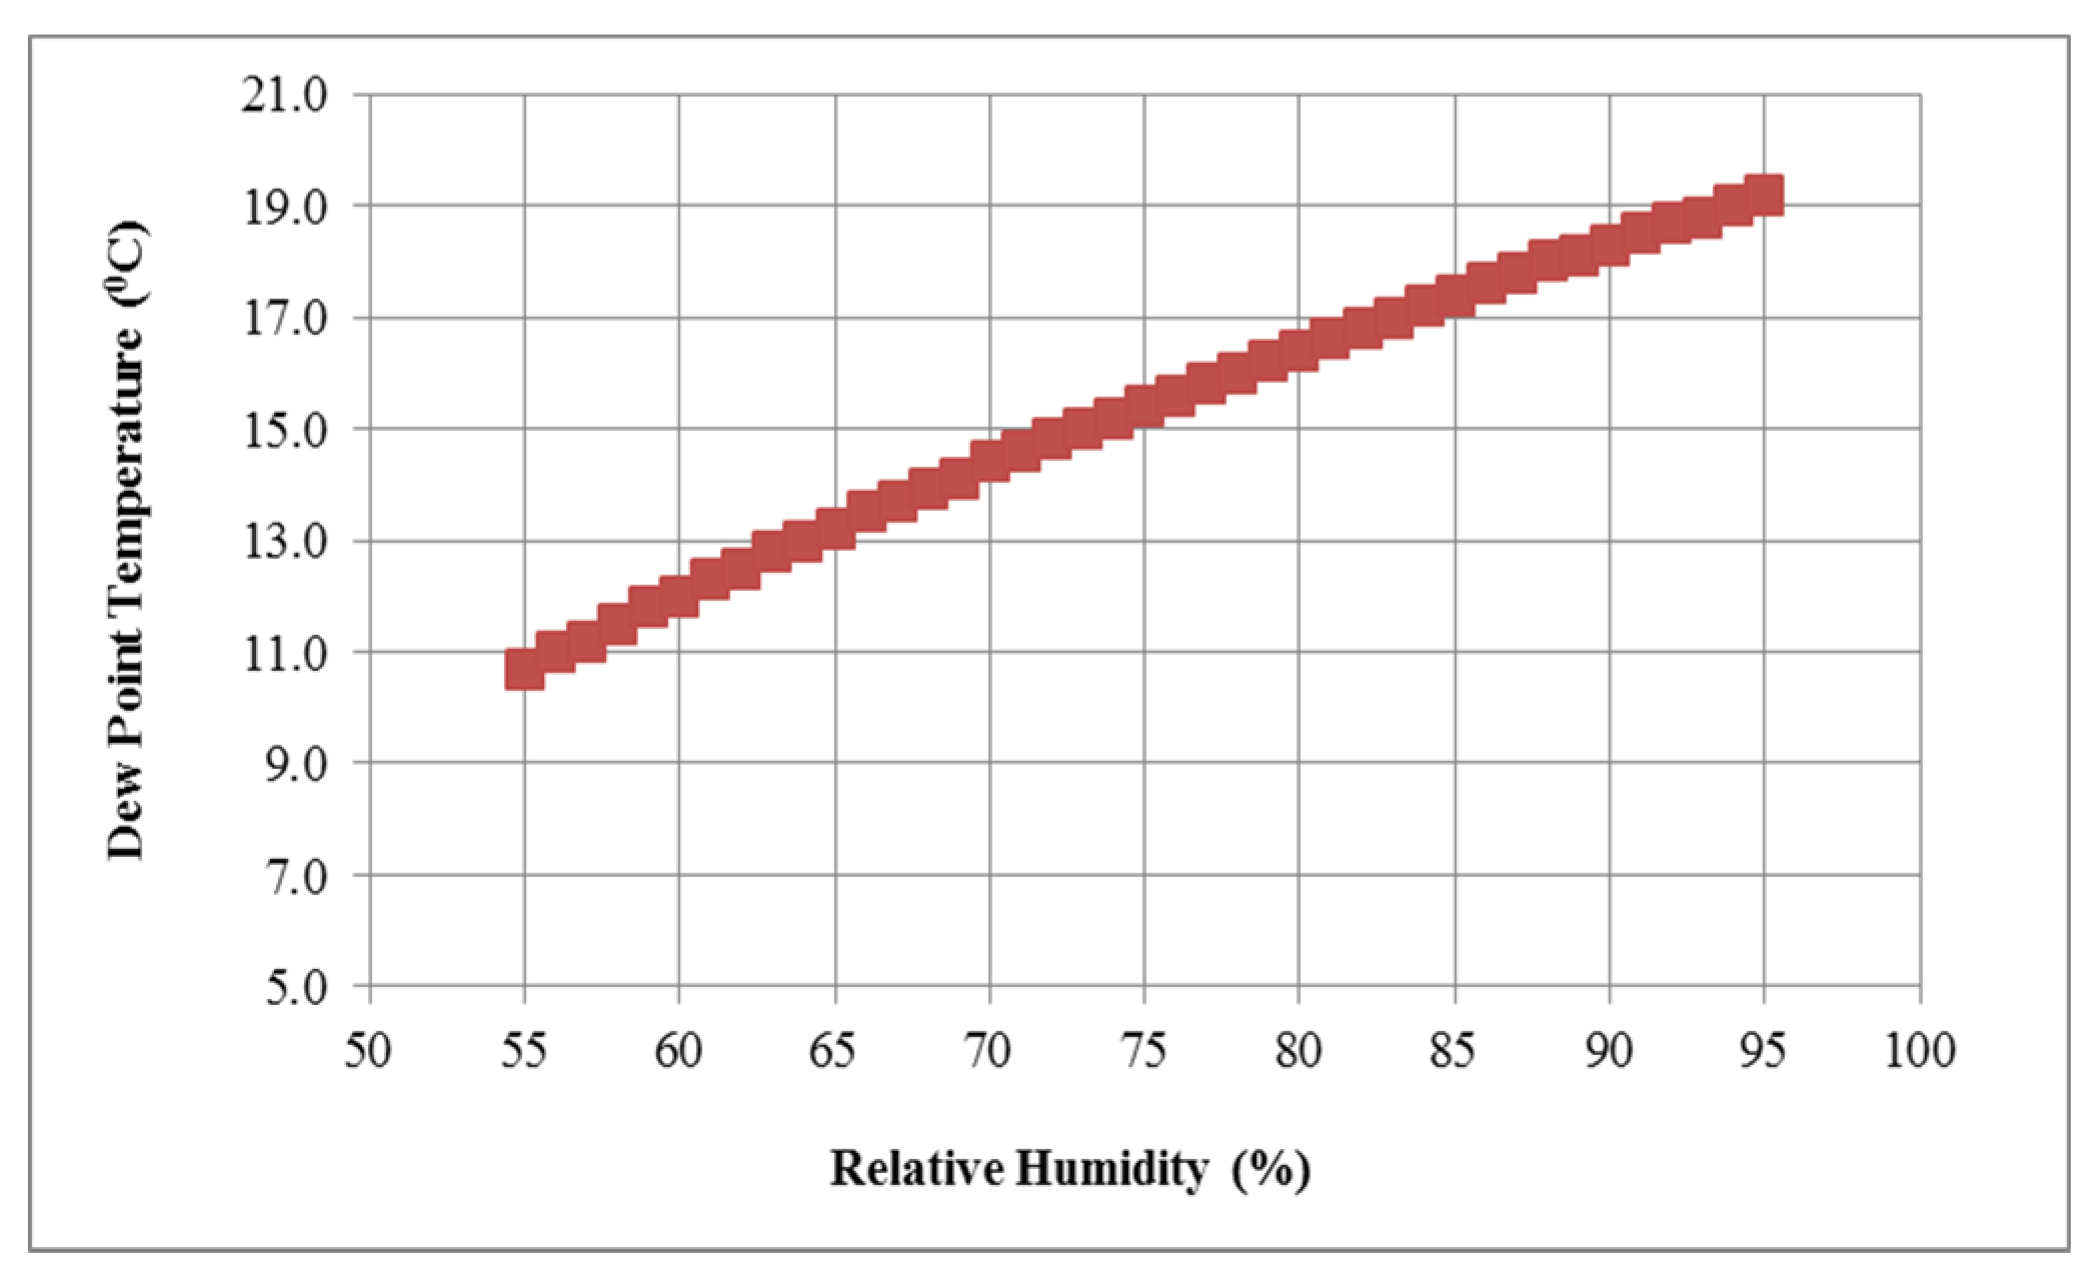
In the study, the indoor temperature was taken as 20 °C by increasing 1 °C as recommended in TS 825 [31]. The relative humidity dependent dew point temperature required for indoor mold growth at 20 °C is given in Figure 5.
Figure 5.
Relative humidity dependent dew point temperature for indoor environment.
For the cities selected in the calculations of the indoor relative humidity required for the formation of mold on the surface, the month of January, when the outdoor temperature is minimum, has been accepted.
2.5. Calculation of the Amount of Condensed Moisture
The density of heat flux,
Wall indoor surface temperature calculation,
For one-dimensional steady state water vapor diffusion equation,
Indoor surface vapor permeability coefficient (Ωi) value is taken as 0.000111 kg/m2 h. mmSS and outdoor surface vapor permeability coefficient (Ω0) value is taken as 0.00390 kg/m2 h. mmSS. μ is the water vapor diffusion resistance factor of external wall materials and x is the thickness.
Here, Psi and Pso are the pressures of the saturated water vapor in the indoor and outdoor temperatures. Pin ve Pout are the partial water vapor pressures for the indoor and outdoor environment [4,5,16,17,18,19,20,21,22].
In the condensation calculations for the wall, the indoor temperature has been increased by 1 °C according to the TS 825 insulation standard and taken as 20 °C. The indoor humidity is accepted as 65% by accepting natural ventilation [31].
2.6. The Parameters Used in Calculations
The annual average meteorological values used in the heat transfer coefficient calculations for the external walls of the buildings in five different selected cities are given in Table 1. In Table 1, the minimum temperature values used in the calculation of the amount of moisture to be formed on the wall are also shown. In Table 2, heating degree-days (HDD) for 19 °C base temperature in heating period and cooling degree-days (CDD) for 22 °C base temperatures in the cooling period are given. The cost value used in optimum insulation thickness calculations is shown in Table 3. In Table 4, the heat conduction coefficient and thickness of wall materials with different properties are given. In Table 5, the water vapor diffusion resistance factor of the construction materials used in the calculation of the amount of moisture to be formed on the wall in the study is shown.
Table 1.
The annual average meteorological values [35].
Table 2.
Heating (HDD) and Cooling (CDD) Degree-days for selected cities [31,36].
Table 3.
The parameters used in cost calculations [3,6,7,9,11,12,29].
Table 4.
The properties of wall materials [15,31].
Table 5.
The water vapor diffusion resistance factor of construction materials [1,31].
3. Results and Discussion
Dew point temperature was found to be the highest at 9.4 °C in Izmir in the first climate zone and the lowest in Erzurum in the fifth climate zone at 0.6 °C. Apart from these, it was found as 8.7 °C in Balikesir in the second climate zone, 5.2 °C in Ankara in the third climate zone, and 4.0 °C in the fourth climate zone. The dew point temperature, dry bulb temperature, and relative humidity are important parameters in terms of mold and moisture formation. However, dew point temperature is one of the most effective parameters in moisture and mold formation.
Two of the important parameters in calculating the optimum insulation thickness for external walls are heating and cooling degree days. The heating degree day value was determined as 4869 in Erzurum, and 1630 in Izmir. Heating degree days were found as 2148 in Balikesir, 3181 in Ankara, which is in the third climate zone, and 3299 in Kayseri. Cooling degree day values were determined as 721 in Izmir and 145 in Erzurum. The cooling degree days were found to be 468 in Balikesir, 278 in Ankara, and 266 in Kayseri. According to Turkish Insulation Standard TS 825, cities in the first climate zone are considered the warmest, cities in the second climate zone are considered temperate, cities in the third climate zone are partially cold, cities in the fourth climate zone are cold, and cities in the fifth climate zone are very cold.
The highest value of the optimum insulation thickness, covering both heating and cooling periods, calculated for the cities selected to represent the five climate regions in TS 825 was determined in the hollow brick wall material, hemp wool insulation material, and the use of electricity as an energy source during the heating period. The reason for this is that the heat transmission value of the hemp wool insulation material is the highest among the three selected insulation materials. On the other hand, the cost is the lowest. In addition, the lowest heating value of the electricity used as an energy source during the heating period is another effective parameter in the high optimum insulation thickness. The highest values of optimum insulation thickness were calculated as 0.118 m for İzmir, 0.132 m for Balikesir, 0.161 m for Ankara, 0.164 m for Kayseri, and 0.222 m for Erzurum. The insulation thickness of Block Bims 4 as wall material, aerogel blanket as insulation material, and natural gas and coal as an energy source during the heating period could not be determined. The reason for this is that although the heat conduction coefficient of the aerogel blanket insulation material is very low, the cost is very high. Hemp wool insulation material cost is the lowest value insulation materials in the study. Cost is a more effective parameter at optimum insulation thickness. Optimum insulation thickness values calculated depending on different wall materials, insulation materials, and energy sources for the selected cities are given in Table 6.
Table 6.
The optimum insulation thicknesses for selected cities.
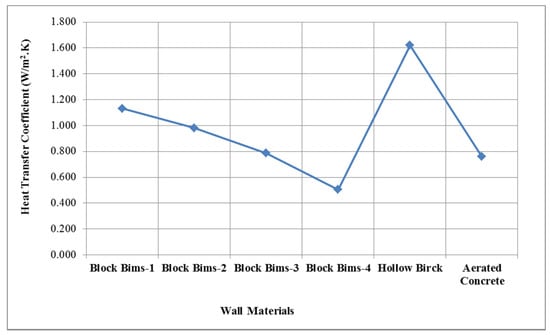
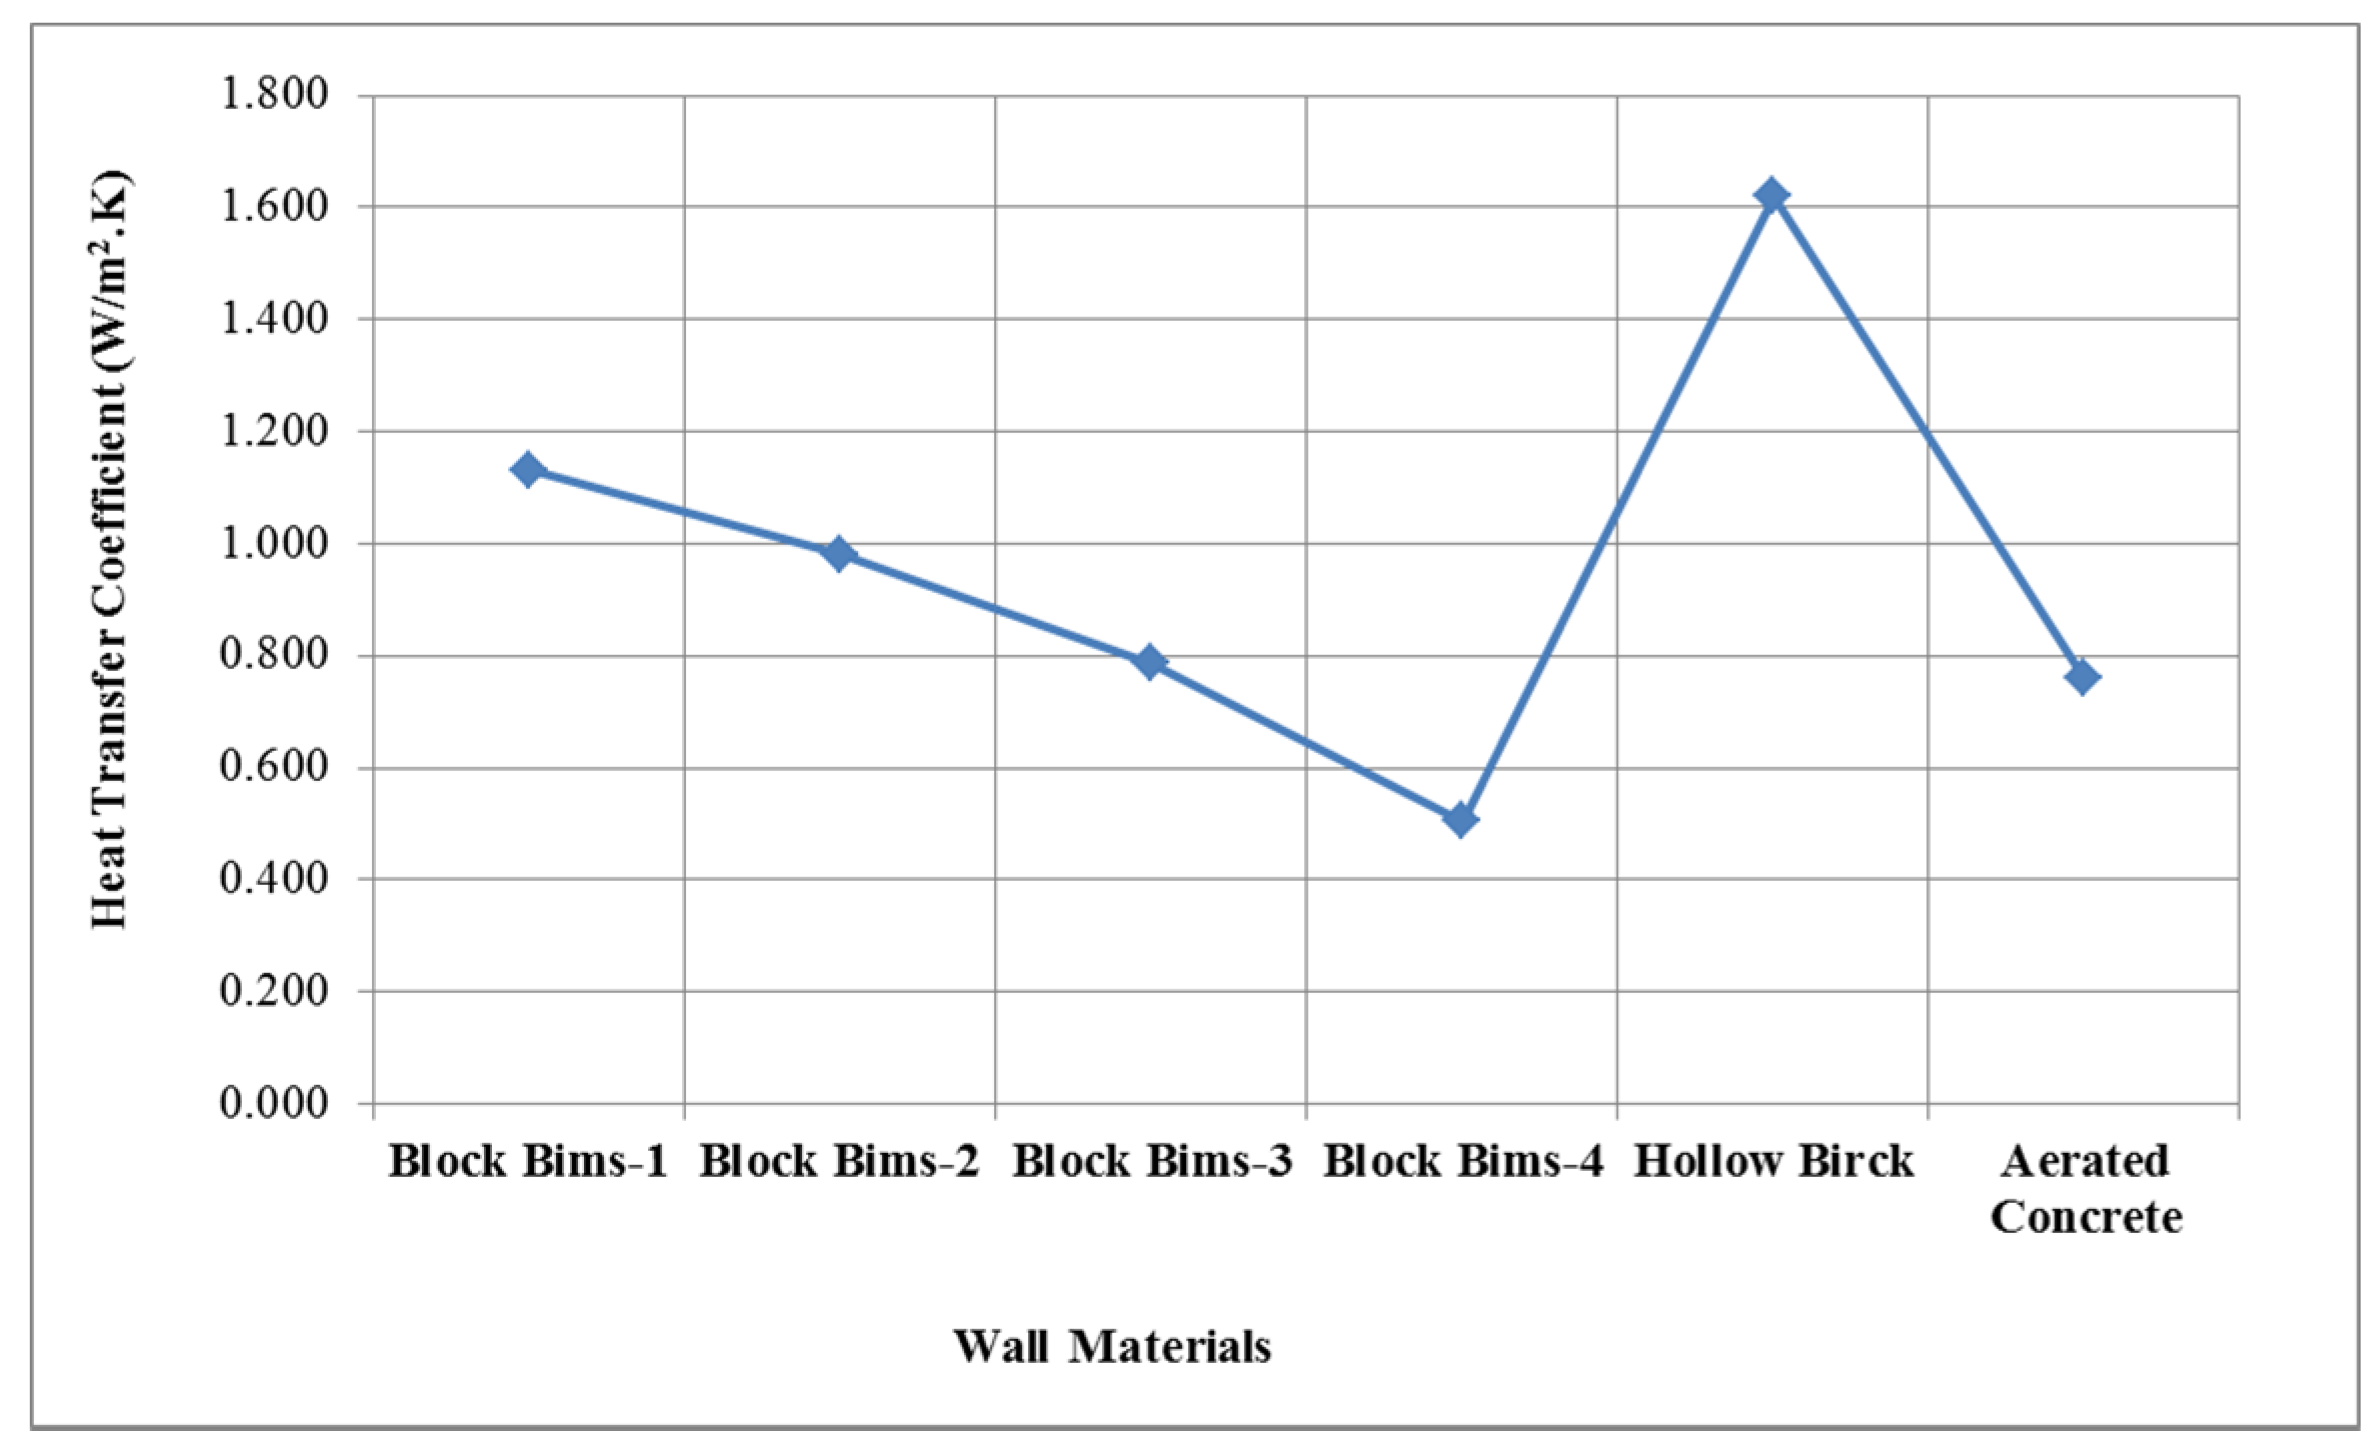
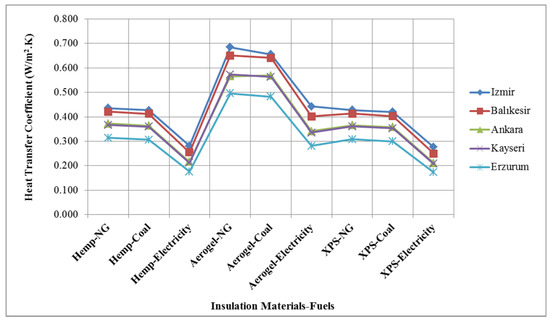
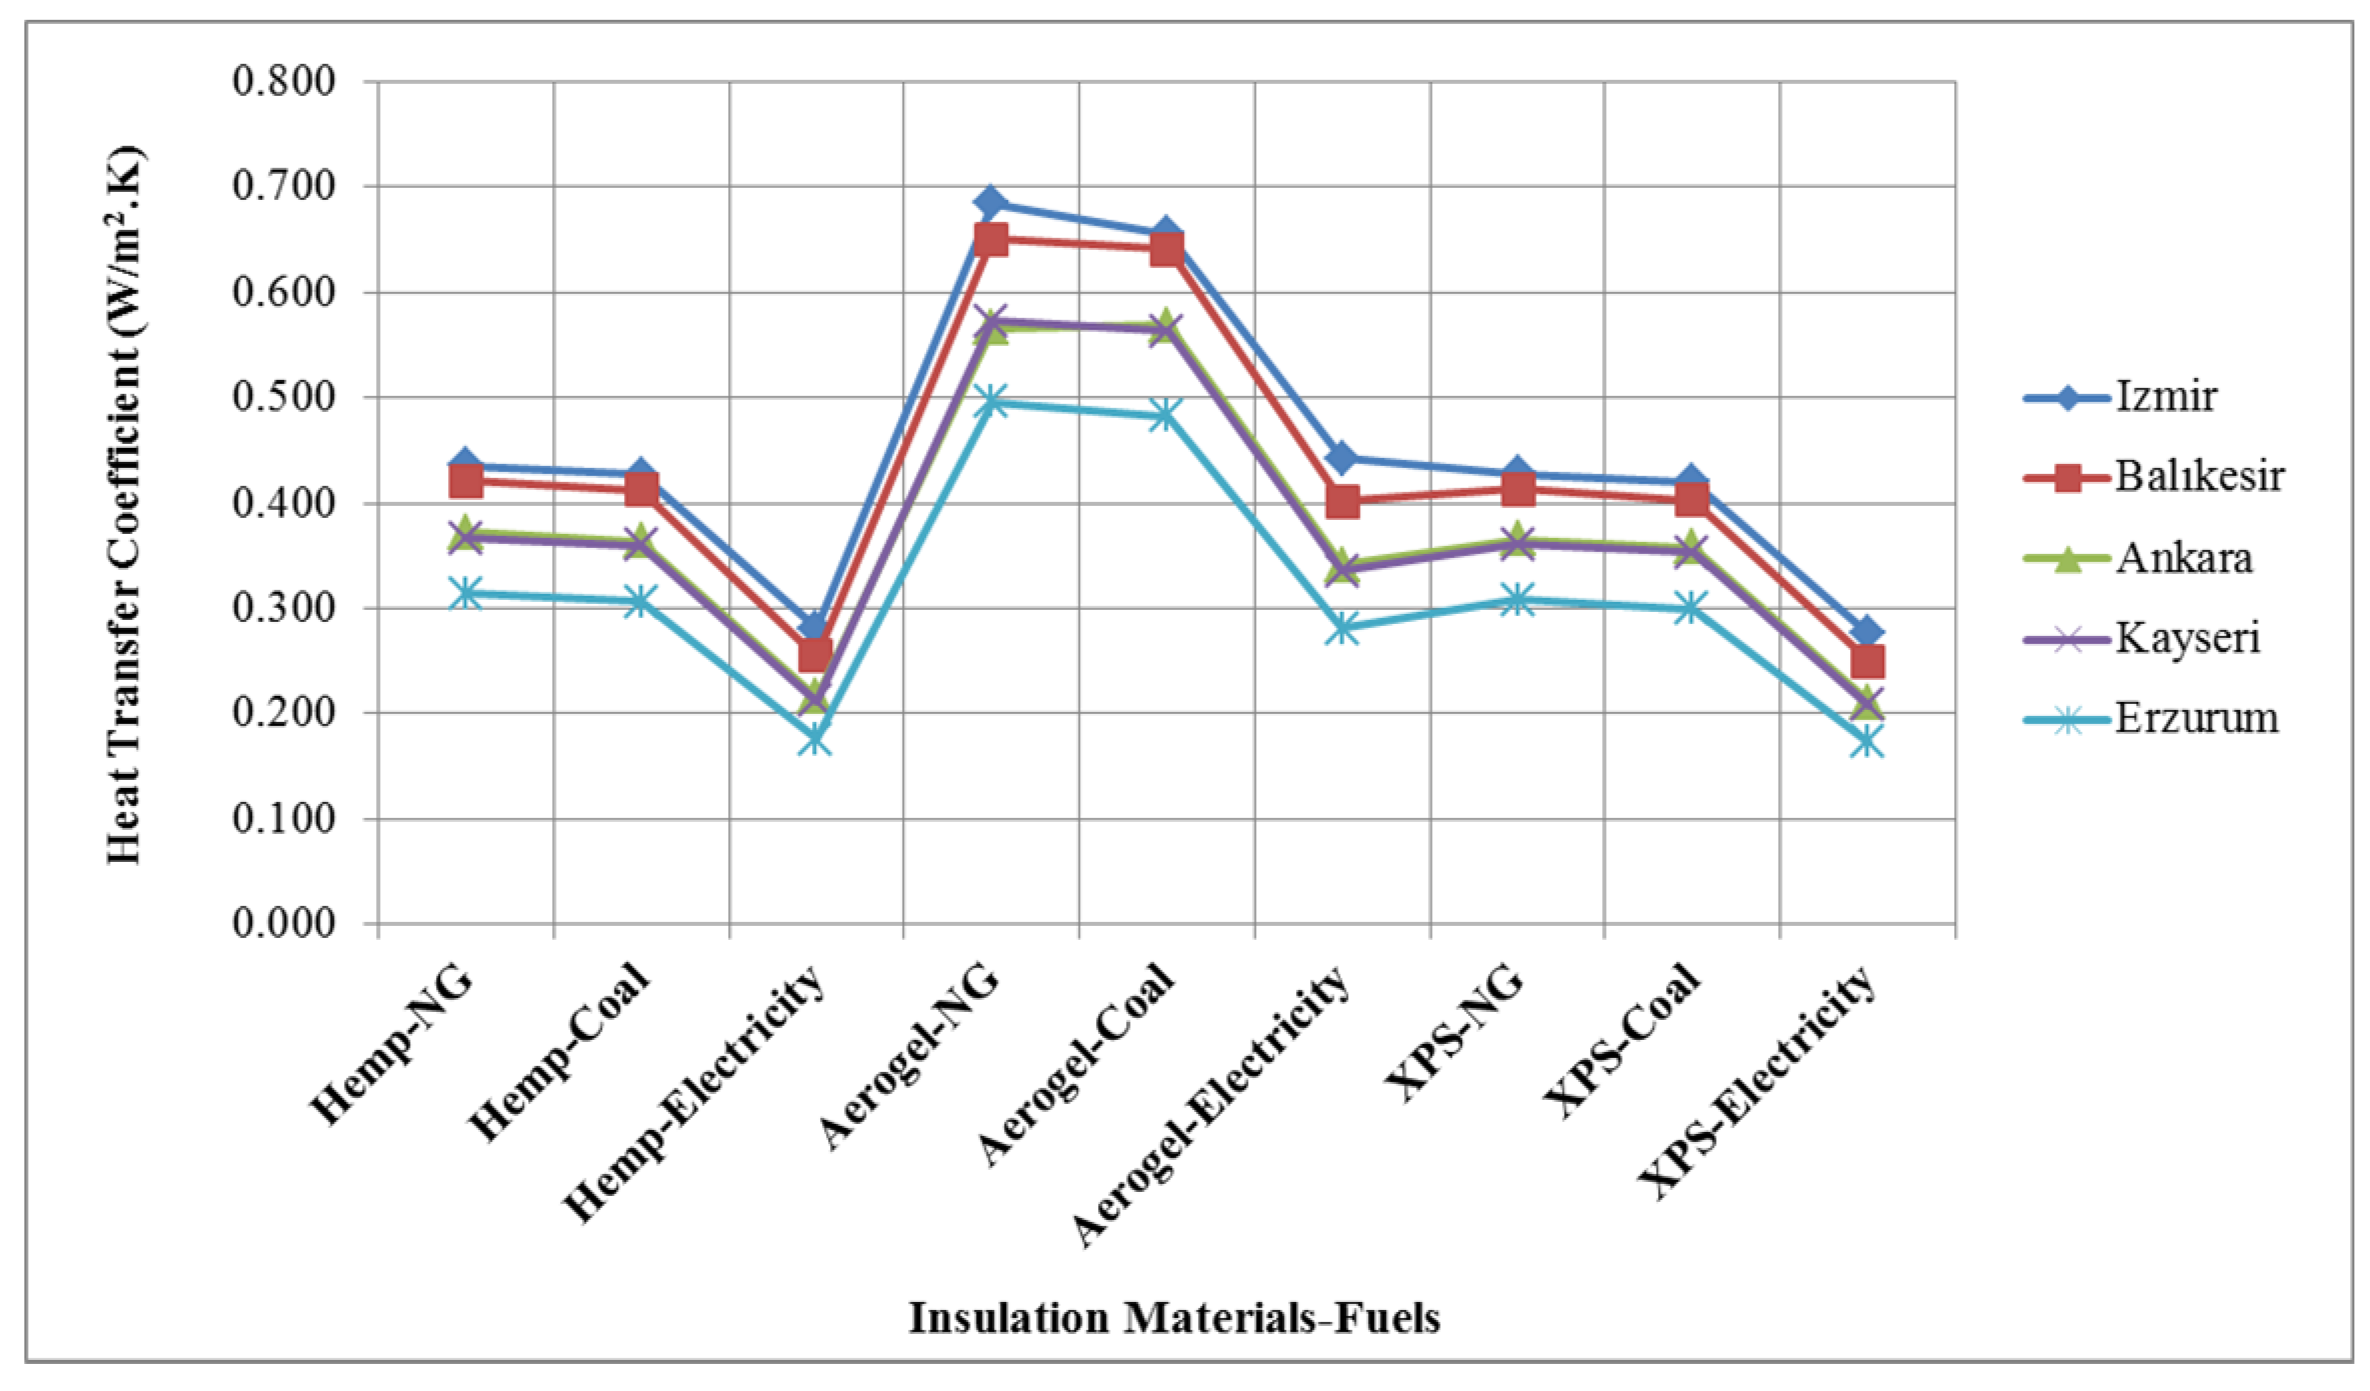
For all selected cities, the highest heat transfer coefficient for the uninsulated wall was found in the hollow brick wall material with 1.621 W/m2 K and the lowest in block bims 4 with 0.504 W/m2 K. Thus, the best wall material used in the study in terms of heat transfer is block bim 4. The one that will lose the most heat is the hollow brick wall material. Wall materials are also an effective parameter in optimum insulation thickness calculations. This uninsulated wall heat transfer coefficient is shown in Figure 6. For the insulated wall, the highest heat transfer coefficient was found in the aerogel blanket insulation materials and natural gas energy source for all wall materials—0.685 for Izmir, 0.651 for Balikesir, 0.569 for Ankara, 0.573 for Kayseri, and 0.496 W/m2·K for Erzurum. The reason for this is that the optimum insulation thickness values calculated using the aerogel blanket insulation material and natural gas energy source are at the lowest values in the study. The lowest heat transfer coefficient was found in extruded polystyrene (XPS) insulation material and electrical energy source. It is calculated as 0.276 W/m2 K for Izmir, 0.250 for Balikesir, 0.211 for Ankara, 0.208 for Kayseri and 0.173 W/m2 K for Erzurum. The optimum insulation thicknesses determined in Extruded Polystyrene (XPS) insulation material and electrical energy source are higher. The heat conduction value is higher than that of extruded polystyrene (XPS) in the calculation of the highest optimum insulation thicknesses for hemp wool. These values are given in Figure 7.
Figure 6.
The heat transfer coefficients for uninsulated walls depend on different wall materials.
Figure 7.
The heat transfer coefficients based on the different energy sources and insulation materials.
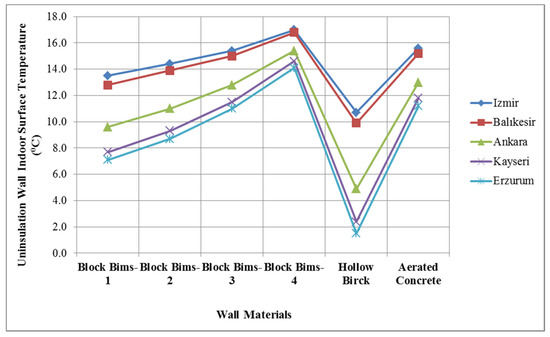
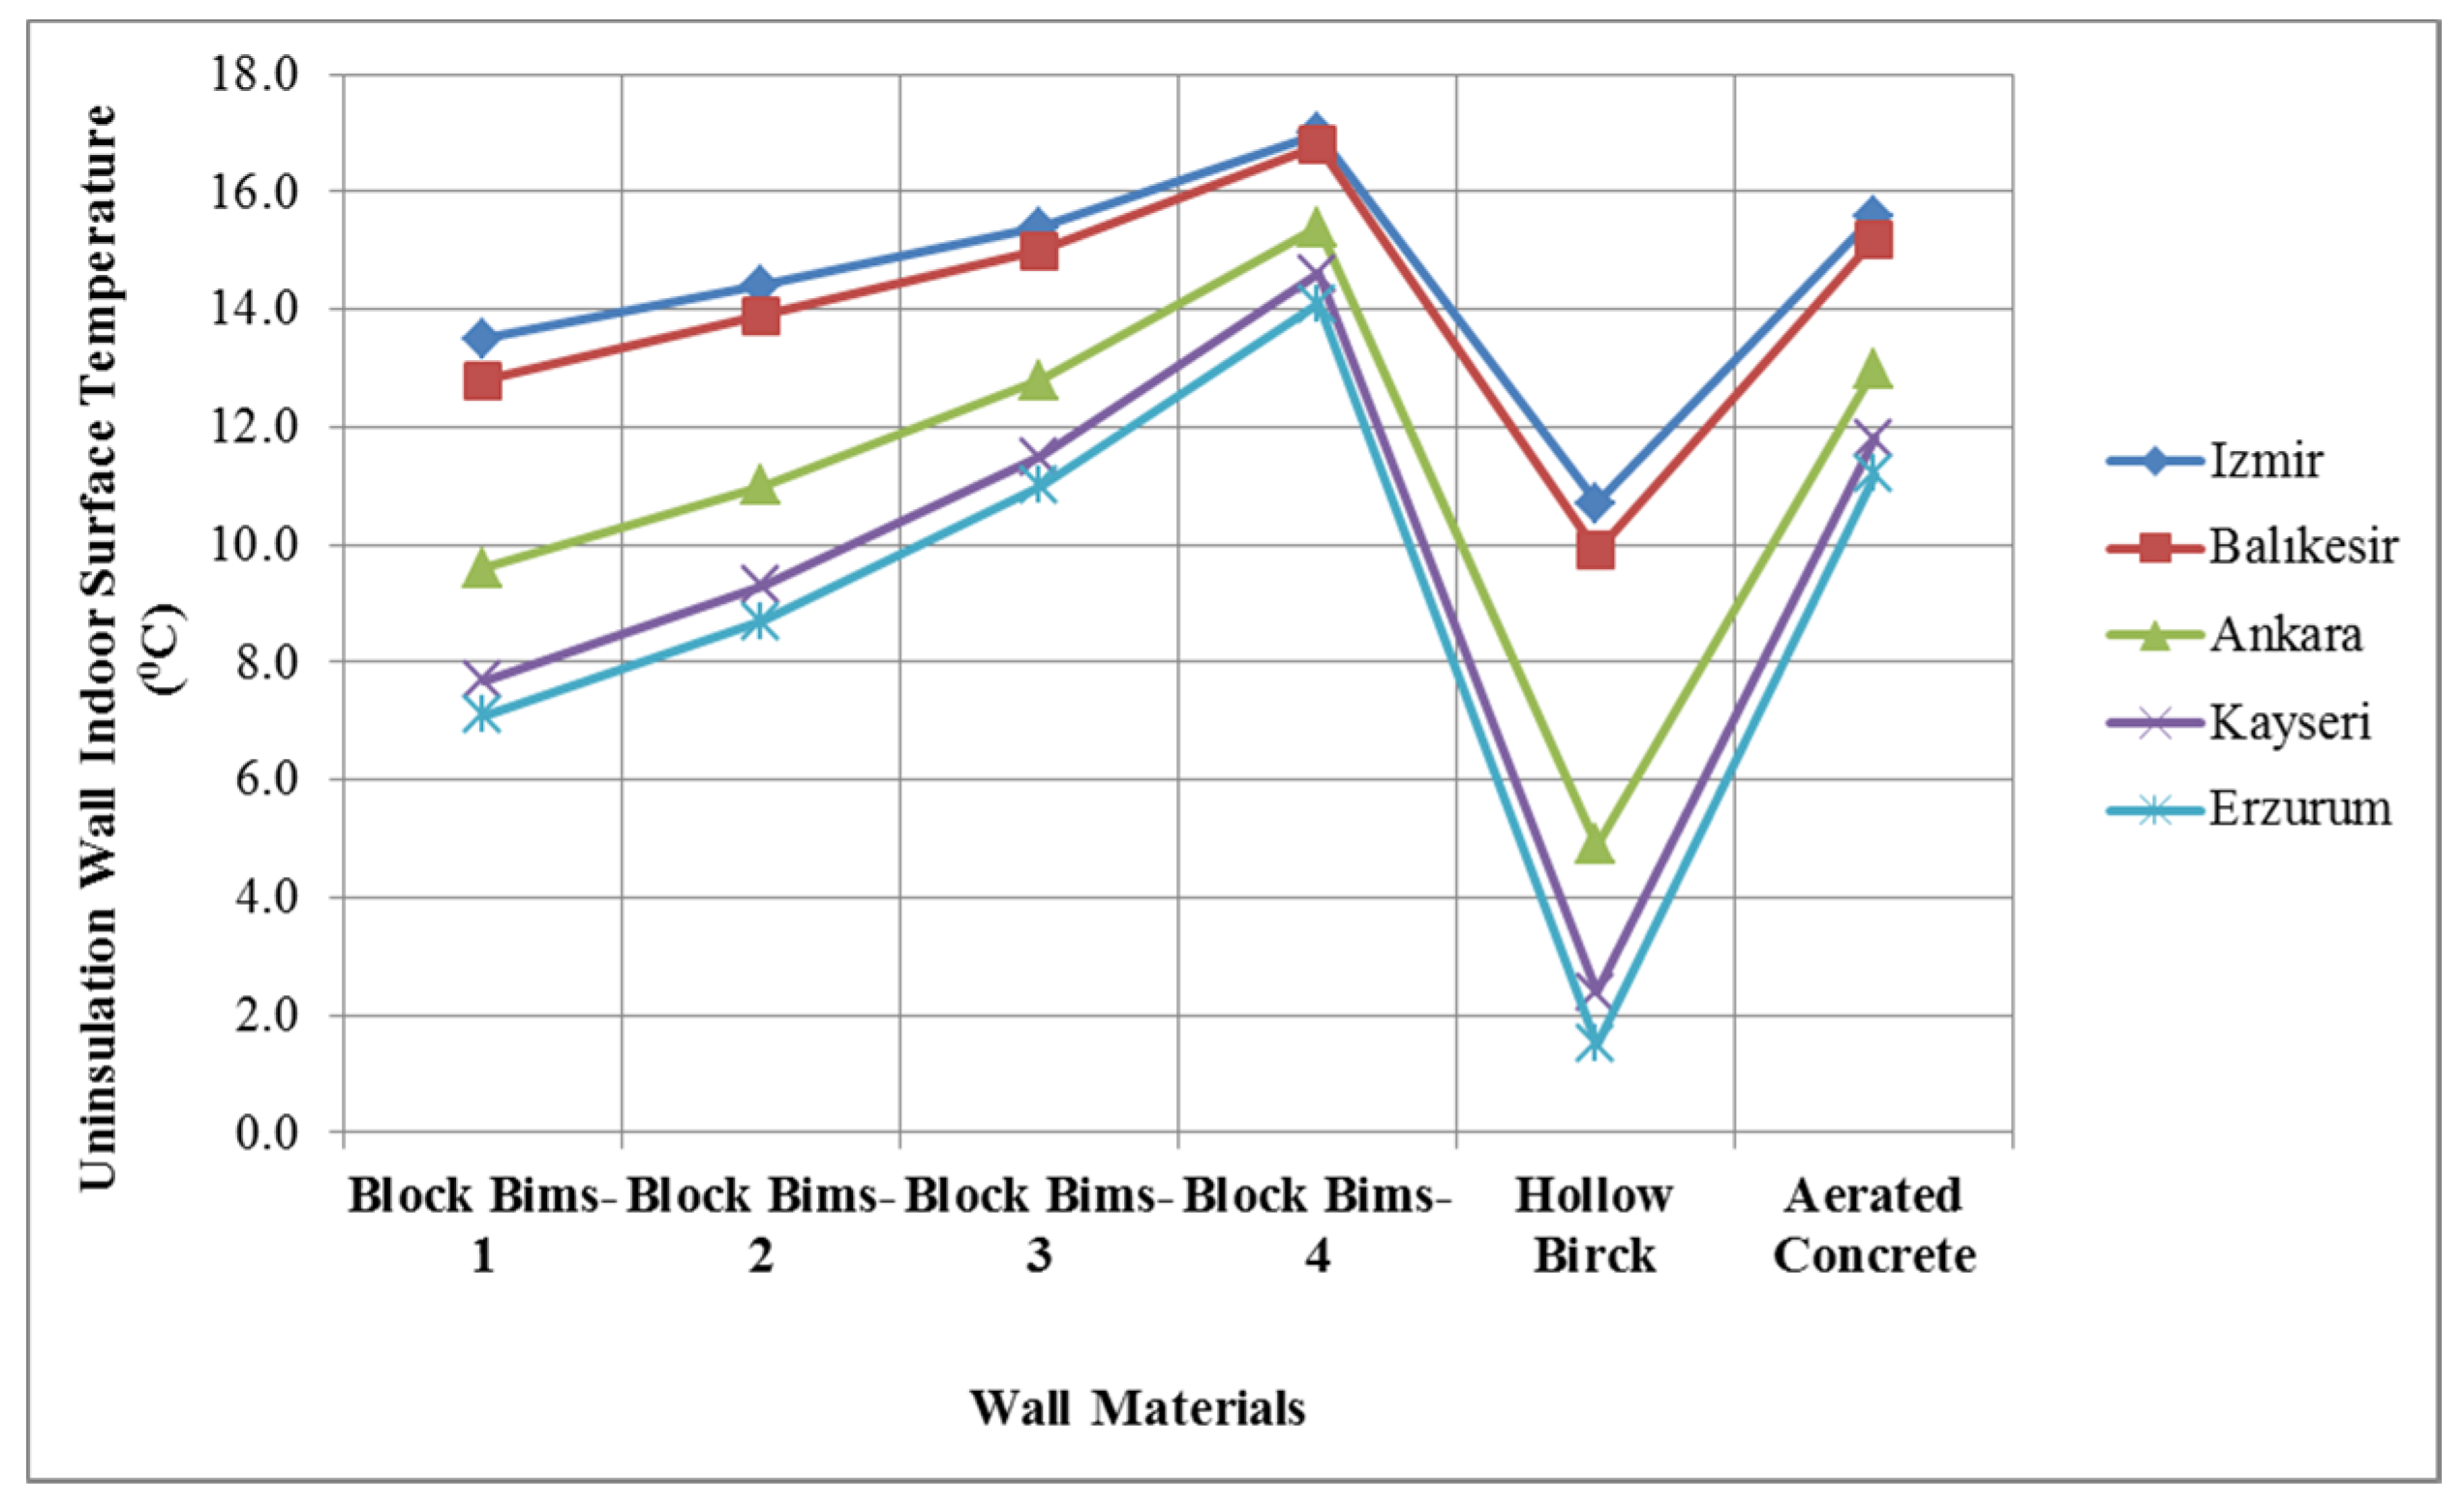
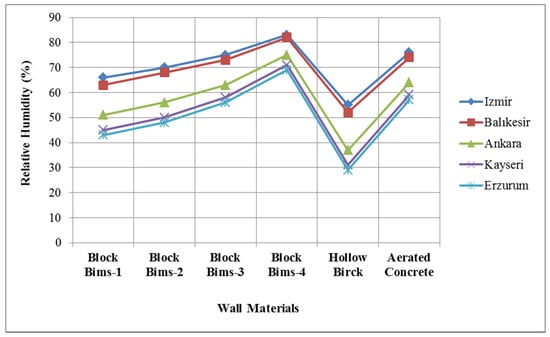
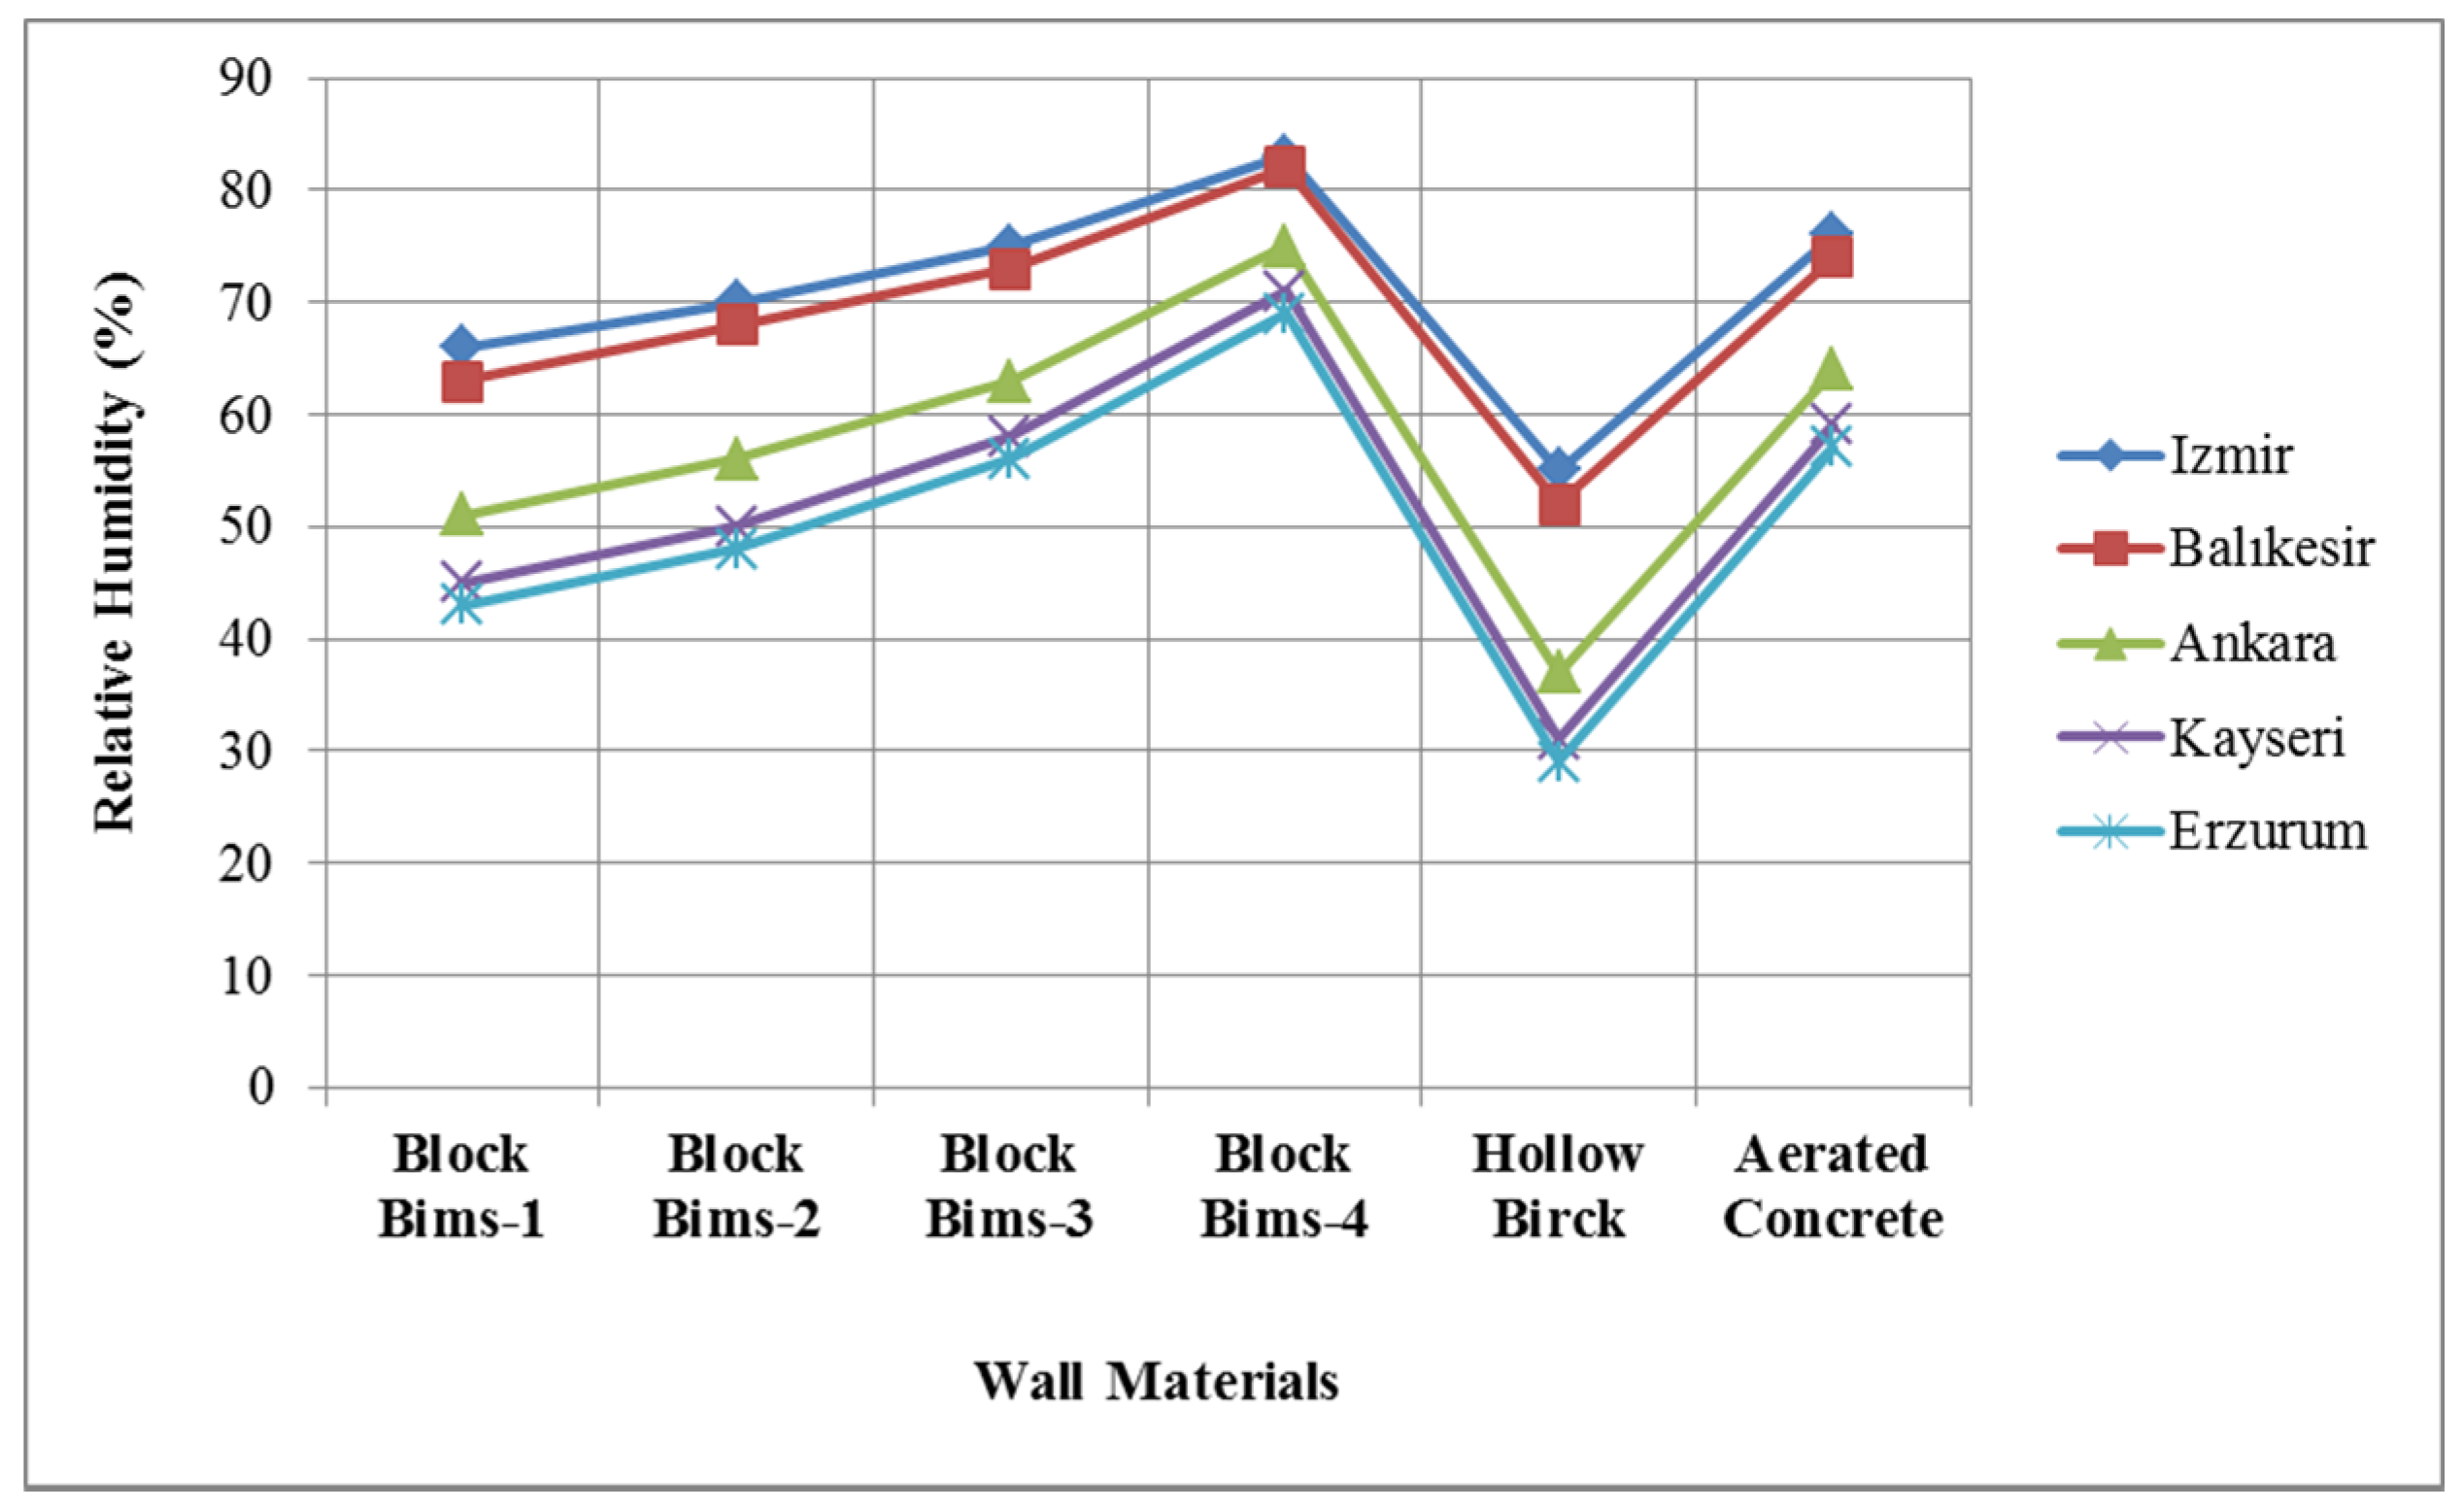
The highest values of wall indoor surface temperature calculated depending on the uninsulated block bims 4 wall material were calculated as 17.0 °C for Izmir, 16.8 °C for Balikesir, 15.4 °C for Ankara, 14.6 °C for Kayseri, and 14.1 °C for Erzurum. The lowest was determined in hollow brick wall material as 10.7 °C for Izmir, 9.9 °C for Balikesir, 4.9 °C for Ankara, 2.4 °C for Kayseri, and 1.5 °C for Erzurum. The reason for this is that the uninsulated wall heat transfer coefficient has the highest value in hollow brick wall material and the lowest value in block bims 4. These values are shown in Figure 8. The indoor relative humidity values required for mold and moisture formation depending on this wall indoor surface temperature are given in Figure 9. The highest humidity levels required for wall surface mold and moisture formation are 83% for Izmir, 82% for Balikesir, 75% for Ankara, 71% for Kayseri, and 69% for Erzurum. These values were determined in block pumice 4 wall material. The lowest humidity values are 55% for Izmir, 52% for Balikesir, 37% for Ankara, 31% for Kayseri, and 29% for Erzurum. These values were determined in hollow brick wall material. In Block Bims 4, wall indoor surface temperature temperatures were found at the highest value and in hollow brick wall material at the lowest value.
Figure 8.
Indoor surface wall temperature values due to different uninsulated wall materials.
Figure 9.
Relative humidity values required for mold that may occur indoors due to different wall materials’ uninsulation.
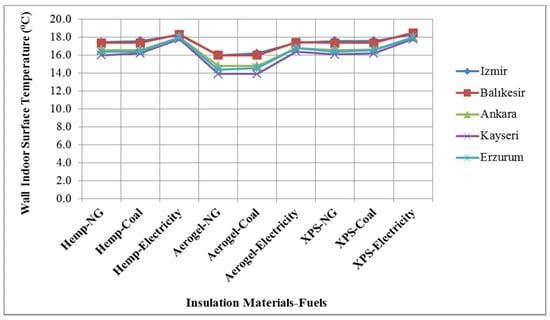
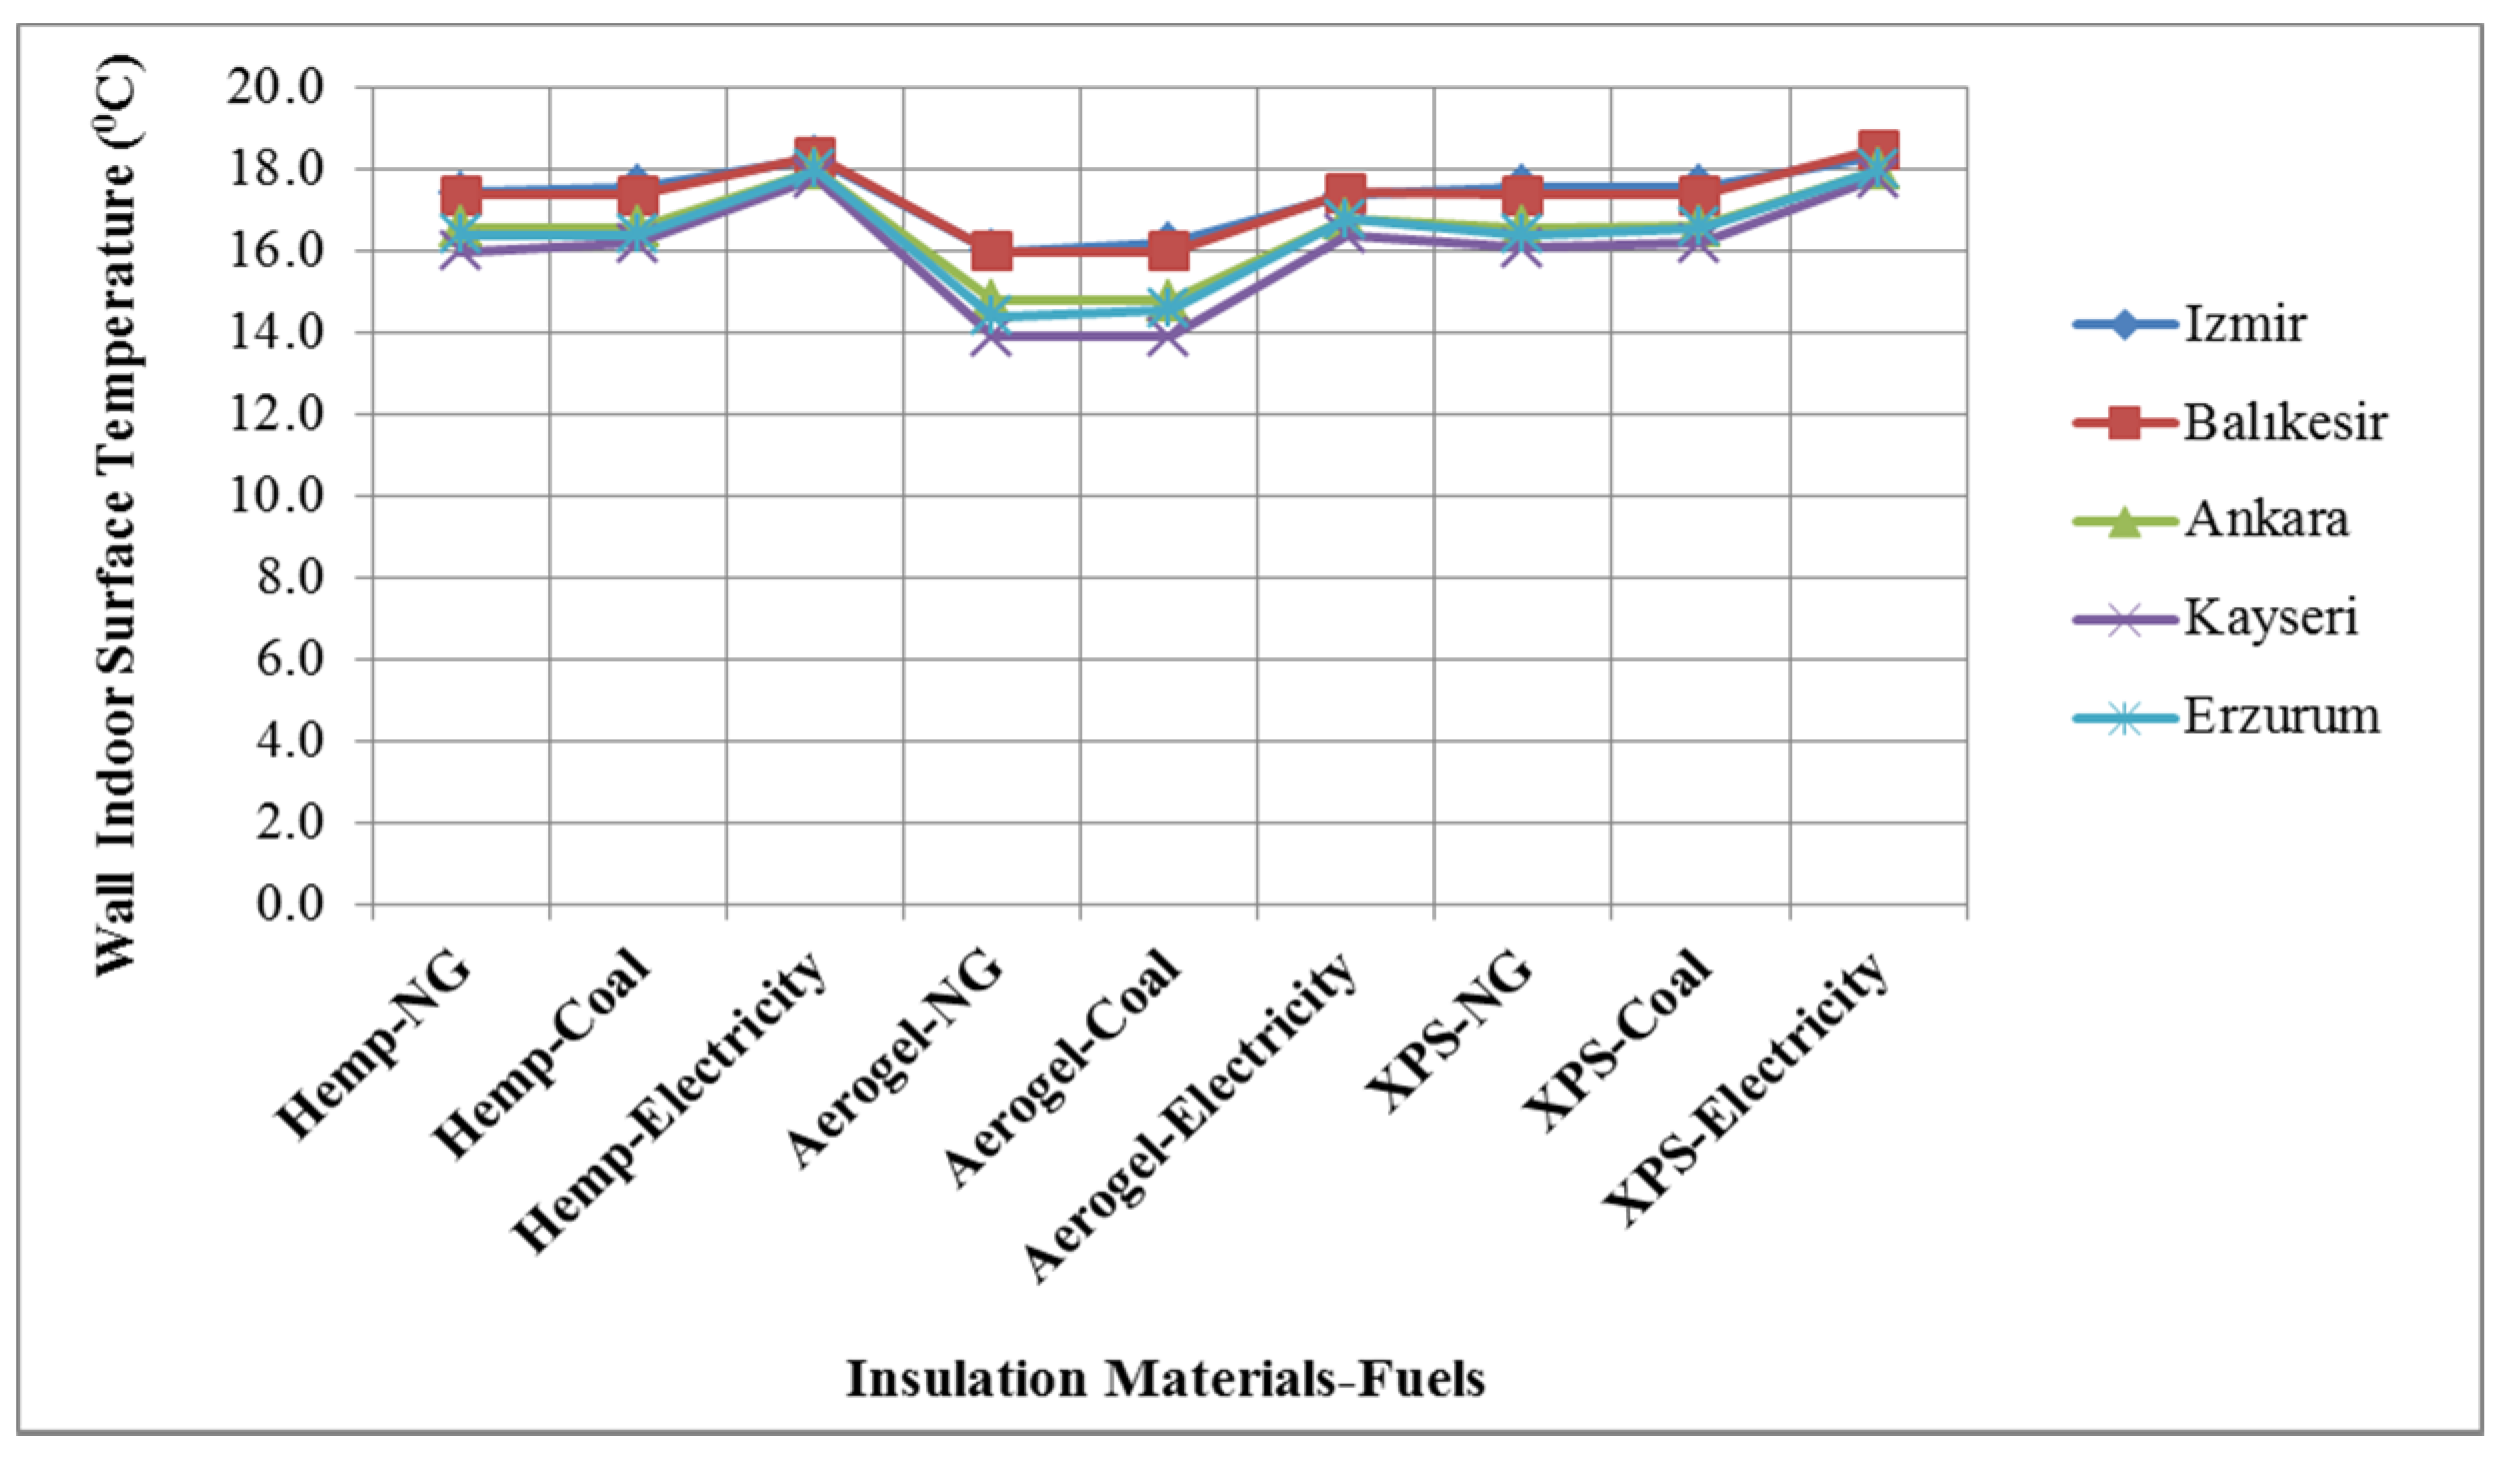
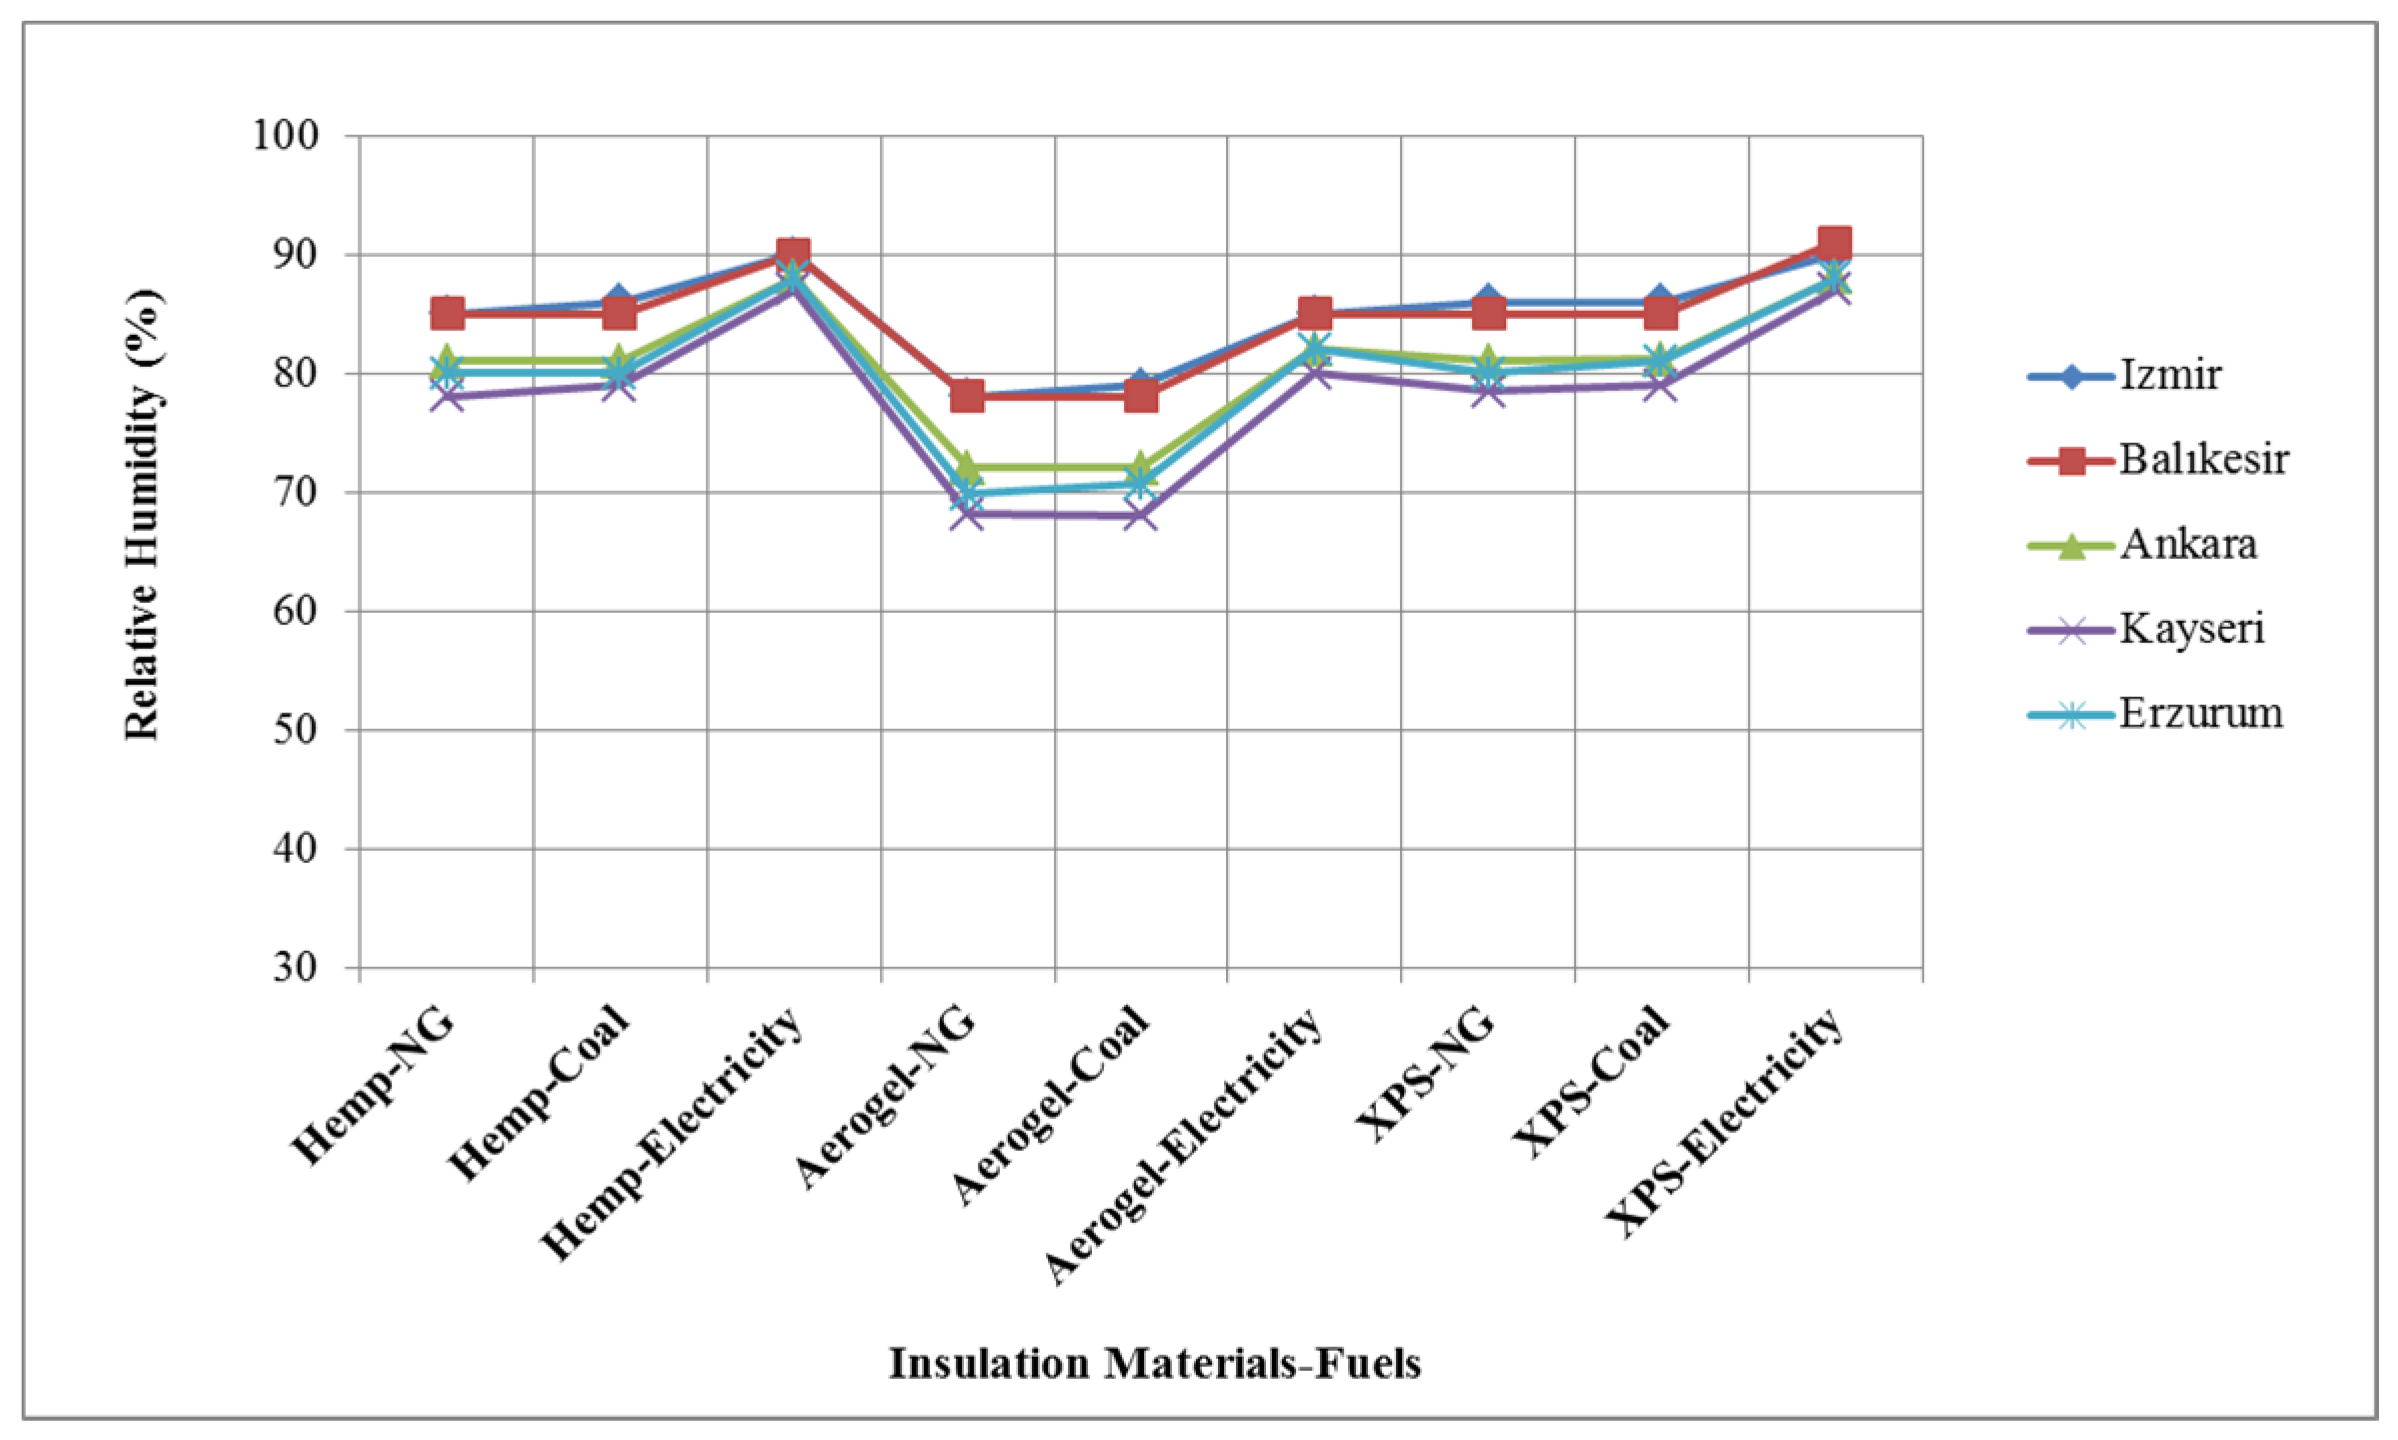
For the insulated wall, the wall indoor surface temperature is calculated at the highest value in the extruded polystyrene (XPS) insulation materials and electrical energy source. It is 18.3 °C for Izmir and Balikesir, 18.0 °C for Ankara, 17.8 °C for Kayseri, and 18.0 °C for Erzurum. The lowest was found in aerogel blanket insulation materials and natural gas energy sources. It is 16.0 °C for Izmir and Balikesir, 14.8 °C for Ankara, 13.9 °C for Kayseri, and 16.0 °C for Erzurum. Here, the heat transfer coefficient is the lowest in extruded polystyrene (XPS) insulation materials and electrical energy sources, and the highest value in aerogel insulation materials and natural gas energy sources. These values are shown in Figure 10. For this insulated wall, the indoor relative humidity values required for mold and moisture formation depending on the wall indoor surface temperature are given in Figure 11. The highest values are 90% for Izmir and Balikesir, 88% for Ankara, 87% for Kayseri, and 88% for Erzurum. The lowest values are 78% for Izmir and Balikesir, 72% for Ankara, 68% for Kayseri, and 70% for Erzurum. The highest wall indoor surface temperature value was calculated for extruded polystyrene (XPS) insulation materials and electrical energy source. The lowest wall indoor surface temperature value was found in the aerogel blanket insulation materials and natural gas energy source. In order to detect the dew point temperature of the wall indoor surface temperature, the indoor relative humidity value is required. Moisture above these values will result in mold and moisture formation. At values above these determined humidity values, the dew point temperature will be exceeded, and mold and moisture formation will occur.
Figure 10.
Wall indoor surface temperature values at optimum insulation thickness due to different energy sources and insulation materials.
Figure 11.
Relative humidity values required for mold that may occur indoors at optimum insulation thickness due to different energy sources and insulation materials.
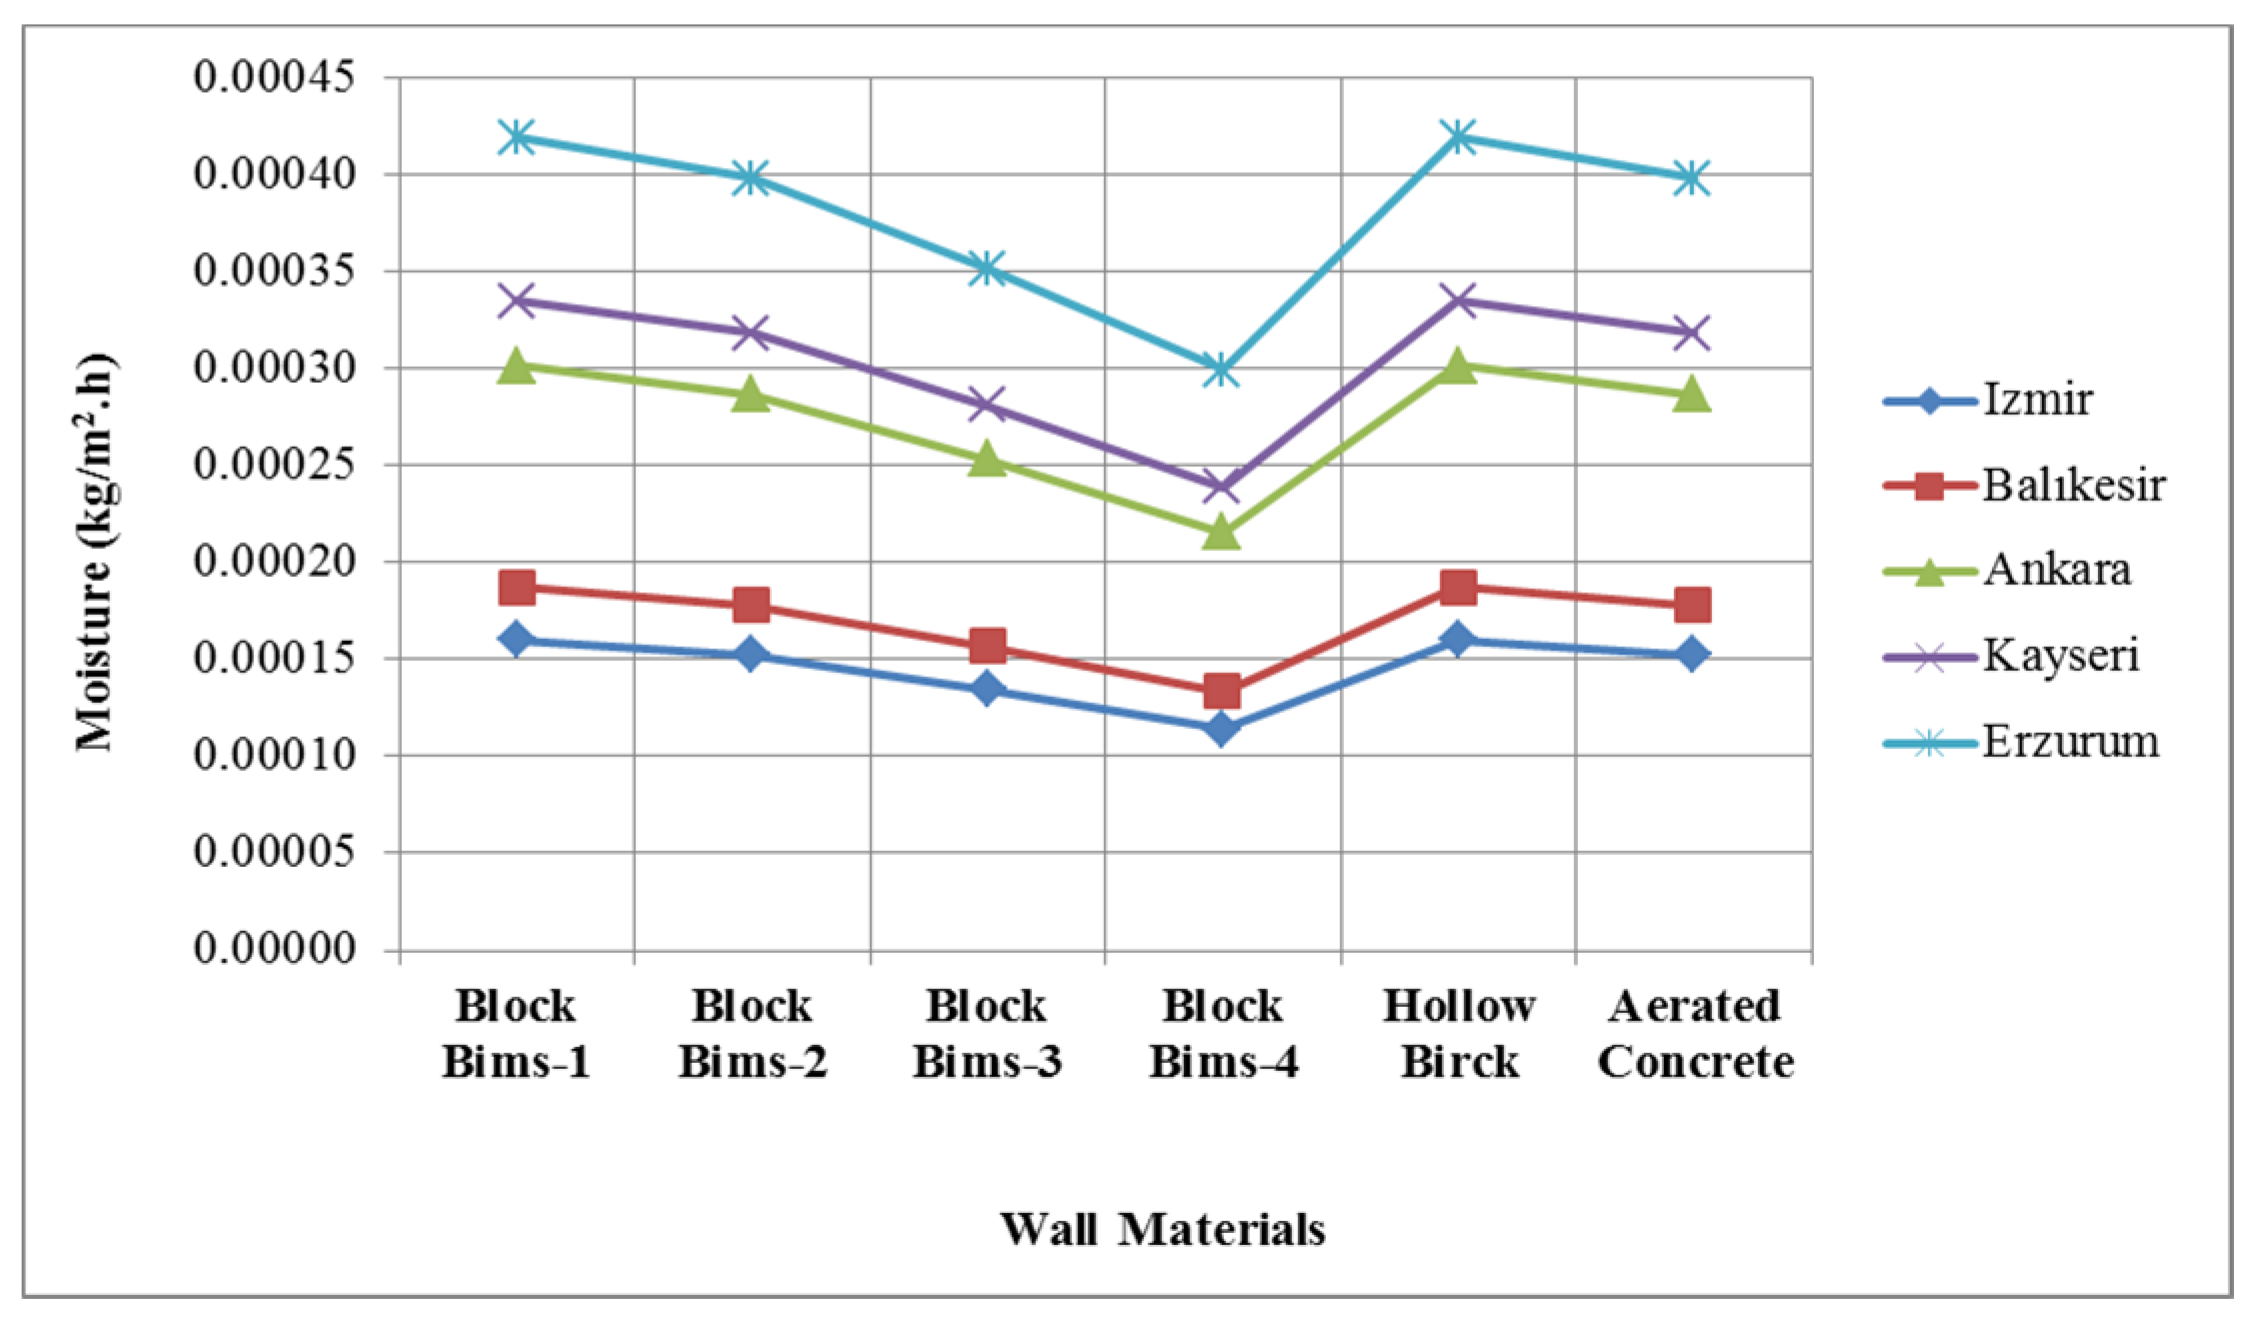
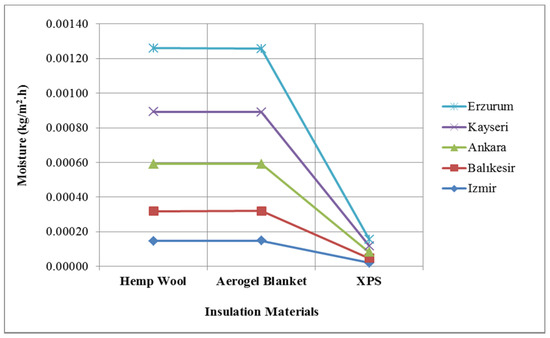
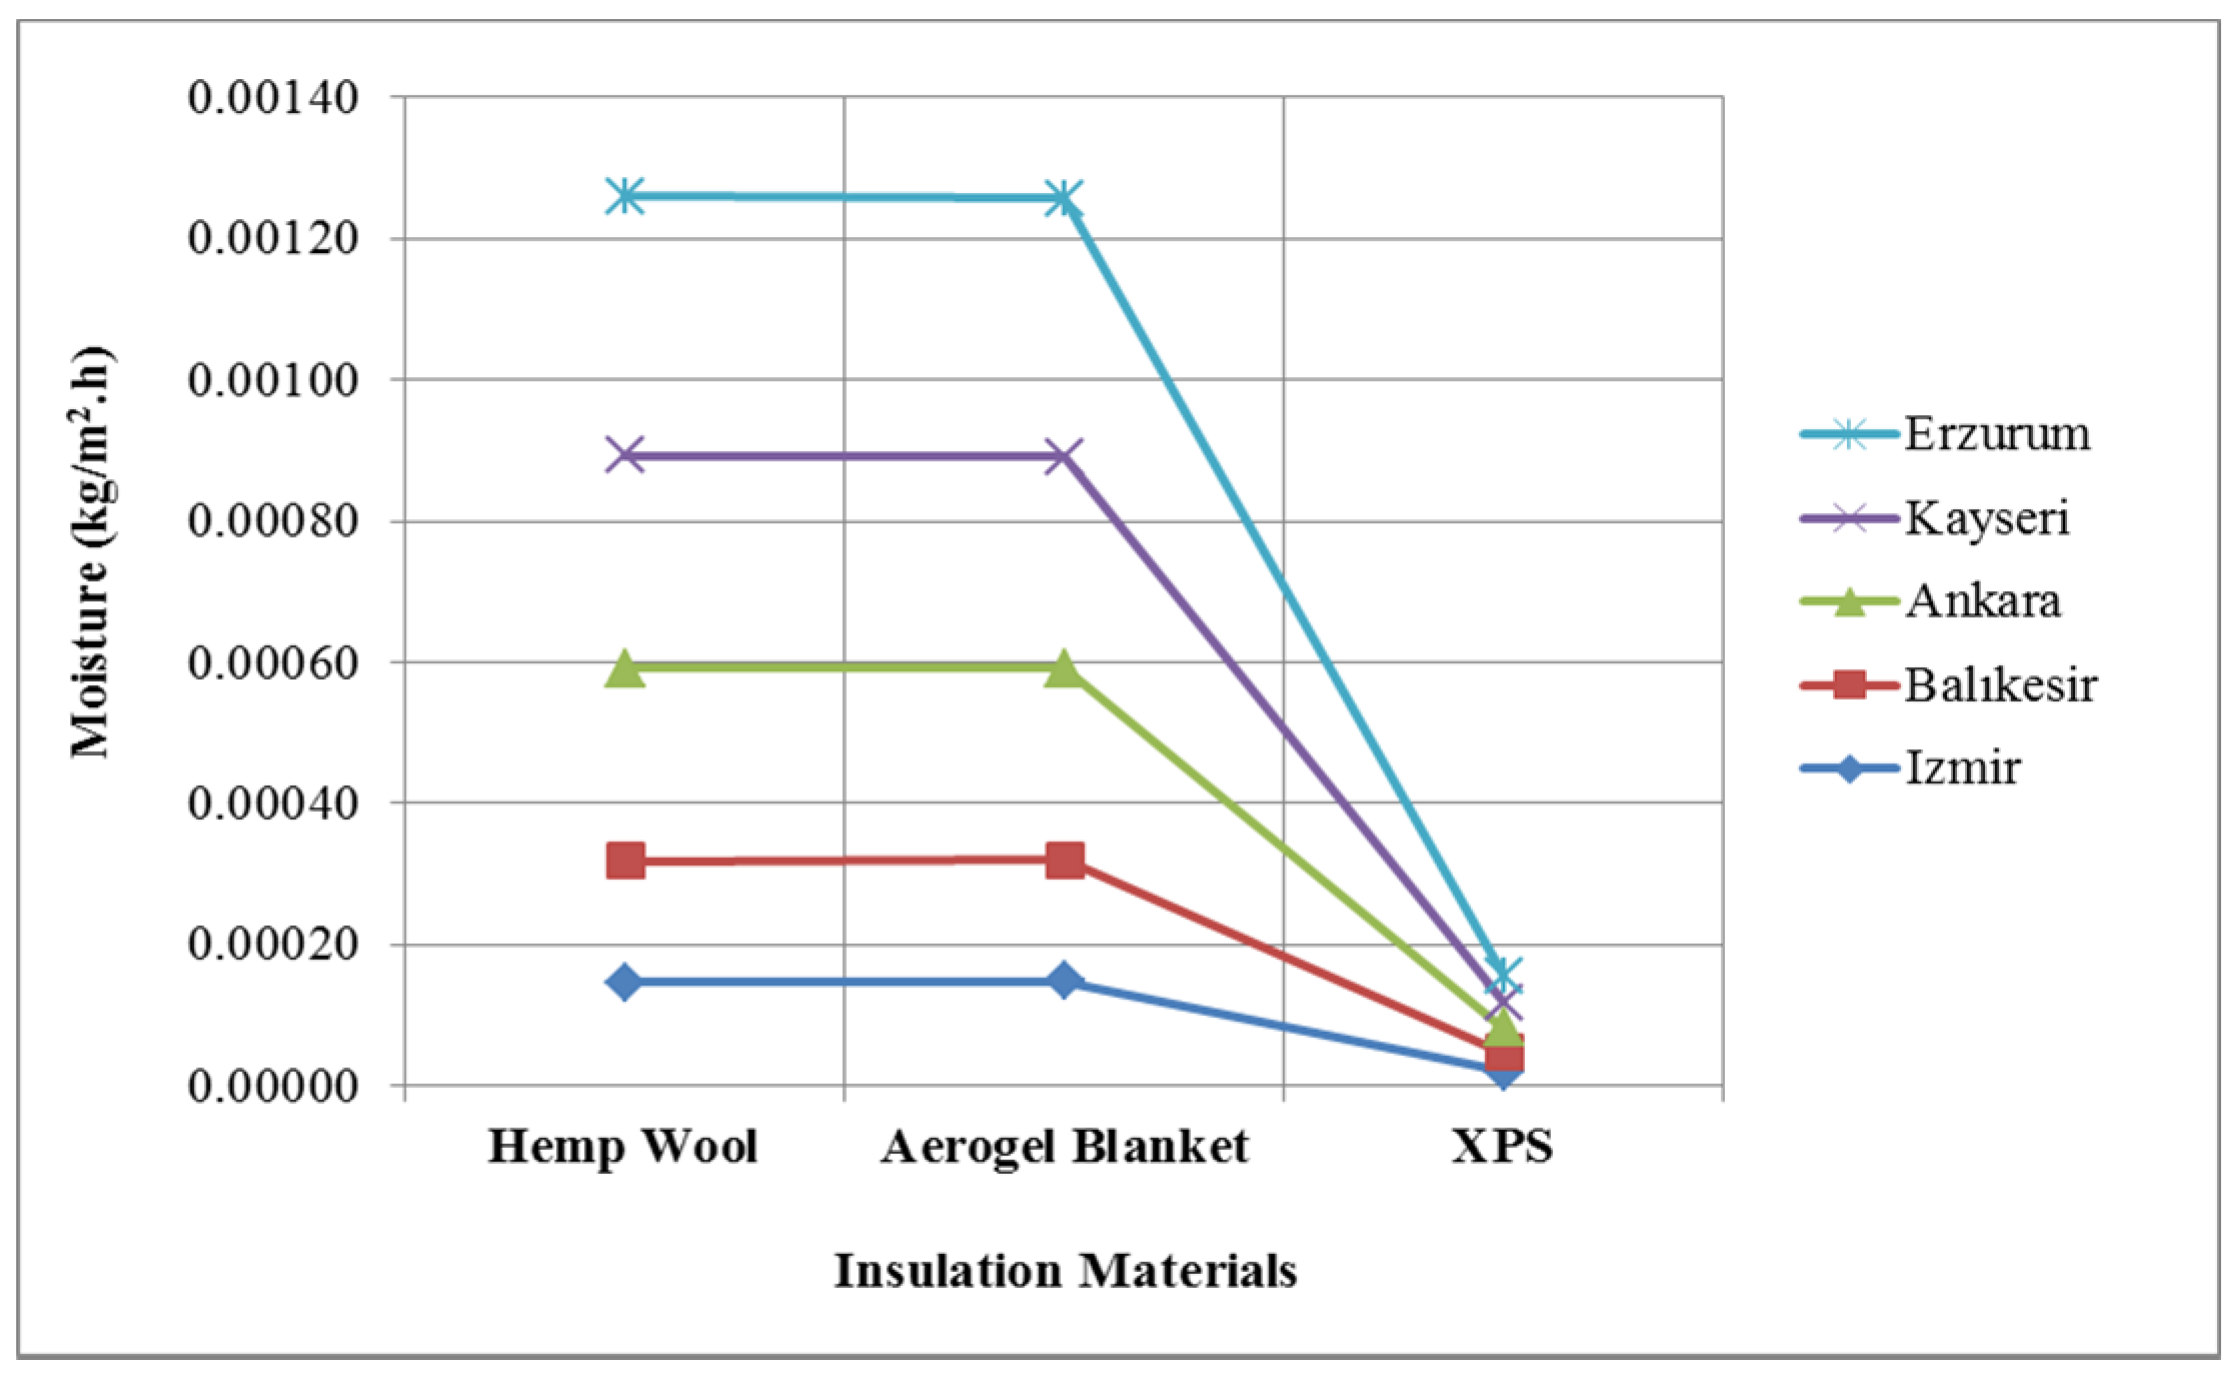
It has been determined that the highest moisture value for the uninsulated wall occurs in the hollow brick wall material. The lowest was seen in block bims 4 wall material. The highest moisture content values are 0.0001601 for Izmir, 0.0001872 for Balikesir, 0.000307 for Ankara, 0.0003348 for Kayseri, and 0.0004191 kg/m2.h for Erzurum. The lowest moisture content values are 0.0001143 for Izmir, 0.0001336 for Balikesir, 0.0002153 for Ankara, 0.0002389 for Kayseri, and 0.0002991 kg/m2.h for Erzurum. These values are shown in Figure 12. The highest moisture content for the optimum insulated wall was calculated in the hemp wool insulation material, in the hollow brick wall material, and in the electrical energy source. It is 0.0001466 for Izmir, 0.0001729 for Balikesir, 0.0002712 for Ankara, 0.0003010 for Kayseri, and 0.0003673 kg/m2.h for Erzurum. Aerogel blanket insulation material and hemp wool fuel moisture content was calculated. The lowest moisture content was found in extruded polystyrene (XPS) insulation material, hollow brick wall material, and electrical energy sources. It is 0.0000211 for Izmir, 0.0000273 for Balikesir, 0.000336 for Ankara, 0.000364 for Kayseri, and 0.0000377 kg/m2.h for Erzurum. These values are given in Figure 13. Optimum insulation thickness was calculated at the highest value in hemp wool, aerogel blanket, and extruded polystyrene (XPS) insulation materials. Hemp wool insulation material the water vapor diffusion resistance factor (µ = 1) is very low. Aerogel blanket the water vapor diffusion resistance factor (µ = 5) is partially low. On the other hand, extruded polystyrene (XPS) water vapor diffusion resistance factor (µ = 80) is much higher. For this reason, the least amount of moisture formation will be seen in the wall among the three insulation materials in the extruded polystyrene (XPS) insulation material study.
Figure 12.
Moisture values due to different wall materials for uninsulated wall.
Figure 13.
Moisture values for different insulation materials for hollow brick wall.
4. Conclusions
In the study, many conclusions were reached as a result of calculations, examinations, and research. These results are as follows:
First of all, it was observed that the optimum insulation thickness and moisture formation in the wall increased with the increase of the climate zone. The highest values of optimum thickness for all climatic regions were found in hemp wool insulation materials, hollow brick wall materials, and electrical energy sources. The highest values of optimum insulation thickness were determined as 0.118 m in Izmir in the first climate zone, 0.132 m in Balikesir in the second climate zone, 0.161 m in Ankara in the third climate zone, 0.164 m in the fourth climate zone Kayseri, and 0.202 m in the fifth climate zone Erzurum.
It has been determined that there is no need for optimum insulation thickness in aerogel blanket insulation materials and in natural gas and coal energy sources for all climate zones. The effective cost of aerogel blanket insulation materials here is that it is of very high value.
All climate zones and all wall materials have been identified for electricity among the energy sources of the highest optimum insulation thickness. What is effective here is that the lower heating value of the electricity is at the lowest value. Among the wall insulations, the lowest values of optimum insulation thickness for all climate zones were found in block bims 4 and the highest in hollow brick materials. Here, the lowest heat conduction coefficients were seen in wall materials block bims 4 and the highest in hollow brick materials.
The heat transfer coefficients for the insulation wall were determined as 0.685 W/m2 K in Izmir in the first climate zone and 0.173 W/m2 K in Erzurum in the fifth climate region. As the climate zone increases, the heat transfer coefficient decreases. The highest heat transfer coefficient for the insulated wall was calculated for the aerogel blanket insulation materials and the natural gas energy source. The lowest is calculated for extruded polystyrene (XPS) insulation material and electrical energy sources.
The parameter that is effective in reaching the dew point temperature on the inner surface of the wall is the indoor relative humidity value. The lowest values for reality humidity uninsulated walls are 55% for Izmir, 52% for Balikesir, 37% for Ankara, 31% for Kayseri, and 29% for Erzurum. These values are calculated for hollow brick wall material. Here again, the effective parameter is the heat conduction coefficient. Among all the selected wall materials, hollow brick is the wall material with the highest heat conduction coefficient. The lowest humidity value for the insulated wall was determined as 78% for Izmir, 78% for Balikesir, 72% for Ankara, 68% for Kayseri, and 69% for Erzurum. When the indoor humidity value exceeds these humidity values, moisture and mold formation will occur on the inner surface of the wall. These humidity values were found for the insulated wall for the aerogel blanket and natural gas and coal energy source as the insulation material.
In the uninsulated wall for average of the whole year, the highest humidity amount was determined as 0.0004191 kg/m2 h for Erzurum province and 0.0001601 kg/m2 h for Izmir province. The lowest amount of moisture to be formed in the insulated wall was found to be 0.0000211 kg/m2 h in Izmir and the highest amount was 0.0000377 kg/m2 h for Erzurum province. As the climate zone increases, the amount of moisture that will form inside the wall also increases. Here, the most effective parameter is insulation materials in the water vapor diffusion resistance factor. For extruded polystyrene (XPS), the water vapor diffusion resistance factor is much higher than other insulation materials.
As a result, while optimum insulation thickness is sufficient for hemp wool insulation materials, it is not sufficient for an aerogel blanket due to its high cost. However, since the water vapor diffusion resistance factor is very low for both hemp wool and aerogel blanket insulation materials, they are insulation materials that are suitable for mold and moisture formation in and on the wall.
The amount of moisture formation on the external walls is seen at the lowest in the first climate zone and the highest in the fifth climate zone. As the climate zone gets colder, the amount of moisture formation on the outer walls increases as you go from the first climate zone to the fifth climate zone. In this case, it is necessary to calculate the insulation thickness more carefully in the cold climate zone. When calculating the insulation thickness in a cold climate zone, it should be evaluated not only in terms of the cost of the insulation, but also in terms of moisture and mold formation.
In future studies, the insulation materials that are widely used and applied in the market will be examined in terms of mold and moisture formation.
Author Contributions
Conceptualization, İ.C. and O.K.; methodology, O.K.; validation, O.K.; formal analysis, O.K.; investigation, İ.C. and O.K.; writing—original draft preparation, O.K.; writing—review and editing, İ.C. and O.K.; visualization, İ.C. and O.K.; supervision, O.K. All authors have read and agreed to the published version of the manuscript.
Funding
This research received no external funding.
Informed Consent Statement
Not applicable.
Conflicts of Interest
The authors declare no conflict of interest.
Nomenclature
| HDD | Heating degree-day |
| CDD | Cooling degree-day |
| T | Temperature (°C, K) |
| x | Insulation thickness (m) |
| Re | Reynold number |
| V | Air velocity (m/s) |
| l | Length (m) |
| ʋ | Kinematic viscosity (m2/s) |
| Nu | Nusselt number |
| Pr | Prandtl number |
| Gr | Grashof number |
| Ra | Raleigh number |
| ρ | Gravitational acceleration (9.81 m/s2) |
| ε | Emissivity |
| σ | Stefan-Boltzmann constant |
| (5.670 × 10⁻⁸ W⋅m−2⋅K−4) | |
| h | Heat transfer coefficient |
| Pv | Partial vapour pressure (Pa) |
| λ | Conduction heat transfer coefficient (W/m K) |
| q | Heat loss (W/m2) |
| U | Overall heat transfer coefficient (W/m2 °C) |
| β | Coefficient of valume expansion (1/K) |
| R | Thermal resistance (m2 K/W) |
| η | Heating system efficiency (%) |
| C | Cost ($) |
| COP | Cooling performance coefficient |
| XPS | Extruded Polystyrene |
| PWF | Present Worth Factor |
| i | Interest rate (%) |
| g | Inflation rate (%) |
| N | Life (year) |
| E | Annual energy load (kWh/m2) |
| r | Interest rate |
| Hu | Lower heating value (J/kg, J/m3, J/kWh) |
| Ω | Surface vapor permeability coefficient (kg/m2 h mmSS) |
| φ | Relative humidity (%) |
| µ | The water vapor diffusion resistance factor |
References
- Özer, N.; Özgünler, S.A. Yapılarda yaygın kullanılan ısı yalıtım malzemelerinin performans özelliklerinin duvar kesitleri üzerinde değerlendirilmesi. Uludağ Univ. J. Fac. Eng. 2019, 24, 25–48. [Google Scholar]
- Ziapour, B.M.; Rahimi, M.; Gendeshmin, M.Y. Thermoeconomic analysis for determining optimal insulation thickness for new composite prefabricated wall block as an external wall member in buildings. J. Build. Eng. 2020, 31, 101354. [Google Scholar] [CrossRef] [Scilit]
- Cuce, E.; Cuce, P.M.; Wood, C.J.; Riffat, S.B. Optimizing insulation thickness and analysing environmental impactsof aerogel-based thermal superinsulation in buildings. Energy Build. 2014, 77, 28–39. [Google Scholar] [CrossRef] [Scilit]
- Yamankaradeniz, N. Minimization of thermal insulation thickness taking into account condensation on external walls. Adv. Mech. Eng. 2015, 7, 1687814015604803. [Google Scholar] [CrossRef] [Scilit]
- Kaya, S.; Oğuz, M.E. Tesisat yalıtımında uygun malzeme seçimi. In Proceedings of the Ulusal Tesisat Kongresi Ve Sergisi (TESKON), Yalıtım Semineri, Izmir, Turkey, 8–11 April 2015; pp. 2483–2496. [Google Scholar]
- Ibrahim, M.; Biwole, P.H.; Achard, P.; Wurtz, E.; Ansart, G. Building envelope with a new aerogel-based insulating rendering: Experimental and numerical study, cost analysis, and thickness optimization. Appl. Energy 2015, 159, 490–501. [Google Scholar] [CrossRef] [Scilit]
- Dlimi, M.; Iken, O.; Agounoun, R.; Zoubir, A.; Kadiri, I.; Sbai, K. Energy performance and thickness optimization of hemp wool insulation and air cavity layers integrated in Moroccan building walls. Sustain. Prod. Consum. 2019, 20, 273–288. [Google Scholar] [CrossRef] [Scilit]
- Evangelisti, L.; Guattari, C.; Gori, P.; Bianchi, F. Heat transfer study of external convective and radiative coefficients for building applications. Energy Build. 2017, 151, 429–438. [Google Scholar] [CrossRef] [Scilit]
- Huang, H.; Zhou, Y.; Huang, R.; Wu, H.; Sun, Y.; Huang, G.; Xu, T. Optimum insulation thicknesses and energy conservation of building thermal insulation materials in Chinese zone of humid subtropical climate. Sustain. Cities Soc. 2020, 52, 101840. [Google Scholar] [CrossRef] [Scilit]
- Kurekci, N.A. Determination of optimum insulation thickness for building walls by using heating and cooling degree-day values of all Turkey’s provincial centers. Energy Build. 2016, 118, 197–213. [Google Scholar] [CrossRef] [Scilit]
- Tükel, M.; Tunçbilek, E.; Komerska, A.; Keskin, G.A.; Arıcı, M. Reclassification of climatic zones for building thermal regulations based on thermoeconomic analysis: A case study of Turkey. Energy Build. 2021, 246, 111121. [Google Scholar] [CrossRef] [Scilit]
- Ozel, M. Thermal, economical and environmental analysis of insulated building walls in a cold climate. Energy Convers. Manag. 2013, 76, 674–684. [Google Scholar] [CrossRef] [Scilit]
- Dombayci, A.Ö.; Gölcü, M.; Pancar, Y. Optimization of insulation thickness for external walls using different energy-sources. Appl. Energy 2006, 83, 921–928. [Google Scholar] [CrossRef] [Scilit]
- Alghoul, S.K.; Gwesha, A.O.; Naas, A.M. The effect of electricity price on saving energy transmitted from external building walls. Energy Res. J. 2016, 7, 1–9. [Google Scholar] [CrossRef] [Scilit]
- Uygunoğlu, T.; Keçebaş, A. LCC analysis for energy-saving in residential buildings with different types of construction masonry blocks. Energy Build. 2011, 43, 2077–2085. [Google Scholar] [CrossRef] [Scilit]
- Lopez-Arce, P.; Altamirano-Medina, H.; Berry, J.; Rovas, D.; Sarce, F.; Hodgson, S. Building moisture diagnosis: Processing, assessing and representation of environmental data for root cause analysis of mould growth. Build. Simul. 2020, 13, 999–1008. [Google Scholar] [CrossRef] [Scilit]
- Boroń, J.; Marszałek, K. Distribution of the temperature factor in terms of building envelope protection against mould growth. Technol. Trans. Civ. Eng. 2015, 1-B, 3–16. [Google Scholar] [CrossRef]
- Wang, R.; Ge, H.; Baril, D. Moisture-safe attic design in extremely cold climate: Hygrothermal simulations. Build. Environ. 2020, 182, 107166. [Google Scholar] [CrossRef] [Scilit]
- Cho, H.M.; Yang, S.; Wi, S.; Chang, S.J.; Kim, S. Hygrothermal and energy retrofit planning of masonry façade historic building used as museum and office: A cultural properties case study. Energy 2020, 201, 117607. [Google Scholar] [CrossRef] [Scilit]
- Arısoy, A. Nem alma sistemlerinde nem kazancının hesabı, IV. In Proceedings of the Ulusal Tesisat Mühendisliği Kongresi Ve Sergisi(TESKON), Izmir, Turkey, 4–7 November 1999; pp. 621–631. [Google Scholar]
- Kon, O.; Caner, I.; Arda, S. Investigation of using hemp as a thermal insulation material in the building envelope in terms of thermal comfort. In Proceedings of the 12th International Exergy, Energy and Environment Symposium (IEEES-12), Doha, Qatar, 20–24 December 2020; pp. 1–4. [Google Scholar]
- Lewandowski, M.W.; Lewandowska-Iwaniak, W. The external walls of a passive building: A classification and description of their thermal and optical properties. Energy Build. 2014, 69, 93–102. [Google Scholar] [CrossRef] [Scilit]
- Saafi, K.; Daouas, N. Energy and cost efficiency of phase change materials integrated in building envelopes under Tunisia Mediterranean climate. Energy 2019, 187, 115987. [Google Scholar] [CrossRef] [Scilit]
- Bruno, R.; Bevilacqua, P.; Ferraro, V.; Arcuri, N. Reflective thermal insulation in non-ventilated air-gaps: Experimentalmand theoretical evaluations on the global heat transfer coefficient. Energy Build. 2021, 236, 110769. [Google Scholar] [CrossRef] [Scilit]
- Mirsadeghi, M.; Cóstola, D.; Blocken, B.; Hensen, J.L.M. Review of external convective heat transfer coefficient models in building energy simulation programs: Implementation and uncertainty. Appl. Therm. Eng. 2013, 56, 134–151. [Google Scholar] [CrossRef] [Scilit]
- Joudi, A.; Svedung, H.; Bales, C.; Rönnelid, M. Highly reflective coatings for interior and exterior steel cladding and the energy efficiency of buildings. Appl. Energy 2011, 88, 4655–4666. [Google Scholar] [CrossRef] [Scilit]
- Evangelisti, L.; Guattari, C.; Asdrubali, F. On the sky temperature models and their influence on buildings energy performance: A critical review. Energy Build. 2019, 183, 607–662. [Google Scholar] [CrossRef] [Scilit]
- Li, M.; Jiang, Y.; Coimbra, C.F.M. On the determination of atmospheric longwave irradiance under all-sky conditions. Sol. Energy 2017, 144, 40–48. [Google Scholar] [CrossRef] [Scilit]
- Kon, O.; Caner, İ. Investigation of buildings with optimum insulation thickness depending on different external wall types and insulation materials in terms of mold and moisture risk. In Proceedings of the TÜBA World Conference on Energy Science and Technology (TÜBA WCEST—2021), Ankara, Turkey, 8–12 August 2021; pp. 92–93. [Google Scholar]
- Aydin, N.; Biyikoğlu, A. Determination of optimum insulation thickness by life cycle cost analysis for residential buildings in Turkey. Sci. Technol. Built Environ. 2021, 27, 2–13. [Google Scholar] [CrossRef] [Scilit]
- TS 825; Thermal Insulation Requirements for Buildings. Turkish Standard: Ankara, Turkey, 2013.
- Attia, S.; Shadmanfar, N.; Ricci, F. Developing two benchmark models for nearly zero energy schools. Appled Energy 2020, 263, 114614. [Google Scholar] [CrossRef] [Scilit]
- Cengel, Y.; Ghafar, A. Heat and Mass Transfer: Fundamentals and Applications; McGraw-Hill Higher Education: New York, NY, USA, 2014. [Google Scholar]
- Çengel, A.Y.; Boles, M.A.; Kanoğlu, M. An Engineering Approach Thermodynamics; McGraw-Hill Education: New York, NY, USA, 2019. [Google Scholar]
- Climate & Weather Datas. Available online: https://www.timeanddate.com (accessed on 1 October 2021).
- Degree Days Calculated Accurately for Locations Worldwide. Available online: https://www.degreedays.net (accessed on 2 October 2021).

Publisher’s Note: MDPI stays neutral with regard to jurisdictional claims in published maps and institutional affiliations. |
© 2022 by the authors. Licensee MDPI, Basel, Switzerland. This article is an open access article distributed under the terms and conditions of the Creative Commons Attribution (CC BY) license (https://creativecommons.org/licenses/by/4.0/).