


Abstract
Industrial pure copper sheets as a crucial electronic material have currently attracted extensive attention from scholars due to the rapid development of the information technology industry. However, past investigations into the regulation discipline of the microstructure and mechanical properties of pure copper have not paid sufficient attention due to the inevitably low strength induced by the lack of alloying elements. In this study, a typical T2 copper sheet was fabricated by a severe cold-rolling process with a deformation amount of 83% followed by different annealing temperatures ranging from 200 to 500 °C, and the influence of annealing temperature on the evolution of microstructure, mechanical and physical properties and crystallographic orientation (CRO) was investigated systematically. The microstructure features and micro-texture of the studied T2 copper sheet were characterized by optical microscopy (OM) and scanning electron microscopy equipped with electron back-scattered diffraction (EBSD) techniques throughout the entire process from the initial state to the deformed state and annealed state, and the tensile property and electrical conductivity were tested by utilizing a universal testing machine and a digital micro-ohmmeter. Results indicate that the yield strength and tensile strength of the studied T2 copper sheet are both decreased with increasing annealing temperature, accompanied by an increase in electrical conductivity, and the maximum conductivity of up to 98.2% IACS can be reached at the annealing temperature of 500 °C. With the increase in annealing temperature, the degree of recrystallization becomes increasingly sufficient, and the volume fraction of recrystallized grains is increased from ~17.8% to ~35.7% with the annealing temperature increased from 200 to 500 °C. The texture component of the studied T2 copper sheet processed by severe cold rolling with a deformation amount of 83% is characterized by a deformation texture composed of copper texture and S texture, and is then transformed into a texture that predominantly consists of Cube texture under the application of annealing treatment, and the maximum intensity value of Cube texture is enhanced with the increase in annealing temperature.
1. Introduction
T2 copper sheets or strips, as a key material for manufacturing high-precision electronic devices such as printed circuit board (PCB) and flexible printed circuit (FPC) conductive layers, etc., are widely applied in the field of new energy vehicles, aerospace, high-speed railways, lead frames and home appliances due to copper’s excellent electrical conductivity. With the rapid advancement of corresponding application fields, high-quality requirements including not only high strength and electrical and thermal conductivity but also excellent stamping, bending, drawing and other forming capabilities are urgently required for T2 copper sheets or strips [1,2,3,4]. Generally, the tensile strength and electrical conductivity can be regulated through control of the grain size and precipitation of the secondary phase with respect to T2 copper, respectively, while the formability can be controlled by regulating the evolution behavior of the crystallographic orientation feature, including the texture type and corresponding intensity [5,6]. Hence, it is vitally important to fundamentally illuminate and achieve the basic evolution discipline related to the microstructure information, including the grain size, crystallographic information, etc., to realize an excellent match of mechanical properties, electrical conductivity and formability for copper and different copper alloys.
In recent decades, scholars in China and abroad have performed systematic studies on copper alloys from the perspectives of alloying, optimization of the rolling process, and optimization of the heat treatment process [7,8,9,10,11,12,13,14,15,16,17,18,19]. For example, a precipitation-strengthened Cu-0.96Ni-0.22P alloy was designed via thermo-mechanical treatment, and comprehensive properties including a tensile strength of 630 MPa, yield strength of 614 MPa and electrical conductivity of 64% IACS could be achieved through precipitation strengthening of coherent G.P zones [7]. A Cu-12Fe-0.42Si-0.008B copper alloy was fabricated by a combination of twin-roll strip casting and alloying of Si and B elements together with double-stage cold rolling, and a maximum strength of 682.2 MPa was achieved; a highest relative conductivity of 54.9% could be obtained through the strengthening of iron-rich phase particles [8]. A Cu-Ni-Si alloy was fabricated by a two-stage rolling process, and the strength increase was accompanied by unchanged conductivity due to the synergistic effects of dislocation strengthening, precipitation strengthening, and grain boundary strengthening; optimal properties including an electrical conductivity of 49.53% IACS, tensile strength of 773.0 MPa, and yield strength of 723.3 MPa were achieved [9,10]. A Cu-1.01%Ni-0.28%Si-0.14%Co-0.45%Cr alloy was fabricated by alloying together with a multi-stage thermo-mechanical process, and excellent comprehensive properties with a tensile strength of 810 MPa, yield strength of 777 MPa, elongation of 3.4%, and conductivity of 57.5% IACS could be achieved through dispersion strengthening, substructure strengthening and work-hardening [11]. A Cu-Zn-Sn-Ni-Co-Si alloy was developed and fabricated by cold rolling, together with a two-step aging process, and comprehensive properties including a tensile strength of 650 MPa and conductivity of 33% IACS were obtained through synergistic (Ni, Co)2Si precipitation and dislocation reinforcement [12]. Cu-1Cr-0.061Zr alloy strips were fabricated by multi-pass rolling followed by aging treatment, and a maximum tensile strength of 683 MPa, yield strength of 641 MPa, together with electrical conductivity of 68.1% IACS, could be achieved through nano-precipitation strengthening and grain boundary strengthening [13]. In addition, many scholars focused on the investigation related to the variation in the plastic deformation process in regard to the copper alloys [14,15]. Cu-Ni-Si alloy sheets were investigated by a combination of constrained groove pressing and aging treatments, and optimal comprehensive properties including tensile strength of 773.5 MPa, fracture elongation of 15.7%, as well as electrical conductivity of 38.1% IACS could be achieved [14]. A Cu-Cr-Ni-Si-Co alloy was fabricated by equal-channel corner extrusion followed by cold deformation and aging treatment, and good mechanical properties with tensile strength of 546 MPa, yield strength of 475 MPa, elongation of 18.2%, and electrical conductivity of 52.8% could be obtained [15]. Alloying together with cold-drawing followed by a heat treatment process was applied to manufacture copper wire, and well combination of mechanical properties and electrical properties was pursued and investigated [16].
The above-mentioned studies have shown that various kinds of copper alloys with excellent properties could be developed by regulating the different component systems, and the overall predominant strengthening with respect to the reported copper alloys was closely related to the addition of alloying elements. Recently, the requirements for high-quality pure copper, including the typical T2 copper, have been increasing steadily with the rapid advancement of the information technology industry. However, there were relatively few systematic studies related to pure copper due to the inevitably low strength induced by the lack of alloying elements in the past decades. The rare reports on pure copper were predominantly related to the fabrication theory of high-purity copper wires or illumination of microstructure evolution discipline under the addition of trace amounts of rare earth elements [20,21]. Generally, the copper alloys could be strengthened through different strengthening mechanisms such as grain refinement strengthening, solidification strengthening, dislocation strengthening, as well as precipitation strengthening, and optimal properties could be achieved by regulating the microstructural features including grain size, distribution feature of the second-phase precipitation, dislocation density, as well as texture feature, etc. However, the theoretical and experimental laws obtained through the copper alloys were limited in their ability to guide the regulation of pure copper without the additions of substitutional or interstitial atoms. As stated above, the second-phase precipitation strengthening mechanism played a significant role in achieving high enough strength with respect to the various copper alloys [7,8,9,10,11,12,13,14,15]. The precipitation strengthening was almost neglected with respect to pure copper, which indicates the disciplines obtained through copper alloys were ineffective in guiding the control of the microstructure and properties of pure copper. In the field of electronic materials, it was necessary to explore various mechanical and physical properties under the premise of high electrical conductivity to have practical application value. Hence, it could be known that the theoretical research on the control of microstructure and properties was vitally important to the field of electronic materials with respect to pure copper or near-pure copper alloys.
Based on the background stated above, the typical electronic material of T2 copper sheet was adopted as the investigated target in this study. The microstructure evolution behavior, including grain boundary features, crystallographic orientation (CRO), etc., processed by severe cold rolling followed by different annealing treatments were achieved. The variation disciplines of the properties, including the mechanical property and electrical conductivity as a function of annealing temperature, were clarified, and the evolution discipline of texture throughout the deformation stage and annealing treatment process were further illuminated, which is expected to provide a theoretical basis for optimizing processing methods to fully exploit the comprehensive properties with respect to the studied T2 copper.
2. Materials and Methods
2.1. Material and Experimental Process
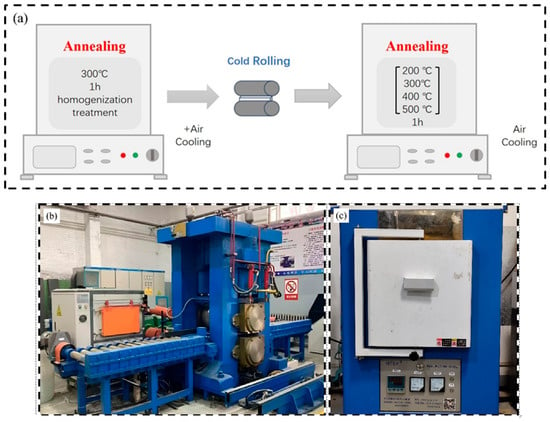
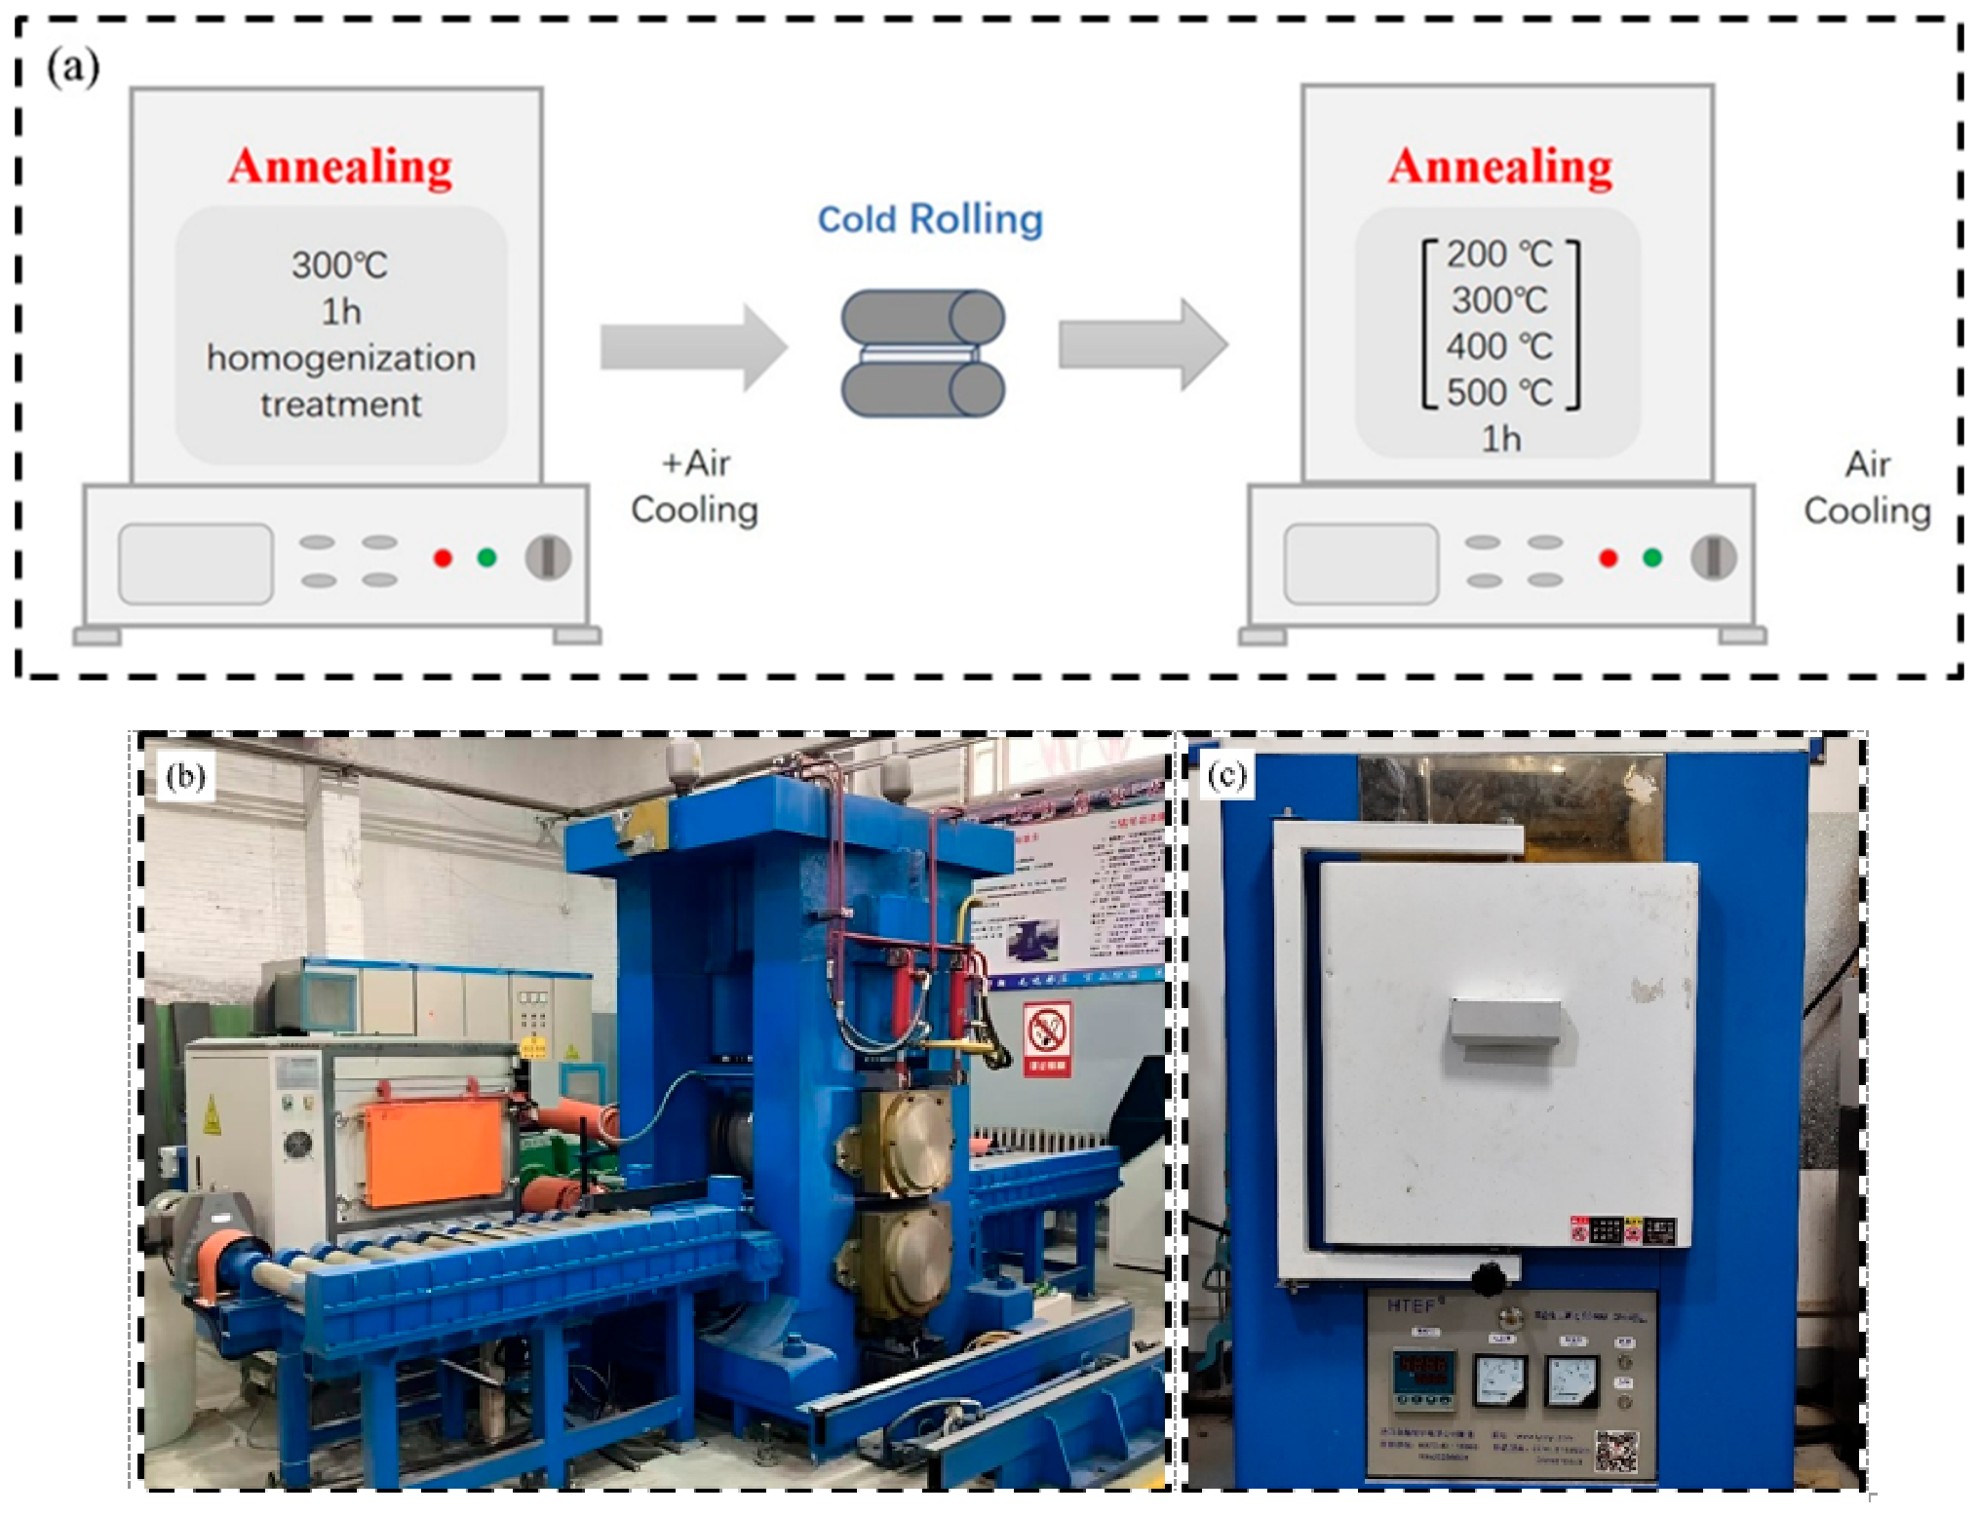
The T2 copper sheet with a thickness of 1.5 mm was regarded as the investigated target in this study, and the concrete chemical composition of the studied copper is depicted in Table 1. To eliminate processing residual stress and obtain a uniform initial microstructure before the rolling experiment, the T2 copper sheet was first heat treated at 300 °C for 60 min, followed by air cooling. Then, the cold-rolling experiments were carried out at ambient temperature. To fully accumulate the deformation storage energy of recrystallization and exert the effect of recrystallization on grain refinement, a severe deformation amount was adopted in this study, and the deformation amount was finally determined to be 83% under the premise of fully utilizing the maximum forming capacity of the experimental equipment. During the experiment, the copper sheet was continuously rolled through 8 passes to achieve the deformation amount of 83% with rolling reduction parameters of 1.5 mm, 1.3 mm, 1.0 mm, 0.8 mm, 0.6 mm, 0.5 mm, 0.4 mm, 0.3 mm, and 0.25 mm. In addition, the industrial lubricants reported in the literature [22] were adopted during cold rolling, and the rolling speed was selected as 0.5 m/s. Subsequently, the cold-rolled sheet was annealed at different temperatures ranging from 200 to 500 °C with an interval of 100 °C for a holding time of 60 min. The heating rate was 10 °C/min, and all specimens were cooled to ambient temperature by air cooling. Cold rolling experiments were performed on a four-roll rolling mill platform self-developed by Taiyuan University of Science and Technology in China, and the diameters of the work roll, support roll and roll body length were confirmed to be 90 mm, 280 mm, and 350 mm, respectively. Annealing treatments were performed by utilizing a Muffle furnace (Model: KBF-1400C-V, Manufacturer: Nanjing Nanda Instruments Co., Ltd., Nanjing, China). Figure 1a shows the schematic diagram of the rolling mill and heat treatment processes, and the photographs of the utilized rolling mill and furnace are depicted in Figure 1b,c.
Table 1.
Chemical composition of the studied T2 copper sheet (mass fraction, %).
Figure 1.
(a) Schematic diagram of cold rolling and heat treatment processes. (b) Photograph of rolling mill. (c) Photograph of furnace for heat treatment.
2.2. Microstructural Characterization
To achieve the microstructure and CRO information of the studied T2 copper processed by different annealing treatment processes, optical microscopy (OM, Model: LEICA DMIRM, Manufacturer: Leica Instrument Company, Wetzlar, Germany) and scanning electron microscope (SEM, Model: ZEISS Gemini, Manufacturer: Carl Zeiss AG from Oberkochen, Germany) equipped with electron back-scattered diffraction technique (EBSD, Model: Symmetry, Manufacturer: Oxford Company, Oxford, UK) were applied for investigation. After mechanical grinding and polishing, the OM specimens were prepared and etched by utilizing a solution of 20 mL H2O, 4 mL HCl and 1 g FeCl3, followed by cleaning and drying with ethanol. The EBSD specimens were mechanically ground and polished at ambient temperature, followed by electro-polishing in a solution of 50 mL H3PO4, 50 mL C2H5OH and 100 mL H2O at a voltage of 5 V. The magnification and step size were determined to be 300× and 0.4 μm, respectively, with the identification rate above 90% with respect to the overall EBSD detections. The EBSD data were post-processed using Channel 5 software (2010), and a misorientation of 15° was adopted to distinguish the high-angle misorientation grain boundary (HAGB) and low-angle misorientation grain boundary (LAGB). The microstructure and CRO of the studied T2 copper corresponding to the initial state, cold-rolled state and annealed state were then characterized and systematically analyzed.
2.3. Mechanical and Physical Property Testing
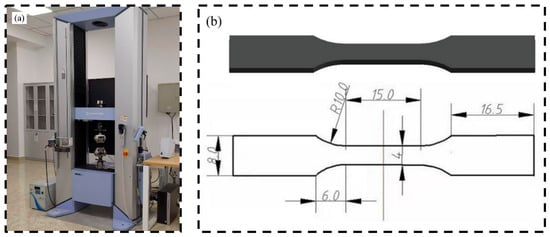
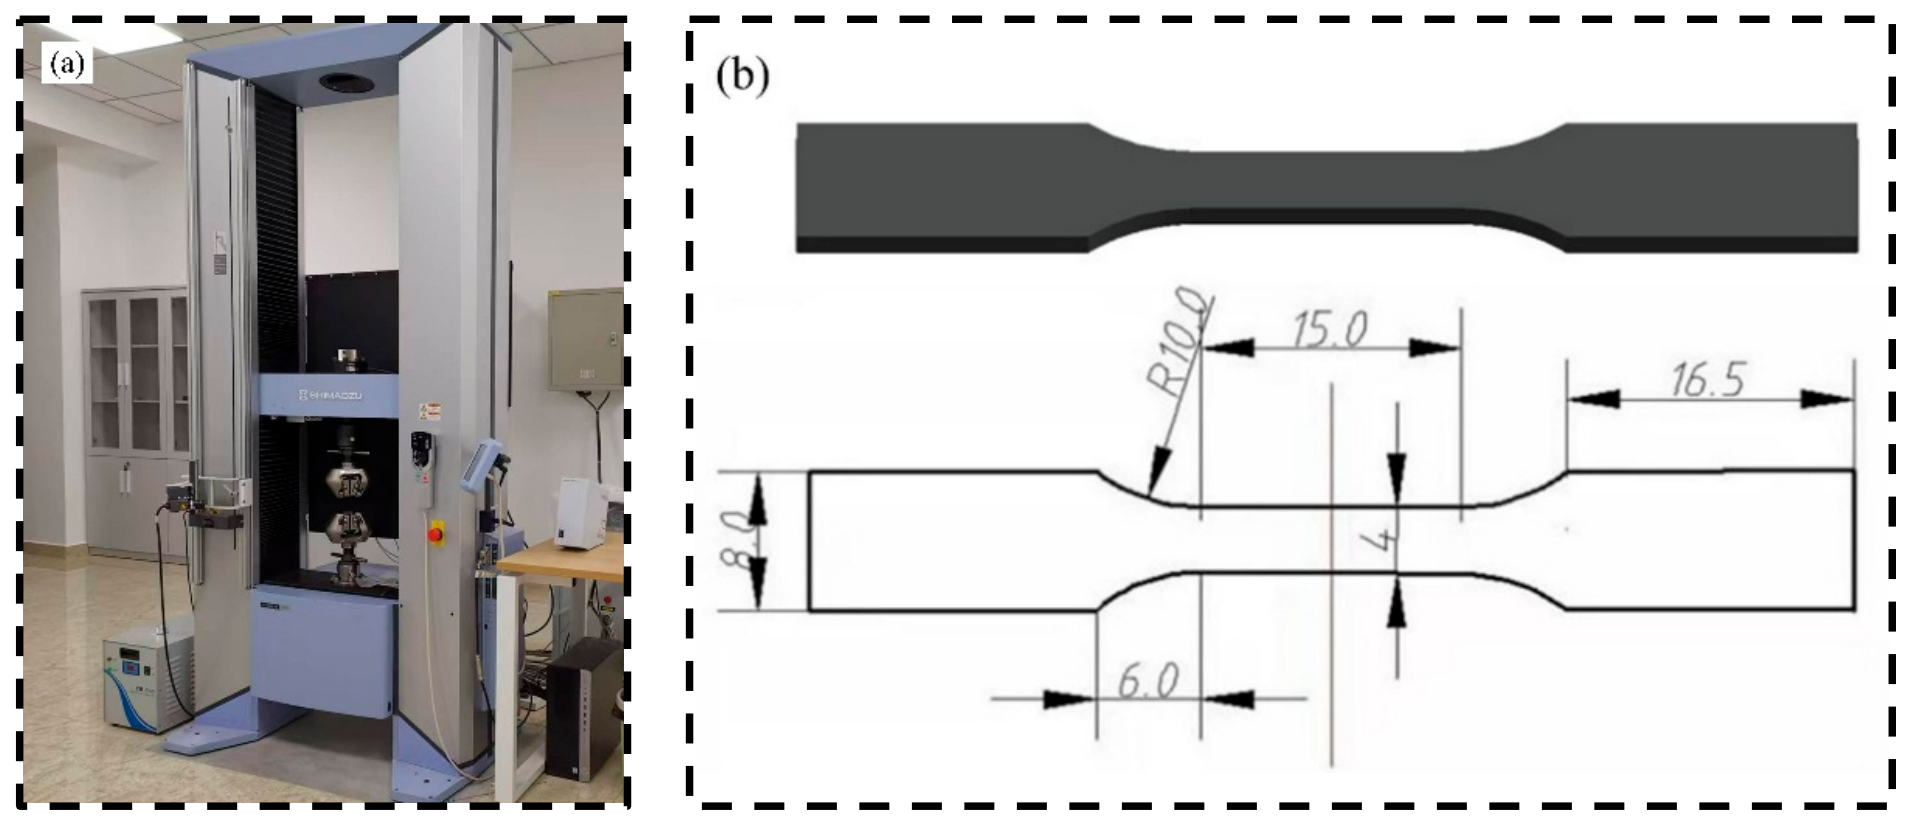
Tensile properties and electrical conductivity of the studied T2 copper corresponding to different heat treatment processes were tested in this study. The sample preparation and tensile test were performed in accordance with the specification of China “Copper and copper alloy materials–Tensile testing at room temperature (GB/T 34505-2017)” [23]. Since the dimension of the tested copper was insufficient to fabricate the standard proportion sample, the small-sized proportion sample was adopted in accordance with the specification. During tensile tests, three tensile samples were cut from each sheet processed by different processes for tensile property measurement, and the average value was taken as the final strength value. The tensile properties of the specimens were tested at ambient temperature by using a universal testing machine (Model: AG-X plus-100KN, Manufacturer: SHIMADZU Company, Kyoto, Japan) with the tensile speed set at 1 mm/min, and the photograph of the utilized universal testing machine and dimensions of the tensile specimen are shown in Figure 2a,b. Three specimens with dimensions of 1.5 mm × 2 mm × 40 mm were cut from each sheet processed by different processes for resistance measurement, and the average value was taken as the final resistance value. The resistance of the specimens was measured using a digital micro-ohmmeter (Model: ZY9987, Manufacturer: Zhengyang Instrument Factory, Shanghai, China), which had four ranges of 20 m Ω, 200 m Ω, 2 Ω, and 20 Ω with a high resolution of 1 μΩ. The oxide layer on the surface of the specimens used for resistance detection was polished before measurement, and the measurement was performed by utilizing the four-probe method of contact.
Figure 2.
(a) Photograph of the universal testing machine. (b) Dimensions of the tensile specimen.
3. Results
3.1. Microstructure Feature Processed by Severe Deformation and Different Annealing Treatments
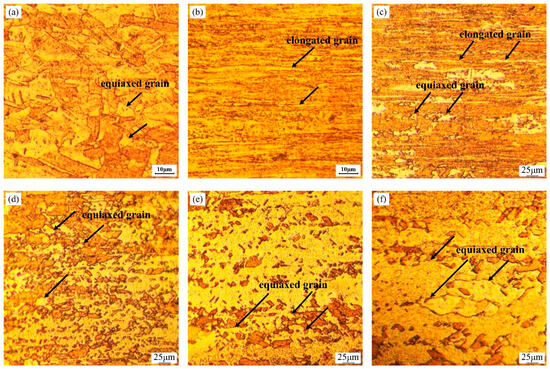
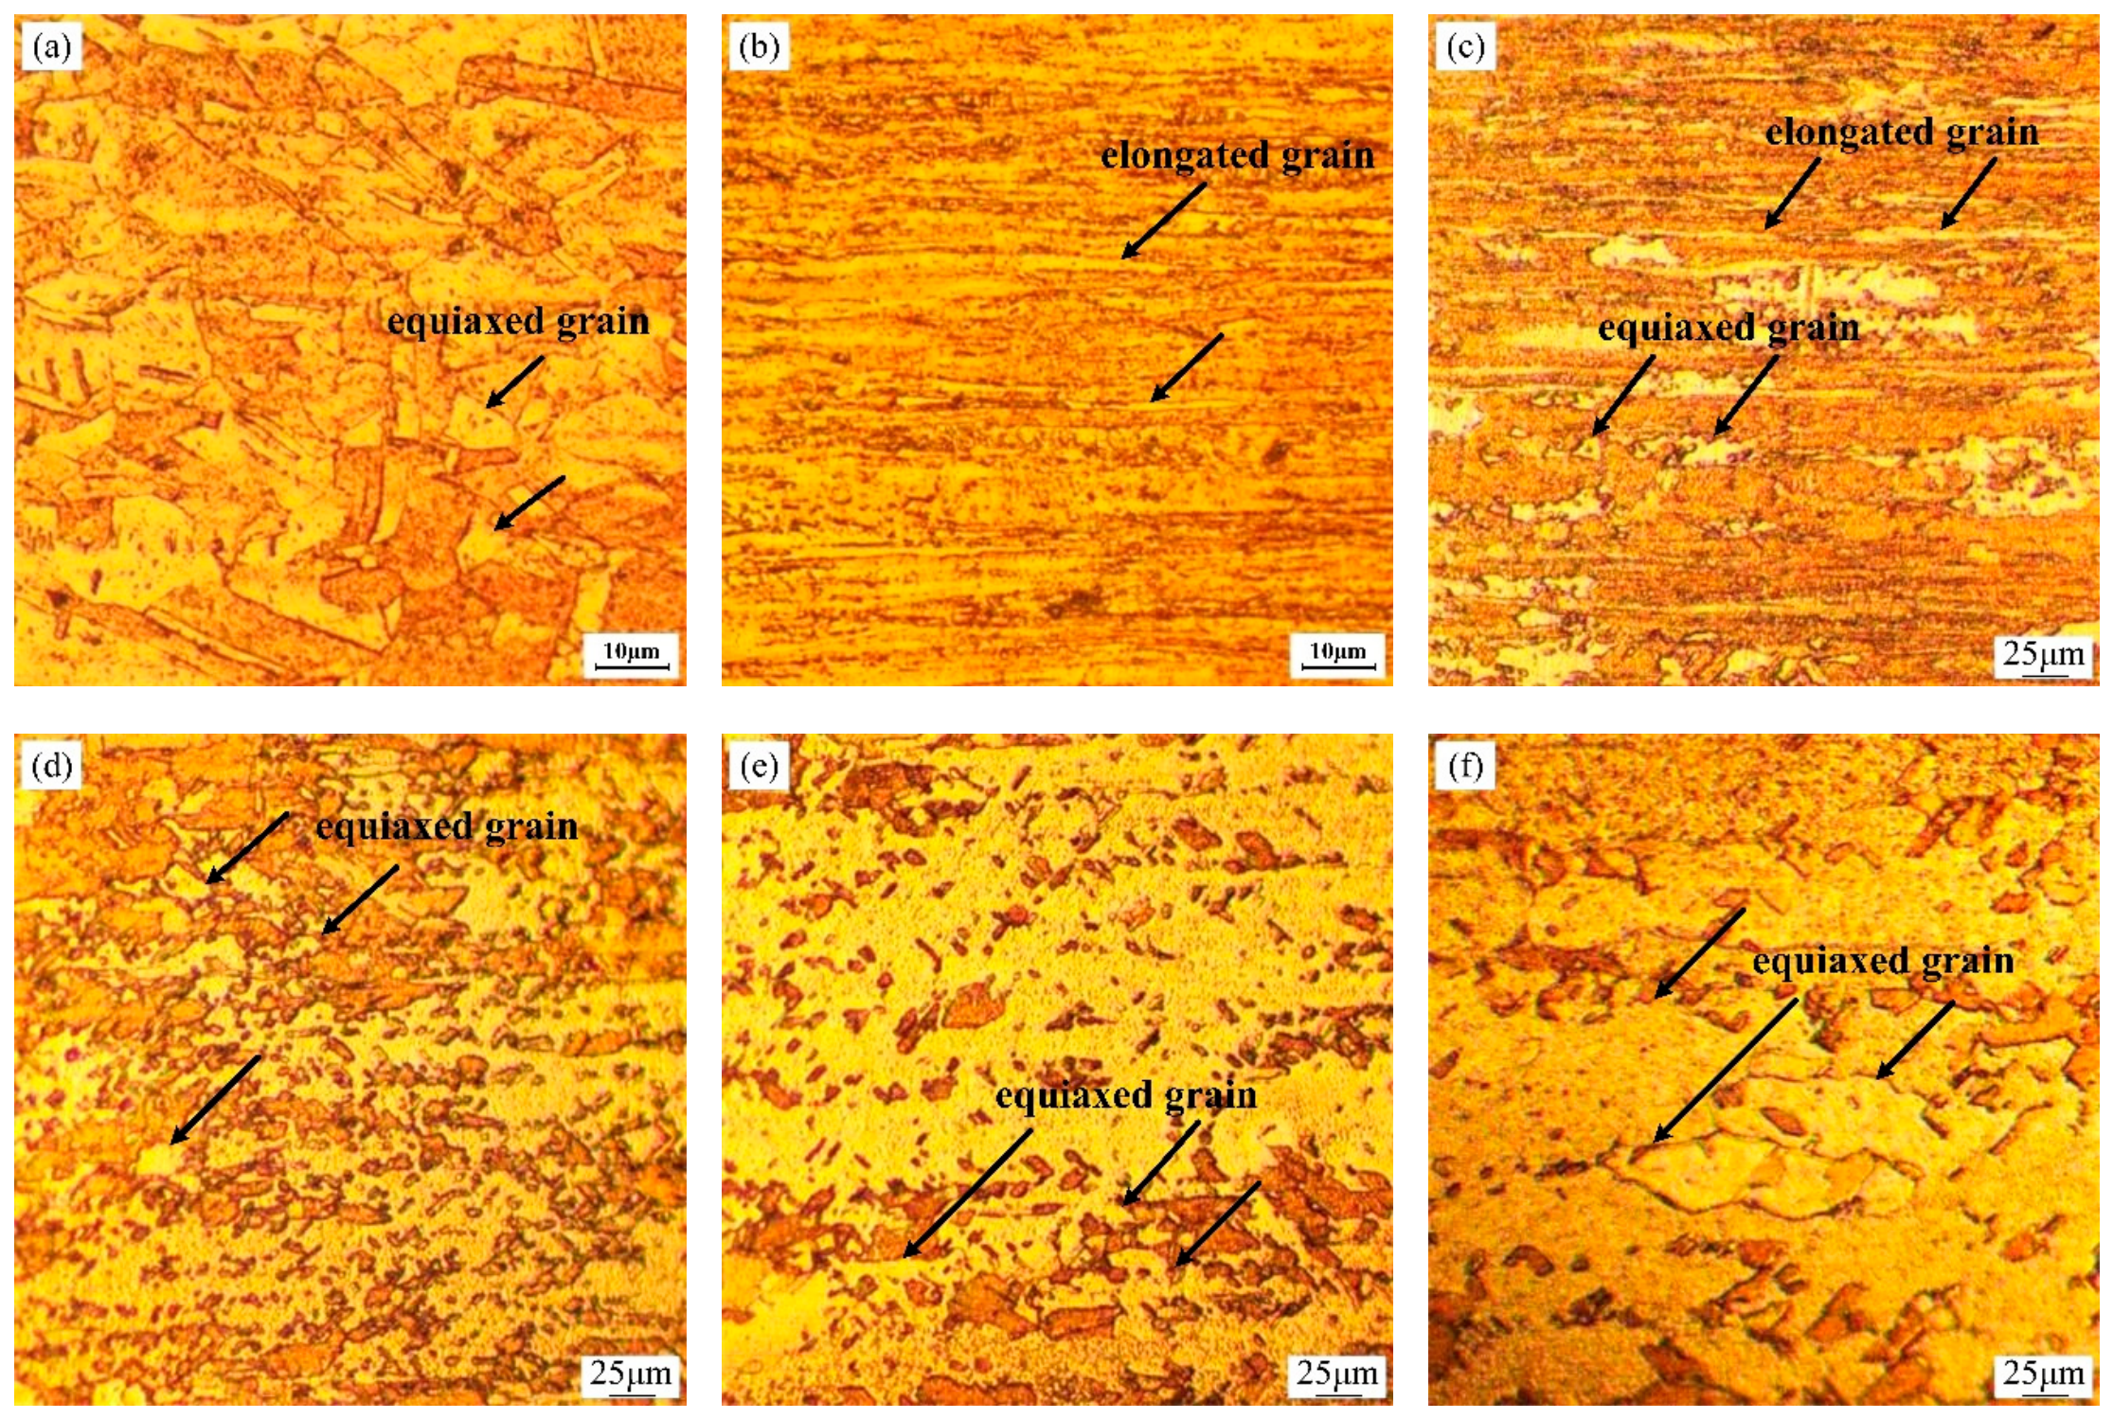
The metallographic microstructures of the studied T2 copper corresponding to different deformation and annealing processes are depicted in Figure 3. From the characterization results, it could be found that the initial microstructure of the studied T2 copper processed by annealing treatment before the cold rolling experiment is characterized by equiaxed grains with clear grain boundaries, and the homogeneity of the microstructure is relatively poor, as shown in Figure 3a. After cold rolling with a deformation amount of 83% at ambient temperature, the microstructure is elongated drastically along the rolling direction, and a fibrous microstructure is generated and involved in the microstructure of the studied T2 copper sheet, as shown in Figure 3b. Figure 3c–f show the microstructure of the studied T2 copper undergoing deformation treatment with a severe deformation amount of 83%, together with annealing treatment at temperatures ranging from 200 to 500 °C with an interval of 100 °C for 60 min, and it could be observed that the degree of recrystallization is increased significantly with the increase in annealing temperature. For the T2 copper processed at an annealing temperature of 200 °C, the microstructure is characterized by a complex microstructure consisting of elongated grains and a small fraction of equiaxed grains, indicating that recrystallization occurred at a local position, as shown in Figure 3c. When the annealing temperature is increased to 300 °C, a large volume fraction of equiaxed grains is distributed in the microstructure, accompanied by the existence of a small fraction of elongated grains, implying the degree of recrystallization is becoming higher compared to the 200 °C condition, shown in Figure 3d. When the annealing temperature is increased above 400 °C, the recrystallization is completed with respect to the studied T2 copper sheet, and the equiaxed grains are predominant in the microstructure, shown in Figure 3e,f. In addition, it could also be observed that the dimension of grains appears to have become coarser compared to the low-temperature annealing condition as the annealing temperature increased from 400 °C to 500 °C, indicating the effective temperature for recrystallization is distributed in the annealing temperature range from 400 to 500 °C with respect to the studied T2 copper sheet.
Figure 3.
Metallographic microstructures of studied T2 copper corresponding to different stages: (a) initial microstructure; (b) processed by deformation amount of 83%; (c) deformation amount of 83% + annealing at 200 °C for 60 min; (d) deformation amount of 83% + annealing at 300 °C for 60 min; (e) deformation amount of 83% + annealing at 400 °C for 60 min; (f) deformation amount of 83% + annealing at 500 °C for 60 min.
3.2. EBSD Analysis Processed by Large Deformation and Different Annealing Treatments
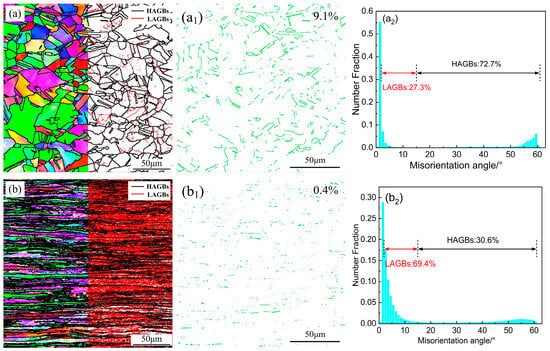
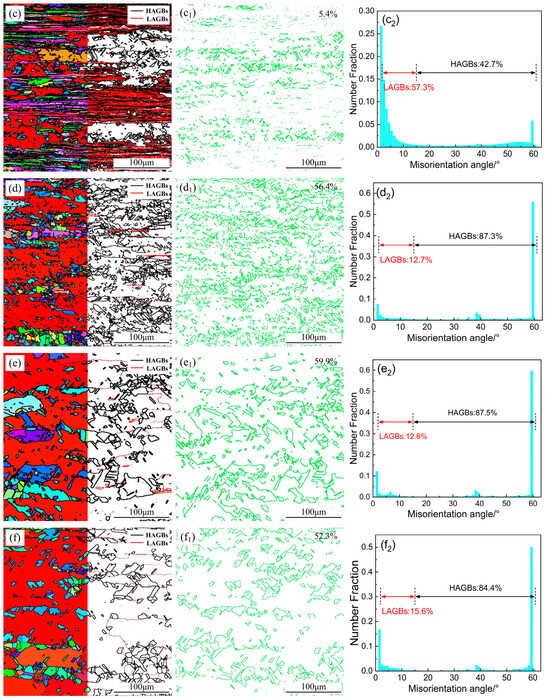
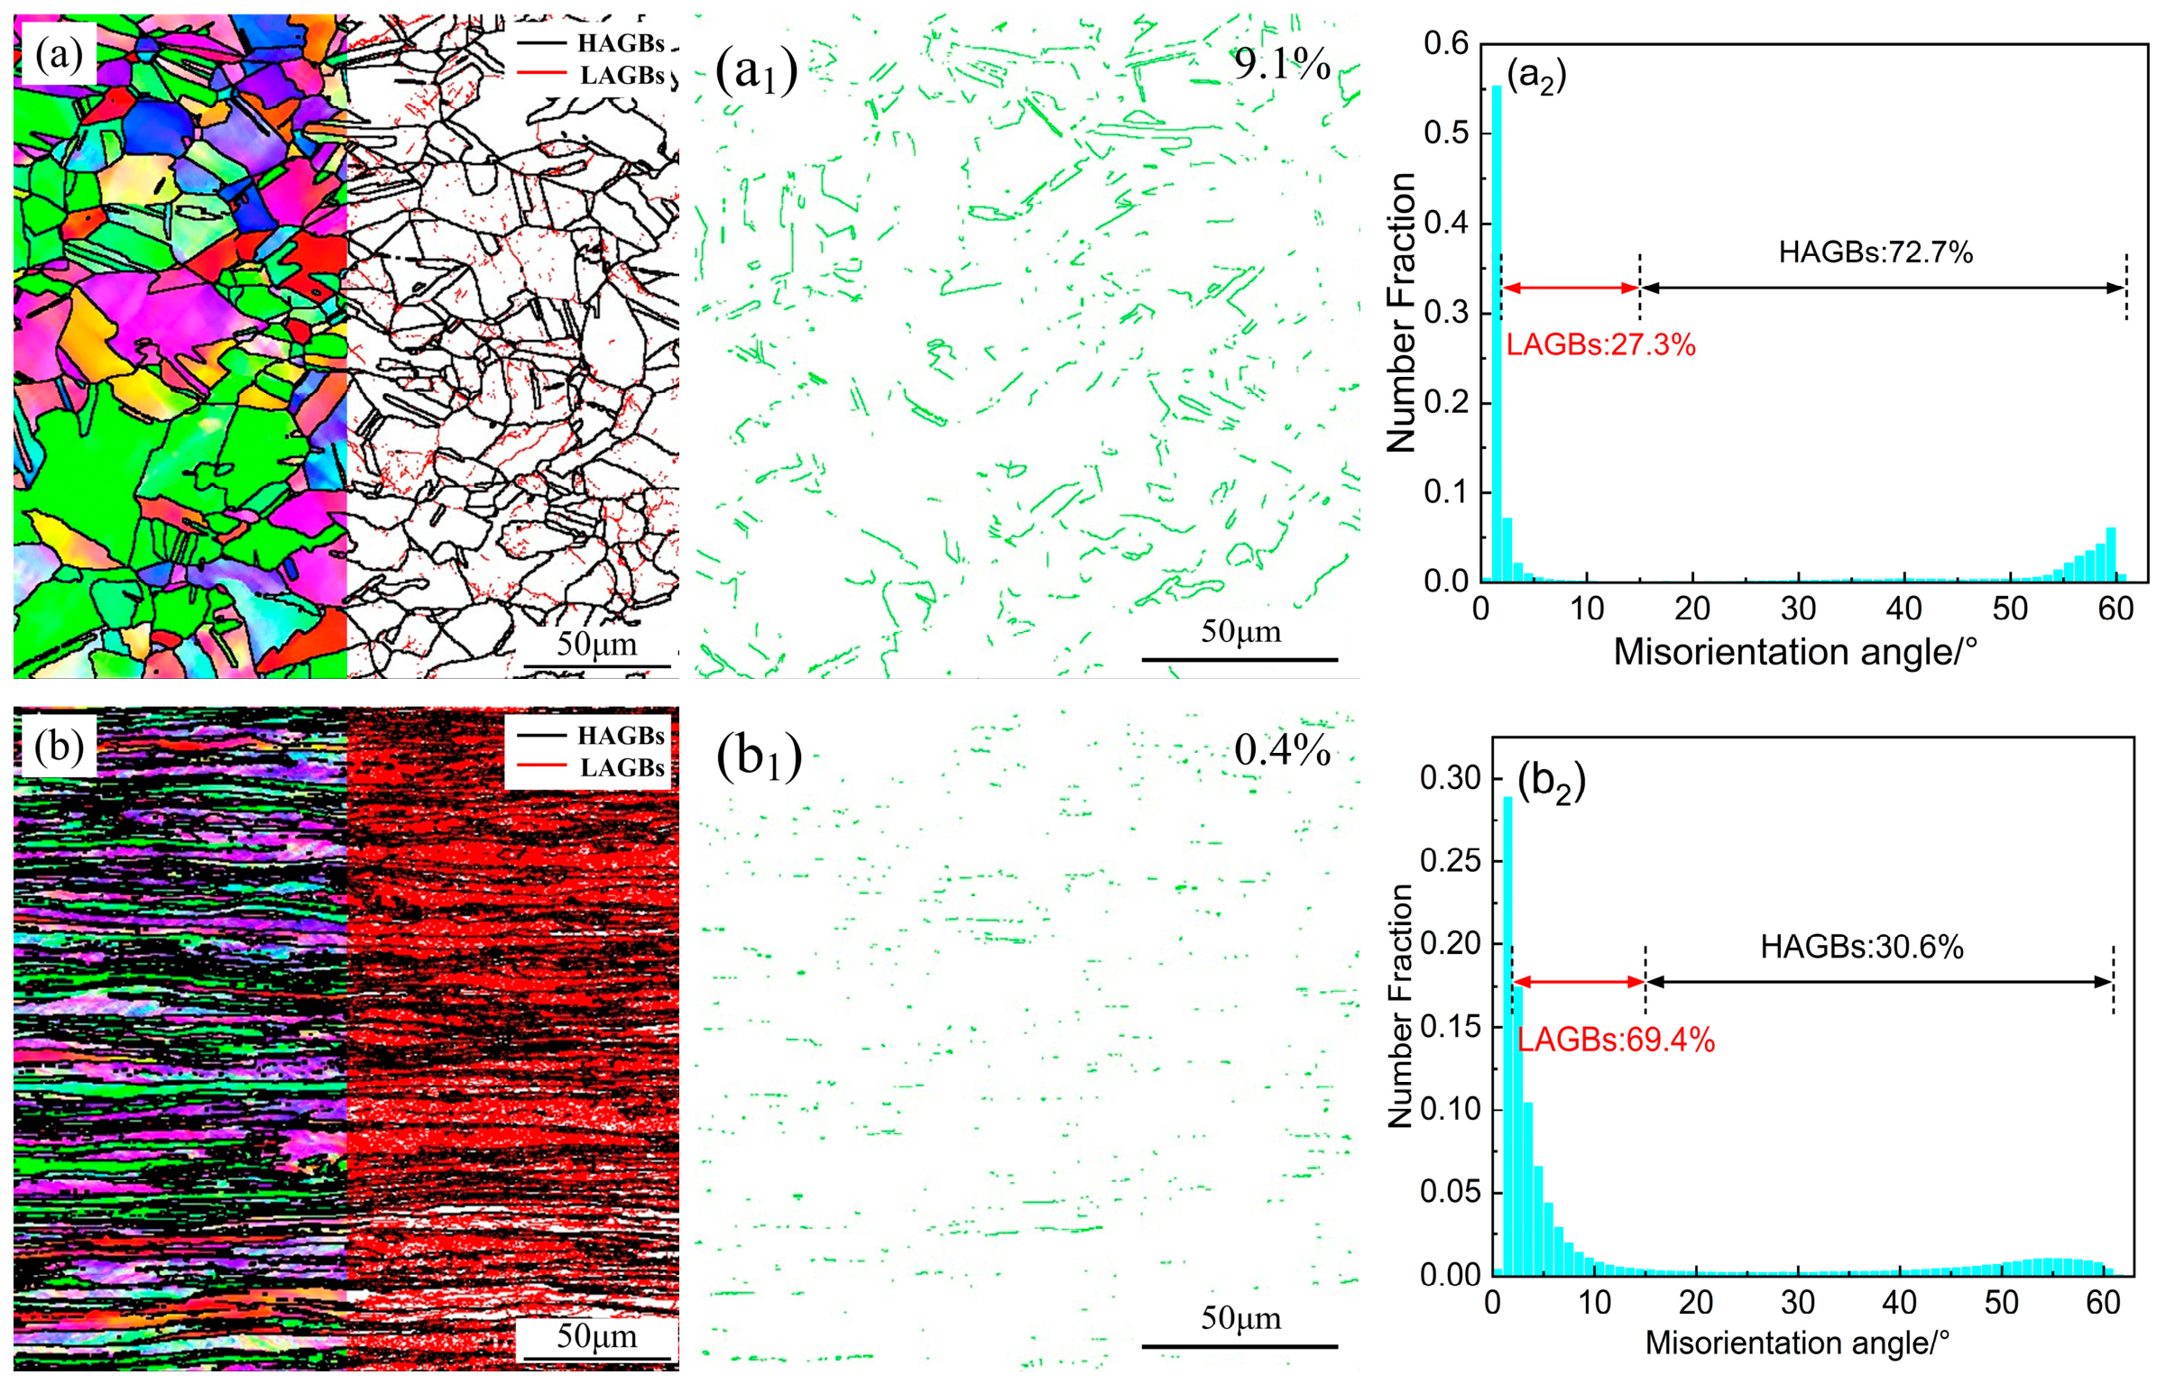
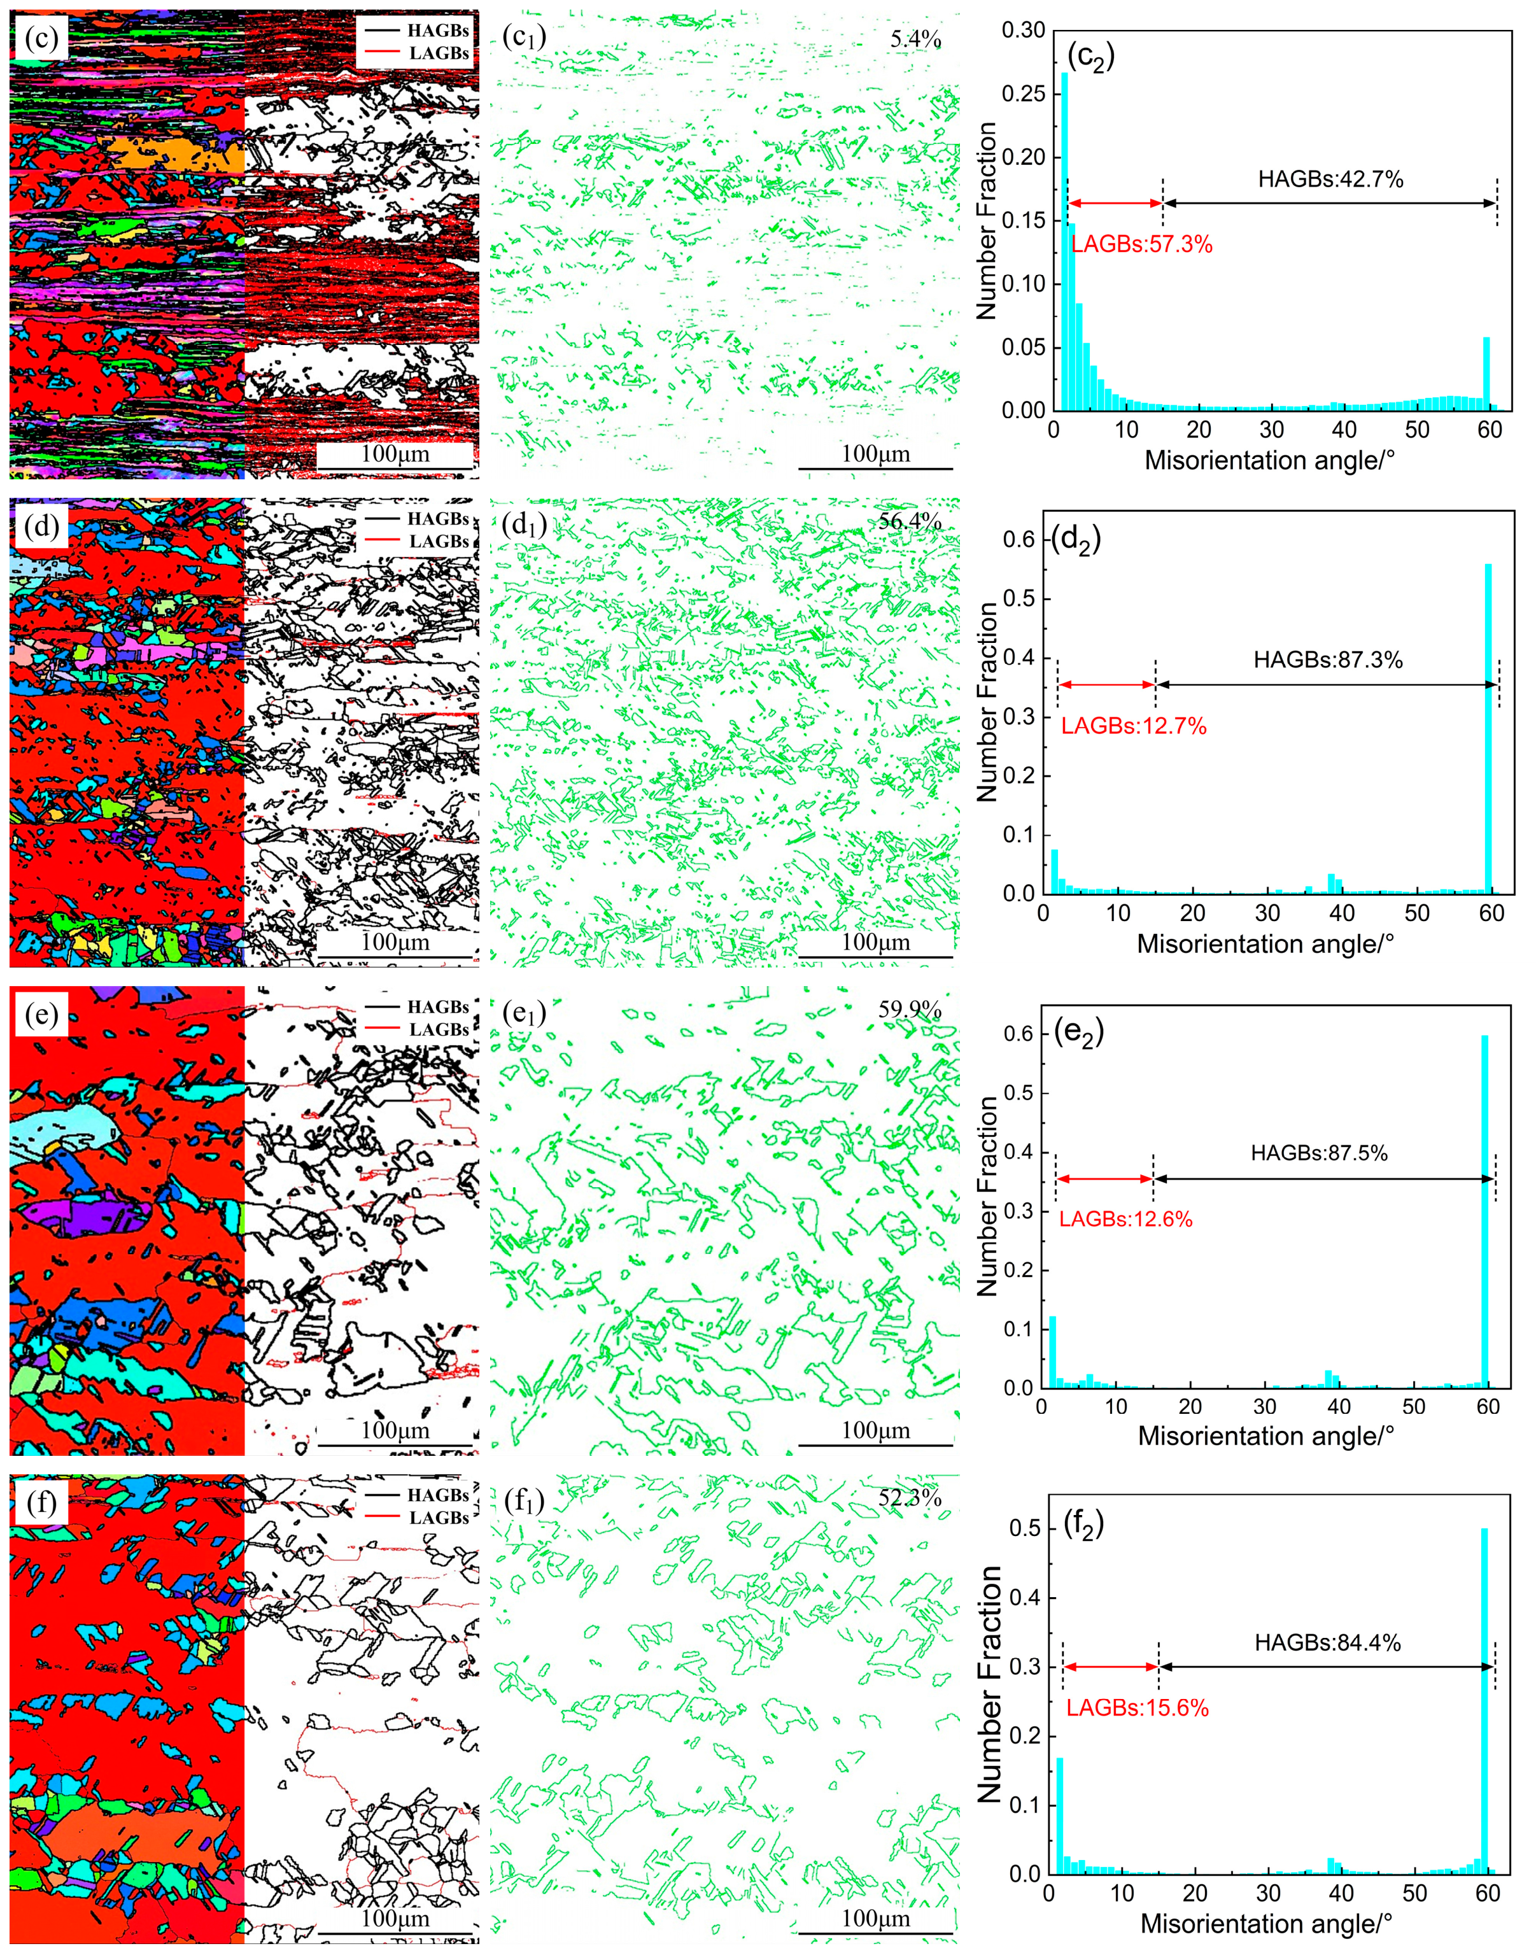
Figure 4 shows the CRO information of the studied T2 copper sheet processed by the same deformation amount and different annealing temperatures, including the IPF, grain boundary map, twin boundary map, as well as the distribution of grain boundaries. For the initial microstructure of the studied T2 copper sheet before severe cold rolling, the microstructure is characterized by equiaxed grains as shown in Figure 4a, and the relative volume fraction of HAGB is confirmed to be ~72.7%, which is obviously larger compared to the LAGB with relative volume fraction of ~27.3%, indicating the HAGBs are predominant with respect to the T2 copper sheet at this state, shown in Figure 4(a2). Meanwhile, a small amount of twins is prone to generate during the homogenization treatment process at 300 °C before cold rolling due to the feature of low stacking fault energy with respect to the T2 copper [24,25], and the volume fraction of twin boundary is estimated to be ~9.1%, shown in Figure 4(a1). For the microstructure processed by severe cold rolling with deformation amount of 83%, the microstructure is characterized by fibrous structure along the rolling direction as shown in Figure 4b, and the relative volume fraction of LAGB is significantly increased to ~69.4% from the initial microstructure state with relative volume fraction of ~27.3%, shown in Figure 4(b2), indicating a large amount of dislocation density is introduced into the microstructure through severe deformation. In addition, the severe deformation is prone to destroy the twin structure, and the volume fraction of twin boundary is decreased to ~0.4% from the initial state with volume fraction of ~9.1%, as shown in Figure 4(b1). For the microstructure processed by severe cold rolling together with annealing treatment at a temperature of 200 °C, the trace of recrystallization is obvious with respect to the studied T2 copper sheet, and some equiaxed microstructure with low-dislocation density is generated and involved in the microstructure as shown in Figure 4c. The twin boundary is also formed along with the formation of recrystallized grains, and the volume fraction of twin boundary with respect to the T2 copper sheet processed by annealing treatment at temperature of 200 °C is determined to be ~5.4%, which is obviously larger compared to the deformed state with volume fraction of ~0.4%, shown in Figure 4(c1), indicating the recrystallization during the annealing process is conducive to the formation of twins. In addition, the volume fraction of LAGBs is also decreased, accompanied by an increase in volume fractions of HAGBs with the application of annealing treatment with respect to the studied T2 copper sheet, shown in Figure 4(c2). When the annealing temperature is increased to 300 °C, the volume fraction of equiaxed grains is obviously increased, accompanied by obvious increases in volume fractions of twin boundaries and HAGBs, indicating the recrystallization degree has been significantly promoted, shown in Figure 4d,(d2). When the annealing temperature is increased above 400 °C, the process of replacing and reorganizing the elongated fibrous microstructure for new grains has been fully completed, and the variations in volume fraction of twin boundaries and the other grain boundaries are not obvious with the increase in annealing temperature, shown in Figure 4e,f. The achieved investigation results associated with the CRO are consistent with the metallographic characterization results in describing the microstructure evolution behavior with respect to the studied T2 copper sheet throughout different deformation and heat treatment processes.
Figure 4.
IPF (a–f), grain boundary maps (a1–f1), twin boundary maps and distribution of grain boundary corresponding to different states (a2–f2): (a) initial state; (b) deformation amount of 83%; (c) deformation amount of 83%+ annealing at 200 °C for 60 min; (d) deformation amount of 83%+ annealing at 300 °C for 60 min; (e) deformation amount of 83%+ annealing at 400 °C for 60 min; (f) deformation amount of 83%+ annealing at 500 °C for 60 min.
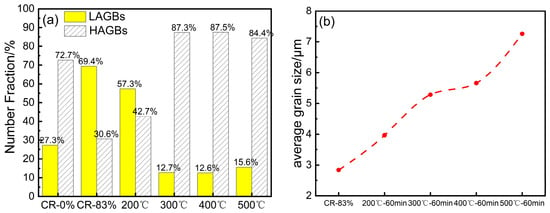
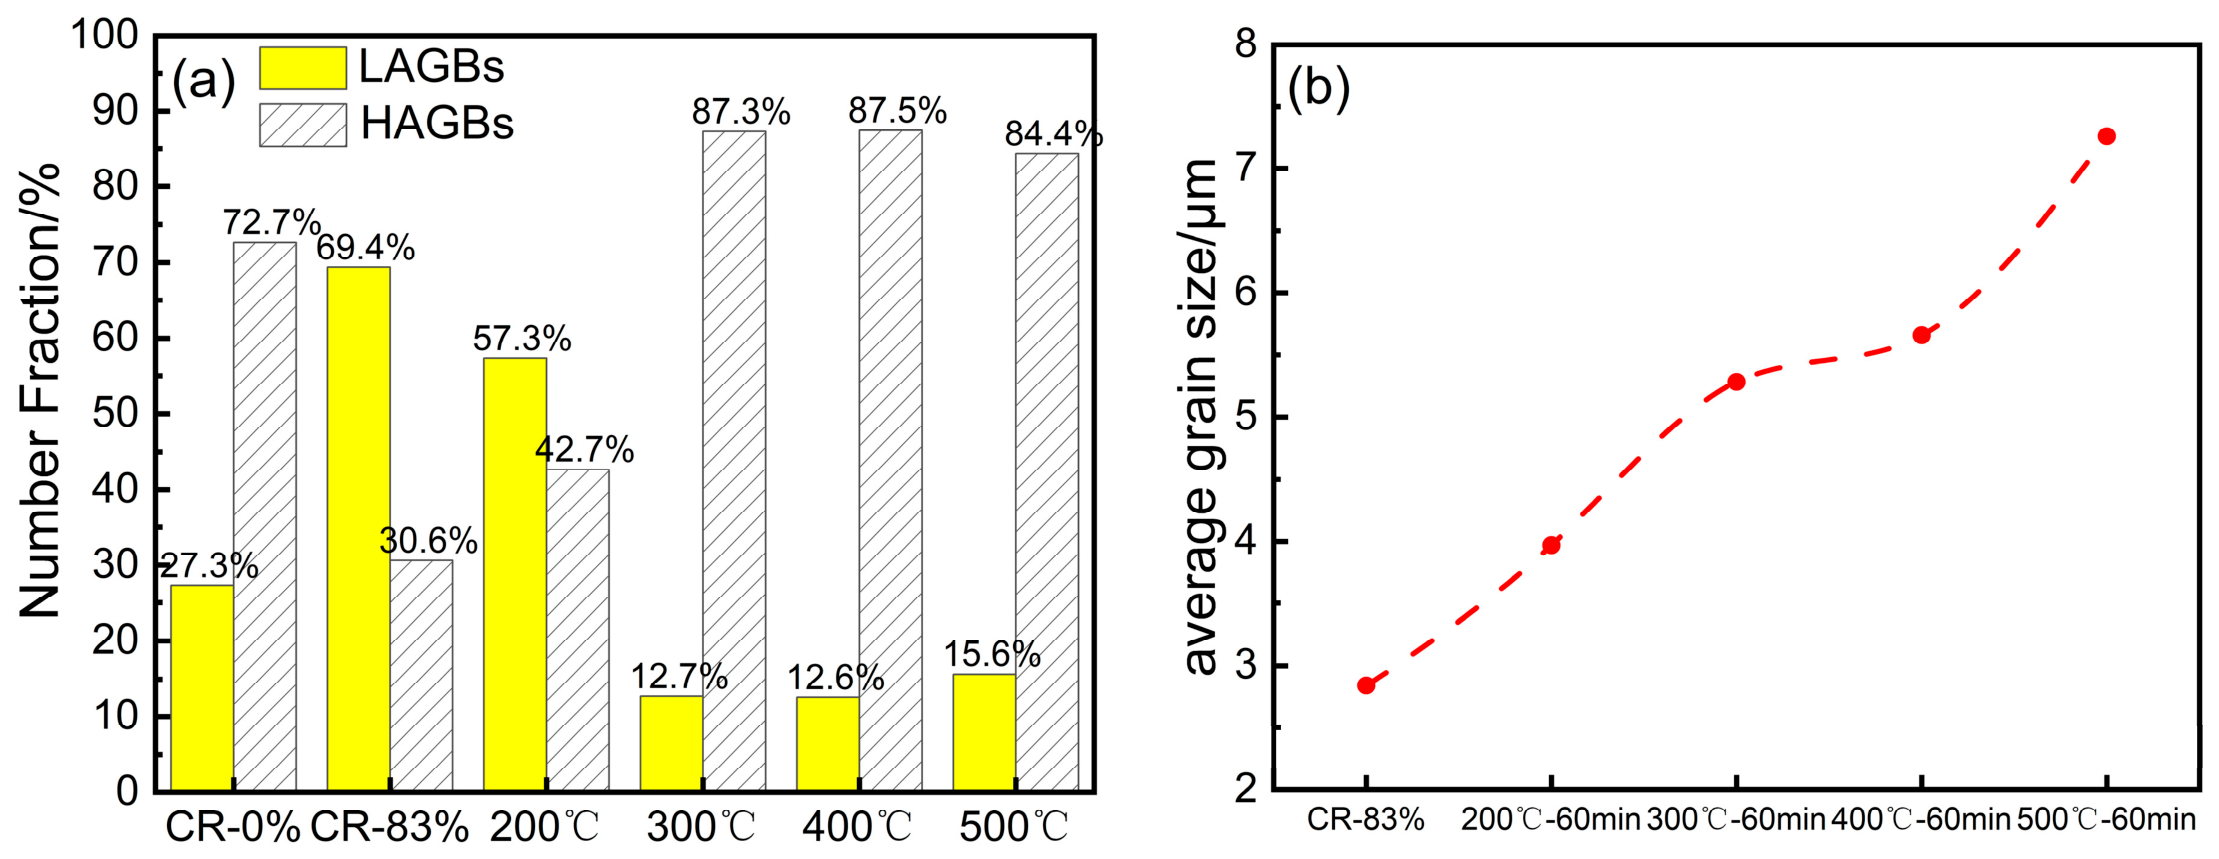
To further quantitatively describe the variation discipline of microstructure information corresponding to different deformation and annealing treatment processes, the comparison of volume fractions of LAGBs and HAGBs with respect to the studied T2 copper sheet is performed as shown in Figure 5a. From the statistics, it could be found that the volume fraction of LAGBs has undergone a process of first increasing and then decreasing corresponding to the whole deformation and annealing process, and the volume fraction of LAGBs could be increased to ~69.4% under the effect of severe cold deformation with a deformation amount of 83%. Furthermore, the volume fraction of LAGBs is then obviously decreased with the application of the annealing process, and the volume fraction of LAGBs could be decreased to ~15.6% induced by recrystallization with the annealing temperature increased to 500 °C. The variation behavior of volume fraction with regard to LAGBs is closely related to the plastic deformation mechanism and recrystallization mechanism. When cold rolling is performed on the copper sheet in the initial state, the dislocation density is significantly increased through the mechanism of dislocation multiplication, which contributes to the sharp increase in LAGBs predominantly consisting of dislocations. When the annealing treatment is performed subsequently, both the volume fractions of LAGBs and HAGBs are decreased induced by recrystallization, and the decreasing rate of LAGBs is obviously higher compared to the HAGBs, which leads to the final volume fraction of LAGBs being sharply decreased compared to the cold-rolling state. To explore the variation discipline of average grain size with respect to the studied T2 copper sheet, the average grain size corresponding to different states is statistically calculated based on the EBSD detection data, and the variation in average grain size as a function of different deformation and annealing treatment processes is depicted in Figure 5b. For the variation discipline of average grain size, it could be easily obtained that the average grain size of the studied T2 copper sheet is obviously increased with the increase in annealing temperature, and the average grain size is increased from the deformed state with an average value of ~2.84 μm to the annealed state with an average of 7.26 μm, as shown in Figure 5b.
Figure 5.
(a) Comparison of volume fractions of LAGBs and HAGBs, and (b) distribution of average grain size corresponding to different deformation and annealing states.
3.3. Mechanical and Physical Properties Processed by Different Annealing Treatments
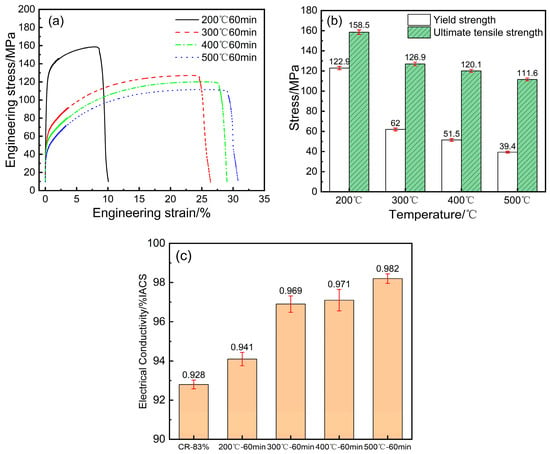
Figure 6 shows the mechanical and physical properties of the studied T2 copper sheet processed by severe cold rolling with a deformation amount of 83% followed by different annealing temperatures. It could be obtained that the engineering stress–strain curves of the studied T2 copper sheet are characterized by house-type curves, indicating many movable dislocations play a significant role during the plastic deformation process, shown in Figure 6a. The statistics of tensile properties for the studied T2 copper sheet, including the yield strength and tensile strength, are depicted in Figure 6b. In accordance with the statistics, it could be confirmed that the yield strength and tensile strength of the T2 copper sheet are both decreased with the increasing of annealing temperature, and the yield strength is decreased from ~122.9 MPa to ~39.4 MPa as the annealing temperature increased from 200 °C to 500 °C. The tensile strength is decreased from ~158.5 MPa to ~111.6 MPa as the annealing temperature increased from 200 °C to 500 °C. Figure 6c shows the distribution of electrical conductivity of the studied T2 copper sheet processed by different deformation and annealing treatment processes, and it could be found that the studied T2 copper sheet corresponding to the deformed state with deformation amount of 83% possesses the lowest electrical conductivity compared to the other copper sheet processed by annealing treatment, and the lowest electrical conductivity is determined to be ~92.8% IACS. With the application of annealing treatment, the electrical conductivity is slightly increased, and the electrical conductivity is increased from ~92.8% IACS to ~94.1% IACS with the adoption of annealing treatment at 200 °C for 60 min. When the annealing temperature is increased to 300 °C, the electrical conductivity is increased from ~94.1% IACS to ~97.1% IACS, and the electrical conductivity is increased to a maximum of ~98.2% IACS under the annealing treatment of 500 °C. According to Matheson’s law [26], the increase in lattice defects and impurity atoms can hinder the free movement of electrons, leading to an increase in resistivity. In this study, the highly pure composition design for the studied T2 copper indicates that the influence of impurity atoms on resistivity could be ignored, and lattice defects induced by dislocations play a significant role in determining the electrical conductivity. The decrease in electrical conductivity after cold rolling of T2 copper is induced by the generation of defects and an increase in dislocations during the rolling deformation, which could hinder the free movement of electrons and, finally, contribute to relatively high resistance. When the annealing treatment is applied to the studied T2 copper, the dislocation density is obviously decreased, induced by recrystallization, which could reduce the resistance to the movement of electrons and, finally, contribute to an increase in electrical conductivity.
Figure 6.
Mechanical and physical properties of studied T2 copper sheet. (a) Typical engineering stress–strain curves. (b) Distribution of tensile strength and yield strength. (c) Distribution of electrical conductivity.
The fundamental difference in the evolution of microstructure and properties between the studied T2 copper sheet and the other copper alloys lies in alloying. For the copper alloys, the second-phase particles caused by alloying elements will hinder the movement of dislocations and the proliferation of dislocations during the plastic deformation process, which is reflected in the deformation behavior as a difference in processing hardening. The phenomenon that the processing hardening ability of copper alloys is significantly higher compared to the T2 copper sheet could be verified by comparing the engineering stress–strain curves obtained in the present study, as shown in Figure 6a, with those from other previously reported studies [8,9]. However, the T2 copper sheet exhibits a relatively weak processing hardening ability due to the absence of other alloying elements or the presence of very few additional elements. It could only cause the proliferation of dislocations through dislocation entanglement. During the recrystallization stage, the presence of second-phase particles has little effect on the nucleation behavior of recrystallization with respect to various kinds of copper alloys, but it plays a role in pinning the grain boundaries and hindering grain growth after recrystallization, thereby achieving grain refinement and an improvement in mechanical properties.
4. Discussion
4.1. Influence of Annealing Temperature on the Recrystallization Behavior of Studied T2 Copper Sheet
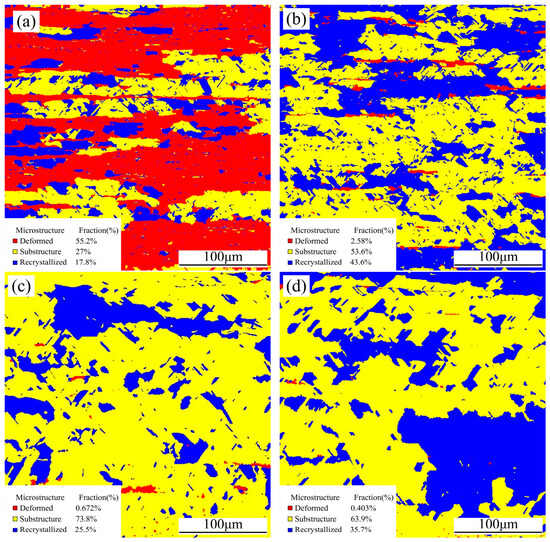
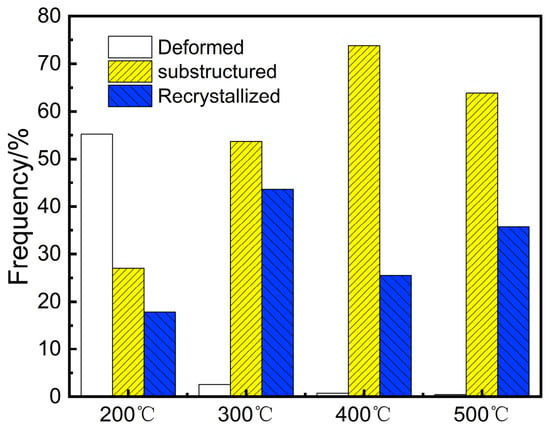
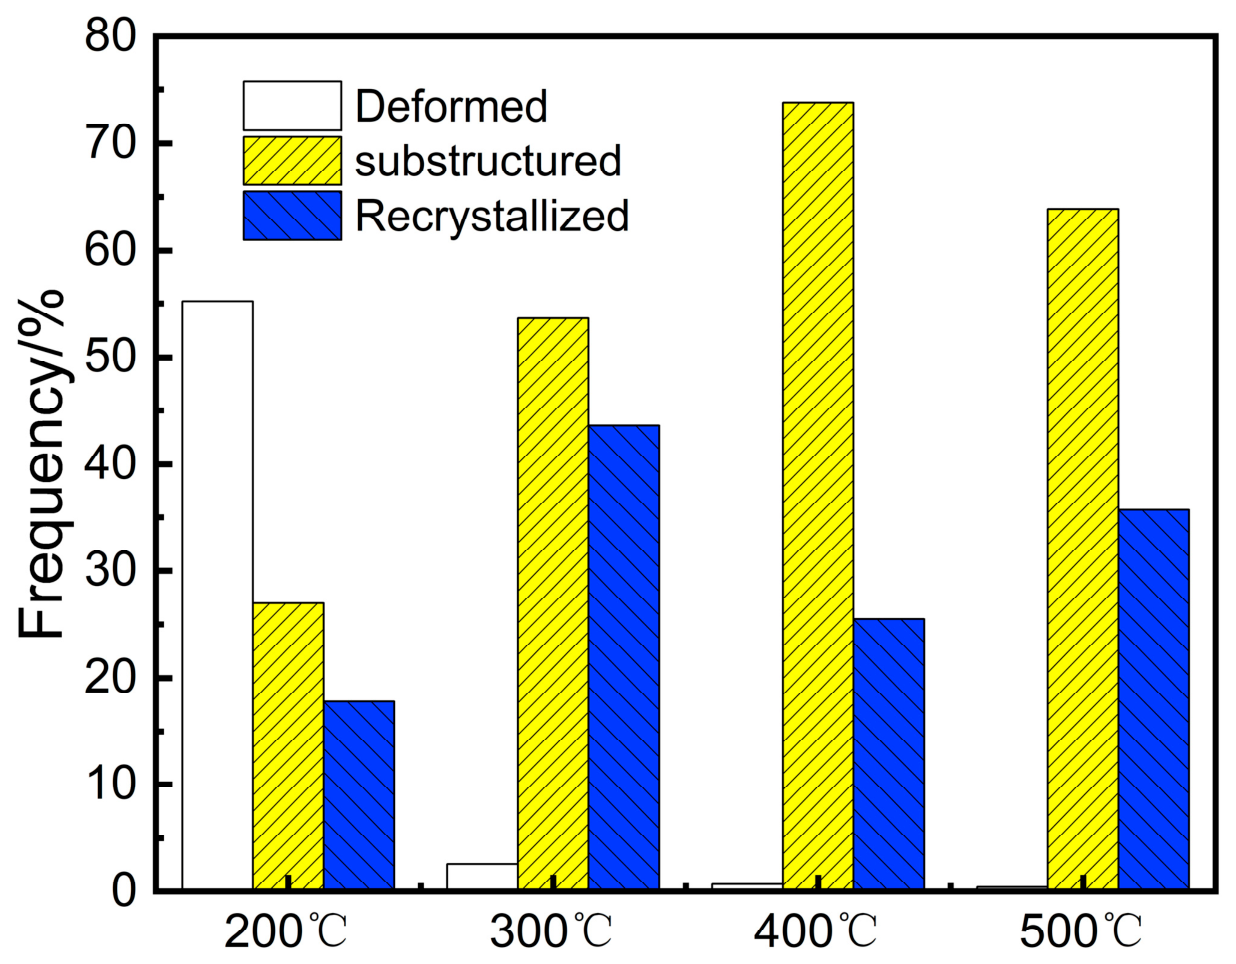
Figure 7 shows the grain state diagrams of the studied T2 copper sheet processed by different annealing temperatures ranging from 200 to 500 °C with an interval of 100 °C. The areas of red, yellow and blue represent the deformed state of the microstructure, the substructure, as well as the recrystallized microstructure, respectively. From the grain state diagram, it could be observed that the fraction of red area is dominant in the microstructure processed at an annealing temperature of 200 °C, while the fraction of blue area is relatively low, indicating the microstructure of the studied T2 copper sheet is in a hardened state, and the degree of recrystallization is relatively low, as shown in Figure 7a. For the microstructure processed at an annealing temperature of 300 °C, the volume fraction of the red area is obviously decreased compared to the 200 °C condition, and the volume fractions of the yellow area and blue area are increased, implying the recovery and recrystallization mechanisms are sufficiently promoted, as shown in Figure 7b. Similarly, the volume fractions of the yellow area together with the blue area are further increased with annealing temperature increased to temperatures above 400 °C, and a large area of recrystallized grains could be observed in the microstructure with respect to the studied T2 copper sheet processed at an annealing temperature of 500 °C, as shown in Figure 7c,d. To quantitatively investigate the variation discipline of recrystallization degree, the statistics including the proportion of recrystallized grains, substructures and deformed grains of the studied T2 copper sheet processed by different annealing temperatures are depicted in Figure 8. From the statistics, it could be determined that the volume fractions corresponding to the deformed state of microstructure, the substructure as well as the recrystallized microstructure are confirmed to be 55.2%, 27.0% and 17.8% with respect to the studied T2 copper sheet processed at 200 °C, respectively. The volume fractions of substructure and the recrystallized microstructure with respect to the studied T2 copper sheet processed at 300 °C are obviously increased to 53.6% and 43.6% compared to the 200 °C condition, respectively. When the annealing temperature is increased above 400 °C, the deformed grains are decreased sharply, accompanied by the obvious increase in volume fractions for the substructure and recrystallized grains. Substructure grains are formed in large quantities in the annealing temperature range from 300 to 400 °C, peaking at 73.8% at an annealing temperature of 400 °C. Despite fluctuations in the 300 °C and 400 °C data due to sampling area bias, the variation discipline related to the recrystallization behavior is still informative. Generally, the substructure state represents the transitional phase from the deformed state to the recrystallized state, and the substructure state and recrystallized state are characterized by relatively lower dislocation density compared to the deformed state, where both states are regarded as softened signals induced by recovery and recrystallization during the EBSD analysis for the recrystallization behavior. In this investigation, the sum of the two state microstructure including substructure state and recrystallized state corresponding to the annealing temperature ranging from 200 to 500 °C are detected to be 44.8%, 97.2%, 99.3% and 99.6%, respectively, shown in Figure 7, which indicates that the annealing temperature of 300 °C is the critical temperature at which the recrystallization degree undergoes a significant change, and the difference in the fraction sum composed of substructure state and recrystallized state is not obvious when the annealing temperature is increased above 400 °C as shown in Figure 8. For the T2 copper, it is a kind of material with medium- to high-level fault energy (78 mJ/m2), and the nucleation of recrystallization is prone to be dominated by the mechanism of subgrain coalescence under severe deformation. The recrystallization temperature of the studied T2 copper sheet is distributed in the temperature range of 200–280 °C, which is much lower compared to the other alloys due to the non-alloying addition [27]. After severe deformation with a deformation amount of 83%, the recrystallization process could be sufficiently activated even at a relatively lower annealing temperature compared to the recrystallization temperature, and thermodynamic conditions could be provided for nucleation of sub-crystalline merger. A surge in the percentage of sub-granular grains at an annealing temperature of 200 °C indicates that this stage is dominated by recovery with respect to the studied T2 copper sheet, and the increase in twinning boundaries together with the transformation of sub-grains into HAGB at annealing temperature of 300 °C indicates the nucleation and growth involved in recrystallization mechanism, which finally contribute to the significant increase in volume fraction of recrystallization.
Figure 7.
Grain state diagram of T2 copper sheet processed at annealing temperature of (a) 200 °C; (b) 300 °C; (c) 400 °C; (d) 500 °C.
Figure 8.
Comparison of grain distribution histogram at different annealing temperatures.
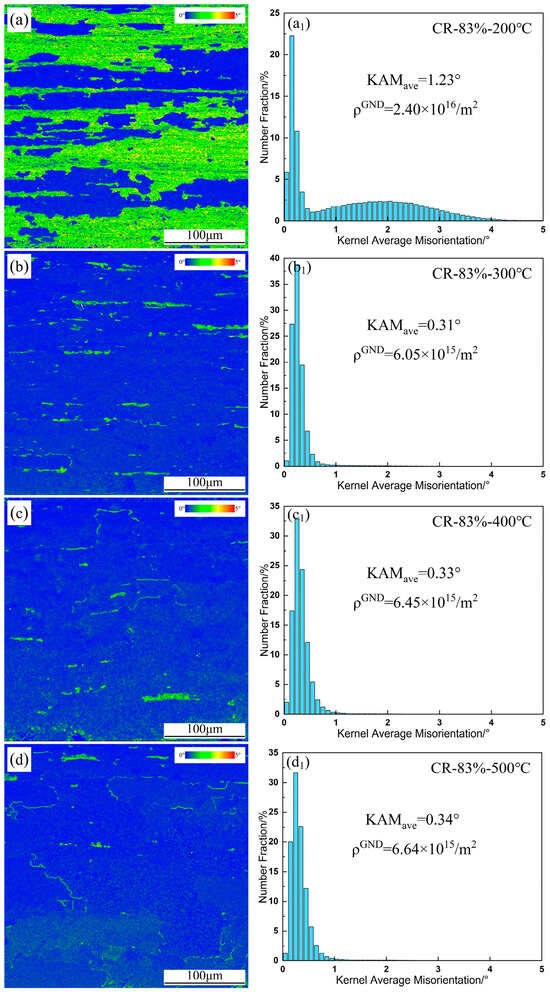
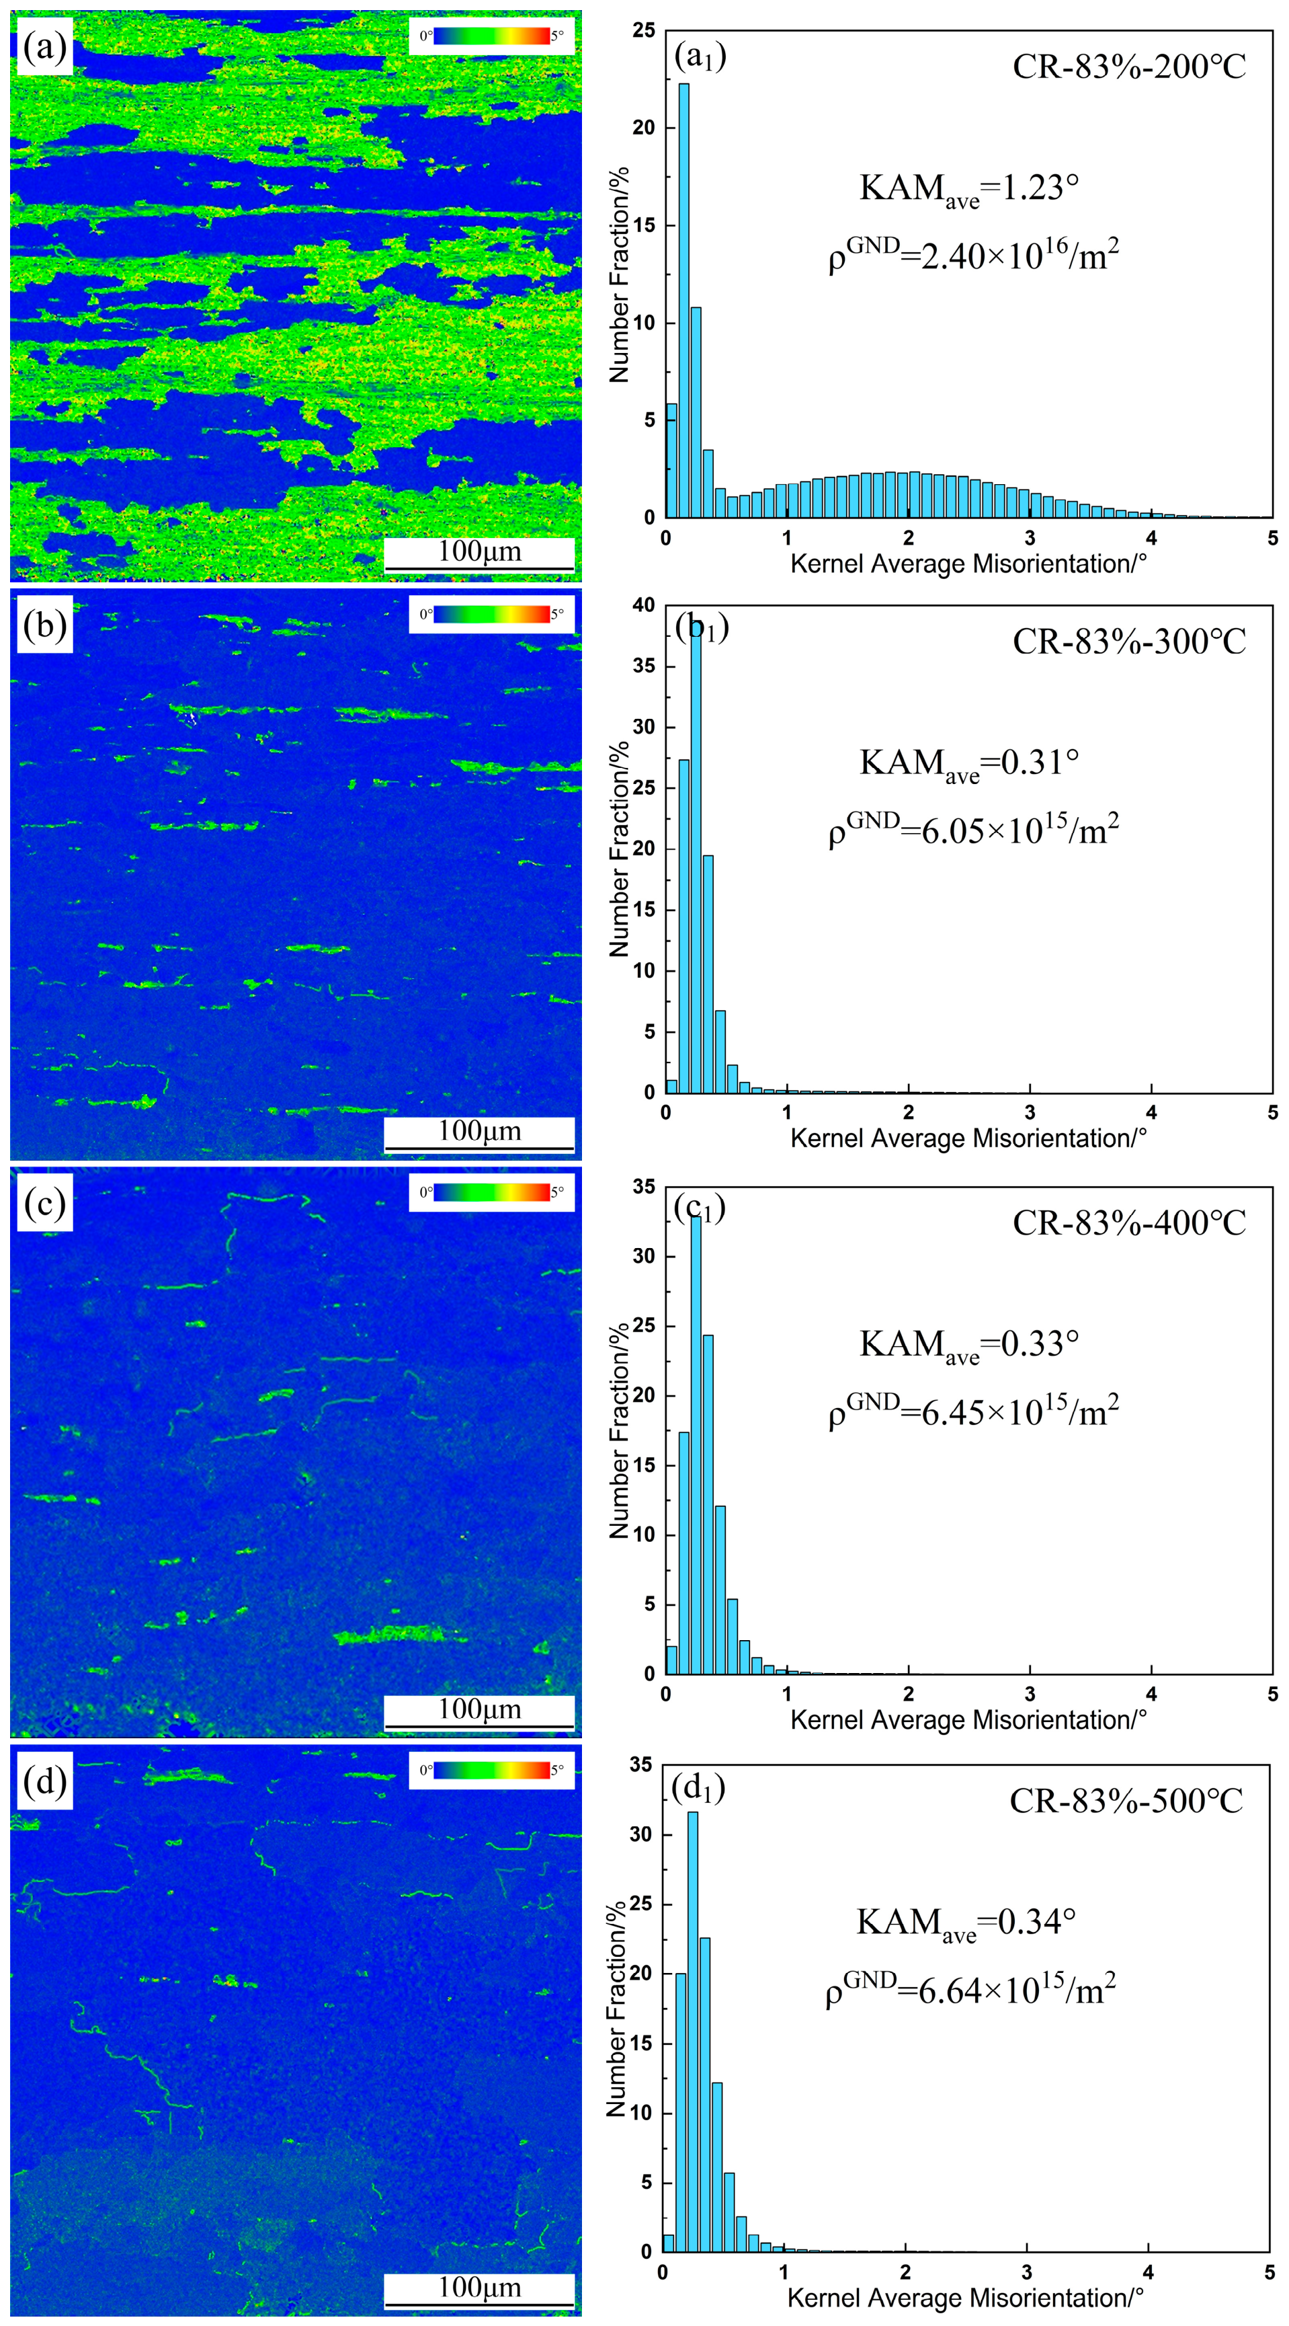
Figure 9 further shows the diagram of kernel-averaged misorientation (KAM) and corresponding distribution of average geometrically necessary dislocation (GND) density of the studied T2 copper sheet processed by different annealing temperatures. Generally, the KAM diagrams can be applied to analyze the amount of energy stored within the material, and the KAM value can be used to derive the geometrically necessary dislocation density of T2 copper sheet rolled at ambient temperature.
Figure 9.
KAM diagrams, average GND density (a1–d1) of T2 copper sheet processed by annealing temperature of (a) 200 °C; (b) 300 °C; (c) 400 °C; (d) 500 °C.
In order to quantify the dislocation distribution in T2 copper sheet processed by different annealing temperatures, the KAM method is used to determine the local orientation error based on ESBD data, and the density of GND was calculated according to the following formula [28]:
where is GND density, θ is the local misorientation, b is the Burgers vector and μ is the scanning step (0.4 μm).
The regions with green color and blue color in the KAM diagram represent the high-energy area and the low-energy area, respectively. The high-energy region is mainly prone to be concentrated near the deformed microstructure, and the low-energy region is mainly prone to be concentrated near the recrystallized microstructure. In accordance with the characterization results, it could be easily found that the green region is predominant in the KAM diagram accompanied by only a small portion of blue region with respect to the studied T2 copper sheet processed by annealing temperature of 200 °C, shown in Figure 9a, indicating the internal storage energy is decreased to a certain extent, and the dislocation density is reduced with the generation of recrystallized grains. In addition, the GND density involved in the studied T2 copper sheet processed by annealing temperature of 200 °C is calculated to be 2.40 × 10¹⁶ /m2, as shown in Figure 9(a1). While the KAM diagrams of the studied T2 copper sheets processed at annealing temperature ranging from 300 to 500 °C are dominated by the blue region, indicating the internal storage of energy is low, induced by recrystallization mechanism with respect to the studied sheets processed at these deformation and annealing conditions, shown in Figure 9b–d, which could be further verified by the distribution feature of GND density with respect to the studied T2 copper sheet. The GND density for the sheet processed at annealing temperatures ranging from 300 to 500 °C is relatively lower compared to the condition treated at an annealing temperature of 200 °C, shown in Figure 9(b1)–(d1), implying that most of the energy stored in plastic deformation is released and becomes the driving force for nucleation of new grains.
The variation discipline of tensile properties, including the yield strength and tensile strength stated in Section 3.3, is closely related to the recrystallization behavior with respect to the studied T2 copper. For the studied T2 copper sheet processed by annealing treatment at 200 °C, the volume fraction of deformed structure with relatively high dislocation density is high, as shown in Figure 7 and Figure 8, where recrystallization occurs in some local regions, and the yield strength and tensile strength are overall relatively high, with strength values of 122.9 MPa and 158.5 MPa, respectively. With the increase in annealing temperature, the volume fraction of deformed structure is decreased, accompanied by the increase in volume fractions of substructure and recrystallized structure, and the tensile strength is decreased. When the annealing temperature is further increased to 500 °C, the yield strength and tensile strength with respect to the studied T2 copper sheet are decreased to 39.4 MPa and 111.6 MPa, respectively. The variation discipline of tensile properties as a function of annealing temperature indicates that a severe deformation with a deformation amount of up to 83% together with an annealing temperature ranging from 200 to 500 °C could be attempted to achieve the ideal mechanical properties.
4.2. Evolution Behavior of CRO Through Entire Deformation
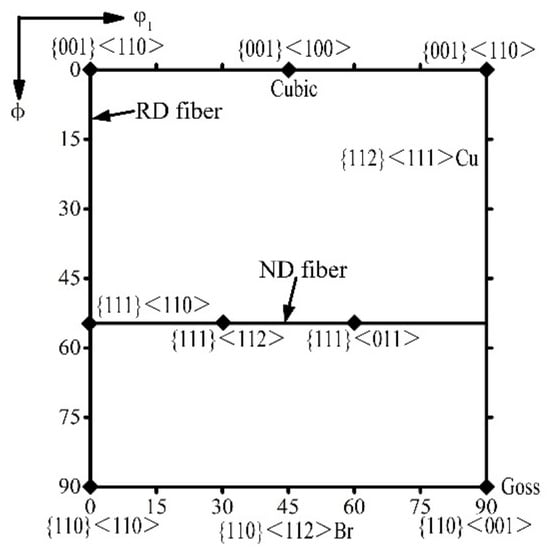
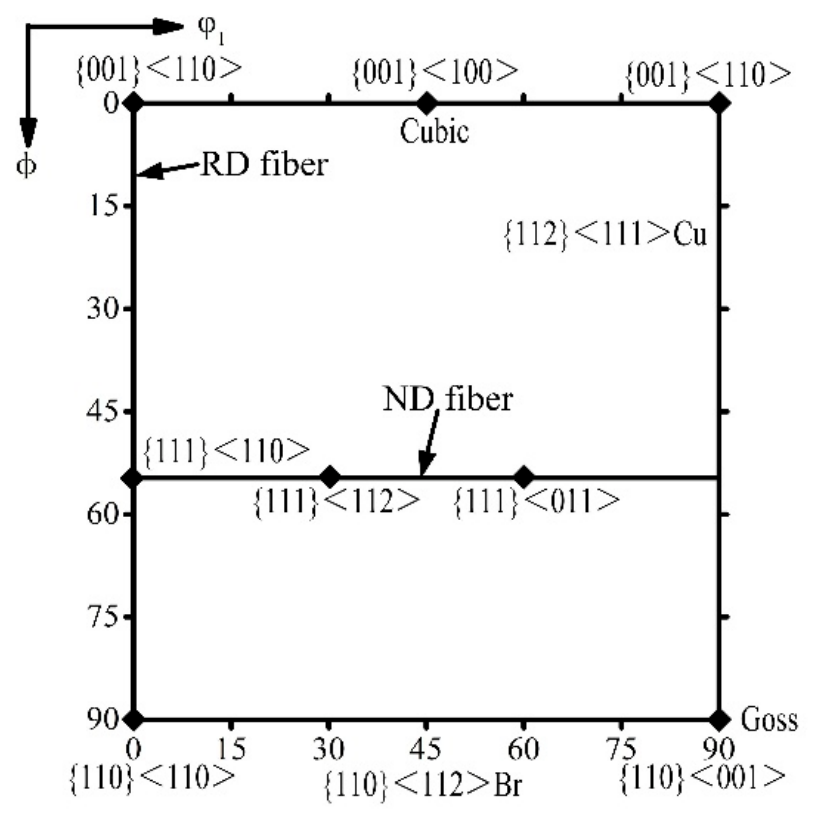
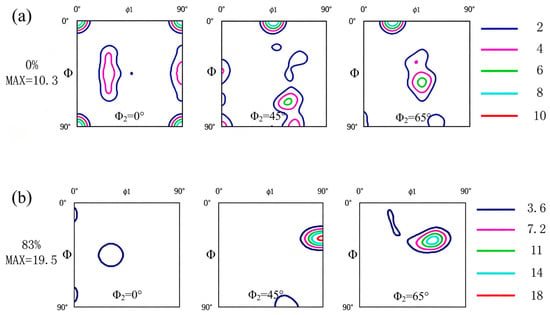
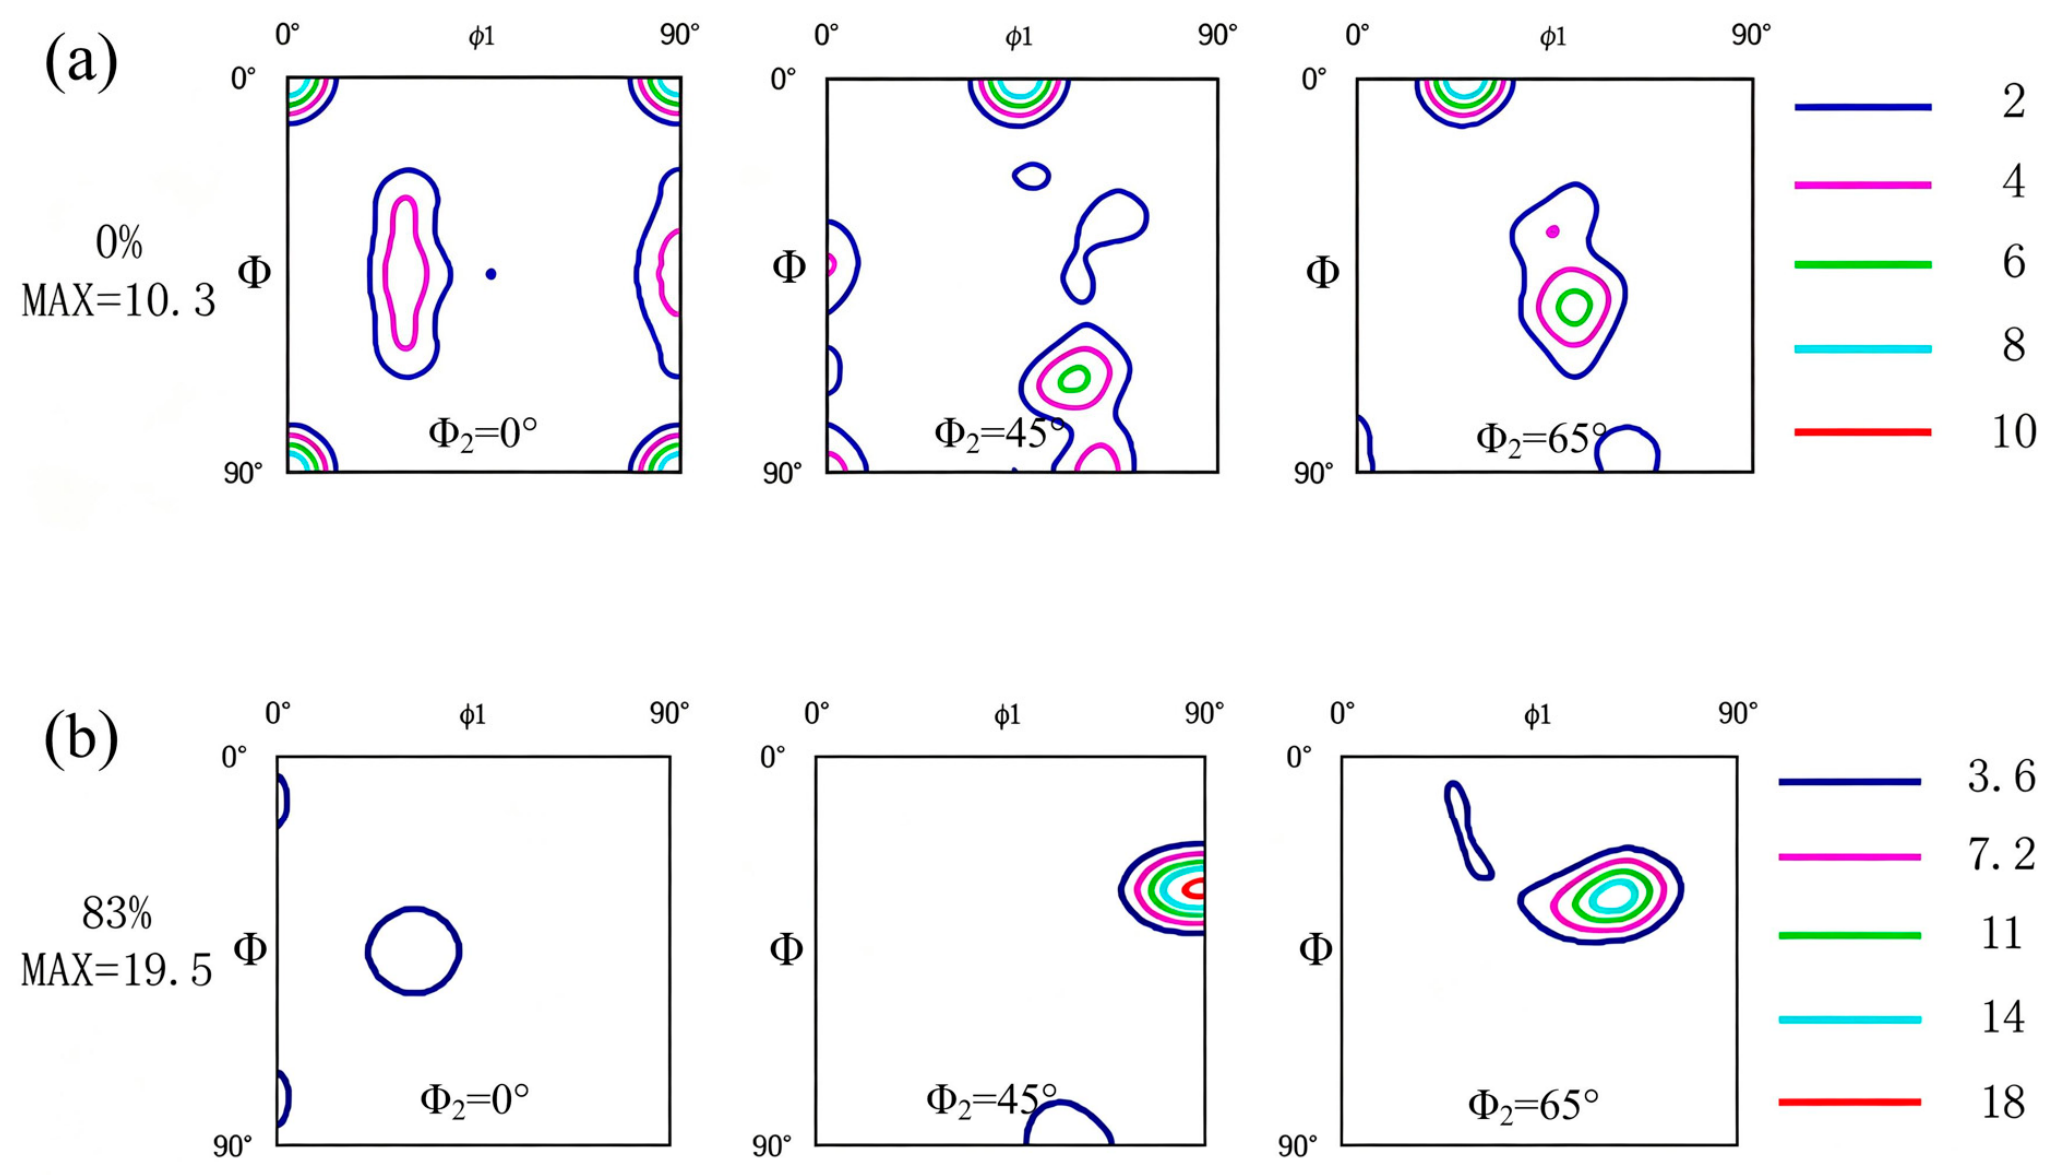
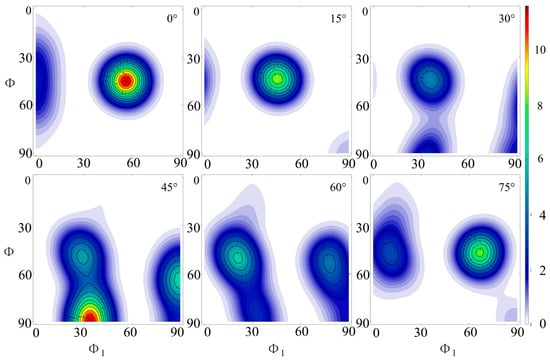
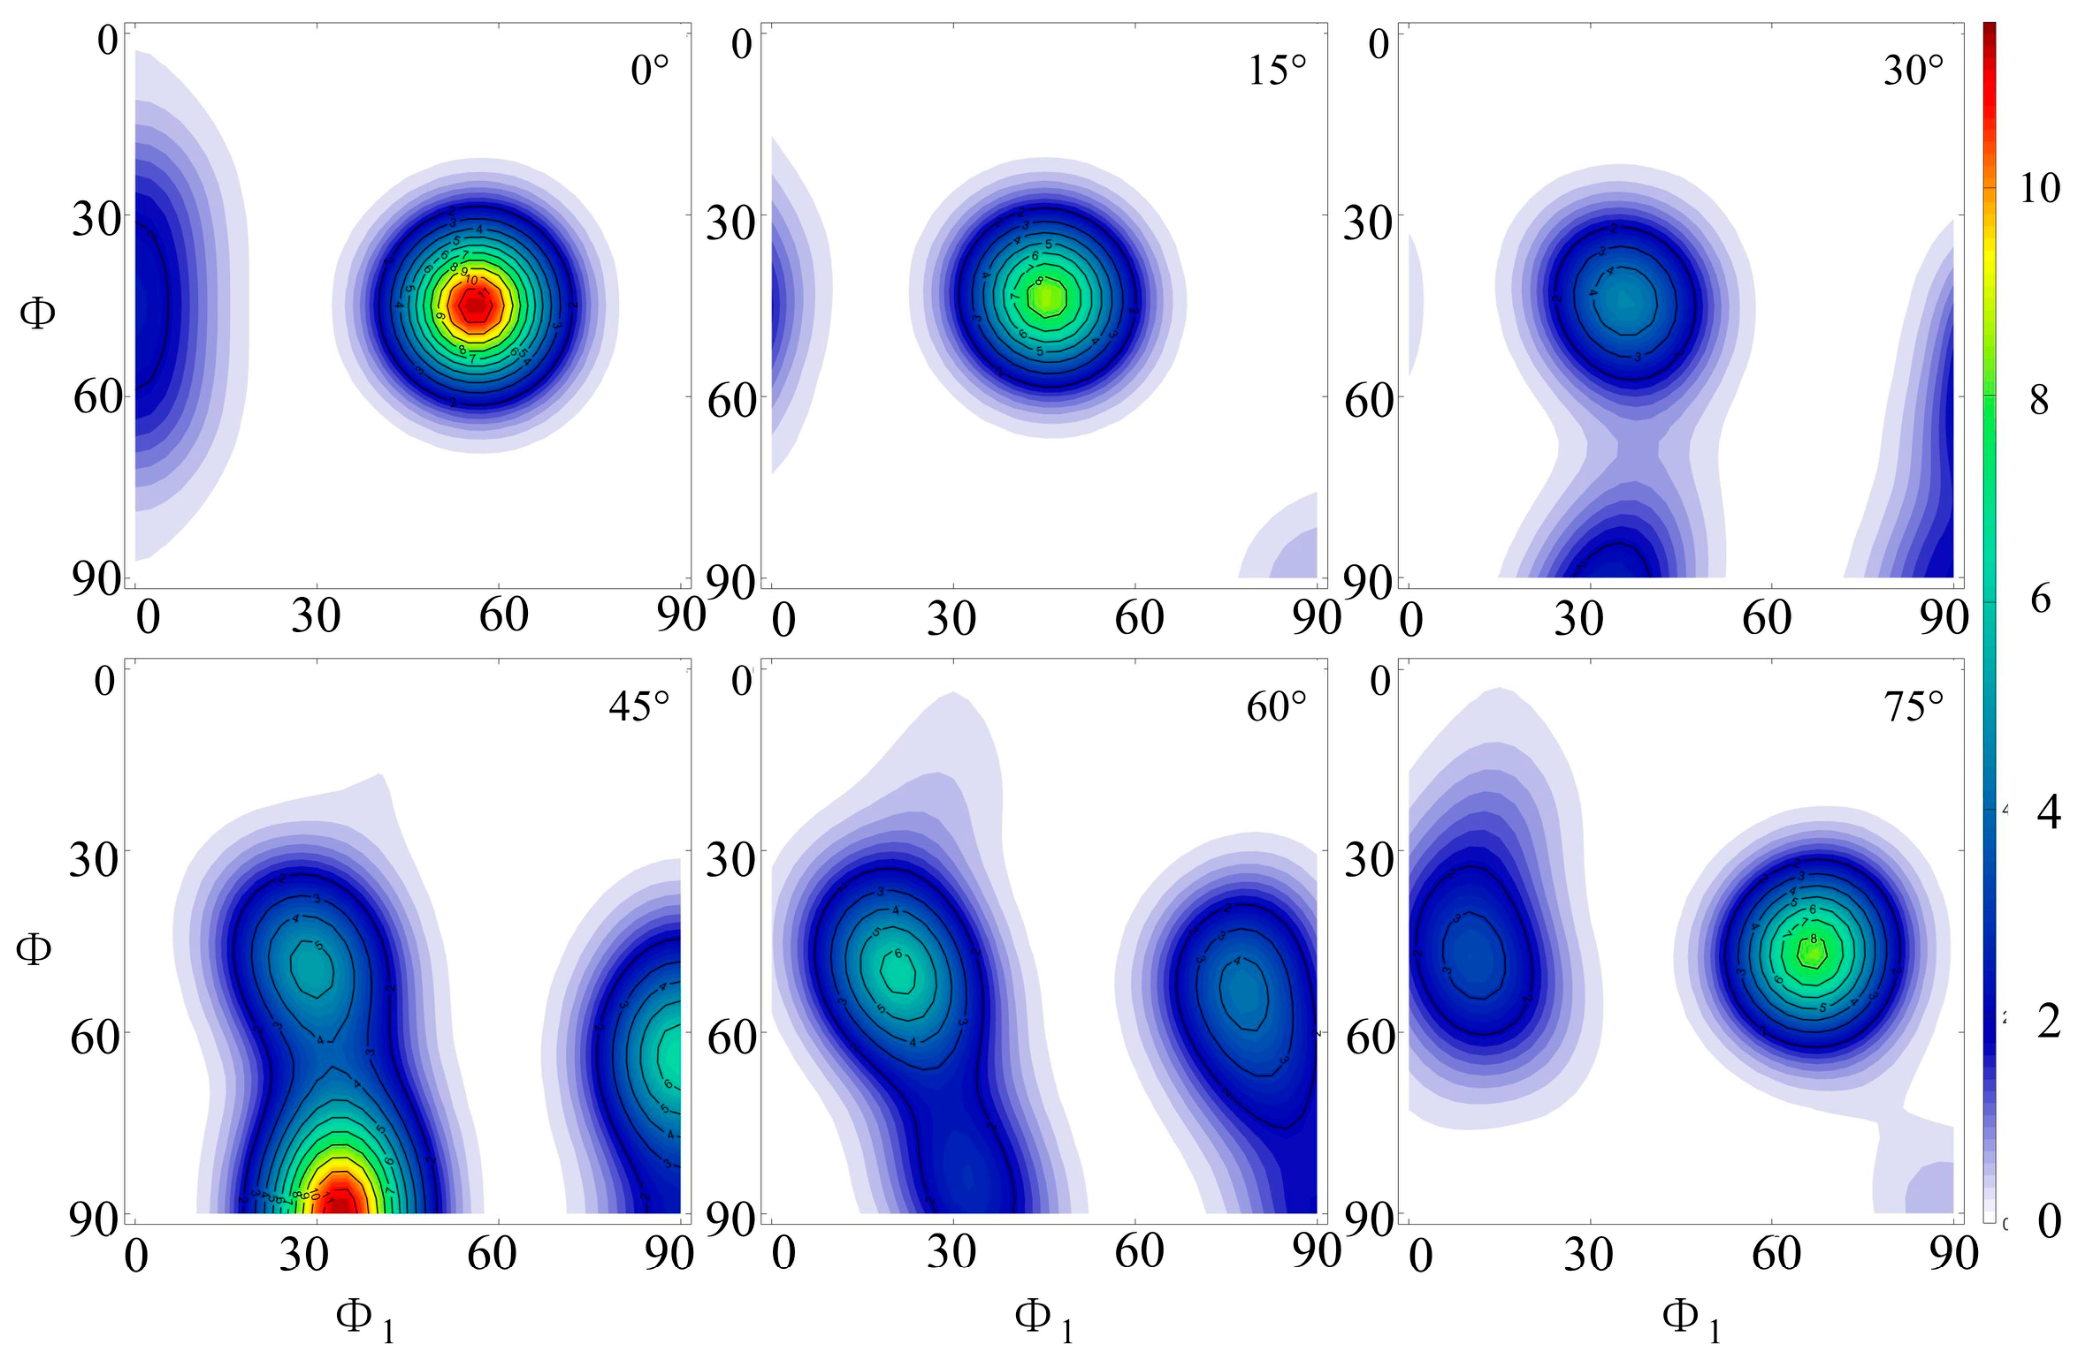
In order to comprehensively and systematically clarify the evolution discipline of CRO throughout the entire deformation and annealing stages with respect to the studied T2 copper sheet, it is necessary to first obtain and understand the evolution behavior of CRO after it has been processed through the deformation process. In this study, the orientation distribution function (ODF) is applied to describe the CRO feature of the studied T2 copper sheet with different deformation states and different annealing states, and the standard ODF diagram is depicted in Figure 10. Figure 11 shows the ODF diagram of the studied T2 copper sheet corresponding to the initial state and deformation state, which were processed by annealing softening treatment and severe deformation with an entire deformation amount of 83%, respectively. In accordance with the characterization results, it could be found that the initial texture component of the studied T2 copper sheet prior to cold-rolling process is predominantly composed of Cube texture ({001} <100>) and other randomly distributed CRO, and the maximum intensity values corresponding to the Cube texture and random CRO are estimated to be ~10.3 and ~6.0, respectively, shown in Figure 11a. After severely cold-rolling process with a large deformation amount of 83% for the studied T2 copper sheet, the predominant texture is prone to transform to a single strong texture, and the texture component is mainly composed of copper texture ({112} <111>) accompanied by additional weak texture including the S texture ({123} <634>), Brass texture ({110} <112>) and Cube texture, and the maximum intensity value corresponding to the copper texture is reached up to ~19.5, as shown in Figure 11b. To further explore the evolution mechanism involved in the severe deformation process with respect to the studied T2 copper sheet, the crystal plasticity theory characterized by unique advantages in studying the plastic deformation behavior and mechanism of materials at the mesoscopic level is adopted [29,30,31,32,33], and a visco-plastic self-consistent model (VPSC, version: 7b) proposed by Lebensohn and Tomé [30] was applied in this investigation. In accordance with the theory of metal science, the T2 copper exhibits the FCC Bravais lattice crystal structure and could be classified as a metal belonging to the medium–low energy category, indicating its deformation mechanism is mainly based on the dislocation slipping mechanism, with the twinning mechanism playing a secondary role [34]. For the studied T2 copper sheet, the potential slipping system and twinning system during plastic deformation are {111}<110> and {111}<112>, respectively.
Figure 10.
Standard orientation distribution function diagram.
Figure 11.
ODF diagram of studied T2 copper sheet: (a) initial state processed by annealing softening treatment, and (b) severe deformation with deformation amount of 83%.
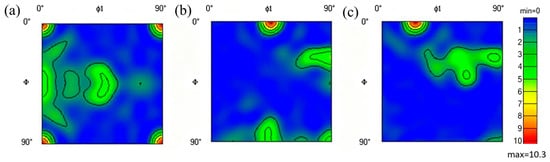
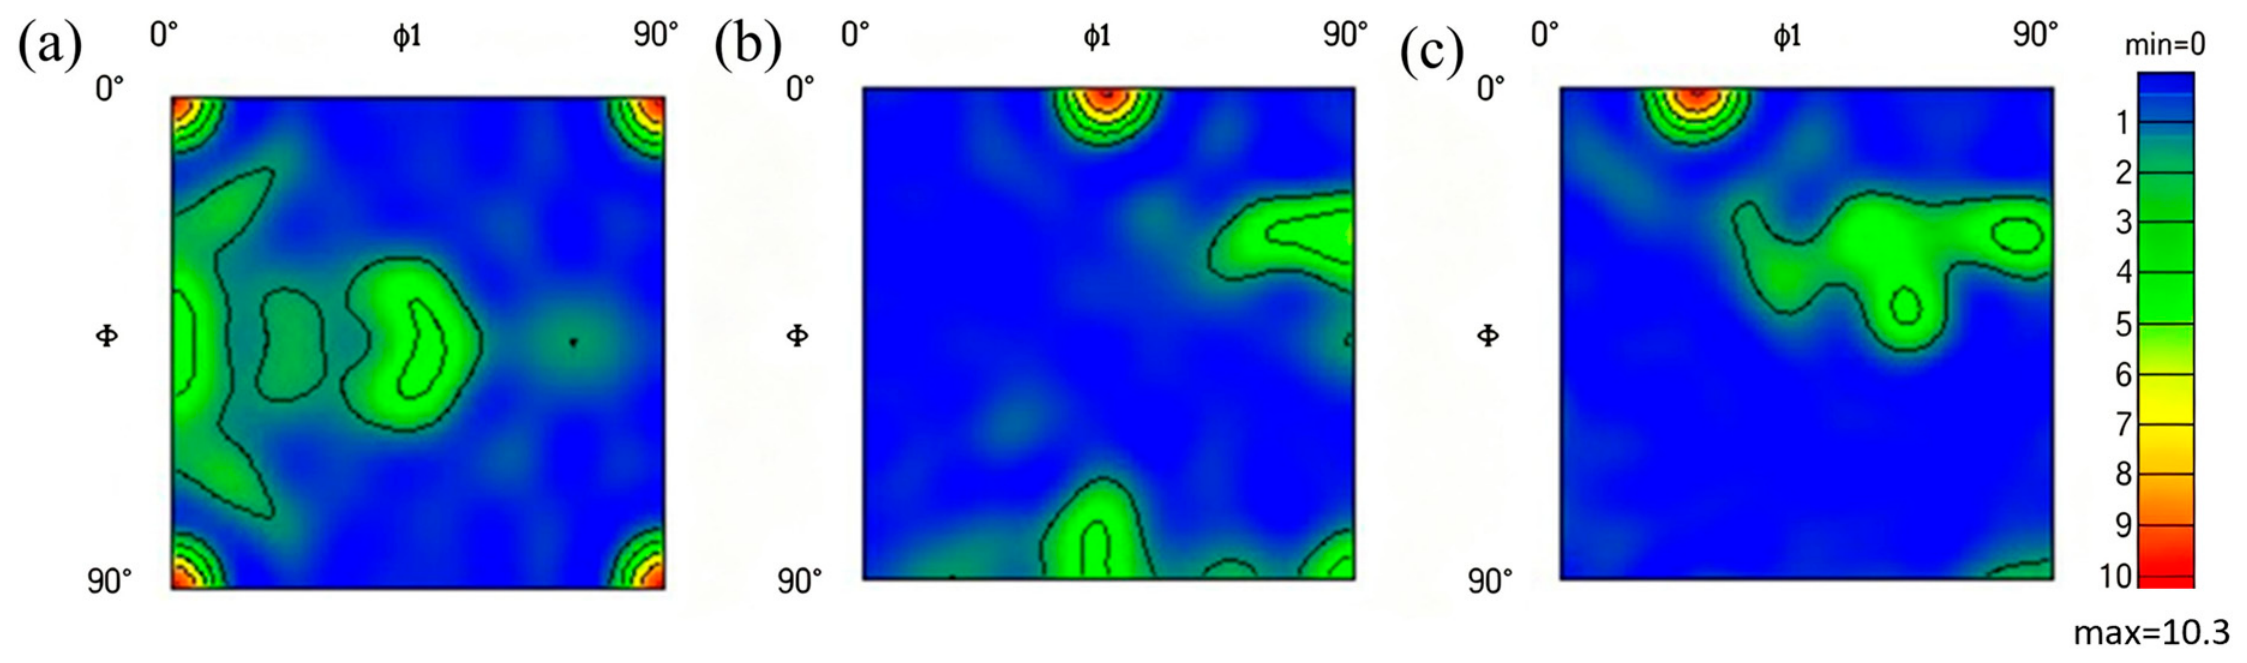
To reveal the evolution mechanism of CRO of the studied T2 copper during the rolling forming process, the VPSC model is applied to simulate and calculate the evolution behavior of CRO under three different deformation conditions, including the activation of the slipping mechanism independently, the activation of the twinning mechanism independently, as well as the coupling activations of the slipping mechanism and twinning mechanism. The information typically required for the establishment of the VPSC model mainly includes the initial CRO, the ratio of three-dimensional grain sizes, as well as the hardening parameters related to the material’s hardening mechanism, among other key parameters. The CRO is mainly obtained through EBSD detection and analysis, and the CRO of the studied T2 copper sheet after stress relief annealing treatment is selected as the initial CRO, as shown in Figure 12. The ODF diagram of the initial CRO obtained from the test indicates that there are relatively more typical feature CROs in the annealed state of the studied T2 copper, mainly including copper, Brass and Cube components. The maximum intensities of the three feature CROs are approximately determined to be 4.0, 4.0 and 10.3, respectively, and the intensities corresponding to all CROs are distributed within the scale of 0 to 10.3, shown in Figure 12b. To facilitate the theoretical calculation, a number of ~15,946 samples randomly selected from the initial CRO are used for the subsequent calculation of the plastic deformation process during the data processing.
Figure 12.
ODF of the studied T2 copper sheet after stress relief annealing treatment (a) φ2 = 0°, (b) φ2 = 45°, (c) φ2 = 90°.
In order to obtain the three-dimensional grain size ratio of the initial state of the studied T2 copper sheet, the grain size statistics are conducted on the initial state grains shown in the IPF diagram in Figure 4a. Since the IPF diagram is a two-dimensional figure, the grain size in the ND direction is approximately used to represent the grain size in the TD direction, considering the characteristics of the grains during the rolling process. According to this statistical method, the average grain length along the RD, ND, and TD directions for the test T2 copper sheet are confirmed to be ~374 μm, ~270 μm and ~270 μm, respectively, and the aspect ratios in the three directions are 1.39:1:1. During the calculation process, the saturated Voce hardening model is adopted, and the Voce hardening model coefficients are taken from the default coefficients provided for copper alloys in the VPSC code case library [30]. The Voce hardening model coefficients selected under different deformation mechanisms are shown in Table 2. To verify the calculation results of the transformation law related to CRO, the CRO results of the studied T2 copper under 83% rolling deformation, as depicted in Figure 11b, are applied for comparison and verification. The 83% rolling deformation is converted into true strain, with a magnitude of approximately 1.8. Based on the above VPSC model, relevant parameters are constructed, and the VPSC is used to calculate the CRO of the studied T2 copper sheet under different deformation mechanisms.
Table 2.
The parameters used for Voce hardening model of the studied T2 copper sheet.
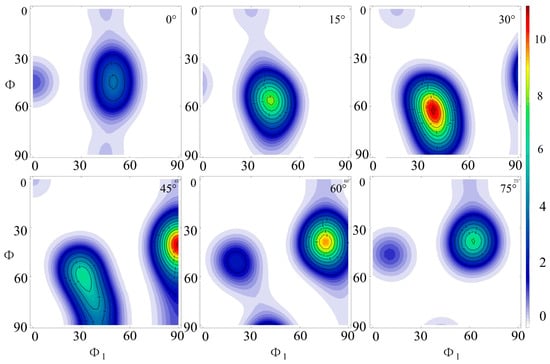
Figure 13 shows the ODF diagram of the studied T2 copper sheet calculated under the condition of considering only the {111}<110> slip system. According to the calculation results, it could be obtained that the CRO feature of the studied T2 copper mainly distribute near the two orientation positions of (90°, 70°, 45°) and (35°, 90°, 45°) under the condition of considering the initiation of the slip system alone, and the distribution intensity at the position (35°, 90°, 45°) is reached up to approximately 11.0. The above calculation results indicate that under the condition where the {111}<110> slip system is activated alone, the CRO of the studied T2 copper sheet will change from the initial copper, Brass, Cube composite CRO to the above-mentioned feature CROs.
Figure 13.
The ODF of the studied T2 copper sheet obtained through calculation at true strain of 1.8 considering only the activation of {111}<110> slip system.
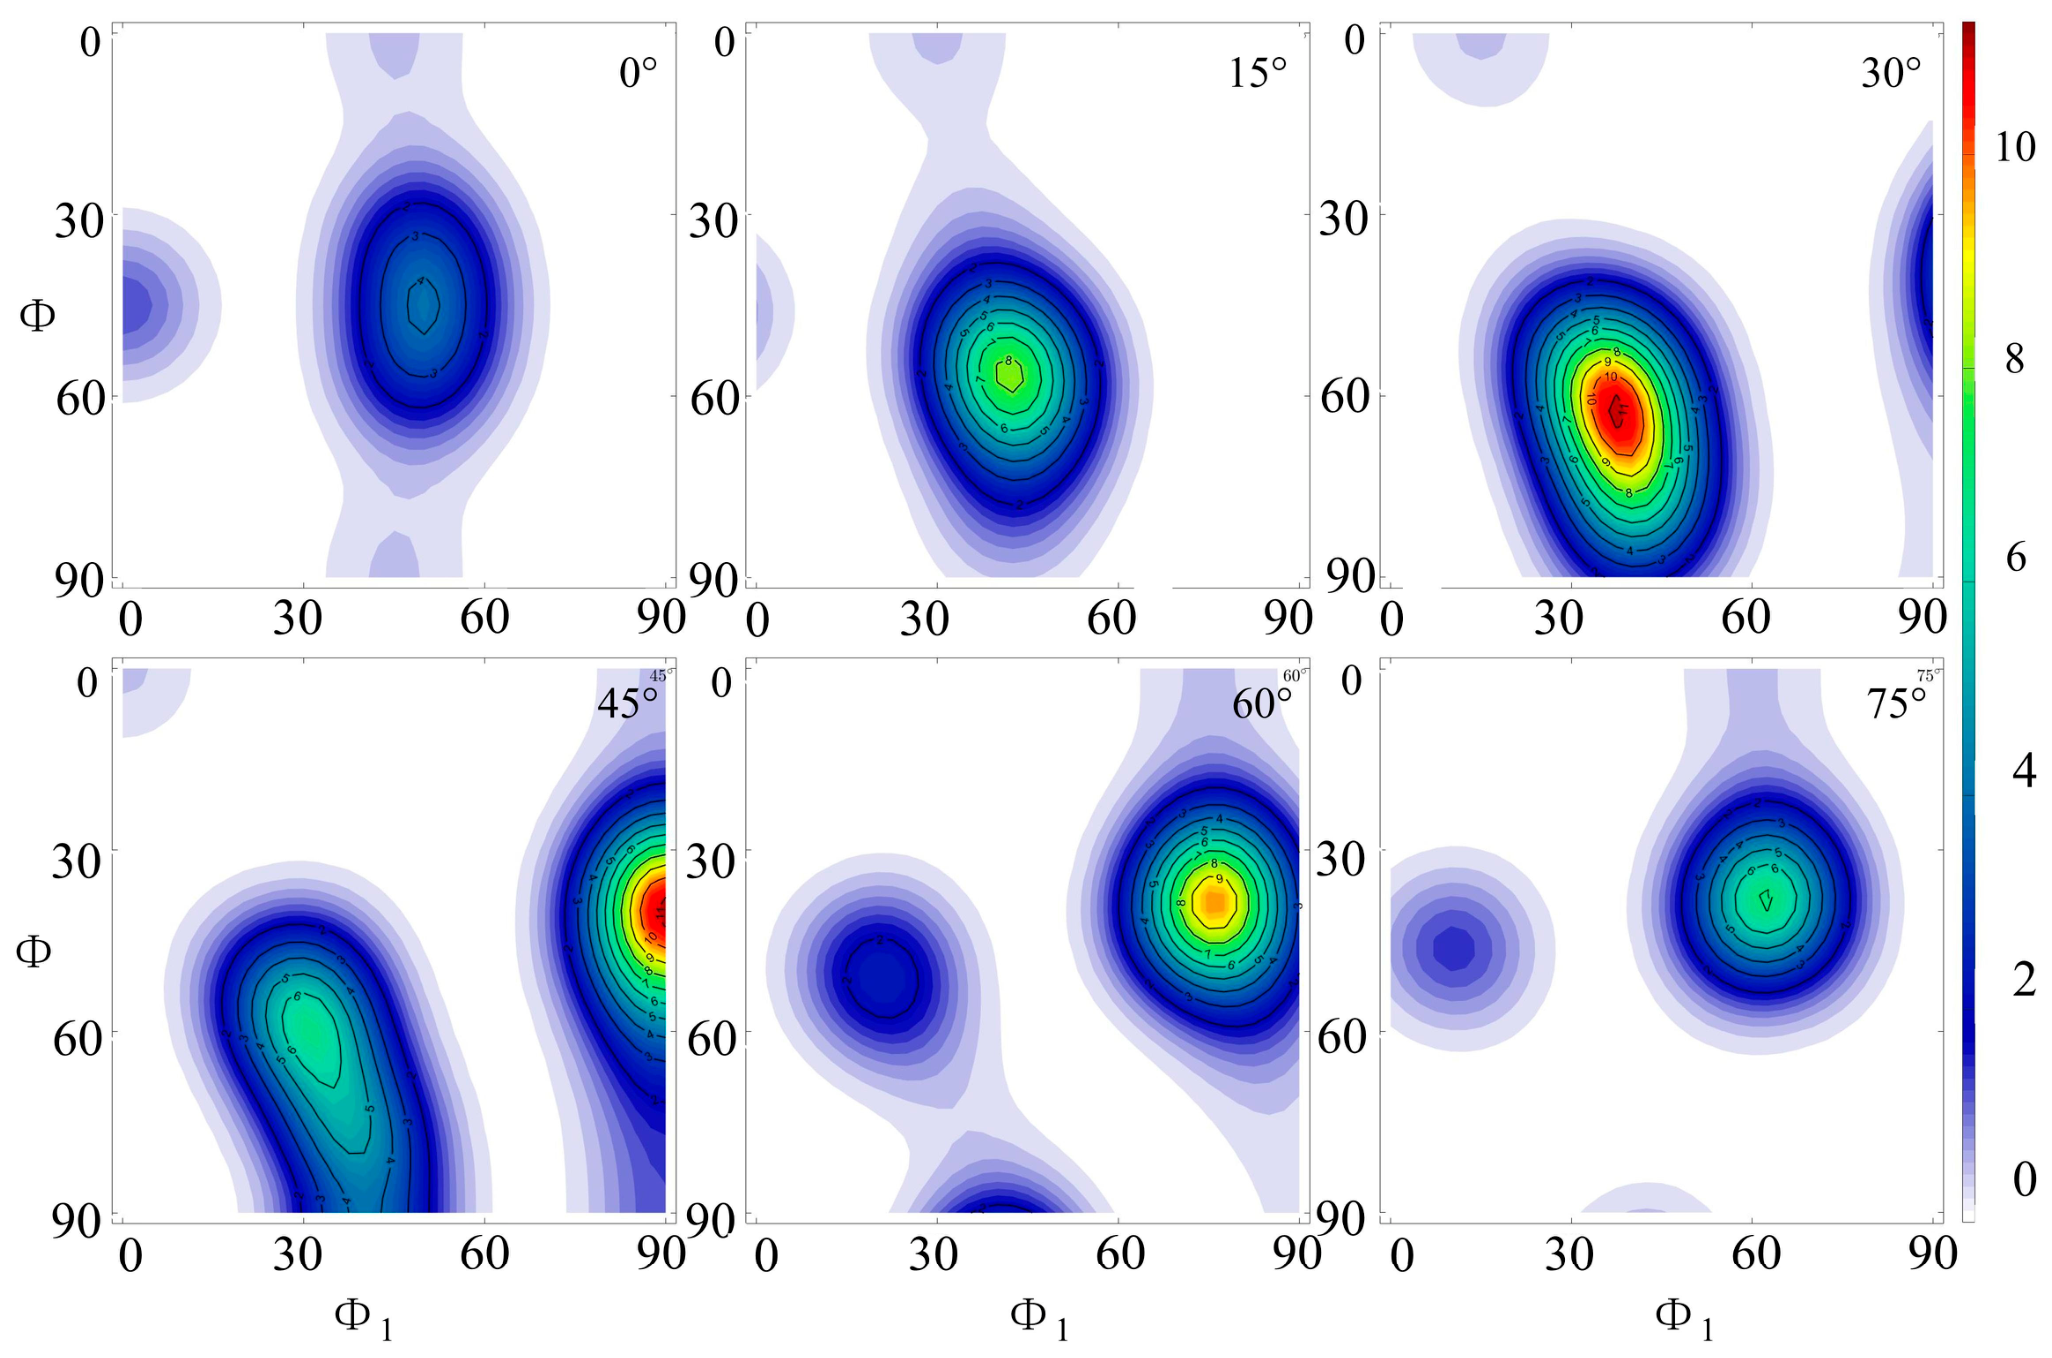
Figure 14 shows the ODF diagram of the studied T2 copper sheet used in the test under the condition of considering only the {111}<112> twin system. According to the calculation results, it could be seen that the CRO of the studied T2 copper sheet is mainly distributed on the copper orientation on the τ-fiber and the (35°, 58°, 45°) feature orientation position, considering only the activation of the twin system. This indicates that the activation of the twin system will cause the orientation of the studied T2 copper to change from the initial orientation composed of copper, Brass, and Cube composite orientations to an orientation dominated by copper, with the peak strength reaching approximately 11.5.
Figure 14.
The ODF of the studied T2 copper sheet obtained through calculation at true strain of 1.8 considering only the activation of {111}<112> twin system.
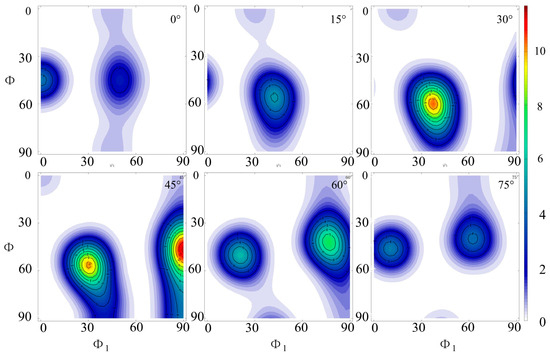
Figure 15 further gives the ODF diagram of the studied T2 copper sheet processed under the activation of combined conditions of the {111}<110> slip system and {111}<112> twin system. From the calculation results, it could be seen that when both the activation of the slip system and the twin system are considered, the CRO of the studied T2 copper is also distributed on the τ-fiber at the Copper CRO and the (35°, 58°, 45°) feature orientation position. Moreover, the distribution intensity at the (35°, 58°, 45°) feature orientation position is higher compared to the intensity obtained under the condition of considering the twin system independently. Under this condition, the initial orientation composed of copper, Brass, and Cube composite orientations of the studied T2 copper should transform to the CRO predominantly composed of Copper with the highest distribution intensity of approximately 11.5.
Figure 15.
The ODF of the studied T2 copper sheet obtained through calculation at true strain of 1.8 considering the activations of {111}<110> slip system and {111}<112> twinning system.
In order to verify which deformation mechanism leads to a high degree of agreement between the theoretical calculation results and the experimental results, the ODF diagram of the studied T2 copper sheet with a deformation amount of 83% shown in Figure 11b was selected for subsequent comparison. From the test results, it could be seen that the Brass component is relatively weak while the Copper component is relatively strong under the 83% rolling deformation condition. The distribution intensity of Copper orientation could reach up to the highest value of 19.5, and the texture is predominantly concentrated in the β-fiber, forming a CRO feature dominated by the typical Copper and S texture. By comparing the theoretical calculation results shown in Figure 13, Figure 14 and Figure 15, it can be seen that the feature CRO obtained through theoretical calculation before and after rolling is in relatively high agreement with the feature of CRO obtained from the experimental tests under the condition of twin system activation. For the results obtained through the experimental tests or the theoretical calculations, the distribution intensity of the Copper texture in the studied T2 copper sheet is the highest, indicating the twinning mechanism plays a significant role in the plastic deformation process with respect to the studied T2 copper sheet. Considering that the slipping mechanism is the primary deformation mechanism for metals with a face-centered cubic crystal structure, it could be inferred that the coupling mechanism consisting of dislocation slipping and crystal twinning is the main mechanism of its deformation with respect to the studied T2 copper used in this investigation.
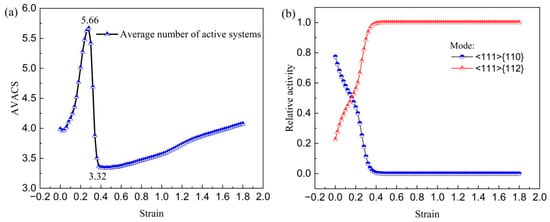
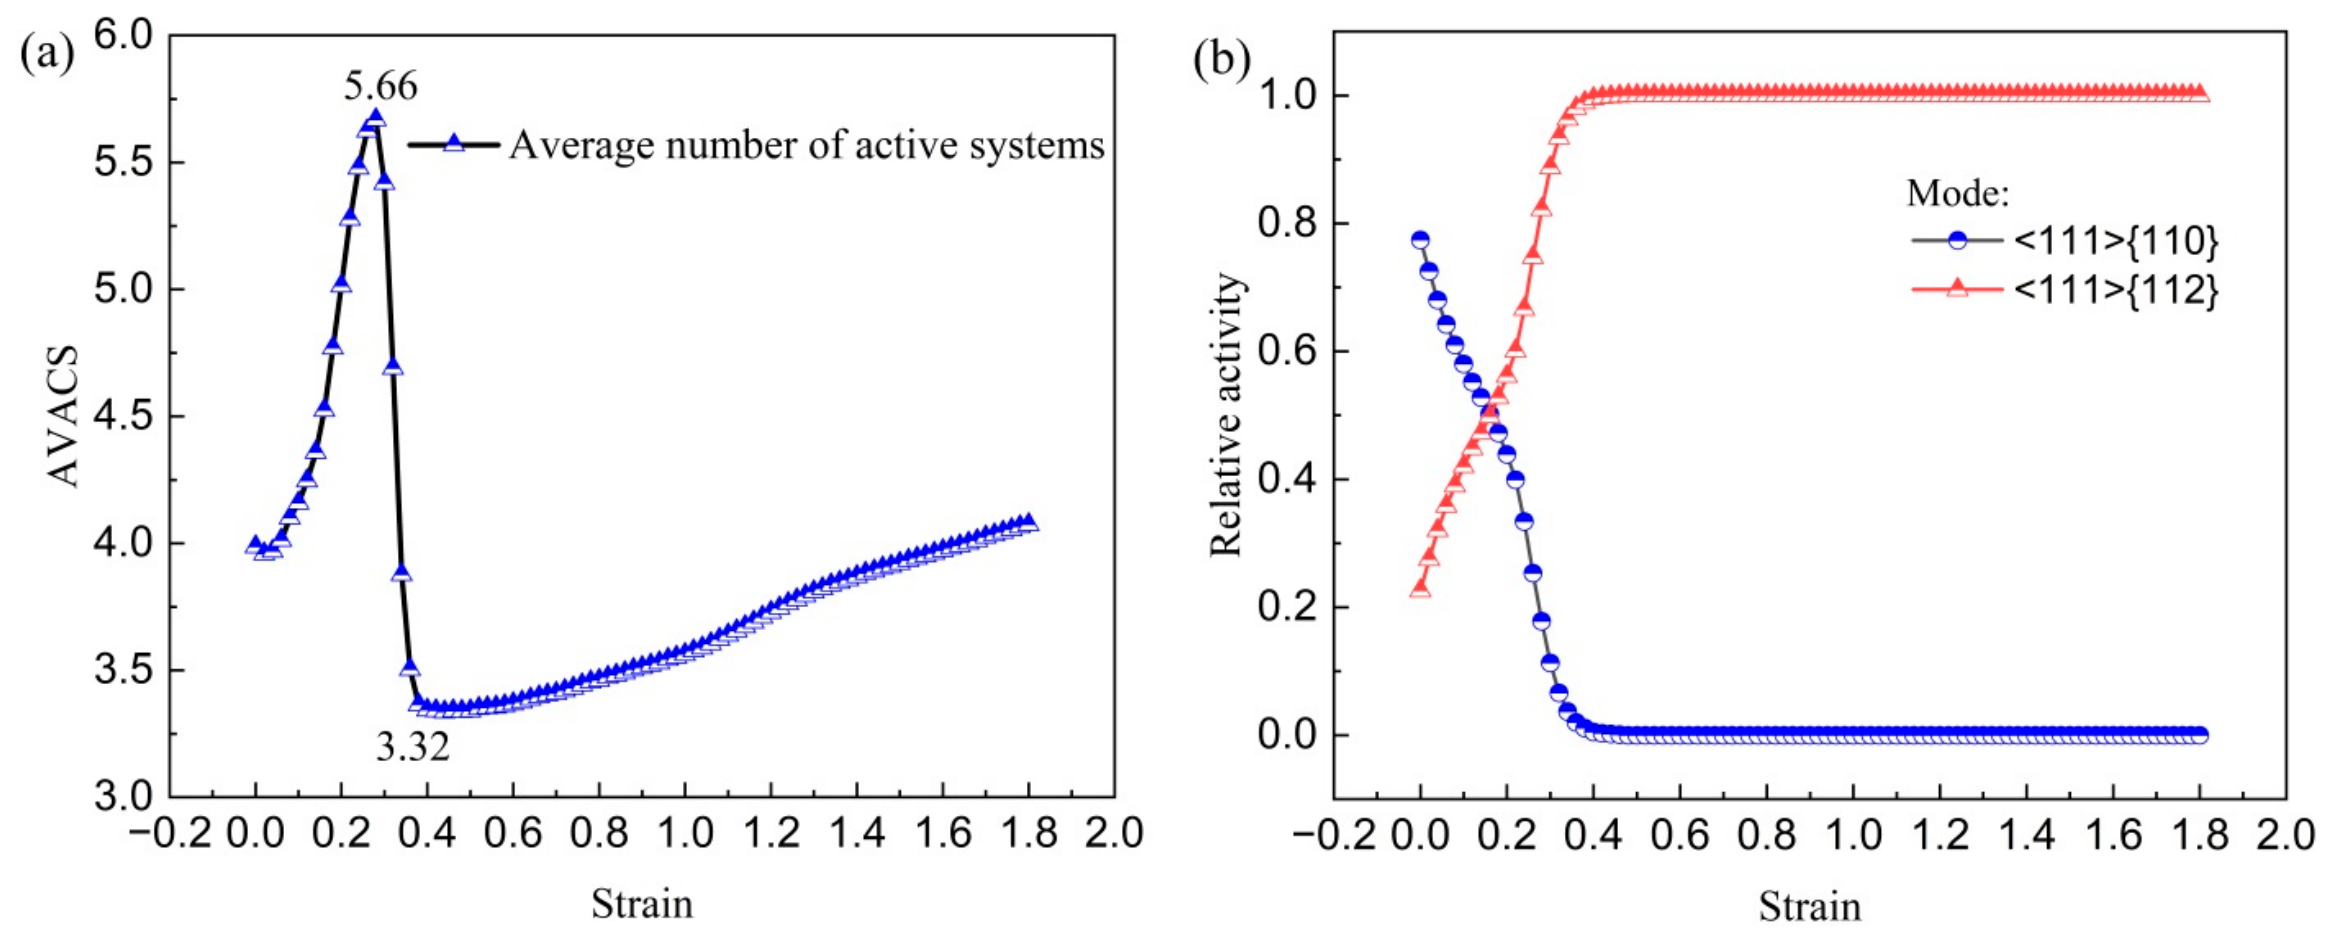
To further quantitatively explore the specific contributions induced by the slipping mechanism and twinning mechanism during the plastic deformation with respect to the studied T2 copper sheet, the average values of the activated slip systems within individual grains at different strains, as well as the variation patterns of the contribution values induced by different deformation mechanisms to plastic deformation, were studied, and the calculation results are depicted in Figure 16. From the calculation results, it could be observed that the average number of slip systems activated within a single crystal grain shows a trend of first increasing and then decreasing with the increase in strain. When the true strain is increased to approximately 0.3, the number of activated slip systems within a single crystal grain reaches the maximum, with approximately 5.66. With the further increase in true strain, the number of activated slip systems within a single crystal grain is significantly decreased to approximately 3.32, as shown in Figure 16a. Figure 16b presents the distribution pattern of the contribution values induced by the slipping mechanism and twinning mechanism to plastic deformation. From the calculation results, it could be obtained that the slipping mechanism has a greater contribution to the plastic deformation of the studied T2 copper sheet in the initial deformation stage, and shows a trend of first decreasing and then stabilizing with the true strain increase. When the true strain reaches approximately 0.32, the slipping mechanism almost has no effect. On the contrary, in the initial deformation stage, the twinning mechanism has a relatively smaller contribution to the plastic deformation of the studied T2 copper sheet. With the true strain increasing, it shows a trend of first increasing and then stabilizing, and the twinning mechanism plays a major role in plastic deformation when the true strain reaches approximately 0.32 or above, indicating the twinning mechanism plays a major role in the large deformation stage with respect to the studied T2 copper sheet.
Figure 16.
The quantitative contribution induced by coupling mechanism of {111}<110> slipping mechanism together with {111}<112> twinning mechanism: (a) the average number of activated systems within individual grains, (b) the contribution amounts induced by two deformation mechanisms.
From the above, it could be concluded that the initiation of slip systems during plastic deformation is conducive to the transformation of the initial composite orientation (90°, 70°, 45°), (35°, 90°, 45°) and other uncommon crystal orientations for the studied T2 copper sheet, while the initiation of twinning systems is conducive to the transformation of the crystal orientation of the studied T2 copper sheet to the Copper texture. The coupling activation of the {111}<110> slipping mechanism together with the {111}<112> twinning mechanism is the predominant deformation mechanism with respect to the studied T2 copper sheet, and the coupling activations of the slipping mechanism and twinning mechanism play a dominant role when the true strain is below ~0.32. When the true strain is increased above ~0.32, the deformation is mainly dominated by the {111}<112> twinning mechanism with respect to the studied T2 copper sheet.
4.3. CRO Feature of Copper Sheet Undergoing Annealing Process
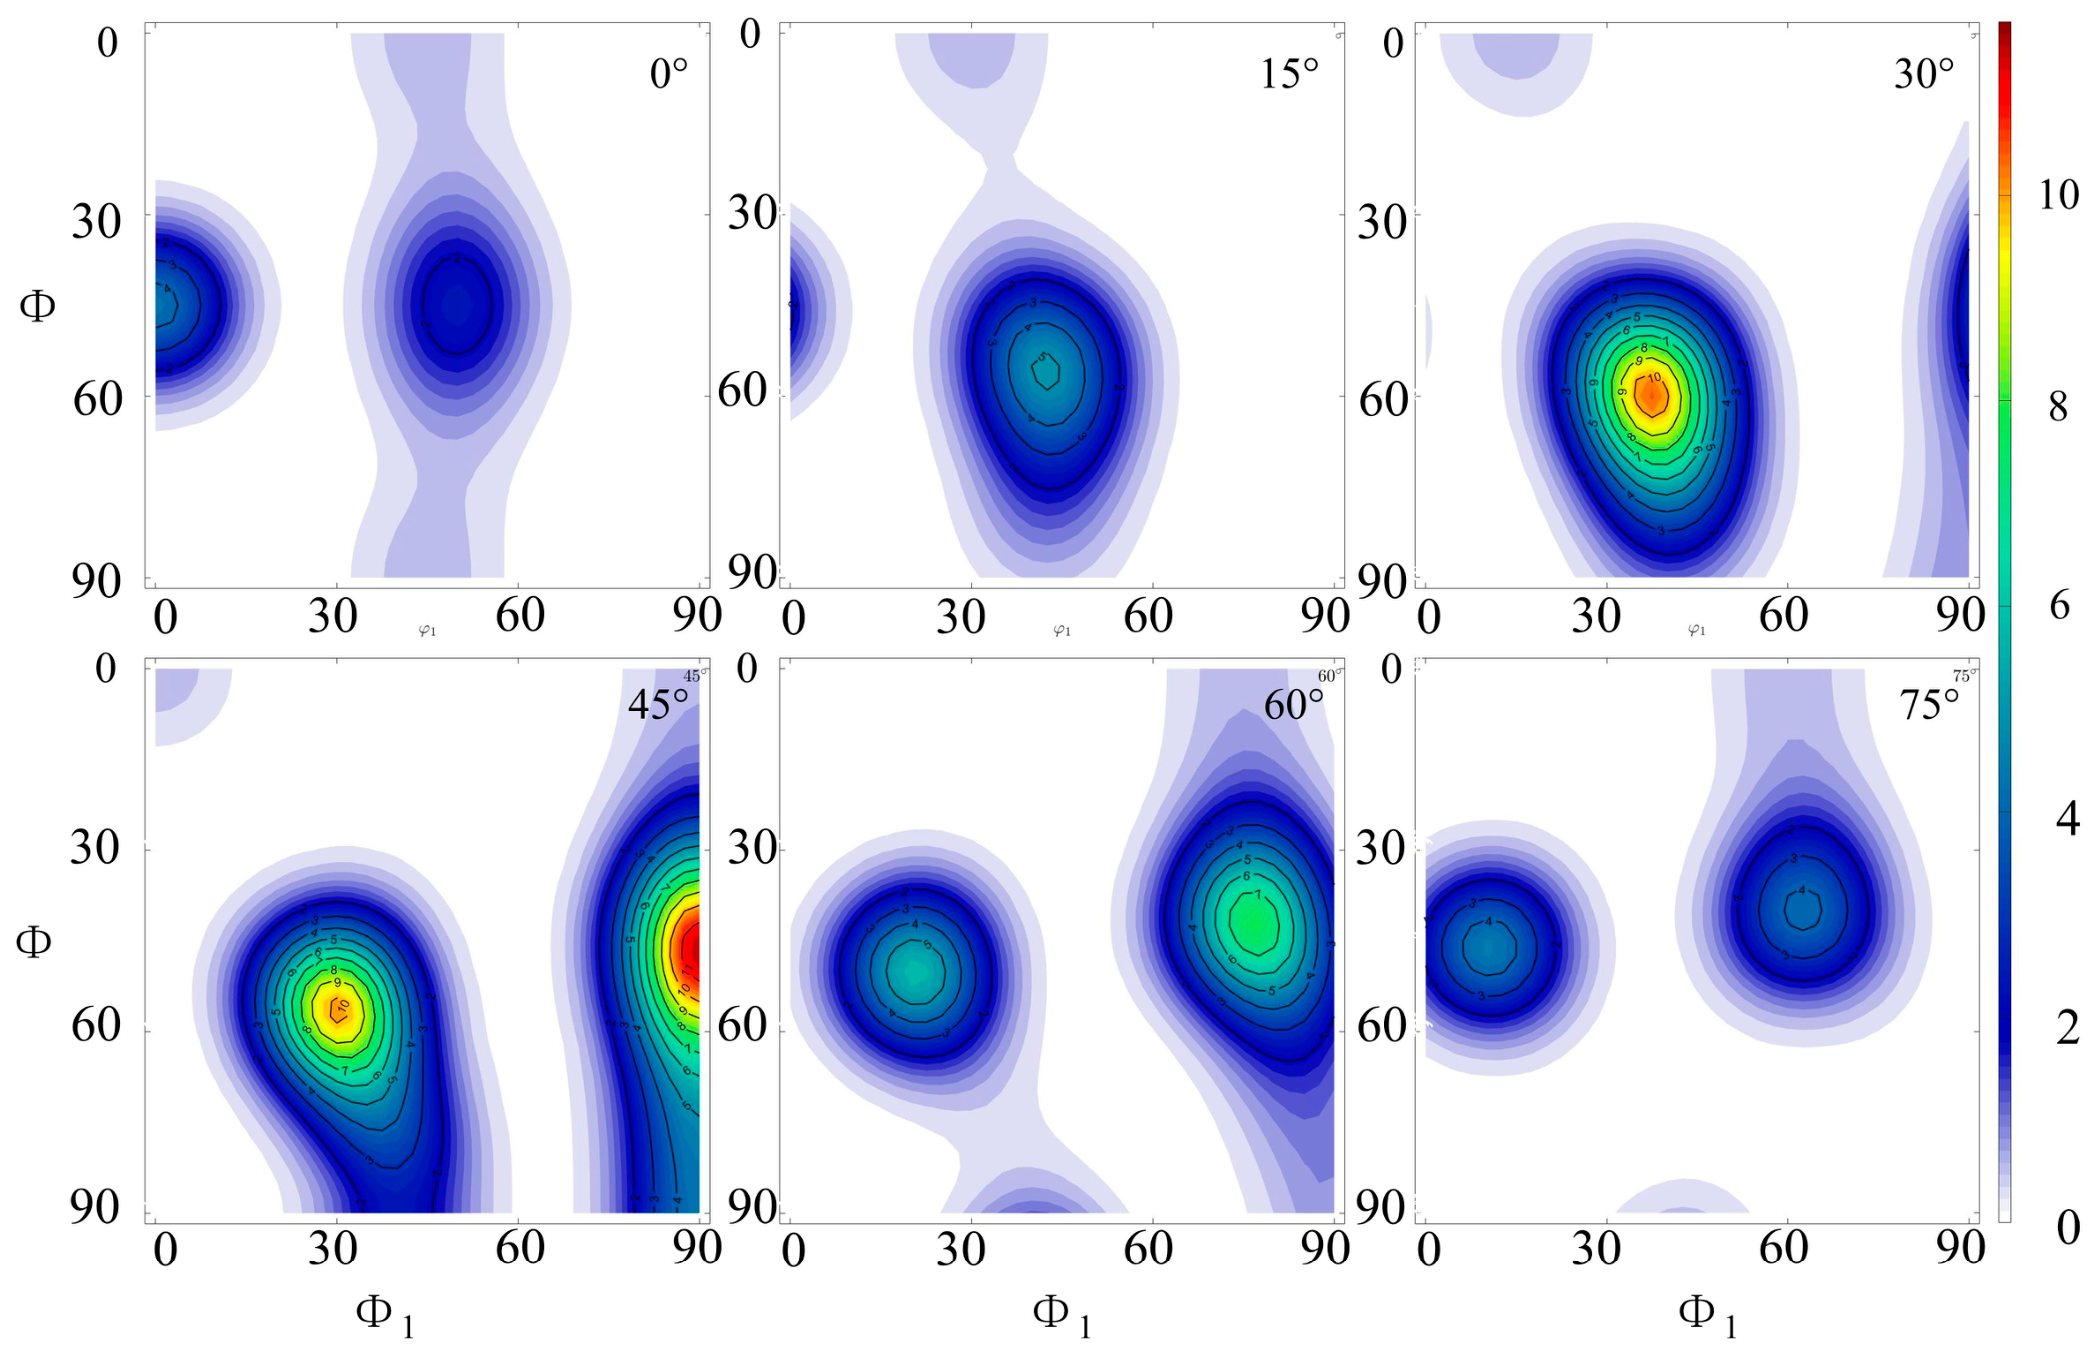
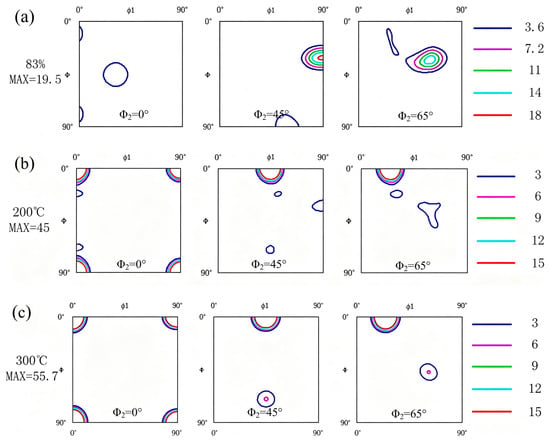
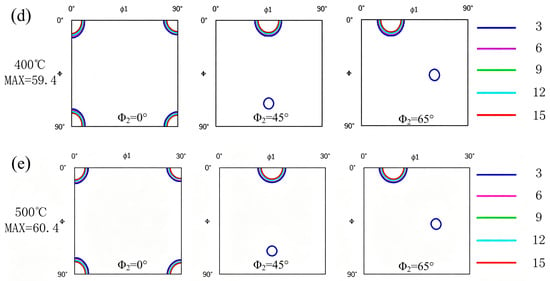
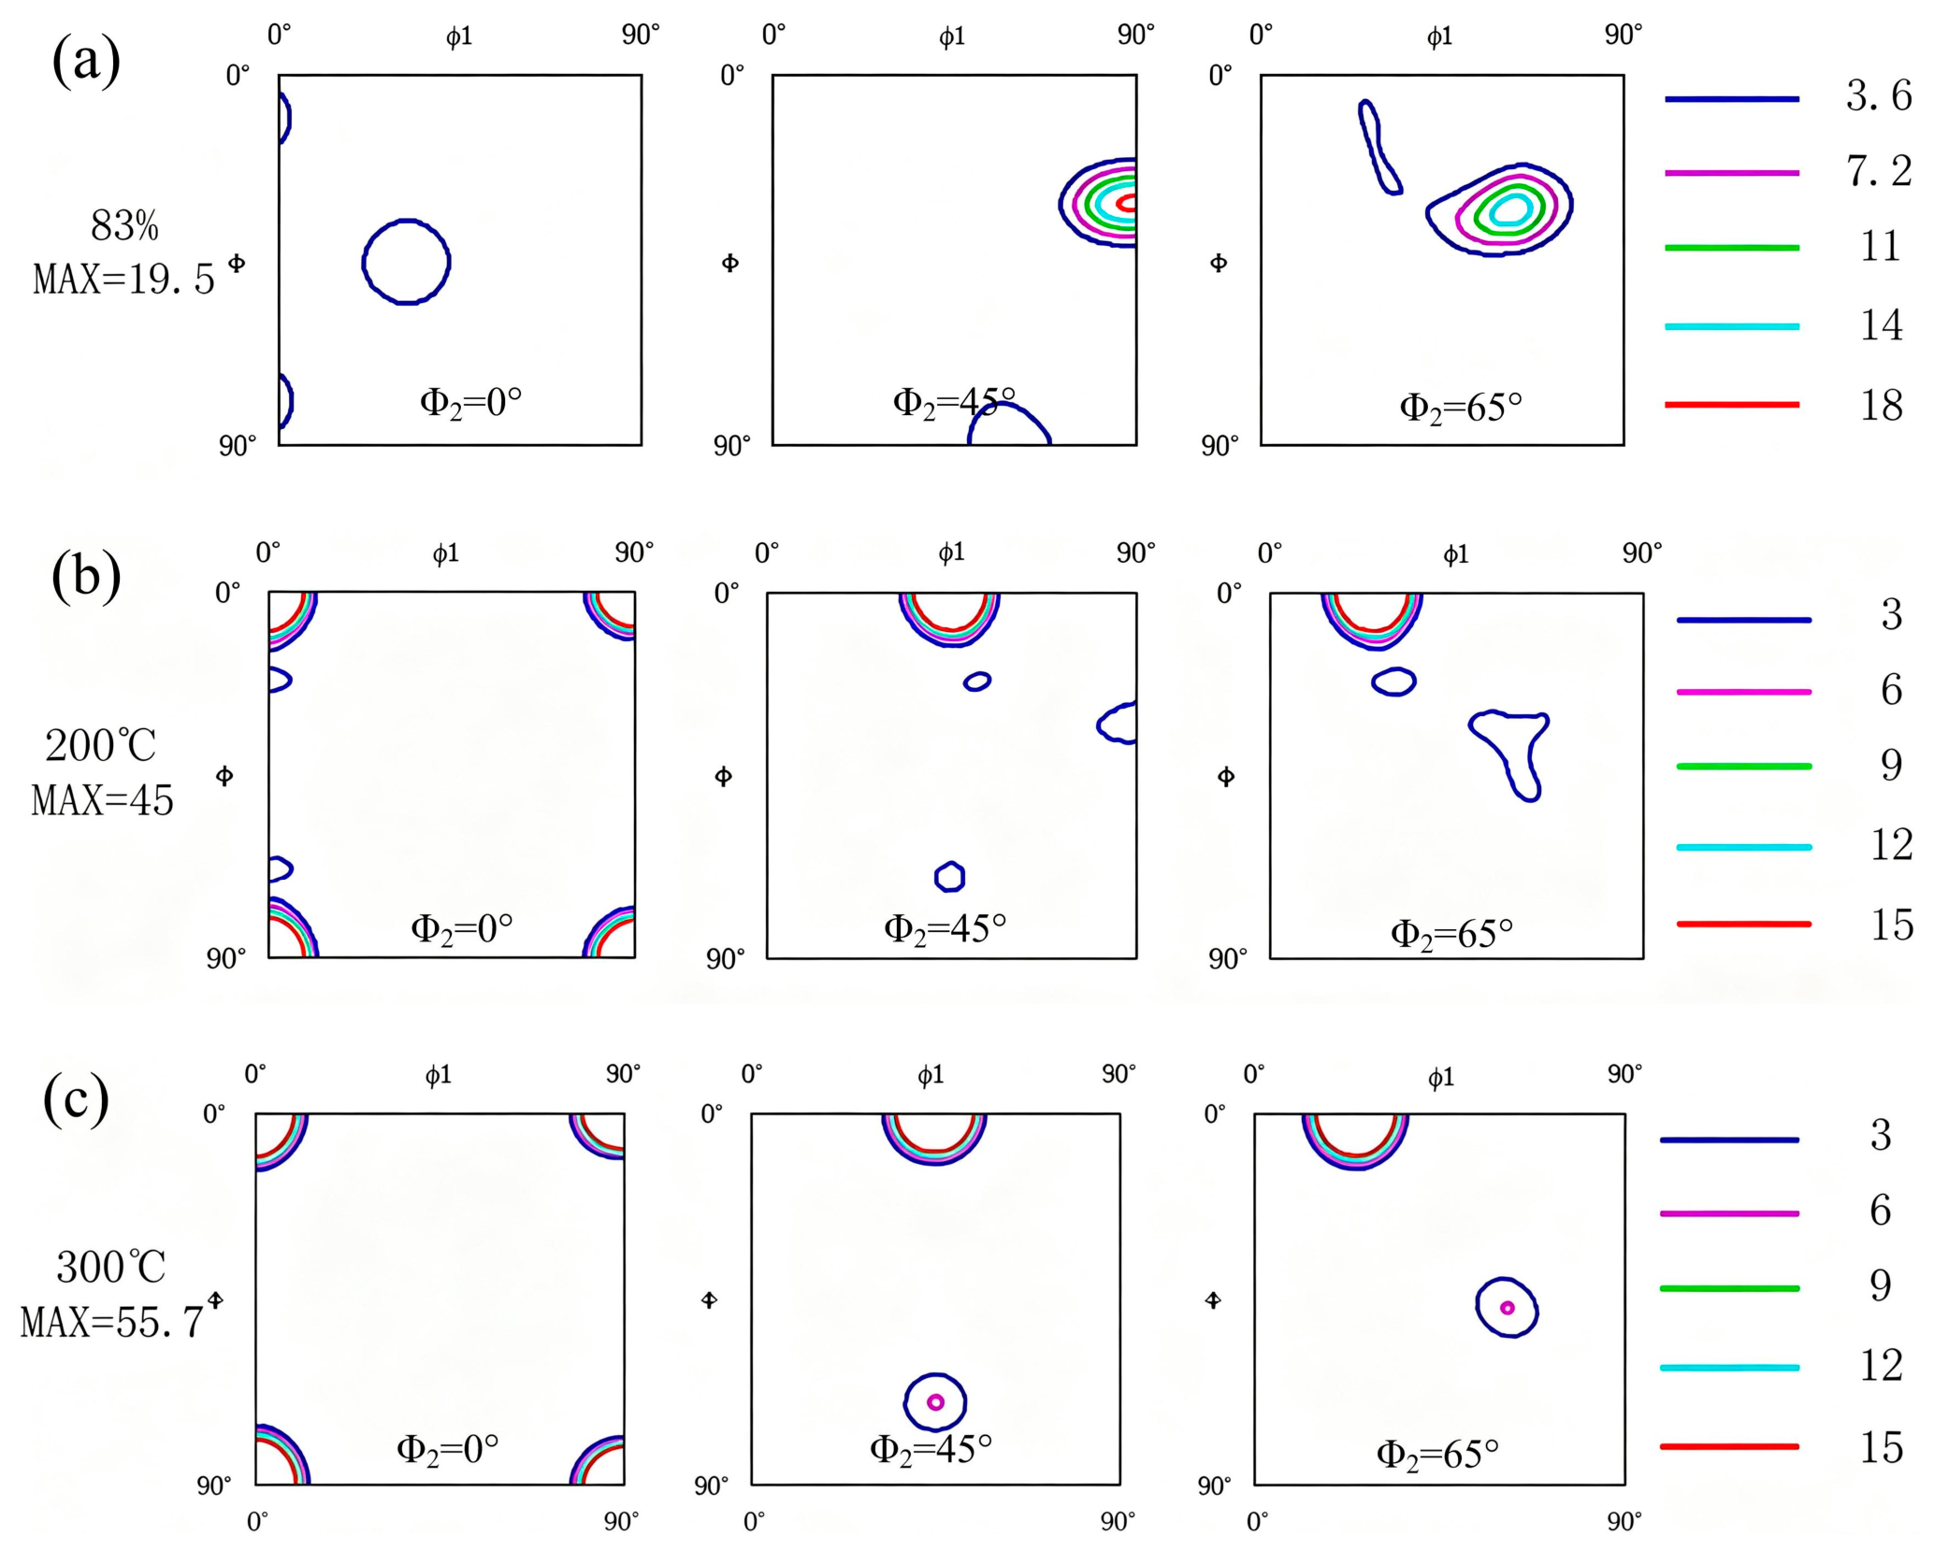
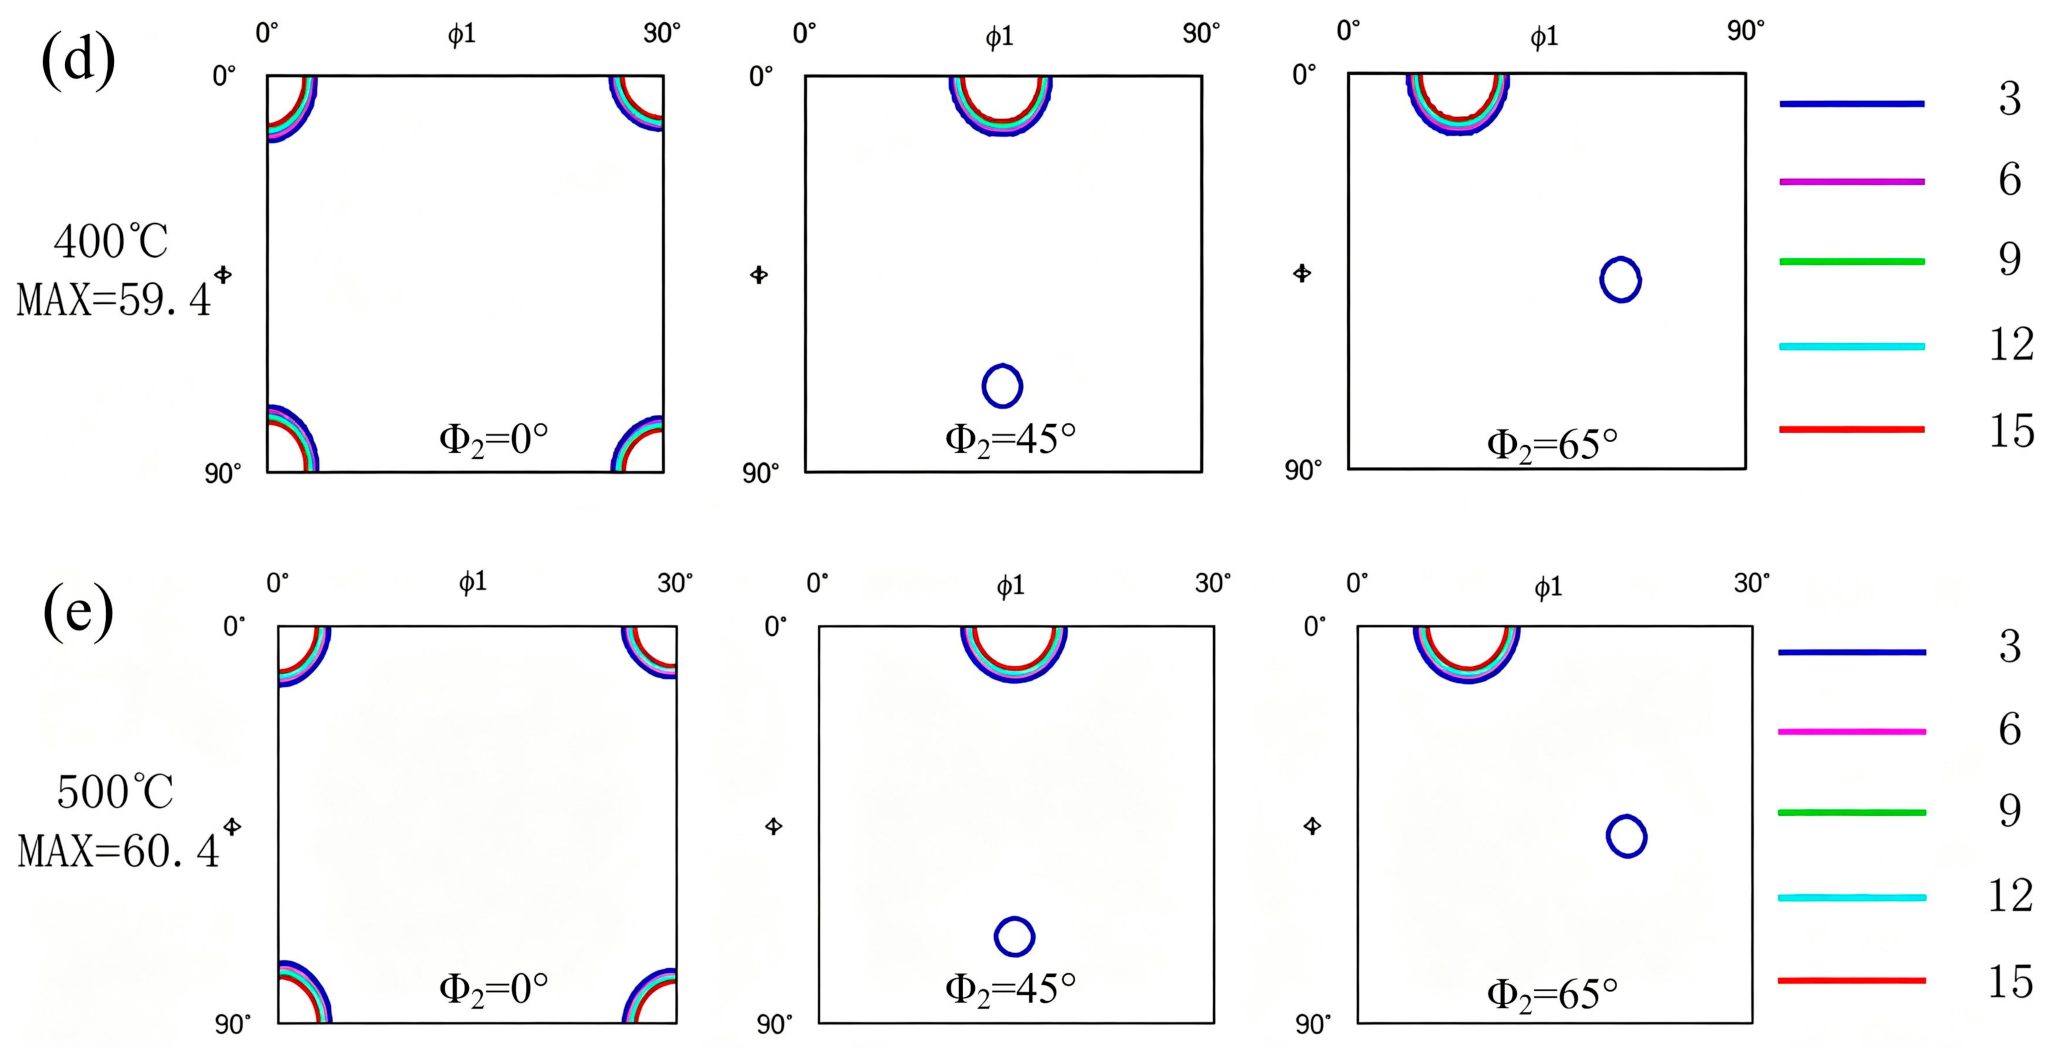
With the application of the annealing process with respect to the cold-rolled T2 copper sheet, the texture intensity induced by severe deformation is significantly weakened, and the recrystallization texture is progressively generated. In accordance with the characterization results, it could be found that the texture component of the studied T2 copper sheet processed by severe deformation followed by annealing treatment at annealing temperature scale ranging from 200 to 500 °C is dominated by Cube texture, and the maximum intensity of Cube texture is increased from ~45.0 to ~60.4 with the annealing temperature increase from 200 °C to 500 °C, as shown in Figure 17b–e, indicating the increase in annealing temperature could promote the formation and enhancement of the Cube texture. The great influence of annealing temperature on the CRO could be understood from the migration of the grain boundary, and the difference in texture component and distribution intensity of CRO involved in the parent microstructure could determine the formation and development of the recrystallization texture [35]. Based on the results mentioned above, it could be known that the severe rolling deformation is conducive to the formation of deformation texture including Cube texture and S texture with respect to the T2 copper sheet, and the texture component is prone to transform from the deformation texture to the Cube texture under further application of annealing treatment. Ultimately, the Cube texture emerges as the strongest and dominant texture in the studied copper sheet.
Figure 17.
ODF diagram of T2 copper sheet corresponding to different deformation and annealing processes.
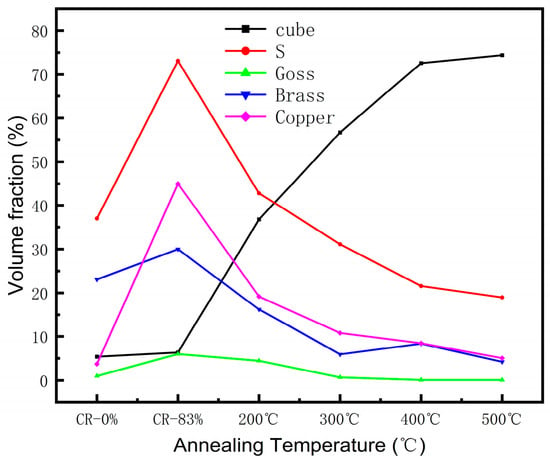
Figure 18 further quantitatively gives the distribution of volume fraction corresponding to the predominant texture components obtained under different deformation and heat-treatment processes. A comparison reveals that the volume fraction of the Cube texture is significantly enhanced with the increase in annealing temperature, accompanying by first increases and then decreases for the other texture components including S, Goss texture, Brass texture as well as Copper texture, and there is a quantitative correspondence between the volume fractions of the different predominant textures and the annealing temperature, indicating the distribution intensity of Cube texture could be well regulated by varying annealing treatment parameters.
Figure 18.
Variation in texture volume fraction corresponding to different textures with respect to studied T2 copper sheet processed under different deformation and heat-treatment processes.
In summary, the variation in disciplines of mechanical and physical properties, including yield strength, tensile strength and electrical conductivity, is closely related to the selection of annealing temperatures after severe cold rolling with respect to the studied T2 copper sheet, which could be further understood from the variation behavior related to the recrystallization behavior of the copper sheet. For the mechanical properties, both the yield strength and tensile strength are obviously decreased with the annealing temperature increasing from 200 °C to 500 °C due to the increase in recrystallization degree and obvious decrease in dislocation density. On the contrary, the electrical conductivity of the studied T2 copper sheet is increased with the increase in recrystallization degree due to the obvious decrease in various crystal defects, including the point and line defects, with the annealing temperature increasing from 200 °C to 500 °C. A good combination of electrical conductivity of ~97.1% IACS together with yield strength of 51.5 MPa and tensile strength of 120.1 MPa could be achieved with respect to the studied T2 copper sheet by choosing the severe cold-rolling process with deformation amount of 83%, followed by annealing at a temperature of 400 °C. Meanwhile, the microstructure evolution of microstructure could also be understood from the perspective of CRO, where the progress of recrystallization with the increase in annealing temperature is accompanied by the formation and development of Cube texture. It could be concluded that the variation in mechanical and physical properties with respect to the studied T2 copper sheet processed by severe deformation followed by different annealing temperatures is attributed to the microstructure evolution behavior, including the recrystallized grains and texture component induced by the recrystallization mechanism. The investigation in this study is expected to provide an experimental and theoretical basis for optimizing processing methods and parameters to fully exploit the excellent comprehensive properties with respect to the studied T2 copper sheet.
5. Conclusions
- (a)
- Under severe cold rolling with a deformation amount of 83% followed by annealing treatment ranging from 200 to 500 °C, the yield strength and tensile strength are decreased from ~122.9 MPa to ~39.4 MPa and from ~158.5 MPa to ~111.6 MPa with the annealing temperature increased from 200 °C to 500 °C, respectively. Meanwhile, the electrical conductivity increased from ~94.1% IACS to ~98.2% IACS with the annealing temperature increased from 200 °C to 500 °C.
- (b)
- The texture of the studied T2 copper sheet processed by the cold-rolling process with a deformation amount of 83% is characterized by deformation texture including copper texture and S texture. After annealing treatment, the texture component is dominated by Cube texture, and the maximum intensity value of Cube texture is increased from ~45.0 to ~60.4 with the annealing temperature increase from 200 °C to 500 °C.
- (c)
- The coupling activation of the {111}<110> slipping mechanism together with the {111}<112> twinning mechanism is the predominant deformation mechanism with respect to the studied T2 copper sheet during cold rolling. When the true strain is below ~0.32, the coupling activation of the slipping mechanism and twinning mechanism plays a dominant role, and the deformation is mainly dominated by the {111}<112> twinning mechanism when the true strain is increased above ~0.32 with respect to the studied T2 copper sheet.
- (d)
- To achieve the regulation of target mechanical properties, electrical conductivity and Cube texture intensity with respect to the T2 copper sheet, a severe deformation with a deformation amount of up to 83% together with an annealing temperature ranging from 200 to 500 °C could be attempted.
Author Contributions
Conceptualization, W.H. (Wenli Hu) and F.J.; methodology, J.Z., Y.H., and Z.Z.; software, Z.L.; validation, F.J., W.H. (Wenli Hu) and Z.Z.; formal analysis, Y.H.; investigation, Y.H., J.Z., and Z.L.; data curation, J.Z. and Y.H.; writing—original draft preparation, J.Z. and Y.H.; writing—review and editing, F.J., W.H. (Wenli Hu), and W.H. (Wenwu He); visualization, Z.L. and Z.Z.; supervision, F.J., W.H. (Wenli Hu), and W.H. (Wenwu He); funding acquisition, J.Z., W.H. (Wenli Hu), and W.H. (Wenwu He). All authors have read and agreed to the published version of the manuscript.
Funding
This research was funded by the National Natural Science Foundation of China (No. 52304409), Taiyuan University of Science and Technology Academic Practice Innovation Project (No. SJ2025003) and the National Key Research and Development Program of China (No. 2023YFB3405404).
Data Availability Statement
The original contributions presented in this study are included in the article. Further inquiries could be directed to the corresponding author.
Conflicts of Interest
Author Zongyan Zou was employed by the Shanxi North Jindong Chemical Industry Co., Ltd. And author Fei Ji was employed by the Jinxi Axle Co., Ltd. The remaining authors declare that the research was conducted in the absence of any commercial or financial relationships that could be construed as a potential conflict of interest.
References
- Qin, J.; Li, X.; Wang, D.; Zhou, C.; Hu, T.; Wang, J.; Yang, Y.; Hu, Y. Microstructure and Texture Evolution in Cold-Rolled and Annealed Oxygen-Free Copper Sheets. Materials 2024, 17, 2202. [Google Scholar] [CrossRef] [Scilit] [PubMed]
- Geng, Y.; Ban, Y.; Wang, B.; Li, X.; Song, K.; Zhang, Y.; Jia, Y.; Tian, B.; Liu, Y.; Volinsky, A.A. A review of microstructure and texture evolution with nanoscale precipitates for copper alloys. J. Mater. Res. Technol. 2020, 9, 11918–11934. [Google Scholar] [CrossRef] [Scilit]
- Zhang, X.H.; Zhang, Y.; Tian, B.H.; Song, K.X.; Liu, P.; Jia, Y.L.; Chen, X.H.; An, J.C.; Zhao, Z.; Liu, Y.; et al. Review of nano-phase effects in high strength and conductivity copper alloys. Nanotechnol. Rev. 2019, 8, 383–395. [Google Scholar] [CrossRef] [Scilit]
- Inoue, H. Simultaneous Prediction of Bendability and Deep Drawability Based on Orientation Distribution Function for Polycrystalline Cubic Metal Sheets. Mater. Sci. Forum 2018, 941, 1468–1473. [Google Scholar] [CrossRef] [Scilit]
- Engler, O.; Zaefferer, S.; Randle, V. Introduction to Texture Analysis: Macrotexture, Microtexture, and Orientation Mapping, 3rd ed.; CRC Press: Boca Raton, FL, USA, 2024. [Google Scholar]
- Jing, Q.; Chen, Z.; Dongsheng, W.; Xun, L.; Tongsheng, H.; JingWen, W.; Youwen, Y. Effects of microstructure and texture on the deep drawability of C10200 copper sheets. J. Mater. Res. Technol. 2023, 25, 773–785. [Google Scholar] [CrossRef] [Scilit]
- Zhu, Y.Q.; Yu, Q.; Peng, L.J.; Mi, X.J.; Xie, H.F.; Li, J.B.; Li, Z.D.; Cao, Y.C. Microstructure and properties evolution of a Cu-Ni-P alloy with high strength and high conductivity during thermomechanical treatment. Mater. Sci. Eng. A 2024, 893, 146098. [Google Scholar] [CrossRef] [Scilit]
- Wang, J.B.; Zhang, Y.X.; Wu, T.M.; Wang, Y.; Fang, F.; Wang, G.D. Effects of single/double stage cold rolling and aging treatment on the α-Fe phase, microstructure, and properties of Cu-12Fe-0.42Si-0.008B alloy. J. Mater. Res. Technol. 2024, 33, 9552–9565. [Google Scholar] [CrossRef] [Scilit]
- Shan, Y.Q.; Zhang, Y.M.; Zhang, C.M.; Feng, J.; Huang, B.H.; Zhao, S.H.; Song, K.X. Study on the microstructure evolution and strengthening mechanism of Cu-Ni-Si alloy after two-stage rolling and aging. Mater. Des. 2025, 254, 113935. [Google Scholar] [CrossRef] [Scilit]
- Shan, Y.Q.; Zhang, C.M.; Zhang, Y.M.; Feng, J.; Zhao, S.H.; Huang, B.H.; Song, K.X.; Zhou, Y.J. Influence of different rolling passes and deformation amounts on the microstructure evolution and strengthening mechanism of Cu-Ni-Si alloy. J. Mater. Res. Technol. 2024, 33, 3205–3220. [Google Scholar] [CrossRef] [Scilit]
- Zhao, Z.; Xiao, Z.; Li, Z.; Qiu, W.; Jiang, H.; Lei, Q.; Liu, Z.; Jiang, Y.; Zhang, S. Microstructure and properties of a Cu–Ni–Si–Co–Cr alloy with high strength and high conductivity. Mater. Sci. Eng. A 2019, 759, 396–403. [Google Scholar] [CrossRef] [Scilit]
- Zheng, Z.S.; Guo, P.S.; Li, J.G.; Yang, T.S.; Song, Z.L.; Xu, C.; Zhou, M.J. Effect of cold rolling on microstructure and mechanical properties of a Cu-Zn-Sn-Ni-Co-Si alloy for interconnecting devices. J. Alloys Compd. 2020, 831, 154842. [Google Scholar] [CrossRef] [Scilit]
- Gong, L.; Huang, Y.; Han, Z.; Song, S.; Feng, H.; Chen, Z.; Liu, X.; Huang, W. Texture evolution and strengthening mechanism of CuCrZr alloys during cold rolling. Vacuum 2024, 221, 112908. [Google Scholar] [CrossRef] [Scilit]
- Yang, H.R.; Fan, Y.C.; Zhou, J.H.; Shi, B.B.; Chen, J.F.; Lin, N.; Wang, C.; Xiao, L. Simultaneous enhancement of mechanical properties and electrical conductivity in Cu-Ni-Si alloy by constrained groove pressing and aging treatments. Mater. Sci. Eng. A 2025, 938, 148465. [Google Scholar] [CrossRef] [Scilit]
- Zhao, Z.L.; Li, Z.; Wang, Z.X.; Xiao, Z. Effect of equal channel angular pressing on microstructure and mechanical properties of a Cu-Cr-Ni-Si-Co alloy. Mater. Sci. Eng. A 2024, 916, 147356. [Google Scholar] [CrossRef] [Scilit]
- Qiu, W.T.; Zheng, L.Y.; Wang, Q.R.; Li, X.J.; Chao, G.H.; Xiang, Y.L.; Wang, Y.R.; Gong, S.; Li, Z. Microstructure evolution and mechanical properties of high strength and high conductivity Cu-Fe alloy wire prepared by cold drawing. Mater. Charact. 2024, 210, 115961. [Google Scholar] [CrossRef] [Scilit]
- Xu, Z.H.; Shi, H.L.; Liu, S.Y.; Li, X.J.; Gan, W.M.; Hu, X.S.; Fan, G.H.; Wang, X.J. Effect of aging temperature on microstructure and properties of cold-rolled Cu-Ni-Si alloy. Mater. Today Commun. 2024, 40, 113781. [Google Scholar] [CrossRef] [Scilit]
- Sakai, T.; Belyakov, A.; Kaibyshev, R.; Miura, H.; Jonas, J.J. Dynamic and post-dynamic recrystallization under hot, cold and severe plastic deformation conditions. Prog. Mater. Sci. 2014, 60, 130–207. [Google Scholar] [CrossRef] [Scilit]
- Li, Z.; Zhang, J.; Liu, S.; Hao, J.; Liu, L.; He, Y.; Zhang, H.; Jiao, X.; Zhang, X.; Wu, R. Microstructure evolution of extruded Mg-RE-Ag alloy during short-time heat treatment. J. Rare Earth 2024, 42, 2350–2361. [Google Scholar] [CrossRef] [Scilit]
- Hua, Y.X.; Liu, H.T.; Song, K.X.; Wang, J.W.; Guo, Y.G.; Tian, J.; Guo, H.W. Effect of cerium on microstructure, texture and properties of ultrahigh-purity copper. J. Rare Earth 2024, 42, 220–227. [Google Scholar] [CrossRef] [Scilit]
- Li, X.; Zhou, Y.J.; Liu, Y.H.; Li, S.L.; Song, K.X.; Feng, C.L.; Wu, B.A.; Zhang, P.F.; Wu, H.J.; Gu, J.H.; et al. Texture evolution and its influence mechanism on properties of single crystal copper and polycrystalline copper during cumulative deformation. J. Mater. Res. Technol. 2023, 24, 6808–6819. [Google Scholar] [CrossRef] [Scilit]
- Trzepiecin, T.; Szwajka, K.; Szewczyk, M. Pressure-Assisted Lubrication of DC01 Steel Sheets to Reduce Friction in Sheet-Metal-Forming Processes. Lubricants 2023, 11, 169. [Google Scholar] [CrossRef] [Scilit]
- GB/T 34505-2017; Copper and Copper Alloy Materials-Tensile Testing at Room Temperature. The State Quality Supervision, Inspection and Quarantine Administration of the People’s Republic of China: Beijing, China, 2017; pp. 1–35.
- Wang, S.W.; Song, H.W.; Chen, Y.; Yu, Q.; Zhang, S.H. Evolution of Goss texture in thin-walled copper tube at different heat treatment temperatures. Trans. Nonferrous Met. Soc. China 2022, 32, 1205–1216. [Google Scholar] [CrossRef] [Scilit]
- Field, D.P.; Bradford, L.T.; Nowell, M.M.; Lillo, T.M. The role of annealing twins during recrystallization of Cu. Acta Mater. 2007, 55, 4233–4241. [Google Scholar] [CrossRef] [Scilit]
- Ban, Y.J.; Geng, Y.F.; Hou, J.R.; Zhang, Y.; Zhou, M.; Jia, Y.L.; Tian, B.H.; Liu, Y.; Li, X.; Volinsky, A.A. Properties and precipitates of the high strength and electrical conductivity Cu-Ni-Co-Si-Cr alloy. J. Mater. Sci. Technol. 2021, 93, 1–6. [Google Scholar] [CrossRef] [Scilit]
- Jayakumar, P.K.; Balasubramanian, K.; Tagore, G.R. Recrystallisation and bonding behaviour of ultra fine grained copper and Cu–Cr–Zr alloy using ECAP. Mater. Sci. Eng. A 2012, 538, 7–13. [Google Scholar] [CrossRef] [Scilit]
- Liu, Y.H.; Zhou, Y.J.; Lu, C.J.; Gan, K.K.; Du, Y.B.; Liu, A.K.; Meng, F.J.; Liu, G.W.; Gong, Y.Z.; Song, K.X.; et al. Nano-precipitates evolution and properties improvement mechanism of Cu-Zn-Ni-Si-X alloy strip based on multi-element microalloying and thermomechanical treatment. J. Mater. Res. Technol. 2023, 25, 107–119. [Google Scholar] [CrossRef] [Scilit]
- Raabe, D. Computational Materials Science: The Simulation of Materials Microstructures and Properties; WILEY-VCH Verlag GmbH: Weinheim, Germany, 1998. [Google Scholar]
- Lebensohn, R.A.; Tome, C.N.; Maudlin, P.J. A self consistent formulation for the prediction of the anisotropic behaivor of viscoplastic polycrystals with voids. J. Mech. Phys. Solids 2004, 52, 249–278. [Google Scholar]
- Wang, H.; Wu, P.D.; Tome, C.N.; Huang, Y. Evaluation of self-consistent polycrystal plasticity models for magnesium alloy AZ31B sheet. J. Mech. Phys. Solids 2010, 58, 594–612. [Google Scholar]
- Jia, N.; Peng, R.; Wang, Y.; Chai, G.; Johansson, S.; Wang, G.; Liaw, P. Interactions between the phase stress and the grain-orientation-dependent stress in duplex stainless steel during deformation. Acta Mater. 2006, 54, 3907–3916. [Google Scholar] [CrossRef] [Scilit]
- Molinari, A.; Canova, G.R.; Ahzi, S. A self-consistent approach of the large deformation polycrystal viscoplasticity. Acta Metall. 1987, 35, 2983–2994. [Google Scholar] [CrossRef] [Scilit]
- Dyakonov, G.S.; Mironov, S.; Semenova, I.P.; Valiev, R.Z.; Semiatin, S.L. EBSD analysis of grain-refinement mechanisms operating during equal-channel angular pressing of commercial-purity titanium. Acta Mater. 2019, 173, 174–183. [Google Scholar] [CrossRef] [Scilit]
- Kikuchi, S.; Kimura, E.; Koiwa, M. Deformation and recrystallization textures of copper single crystals and bicrystals. J. Mater. Sci. 1992, 27, 4927–4934. [Google Scholar] [CrossRef] [Scilit]

Disclaimer/Publisher’s Note: The statements, opinions and data contained in all publications are solely those of the individual author(s) and contributor(s) and not of MDPI and/or the editor(s). MDPI and/or the editor(s) disclaim responsibility for any injury to people or property resulting from any ideas, methods, instructions or products referred to in the content. |
© 2026 by the authors. Licensee MDPI, Basel, Switzerland. This article is an open access article distributed under the terms and conditions of the Creative Commons Attribution (CC BY) license.