


Abstract
Real-time monitoring of laser welding of metal–polymer joints is essential for modern automated production, and effective online quality characterization is critically required for industrial deployment. In this exploratory laboratory study, in-process optoelectronic signals were acquired to capture the laser welding process of steel–polymethyl methacrylate (PMMA) joints. With fixed experimental parameters, four typical welding states (i.e., weak welding, sound welding, discoloration, and carbonization) and their corresponding optoelectronic signal datasets were obtained, and all signal analyses were performed via offline post-processing of the recorded data. On this basis, the time–domain characteristics of optoelectronic signals under different welding conditions were analyzed, followed by systematic frequency–domain analysis. The frequency–domain spectrum and spectral energy within the visible light band of 750–800 Hz were calculated to explore potential feature differences corresponding to various welding states. Observable discrepancies in frequency–domain features were observed among the four laboratory-defined weld categories. This study establishes empirical correlations under controlled laboratory conditions. The results primarily validate the exploratory potential of optoelectronic sensing for welding state characterization in laser-welded metal–polymer joints, while the industrial feasibility and real-time processing performance of the proposed approach remain to be further verified.
1. Introduction
Laser welding represents a high-efficiency, high-precision, and automation-compatible joining technique that features a small heat-affected zone (HAZ), minimal thermal distortion, superior welding quality, and remote operational capability, eliminating the need for additional filler materials [1]. In recent years, the demand for reliable dissimilar joining between metals, polymethyl methacrylate (PMMA), ceramics, and resins has grown continuously. Such demands are driven not only by aerospace applications [2,3] but also by the lightweight, low-cost, and high-precision packaging requirements of automotive components, smartphones, digital cameras, and other consumer electronic devices [4,5,6,7]. Appropriate selection of process parameters facilitates the formation of high-strength welds and promotes atomic-level interfacial bonding at metal–polymer joints. In the manufacturing industry, laser welding of metal–polymer hybrid structures enables effective lightweight design while maintaining favorable mechanical performance, thereby reducing energy consumption and fuel expenditure in service [7,8].
However, laser welding of metal–polymer dissimilar pairs still faces inherent challenges, including insufficient joint strength, unstable weld formation, and poor process repeatability. These issues commonly induce typical welding defects such as lack of fusion [9], bubble (porosity) [10,11], tunnel [12], discoloration [9], and crack [13]. The presence of such defects substantially deteriorates the mechanical integrity of welded components. Although post-weld heat treatment and thermomechanical processing can effectively refine microstructures and restore mechanical performance in metallic welds [14], these conventional post-processing strategies are infeasible for steel–PMMA laser-welded joints due to the significant discrepancy in thermal stability and thermophysical properties between metallic and polymeric materials.
Extensive research has been conducted to mitigate welding defects in dissimilar laser welding. Statistical regression-based optimization methods have been widely adopted; however, their practical improvement effectiveness remains limited [15]. Advanced modified laser welding techniques have also been proposed to suppress defect generation, though their large-scale industrial application is restricted by excessive equipment costs [16]. Accordingly, real-time process monitoring and intelligent quality evaluation strategies are urgently required to support the reliable and stable industrial application of metal–polymer laser welding.
Currently, non-destructive monitoring techniques for laser-welded metal–polymer hybrid joints include K-type thermocouples, infrared cameras, photoelectric sensors, high-speed cameras, optical coherence tomography (OCT), and ultrasonic interferometry. These tools support pre-welding, in-process, and post-welding monitoring for weld inspection and quality control to guarantee stable manufacturing performance. Schricker et al. [17] investigated laser welding of an AA6082 aluminum alloy and a PA66 polymer. A K-type thermocouple was deployed to record temperature–time profiles under varied process parameters. K-type thermocouples are a low-cost solution mainly used to track melt pool temperature. However, their accurate positioning is difficult, which often leads to unreliable temperature measurements. Lambiase and Genna [12] used an infrared camera to acquire thermal data during laser joining of AISI304–Polycarbonate (PC) and analyzed the influences of process parameters on temperature distribution and bonding defect formation. They further identified and optimized the process window to improve the shear strength of AISI304–PC joints. Nevertheless, infrared cameras, which primarily capture thermal distribution within the laser-heated zone, require careful pre-calibration, involve complicated operation workflows, carry high hardware costs, and suffer from relatively low sampling rates. To explore the correlation between bubble formation mechanisms and welding quality, Schricker et al. [18] designed a novel half-section test setup. A high-speed camera was adopted to visualize melt pool dynamics, capturing bubble nucleation within the molten zone during fusion and bubble migration in the cooling stage after welding. Combined with temperature data from finite element simulations, the bubble formation mechanism in the molten region was clarified. High-speed cameras can directly observe the morphological evolution and dynamic behavior of bubbles at metal–polymer interfaces, yet their applicability is restricted to transparent polymers. Furthermore, the recorded raw data are two-dimensional image sequences with large data volume, and feature extraction from these images is computationally intensive, hindering real-time online quality evaluation. To gain a deeper insight into the joining process of polymer–metal interfaces, Schricker et al. [19] utilized Fiber Bragg Gratings (FBGs) to monitor the laser joining process. They evaluated the spectral response signals collected and analyzed the correlation between laser process parameters and the FBG spectral response. Schmitt et al. [20], on the other hand, employed optical coherence tomography (OCT) technology. Relying on coherent optical feedback from hybrid specimens during laser welding, OCT enables identification of joint geometry, voids, defects, and wetting-bonded regions, supporting adaptive closed-loop control for improved joining performance. Ultrasonic non-destructive testing represents another quantitative characterization method. Levesque et al. [21] employed ultrasonic interferometry to inspect the bonding interface of polymer–metal lap joints and explored the relationship between interfacial adhesion and tensile strength. Ultrasonic evaluation has been widely adopted for characterizing adhesive seals in manufacturing and can also assess internal bonding quality of metal–polymer joints. However, this technique demands high flatness in the bonded samples. Laser-welded joints may undergo stress-induced deformation, which degrades measurement accuracy.
In summary, developing robust real-time non-destructive monitoring approaches for metal–polymer laser welding is critical to provide reliable guidance for production quality control and process optimization. The sampling performance and practical limitations of the aforementioned monitoring technologies are summarized below. K-type thermocouples deliver millisecond-scale response but are susceptible to positioning errors. Infrared cameras typically operate at tens to hundreds of Hz with high equipment costs. High-speed cameras offer kHz sampling rates but produce enormous image datasets. FBG, OCT and ultrasonic interferometry each have inherent drawbacks, such as sophisticated system architecture or strict flatness requirements for workpieces.
In contrast, the photoelectric sensor used in this work achieves a 5 kHz sampling rate with fast response and low system cost. It can be compactly integrated onto the laser welding head for in-line signal acquisition. It should be emphasized that the quantitative detection accuracy of this photoelectric sensing approach has not been fully validated in the present study; further evaluation will be performed in future work once classification models and labeled test datasets are established. Therefore, real-time process monitoring and intelligent quality assessment strategies are highly desirable to facilitate reliable industrial deployment of metal–polymer laser welding.
In this work, an optoelectronic sensor (ALPAS-WDD, Diligine, Guangzhou, China) was employed to monitor the laser welding states of steel–PMMA joints. In the context of mass-production laser welding, photoelectric-based monitoring approaches offer promising advantages in terms of low cost and compact integration. Real-time closed-loop feedback control utilizing such sensor signals remains a target for future development. In the present work, all acquired photoelectric signals were stored and processed through offline post-processing routines. Wang et al. [22] developed a controllable laser joining system for titanium–polyethylene terephthalate (PET) hybrid joints. Their work demonstrated that optical radiation signals can be correlated with joint formation to adjust joining parameters. Nevertheless, their signal-related conclusions cannot be directly extrapolated to the current steel–PMMA system, owing to the distinct laser absorption behavior and thermal decomposition characteristics between Ti/304 stainless steel and PET/PMMA. Drawing inspiration from their conceptual sensing framework, the present study investigates optoelectronic signal features specifically for steel–PMMA laser lap joints. Visible-light photodiode sensing has previously been adopted to monitor laser welding processes of metallic components [22,23]. However, for laser joining of metal polymer dissimilar joints, most existing monitoring approaches adopt infrared thermometry, high-speed cameras, FBG or OCT. Comparatively few studies isolate and extract frequency domain features purely from visible light signals to characterize different weld states for steel PMMA lap joints. Accordingly, this work explores the correlations between visible-light spectral features and variations in weld conditions, aiming to provide supplementary monitoring knowledge for laser welding of such hybrid joints.
Prior to introducing the experimental setup, the core research questions and physical hypotheses of this exploratory study are explicitly formulated to clarify the research framework and guide subsequent experiments. Research Question 1: Can distinguishable optoelectronic signal features be identified in response to diverse welding states (i.e., weak weld, sound weld, discolored weld, and carbonized weld) of steel–PMMA laser lap joints? Hypothesis 1: Variations in laser heat input alter melt pool dynamics, vapor plume behavior, and polymer thermal decomposition during welding. These physical changes modulate the in situ optical radiation generated by laser–material interaction, thereby producing distinguishable variations in optoelectronic sensor responses. Research Question 2: Can specific frequency–domain features extracted from visible-light optoelectronic signals effectively differentiate the four typical welding states? Hypothesis 2: Melt pool oscillation and vapor plume fluctuation induced by laser–material interaction generate unique frequency components within the kilohertz range. This study hypothesizes that spectral features in the 700–800 Hz band exhibit distinct amplitude discrepancies across different welding conditions, enabling effective weld state classification.
2. Experimental Details and Monitoring Principle
2.1. Experimental Details
2.1.1. Experimental Equipment
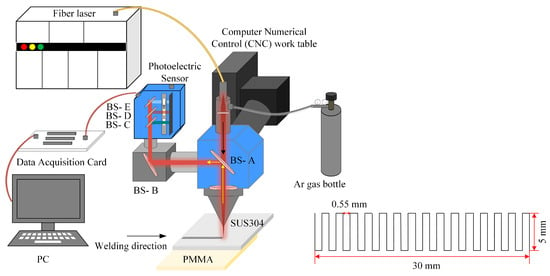
The diagram of welding monitoring and laser scanning trajectory in the laser welding process is shown in Figure 1. The laser welding system utilized in this experiment adopts a MOPA (Master Oscillator Power Amplifier) fiber laser (YDFLP-E2-100-M7-M-R, JPT, Changsha, China), which provides a maximum average power of 100 W, a focused spot diameter of 100 μm, and a central wavelength of 1064 nm. The laser operates in a pulse-modulated quasi-continuous wave (quasi-CW) mode, emitting high-frequency short pulses with a pulse repetition rate of 67 kHz and a pulse duration of 200 ns to achieve the targeted average laser power for dissimilar joining. Coaxial shielding gas is delivered directly to the welding zone through the laser welding head, providing stable and effective protection throughout the welding process. The oscillating scanning trajectory (30 mm length × 5 mm width, 0.55 mm line spacing) was adopted for all welding trials. Preliminary exploratory tests indicated that single-pass welding under the present laser conditions tends to cause excessive local heat input, severe PMMA decomposition and joint delamination. Therefore, this wobble-scanning configuration was used to spread laser energy and reduce local overheating.
Figure 1.
Diagram of welding monitoring and laser scanning trajectory in laser welding process.
A multi-channel optical sensing module integrated on the laser welding head is deployed to acquire in situ optical radiation signals during laser–material interaction. Preliminary tests indicated that the effective signal frequency components could reach approximately 2 kHz. Accordingly, the sensor sampling rate was set to 5 kHz to fully capture both low-frequency and high-frequency signal characteristics without bandwidth omission. The matched data acquisition (DAQ) card (PCI-6515, National Instruments, Austin, TX, USA) is integrated with a built-in hardware anti-aliasing low-pass filter with a cutoff frequency of 2 kHz. All sampled signal data were stored systematically for subsequent in-depth post-processing and feature analysis.
2.1.2. Materials
The materials used were 0.5 mm thick 304 stainless steel and PMMA plastic, which conform to the development trend of integrated neutrino detectors and automotive body structures. The physical and mechanical properties of the PMMA and 304 stainless steel used for hybrid joining are listed in Table 1 [24]. The metallic substrate was a commercial AISI 304 austenitic stainless-steel sheet, whereas the polymer substrate was cast-grade PMMA sheet. The exact commercial grade and supplier records were not retained after the experiments. Median values of the property ranges summarized in Table 1 were used as reference parameters for qualitative thermophysical analysis. Prior to welding, consistent surface preparation was conducted for all specimens. The 304 stainless-steel sheets were wiped with anhydrous ethanol using lint-free wipes to remove grease and fingerprints and then dried with clean compressed air; no mechanical polishing or chemical oxide-removal etching was applied. PMMA sheets were wiped with isopropyl-alcohol-soaked lint-free wipes to clear surface dust and contaminants. All samples were kept under laboratory ambient conditions for full solvent evaporation before clamping and laser welding. No further chemical surface modification was performed. The laser lap welding test was conducted through a pneumatic clamping device, with a clamping force of 0.4 MPa and a lap width of 30 mm.
Table 1.
Physical and mechanical properties of steel and polymethyl methacrylate [24].
The laser welding process parameters are shown in Table 2. Given the small laser spot size and high energy density, a laser trajectory scanning mode was adopted to fabricate steel–PMMA lap joints to achieve reliable joint quality. The defocus distance was set to 0 mm to facilitate optoelectronic signal acquisition during welding. Acceptable lap joints were obtained within an average laser power range of 60–100 W. A constant travel speed of 60 mm/s was maintained throughout all welding trials. Preliminary screening experiments confirmed that this speed provides a suitable process window for steel–PMMA laser joining: lower travel speeds lead to excessive heat accumulation and severe PMMA pyrolysis, while substantially higher speeds result in persistent insufficient interfacial bonding. In the present study, welding speed was kept as a fixed control parameter, and average laser power was selected as the primary independent variable to generate a set of representative weld states, thereby avoiding confounding multi-parameter variations. Further investigations covering different welding speeds will be conducted in future work to verify the generalizability of the observed signal–feature responses.
Table 2.
Laser welding of steel–PMMA joints parameters.
After welding, a universal tensile testing machine (CMT6104, Sansiyongheng, Ningbo, China) was employed to evaluate joint mechanical strength. Flat hard-rubber gaskets were affixed to both sides of each specimen prior to tensile clamping to reduce stress concentration near the gripping jaws. Each gasket had a thickness of 0.5 mm, width of 5 mm and length of 10 mm. Identical gasket material and dimensions were used for all tested samples to ensure consistent clamping conditions. No dedicated calibration test was performed to quantify the exact magnitude of stress-concentration reduction; this is a conventional practical configuration intended to prevent premature fracture near clamping jaws. Tensile tests were then conducted on these samples at a constant speed of 1 mm/min under room temperature conditions, with weld strength determined by the maximum breaking force recorded.
2.1.3. Monitoring Principle
In this study, the adopted photoelectric sensor converts optical radiation generated during laser welding into measurable electrical signals for subsequent signal acquisition and analysis. The multi-spectral monitoring sensor (ALPAS-WDD, Diligine, Guangzhou, China) adopts a custom-integrated multi-channel photodetector array composed of silicon and InGaAs photodiodes. Exact detector part numbers and component-level responsivity (A/W) values are proprietary and not released by the manufacturer. The publicly specified system-level spectral coverage is 400–1800 nm, covering plasma ultraviolet–visible (UV-VIS) emission, the 1064 nm reflected-laser signal, and infrared thermal radiation from the melt pool. The practical acquisition dynamic range is determined by the combined performance of the analog amplifier and on-board analog-to-digital converter (ADC). The amplifier gain can be adjusted via the vendor’s graphical user interface within the welding defect detection software (ALPAS-WDD V1.0) and tuned according to welding conditions; discrete gain values in decibels (dBs) are not publicly available. All raw acquired signals are saved as relative voltage outputs in arbitrary units (a.u), without conversion to absolute radiometric quantities.
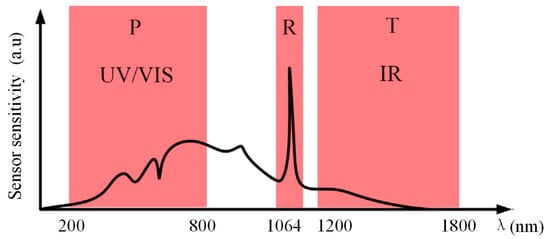
The optical measurement workflow is described below. First, the optoelectronic sensor captures welding-generated optical radiation via beam splitter A (BS-A) and beam splitter B (BS-B). Next, custom coatings on beam splitters C, D and E (BS-C, BS-D, BS-E) enable spectral separation across distinct wavelength bands [25], as illustrated in Figure 2. In this setup, P denotes the plasma spectral band originating from welding plume-plasma emission; R denotes the reflected-laser band; T denotes the molten-pool thermal spectral band. The curve represents the relative sensor sensitivity across wavelength. Beam splitters BS-C, BS-D and BS-E are coated with custom multilayer dichroic thin films with nominal cut-off wavelengths of 800 nm and 1200 nm. For each target pass-band (200–800 nm, 1064 nm, 1200–1800 nm), the average transmittance exceeds 90%, while stop-band reflectance is higher than 95% to suppress spectral crosstalk.
Figure 2.
Schematic of wavebands of three types of radiation signals. Adapted with permission from ref. [25]. Copyright 2011 Optics and Lasers in Engineering.
Before welding tests, spectral-channel validation was carried out by illuminating each channel with monochromatic calibration light spanning 200–1800 nm, confirming that each detector only responds to its assigned wavelength range. Dark-offset baseline calibration and noise-floor characterization were also completed. With the laser switched off and in the absence of welding plasma or melt-pool radiation, baseline raw outputs of each spectral channel were recorded to eliminate static DC offsets induced by detector dark current and stray-light interference. Continuous 10 s idle-state time-series data were collected to determine the RMS-based system noise floor for each channel. Subsequent signal processing and frequency–domain analysis were performed on offset-subtracted data. Absolute radiometric calibration converting sensor arbitrary-unit outputs to optical power was not performed, as this study concentrates on relative signal fluctuations and comparative feature differences across weld states. The separated optical signals are directed to their respective photosensitive elements and converted into electrical outputs. These electrical signals are routed via cables to the data acquisition card and conditioned by a DAQ controller. The conditioned signals are then transmitted to a personal computer (PC). Signal processing, analysis and visualization of monitoring results are implemented on the PC using the ALPAS-WDD laser welding inspection software.
3. Results and Discussions
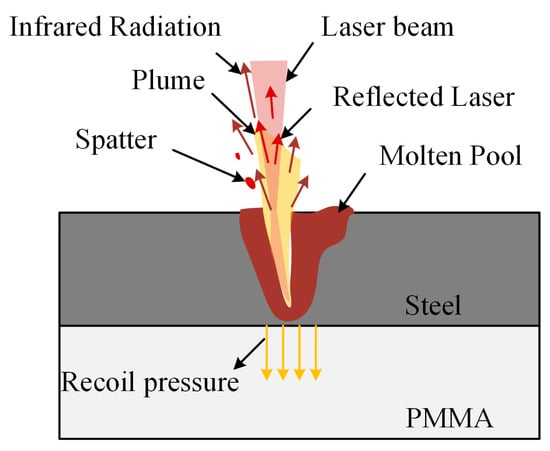
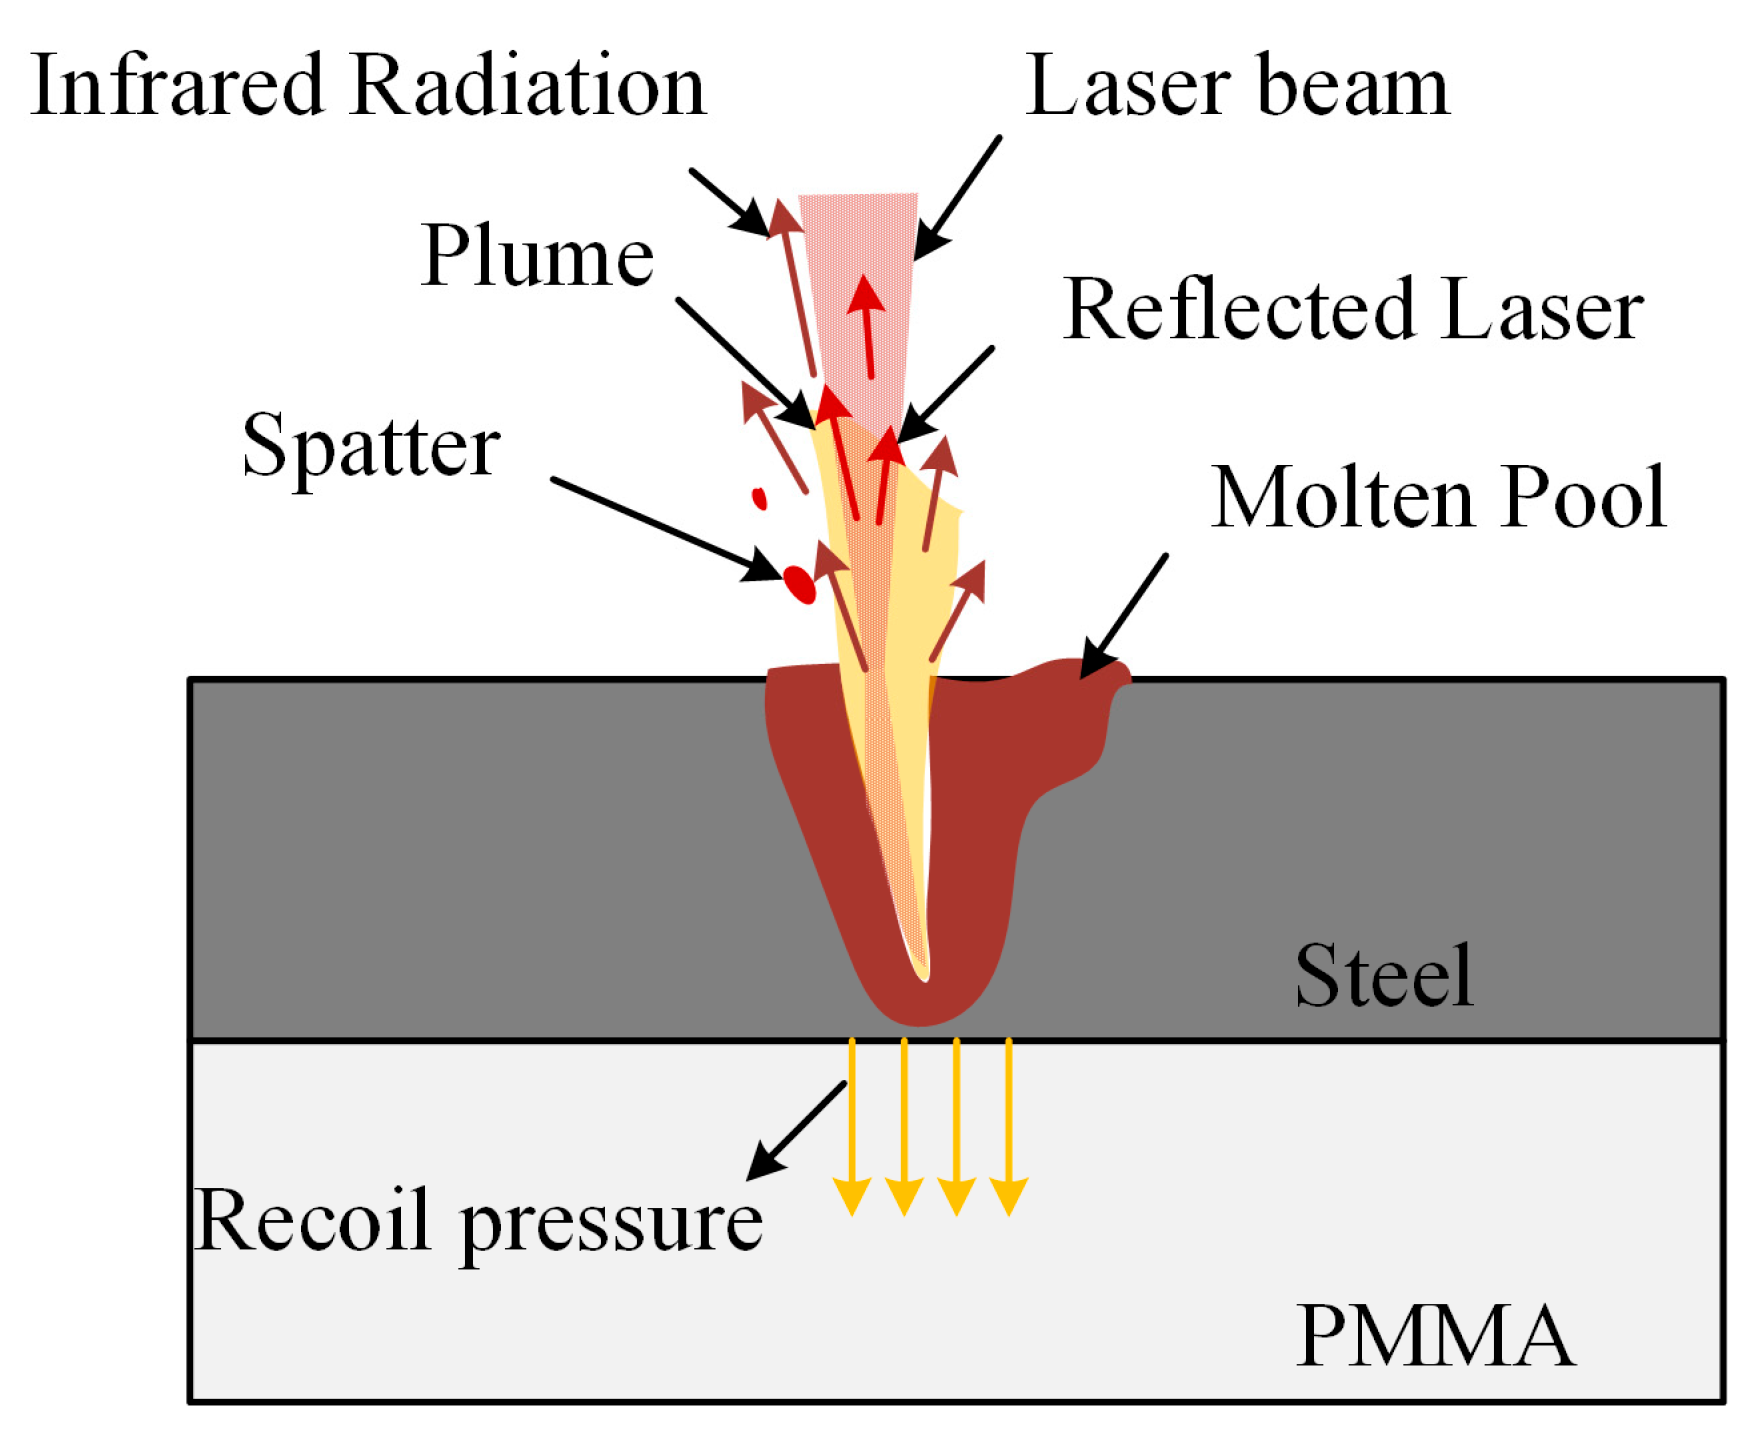
The fundamental principle of laser welding for steel–PMMA lap joints and the associated process mechanism are illustrated in Figure 3. In this process, the steel side absorbs laser radiation and generates heat to form a melt pool via conductive heat transfer. As the heat input increases and the temperature exceeds the boiling point of the steel side, vaporization-induced recoil pressure within the melt pool depresses the liquid surface and eventually creates a keyhole [15]. During the laser welding process of steel–PMMA lap joints, the interaction between the laser and the material primarily occurs on the SUS304 metal side. The degree of thermal decomposition and melting of the PMMA polymer depends on the amount of thermal radiation it absorbs from the steel side. Throughout the laser welding process, any variations in the states of the melt pool exert a direct influence on the modifications of the photoelectric signals [25]. Therefore, the quality of steel and PMMA lap joints can be indirectly assessed by monitoring changes in the photoelectric information of the steel side melt pool.
Figure 3.
Principle and process of laser welding steel and PMMA lap joints.
3.1. Analysis of Joint Morphology and Mechanical Strength
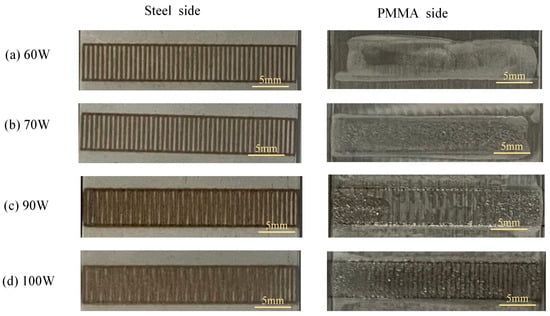
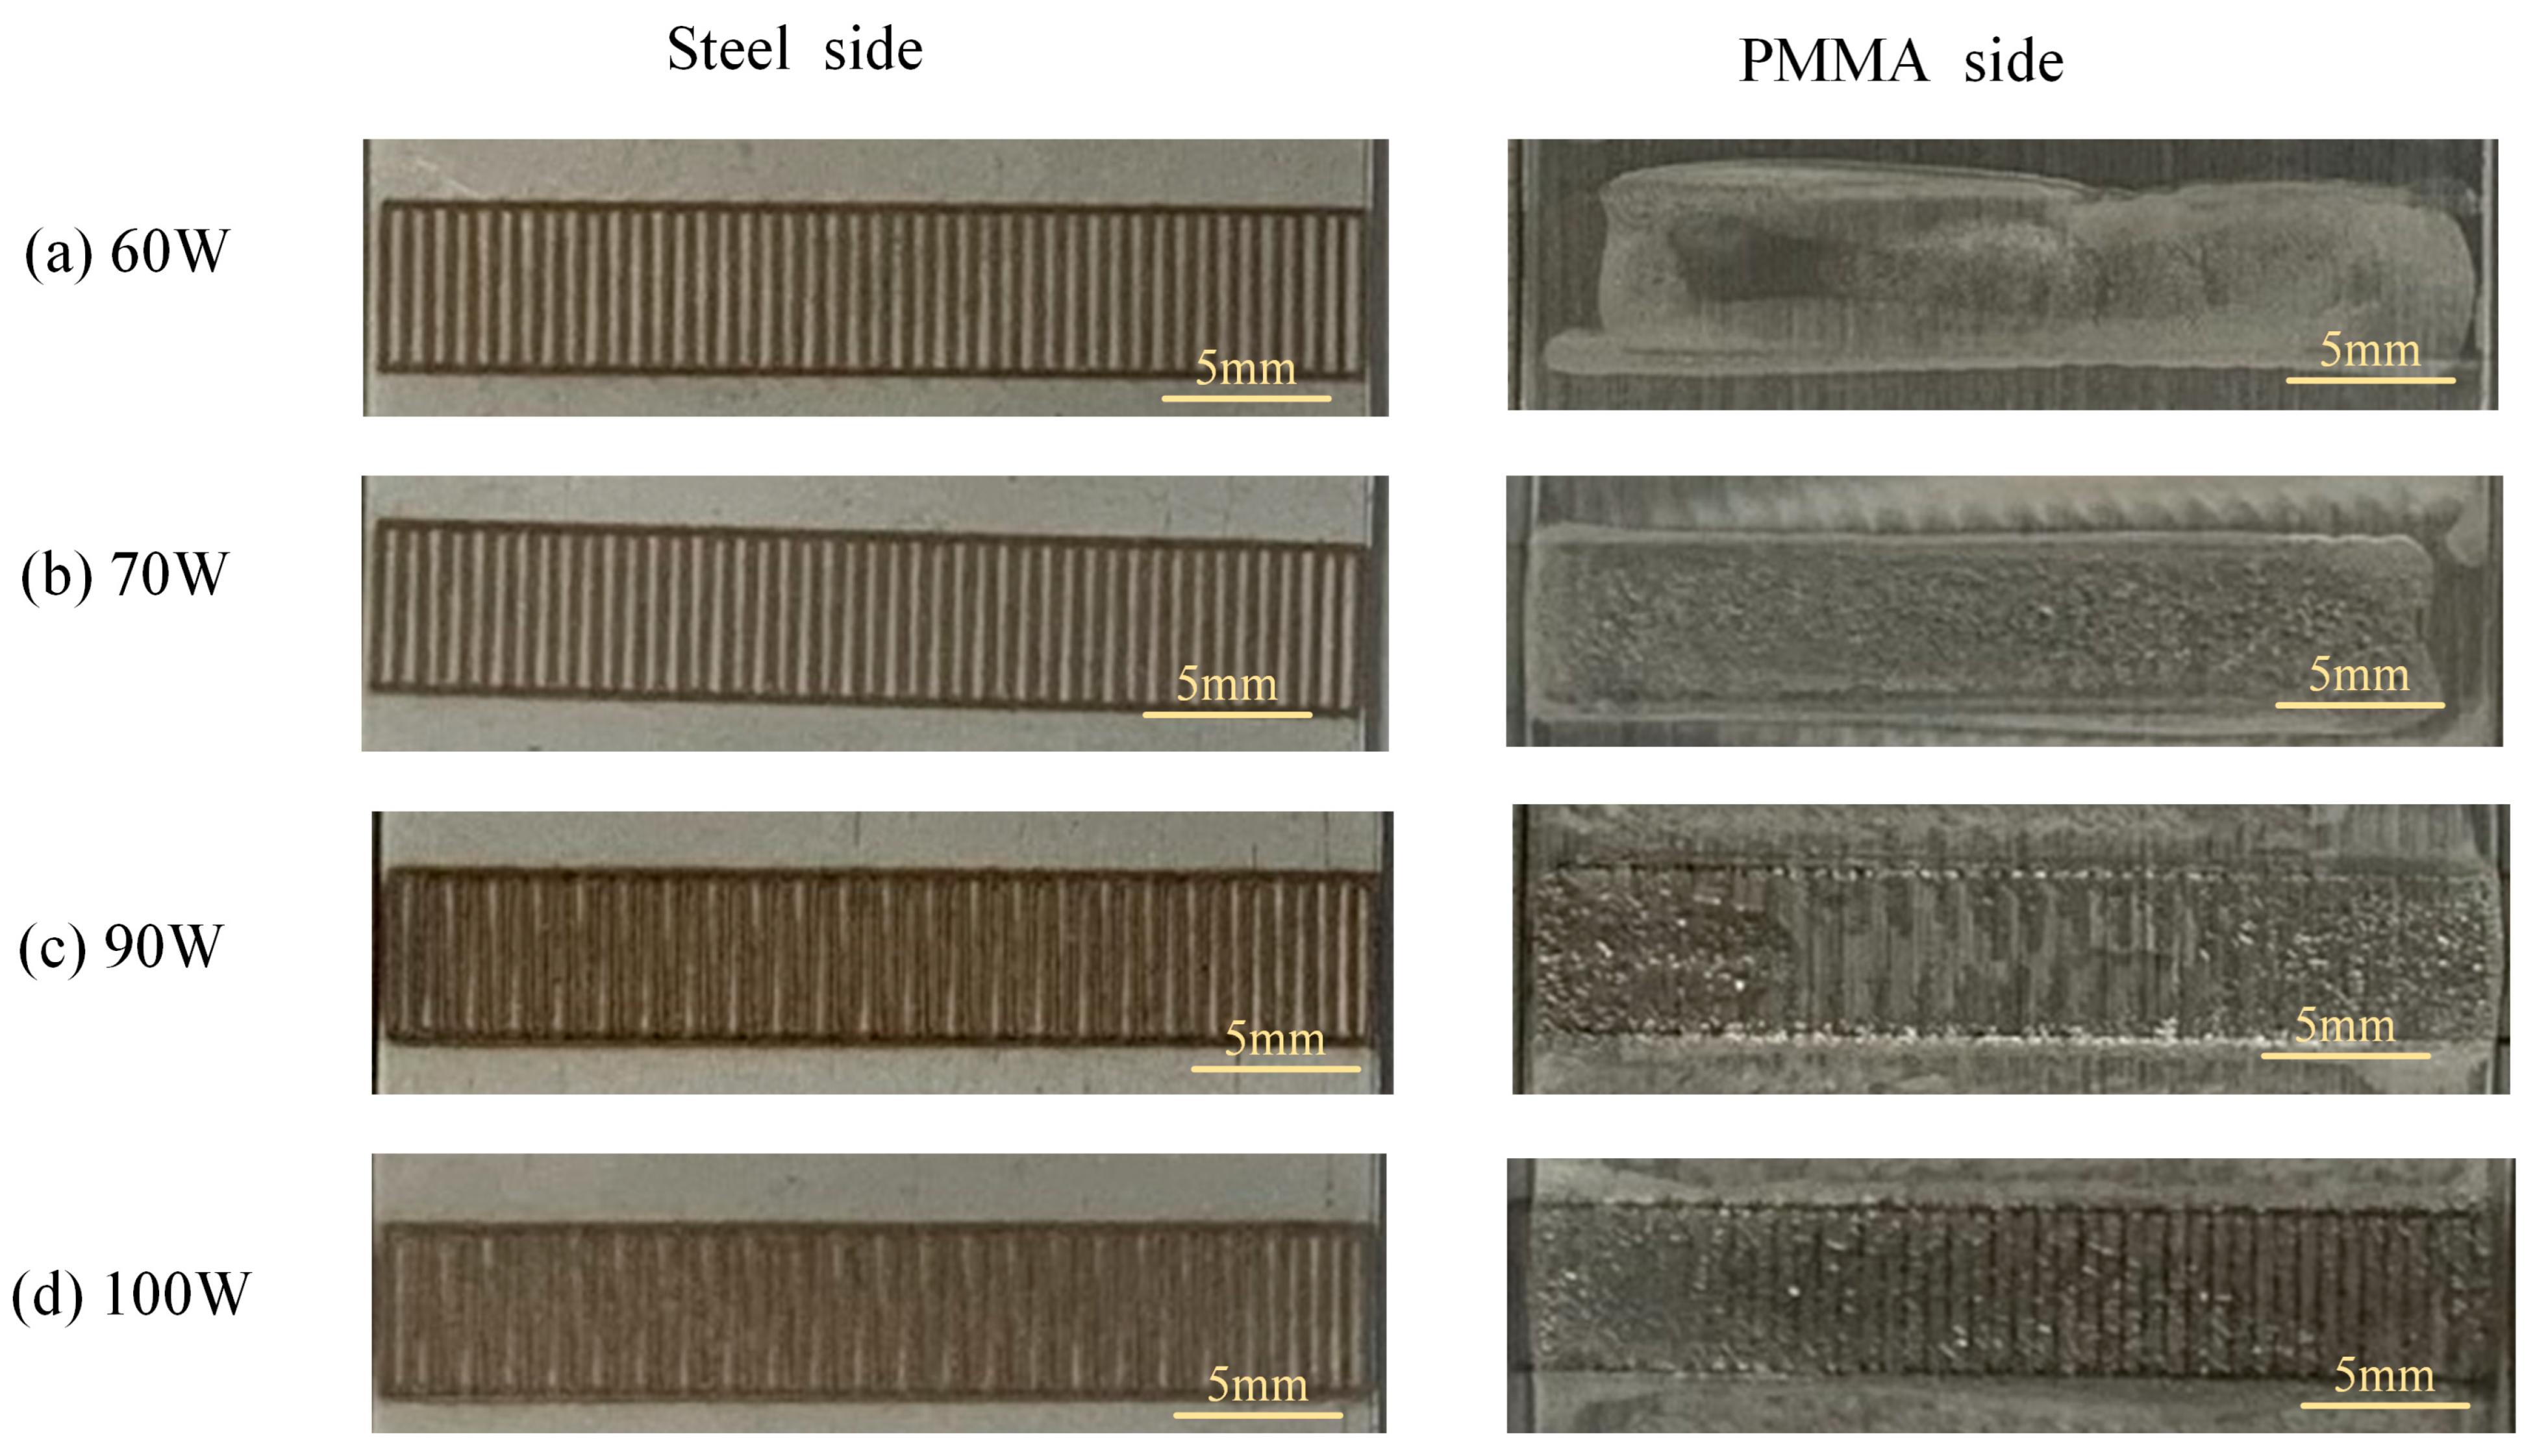
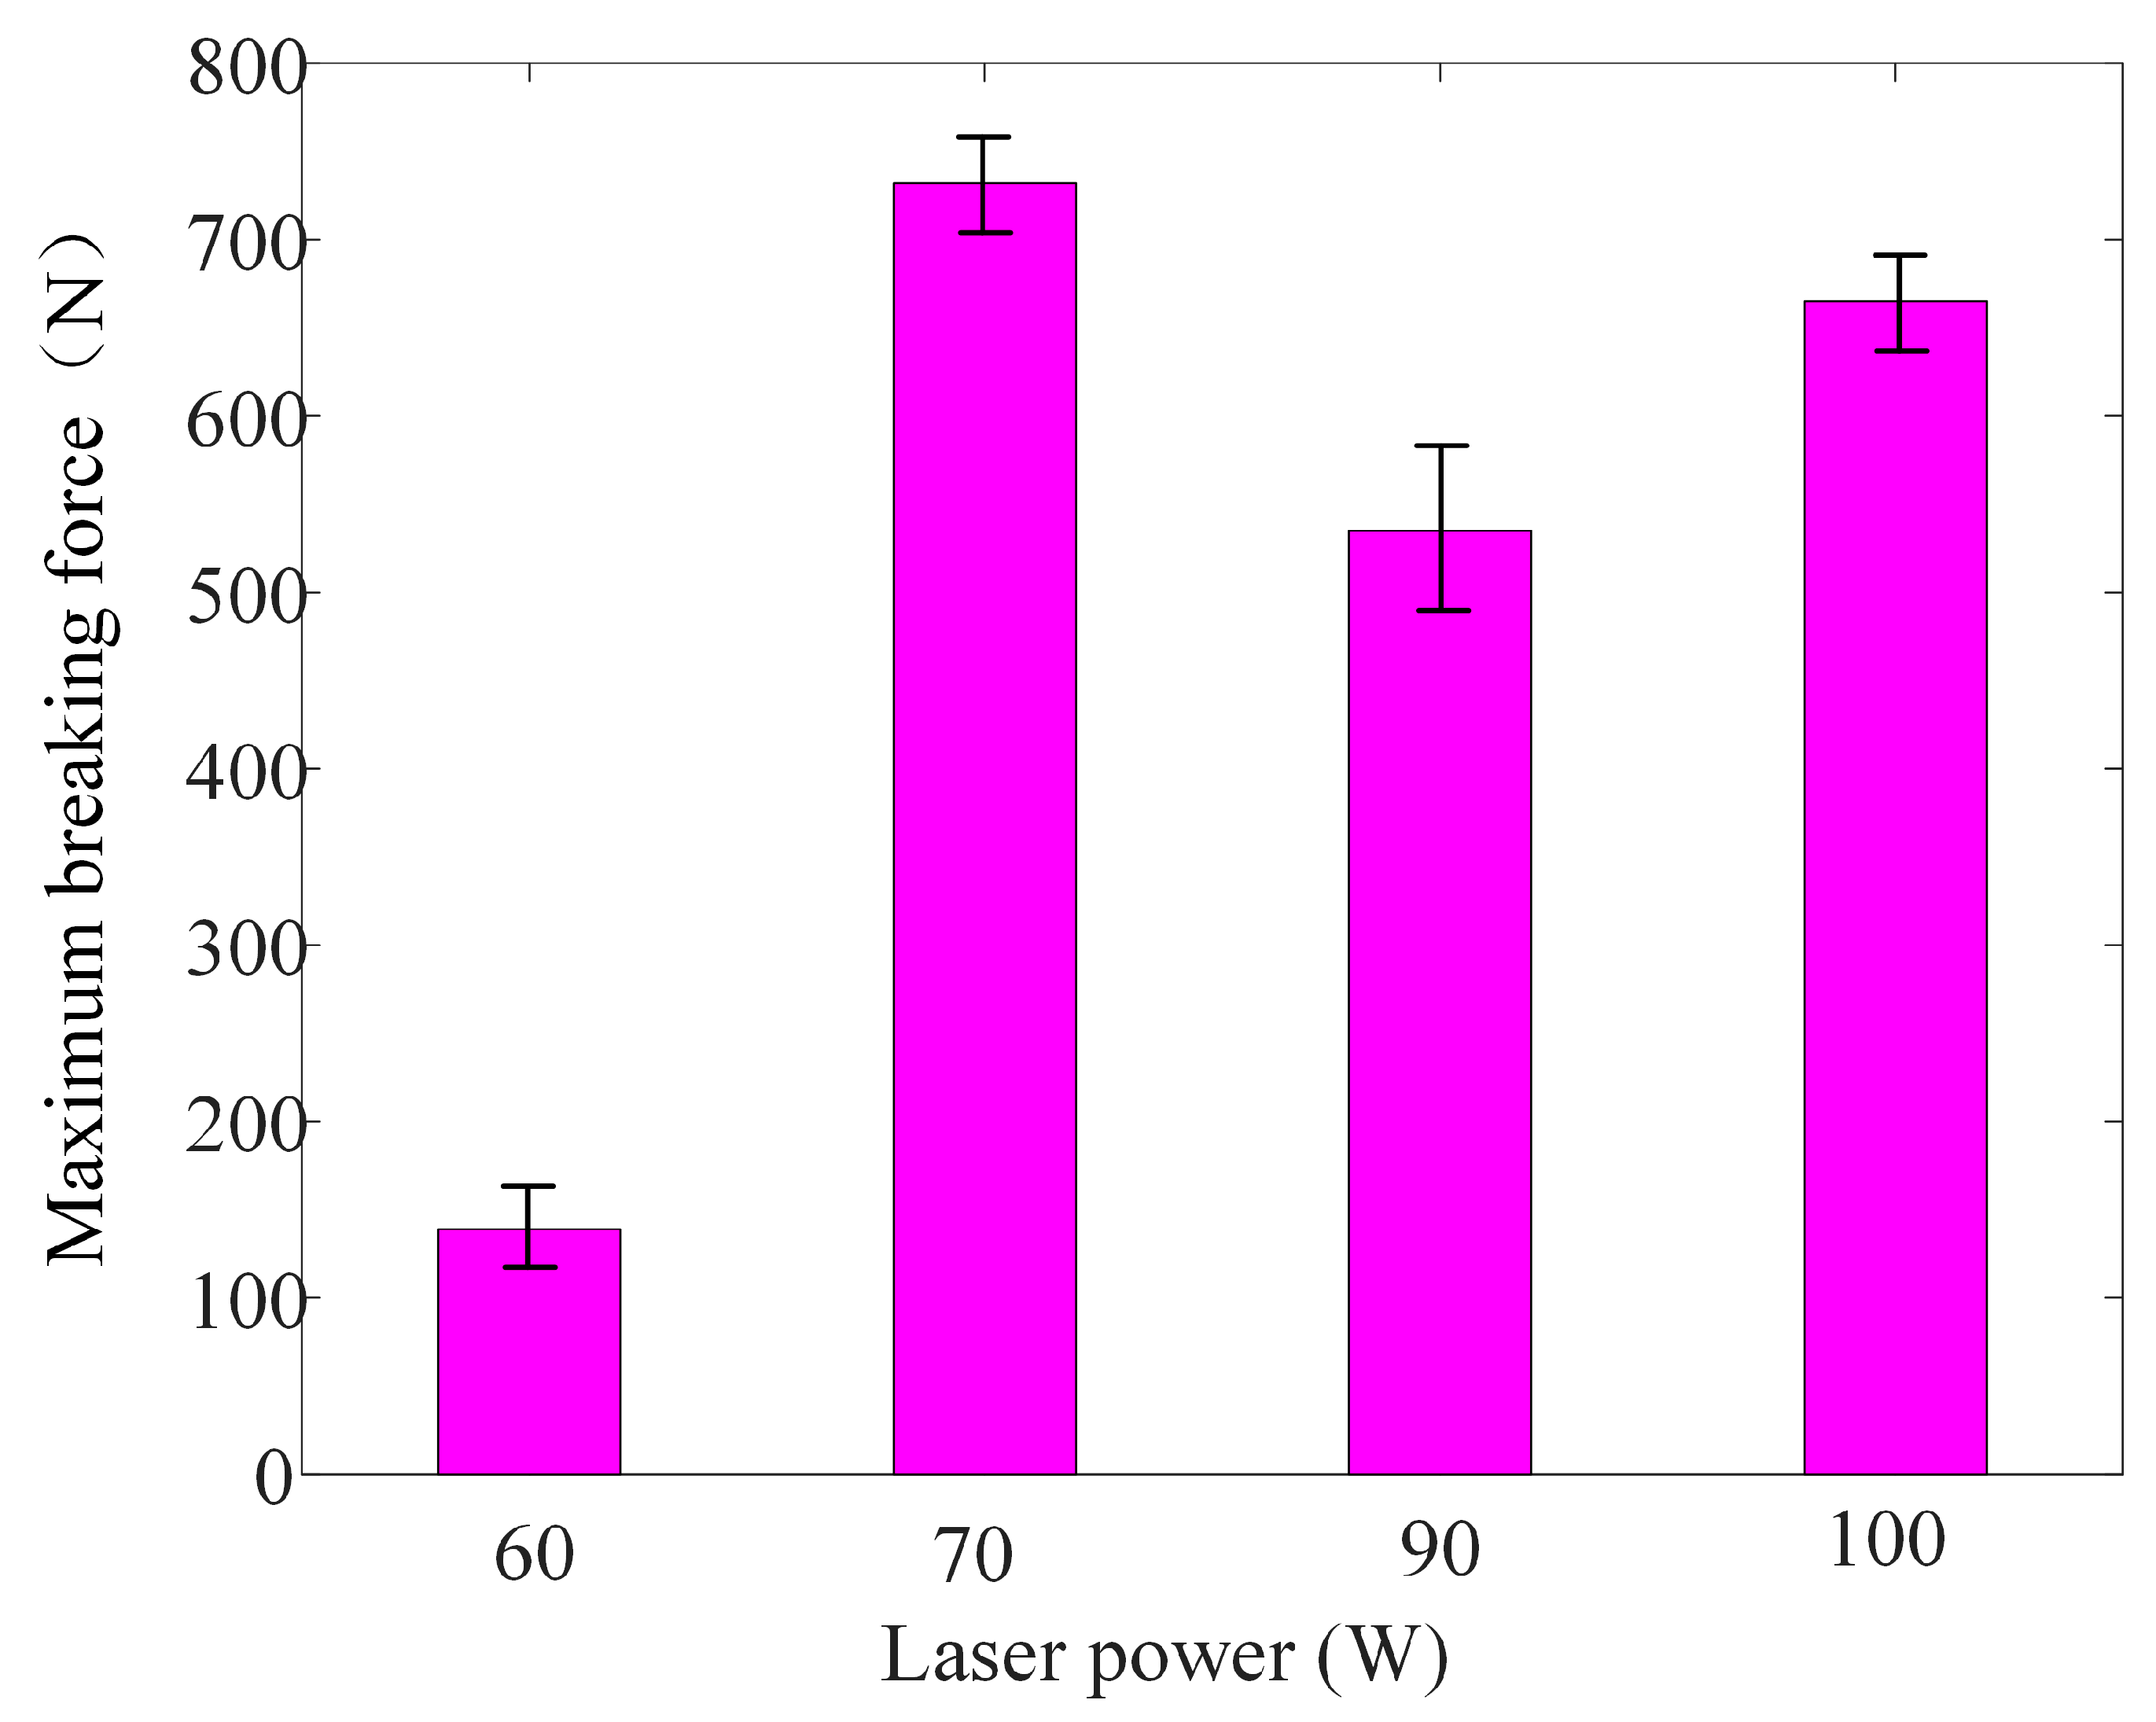
Laser welding experiments were performed according to the process parameters summarized in Table 2. Four distinct weld morphologies were generated with the increase in laser power, as visualized in Figure 4. Corresponding tensile mechanical performance data for each morphological type were also acquired and presented in Figure 5. Combining the observed joint morphologies and measured maximum lap-shear fracture forces, four exploratory laboratory-level weld states were defined in this study: weak weld, sound weld, discolored weld, and carbonized weld. Notably, these empirical classifications are established under controlled laboratory conditions and do not correspond to standardized industrial weld quality acceptance criteria.
Figure 4.
Four exploratory laboratory-defined weld categories showing weld beam profiles for steel side and PMMA side: (a) weak weld, (b) healthy weld, (c) discoloration weld and (d) carbonized weld. These categories are empirical groupings for laboratory exploratory analysis and are not formal industrial quality classes.
Figure 5.
The maximum breaking force of different laser powers.
At a laser power of 60 W, the thermal heat input is relatively low, and the upper steel is not fully penetrated. Limited heat is conducted from the steel side to the PMMA interface, resulting in only slight melting of the polymer layer, as displayed in Figure 4a. The interfacial bonding in this case is dominated by van der Waals forces, forming a weakly bonded joint [26]. As the laser power increases to 70 W, the elevated heat input increases the penetration depth of the steel substrate. More thermal energy is transmitted to the bonding interface and further conducted into the PMMA layer, inducing moderate thermal decomposition of the polymer. The molten PMMA flows and solidifies during cooling, forming numerous dense and fine bubbles within the bonding region. The resolidified polymer tightly adheres to the steel surface, yielding a high-strength joint [26], as shown in Figure 4b. When the laser power further increases to 90 W, the steel substrate is completely penetrated, and distinct laser scanning traces become visible on the PMMA side (Figure 4c). Non-uniform heat conduction and a rapid rise in temperature across the lap interface cause uneven thermal decomposition of the PMMA polymer. Consequently, bubble distribution becomes irregular: large bubbles emerge at the weld start and end regions, tunnel defects form in the middle weld zone, and widespread surface discoloration appears on the PMMA side. Such defects, including oversized bubbles, internal tunnels, and thermal discoloration, collectively degrade the mechanical performance of the hybrid joint [9,10]. At the maximum applied laser power of 100 W, full penetration of the steel substrate is achieved, as shown in Figure 4d. Intense thermal radiation propagates through the laser-induced keyhole toward the PMMA layer, triggering severe polymer thermal decomposition and obvious carbonization [9]. Regular laser scanning trajectories consistent with the preset processing parameters can be clearly observed on the polymer surface.
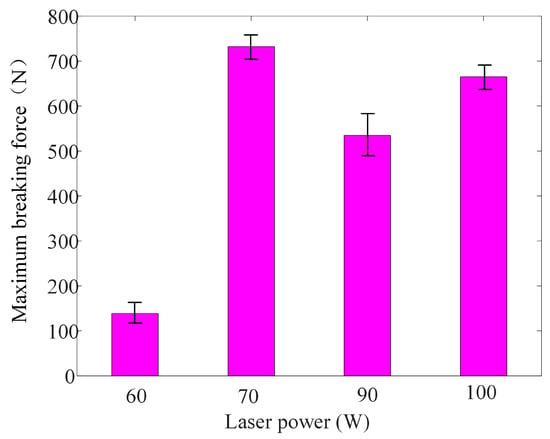
There is an inevitable connection between weld morphology and welding quality [26]. Figure 5 presents the tensile performance obtained at laser powers ranging from 60 W to 100 W. For all tensile specimens under four laser power conditions, interfacial fracture along the steel–PMMA bonding interface was consistently observed. No bulk fracture of the PMMA sheet or steel-substrate fracture occurred. Accordingly, the measured maximum lap-shear breaking force characterizes the interfacial bonding performance of the dissimilar joint. Three independent replicate lap-joint specimens (n = 3) were tested for each laser power condition, and the reported maximum lap-shear fracture forces correspond to arithmetic averages of the repeated measurements. The ultimate maximum lap-shear breaking force increases from 60 W to 70 W, reaching its maximum at 70 W. At 90 W, the lap-shear force declines owing to partial thermal decomposition and the formation of microdefects at the steel–PMMA interface. A moderate secondary strength increase is observed at 100 W. Although higher heat input enlarges the effective interfacial bonding area and partially offsets the strength degradation induced by polymer decomposition, joints produced at 100 W exhibit severe PMMA carbonization and internal defects. The overall joint quality remains inferior to the 70 W group, which agrees with previously reported results [9,24].
This phenomenon was previously interpreted as resulting from enlarged weld area and melt depth; however, this explanation remains physically plausible but speculative. In the present work, quantitative measurements of weld area, melt depth, and SEM fracture-surface analysis were not carried out to verify this mechanism. Joints at 100 W suffer from severe PMMA carbonization and interior void defects. Multiple competing factors, such as changes in carbonized-layer mechanical behavior, may also contribute to the strength rebound. Further experiments combining bonding-area quantification and fracture-surface characterization are needed to clarify the underlying mechanism.
3.2. Analysis of Original Signals
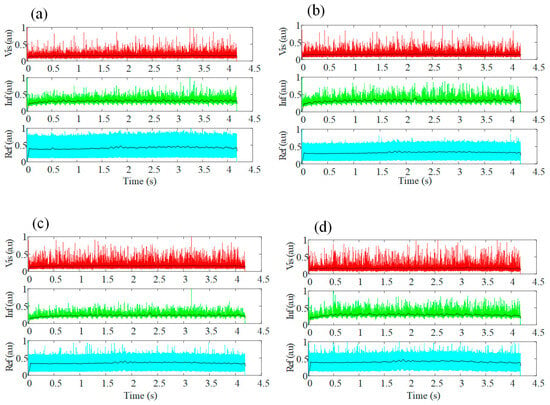
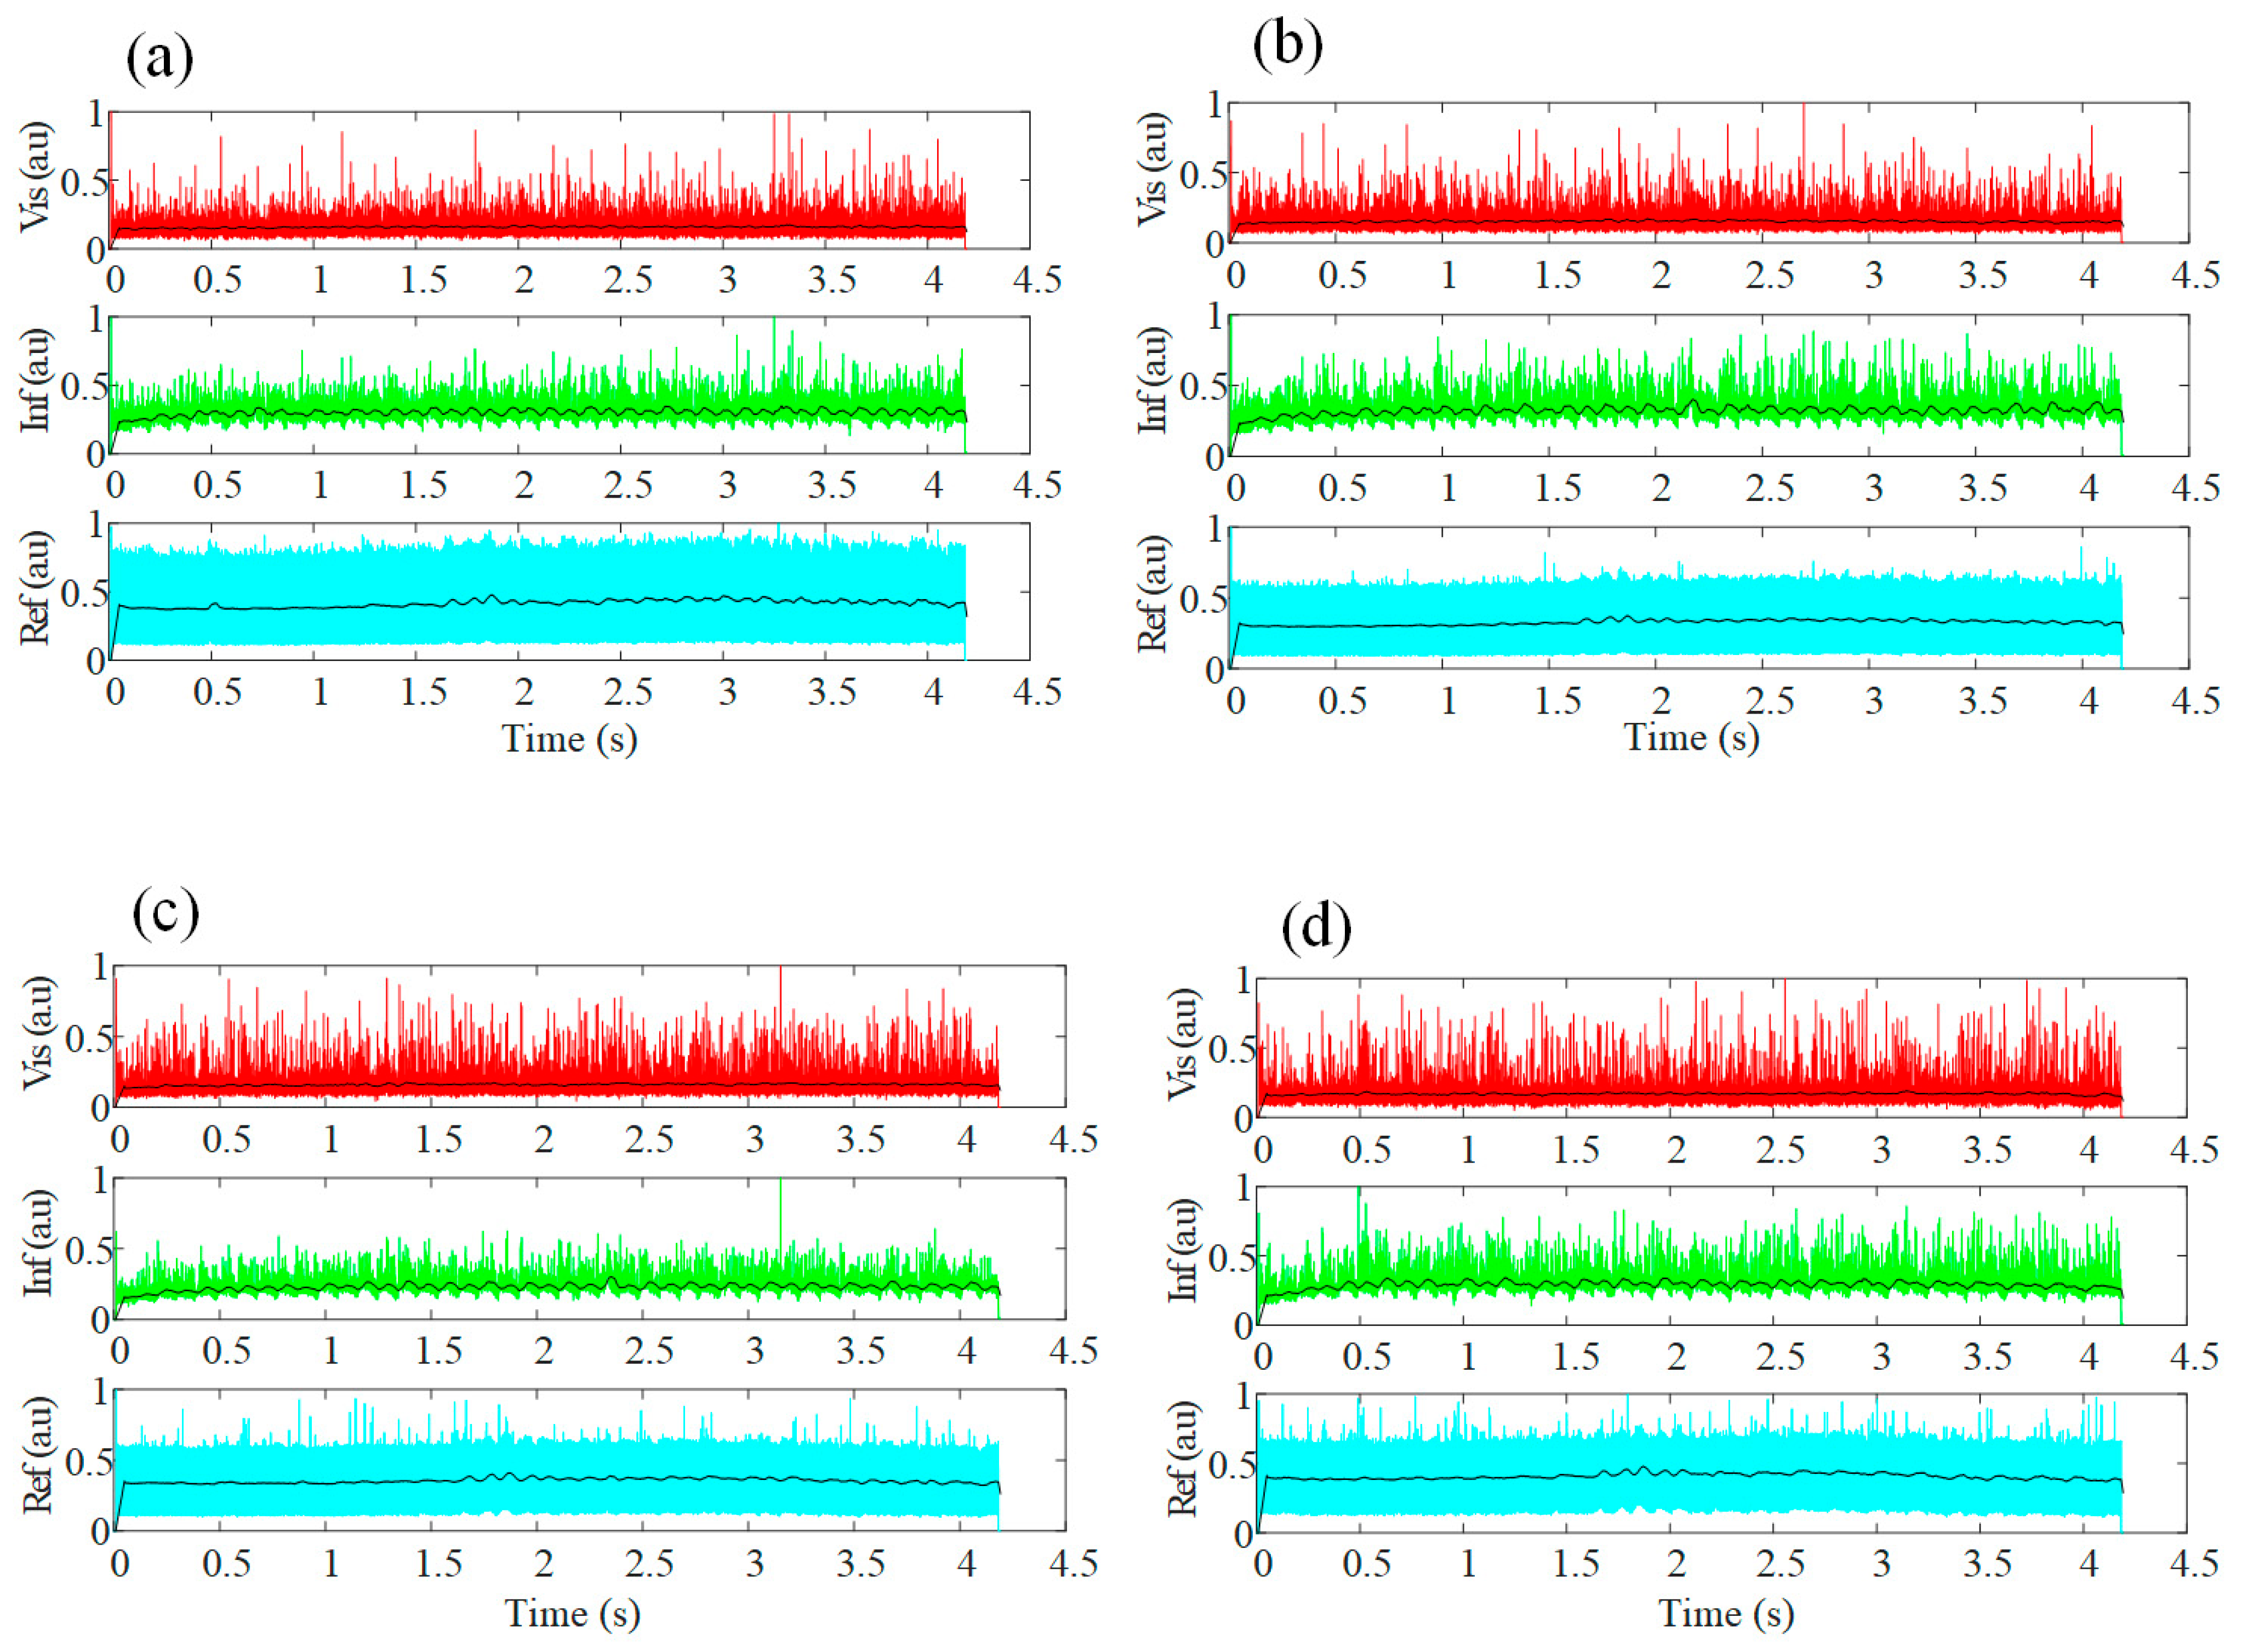
Raw optoelectronic signals acquired during laser lap welding are presented in Figure 6. The time–domain waveforms shown in Figure 6 are representative traces selected from three repeated welding trials at each laser power. Signals acquired from replicate welding tests at identical power exhibit consistent overall envelopes and primary fluctuation features, alongside minor random amplitude variations originating from stochastic plume dynamics and melt-pool interfacial behavior. Figure 6 displays optoelectronic signals corresponding to the four typical weld states [26]: weak weld, healthy weld, discoloration weld and carbonized weld. Signal magnitude is characterized by waveform amplitude. Here, Vis, Inf and Ref denote the intensities of ultraviolet–visible light, infrared light and reflected laser light, respectively. Time–domain waveforms from the Vis, Inf and Ref channels are plotted for visual comparison. It should be noted that quantitative metrics such as channel-to-channel cross-correlation and relative-amplitude statistics are not conducted in this section; only qualitative waveform inspection is carried out. It can be seen from Figure 6a–d that the signals of four kinds of typical changes fluctuate gently, without significant waves, small amplitudes or obvious troughs/peaks. This is in agreement with the findings in [26]. Thus, it is also necessary to explore the time–frequency analysis of the process signals generated during laser welding of steel–PMMA lap joints to observe their changing characteristics.
Figure 6.
Photoelectric signals of steel–PMMA lap weld under different laser power: (a) weak weld, (b) healthy weld, (c) discoloration weld and (d) carbonized weld. The mean (μ), standard deviation σ, and sample size (n) for the vis spectral features as follows: (a) μvis = 0.758, σvis = 0.318 nvis = 26,884; (b) μvis = 0.913, σvis = 0.412 nvis = 26,884; (c) μvis = 1.203, σvis = 0.581 nvis = 26,884; (d) μvis = 1.269, σvis = 0.608 nvis = 26,884.
3.3. Characteristics of Frequency Domain
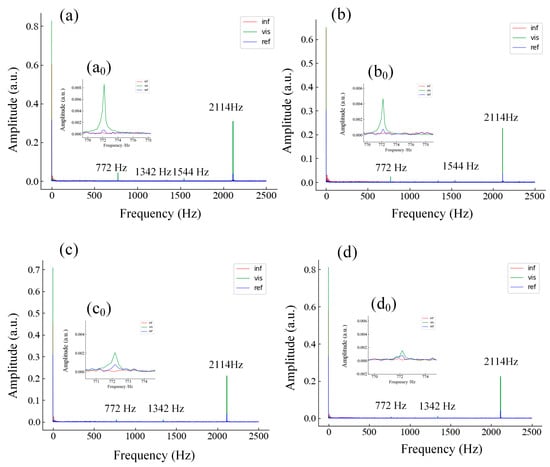
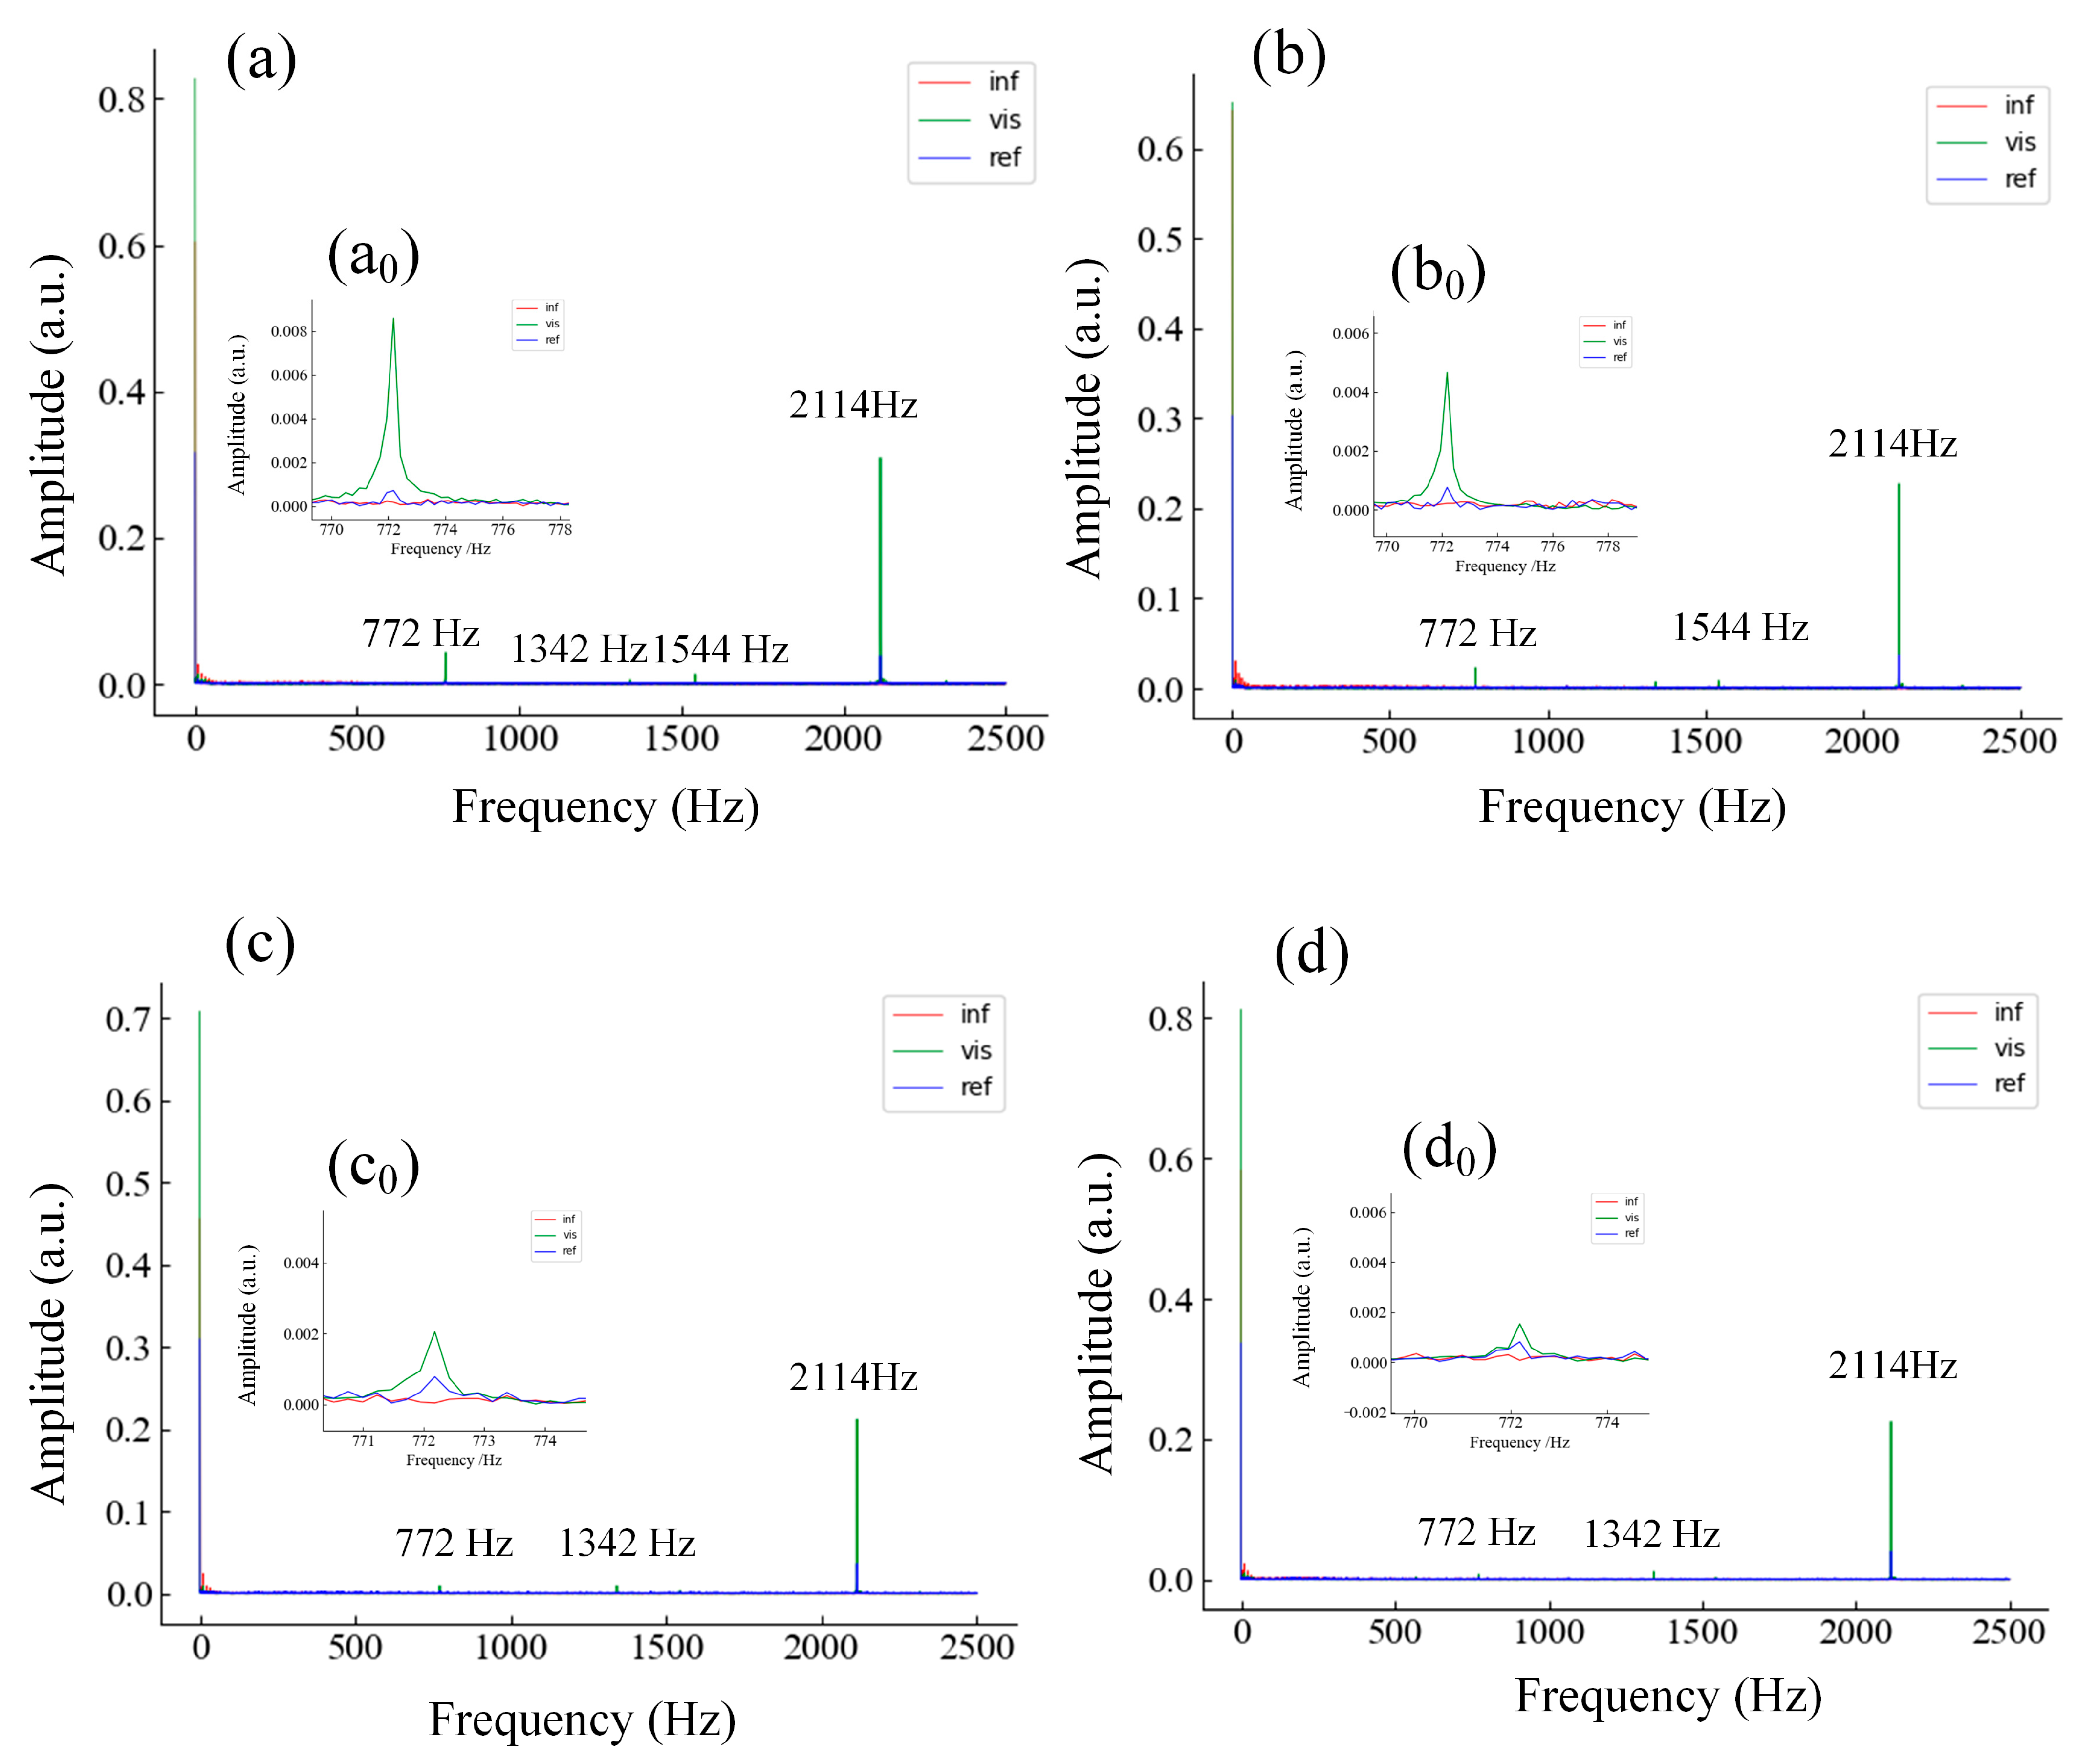
Raw optoelectronic data acquired during laser welding of steel–PMMA lap joints were processed via fast Fourier transform (FFT) to obtain frequency spectra at different laser powers, as shown in Figure 7a–d. Although signals from the Inf and Ref channels were synchronously acquired and plotted for reference, their spectral amplitudes within the 750–800 Hz band display weak fluctuations and negligible correlation with weld quality under the present experimental setup. Accordingly, further quantitative analysis for this frequency band focuses primarily on the Vis channel. Multi-channel feature fusion will be investigated in future work. Figure 7a shows that the frequency spectrum of the Vis band exhibits multiple peaks at frequencies of 772 Hz, 1342 Hz, 1544 Hz, and 2114 Hz. Figure 7b shows that the frequency spectrum of the Vis band exhibits multiple peaks at frequencies of 772 Hz, 1544 Hz, and 2114 Hz. Figure 7c,d shows that the frequency spectrum of the Vis band exhibits multiple peaks at frequencies of 772 Hz, 1342 Hz, and 2114 Hz. Previous work reported that the dominant effective features of optoelectronic signals during laser welding generally lie below 1000 Hz [15]. Therefore, all that needs to be done is the analysis of the photoelectric signal information at 772 Hz. The magnified spectra centered at 772 Hz are illustrated in Figure 7(a0–d0). The peak amplitude gradually declines with rising laser power and nearly vanishes at 100 W. From the time–frequency features of optoelectronic signals corresponding to the four representative weld states, the Vis-channel component at 772 Hz varies markedly across different weld conditions (weak weld, sound weld, discolored weld and carbonized weld). Therefore, the 772 Hz characteristic frequency can act as a discriminative feature for classifying distinct weld states. This frequency component is neither a sampling artifact nor stationary mechanical vibration noise. It falls within the valid bandwidth of the 5 kHz sampling system and demonstrates amplitude changes dependent on weld condition. Physically, the 772 Hz spectral peak is hypothesized to arise from quasi-periodic oscillations of the laser-induced plasma plume and melt-pool fluctuation. Such dynamic behaviors are highly sensitive to laser heat input and interfacial bonding conditions. Nevertheless, this mechanistic interpretation remains speculative and cannot be definitively validated solely by offline optoelectronic measurements in the current study. Future experiments incorporating synchronous high-speed imaging are needed to directly visualize melt-pool and plume dynamics and verify this proposed physical mechanism.
Figure 7.
Spectrum diagram of photoelectric information corresponding to the four kinds of typical welds: (a) weak weld, (b) healthy weld, (c) discoloration weld and (d) carbonized weld. (a0–d0) are the magnified spectra centered at 772 Hz.
3.4. Frequency–Domain Feature Characterization for Different Weld Categories
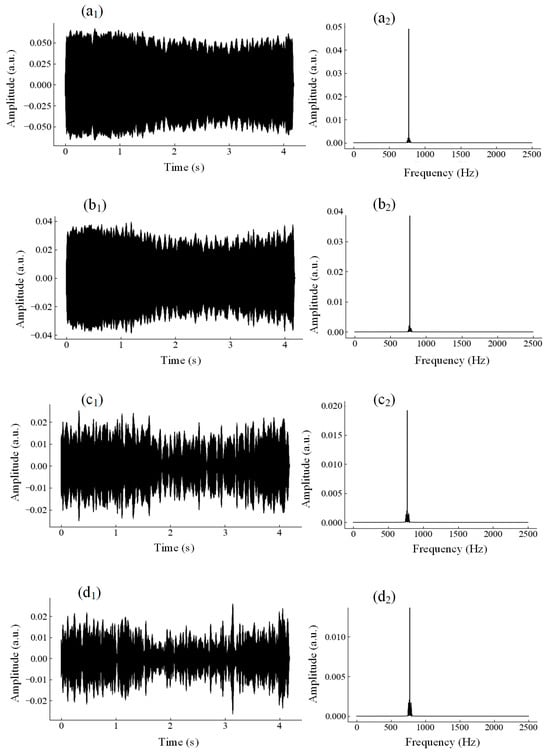
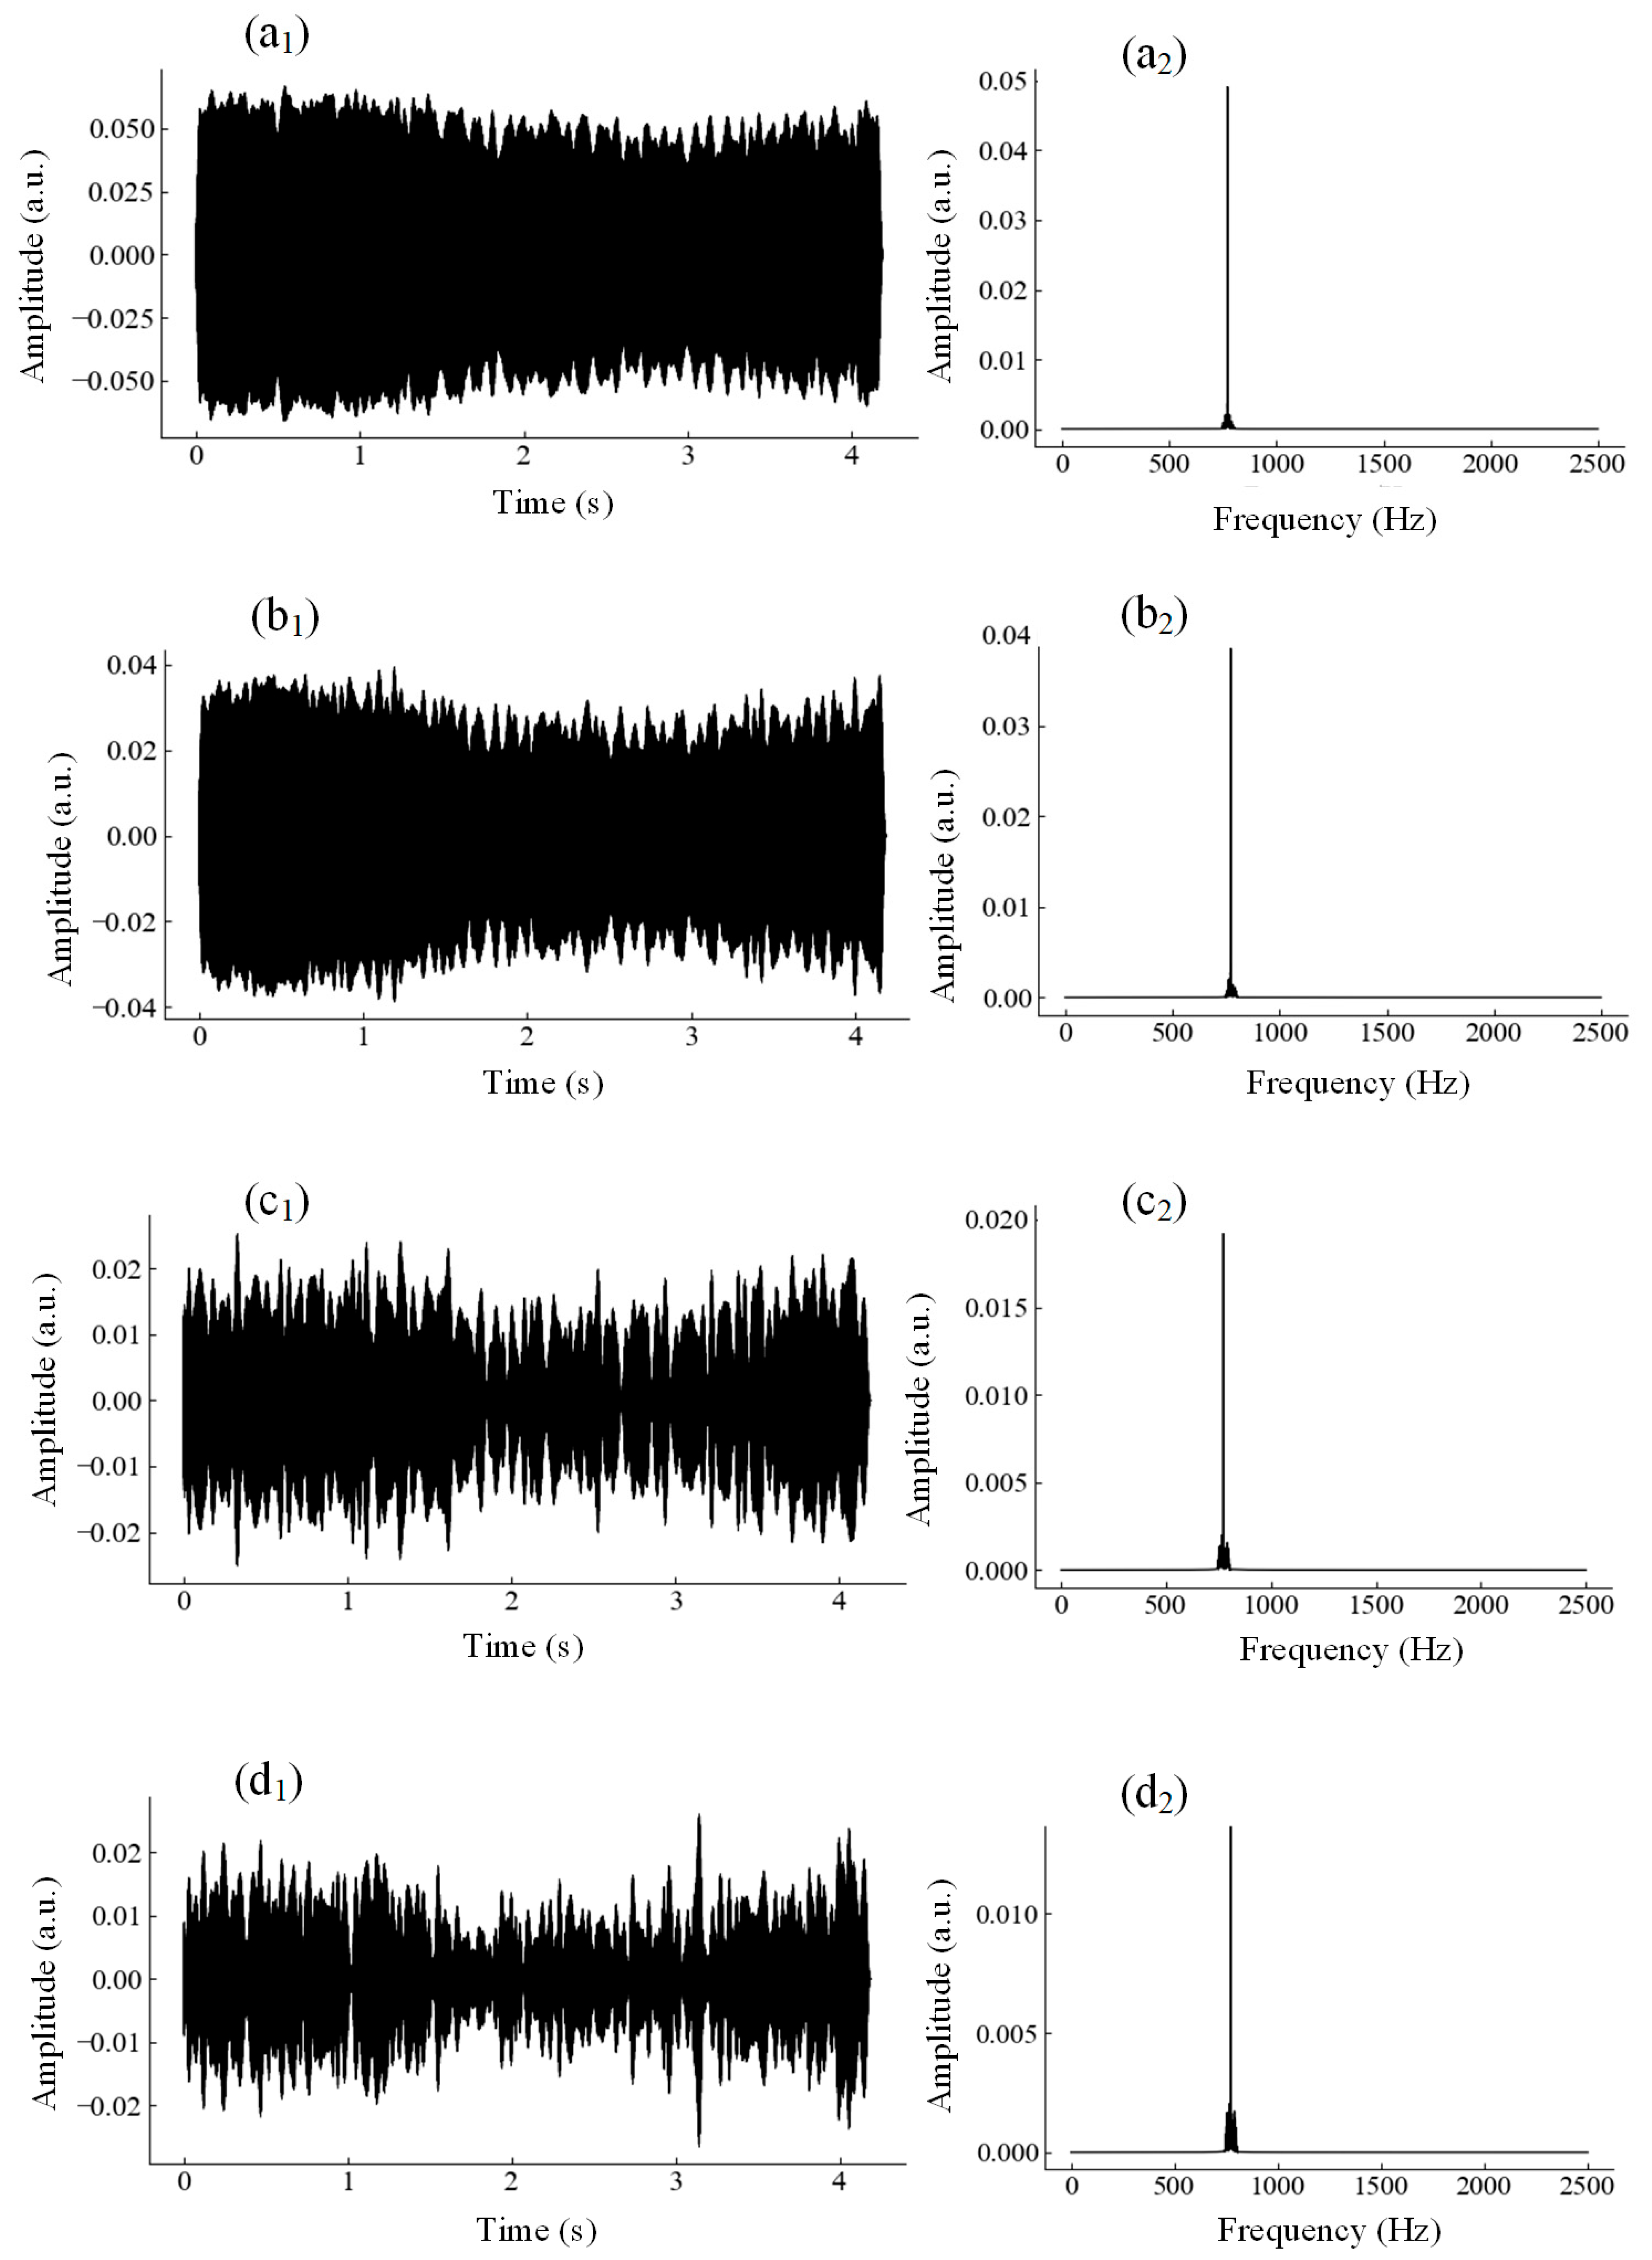
To interpret the physical origins of these differences, a 4th-order Butterworth bandpass filter was implemented to extract the target frequency components within the 750–800 Hz passband, based on the observed signal features across the four laboratory-defined weld states. All filtering and spectral-energy calculations were conducted as offline post-processing on the recorded signal datasets. The filter was designed with 40 dB stop-band attenuation and passband ripple kept below 0.1 dB. The corresponding spectra are presented in Figure 8. During the transition of joint characteristics from weak weld to carbonized weld, visual inspection of time–domain waveforms suggests that the temporal distribution of signal fluctuations changes with welding condition, accompanied by a clear shift in the clustering behavior of signal oscillations. Accordingly, this distinctive feature of visible-light optoelectronic signals can effectively discriminate among the four representative weld states.
Figure 8.
Vis 750–800 Hz frequency band signal and its spectrum: (a) weak weld, (b) healthy weld, (c) discoloration weld and (d) carbonized weld. (a1–d1) are the 750–800 Hz frequency band signal, (a2–d2) are their spectrum.
During laser welding of steel–PMMA dissimilar joints, different defect types and weld morphologies produce distinct signal variations arising from different physical mechanisms. Moreover, measurable signal discrepancies can be observed even within the same defect class because of differing contributing factors. Therefore, analysis of the in situ process signals acquired during laser metal–polymer welding enables investigation into the origins of diverse morphological features. Such insights can support process parameter optimization and improve the joining quality of dissimilar material assemblies.
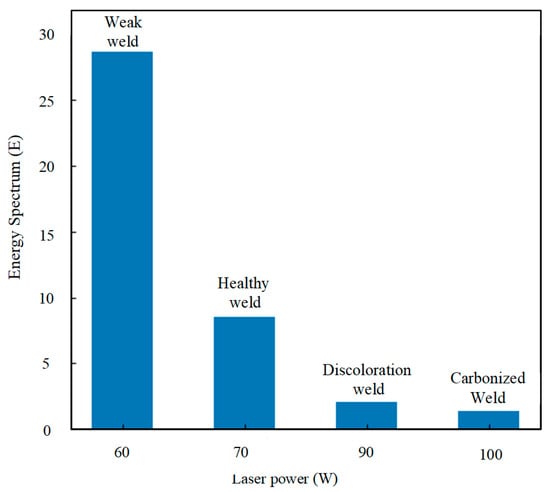
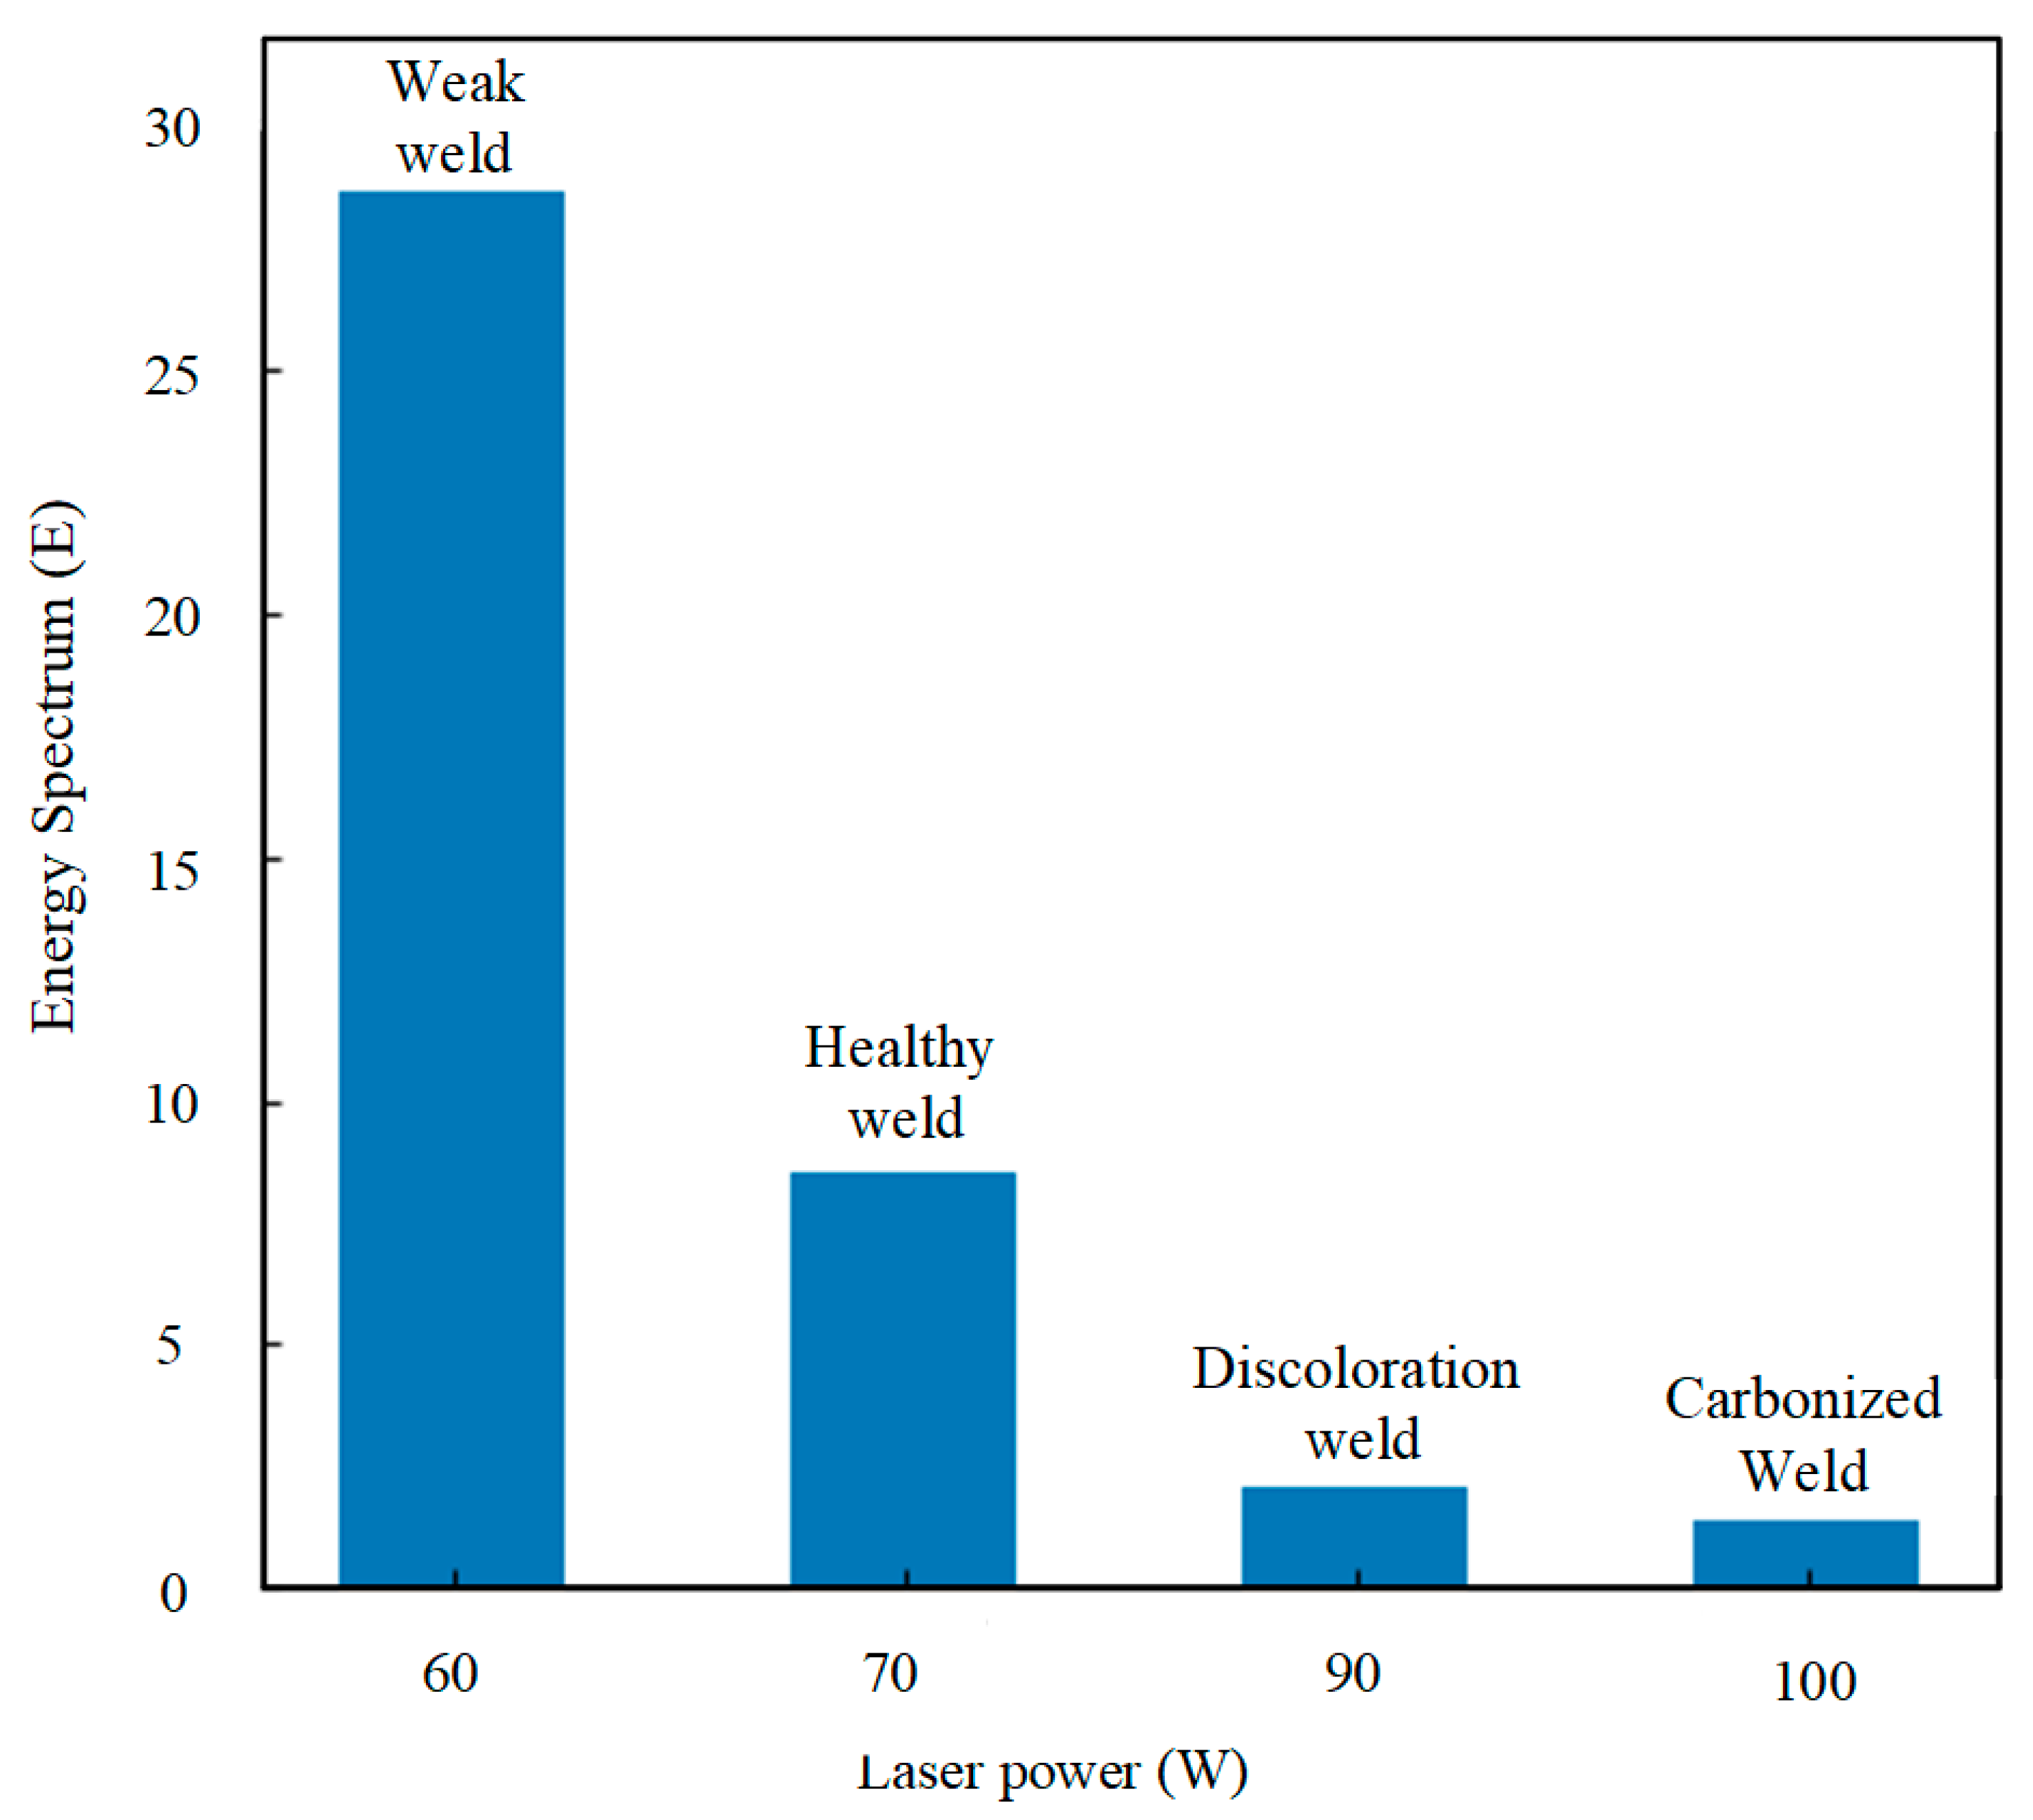
Based on Parseval’s theorem (Equation (1)) [27], the spectral energy of the visible-light signal within the 750–800 Hz band, which corresponds to the integral of the squared amplitude of the filtered signal over this frequency range, can be calculated. The results are shown in Figure 9. Consistent with the above observations, the Vis-channel spectral energy is relatively high at the laser power of 60 W, while the lap-shear strength of the steel–PMMA joint remains low. When laser power exceeds 90 W, the laser-welded steel–PMMA joints show discoloration and carbonization, accompanied by reduced spectral energy values of the corresponding signals. Based on these preliminary results, the following conclusion can be drawn: the frequency–domain characteristic of visible light within this specific band can effectively differentiate between various joint types. As a result, the four weld categories exhibit distinct spectral energy features, which can be used to characterize different weld quality states. The extracted spectral-band energy feature shows an evident correlation with different weld quality states under the present experimental conditions. It should be noted that classification thresholds and statistical separability analysis (e.g., ANOVA) are not performed in this study, and further investigations with expanded sample size are required to realize reliable weld-state discrimination.
Figure 9.
Energy spectrum of 750–800 Hz band of Vis at different laser powers.
4. Conclusions
This exploratory laboratory study investigates frequency–domain features from offline-processed photodetector signals to analyze their correlation with the quality of laser-welded steel–PMMA joints. All signal processing was performed as offline post-processing of in-process-acquired raw data; real-time signal analysis and closed-loop process control were not realized in this study. The main observations from this empirical work are summarized as follows:
- (1)
- In situ optical signals were acquired during laser welding of steel–PMMA lap joints for four empirically defined laboratory weld states: weak weld, sound weld, discolored weld, and carbonized weld.
- (2)
- Systematic offline analysis was conducted on the corresponding photoelectric signals for these four laboratory-exploratory weld categories. Fast Fourier transform was used to produce the frequency spectrum. An observable correlation was identified between the visible-light-signal feature near 772 Hz and joint behavior reflected by maximum lap-shear breaking force under the given fixed laboratory experimental conditions. The physical origin of the 772 Hz spectral peak remains hypothetical and requires further experimental validation.
- (3)
- A Butterworth bandpass filter and Parseval’s theorem were adopted for offline spectral post-processing. The resulting frequency and spectral-energy spectra reveal distinguishable visible-light frequency–domain features among the four weld groups. The extracted spectral-band-energy feature exhibits empirical correlation with different weld-state observations under the present experimental setup. This sensing approach shows only exploratory laboratory-scale potential for feature analysis of SUS304-PMMA laser-welded joints, and has not been validated for industrial deployment.
This study possesses several inherent limitations. All laser welding experiments were completed under fixed welding speed and clamping conditions, and the adaptability of the 772 Hz spectral feature under variable process parameters requires further verification. Although replicate welding and mechanical tests were carried out, systematic statistical analysis and error quantification remain limited. In addition, the sensor was fixed at a single placement position throughout the experiment, and the generalization performance of the photoelectric monitoring method under different sensor layouts remains unclear. Furthermore, the four weld categories used in this work are empirical laboratory-exploratory groupings and have not been validated against formal industrial weld-quality standards. The current work only achieves offline exploratory weld-related feature analysis based on extracted signal features, without real-time monitoring or closed-loop process regulation. Future work will focus on parameter adaptability verification, statistical repeatability evaluation, synchronous high-speed-camera mechanistic validation, sensor-layout optimization, and exploration towards intelligent closed-loop control.
Author Contributions
Conceptualization, Y.H.; data curation, Y.H., B.M., G.L., and Q.W.; funding acquisition, Y.H., G.L., and Q.W.; investigation, Y.H., B.M., and Q.W.; methodology, Y.H. and Q.W.; project administration, G.L.; resources, G.L.; supervision, Y.H., B.M., and G.L.; visualization, Y.H.; writing—original draft, Y.H. and B.M.; writing—review and editing, Y.H. and B.M. All authors have read and agreed to the published version of the manuscript.
Funding
This work was partly supported by the Guangdong Provincial Universities Young Innovative Talents Project (Grant No. 2024KQNCX318), the Guangdong Provincial Special Fund for Science and Technology Innovation Strategy (Grant No. pdjh2026bk338) and in part by Guangdong Natural Science Foundation (Grant No. 2025A1515010910), the High-level Talent Project (Grant No. 2026-gc-21), the school-level scientific researchand innovation team of Guangdong Polytechnic of Industry and Commerce (Grant No. 2025-TD-06), the university-level Scientific Research Project (Grant No. 2025-ZK-08), the College Students’ Innovation and Entrepreneurship Training Program (Grant No. 08 and DCYB-2026-3).
Data Availability Statement
The original contributions presented in this study are included in the article material. Further inquiries can be directed to the corresponding author.
Acknowledgments
The authors are grateful to the Instrumental Analysis Center for Guangdong University of Technology.
Conflicts of Interest
The authors declare no conflict of interest.
References
- Liu, J.; Jiang, F.; Tashiro, S.; Chen, S.; Tanaka, M. A physics-informed and data-driven framework for robotic welding in manufacturing. Nat. Commun. 2025, 16, 4807. [Google Scholar] [CrossRef] [Scilit]
- Wang, X.; Li, P.; Xu, Z.K.; Song, X.H.; Liu, H.X. Laser transmission joint between PET and titanium for biomedical application. J. Mater. Process. Technol. 2010, 210, 1767–1771. [Google Scholar] [CrossRef] [Scilit]
- Chan, C.W.; Smith, G.C. Fiber laser joining of highly dissimilar materials: Commercially pure Ti and PET hybrid joint for medical device applications. Mater. Des. 2016, 103, 278–292. [Google Scholar] [CrossRef] [Scilit]
- Scholten, K.; Meng, E. Materials for microfabricated implantable devices: A review. Lab A Chip 2015, 15, 4256–4272. [Google Scholar] [CrossRef] [Scilit]
- Jiao, J.K.; Wang, Q.; Zan, S.P.; Zhang, W.W. Research Progress on CFRTP Laser Joining Technology. Aeronaut. Manuf. Technol. 2016, 19, 24–28. [Google Scholar]
- Feng, J.C. A Review of Research Progress on Hybrid Material Connections. J. Aeronaut. 2022, 43, 626413. [Google Scholar] [CrossRef]
- Pagano, N.; Campana, G.; Fiorini, M.; Morelli, R. Laser transmission welding of polylactide to aluminium thin films for applications in the food-packaging industry. Opt. Laser Technol. 2017, 91, 80–84. [Google Scholar] [CrossRef] [Scilit]
- Tamrin, K.F.; Nukman, Y.; Zakariyah, S.S. Laser Lap Joining of Dissimilar Materials–A Review of Factors Affecting Joint Strength. Mater. Manuf. Process. 2013, 28, 857–871. [Google Scholar] [CrossRef] [Scilit]
- Huang, Y.J.; Gao, X.D.; Ma, B.; Liu, G.Q.; Zhang, N.F.; Zhang, Y.X.; You, D.Y. Optimization of weld strength for laser welding of steel to PMMA using Taguchi design method. Opt. Laser Technol. 2021, 136, 106726. [Google Scholar] [CrossRef] [Scilit]
- Kira, V.; Burkhardt, I.; Olowinsky, A.; Gillner, A. Laser-induced Self-organizing Microstructures on Steel for Joining with Polymers. Phys. Procedia 2016, 83, 1137–1144. [Google Scholar] [CrossRef] [Scilit]
- Tan, X.; Zhang, J.; Shan, J.; Yang, S.; Ren, J. Characteristics and formation mechanism of porosities in CFRP during laser joining of CFRP and steel. Compos. Part B Eng. 2015, 70, 35–43. [Google Scholar] [CrossRef] [Scilit]
- Lambiase, F.; Genna, S. Laser-assisted direct joining of AISI304 stainless steel with polycarbonate sheets: Thermal analysis, mechanical characterization, and bonds morphology. Opt. Laser Technol. 2017, 88, 205–214. [Google Scholar] [CrossRef] [Scilit]
- Gower, H.L.; Pieters, R.; Richardson, I.M. Pulsed laser welding of metal-polymer sandwich materials using pulse shaping. J. Laser Appl. 2006, 18, 35–41. [Google Scholar] [CrossRef] [Scilit]
- El-Fahhar, H.H.; Gadallah, E.A.; Habba, M.I.A.; Seleman, M.M.E.-S.; Ahmed, M.M.Z.; Mohamed, A.Y.; Fouad, R.A. Effect of post-weld heat-treatment and solid-state thermomechanical treatment on the properties of the AA6082 MIG welded joints. Sci. Rep. 2024, 14, 4380. [Google Scholar] [CrossRef] [Scilit]
- You, D.; Gao, X.; Katayama, S. Review of laser welding monitoring. Sci. Technol. Weld. Join. 2014, 19, 181–201. [Google Scholar] [CrossRef] [Scilit]
- Xie, S.; Wang, B.; Zou, J.; Liu, T.; Cai, J.; Li, Z.; Yang, W. Fiber laser welding penetration depth monitoring: A novel method using plume visual and SMI signal fusion analysis. J. Manuf. Process. 2025, 148, 150–159. [Google Scholar] [CrossRef] [Scilit]
- Schricker, K.; Bergmann, J.P.; Hopfeld, M.; Spieß, L. Effect of thermoplastic morphology on mechanical properties in laser-assisted joining of polyamide 6 with aluminum. Weld. World 2021, 65, 699–711. [Google Scholar] [CrossRef] [Scilit]
- Schricker, K.; Diller, S.; Bergmann, J.P. Bubble formation in thermal joining of plastics with metals. Procedia CIRP 2018, 74, 518–523. [Google Scholar] [CrossRef] [Scilit]
- Schricker, K.; Ganß, M.; Könke, C.; Bergmann, J.P. Feasibility study of using integrated fiber optical sensors to monitor laser-assisted metal–polymer joining. Weld. World 2020, 64, 1565–1578. [Google Scholar] [CrossRef] [Scilit]
- Schmitt, R.; Mallmann, G.; Ackermann, P.; Bergmann, J.P.; Stambke, M.; Schricker, K. 3D weld seam characterization based on optical coherence tomography for laser-based thermal joining of thermoplastics to metals. In Proceedings of the Lasers in Manufacturing Conference 2015, Munich, Germany, 22–25 June 2015; p. 8. [Google Scholar]
- Lévesque, D.; Legros, A.; Michel, A.; Piché, L. High resolution ultrasonic interferometry for quantitative nondestructive characterization of interfacial adhesion in multilayer (metal/polymer/metal) composites. J. Adhes. Sci. Technol. 1993, 7, 719–741. [Google Scholar] [CrossRef] [Scilit]
- Wang, H.Z.; Kawahito, Y.; Nishimoto, K. A Laser Joining System for Titanium and Polyethylene Terephthalate Plastic Controlled by Multiple Signal Sources. IEEE Trans. Ind. Electron. 2018, 66, 1255–1263. [Google Scholar] [CrossRef]
- Olsson, R.; Eriksson, I.; Powell, J.; Langtry, A.; Kaplan, A. Challenges to the interpretation of the electromagnetic feedback from laser welding. Opt. Lasers Eng. 2011, 49, 188–194. [Google Scholar] [CrossRef] [Scilit]
- Huang, Y.J.; Gao, X.D.; Ma, B.; Zhang, Y.X. Interface Formation and Bonding Mechanisms of Laser Welding of PMMA Plastic and 304 Austenitic Stainless Steel. Metals 2021, 11, 1495. [Google Scholar] [CrossRef] [Scilit]
- Cheng, L.; Mi, G.; Li, S.; Wang, C.; Hu, X. Defects diagnosis in laser brazing using near-infrared signals based on empirical mode decomposition. Opt. Laser Technol. 2018, 100, 12–20. [Google Scholar] [CrossRef] [Scilit]
- Huang, Y.J.; Gao, X.D.; Zhang, Y.X.; Ma, B. Laser joining technology of polymer-metal hybrid structures-A review. J. Manuf. Process. 2022, 79, 934–961. [Google Scholar] [CrossRef] [Scilit]
- Xin, L.; Fangze, W.; Hao, L.; Jingran, B.; Yuxin, D.; Yang, S. Fault location of transmission lines by wavelet packet decomposition based on SSSC and EMD. Electr. Eng. 2024, 106, 7853–7866. [Google Scholar] [CrossRef] [Scilit]

Disclaimer/Publisher’s Note: The statements, opinions and data contained in all publications are solely those of the individual author(s) and contributor(s) and not of MDPI and/or the editor(s). MDPI and/or the editor(s) disclaim responsibility for any injury to people or property resulting from any ideas, methods, instructions or products referred to in the content. |
© 2026 by the authors. Licensee MDPI, Basel, Switzerland. This article is an open access article distributed under the terms and conditions of the Creative Commons Attribution (CC BY) license.