


Abstract
This study investigates the hot-deformation behavior and dynamic recrystallization (DRX) kinetics of 12Cr2Mo1V steel for heavy forgings of large hydrogenation reactors. Gleeble isothermal compression tests were performed at 950–1200 °C and strain rates of 0.01–5 s−1 with friction correction to obtain reliable flow–stress data. A strain-compensated Arrhenius constitutive model was established to characterize the hot flow behavior over the entire strain range, with R = 0.9918 and AARE = 3.8826%. The dynamic material model was used to determine the optimal stable processing window of 1000–1200 °C and 0.01–0.1 s−1. Microstructural analyses reveal that continuous dynamic recrystallization (CDRX) dominates grain evolution below 1100 °C, while discontinuous dynamic recrystallization (DDRX) prevails at higher temperatures. A mechanism-segmented DRX model with a 1100 °C transition threshold is proposed to precisely describe the temperature-dependent dual-DRX kinetics of the studied steel. The calibrated constitutive equation and segmented DRX sub-models were embedded into the DEFORM finite-element software for coupled thermo-mechanical–microstructural simulations, and the simulated microstructures agree well with experimental results. This work supports refined numerical simulation and process-parameter optimization of heavy reactor forgings, while providing a convenient and efficient modeling strategy for alloys with temperature-dependent dual-DRX mechanisms.
1. Introduction
12Cr2Mo1V steel exhibits high strength, favorable high-temperature creep resistance, and good resistance to hydrogen-induced cracking and hydrogen corrosion, making it a candidate material for core pressure-bearing components in petrochemical hydrogenation reactors. With the rapid advancement of the global petrochemical industry, modern hydrogenation facilities are trending toward large-scale integration, high production efficiency, heavy-oil deep processing and clean-production modes. At present, the annual processing capacity of a single hydrogenation unit exceeds 2 million tons, the maximum reactor outer diameter is over 5 m, and individual integral heavy forgings can weigh more than 300 tons. Such substantial upgrades in equipment and service conditions impose higher requirements on operating temperature, working pressure and safety redundancy for hydrogenation reactors [1,2,3]. Key components of hydrogenation reactors are predominantly manufactured by free forging. To meet increasingly stringent service requirements, large reactor forgings are expected to possess good formability and homogeneous microstructures, while avoiding typical processing defects such as deformation cracking, inhomogeneous mechanical properties and grain coarsening. Against this background, a thorough understanding of the hot-deformation mechanisms and microstructural evolution of 12Cr2Mo1V steel is essential and provides a fundamental basis for optimizing hot-deformation parameters and producing high-quality forgings.
Hot-compression tests, phenomenological constitutive modeling, hot-processing map construction and dynamic recrystallization (DRX) kinetic modeling represent well-established approaches to quantify the mechanical response and microstructural evolution of metallic materials under hot-deformation conditions. Arrhenius-type phenomenological constitutive equations describe the interrelationships among flow stress, strain, strain rate and deformation temperature; they enable flow–stress prediction and supply fundamental input data for finite-element simulations. Sellars and Whiteman proposed the hyperbolic sine Arrhenius constitutive formulation correlating peak flow stress with deformation variables, laying the foundation for phenomenological constitutive modeling of metallic materials [4]. Hot-processing maps built within the dynamic material model (DMM) framework are effective for evaluating hot workability and identifying feasible processing windows. Prasad et al. defined power-dissipation and flow-instability criteria from experimental flow–stress curves, allowing efficient assessment of hot-deformation performance without large-scale trial manufacturing [5]. Avrami-type kinetic models are widely adopted to quantify DRX volume fraction and grain-evolution behavior. McQueen and Ryan reported an Avrami-based DRX model governed by characteristic recrystallization time. Zahiri and Davies further improved modeling accuracy by calculating DRX fraction from the stress difference between ideal dynamic-recovery (DRV) curves and measured flow–stress curves [6,7]. Collectively, constitutive equations, hot-processing maps and DRX kinetic models form a mature technical framework for exploring hot-deformation mechanisms and optimizing forging processes. Nevertheless, conventional DRX kinetic models usually adopt unified parameters and assume a single dominant recrystallization mechanism, which limits their capability for materials undergoing transitions between continuous DRX (CDRX) and discontinuous DRX (DDRX) over wide temperature ranges. These methods have been extensively applied to various Cr–Mo-series steels and have generated abundant research outcomes.
Wang et al. performed hot-compression tests on a Cr–Mo steel for high-speed-rail brake disks over 850–1150 °C and 0.01–1 s−1. They acquired reliable flow–stress curves, calculated deformation activation energy and established a peak stress-based constitutive equation. Their work clarified the coupled influences of temperature and strain rate on hot-deformation behavior, showing that lower deformation temperature or higher strain rate increases peak stress and reduces peak strain [8]. Yuan et al. carried out hot-compression experiments on a Cr–Mo die steel at 950–1200 °C with strain rates ranging from 0.001 to 5 s−1 and confirmed obvious DRX occurrence during hot deformation. Furthermore, they constructed a full-strain-range phenomenological constitutive equation using eighth-order polynomial regression, which realized accurate flow–stress prediction across the whole deformation strain interval [9]. Bai et al. computed power-dissipation efficiency and flow-instability criteria from hot-compression flow–stress data and established hot-processing maps for a Cr–Mo high-temperature bearing steel under 950–1180 °C and 0.001–1 s−1, offering supportive data for hot-working-parameter optimization [10]. Xie et al. systematically investigated hot-compressive flow–stress evolution of 18CrNiMo7-6 steel at 900–1150 °C and 0.01–5 s−1. They demonstrated that hot deformation is controlled by competition between work hardening and DRX. High-temperature and low-strain-rate conditions promote DRX to counteract work hardening and decrease flow stress; conversely, low-temperature and high-strain-rate conditions suppress DRX and raise flow stress [11]. Despite considerable investigations into the hot-deformation behavior and recrystallization characteristics of various Cr–Mo alloy steels, targeted systematic studies focusing on 12Cr2Mo1V steel for large hydrogenation-reactor heavy forgings remain limited. Owing to its specific alloy composition and the demanding forming requirements for hydrogen-resistant service environments, the hot-deformation rules and microstructural-evolution mechanisms obtained from conventional Cr–Mo steels cannot be directly transferred to this grade. Moreover, traditional DRX kinetic models rely on unified parameters and presume one dominant recrystallization mechanism, making it difficult to precisely reproduce DRX behavior over broad temperature ranges where CDRX and DDRX alternately prevail. These research gaps hinder refined numerical simulation and precise microstructure control for 12Cr2Mo1V heavy forgings.
In the present work, systematic hot-compression experiments and theoretical modeling are performed to characterize the hot-deformation and DRX-evolution behavior of 12Cr2Mo1V steel. First, a strain-compensated Arrhenius constitutive model covering the full strain range is developed from hot-compression data to predict hot flow stress. Second, DMM-derived hot-processing maps are constructed to determine the feasible hot-working window for the investigated material. Third, considering temperature-dependent DRX-mechanism transitions, segmented DRX kinetic models are built for different temperature intervals. The calibrated constitutive and DRX sub-models are embedded into the commercial finite-element software DEFORM® (version 10) to conduct coupled thermo-mechanical–microstructural simulations, and simulation predictions are validated against experimental microstructures. This study provides theoretical support and technical references for process optimization, microstructure control and high-quality manufacturing of large hydrogenation-reactor forgings, and delivers a feasible modeling strategy for alloys exhibiting temperature-dependent dual-DRX mechanisms.
2. Materials and Methods
In this work, hot-compression tests of 12Cr2Mo1V steel were performed on a Gleeble-1500 thermo-mechanical simulator (Dynamic Systems Inc., Poestenkill, NY, USA). The chemical composition of the steel is as follows (in wt%): Fe −0.16C −2.43Cr −1.02Mo −0.32V −0.57Mn −0.07Si −0.004P −0.002S. The investigated 12Cr2Mo1V steel ingot (50 kg) was fabricated by vacuum induction melting (VIM). Prior to specimen processing, the outer layer with scale and near-surface segregation was completely machined off from the ingot. Machining was performed to fully remove all oxidized and segregated near-surface regions, to exclude the detrimental influence of surface oxidation and compositional heterogeneity. Cylindrical hot-compression specimens with final dimensions of Φ8 mm × 10 mm were then wire-cut and machined along the ingot axial direction at a radial position of one-third of the ingot radius measured from the ingot center, avoiding both the ingot core and outer ingot surface, from the ingot central region with minimized macroscopic compositional variation. Prior to hot-deformation tests, the as-cast initial microstructure of the 12Cr2Mo1V steel was routinely characterized.
2.1. Hot-Compression Tests
Two types of hot-compression tests were designed in the present work, namely isothermal hot-compression tests under constant strain rates and hot-compression tests under constant engineering deformation velocity. The isothermal compression tests were performed to acquire true stress–true strain curves (flow–stress curves), which provide fundamental data for constitutive modeling. In comparison, the constant-velocity compression tests were carried out with natural heat exchange between the specimen and the ambient environment. Such testing conditions can closely reproduce the actual working conditions of industrial hydraulic forging presses and are adopted to validate the accuracy of finite-element simulation results.
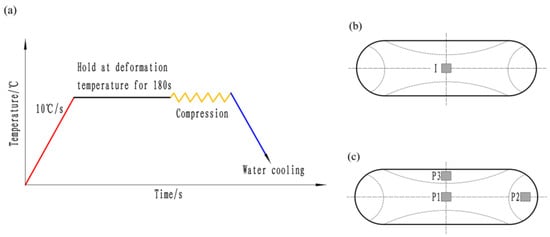
For the constant-strain-rate isothermal compression tests, specimens were compressed to a true strain of 0.69 (approximately 50% engineering strain) at six deformation temperatures (950, 1000, 1050, 1100, 1150, and 1200 °C) and four strain rates (0.01, 0.1, 1, and 5 s−1). For the constant engineering deformation velocity tests, specimens were heated to 1200 °C and compressed to an engineering strain of 50% at a velocity of 1 mm/s under an ambient temperature of 27 °C. Before compression, all specimens were heated to the target temperature at a heating rate of 10 °C/s and held isothermally for 3 min to ensure uniform temperature distribution, as schematically shown in Figure 1a. The true stress and true strain data were collected in real time via the built-in sensing system of the Gleeble-1500 simulator. Immediately after compression, all specimens were water-quenched rapidly to retain the high-temperature deformed microstructure for subsequent characterization.
Figure 1.
Technology flow chart of hot-compression test. (a) Temperature curves; (b) compressed specimen in isothermal hot-compression tests at constant strain rates; (c) compressed specimen in hot-compression tests at constant engineering deformation velocity.
2.2. Microstructural Characterization
After water quenching, the specimens were sectioned along the axial direction, followed by sequential grinding and polishing to obtain smooth and scratch-free cross-sections. Metallographic etching was performed using a saturated picric acid aqueous solution heated to 70 °C in a water bath, with an etching time of 40–60 s. Microstructural observation was implemented via an optical microscope (OM). As shown in Figure 1b, microstructural characterization was focused on the central deformation region (Region I) for specimens deformed under constant strain rates. For specimens compressed at a constant engineering deformation velocity, microstructural detection was performed at three typical positions (P1, P2, and P3), as shown in Figure 1c, to provide experimental data on the spatial variation in microstructural evolution for comparison and validation against finite-element simulation results.
2.3. Finite-Element Simulation
Commercial DEFORM-3D software (version 10) was employed for finite-element(FE) numerical simulation. The experimentally measured flow–stress data and the DRX kinetic model established in this study were embedded into the software database. Coupled thermo-mechanical simulations considering DRX evolution were subsequently conducted to systematically analyze the hot-deformation behavior and internal microstructural evolution of 12Cr2Mo1V steel during hot forging.
3. Results and Discussion
3.1. Friction Correction of Flow Stress
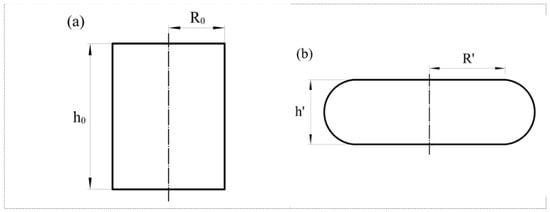
During hot-compression tests, although lubrication measures are applied to the specimen–tool interfaces, friction between the compression platens and the specimen ends remains unavoidable due to lubricant film rupture and high-temperature volatilization of the lubricant during deformation. This interfacial friction impedes the radial flow of the surface material at the specimen ends, leading to progressive barreling (bulging) of the specimen side surface throughout the compression process. Consequently, the ideal uniaxial stress state is perturbed, introducing systematic deviations in the experimentally measured flow stress, as schematically illustrated in Figure 2. To obtain a more accurate representation of the intrinsic mechanical behavior of the material, it is necessary to correct the flow–stress curves for the effect of interfacial friction [12,13,14], as expressed by Equation (1).
where P is the as-measured (uncorrected) flow stress, h is the instantaneous height of the specimen, h0 is the initial height of the specimen, Δh is the instantaneous reduction, R is the instantaneous radius of the specimen, R0 is the initial radius of the specimen, and W is the friction factor.
where R is the nominal radius of the specimen after compression, h is the height of the specimen after compression, and ΔR is the barreling (bulging) amount of the specimen.
Figure 2.
The compression test diagram. (a) Before deformation; (b) after deformation.
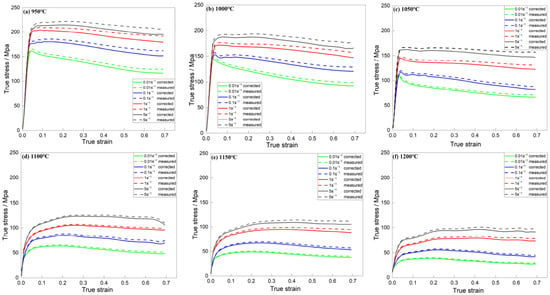
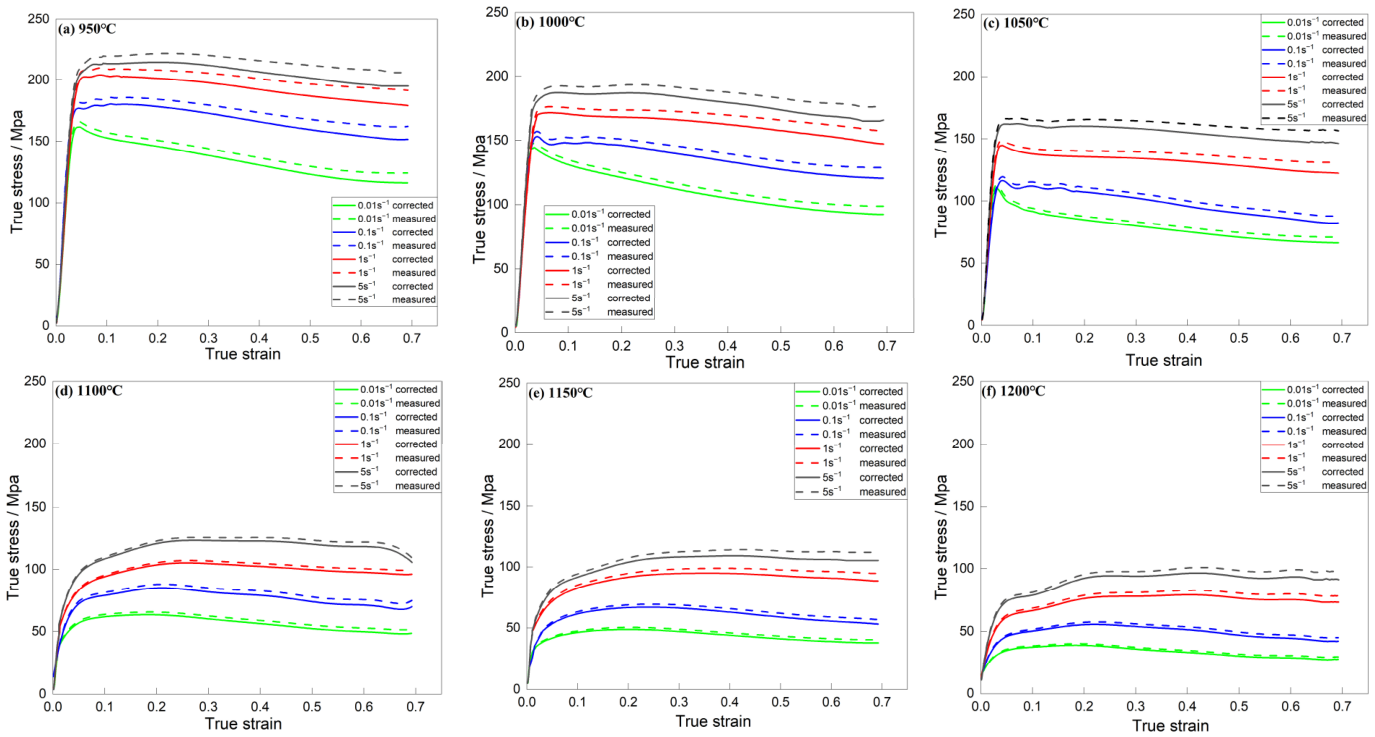
Figure 3 compares flow–stress curves with and without friction correction under different deformation conditions (solid lines: corrected values; dashed lines: as-measured values). It can be observed that, across the entire range of deformation temperatures 950–1200 °C and strain rates 0.01–5 s−1, the corrected flow–stress curves consistently lie below the as-measured curves. This phenomenon can be attributed to the effect of interfacial friction during hot compression: friction at the specimen–platen interfaces restricts the plastic flow of material at the specimen ends, inducing barrel-shaped deformation (barreling). Consequently, the as-measured stress values contain an additional stress component arising from friction. After correction, the frictional contribution is eliminated, yielding the corrected flow stress under the same deformation conditions, which accounts for the observed reduction in stress magnitude. All flow stresses presented below are the corrected stresses.
Figure 3.
Experimentally measured and corrected flow–stress curves of 12Cr2Mo1V steel.
3.2. Flow–Stress Curves of 12Cr2Mo1V Steel
Figure 3 records the flow–stress curves of 12Cr2Mo1V steel during hot deformation. The material shows evident DRX responses, and the overall deformation procedure is categorized into four characteristic stages by macroscopic curve evolution. (i) Rapid work-hardening stage: In the early deformation stage, flow stress rises sharply with increasing strain. This phenomenon originates from rapid dislocation multiplication and severe dislocation tangling, which significantly increases the overall dislocation density and results in work hardening. (ii) Decelerated hardening stage: With continuous strain accumulation, dislocations undergo slip, climb, and cross-slip at elevated temperatures, facilitating dislocation rearrangement and subgrain formation. The activated DRV gradually offsets partial work-hardening responses and reduces the rising rate of flow stress. (iii) The DRX softening stage: Further straining facilitates subgrain coalescence and stimulates the nucleation of new strain-free grains, corresponding to the initiation of DRX. The softening effect induced by DRX substantially counteracts work hardening. Accordingly, the increment in flow stress is remarkably restrained, and the flow stress gradually declines after reaching the peak value. (iv) Steady-state deformation stage: Beyond the peak strain, work hardening, DRV, and DRX gradually reach a dynamic competitive equilibrium. The hot-deformation behavior of 12Cr2Mo1V steel is highly sensitive to deformation temperature and strain rate. At a fixed strain rate, flow stress gradually drops as the deformation temperature rises. Meanwhile, higher strain rates always lead to higher flow stresses under the same deformation temperature. The distinct stress evolution behaviors are identified under different temperature ranges. At low deformation temperatures of 950–1050 °C, flow stress rises sharply prior to peak strain. By contrast, flow stress increases moderately before peak strain at high temperatures ranging from 1100 to 1200 °C.
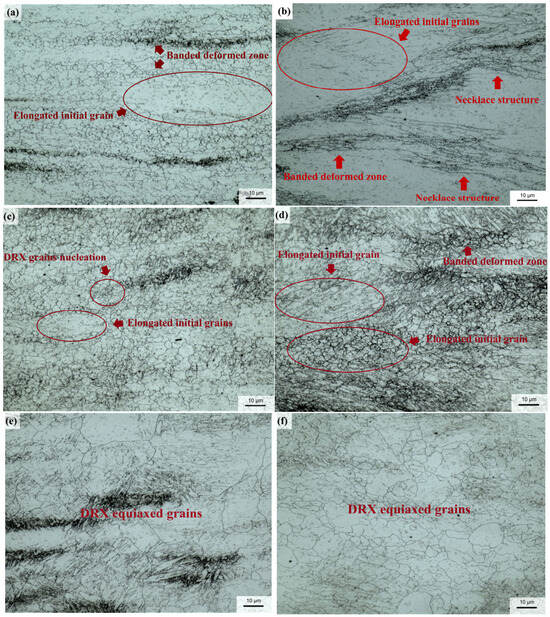
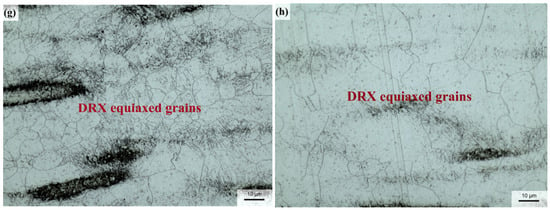
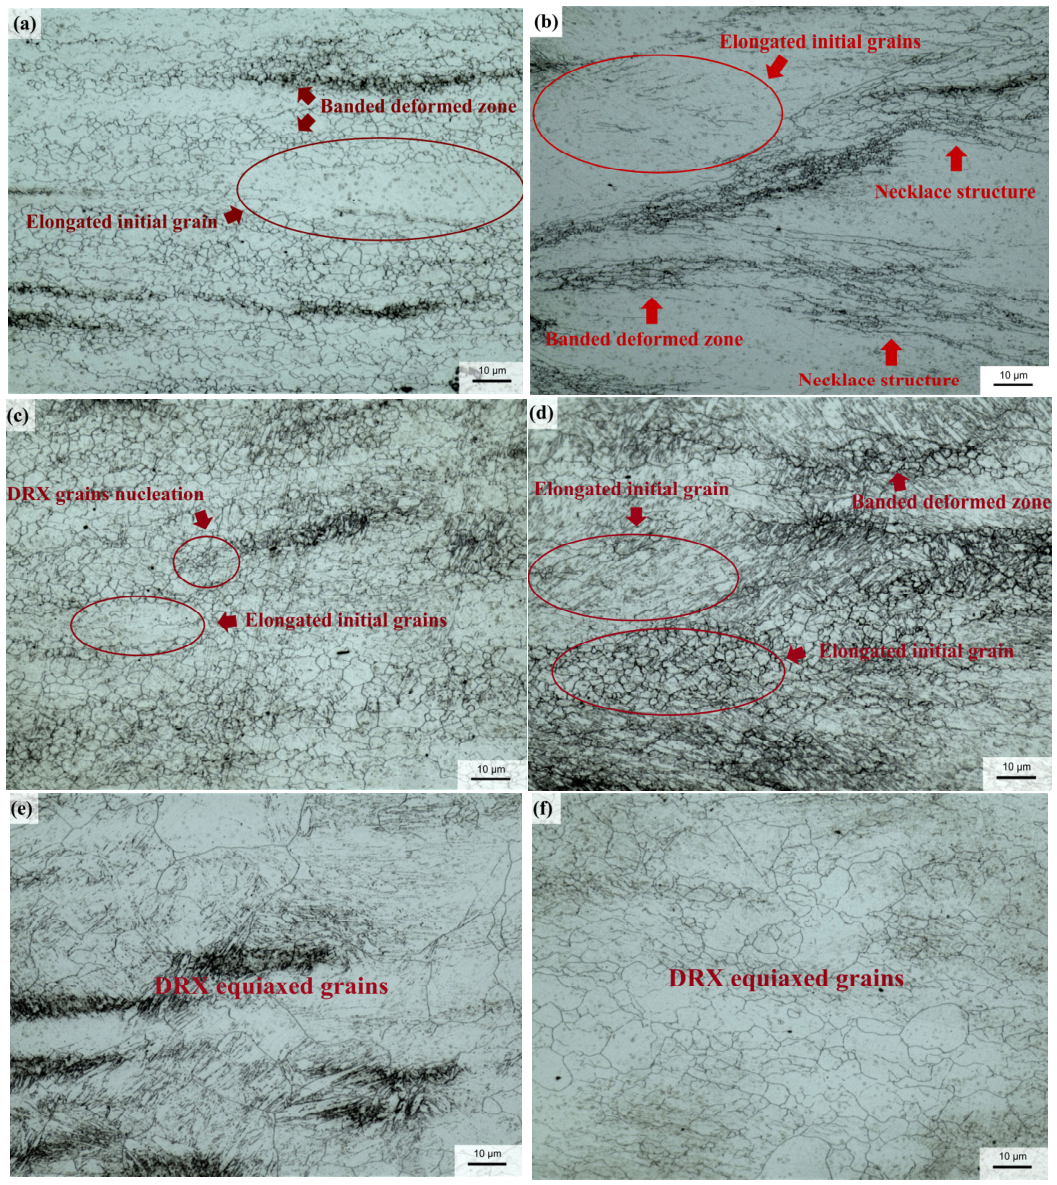
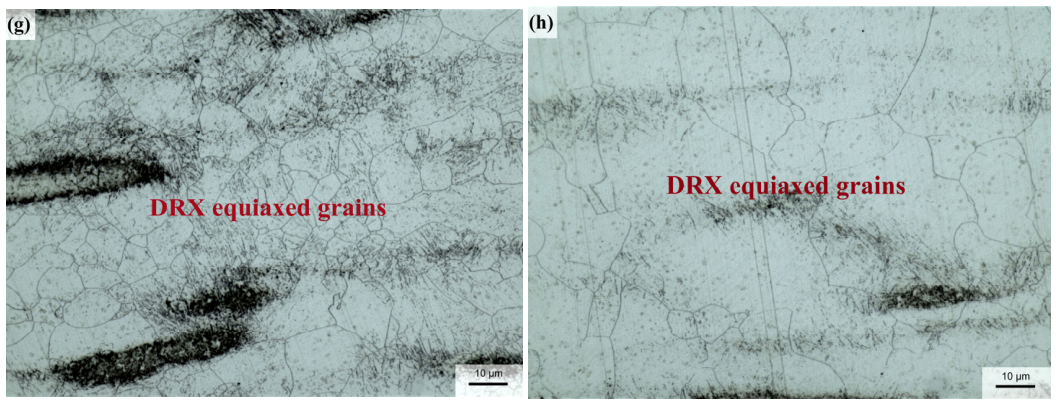
Supported by our previous research on 12Cr2Mo1V steel, this work further verifies that CDRX dominates microstructural evolution at low deformation temperatures, while DDRX governs the microstructural response at high temperatures [15]. Microstructural observations were performed over deformation temperatures of 950–1200 °C and strain rates of 0.01 s−1 and 5 s−1 in Figure 4. Figure 4a–d show the microstructures deformed at low temperatures of 950 °C and 1050 °C, whereas Figure 4e–h present the microstructures obtained at high-temperature conditions of 1100 °C and 1200 °C.
Figure 4.
Microstructures after hot deformation: (a) 950 °C/0.01 s−1; (b) 950 °C/5 s−1; (c) 1050 °C/0.01 s−1; (d) 1050 °C/5 s−1; (e) 1100 °C/0.01 s−1; (f) 1100 °C/5 s−1; (g) 1200 °C/0.01 s−1; (h) 1200 °C/5 s−1.
At low deformation temperatures ranging from 950 to 1050 °C, inhomogeneous deformation features can be observed for both applied strain rates. Original grains are severely elongated along the deformation direction to form a deformed matrix. It should be noted that the elongated initial grains observed after hot deformation are deformation-induced features governed by inhomogeneous strain distribution under compressive loading, instead of inherent metallographic characteristics of the starting material. The homogenized as-cast ingot possesses uniform equiaxed grains prior to deformation. Under a maximum true strain of 0.69, prior austenite grains are stretched along the radial material-flow direction perpendicular to the compression axis, forming an elongated grain morphology together with local banded deformed zones caused by strain localization. Continuous, parallel banded deformed zones are widely distributed within these elongated grains and exhibit obvious layered morphology. Such banded regions originate from intense thermoplastic deformation and accumulate high dislocation density and lattice distortion energy, which facilitate subgrain formation and provide potential nucleation sites for DRX. Driven by locally concentrated strain energy inside banded deformed zones, dislocations continuously rearrange and annihilate in the deformed matrix. The generated substructures gradually evolve into fine, uniformly sized equiaxed grains. These refined grains continuously nucleate and aggregate along elongated grain boundaries and banded deformed zones, eventually producing a typical necklace structure surrounding deformed grains. The coexistence of elongated matrix grains, banded deformed zones and necklace-type recrystallized grains confirms that CDRX is the predominant DRX mechanism under low-temperature deformation.
In contrast, completely different microstructural features are obtained at high deformation temperatures of 1100–1200 °C in Figure 4e–h. Elongated original grains and continuous banded deformed zones observed at low temperatures are no longer visible, leading to a relatively homogeneous microstructure. The necklace structure characteristic of CDRX disappears regardless of strain rate. Under high-temperature conditions, coarse original grain boundaries are significantly curved with prominent local bulges. New fine equiaxed grains preferentially nucleate at these bulged grain boundaries and grow by consuming the surrounding deformed matrix. These recrystallized grains exhibit strain-free equiaxed shapes and are discretely distributed along prior grain boundaries. Grain-boundary bulging, discrete grain-boundary nucleation and independent growth of equiaxed grains are well-recognized signatures of DDRX [16,17,18,19,20], demonstrating that DDRX controls microstructural evolution for 12Cr2Mo1V steel at high deformation temperatures.
Overall, the microstructural results reveal a clear temperature-dependent transition in dominant DRX mechanisms. Low-temperature deformation generates elongated grains and continuous banded deformed zones, which promote subgrain development and necklace-structure formation by CDRX. At high temperatures, inhomogeneous banded-deformation features vanish, and microstructural evolution is governed by DDRX through grain-boundary-bulging nucleation and discrete equiaxed grain growth. Accordingly, a comprehensive constitutive model coupling both CDRX and DDRX is required to accurately describe the microstructural evolution of 12Cr2Mo1V steel during thermoplastic deformation.
3.3. Peak Stress Constitutive Equation of 12Cr2Mo1V Steel
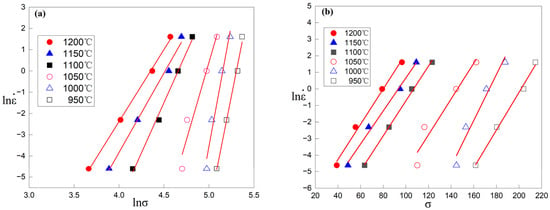
Based on the corrected flow–stress curves (solid line) shown in Figure 3, a hyperbolic sine-type Arrhenius phenomenological constitutive equation is established for 12Cr2Mo1V steel, as expressed by Equations (6)–(8)
where n is the stress exponent, is the strain rate (in s−1), T is the deformation temperature (in K), Q is the hot-deformation activation energy (in J·mol−1), R is the molar gas constant (in J·(mol·K)−1), and σ is the true stress (in MPa). A, A1, A2, n, n1, α and β are all material constants. Among them, α = β/n1, and R = 8.314 J·(mol·K)−1.
Taking the natural logarithm of both sides of Equations (6), (7) and (8), respectively, yields:
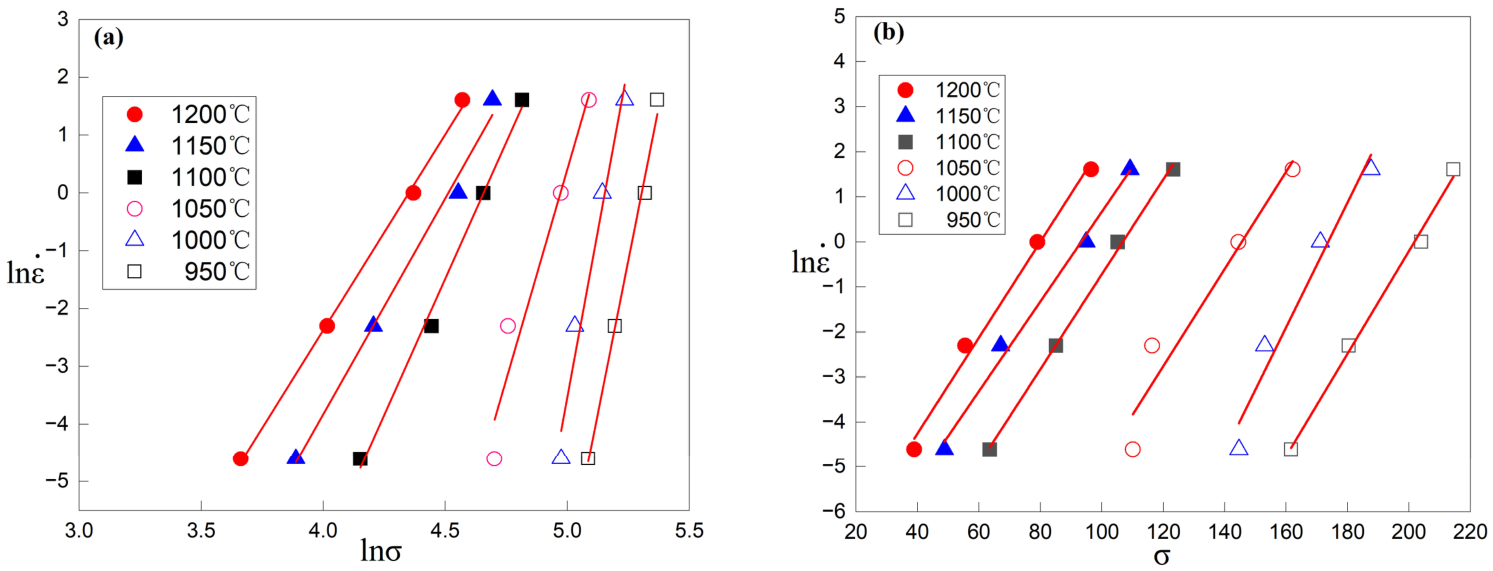
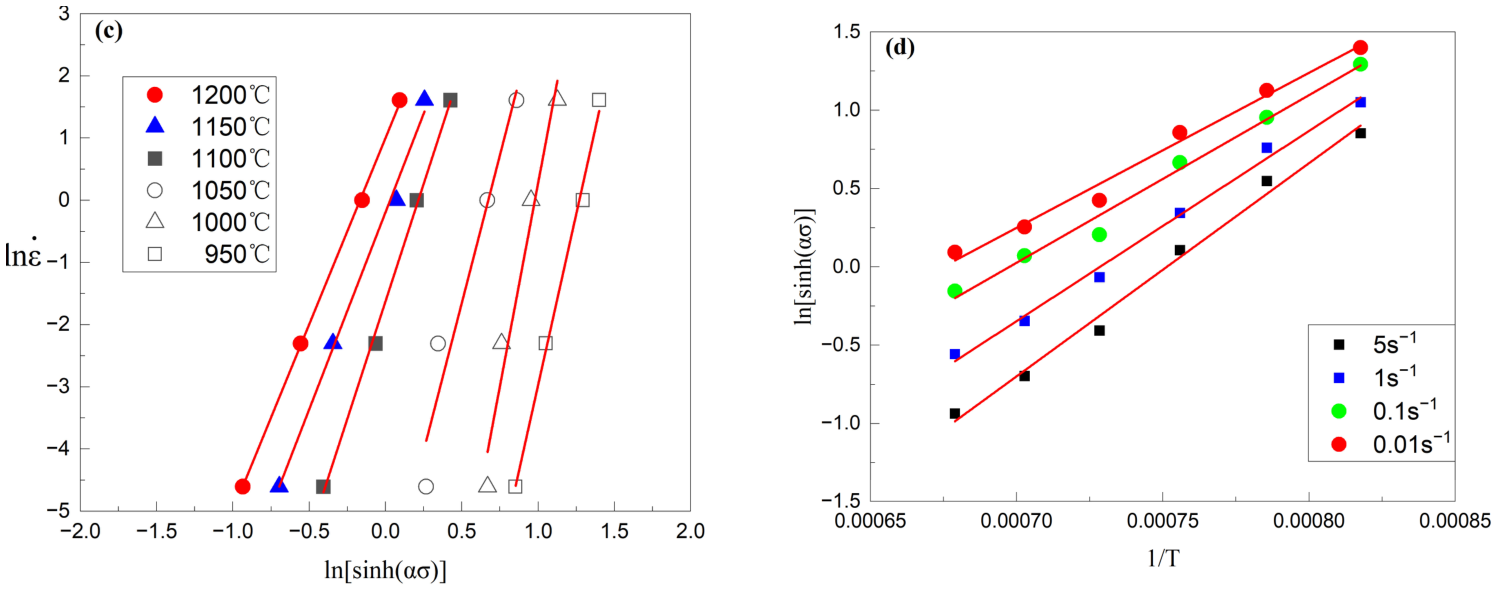
The material constant n can be determined by linear fitting of and the material constant β can be obtained by linear fitting of . In the present study, the values of n1 at different temperatures are 6.776, 7.476, 9.441, 14.540, 23.019, and 21.265, respectively; the corresponding values of β are 0.016, 0.013, 0.011, 0.007, 0.006, and 0.005, respectively. The average value of the material constant α, defined by α = β/n1, is determined to be 9.828 × 10⁻³, as illustrated in Figure 5a,b.
Figure 5.
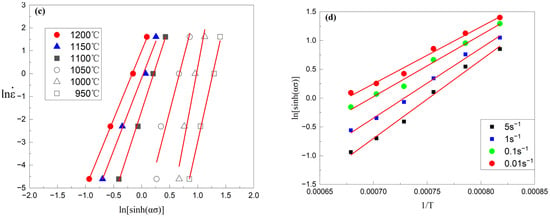
The linear relationship of (a) , (b) , (c) , (d) .
At a constant strain rate , partial differentiation of both sides of Equation (11) with respect to 1/T yields the expression for the hot-deformation activation energy Q, as given by Equation (12). Substituting the slopes obtained from the linear fitting of and into Equation (12) gives the values of the deformation activation energy Q, as illustrated in Figure 5c,d. According to Equation (8), the material constant n can also be derived from the slope of the linear fitting of , as shown in Equations (11) and (13).
In the present study, the values of n at different temperatures are 5.512, 5.832, 6.949, 8.752, 12.003, and 10.126, respectively, yielding an average value of 8.196; the slopes of at different strain rates are 1.401 × 10³, 1.214 × 10³, 1.070 × 10³, and 9.894 × 10², respectively. According to Equation (12), the corresponding deformation activation energies Q are calculated as 864.619 × 10³ J·mol−1, 827.134 × 10³ J·mol−1, 728.904 × 10³ J·mol−1, and 674.135 × 10³ J·mol−1, respectively, with an average value of 773.698 × 10³ J·mol−1.
The material constant A can be determined by substituting the deformation activation energy Q into the intercept of the linear fitting equation. In the present study, the values of the material constant A at different temperatures are 1.095 × 1030, 2.082 × 1028, 5.381 × 1028, 5.847 × 1027, 1.598 × 1026, and 9.489 × 1026, respectively, yielding an average value of 1.795 × 1028.
The Zener–Hollomon parameter (Z-parameter) integrates the effects of strain rate and deformation temperature on hot-deformation behavior into a single variable as expressed in Equation (14), making it a fundamentally important physical quantity in the research on hot deformation [21,22]. By performing an inverse hyperbolic sine transformation on the Z-parameter, the peak stress constitutive equation expressed in terms of the Z-parameter can be derived, as Equation (15).
In summary, by substituting the obtained material constants into Equation (15), the peak stress constitutive equation for 12Cr2Mo1V steel is derived, as expressed by Equations (16) and (17).
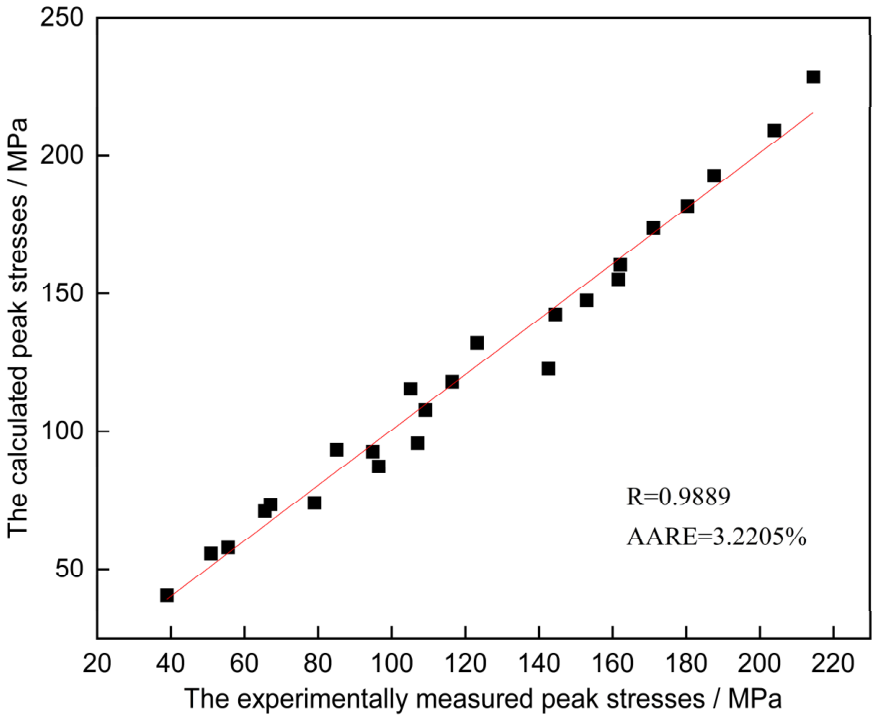
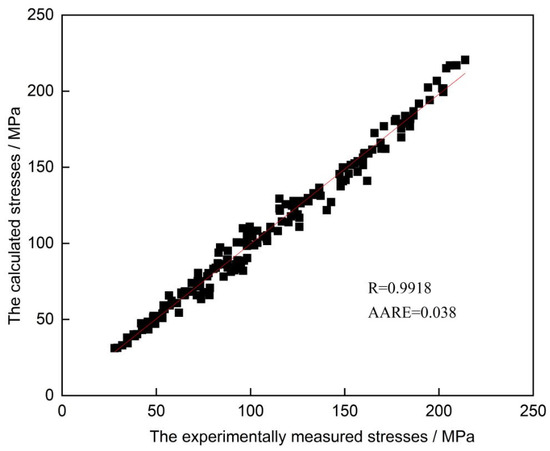
Figure 6 presents the correlation between the calculated and measured peak stresses of 12Cr2Mo1V steel under various deformation conditions. The Pearson correlation coefficient R and the average absolute relative error AARE of the peak stress model are determined to be 0.9889 and 3.2205%, respectively, as calculated by Equations (18) and (19). The results indicate that the established peak stress phenomenological constitutive equation can accurately predict the actual peak stress, which provides a foundation for the subsequent development of a strain-compensated constitutive equation covering the full strain range.
where Ei is the experimentally measured stress, is the mean value of the experimental stresses, Pi is the calculated stress value, is the mean value of the calculated stresses, and N is the number of stress data points selected for the calculation [23].
Figure 6.
Correlation between calculated and measured peak stress values. R denotes the Pearson correlation coefficient, and AARE denotes average absolute relative error.
3.4. The Strain-Compensated Constitutive Equation of 12Cr2Mo1V Steel
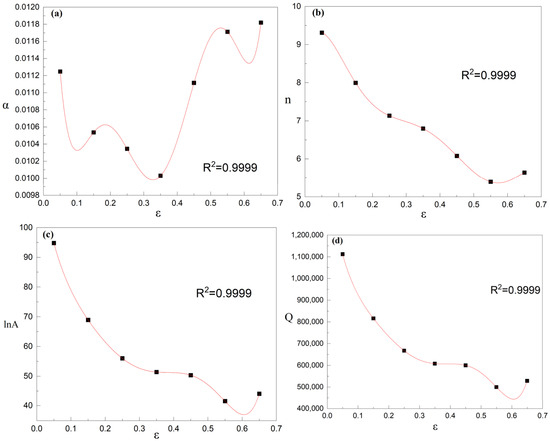
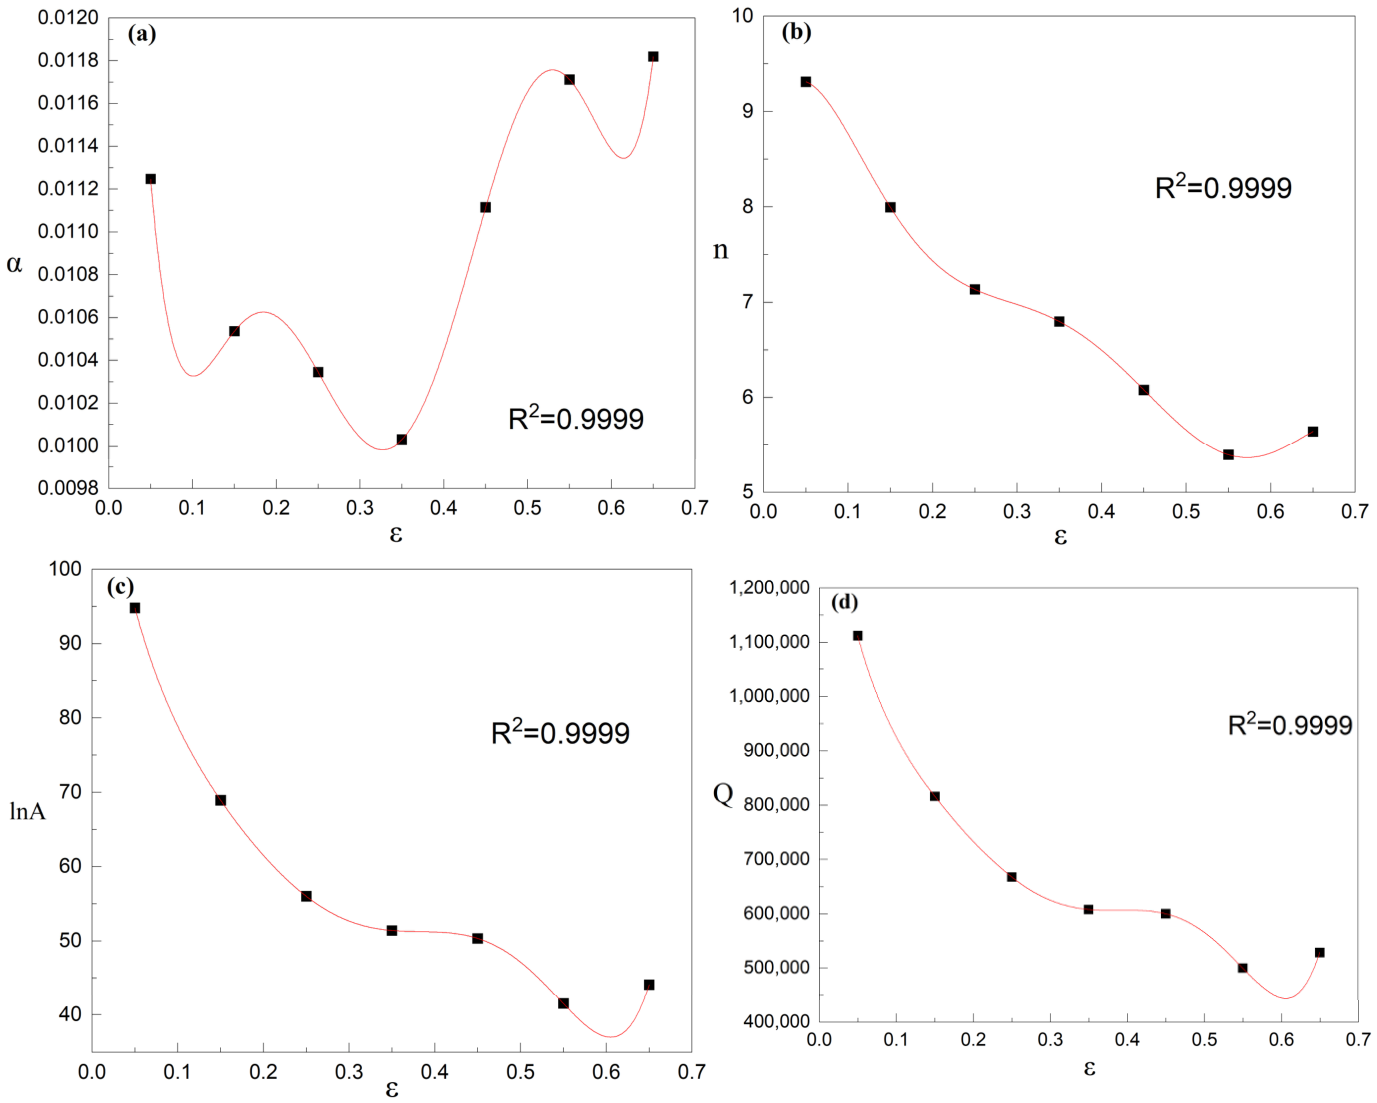
Since the peak stress constitutive equation can only characterize the material behavior at the peak strain, to establish a strain-compensated constitutive equation covering the full strain range, data points are extracted from each flow curve at strain intervals of 0.1 within the strain range of 0.05–0.65. Following the same methodology used for establishing the peak stress constitutive equation, the material constants α, n, lnA, and the hot-deformation activation energy Q are determined at each strain level. Subsequently, sixth-order polynomial fitting is employed to describe the evolution of these material parameters with strain [24], as illustrated in Figure 7 and Table 1 and Table 2.
Figure 7.
Sixth-order fitting relationship of material constants and deformation activation energy. (a) The material constant α, (b) The material constant n, (c) The material constant lnA, (d) The material constant Q.
Table 1.
The material constants at different strains.
Table 2.
Sixth-order polynomial coefficients for material constants and deformation activation energy.
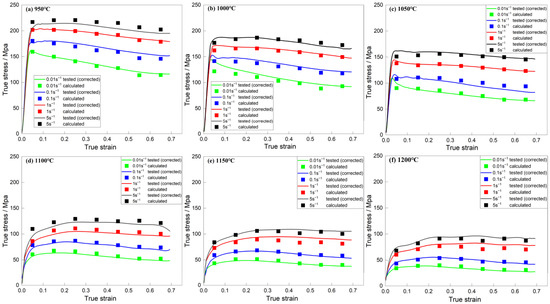
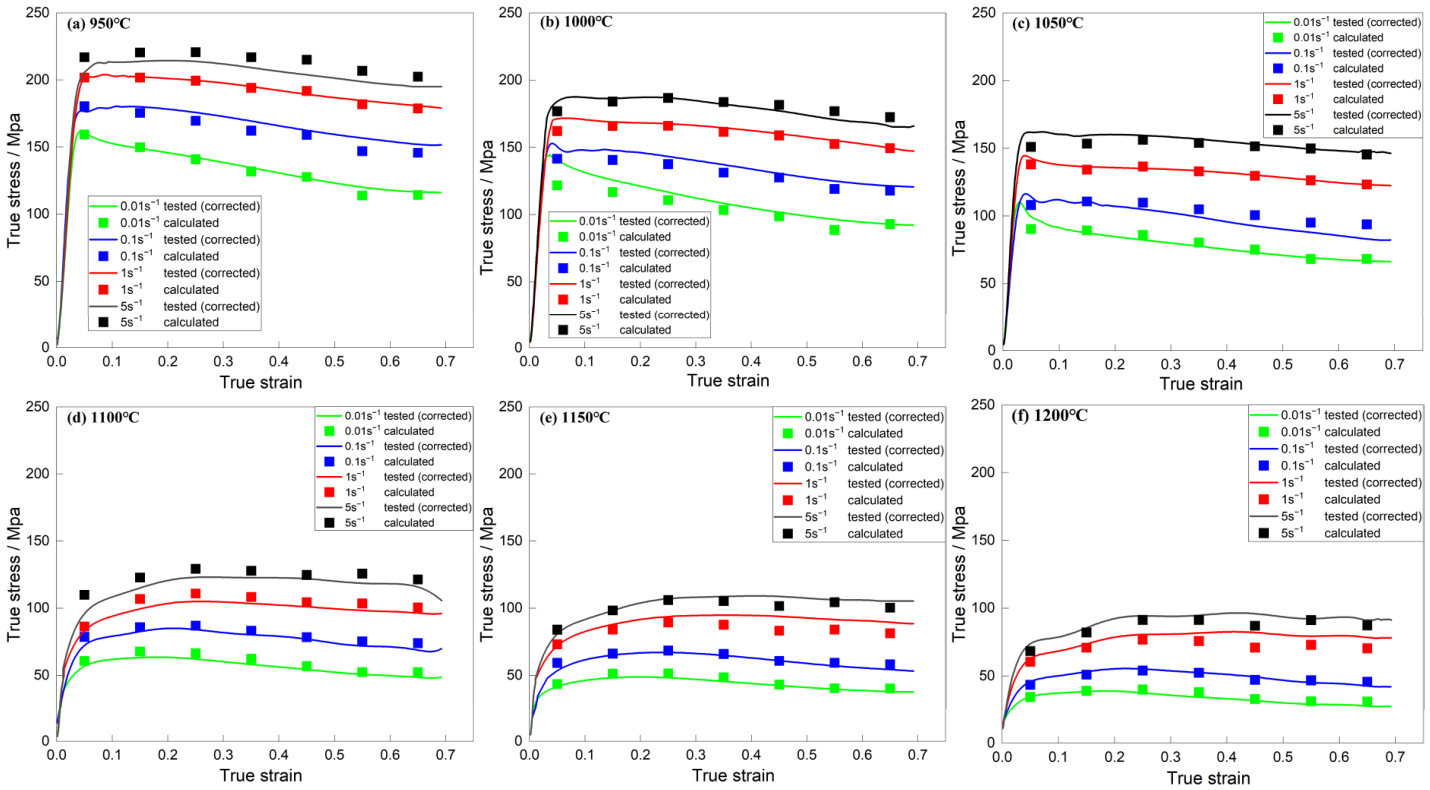
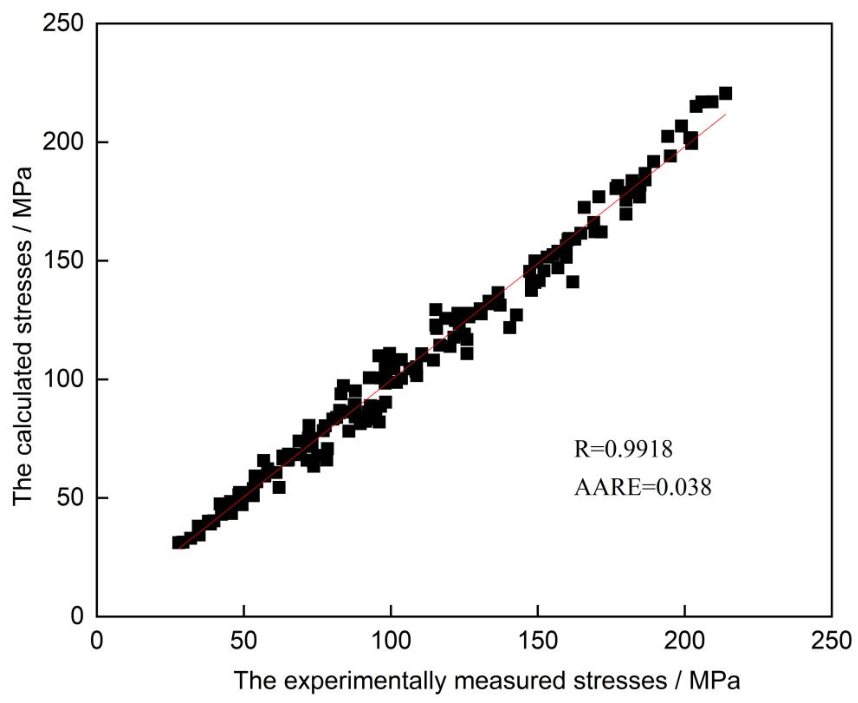
The form of the strain-compensated constitutive equation is given by Equations (20) and (21). By substituting the parameters listed in Table 2 into Equation (18), the calculated stress values at different strains can be obtained, as shown in Figure 8. In Figure 8, the solid lines represent the corrected as-measured flow–stress curves. The stress values calculated by the strain-compensated constitutive equation are in good agreement with the experimental values, with a Pearson correlation coefficient R = 0.9918 and an average absolute relative error AARE = 3.8826%, as shown in Figure 9. These results indicate that the strain-compensated constitutive equation can accurately reflect the actual flow–stress curves and reliably describe the hot-deformation behavior of 12Cr2Mo1V steel.
Figure 8.
Comparison between actual and calculated values of the flow–stress curve.
Figure 9.
The correlation between calculated and actual values of true stress.
3.5. Hot-Processing Map of 12Cr2Mo1V Steel
Based on Prasad’s dynamic material model (DMM) theory, the hot-processing map is constructed by superimposing a power-dissipation map and a flow-instability map, which enables the quantitative evaluation of the hot workability of the material [25]. The power-dissipation map is a contour plot constructed based on the dissipation efficiency factor. The total power dissipation P during plastic deformation consists of two components: one is the energy dissipation G associated with plastic deformation, which is mainly dissipated in the form of heat; the other is the dissipative co-content J related to microstructure evolution, which is consumed in driving DRV and DRX. The total power dissipation P is expressed by Equation (22). Building upon the power-dissipation theory, the flow-instability criterion is introduced, and the flow-instability map is constructed through calculations based on Equation (25). By superimposing the power-dissipation map and the instability map, a complete hot-processing map is obtained, which clearly delineates the stable processing regions and flow-instability regions within the hot-deformation parameter range, thereby providing a theoretical basis for determining the optimal forging processing window.
According to the DMM proposed by Prasad [26], the dissipative co-content J quantifies the power consumed by microstructural evolution during hot deformation. The specific metallurgical mechanisms consuming J vary significantly with deformation temperature. At lower temperatures 950–1050 °C, limited grain-boundary mobility suppresses grain-boundary bulging. Correspondingly, the microstructures exhibit prominent dislocation rearrangement, subgrain formation and subgrain rotation, indicating that DRV and CDRX are the dominant mechanisms consuming J. At higher temperatures 1100–1200 °C within the stable processing domain, enhanced grain-boundary mobility changes the major energy-consumption pathway for J. Observations of necklace structures and strain-free equiaxed grains demonstrate that DDRX, including grain-boundary bulging and nucleation-and-growth of recrystallized grains, becomes the primary mechanism. In instability regions, homogeneous DRV and DRX are suppressed; the deformation energy corresponding to J is concentrated in localized banded-deformation zones and non-uniform plastic flow, which promotes the generation of microstructural defects. The optimal processing window of 1000–1200 °C and 0.01–0.1 s−1 corresponds to the parameter domain where J can be efficiently converted to activate homogeneous DDRX, yielding homogeneous microstructures desirable for heavy forgings of petrochemical hydrogenation reactors.
The power-dissipation efficiency factor η is derived from the strain rate sensitivity coefficient m, which reflects the ratio of the energy dissipation associated with microstructure evolution to the linear energy dissipation during deformation, as expressed by Equation (24).
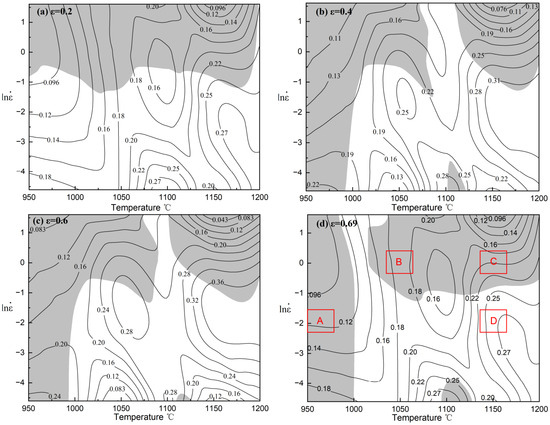
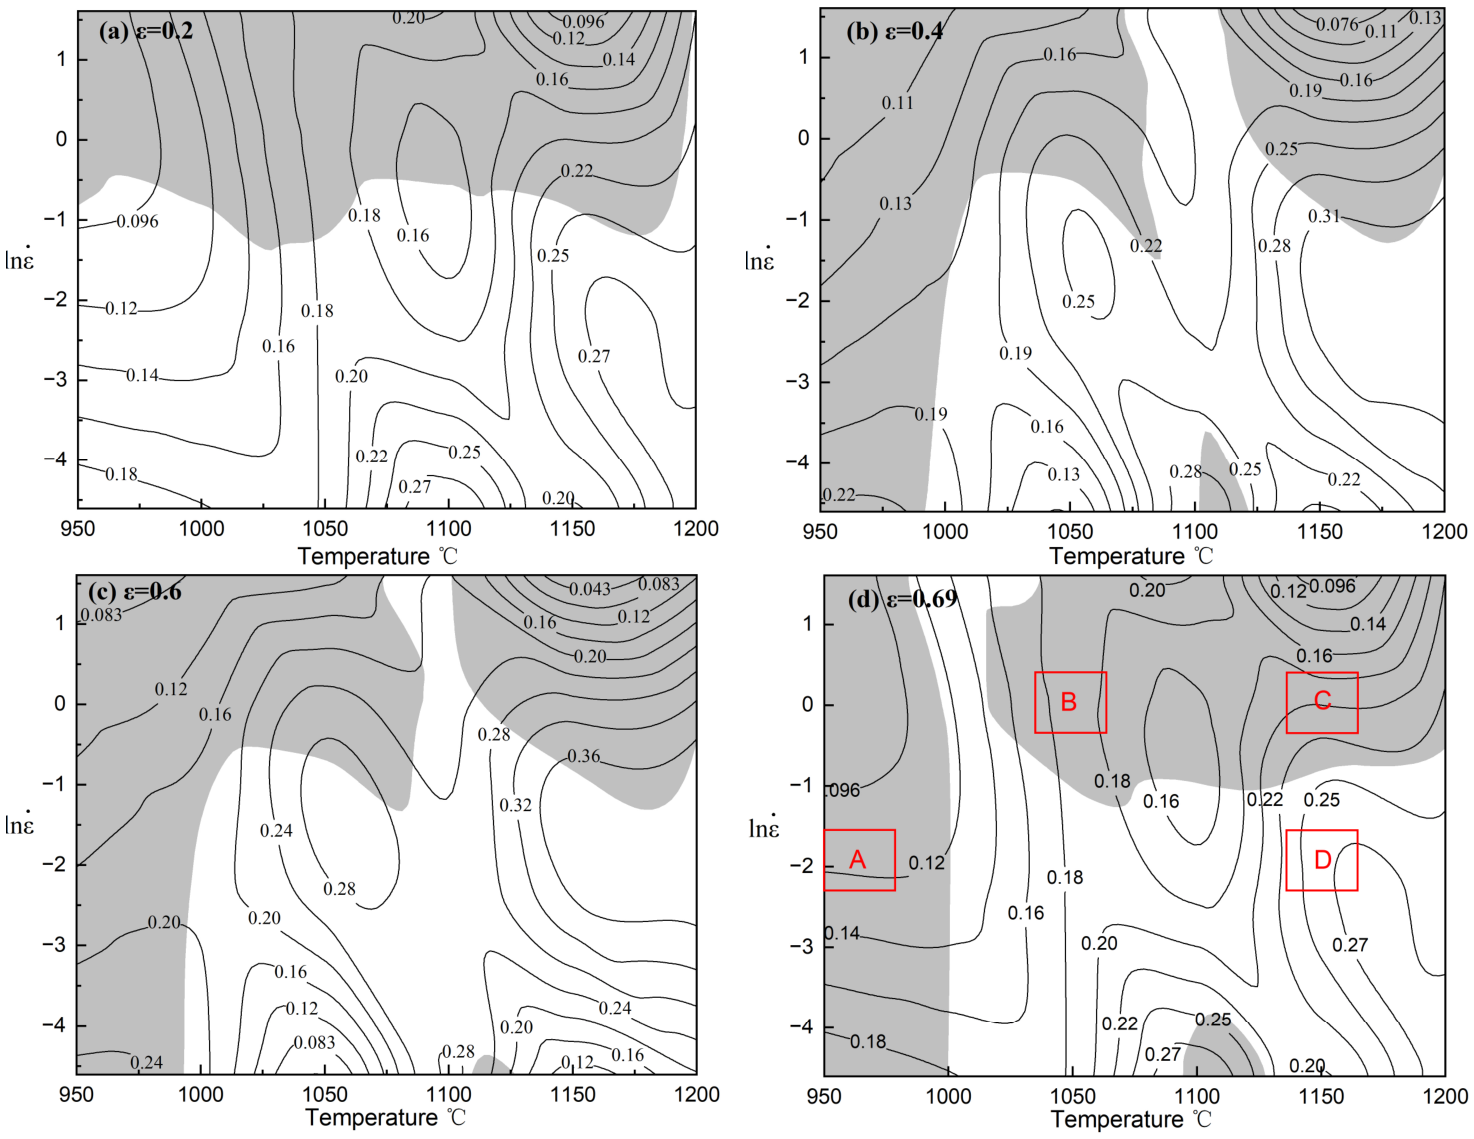
Based on the hot-compressed flow–stress curves, hot-processing maps of 12Cr2Mo1V steel were established at true strains of 0.2, 0.4, 0.6, and 0.69, as illustrated in Figure 10. The processing map results show that the gray-shaded instability regions exhibit obvious strain-dependent evolution characteristics. For deformation temperatures below 1000 °C, the instability domains gradually expand from high strain rates toward low strain rates with the increase in true strain. In particular, when the strain rate exceeds 1 s−1, instability regions widely cover the entire investigated temperature range, indicating a poor hot-deformation compatibility under high-strain-rate conditions. Correspondingly, the optimal stable deformation domain for 12Cr2Mo1V steel is confirmed to be concentrated in the temperature range of 1000–1200 °C and the low strain rate range of 0.01–0.1 s−1.
Figure 10.
The hot-processing maps of 12Cr2Mo1V steel in different deformation conditions.
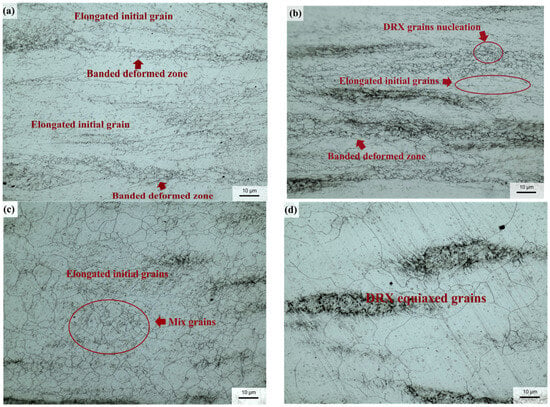
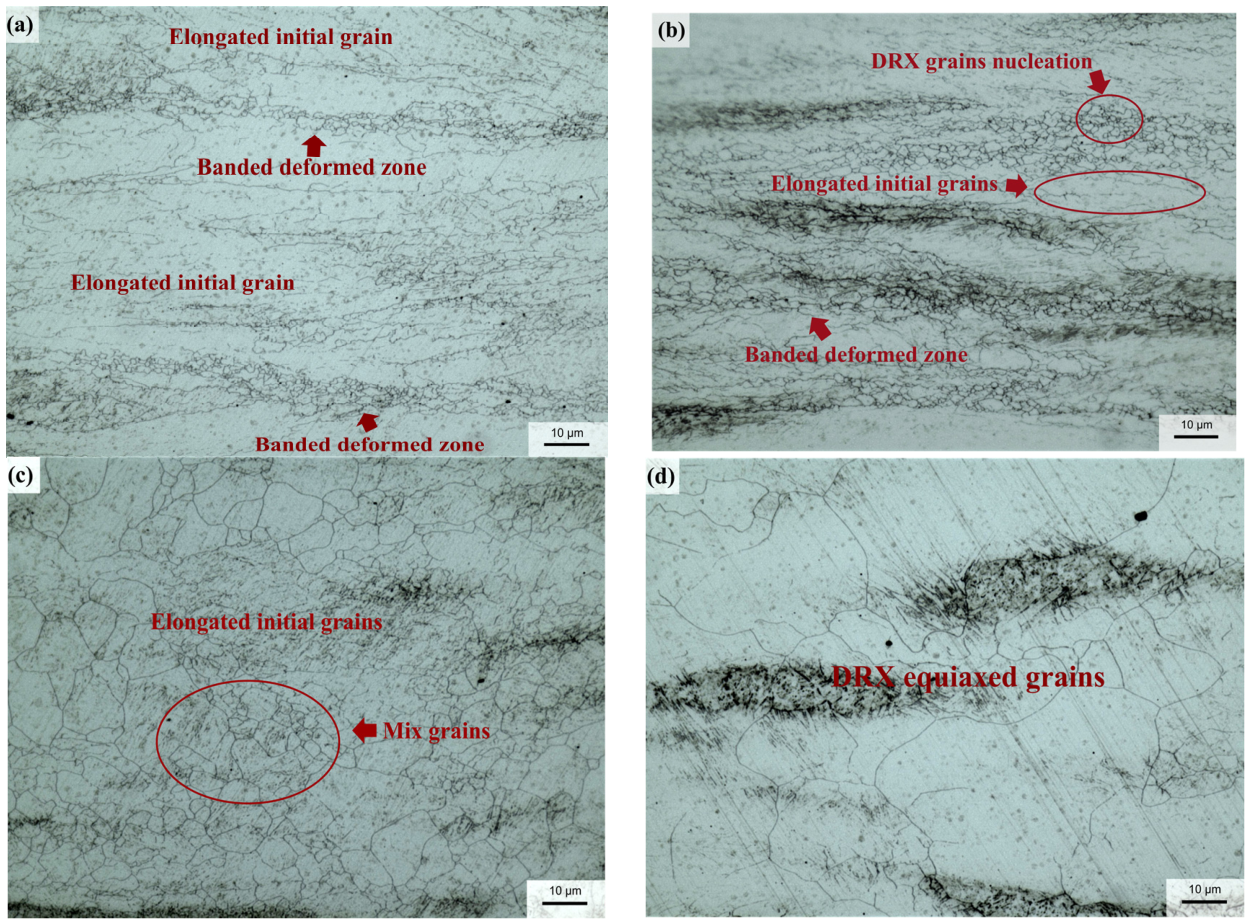
Figure 11 presents the microstructural morphologies of 12Cr2Mo1V steel under typical unstable and stable deformation conditions. The samples deformed at 950 °C/0.1 s−1 (Zone A), 1050 °C/1 s−1 (Zone B), and 1150 °C/1 s−1 (Zone C) exhibit typical defective and inhomogeneous microstructures. These microstructures are dominated by severely elongated deformed grains and continuous banded-deformation zones, with only a small amount of DRX grains generated during deformation. Even at the relatively high temperature of 1150 °C/1 s−1, locally formed equiaxed DRX grains fail to effectively homogenize the matrix microstructure, and a prominent mixed-grain feature remains prevalent. Such heterogeneous morphological characteristics demonstrate that the above process parameters correspond to unstable hot-deformation domains that are susceptible to microstructural defects. In contrast, the representative stable condition of 1150 °C/0.1 s−1 (Zone D) produces a uniform microstructure consisting of fully developed equiaxed DRX grains with negligible microstructural defects. The sufficient and homogeneous DRX response establishes a stable microstructural state, which further verifies the accuracy and reliability of the optimized stable hot-processing domain.
Figure 11.
Microstructure of 12Cr2Mo1V steel in the unstable hot-working area (ε = 0.69): (a) 950 °C/0.1 s−1; (b) 1050 °C/1 s−1; (c) 1150 °C/1 s−1; (d) 1150 °C/0.1 s−1.
Integrated analysis of processing maps and microstructural observations clarifies the coupled influence of deformation temperature and strain rate on the hot-deformation response of 12Cr2Mo1V steel. High-temperature and low-strain-rate conditions supply adequate thermal activation energy and sufficient deformation duration, which facilitates the nucleation and continuous growth of DRX grains. Under such favorable deformation environments, strain-distorted grains can be completely transformed into homogeneous, strain-free equiaxed grains, eliminating internal microstructural defects and substantially improving the hot-deformation stability of the steel. On the contrary, low-temperature and high-strain-rate conditions significantly constrain dislocation movement and grain boundary migration, thereby strongly suppressing DRX progression. Defective structural features, including elongated deformed grains, continuous banded zones and heterogeneous mixed grains, cannot be eliminated during deformation. The sustained accumulation of microstructural defects with increasing strain eventually induces macroscopic plastic flow instability.
3.6. Dynamic Recrystallization Model of 12Cr2Mo1V Steel
The DRX model proposed by S. F. Medina, C. A. Hernández et al., based on the Avrami equation, is an important approach for evaluating the extent of DRX during material deformation [27], as expressed by Equation (26).
where XR is the volume fraction of DRX, εc is the critical strain for DRX initiation, Q1 is the activation energy for DRX, k, n2, α1 and β1 are material constants, and ε0.5 is the strain corresponding to a DRX volume fraction of 50%.
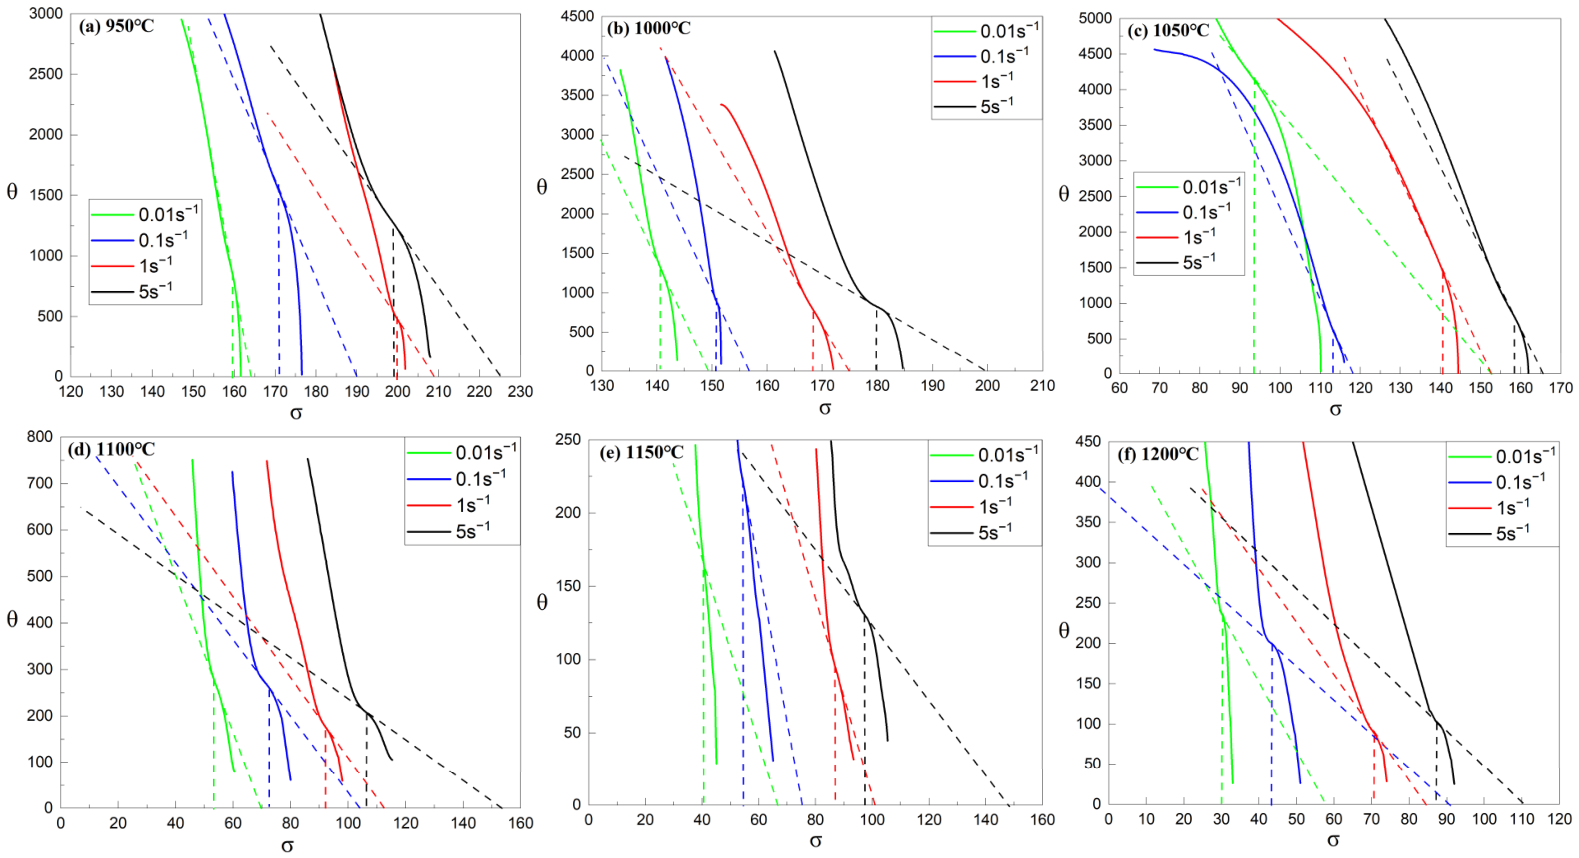
The work-hardening rate θ can be calculated according to Equation (28).
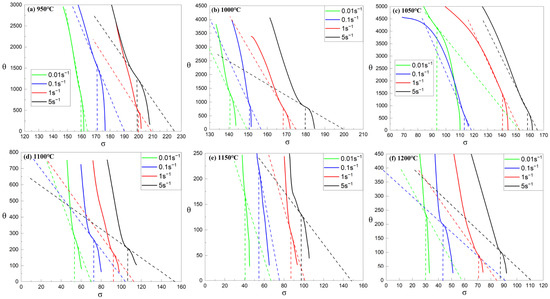
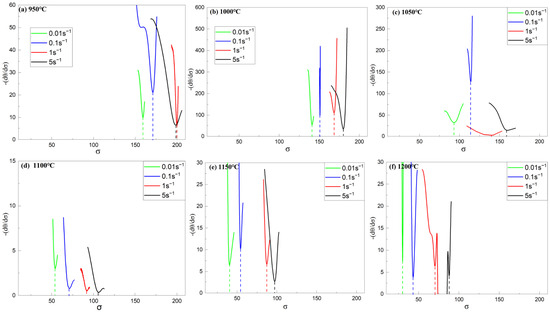
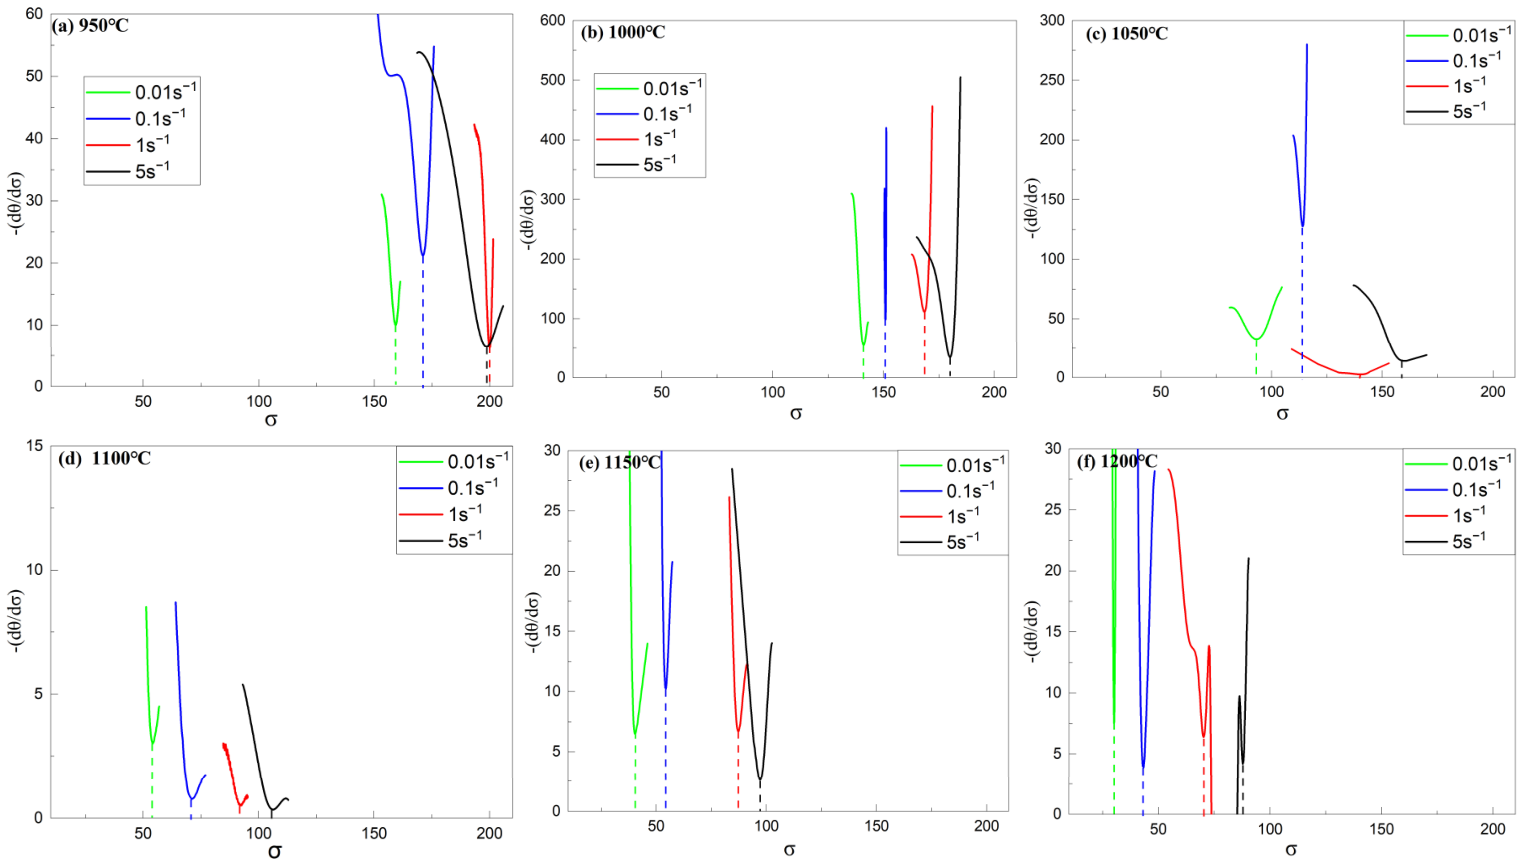
Figure 12 and Figure 13 show the schematic diagrams for determining the critical conditions for DRX. First, based on the θ − σ curve, the −(dθ/dσ) − σ curve is obtained by differentiation, as shown in Figure 13. When the −(dθ/dσ) − σ curve reaches its minimum value, the corresponding abscissa represents the critical stress σc for DRX. In Figure 12, the point on the θ − σ curve with the abscissa of σc gives the critical work-hardening rate θc. By drawing a tangent to the θ − σ curve passing through the characteristic point (σc, θc), the intersection of this tangent with the abscissa (where θ = 0) corresponds to the saturation stress σsat of the DRV curve. It can be intuitively observed that the critical stress σc for DRX initiation decreases continuously with increasing deformation temperature, which is consistent with the thermal activation nature of DRX.
Figure 12.
of critical conditions for DRX.
Figure 13.
The relation of of critical conditions for DRX.
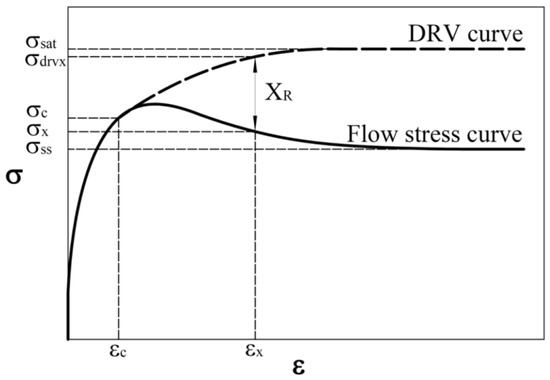
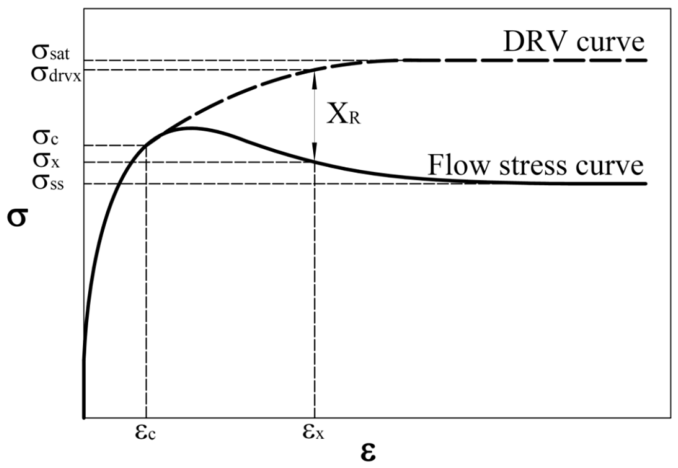
By establishing a pure DRV curve and quantifying the stress difference between the DRV curve and the measured flow curve, the degree of DRX can be characterized via macroscopic mechanical behavior, as illustrated in Figure 14. When the DRV curve reaches an equilibrium state, the corresponding stress is the saturation stress σsat; when the actual flow curve reaches a steady state, the corresponding stress is the steady-state stress σss [28,29].
Figure 14.
The DRV curve and actual flow–stress curve.
Since the volume fraction of DRX characterizes the proportion of defect-free grains formed within the material through the DRX mechanism, it can be derived based on the relationship between dislocation density and flow stress [30,31].
where ρdrv is the dislocation density of the material when only DRV occurs, ρdrx is the dislocation density when both DRV and DRX occur, Δρ is the amount of dislocation annihilated by the DRX mechanism, and ρmax is the maximum amount of dislocation that can be eliminated by the DRX mechanism.
Since the dislocation density of the material is difficult to measure directly, the relationship between dislocation density and flow stress can be established based on the Taylor strengthening equation, as expressed by Equation (31).
Rearrangement of Equation (29) leads to
where α is a dimensionless constant, G is the shear modulus of the material, b is the Burgers vector, and ρ is the dislocation density.
When ε0.5 ≤ ε, σss ≤ σdrvx ≤ σsat and σss ≤ σx ≤ σsat, the dislocation density has not reached saturation; Equation (32) can be expressed as follows:
When dislocation density reaches saturation, σdrvx = σsat. σdrvx = σss. Equation (31) is expressed as
Substituting Equations (33) and (34) into Equation (30) yields the expression for the volume fraction of DRX, as given by Equation (35).
To establish a complete DRV curve, it must be derived from the work-hardening rate equation (Equation (26)). The construction procedure for the DRV curve is as follows:
When σdrvx = σsat, θ = 0; when σ = σc, θ = θc. Thus, Equation (36) can be expressed in the form of a linear equation with two unknowns, as given by Equation (37).
Solving Equation (35) for the unknowns m0 and b yields:
Substituting m0 and b into Equation (34) and performing integration gives Equation (37).
where σss ≤ σdrvx ≤ σsat; σss ≤ σx ≤ σsat,
Rearrangement of Equation (39) leads to
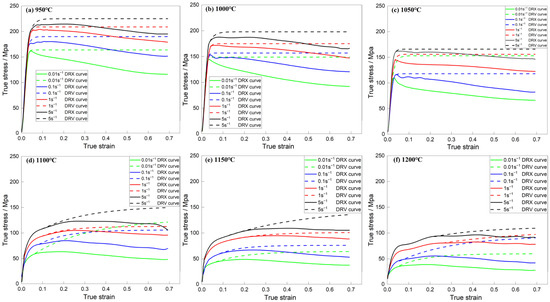
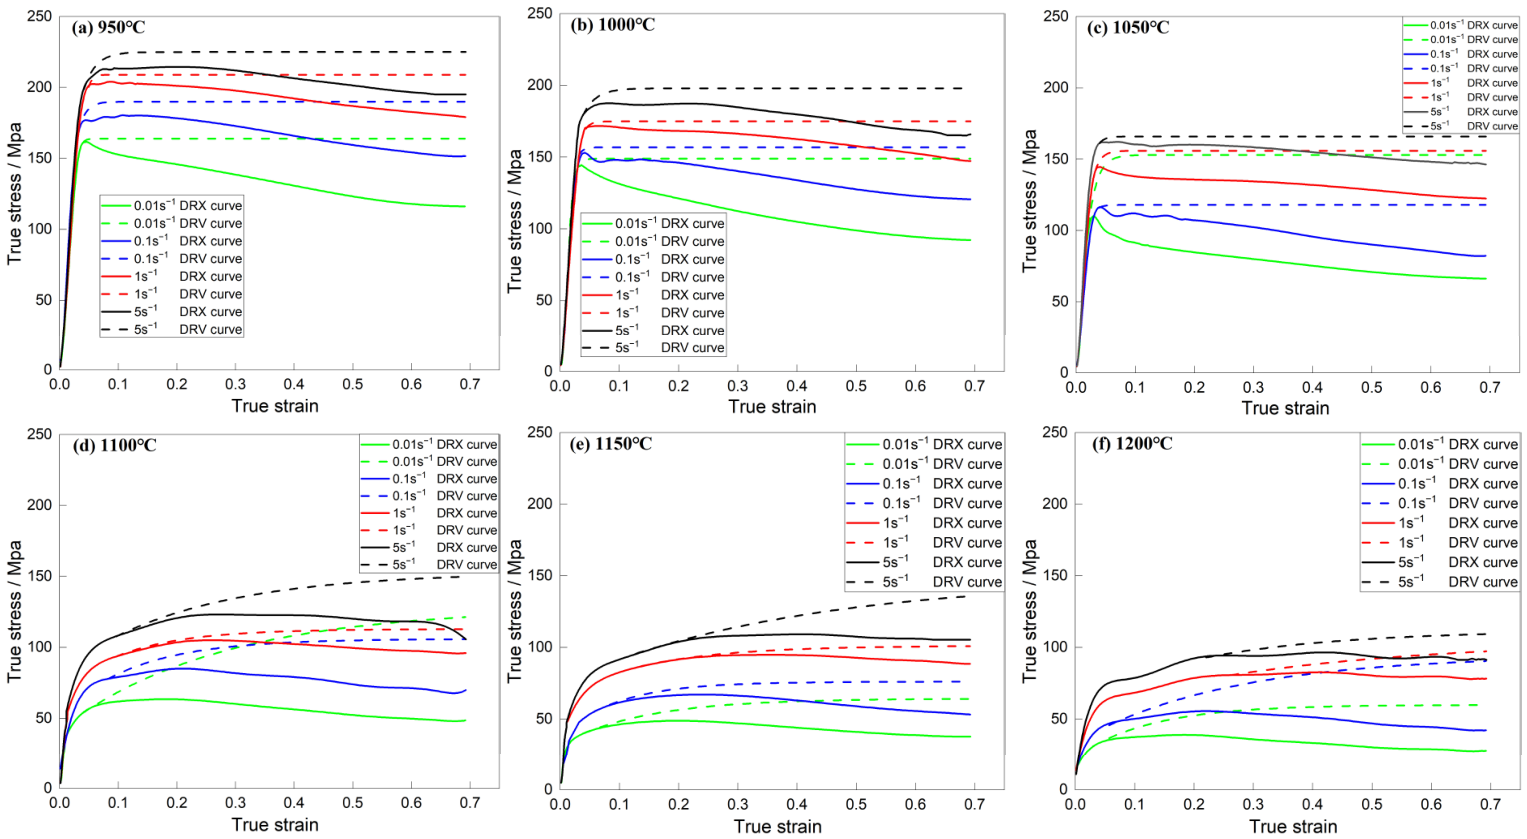
Based on Equation (40), the ideal DRV curves of 12Cr2Mo1V steel are constructed, as shown in Figure 15. The varying degree of coincidence between the DRV curves and experimental flow curves is essentially caused by the transition of dominant recrystallization mechanisms.
Figure 15.
The DRV curve of 12Cr2Mo1V steel.
At 950–1050 °C, CDRX dominates, and the softening effect accumulates gradually with strain, so the two sets of curves follow nearly parallel trajectories with high visual coincidence. At 1100–1200 °C, DDRX prevails with a distinct incubation period. Once the critical strain is exceeded, the softening effect is released intensively, forming an obvious inflection on the flow curve and leading to more pronounced divergence from the smooth DRV curve.
Notably, the most prominent visual separation between the two curves occurs at 1150 °C in Figure 15e. Under this condition, the moderate critical strain for DDRX initiation makes the two curves stay close at low strain and diverge sharply once beyond the critical strain. At 1100 °C, the material just enters the DDRX-dominated regime with a relatively long incubation period, which produces a mild inflection and inconspicuous curve divergence. At 1200 °C, DDRX is activated at quite low strain; consequently, a stable parallel offset is maintained throughout deformation without a sharp inflection.
It should be clarified that the absolute DRX softening actually increases monotonically with temperature, as verified by the stress difference between saturation stress σsat and steady-state stress σss in Table 3. The weaker visual separation at 1100 °C and 1200 °C is due to different DDRX evolution stages: 1100 °C just undergoes the mechanism transition with a long incubation period and blunted inflection, while 1200 °C features much earlier DDRX initiation and a roughly parallel gap throughout deformation, combined with the visual compression effect of the uniform vertical axis scale.
Table 3.
The characterization parameters under different deformation conditions.
Taking the logarithm of both sides of Equations (26) and (27) yields:
Based on the data in Table 3, linear regression of the 1/RT − lnε0.5 relationship yields the parameter Q1; linear regression of the ln relationship yields the Avrami exponent n2. The parameter α1 is obtained from Q1, n2, and Equation (42). The linear regression of the and relationship gives the exponential factor k; and the pre-exponential factor β1 is determined from Equation (41).
Since 12Cr2Mo1V steel exhibits CDRX characteristics in the deformation temperature range of 950–1050 °C and DDRX characteristics in the range of 1100–1200 °C, a single DRX model based on average values cannot accurately reflect the actual hot-deformation behavior of 12Cr2Mo1V steel. Therefore, it is necessary to establish a piecewise DRX model corresponding to different temperature ranges, as expressed by Equations (43)–(46).
When the deformation temperature T ≥ 1100 °C:
When the deformation temperature T < 1100 °C:
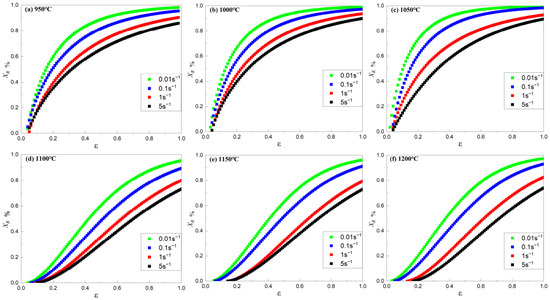
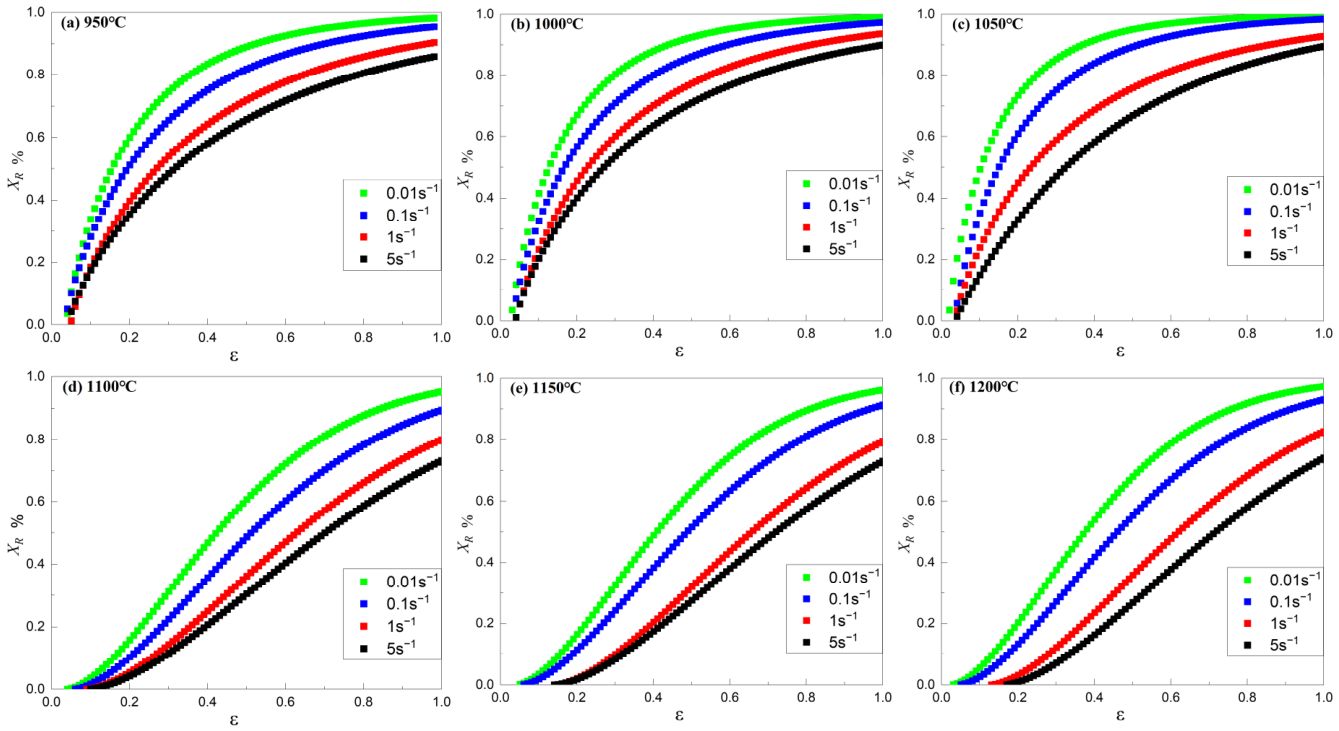
Figure 16 shows the evolution curves of the DRX volume fraction XR of 12Cr2Mo1V steel. Deformation temperature exerts a remarkable influence on the overall DRX kinetic behavior. At deformation temperatures ranging from 950 to 1050 °C, the XR curves exhibit a near power-law-like shape. At very low strain levels, plastic deformation is initially accommodated by DRV, which generates substructures inside deformed grains. Following such preliminary DRV-dominated substructure development shortly after the onset of deformation, CDRX-driven microstructural evolution proceeds rapidly, which gives rise to a fast rise in XR without developing a prominent incubation period. After the applied strain reaches ε0.5 (where XR = 0.5), the growth rate of XR gradually decreases, and the recrystallization process enters a slow-development stage. In contrast, at higher deformation temperatures of 1100–1200 °C, the XR curves display typical S-shaped Avrami-type characteristics. An obvious recrystallization incubation period can be observed at the early stage of deformation; XR increases moderately across the whole measured strain range, and the overall progression rate of DRX remains relatively low. These obvious temperature-dependent differences in DRX kinetics reflect fundamentally different recrystallization-evolution modes under different thermal–mechanical conditions. Owing to such divergent kinetic responses, conventional unified DRX models with fixed material parameters cannot achieve satisfactory prediction accuracy over the full temperature range, which further demonstrates the physical necessity of adopting a segmented DRX modeling strategy in the present work.
Figure 16.
The DRX volume fraction of 12Cr2Mo1V steel.
The apparent kinetic discrepancy observed in Figure 16 originates from the temperature-dependent transition of dominant recrystallization mechanisms, rather than a decrease in intrinsic grain-boundary mobility with rising temperature [32]. According to well-established recrystallization fundamentals, DDRX operates through a two-step mechanism: grain-boundary bulging nucleation followed by subsequent grain growth. Observable new recrystallized grains cannot be generated until the applied strain exceeds a critical threshold value. This intrinsic nucleation requirement produces the well-known S-shaped Avrami-type kinetic response accompanied by a distinct incubation period. In comparison, CDRX corresponds to in situ microstructural evolution within deformed matrices, which does not depend on discrete grain-boundary-bulging nucleation events. Once sufficient plastic strain accumulates inside the material, CDRX related microstructural modification can proceed continuously without a long preliminary incubation stage. Based on the optical microscopy observations in the present work, such a mechanism transition between CDRX and DDRX takes place in 12Cr2Mo1V steel. At 950–1050 °C deformation conditions, necklace-type grain features widely appear, which are regarded as the typical metallographic signature of CDRX. By comparison, prominent grain-boundary-bulging features can be identified at 1100–1200 °C, which corresponds to the activation of DDRX.
It is worth noting that grain-boundary mobility mainly governs grain-growth behavior and cannot override the nucleation requirement for DDRX. Although an increase in temperature intrinsically improves grain-boundary mobility and accelerates grain-growth kinetics, the macroscopic progress of recrystallization under DDRX-dominated conditions is primarily governed by the nucleation barrier, namely the critical strain required to trigger grain-boundary bulging, instead of grain-boundary-migration capacity alone [33]. Higher grain-boundary mobility effectively accelerates grain-growth behavior after nucleation has been completed, yet it cannot eliminate the critical-strain prerequisite for initiating DDRX nucleation. Taken together, the divergent kinetic behaviors illustrated in Figure 16 are physically reasonable and consistent with classical hot-deformation and recrystallization theories.
3.7. Coupled Finite-Element Simulation of Dynamic Recrystallization and Comparative Verification via Constant-Velocity Compression Tests for 12Cr2Mo1V Steel
Constant-velocity compression experiments were performed to characterize the microstructural evolution of 12Cr2Mo1V steel during hot forming. Guided by the stable deformation domain identified from DMM hot-processing maps in Section 3.5, constant-velocity compression experiments were performed to characterize the microstructural evolution of 12Cr2Mo1V steel during hot forming. To validate the reliability of the established DRX kinetic model, the segmented DRX model described by Equations (43)–(46) was embedded into the commercial finite-element platform DEFORM® to conduct coupled thermo-mechanical–microstructural simulations under the same experimental conditions. A two-dimensional geometric model matching the cylindrical test specimen (Φ8 mm × 10 mm) was established and discretized into 300 quadrilateral elements to lower computational cost. All boundary conditions of the numerical model were calibrated according to the practical parameters used in the constant-velocity compression tests. The interfacial heat transfer coefficient between the die and specimen was set to 30 N·(m·s·°C)−1, the friction coefficient at the die–billet contact surface was defined as 0.3, the ambient temperature was 27 °C, and the heat transfer coefficient between the specimen/die and ambient air was 0.02 N·(m·s·°C)−1. Consistent with the physical compression tests, the upper die compression velocity was set to 1 mm/s, and the simulation was implemented at 1200 °C with 50% engineering compressive deformation. Consistent thermal and mechanical loading settings between experiments and simulations enable direct comparison between the predicted and measured DRX volume fractions.
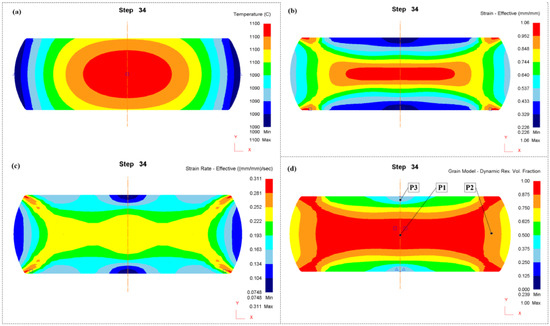
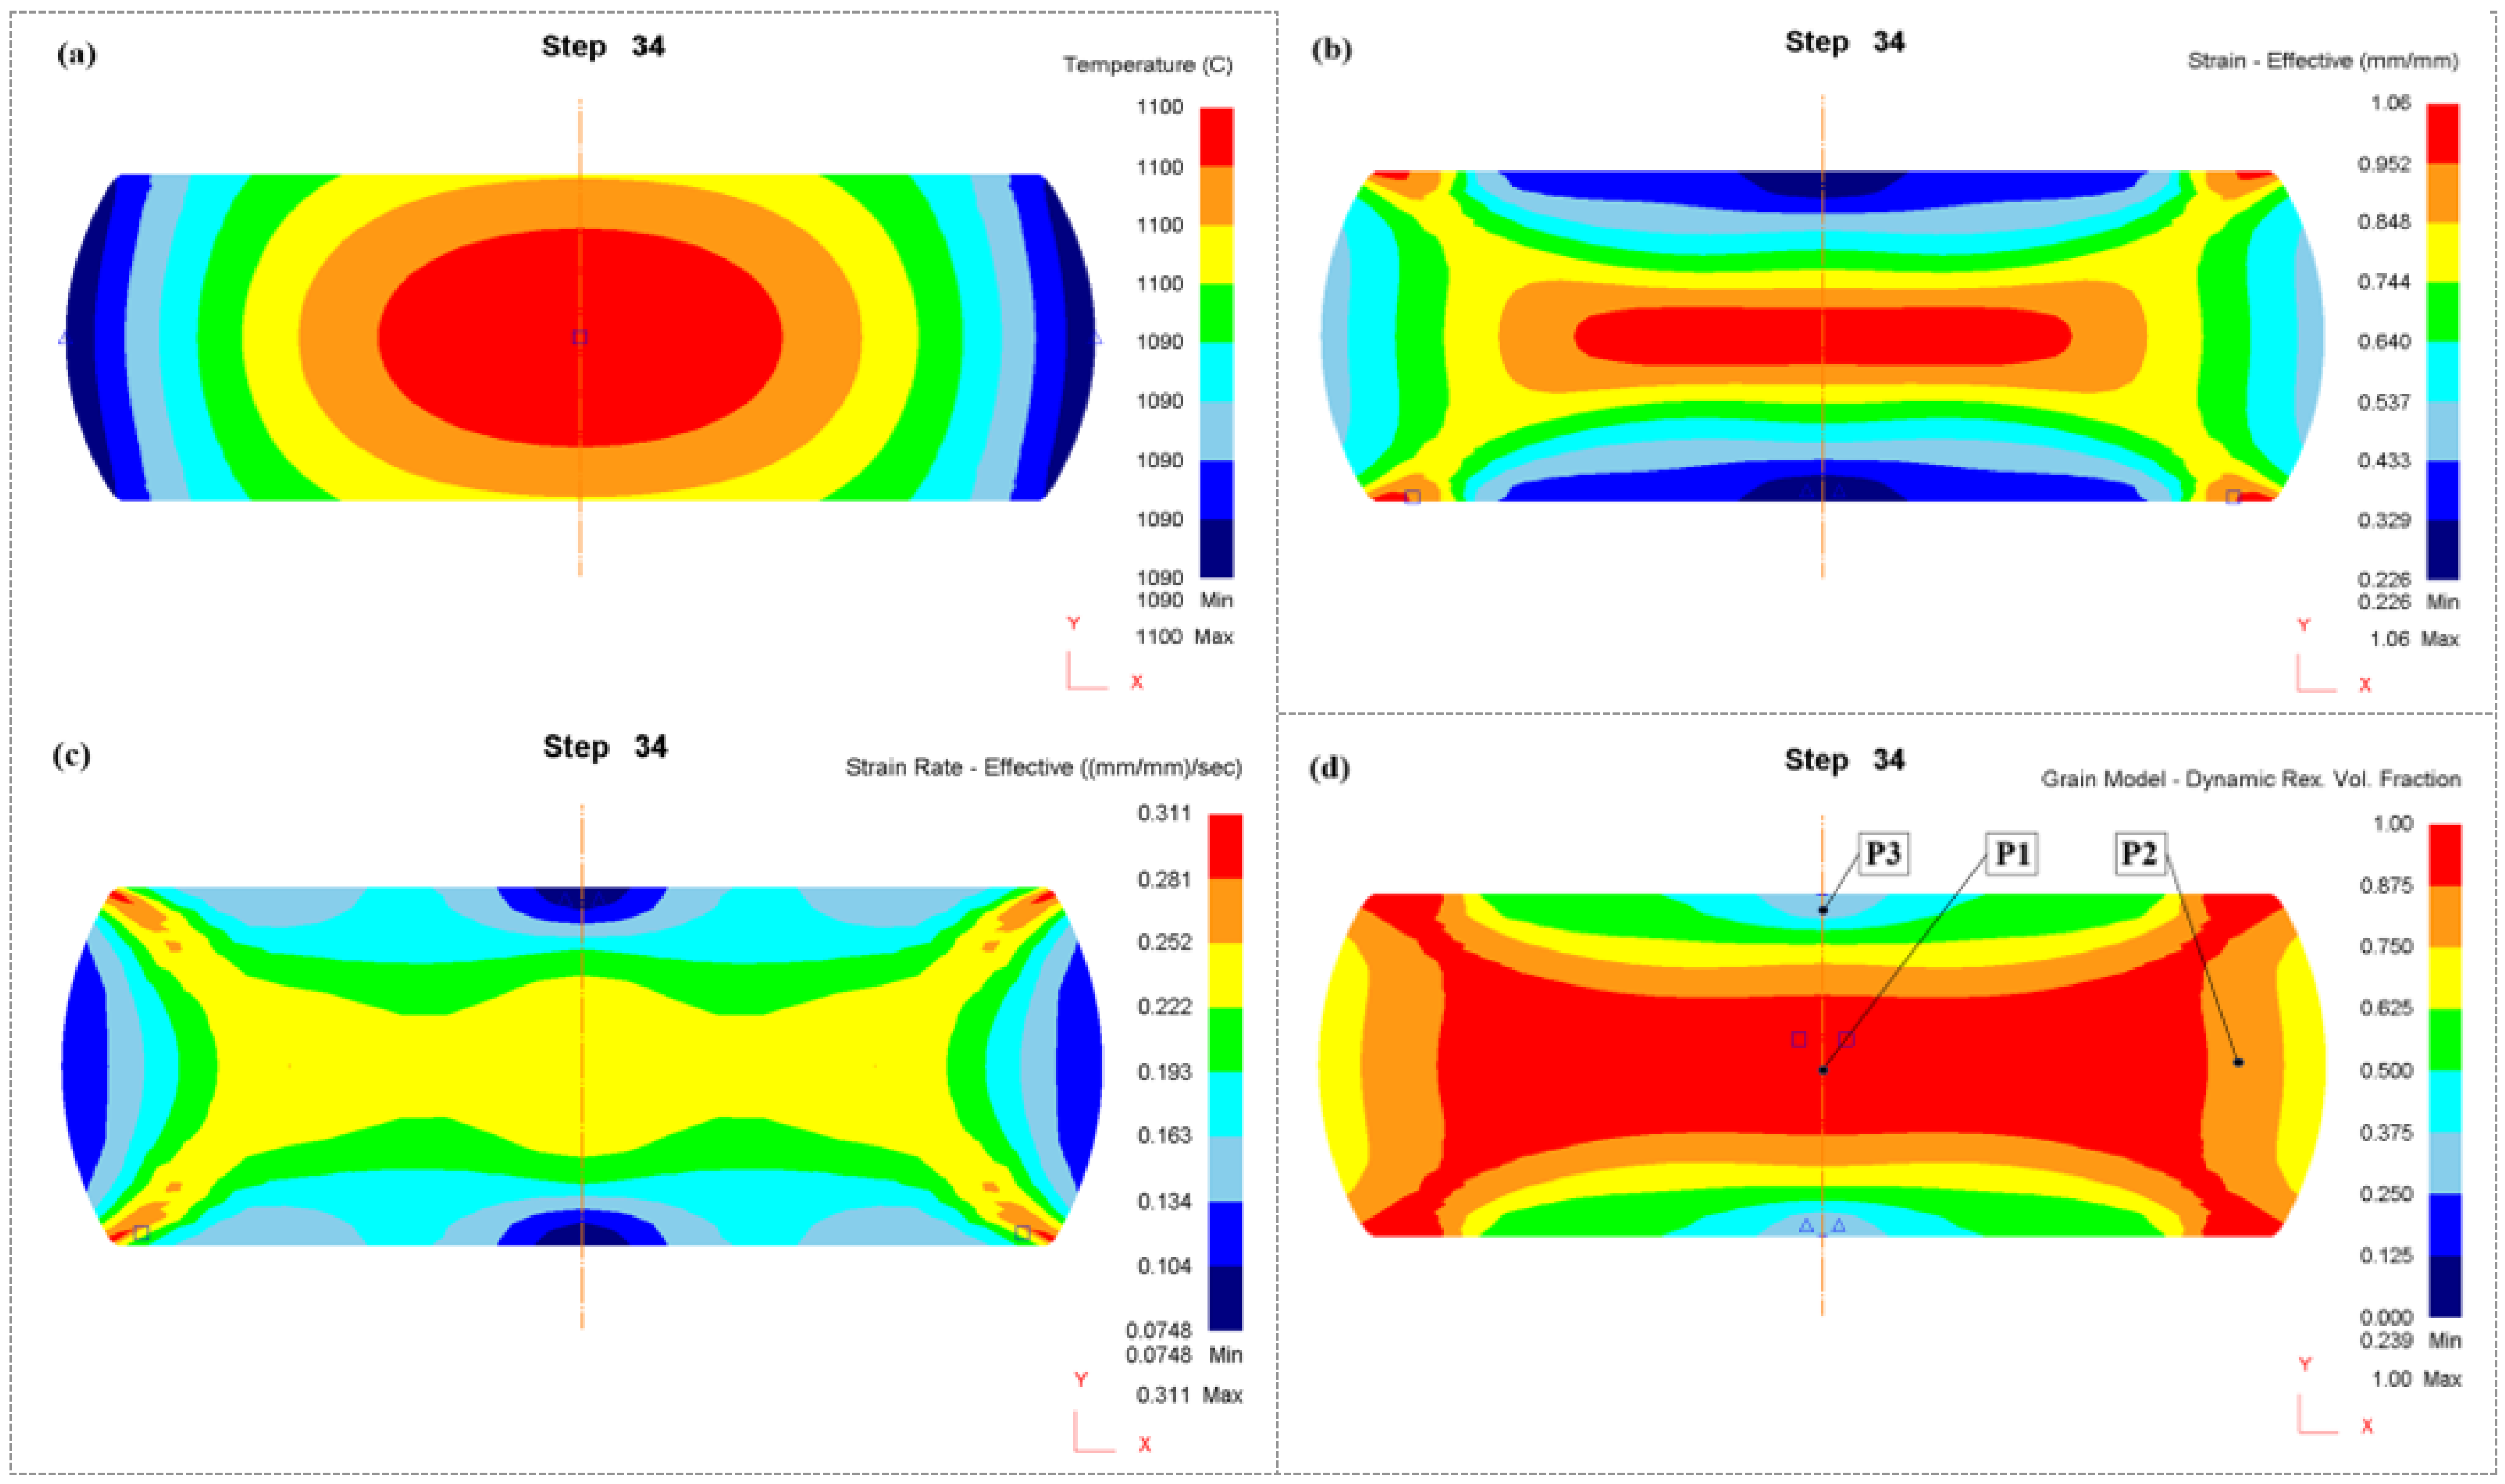
Figure 17 presents the finite-element simulation results of the hot-compression process. As shown in Figure 17a, the temperature field of the specimen after hot compression ranges from 1090 to 1100 °C. The temperature reaches its maximum at the center of the specimen and decreases gradually toward the side surfaces and the top and bottom end faces. The strain distribution, illustrated in Figure 17b, follows a similar pattern. The peak strain occurs at the center of the specimen and decreases toward the side surfaces and end faces. The strain at the top and bottom end faces is the smallest, forming deformation “dead zones” in these regions. Figure 17c depicts the strain rate distribution across the specimen. The peak strain rate is located at the junction between the end faces and the side surfaces. The strain rate at the center ranges from 0.222 to 0.252 s−1, which is higher than that at the end faces and side surfaces. Although higher strain rates generally suppress DRX, since the strain rate at the center is not the highest in the entire specimen, the accumulation of sufficiently large strain in this region can still effectively drive DRX nucleation. The distribution of the DRX volume fraction is shown in Figure 17d. Complete DRX, with a volume fraction of 100%, has occurred at the center of the specimen (Region P1), and the DRX volume fraction decreases toward the side surfaces and end faces. Specifically, the DRX volume fraction decreases to approximately 75% at the side surfaces (Region P2) and reaches a minimum of only 23.9% at the deformation “dead zones” of the top and bottom end faces (Region P3). In summary, the central region of the specimen benefits from a high temperature, large strain, and moderate strain rate, which provide sufficient thermodynamic and kinetic conditions for DRX and result in the highest degree of recrystallization. In contrast, although the deformation “dead zones” at the end faces have the lowest strain rate, the low temperature and small strain in these regions also suppress the nucleation-and-growth of DRX. The DRX-evolution behavior is governed by the combined effects of multiple deformation parameters—temperature, strain, and strain rate—rather than being determined by any single parameter. The superposition of favorable and unfavorable factors ultimately leads to significant differences in the DRX volume fraction across different regions within the specimen. Therefore, finite-element numerical simulation with multi-field coupling represents the most effective approach for predicting DRX in materials, as it enables the multi-dimensional integration of multiple deformation parameters during complex hot forging processes.
Figure 17.
Simulation result of compression: (a) temperature field; (b) strain field; (c) strain rate field; (d) the DRX volume fraction.
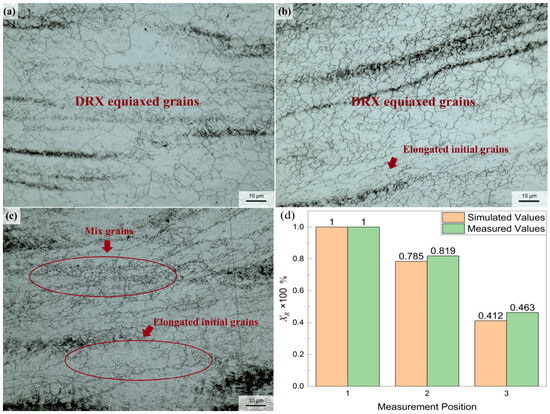
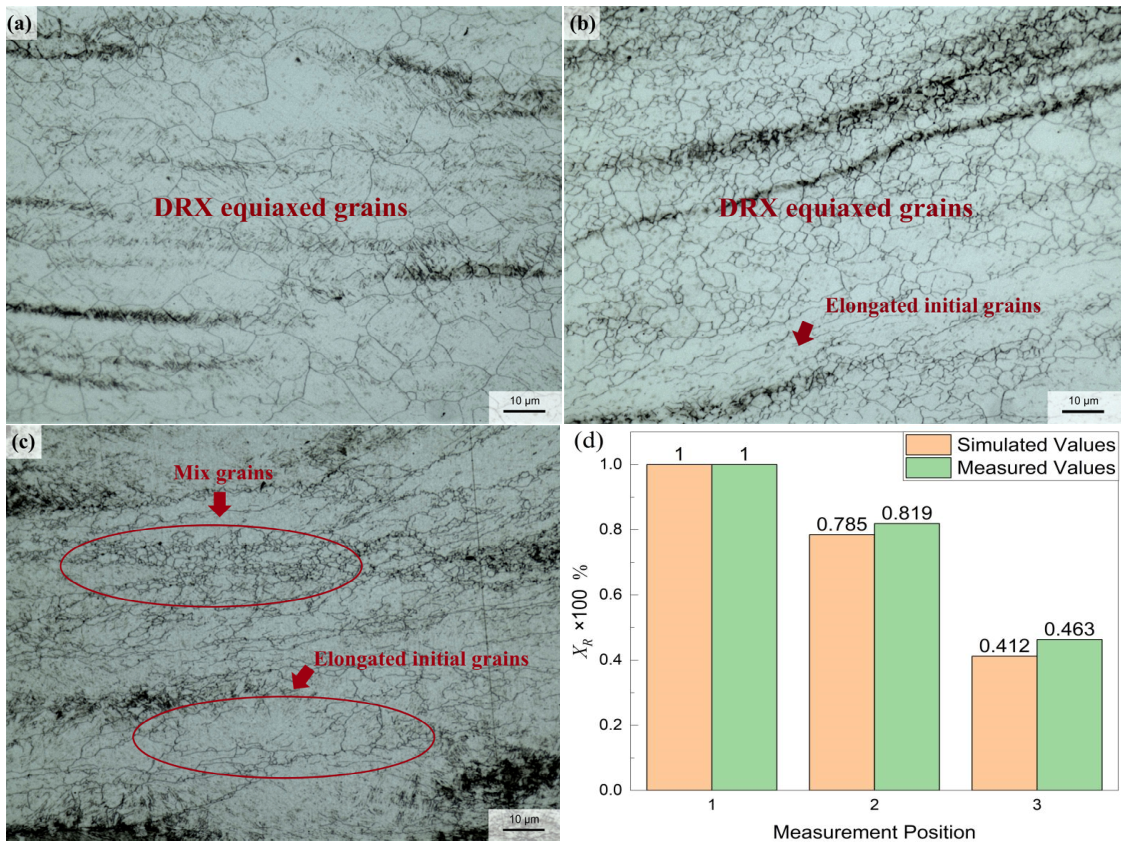
Figure 18 presents the microstructural morphologies of Regions P1, P2, and P3, along with a comparison of the DRX volume fractions. As shown in Figure 18a, complete DRX has occurred in Region P1, where the microstructure is dominated by recrystallized equiaxed grains. The relatively high deformation temperature in this region facilitates the rapid growth of dynamically recrystallized grains after nucleation, resulting in noticeably coarser recrystallized grains. Figure 18b shows the microstructure of Region P2, where only partial recrystallization takes place. The DRX volume fraction is relatively low, and some deformed grains remain in the matrix. Due to the lower deformation temperature, the dynamically recrystallized equiaxed grains are finer than those in the central region. As depicted in Figure 18c, Region P3 contains the highest proportion of deformed grains, and the microstructure exhibits pronounced mixed grains and a banded deformed zone. This region has the lowest DRX volume fraction, and the dynamically recrystallized equiaxed grains that have formed are also comparatively fine. A comparison between the simulated and experimentally measured DRX volume fractions for Regions P1, P2, and P3 is provided in Figure 18d. The close agreement between the simulated and experimentally measured results verifies that the numerical simulation is capable of accurately characterizing the DRX evolution of 12Cr2Mo1V steel, thus validating the reliability of the proposed model.
Figure 18.
Microstructure deformed at 1200 °C with 1 mm/s of P1, P2, P3 zone: (a) P1; (b) P2; (c) P3; (d) comparison of DRX volume fraction.
4. Conclusions
This work systematically investigated the hot-deformation behavior and temperature-dependent dynamic recrystallization (DRX) mechanisms of 12Cr2Mo1V steel for large hydrogenation reactor forgings. A complete research framework including friction correction of compression data, strain-compensated Arrhenius constitutive model, segmented Avrami DRX kinetics, DMM hot-processing maps and coupled thermo-microscopic FEM simulation was established. All models were validated via isothermal and industrial-like constant-velocity compression experiments, providing reliable theoretical guidance for microstructure control and forming parameter optimization of large hydrogenation reactor forgings.
(1) The flow–stress curves of 12Cr2Mo1V steel were obtained by Gleeble-1500 isothermal hot-compression tests at deformation temperatures of 950–1200 °C and strain rates of 0.01–5 s−1. A strain-compensated constitutive equation was established for the material using the sixth-order polynomial fitting method. Verification shows that the stress values calculated by the constitutive equation are in good agreement with the experimental values, indicating that the established strain-compensated constitutive equation can accurately characterize the hot-deformation mechanical behavior of 12Cr2Mo1V steel.
(2) Based on the dissipation energy and instability criterion, the hot-processing map of 12Cr2Mo1V steel was constructed. The optimal processing window of the material is determined to be within the deformation temperature range of 1000–1200 °C and the strain rate range of 0.01–0.1 s−1. Within this region, the material exhibits high hot-deformation stability and excellent workability.
(3) A segmented DRX model was proposed to adapt to temperature-dependent recrystallization kinetics and characterize varied DRX-evolution behaviors at different temperatures:
For T ≥ 1100 °C:
For T < 1100 °C:
The established segmented DRX kinetic equations were embedded into DEFORM® to conduct thermo-mechanical coupled finite-element simulations. By comparing the simulated DRX volume fractions with the microstructural data measured from constant-velocity compression tests, excellent consistency between numerical predictions and experimental characterizations was confirmed. The established DRX model and finite-element simulation framework can supply reliable theoretical guidance and technical data for the optimization of hot forging processes of large 12Cr2Mo1V hydrogenation reactor forgings.
Author Contributions
Conceptualization, R.S. and M.Y.; methodology, R.S. and M.Y.; formal analysis, M.Y., J.L. and C.C.; investigation, L.Y., Y.C., G.Y., X.L. and M.C.; resources, R.S., J.L. and C.C.; data curation, M.Y.; writing—original draft preparation, R.S. and M.Y.; writing—review and editing, R.S., M.Y., J.L., C.C., L.Y., Y.C., G.Y., X.L. and M.C.; project administration, R.S.; funding acquisition, J.L. All authors have read and agreed to the published version of the manuscript.
Funding
The authors gratefully acknowledge the support from the Postdoctoral Research Projects of Henan Province (HN2026064).
Data Availability Statement
The original contributions presented in this study are included in the article. Further inquiries can be directed to the corresponding authors.
Acknowledgments
Special thanks are given to the research teams of State Key Laboratory of Intelligent Mining Heavy Equipment, CITIC Heavy Industries Co., Ltd., Henan University of Science and Technology, for their valuable assistance in specimen preparation, thermal simulation tests and finite-element simulation work.
Conflicts of Interest
Ruxing Shi, Ming Yang, Litao Yin, Ming Chen, Yaqiong Chang, Guohui Yin and Xianju Li were employed by CITIC Heavy Industries Co., Ltd. The remaining authors declare that the research was conducted in the absence of any commercial or financial relationships that could be construed as a potential conflict of interest. The authors declare that this study received funding from the Postdoctoral Research Projects of Henan Province (HN2026064). The funder was not involved in the study design, collection, analysis, interpretation of data, the writing of this article or the decision to submit it for publication.
References
- Pokhmurskii, V.I.; Khoma, M.S.; Chuchman, M.R.; Vasyliv, K.B.; Ratska, N.B. Effect of Temperature and Pressure on Corrosion and Hydrogenation of Steel in Chloride-Acetate Environment with Different Concentrations of Hydrogen Sulfide and Carbon Dioxide. Mater. Sci. 2024, 59, 519–523. [Google Scholar] [CrossRef] [Scilit]
- Álvarez, G.; Zafra, A.; Belzunce, F.J.; Rodríguez, C. Effect of internal hydrogen on the fatigue crack growth rate in the coarse-grain heat-affected zone of a CrMo steel. Metals 2022, 12, 673. [Google Scholar] [CrossRef] [Scilit]
- Dornelas, P.H.G.; Payão Filho, J.d.C.; Moraes e Oliveira, V.H.P.; Farias, F.W.C. Influence of interpass temperature on the simulated coarse-grained heat-affected zone of a circumferentially welded 2.25Cr-1Mo steel pipe joint. J. Manuf. Mater. Process. 2024, 8, 248. [Google Scholar] [CrossRef] [Scilit]
- Sellars, C.M.; Whiteman, J.A. Recrystallization and grain growth in hot rolling. Scr. Metall. 1979, 13, 197–202. [Google Scholar] [CrossRef] [Scilit]
- Prasad, Y.V.R.K.; Gegel, H.L.; Doraivelu, S.M.; Malas, J.C.; Morgan, J.T.; Lark, K.A.; Barker, D.R. Modeling of dynamic material behavior in hot deformation: Forging of Ti 6242. Metall. Trans. A 1984, 15, 1883–1892. [Google Scholar] [CrossRef] [Scilit]
- McQueen, H.J.; Yue, S.; Ryan, N.D.; Fry, E. Hot working characteristics of steels in austenitic state. J. Mater. Process. Technol. 1995, 53, 293–310. [Google Scholar] [CrossRef] [Scilit]
- Zahiri, S.H.; Davies, C.H.J.; Hodgson, P.D. A mechanical approach to quantify dynamic recrystallization in polycrystalline metals. Scr. Mater. 2005, 4, 299–304. [Google Scholar] [CrossRef] [Scilit]
- Wang, C.; An, Z.; Hai, Y. Hot deformation behavior of CrMoV steel for high speed brake disc. Trans. Mater. Heat Treat. 2019, 5, 109–114. [Google Scholar]
- Yuan, Y.; Shi, R.; Wang, W.; Xu, E.; Wang, J. High temperature rheological stress model for new type Cr-Mo-V hot work die steel. J. Plast. Eng. 2024, 5, 124–131. [Google Scholar]
- Bai, D.; Su, L.; Chen, R.; Wu, H.; Ding, C. Research on hot deformation behavior and hot processing map of high Cr-Mo high-temperature bearing steel. J. Plast. Eng. 2025, 5, 112–121. [Google Scholar]
- Xie, Y.; Wang, Q.; Chen, Z.; Wu, X.; Wang, Z. Hot deformation behavior and microstructure evolution of 18CrNiMo7-6 gear steel. Heat Treat. Met. 2023, 2, 103–109. [Google Scholar]
- Sun, S. Problems Analysis and Solution of Compression Test with Hydraulic Wedge for Gleeble-3500 Thermal Analogue. Phys. Test. Chem. Anal. Part A Phys. Test. 2012, 48, 452–453. [Google Scholar]
- Zhang, W.; Zhang, S. Correcting of Hot Compression Test and Constitutive Equation of NiTi SMA. Acta Metall. Sin. 2006, 10, 1036–1040. [Google Scholar]
- Wang, F.; Li, P. Correction and neural network prediction of hot compression flow stress in TA15 alloy. J. Hefei Univ. Technol. 2008, 10, 1602–1605. [Google Scholar]
- Chen, C.; Zhang, Z.; Dai, S.; Dai, Z.; Zhang, B.; Xu, L.; Mao, F.; Shi, H.; Shi, R.; Wei, S. Microstructural evolution and dynamic recrystallization mechanisms of 12Cr2Mo1V steel during hot deformation. J. Mater. Res. Technol. 2026, 42, 8585–8598. [Google Scholar] [CrossRef] [Scilit]
- Gao, F.; Gao, Z.; Zhu, Q.; Liu, Z. Constitutive descriptions and restoration mechanisms of a Fe-17Cr alloy during deformation at temperatures of 700–1000 °C. Materials 2021, 14, 5022. [Google Scholar] [CrossRef] [Scilit] [PubMed]
- Zhao, G.; Tian, Y.; Li, H. Microstructure evolution and dynamic recrystallization mechanisms of ferritic heat-resistant steel during hot compression. J. Mater. Sci. Technol. 2022, 112, 156–165. [Google Scholar]
- Cao, M.Z.; Li, F.; Zhang, J.Y.; Wang, Z.Y. Optimization in strength-ductility of soft plate rolled AZ31 magnesium alloy via CDRX and shear band-induced DRX. J. Alloys Compd. 2025, 1033, 1197–1217. [Google Scholar] [CrossRef] [Scilit]
- Li, Y.; Gu, B.; Jiang, S.; Liu, Y.; Shi, Z.; Lin, J. A CDRX-based material model for hot deformation of aluminium alloys. Int. J. Plast. 2020, 134, 1158–1176. [Google Scholar] [CrossRef] [Scilit]
- Barat, K.; Mandal, A.; Sharma, K.D.; Kumar, C.N.; Shiju, J.; Karmakar, A.; Venkateswarlu, K. Alternating DDRX (Discontinuous dynamicrecrystallization) in Al-Mg-Si alloy under combined ECAP and rolling. J. Alloys Compd. 2025, 1043, 1269–1289. [Google Scholar] [CrossRef] [Scilit]
- Tian, J.; Li, L.; Sha, J.; Li, X.; Yang, Y.; Bao, J.; Chen, W.; Wang, Q.; Liu, W.; Zhang, Z. Competitive multimechanism response in Mg alloys under hot deformation governed by Zener-Hollomon parameter: Dynamic recrystallization transition, twinning behavior and texture evolution. J. Alloys Compd. 2025, 1041, 2291–2309. [Google Scholar]
- Cao, R.; Wang, W.; Ma, S.; Yan, H.; Mu, Z.; Zhang, S. Arrhenius constitutive model and dynamic recrystallization behavior of 18CrNiMo7-6 steel. J. Mater. Res. Technol. 2023, 24, 6334–6347. [Google Scholar] [CrossRef] [Scilit]
- Ortiz-Bernardin, A.; Bustamante, R.; Rajagopal, K.R. A numerical study of elastic bodies that are described by constitutive equations that exhibit limited strains. Int. J. Solids Struct. 2014, 2, 875–885. [Google Scholar] [CrossRef] [Scilit]
- Chouf, S.; Morin, M.; Belkahla, S.; Guénin, G. Equivalent thermo-mechanical treatments in an equiatomic Ti-Ni shape memory alloy. Mater. Sci. Eng. A 2006, 9, 671–674. [Google Scholar] [CrossRef] [Scilit]
- Liu, W.; Liu, W.; Ji, H.; Tang, X.; Wang, M.; Song, C.; Yang, X. Hot deformation behavior and hot working map of Mn-Cr-Ni-Co steel for ball mill liner forging process. J. Mater. Res. Technol. 2024, 30, 5685–5700. [Google Scholar] [CrossRef] [Scilit]
- Prasad, Y.V.R.K. Processing maps: A status report. J. Mater. Eng. Perform. 2003, 11, 638–645. [Google Scholar] [CrossRef] [Scilit]
- Medina, S.F.; Hernandez, C.A. Modelling of the dynamic recrystallization of austenite in low alloy and microalloyed steels. Acta Mater. 1996, 44, 165–171. [Google Scholar] [CrossRef] [Scilit]
- Roucoules, C.; Pietrzyk, M.; Hodgson, P.D. Analysis of work hardening and recrystallization during the hot working of steel using a statistically based internal variable model. Mater. Sci. Eng. A 2003, 339, 1–9. [Google Scholar] [CrossRef] [Scilit]
- Pu, X.; Qiao, M.; Zhang, Y.; Xu, H.; Niu, H.; Hong, Y.; Xiao, H.; Wu, H. Deformation behavior, microstructure characterization, and dynamic recrystallization mechanism of Au-7.5Ni-1.5Cu alloy. Mater. Des. 2025, 260, 181–191. [Google Scholar] [CrossRef] [Scilit]
- Sun, X.; Wang, B.; Duan, Y.; Liu, Q.; Xu, X.; Wang, S.; Yang, X.; Feng, X. Kinetics and microstructure evolution of dynamic recrystallization of medium-Mn steel during hot working. J. Mater. Res. Technol. 2023, 23, 5631–5643. [Google Scholar] [CrossRef] [Scilit]
- Zhang, K.; Chen, D.; Wang, Z.; Li, X.; Sha, G.; Wang, H. Influence of hot deformation on dynamic recovery and dynamic recrystallization mechanism in a spray formed Al-Zn-Mg-Cu alloy. J. Mater. Res. Technol. 2025, 39, 4138–4148. [Google Scholar] [CrossRef] [Scilit]
- Sakai, T.; Belyakov, A.; Kaibyshev, R.; Miura, H.; Jonas, J.J. Dynamic and post-dynamic recrystallization under hot, cold and severe plastic deformation conditions. Prog. Mater. Sci. 2014, 60, 130–207. [Google Scholar] [CrossRef] [Scilit]
- McQueen, H.J. Development of dynamic recrystallization theory. Mater. Sci. Eng. A 2004, 9, 203–208. [Google Scholar] [CrossRef] [Scilit]

Disclaimer/Publisher’s Note: The statements, opinions and data contained in all publications are solely those of the individual author(s) and contributor(s) and not of MDPI and/or the editor(s). MDPI and/or the editor(s) disclaim responsibility for any injury to people or property resulting from any ideas, methods, instructions or products referred to in the content. |
© 2026 by the authors. Licensee MDPI, Basel, Switzerland. This article is an open access article distributed under the terms and conditions of the Creative Commons Attribution (CC BY) license.