


Abstract
Aluminum alloys used in aircraft structures are susceptible to corrosion fatigue cracking under combined aggressive environments and cyclic loading, threatening structural integrity. Pure data-driven models often fail under distribution shifts, while single-physics-informed neural networks (PINNs) lack flexibility in complex conditions. This paper proposes a dual-physics-informed neural network (DPINN) that integrates Walker and Forman crack growth models into a deep residual network. The model adaptively fuses both physical formulas via a trainable weight α and predicts material constants. A hybrid loss function with α regularization ensures physically consistent predictions. Using comprehensive corrosion fatigue data covering eight aluminum alloys, we evaluate the model on an internal test set and, more importantly, on an independent external test set simulating real-world distribution shifts. We further investigate an incremental learning scenario where the model is sequentially fine-tuned with increasing fractions of the external set. Results demonstrate that DPINN rapidly rectifies initial distribution mismatch, crossing the engineering reliability threshold (R2 > 0.90) at an early incremental stage, and achieves superior performance after fine-tuning, significantly outperforming both a single Walker-PINN and gradient boosting regressors. SHAP feature importance analysis identifies ΔK and stress ratio as dominant drivers, confirming mechanistic consistency. The proposed architecture offers a data-efficient and interpretable tool for corrosion fatigue crack growth prediction in aluminum alloy structures.
1. Introduction
Aluminum alloys, especially the 2xxx and 7xxx series, are widely used in aircraft skins, frames, and main load-bearing structures due to their high specific strength, good corrosion resistance, and excellent workability [1,2]. However, during long-term service in aggressive environments (high humidity, chloride ions, varying pH, etc.), these alloys are susceptible to corrosion fatigue cracking, which directly threatens flight safety and structural integrity [3,4]. Accurate prediction of the crack growth rate (da/dN) is essential for damage tolerance design [5], maintenance scheduling, and life extension of aging aircraft [6].
Traditional approaches for fatigue crack growth prediction can be divided into two categories: physics-based models and data-driven models. Physics-based models, such as the Paris [7], Walker [8], and Forman [9] equations, provide concise mathematical descriptions of crack propagation under cyclic loading. The Walker model accounts for the stress ratio effect via a power-law term (1 − R)q, while the Forman model introduces a denominator that captures the acceleration near fracture toughness. Despite their mechanistic clarity, these empirical formulas often oversimplify the complex interactions among material composition (Cu, Zn, Mg, etc.), heat treatment, environmental factors (temperature, pH, Cl− concentration), and loading conditions (ΔK, R, frequency) [10,11]. Consequently, their predictive accuracy degrades when applied to alloy grades or environmental conditions not considered during parameter calibration.
In recent years, machine learning (ML) techniques, including Random Forest (RF), Gradient Boosting (e.g., XGBoost), and Artificial Neural Networks (ANN), have been extensively applied to fatigue and corrosion fatigue prediction [12,13,14,15]. These data-driven models can capture complex nonlinear relationships from large datasets without explicit physical assumptions. For example, Peng et al. [16] developed an incremental learning XGBoost framework for 2xxx series aluminum alloys, achieving high accuracy and low forgetting rates. However, pure data-driven models suffer from a fundamental limitation: they rely entirely on statistical correlations within the training data and lack physical constraints. When the test environment shifts from the training distribution (e.g., different stress ratios, corrosive media, or alloy tempers), their performance often deteriorates dramatically [13]. As shown in our experiments, Random Forest drops from R2 > 0.95 on the internal test set to R2 ≈ 0.50 on the independent external test set when no adaptation is performed, while Gradient Boosting collapses to a negative R2 (≈ −0.41), indicating severe overfitting to the training distribution.
To overcome the limitations of both pure physics-based and pure data-driven approaches, physics-informed neural networks (PINNs) have emerged as a promising hybrid paradigm [17]. By embedding physical laws into the network architecture or loss function, PINNs leverage both experimental data and domain knowledge. Chen et al. [18] applied PINN to fatigue life prediction with limited samples, while Dourado and Viana [17] developed a PINN for corrosion-fatigue prognosis. In the context of aluminum alloy crack growth, Huang et al. [6] integrated the Walker model into a residual neural network, achieving R2 > 0.99 on internal tests. However, existing PINN applications in fatigue prediction typically incorporate only a single physical model (e.g., the Walker equation), which inherently restricts their applicability to the stable crack growth regime (Region II) and fails to capture the accelerated growth near fracture (Region III), where the Forman model’s toughness-dependent denominator becomes essential. Moreover, current PINN frameworks assume a fixed data distribution and do not address the practical scenario where a pre-trained model must adapt to sequentially arriving data from shifted distributions—a common challenge in engineering practice when new alloy batches or service environments are introduced [16,19,20]. To fill these gaps, we propose a Dual-Physics-Informed Neural Network (DPINN) with an incremental learning strategy. The key innovations are: (1) a network architecture with separate heads for Walker parameters (C, m, q), Forman parameters (Cf, mf, Kc), and a trainable fusion weight α, enabling adaptive combination of the two complementary physical laws; (2) a hybrid loss function with explicit α regularization to ensure balanced learning and prevent over-reliance on a single physics model; (3) a rigorous evaluation protocol including an independent external test set and an incremental fine-tuning scheme using only a fixed 10% subset of original data, simulating real-world deployment where new field data is sparse and arrives progressively; and (4) comprehensive benchmarking against Random Forest, Gradient Boosting, and a single Walker-PINN, demonstrating that DPINN achieves superior cross-distribution generalization with minimal new data.
2. Materials and Methods
2.1. Dataset Description and Preprocessing
We collected 2984 corrosion fatigue crack growth data points from multiple published studies [6,16,21,22,23,24,25,26,27,28,29,30], covering eight aluminum alloy grades widely used in aerospace: 2024, 2124, 7017, 7075, 7475, 7A04, LY12, and Al-Zn-Mg. All of these data points were obtained under various corrosive environments (e.g., salt spray, NaCl solutions of different concentrations, and various pH levels), rather than under atmospheric conditions. Each data point includes 24 raw features (Table 1), which can be grouped into loading parameters, material properties, and environmental factors. Categorical features were one-hot encoded, and numerical features were standardized. After preprocessing, the total feature dimension became 67. The target variable is log10(da/dN).
Table 1.
Features used in the dataset.
To rigorously assess generalization, we designed two test scenarios as follows:
- Internal test set: 30% of the total data randomly sampled (stratified by alloy grade), with the remaining 70% for training. This evaluates performance under the same distribution. Second item;
- External test set: An independent dataset obtained from dedicated corrosion fatigue crack growth experiments on 7050 aluminum alloy (see Section 2.2 for detailed experimental setup). It contains 154 valid data points and is deliberately kept separate from all training and internal validation. This simulates a real-world scenario where the model encounters new data from a shifted distribution (different alloy composition, heat treatment, and loading protocol compared to the training data);
- Incremental learning split: To simulate a realistic deployment scenario where a pre-trained model sequentially receives new data from a shifted distribution, we further partitioned the external test set into two subsets. The incremental addition set consists of 92 samples (60% of the external set), which are gradually introduced into the training pool in fractions of 10%, 20%, 30%, 40%, 50%, and 60% (i.e., 15, 30, 46, 61, 77, and 92 samples, respectively). The remaining 62 samples (40% of the external set) are never used for training; instead, they serve as a dynamic evaluation set. At each incremental step, the model is tested on the currently unseen external samples (i.e., those not yet added to the training set). Consequently, the size of this evaluation set decreases from 154 at the initial step (0% addition) to 62 after the final step (60% addition);
- Data-constrained scenario. In many industrial applications, retaining all historical training data may be impractical due to storage or computational constraints. To reflect such a situation, we randomly sampled a fixed 10% subset of the original training set (208 samples) before starting the incremental process. This subset, denoted D010%, is drawn once and remains unchanged throughout all incremental steps. It is combined with the sequentially added external samples to form the fine-tuning training set at each step, as described in Section 2.6.
2.2. Experimental Setup for External Test Set
The external test set used in this study was obtained from dedicated corrosion fatigue crack growth experiments on 7050 aluminum alloy (Cu 2.12 wt.%, Si 0.019 wt.%, Zn 6.19 wt.%, Ti < 0.01 wt.%). The experiments were conducted following the Chinese national standard GB/T 20120.2-2006 [31].
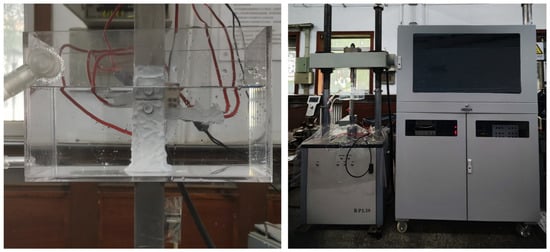
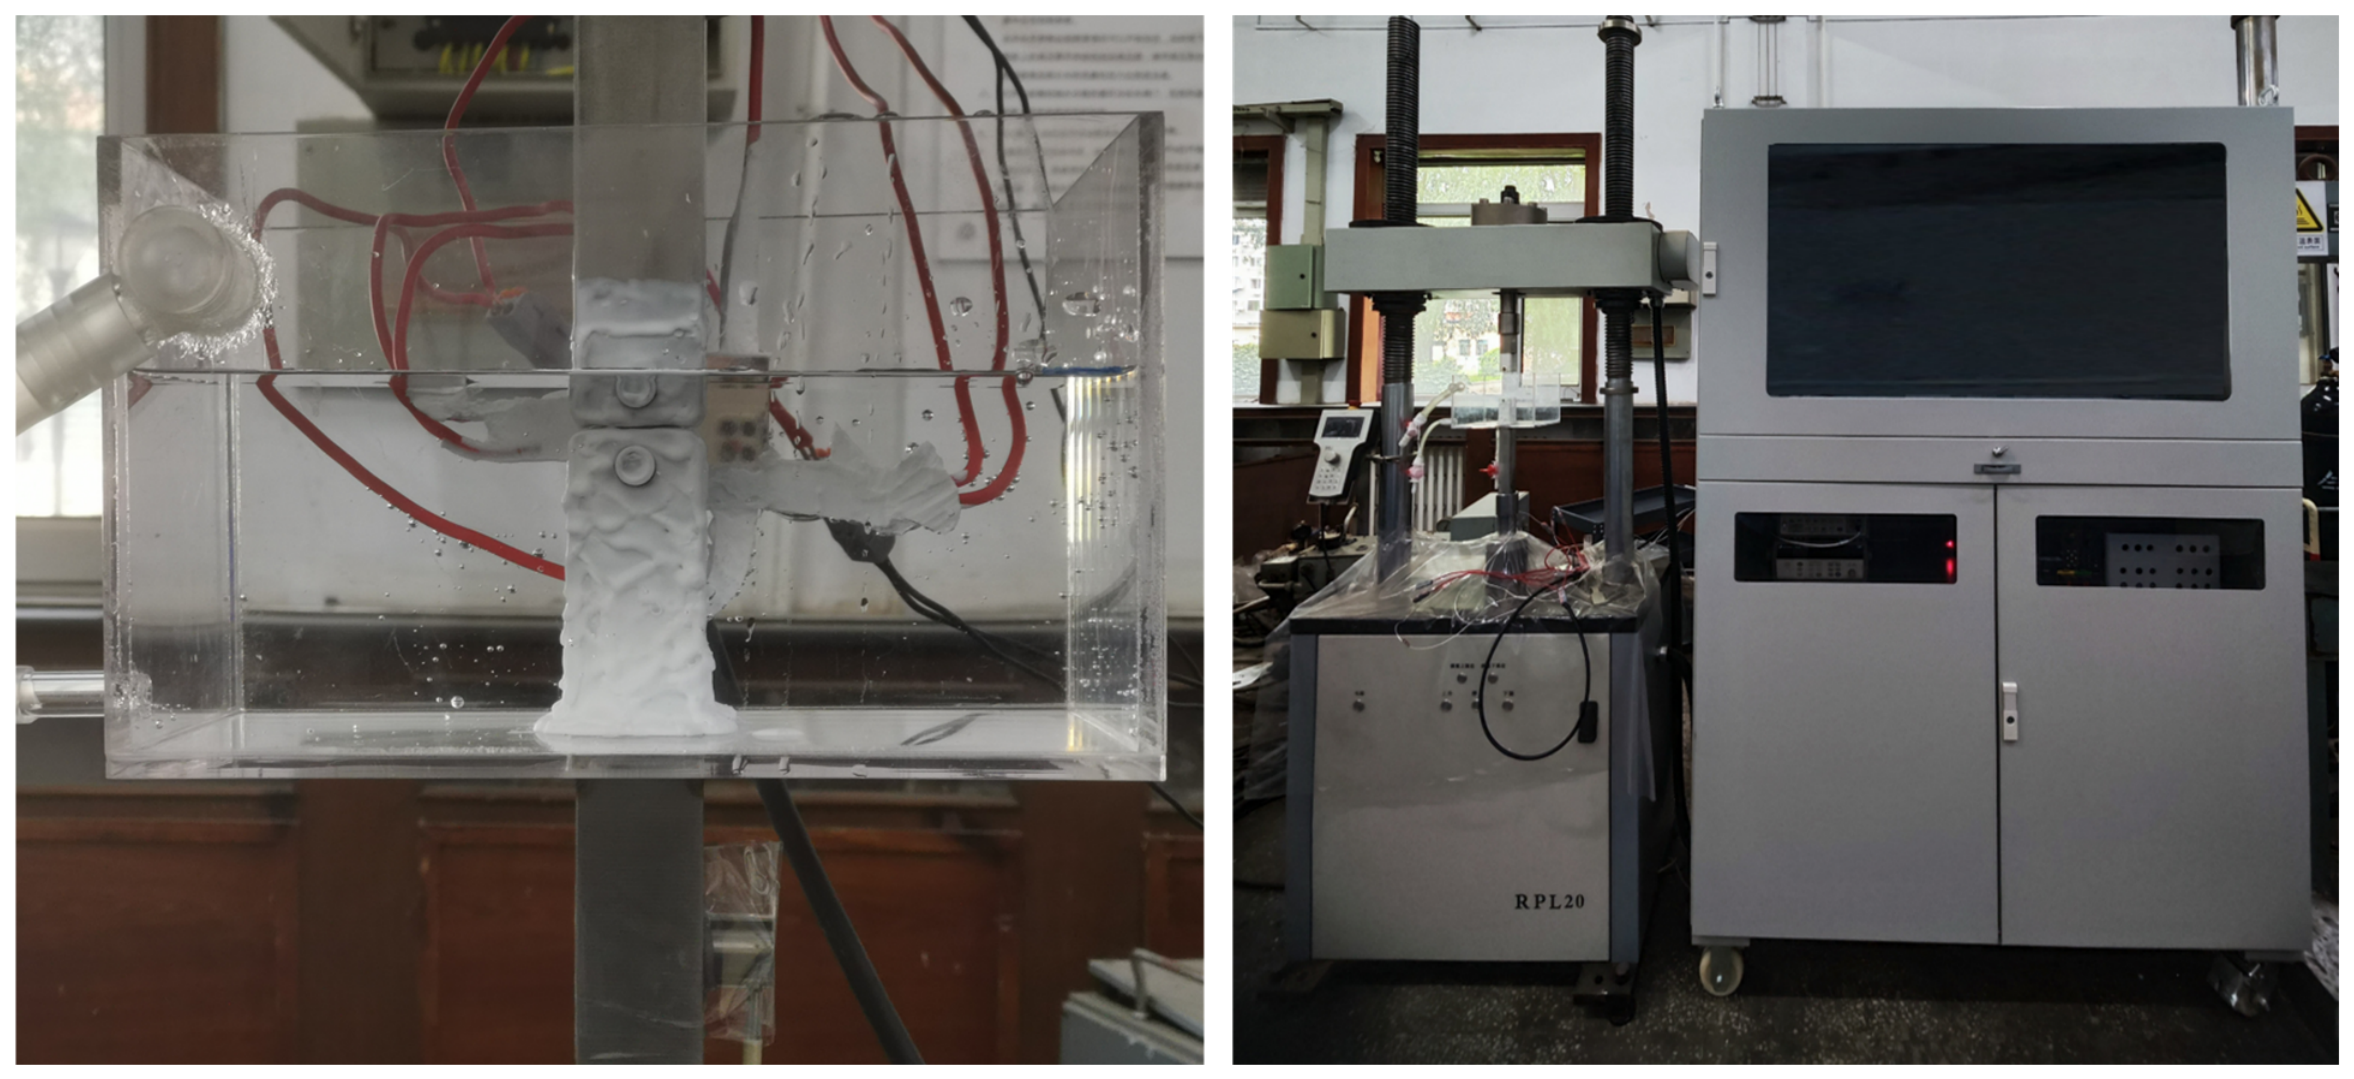
Specimen and equipment: Compact tension (CT) specimens with a width of 50 mm and thickness of 10 mm were machined from the alloy plate in the T-L orientation (crack propagation perpendicular to the rolling direction). All tests were performed on a servo-hydraulic fatigue testing machine (RPL20, Sinotest Equipment Co., Ltd., Changchun, China) equipped with a direct current potential drop (DCPD) crack growth monitoring system (Figure 1). A circulating corrosion solution device was mounted around the specimen grips, connected to a temperature-controlled water bath to maintain the corrosive environment at room temperature. Figure 1 illustrates the experimental setup.
Figure 1.
Corrosion fatigue testing system: fatigue machine and DCPD setup (right); CT specimen immersed in solution (left).
Pre-cracking procedure: prior to corrosion fatigue testing, a sharp pre-crack was introduced in air using a K-decreasing (load shedding) method. The initial maximum stress intensity factor Kmax was set to 10 MPa·√m and gradually reduced to 5 MPa·√m, with a load ratio R = 0.1 and a frequency of 10 Hz. Crack propagation during pre-cracking was monitored by a clip-on COD (crack opening displacement) extensometer.
Corrosion fatigue test protocol: after pre-cracking, the specimen was immersed in the corrosive solution (3.5 wt% NaCl, pH = 7.0) for 24 h to allow full wetting of the crack tip region. The specimen was then mounted on the testing machine, and the solution circulation system was activated to ensure continuous flow of fresh corrosive medium covering the notch area. Corrosion fatigue crack growth tests were performed under constant ΔK (stress intensity factor range) control with a sinusoidal waveform. Three stress ratios were investigated: R = 0.1, 0.3, and 0.5, each at a constant frequency of 0.5 Hz. For each R, the test started at a low ΔK (≈27 MPa·√m) and ΔK was gradually increased in controlled steps to higher values (up to ≈67 MPa·√m) while maintaining a constant R. The crack length was continuously monitored by the DCPD system, which directly outputs the crack extension (Δa) versus number of cycles (N). The crack growth rate (da/dN) was derived by numerical differentiation (seven-point incremental polynomial method). A total of 154 valid data points were obtained, covering a wide range of ΔK (27–67 MPa·√m) and three stress ratios. All tests were performed at room temperature (25 °C) with constant pH and chloride concentration, representing a realistic aggressive environment encountered in aircraft service.
It is important to recognize that the external test set represents a non-trivial distribution shift relative to the training data, rather than a simple random split. This shift arises from three main sources. First, in terms of alloy composition and temper, the training set covers multiple 2xxx and 7xxx series alloys with various heat treatments (e.g., 2024-T3, 7075-T6, 7475-T73), whereas the external set uses 7050-T7451. Although both belong to the 7xxx series, their Zn/Mg/Cu ratios and aging conditions differ, leading to distinct precipitate microstructures (η′ and η phases of varying size and distribution), which in turn affect slip homogeneity, corrosion susceptibility, and the intrinsic Paris-regime coefficients [26,27]. Second, regarding loading protocol, most training data were obtained under constant-amplitude loading with fixed R-ratios, while the external tests were performed under constant-ΔK control with stepwise increasing ΔK. This procedural difference influences crack closure behavior and the effective stress intensity range, thereby altering the da/dN-ΔK relationship for a given nominal ΔK [28]. Third, concerning environmental conditions, the external tests were conducted specifically in 3.5 Wt% NaCl solution at pH 7.0 and 0.5 Hz, whereas the training data aggregate results from air, salt spray, and various aqueous environments with different pH values and chloride concentrations. The combination of low frequency, constant-ΔK loading, and a corrosive medium promotes enhanced corrosion-fatigue interaction—e.g., crack-tip anodic dissolution and hydrogen embrittlement—which can accelerate crack growth beyond what is predicted by superposition of pure fatigue and pure corrosion components [29,30]. Collectively, these differences create a substantial and physically meaningful distribution gap, making the external test set a stringent benchmark for evaluating the model’s generalizability and adaptive capability under realistic deployment conditions.
This external test set was not used during any model training or validation in the initial stage. The alloy 7050 is compositionally similar to the 7xxx series alloys present in the internal training set (e.g., 7075, 7475), but the specific heat treatment (T7451), exact composition, and the combination of constant-ΔK loading steps are different from the literature data used for training. Thus, this dataset simulates a realistic distribution shift that a model would encounter when deployed to a new alloy batch or laboratory.
2.3. Dual-Physics Model Formulation
2.3.1. Walker Model
The Walker equation [8] modifies the Paris law to account for the stress ratio effect:
where C > 0, m, and q are material constants. In logarithmic space:
2.3.2. Forman Model
The Forman equation [9] incorporates the acceleration near fracture toughness Kc:
where Cf > 0, mf, and Kc > 0 are material constants.
2.3.3. Adaptive Dual-Physics Fusion
We propose a hybrid physics prediction that linearly combines Walker and Forman outputs via a learnable weight ∈ [0, 1]:
The final log10 prediction is:
where ε = 1 × 10⁻⁸ prevents numerical issues, and r is a residual correction term learned by the network to capture deviations not covered by the physical models.
It is worth noting that a more comprehensive empirical model, the NASGRO equation, explicitly accounts for all three crack growth regimes—near-threshold (Region I), Paris (Region II), and fracture-toughness-controlled (Region III)—by incorporating the threshold stress intensity factor range ΔKth and the fracture toughness Kc into a single formulation. While NASGRO provides a unified description, it requires accurate determination of additional material-dependent parameters (e.g., ΔKth, Kc, and the transition exponents), which are often difficult to identify reliably from limited or noisy corrosion-fatigue data. In contrast, our DPINN approach adopts a reduced-order representation by adaptively fusing Walker (covering Region II) and Forman (covering Region III) through the trainable weight α, without requiring explicit specification of ΔKth. This design choice prioritizes robustness and data efficiency under sparse training samples, while still capturing the most critical transition—the acceleration toward fracture—through the Forman denominator. The threshold regime (Region I), although important, is left for future extension as more near-threshold data become available.
2.4. Network Architecture
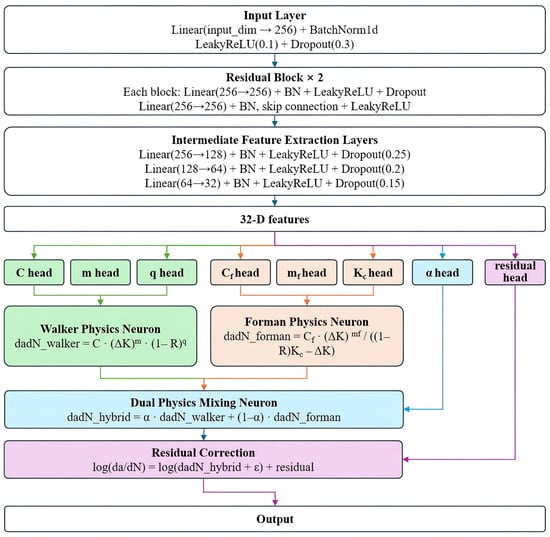
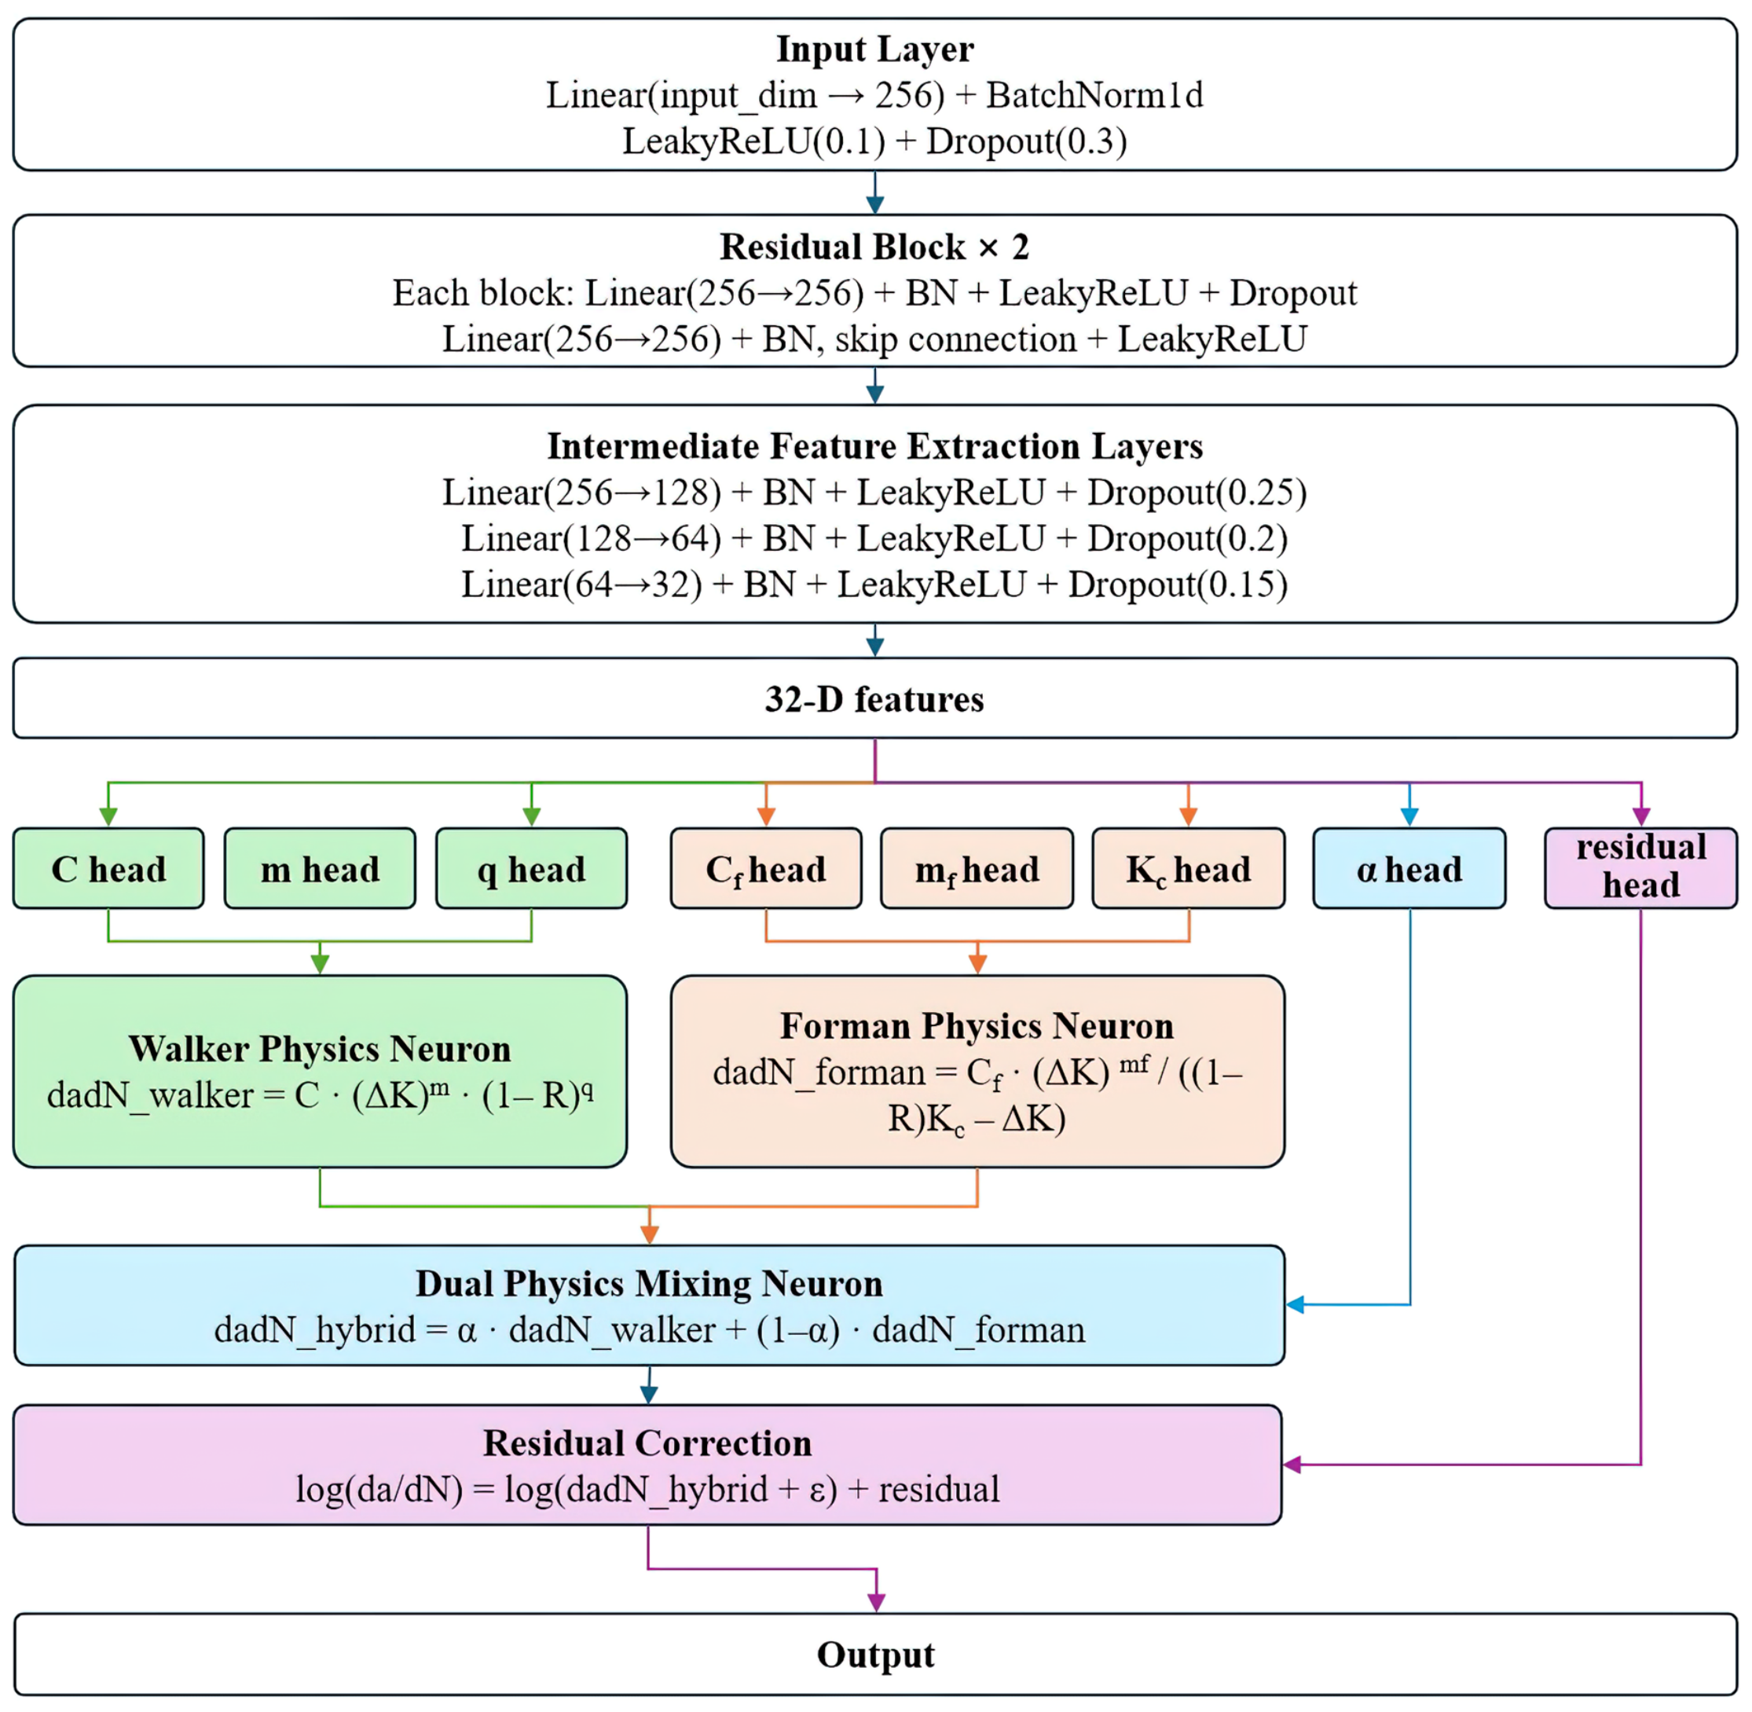
The DPINN architecture (Figure 2) is built upon a deep residual network to facilitate training and feature reuse.
Figure 2.
Architecture of the dual-physics-informed neural network.
The network begins with an input layer that maps the normalized 67-dimensional feature vector to a 256-unit representation, followed by Batch Normalization, LeakyReLU (negative slope 0.1), and Dropout (0.3). Two residual blocks are then applied. Each residual block comprises two linear layers of 256 units, with Batch Normalization, LeakyReLU, and Dropout (0.2) applied after the first linear layer, and Batch Normalization and LeakyReLU after the second linear layer. A residual connection adds the input of the block to the output, followed by a final LeakyReLU. After the residual blocks, three downsampling layers progressively reduce the dimension from 256 to 128, then to 64, and finally to 32. Each downsampling layer includes Batch Normalization, LeakyReLU, and Dropout (with rates 0.25, 0.2, and 0.15, respectively). The resulting 32-dimensional features are fed into four task-specific heads:
Walker head: a sequence of linear layers with dimensions 32, 64, 32, and 1. A Softplus activation is applied to the output of the final layer to obtain the Walker coefficient C, while linear outputs are used for “m” and “q”.
Forman head: a similar structure that outputs Cf (via Softplus), “mf (linear), and Kc (Softplus + 1 × 10⁻³).
Alpha head: linear layers of sizes 32, 32, and 1 with a Sigmoid activation, producing the fusion weight ∈ (0, 1).
Residual head: linear layers of sizes 32, 64, 32, and 1, outputting the residual correction term “r”.
The Walker and Forman predictions are combined via α to form the hybrid physical estimate. The final log10(da/dN) is obtained by adding the residual term “r” and applying a logarithmic transformation. All weights are initialized using Kaiming normal initialization tailored for LeakyReLU nonlinearity.
2.5. Loss Function and Optimization Strategy
To train the DPINN effectively, we design a composite loss function that balances data-driven fidelity with physical regularization. The total loss consists of two terms:
The first term is the standard mean squared error (MSE) between the predicted and experimental values of log10(da/dN):
where N is the batch size, ypred,i is the network output, and ytrue,i is the experimental log10(da/dN). This term ensures that the model accurately fits the observed data.
The second term is a regularization term applied to the fusion weight :
This regularization encourages to stay near 0.5, preventing the network from relying exclusively on one of the two physical models. A value of close to 0.5 indicates a balanced contribution from both the Walker and Forman equations, which we found to be beneficial for generalization under distribution shift. The hyperparameter controls the strength of this regularization and is set to based on a preliminary grid search.
A warmup strategy is adopted during training. For the first w epochs, is fixed at 0.5 to stabilize the early learning phase; after the warmup period, becomes trainable and the regularization term is activated. The warmup length is set to w = 300 for initial training from scratch and reduced to w = 150 for fine-tuning during incremental learning steps.
For optimization, we employ the Radam (Rectified Adam) optimizer [32] with an initial learning rate of . The learning rate is scheduled using OneCycleLR [33] with a maximum learning rate of over a total of 5000 training steps. This schedule gradually increases the learning rate in the early phase, then decreases it, which has been shown to improve convergence speed and final performance.
To avoid overfitting and reduce training time, we apply early stopping. Training is terminated if the total loss on a validation subset (randomly sampled as 10% of the training data) does not improve for 300 consecutive epochs. The model parameters that achieved the lowest validation loss are restored as the final model. The maximum number of epochs is set to 5000, though early stopping typically ends training earlier. The model was implemented in Python 3.11.9 using PyTorch 2.7.1, XGBoost 3.2.0, Scikit-learn 1.8.0, and SHAP 0.51.0.
2.6. Incremental Learning Protocol
To simulate a realistic deployment scenario where a pre-trained model encounters new data from a shifted distribution, we design an incremental learning protocol that uses only a small fixed portion of the original data plus increasing amounts of new external data.
Let denote the original full training set (2088 samples). Before incremental learning, we randomly sample 10% of (208 samples) as a fixed core subset, denoted . This subset is drawn once and remains unchanged throughout all incremental steps.
Let denote the incremental addition set, consisting of 92 samples drawn from the external test set. The samples in are ordered by a fixed random permutation. For each incremental ratio , define as the subset containing the first samples in that order. At each incremental step , the combined training set used for fine-tuning is:
The models are updated as follows:
During incremental fine-tuning, all network parameters (weights and biases) of the Walker-PINN and DPINN are updated without freezing any layers. To mitigate catastrophic forgetting while enabling efficient adaptation, we use a reduced learning rate () compared to the initial training phase, along with a shorter warmup period (150 epochs) and the same early stopping criterion (patience = 300 epochs). Catastrophic forgetting is quantitatively assessed by monitoring model performance (MSE, R2, MRE, and Pearson correlation) on the fixed internal test set (the 30% random split from the original distribution) at each incremental step. The stability of these metrics throughout the incremental process confirms that the model retains knowledge of the original data distribution while adapting to the new one. To ensure reproducibility of the incremental learning procedure, the fixed 10% core subset is sampled once using a fixed random seed, and the incremental addition set is ordered by a fixed random permutation that remains unchanged across all experiments.
- Random Forest (RF): remains fixed (non-adaptive baseline);
- Gradient Boosting Regressor (GBR): uses warm_start = True, adding 50 trees per step, and is refit on ;
- Walker-PINN and DPINN: fine-tuned on Dp using the same optimizer but with a reduced learning rate (), warmup of 150 epochs, and early stopping (patience = 300);
- Origin_testdata: the internal 30% test set to monitor catastrophic forgetting;
- Remaining external samples: the set of external data points that have not yet been added to . Its size decreases from 154 at to 62 at . This dynamic evaluation measures the model’s ability to adapt to the target distribution as it progressively sees more of it.
2.7. Evaluation Metrics
To quantitatively assess model performance, we adopt four standard regression metrics. For a set of test samples with true values and predicted values , the metrics are defined as follows.
Mean Squared Error (MSE) measures the average squared difference between predictions and true values:
A lower MSE indicates better predictive accuracy.
Mean Relative Error (MRE) quantifies the average relative deviation, which is particularly useful for comparing errors across different orders of magnitude. Since the true values can be zero or negative in log-space, we compute relative error on the original scale. Let and be the actual crack growth rates. Then:
MRE is reported as a percentage. A lower MRE signifies better relative accuracy.
The coefficient of determination () represents the proportion of variance in the true values that is explained by the model:
where . An value close to 1 indicates excellent fit, while a negative value implies that the model performs worse than simply predicting the mean.
The Pearson correlation coefficient measures the linear correlation between predicted and experimental values:
This metric ranges from −1 to 1, with values close to 1 indicating strong positive linear correlation.
All metrics are computed separately for the internal test set (to assess forgetting) and for the cold-start external set (to assess adaptation).
3. Results and Discussion
3.1. Microstructural Characterization
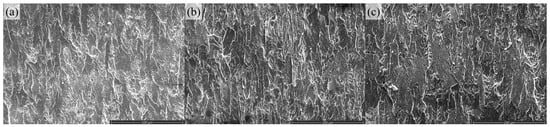
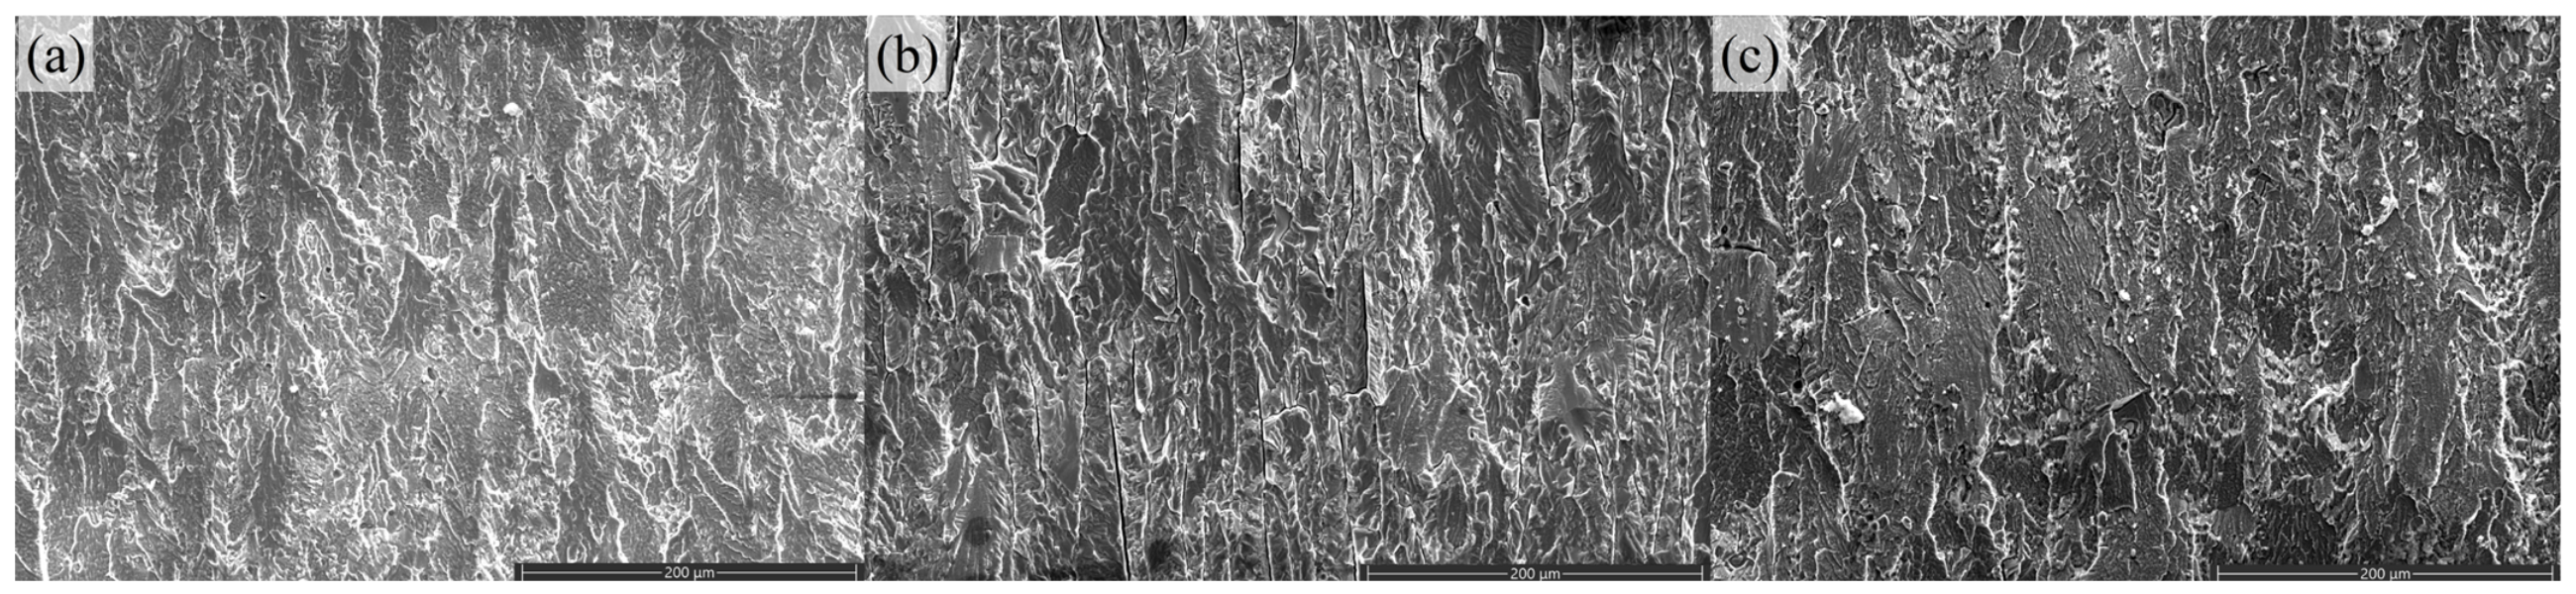
To characterize the fracture surfaces of the 7050-T7451 alloy used in the external test set, the tested specimens were examined using scanning electron microscopy (SEM, Prisma E, Thermo Fisher Scientific, Waltham, MA, USA). Figure 3 presents SEM images of the fracture surfaces of CT specimens tested in 3.5 wt% NaCl solution at three stress ratios: R = 0.1, 0.3, and 0.5.
Figure 3.
SEM images of fracture surfaces of CT specimens tested in 3.5 wt% NaCl solution at different stress ratios: (a) R = 0.1, (b) R = 0.3, and (c) R = 0.5.
As shown in Figure 3, the fracture morphology varies significantly with stress ratio. At R = 0.1 (Figure 3a), the fracture surface exhibits a relatively flat morphology with finely distributed wavy facets and occasional cleavage steps. Micropores are visible but sparse, and no significant corrosion products or pitting features are observed. This morphology suggests that, at low stress ratios, crack propagation is primarily governed by mechanical fatigue, with limited corrosion involvement. At R = 0.3 (Figure 3b), the fracture surface becomes more regular, with wavy facets that are larger and more continuous than those at R = 0.1. Cleavage steps are more pronounced, and the overall texture appears more ordered, indicating that the crack path is increasingly influenced by the underlying grain structure. The transition from R = 0.1 to R = 0.3 suggests a gradual shift from purely fatigue-dominated fracture to a mixed mode involving both fatigue and corrosion-assisted damage. At R = 0.5 (Figure 3c), the fracture surface displays markedly different features. Continuous ridge-like facets dominate the morphology, accompanied by pronounced corrosion pits and evidence of more extensive plastic deformation. The ridge-like patterns suggest that the crack tip experienced repeated blunting and resharpening under the combined action of cyclic loading and corrosive attack, while the corrosion pits indicate that the higher mean stress promotes sustained crack-tip anodic dissolution. The corrosive medium had sufficient time to interact with the freshly exposed crack surfaces, accelerating damage accumulation and leading to the highest corrosion-fatigue interaction among the three stress ratios tested.
To quantitatively characterize this behavior and provide experimental data for model training and validation, additional corrosion fatigue crack growth tests were conducted on the 7050-T7451 alloy. The measured da/dN-ΔK curves are presented and discussed in the following sections.
3.2. Performance on Internal Test Set
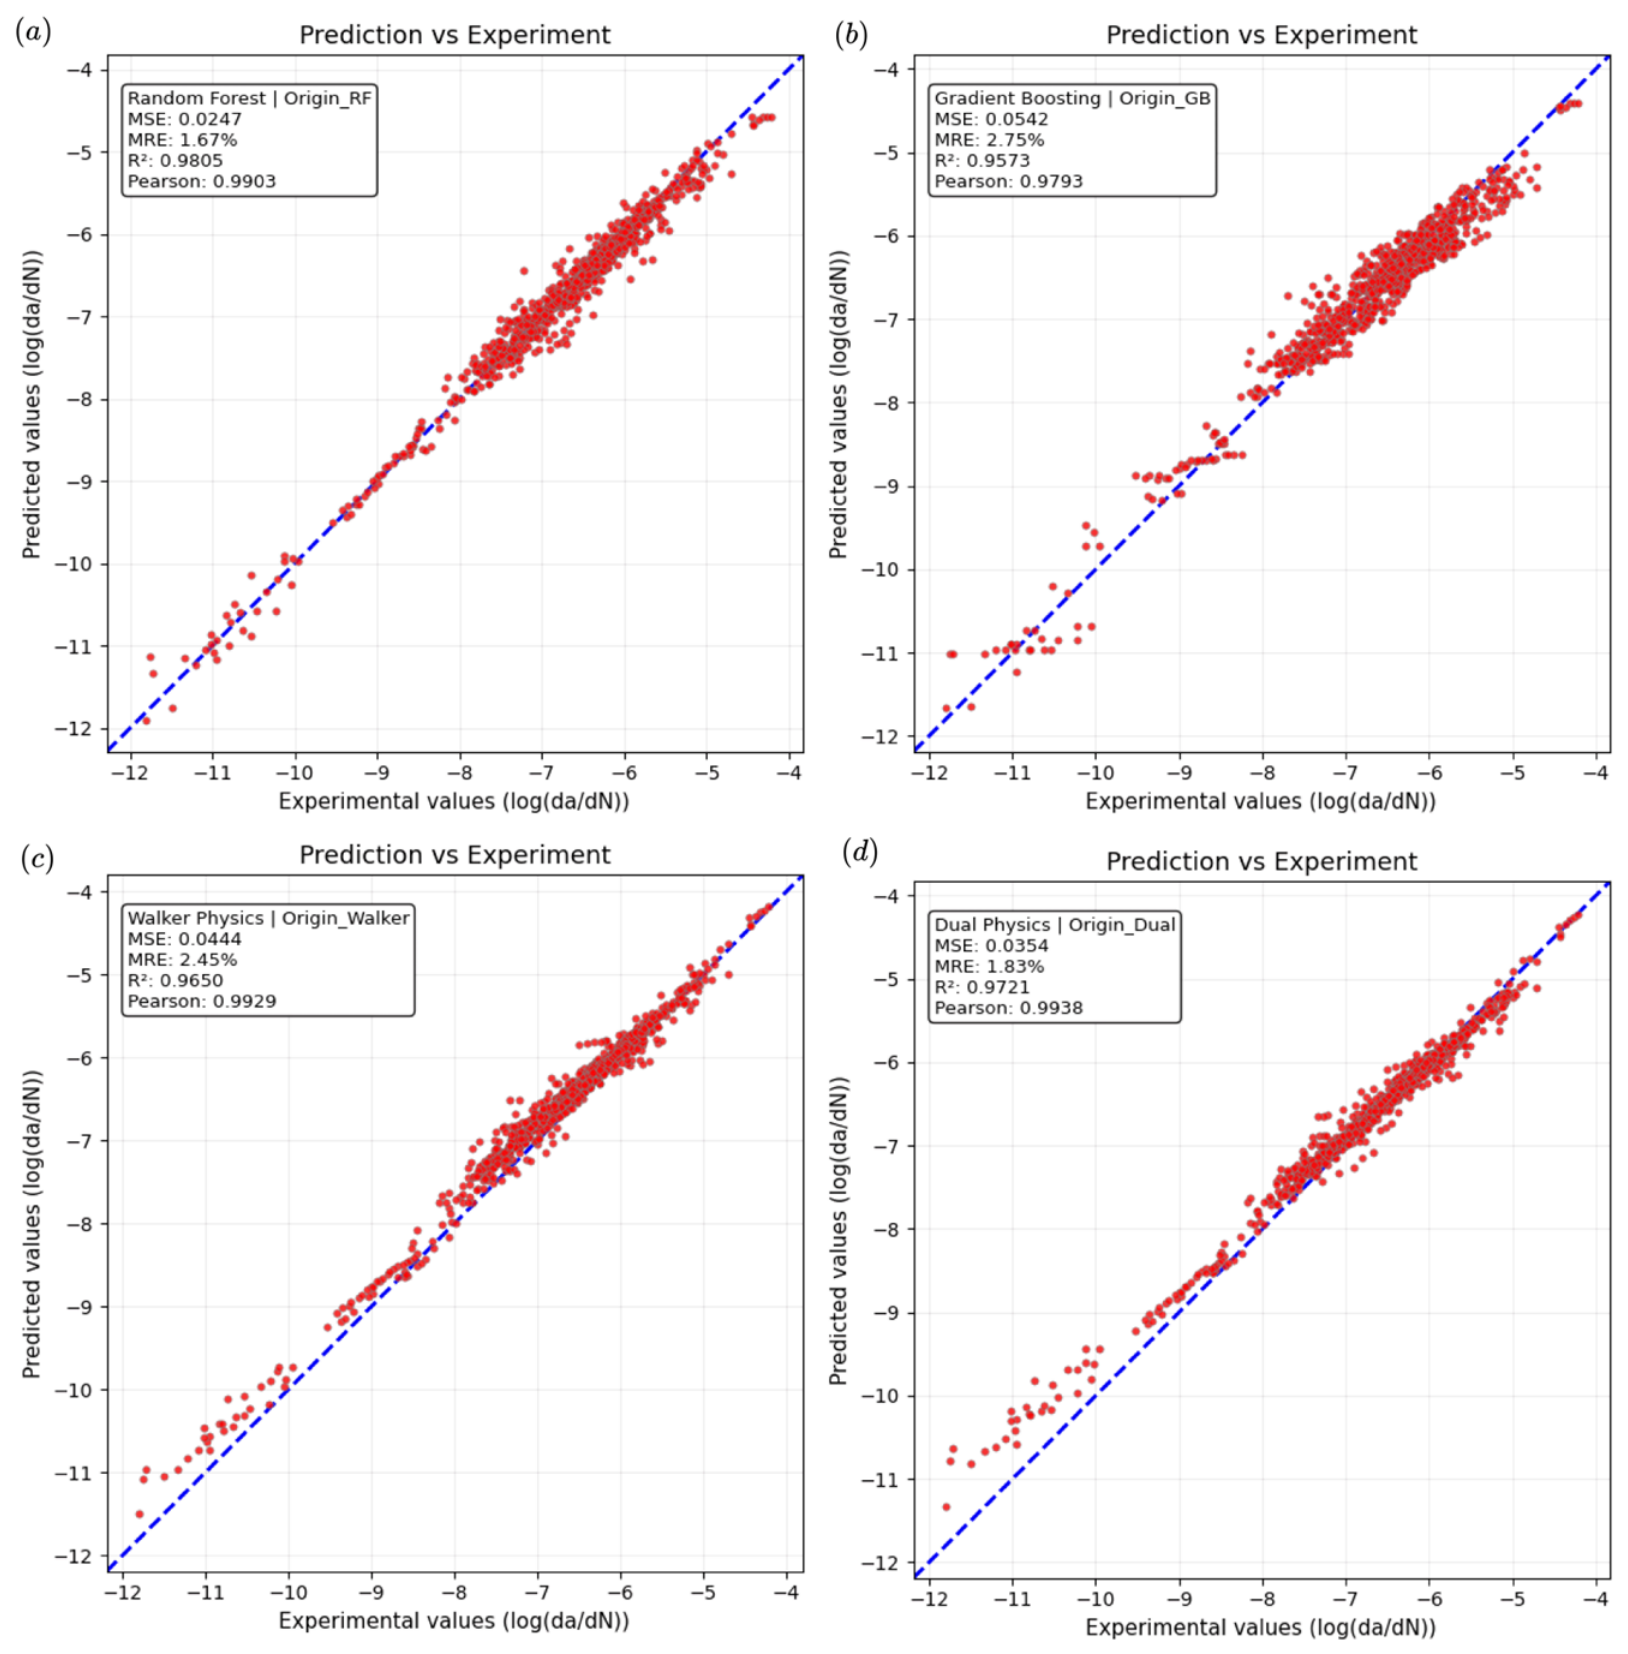
Table 2 presents the performance of all models on the internal test set (30% random split). All models achieve high accuracy, with R2 > 0.95, confirming that they can fit the training distribution well and that incremental fine-tuning does not cause catastrophic forgetting. The DPINN yields an R2 of 0.9710 (MSE = 0.0368, MRE = 1.99%), slightly outperforming the Walker-PINN (R2 = 0.9685). Gradient Boosting improves from its initial 0.9573 to 0.9811 after accumulating trees, while Random Forest remains constant at 0.9805.
Table 2.
Performance comparison on internal test set.
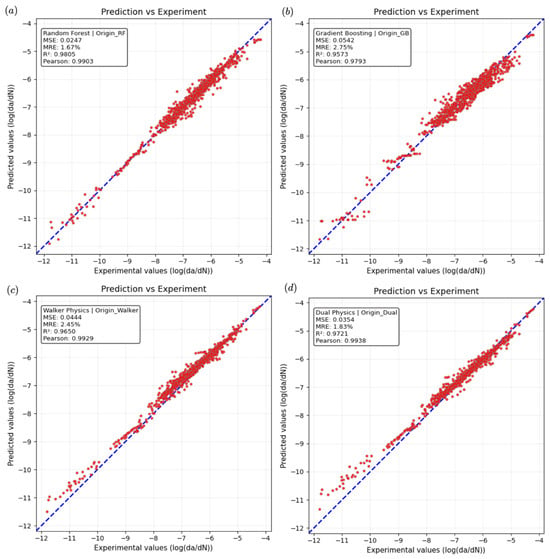
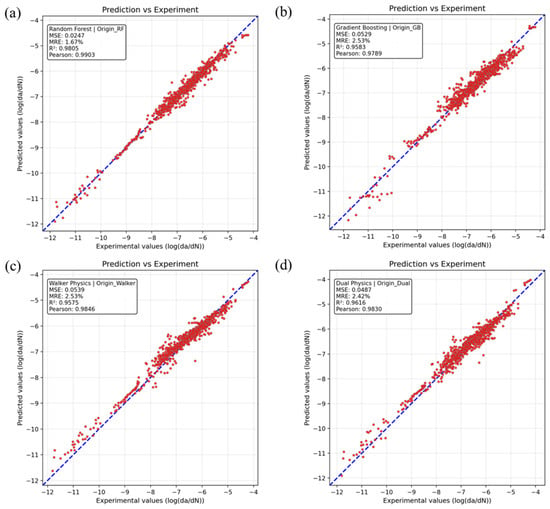
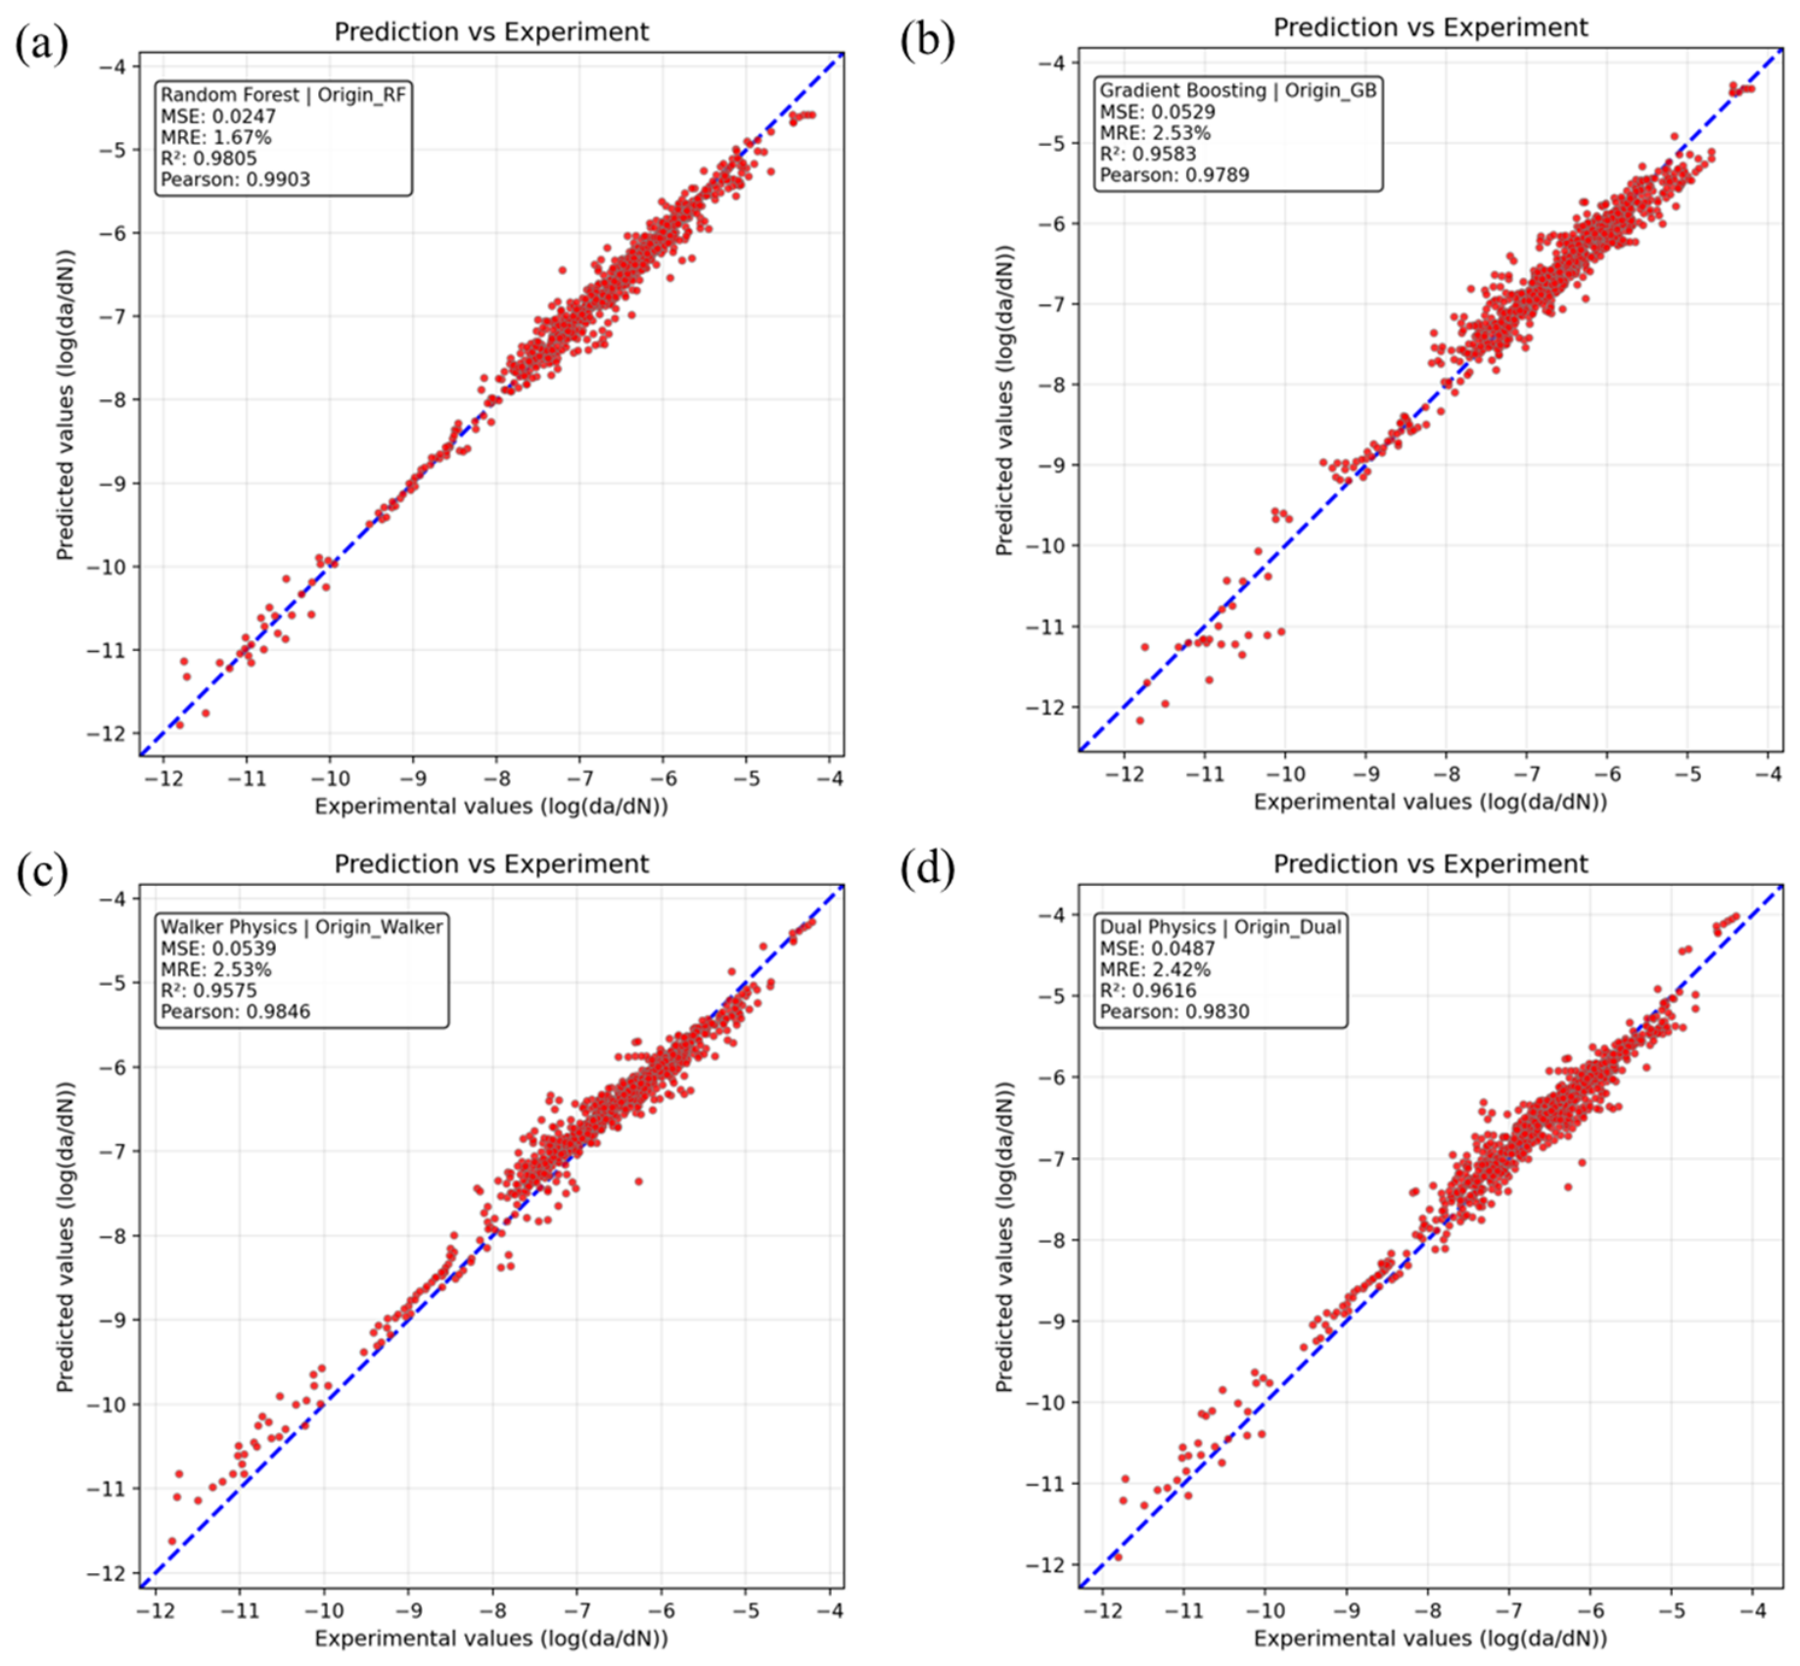
Figure 4 shows the scatter plots of predicted versus experimental log(da/dN) for the four models on this internal test set. All points cluster tightly around the diagonal line (perfect prediction), visually confirming the high accuracy reported in Table 2. The DPINN exhibits the narrowest scatter, especially in the low- and high-rate regions.
Figure 4.
Scatter plots of predicted vs. experimental log(da/dN) on the internal test set for (a) RF, (b) GBR, (c) Walker-PINN, (d) DPINN.
3.3. Devastating Effect of Distribution Shift Without Adaptation
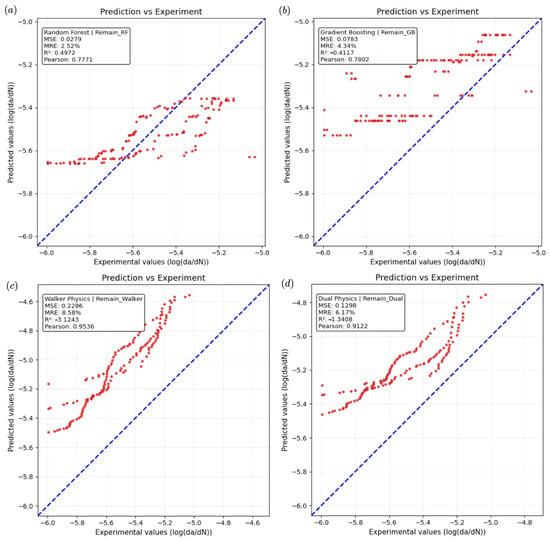
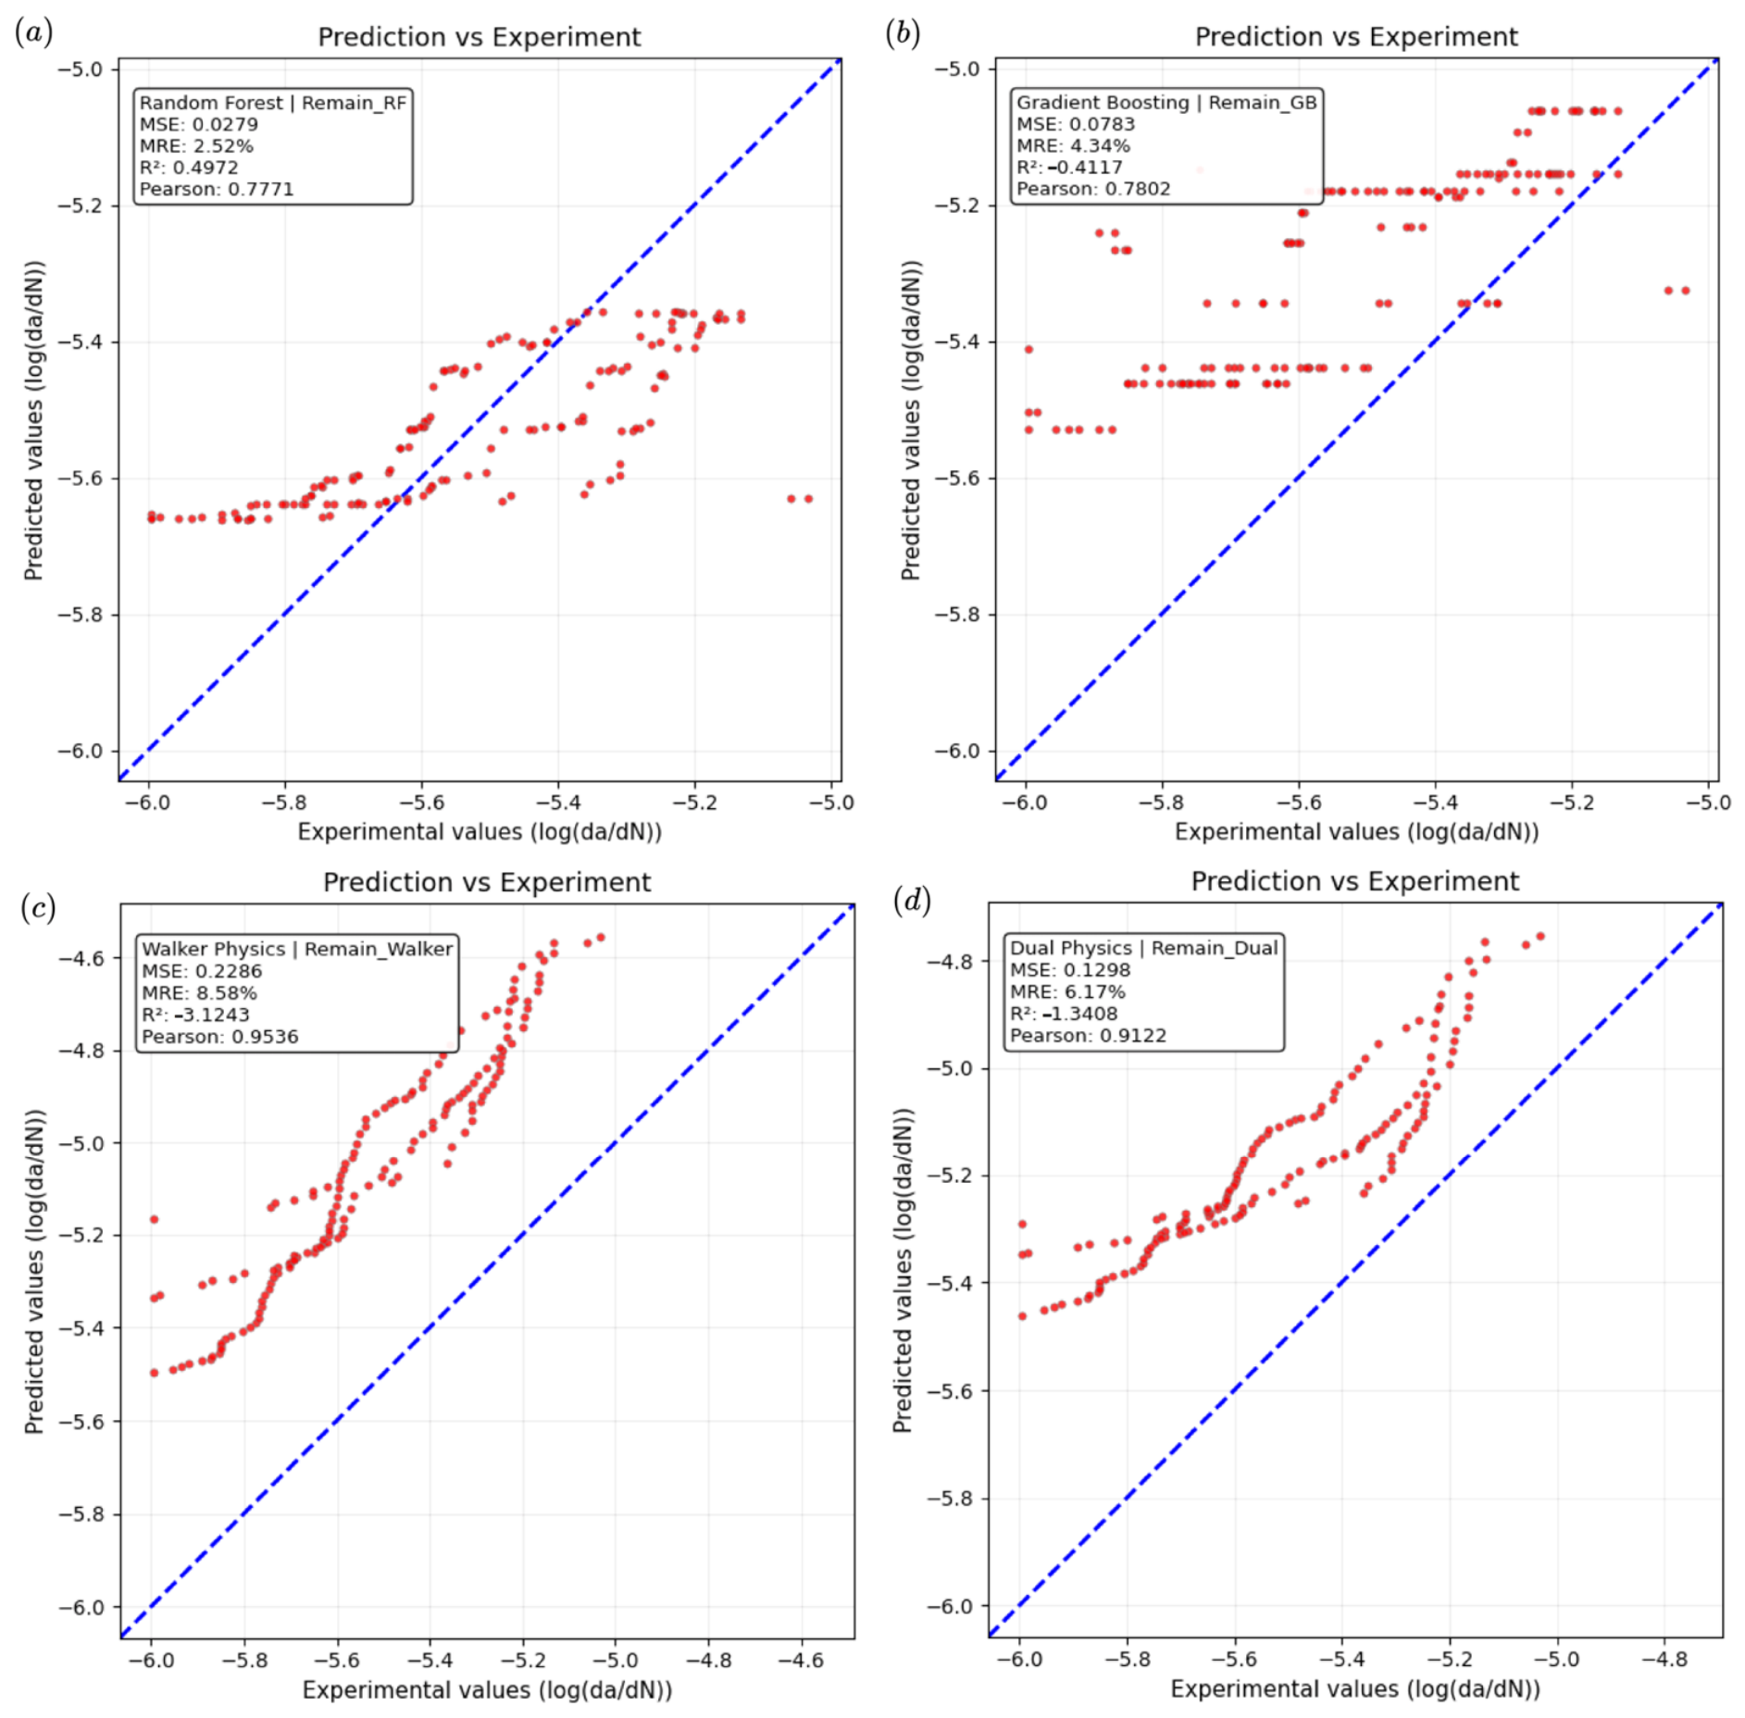
The external test set used in this study was obtained from independent experiments as described in Section 2.6. When the models trained only on the original dataset (0% incremental addition) are directly applied to the full external test set (154 samples), their performance collapses dramatically (Table 3, Figure 5). The Walker-PINN drops to R2 = −3.1243 and MSE = 0.2286, and the DPINN yields R2 = −1.3408. Pure data-driven models fare slightly better but still cannot provide reliable predictions (Random Forest R2 = 0.4972, Gradient Boosting R2 = −0.4117). This confirms that no model can generalize zero-shot to a truly unseen distribution—a realistic challenge in corrosion fatigue where alloy grades, heat treatments, or environmental conditions differ from the training set.
Table 3.
Zero-shot performance on the full external test set (no incremental adaptation).
Figure 5.
Scatter plots of predicted vs. experimental log(da/dN) on the external test set for (a) RF, (b) GBR, (c) Walker-PINN, (d) DPINN.
3.4. Incremental Adaptation Recovers Performance with Few Samples
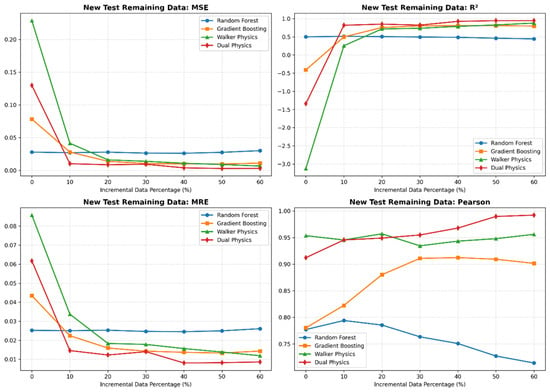
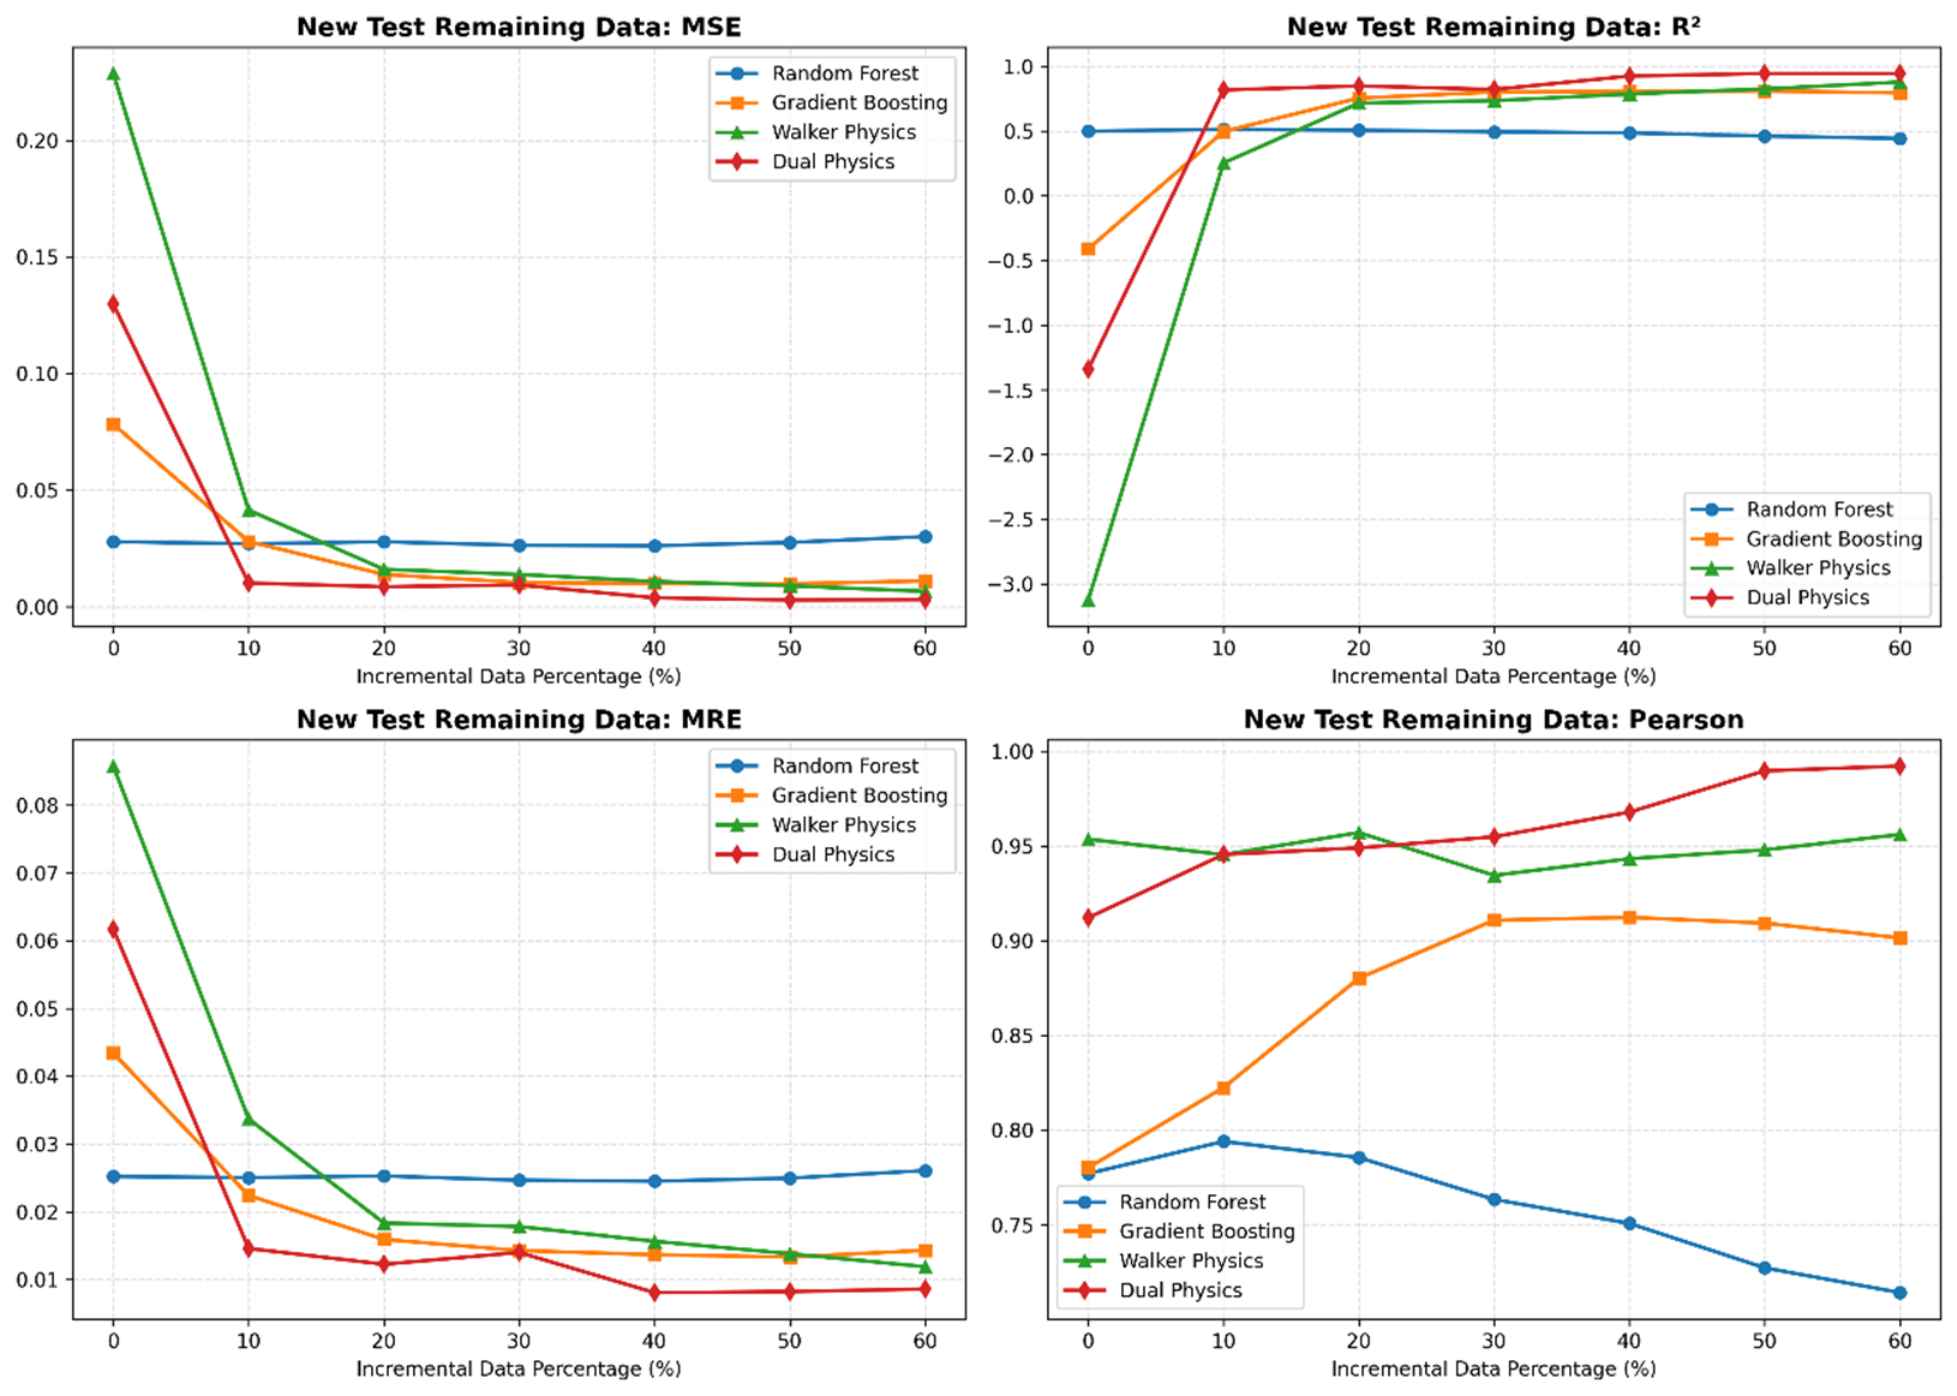
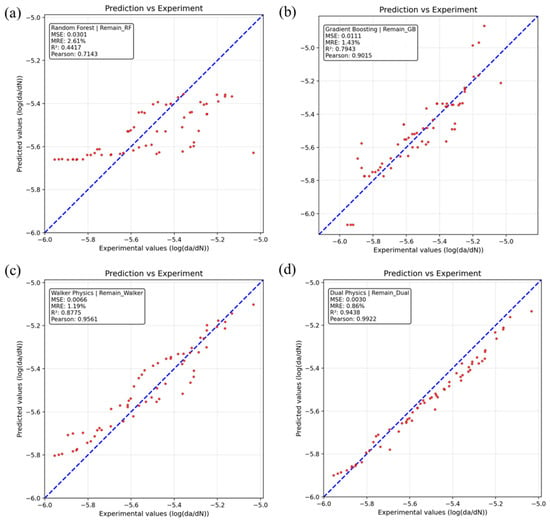
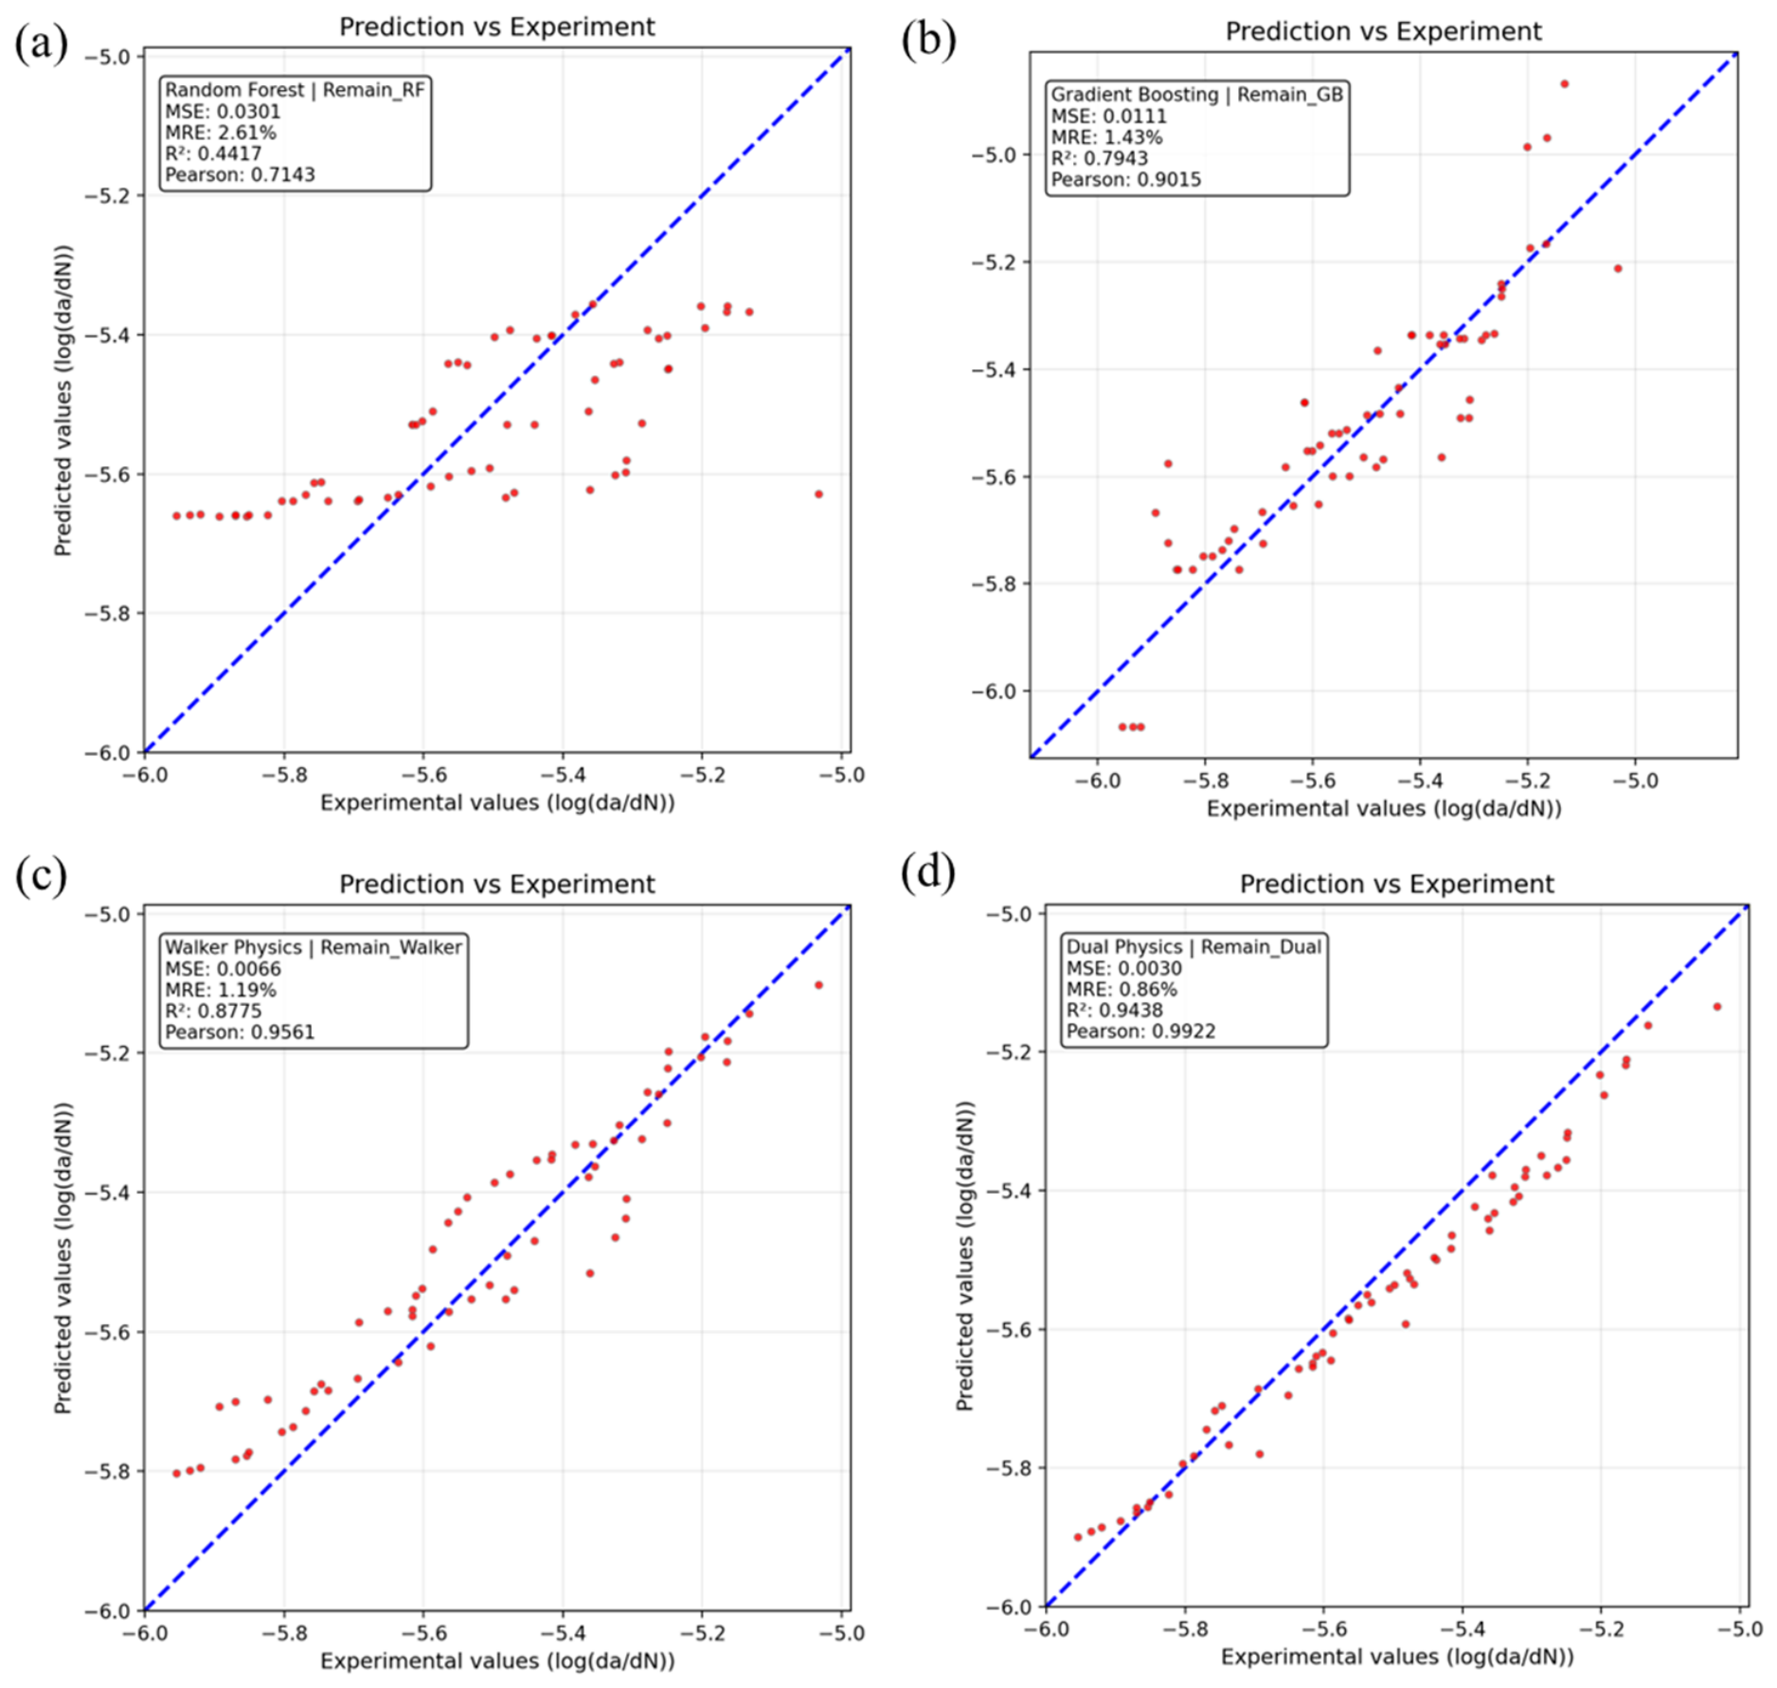
The results presented in Section 3.3 demonstrate that all models fail catastrophically when directly applied to the external test set without any adaptation. This scenario, however, does not reflect a realistic deployment situation. In practice, a pre-trained model can be periodically updated as new field data become available. To simulate this practical setting, we implemented the incremental learning protocol described in Section 2.6. At each step, a certain fraction of the external addition set (from 10% to 60%, corresponding to 15 to 92 samples) is added to the fixed 10% subset of the original training data, and the models are fine-tuned accordingly. After each update, we evaluate the models on the remaining unseen external samples—the set of external data points that have not yet been incorporated into training. The size of this evaluation set decreases gradually from 154 at 0% to 62 at 60% (see Table 4). This dynamic evaluation provides a strict measure of how well each model generalizes after seeing only a subset of the target distribution. Table 4 summarizes the evolution of on the remaining unseen external samples as more data are incorporated. The evolution of the four evaluation metrics (MSE, R2, MRE, and Pearson) with increasing incremental data ratio is presented in Figure 6. Figure 7 shows the corresponding scatter plots of predicted vs. experimental log(da/dN) for all four models after fine-tuning with 60% of the external data. Figure 8 presents the scatter plots on the internal test set after the final incremental step, confirming that no catastrophic forgetting occurred.
Table 4.
Incremental generalization trajectory on the remaining unseen external samples.
Figure 6.
Evaluation metrics (MSE, R2, MRE, Pearson) evolution versus incremental data ratio.
Figure 7.
Scatter plots of predicted vs. experimental log(da/dN) on the external test set with 60% Incremental Ratio for (a) RF, (b) GBR, (c) Walker-PINN, (d) DPINN.
Figure 8.
Scatter plots of predicted vs. experimental log(da/dN) on the internal test set with 60% Incremental Ratio for (a) RF, (b) GBR, (c) Walker-PINN, (d) DPINN.
Data-driven models under distribution shift. The Random Forest model, which remains fixed throughout the incremental steps, shows a gradual decline in performance, with decreasing from 0.497 at 0% to 0.442 at 60%. This confirms that a static model cannot cope with a shifted distribution and may even become less reliable as the target distribution evolves. The Gradient Boosting Regressor, updated incrementally by adding 50 trees per stage, improves substantially: its rises from −0.412 at 0% to 0.794 at 60%. However, GBR still remains below the engineering reliability threshold commonly accepted for predictive maintenance (e.g., ), indicating that purely data-driven adaptation has intrinsic limitations.
Physics-informed models recover quickly. Both Walker-PINN and DPINN start from very low values at 0% (−3.124 and −1.341, respectively), reflecting the severity of the initial distribution shift. As soon as a small fraction of external data is introduced, their performance improves dramatically. With only 10% of the external data, Walker-PINN reaches , while DPINN already achieves . This rapid recovery highlights the benefit of embedding physical priors: even a small amount of domain-specific data can correct the systematic bias caused by distribution shift, because the physical equations provide a strong inductive bias that guides the fine-tuning process.
Crossing the engineering reliability threshold. For many engineering applications, an value above 0.80 is considered sufficient for life estimation, and values above 0.90 are often desired for high-confidence predictions. The DPINN first crosses the threshold at the 40% incremental stage, after adding 61 new samples. At this point, DPINN achieves , with corresponding MSE = 0.0038 and MRE = 0.81%. Walker-PINN, in contrast, does not exceed until the 60% stage, where it reaches .
Final performance at 60% incremental data. After fine-tuning with 60% of the external data, DPINN stabilizes at , MSE = 0.0030, MRE = 0.86%, significantly outperforming both Walker-PINN () and GBR (). The fixed Random Forest remains far below at . These results collectively demonstrate that the dual-physics architecture not only achieves higher final accuracy but also requires fewer new samples to reach a practically useful level of reliability. This data efficiency is particularly valuable in industrial settings where obtaining large amounts of labeled field data is expensive or time-consuming.
Importantly, while both the training data and the external test set are corrosion fatigue data, they differ in alloy composition, heat treatment, loading protocol, and specific environmental parameters. More fundamentally, it is practically infeasible for any training dataset to cover all possible corrosion fatigue scenarios, given the vast combinatorial space of alloy grades, heat treatments, loading spectra, and environmental conditions encountered in real-world applications. This inherent limitation necessitates an incremental learning strategy that enables a pre-trained model to adapt to previously unseen corrosion fatigue conditions with a limited number of new experimental data points—mimicking realistic industrial deployment scenarios.
The evolution of the four evaluation metrics (MSE, R2, MRE, and Pearson) as a function of the incremental data ratio is illustrated in Figure 6. The R2 curve for DPINN rises sharply from negative values at 0% to above 0.9 at 40%, while the MSE and MRE drop correspondingly. This trend clearly demonstrates the rapid adaptation capability of the dual-physics architecture.
Figure 7 presents the scatter plots for all four models on the remaining unseen external samples after fine-tuning with 60% of the external data. The DPINN predictions (panel d) cluster closely around the diagonal, whereas the other models exhibit wider scatter, especially the fixed Random Forest (panel a). This confirms the superior generalization of DPINN after incremental adaptation. Figure 8 shows the corresponding scatter plots on the internal test set after the final incremental step. All models maintain tight clustering around the diagonal, with R2 values remaining above 0.95 (see also the stable performance in Figure 6). This indicates that the fine-tuning process does not cause catastrophic forgetting of the original data distribution.
Engineering significance of data-efficient adaptation. The observation that DPINN crosses the threshold after incorporating only 40% of the external data (61 samples) carries substantial practical value. In industrial and aerospace applications, obtaining labeled corrosion-fatigue data is often expensive and time-consuming, as it requires dedicated long-duration experiments under controlled corrosive environments. The ability to recover from a severe distribution shift with fewer than 100 new samples means that a pre-trained DPINN model can be deployed and updated with minimal experimental overhead when a new alloy batch, heat treatment, or service environment is introduced. This data efficiency is particularly attractive for digital twin frameworks [4,5], where models must continuously assimilate sparse field inspection or sensor data (e.g., from DCPD or strain gauges) to update remaining life predictions without requiring a full retraining cycle. Furthermore, the rapid adaptation capability reduces the latency between data acquisition and model update, enabling more timely maintenance decisions and potentially extending the service life of aging aircraft structures.
Prediction accuracy in the low-da/dN regime. As noted in Section 3.2, all models exhibit higher scatter in the low-da/dN regime (typically below m/cycle) on the internal test set, primarily because the training data are sparser in this region. However, the incremental fine-tuning process significantly improves DPINN’s performance in this critical regime. After incorporating 60% of the external data, the mean relative error (MRE) for samples with m/cycle decreases from 8.92% (at 0% adaptation) to 3.14%, while the MRE for the high-rate regime ( m/cycle) improves from 5.41% to 1.87%. The relatively larger improvement in the low-rate regime is attributable to the external dataset’s inclusion of more data points at low ΔK values, which correspond to low crack growth rates. This observation underscores the importance of targeted data collection in the near-threshold regime for future model improvements. Nevertheless, the low-da/dN regime remains the most challenging for data-driven and physics-informed models alike, and further enhancement would require either more extensive near-threshold experimental data or the incorporation of dedicated threshold models (e.g., including ΔKth into the physics formulation), which we identify as a key direction for future work.
3.5. Analysis of the Fusion Weight α
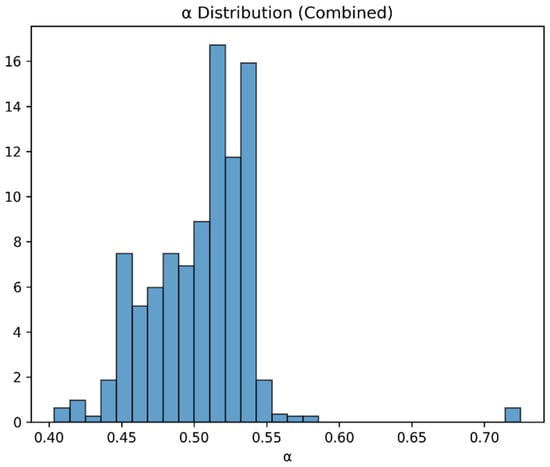
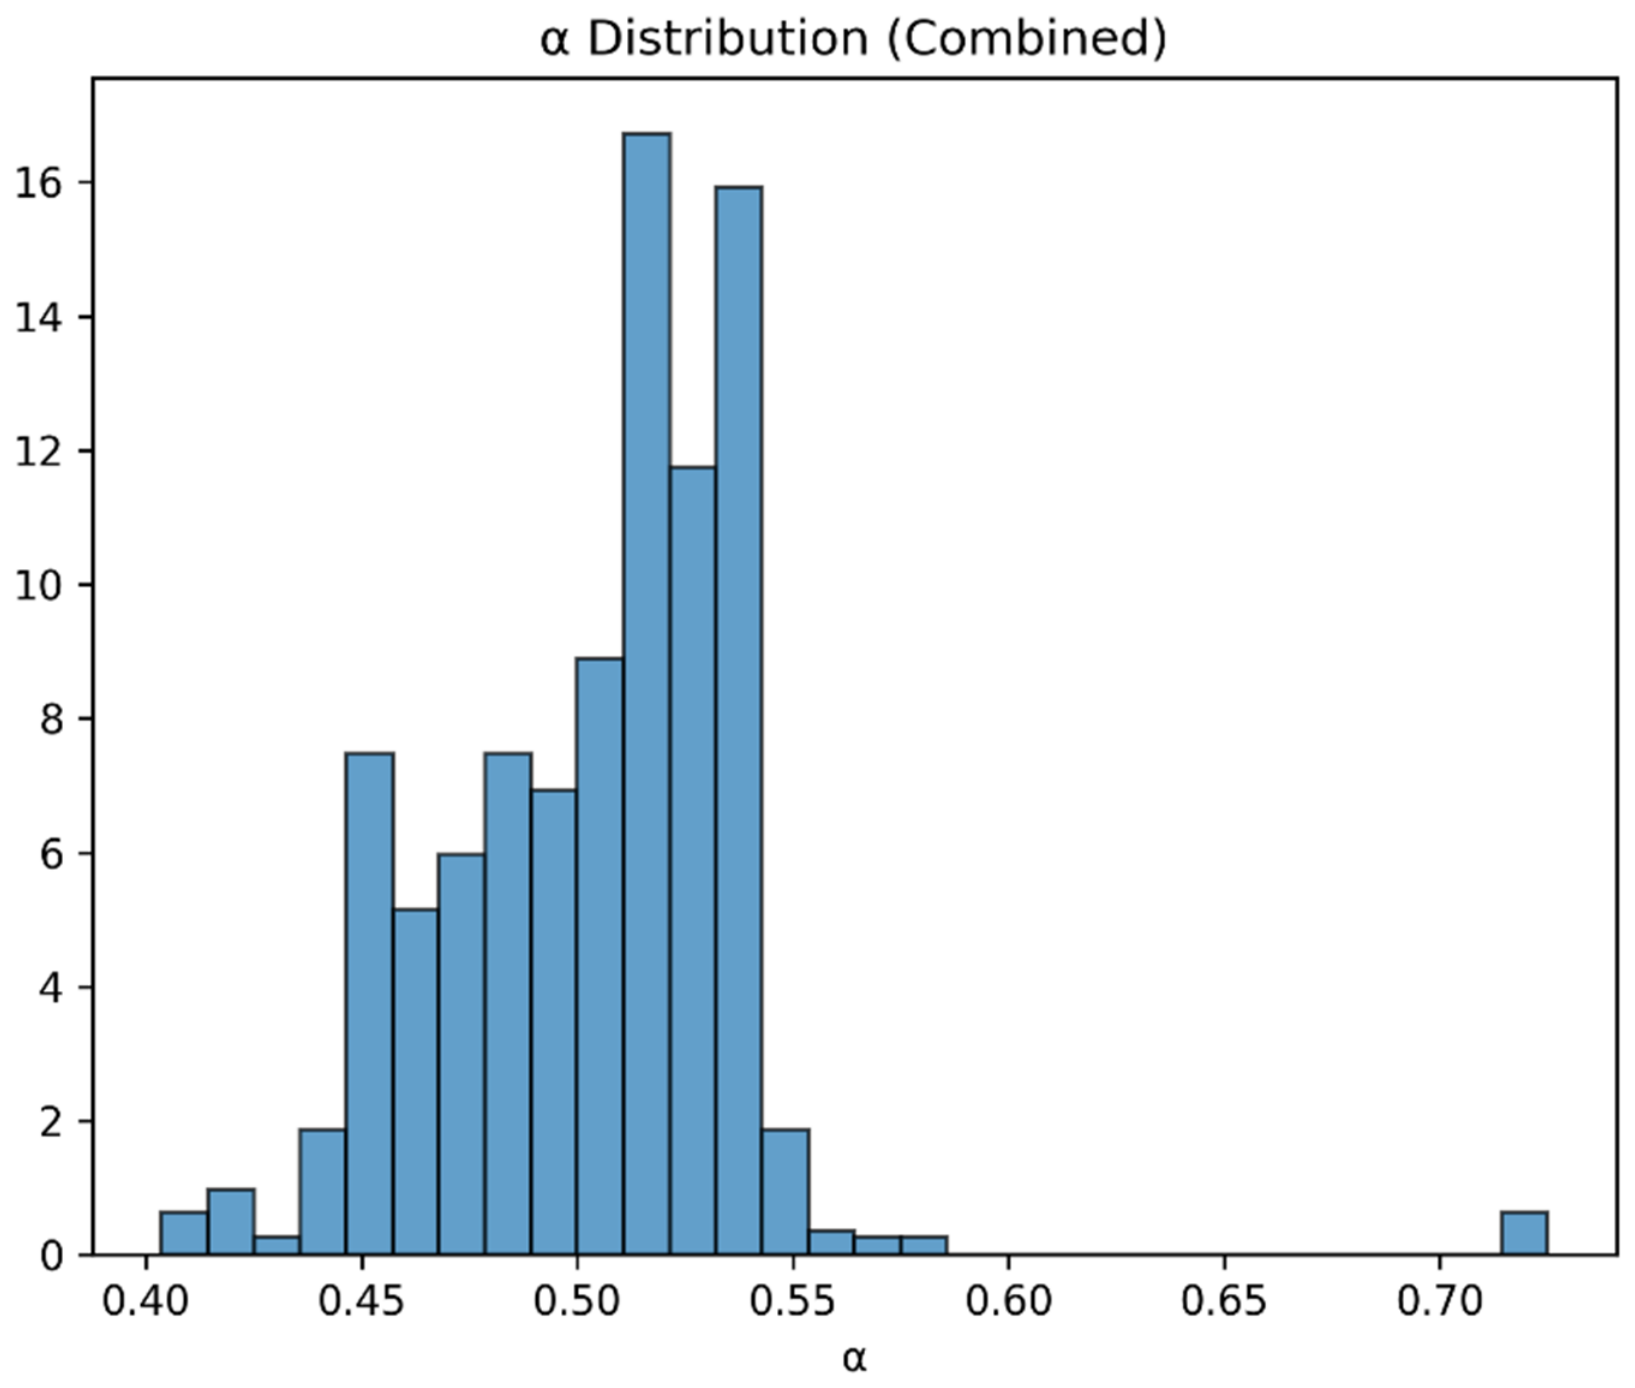
The trainable fusion weight α in DPINN plays a central role in balancing the Walker and Forman contributions. Figure 9 shows the histogram of α values predicted for samples in the external test set. The mean α is approximately 0.55 with a standard deviation of 0.12, indicating a slight overall preference for the Walker model but substantial sample-to-sample variation. This variation suggests that the network adaptively selects the more appropriate physical formula depending on the specific input conditions, rather than relying on a fixed global combination.
Figure 9.
Histogram of α values on the external test set.
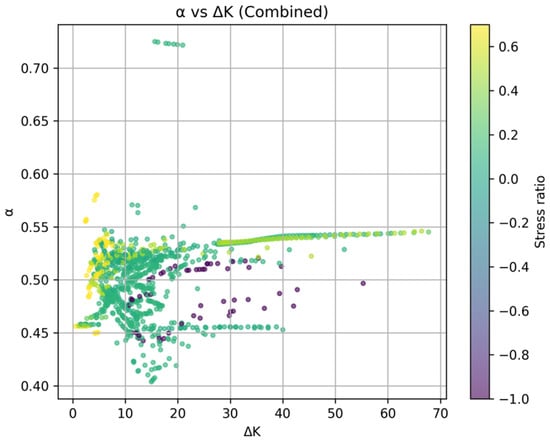
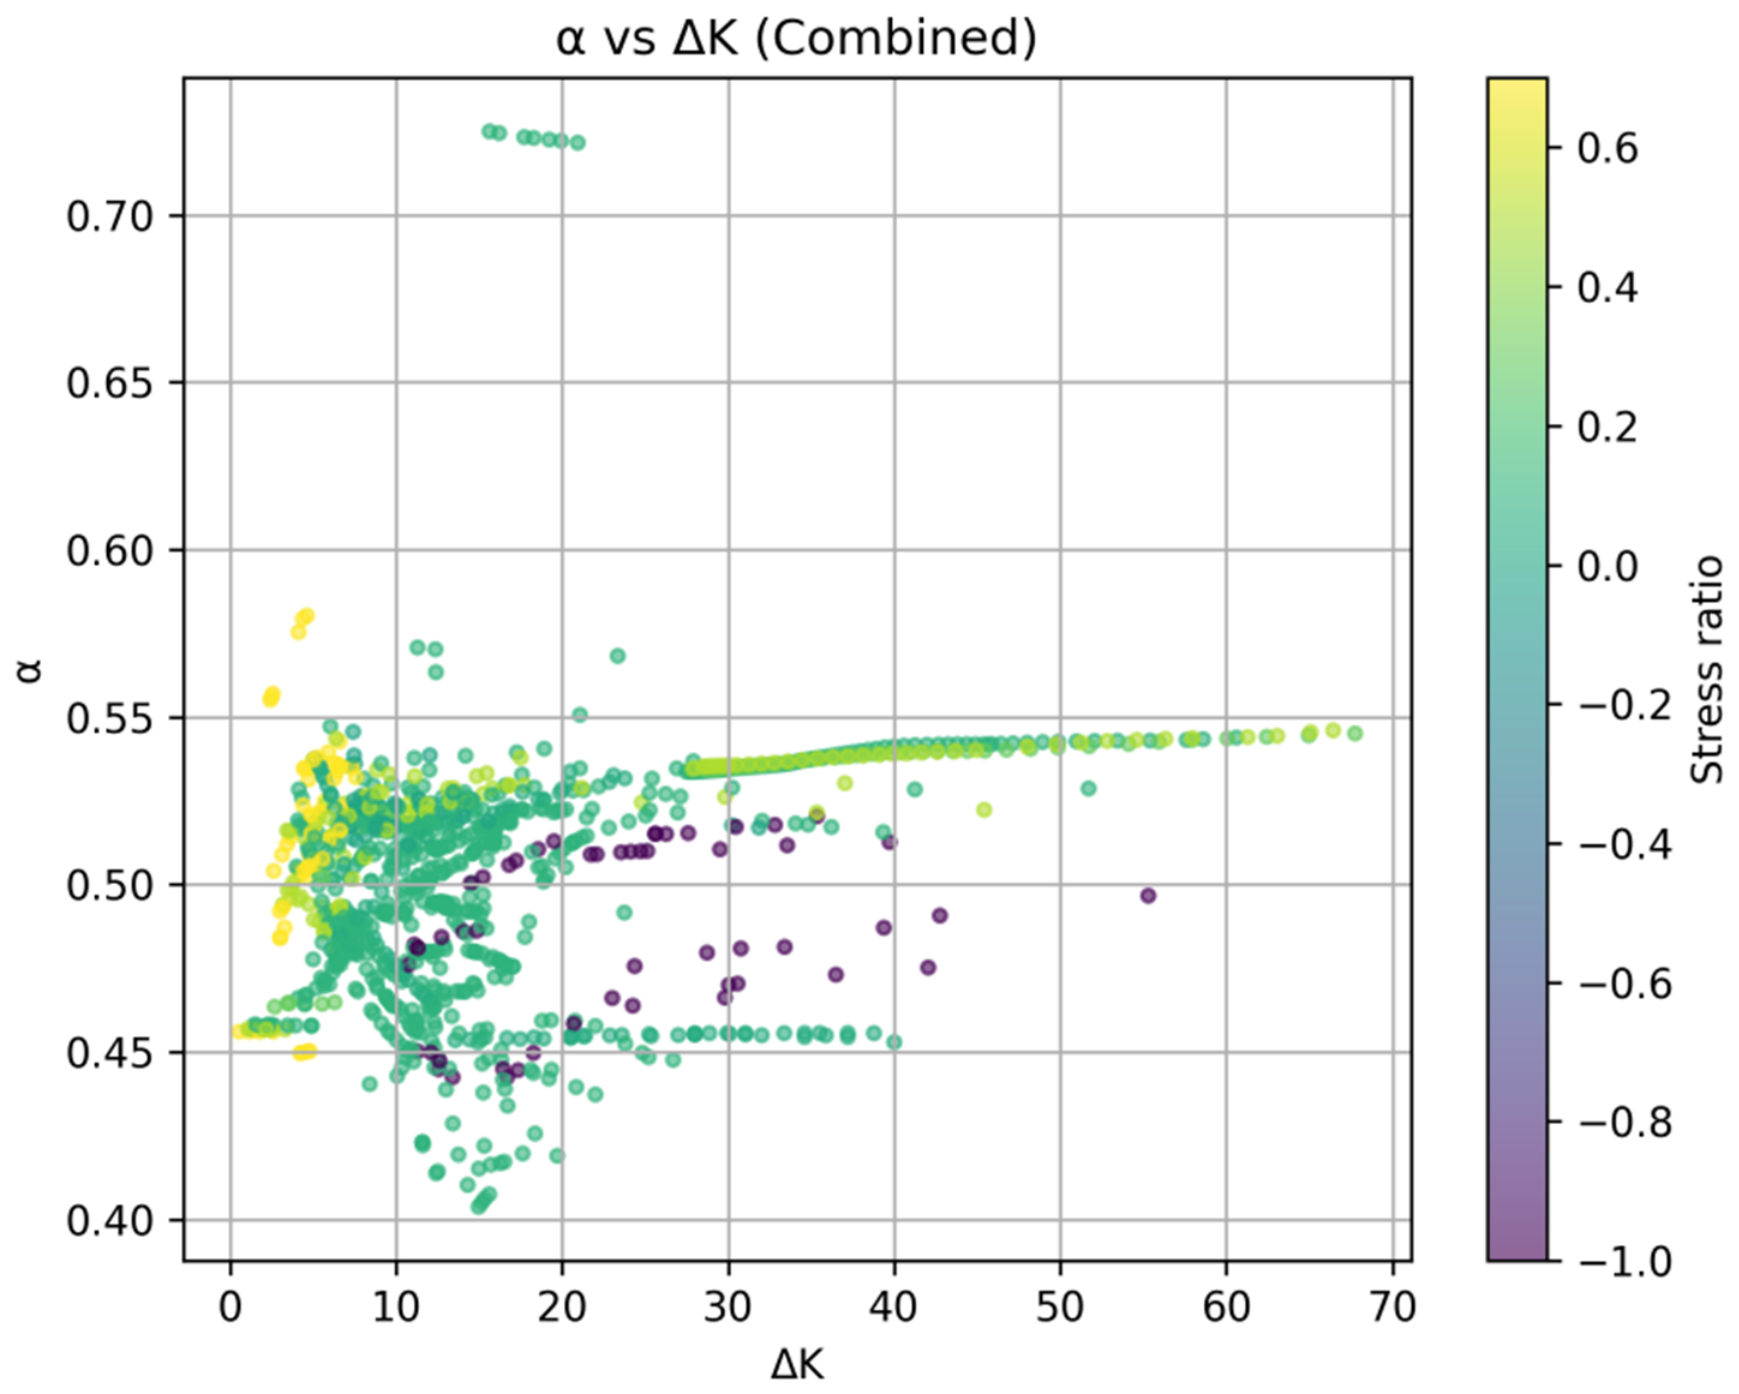
More importantly, the dependence of α on the mechanical driving force ΔK and stress ratio R is illustrated in the contour plot of Figure 10. The results reveal a clear monotonic trend: α tends to decrease as ΔK increases, meaning that the model assigns progressively greater weight to the Forman equation in the high-ΔK regime. This behavior is physically consistent with fracture mechanics theory and can be rigorously interpreted through the mathematical structure of Equation (4). In the low-to-moderate ΔK regime, the Walker term dominates (α close to unity) because Equation (1) provides an excellent log-linear description of stable crack propagation in Region II, where crack growth is governed primarily by cyclic plasticity at the crack tip. However, as ΔK increases and approaches the fracture-toughness-limited regime, the denominator in the Forman equation, i.e., the term , becomes progressively smaller. This term introduces a mathematical singularity as ΔK approaches , which physically captures the sharp acceleration of crack growth driven by the onset of static fracture modes (e.g., microvoid coalescence or intergranular decohesion) that superimpose on the fatigue damage. To reproduce this rapid upward curvature in the da/dN-ΔK curve, the network autonomously reduces α, thereby transferring greater predictive responsibility to the Forman contribution as expressed in Equation (3). Notably, the influence of the stress ratio R is also embedded in this transition: a higher R-ratio reduces the effective fracture toughness term , shifting the transition point to lower ΔK values—a trend that is qualitatively captured by the α contours in Figure 10.
Figure 10.
Contour plot of α as a function of ΔK and R.
This adaptive behavior confirms that the trainable fusion weight is not merely a data-driven interpolation coefficient but rather a physically interpretable mechanism that autonomously identifies the transition between two distinct crack growth regimes. It demonstrates that the DPINN effectively leverages the embedded physical knowledge to guide predictions in regions where pure data-driven extrapolation would otherwise fail, while simultaneously providing transparent insight into which physical law governs the prediction for a given input condition.
3.6. Feature Importance and Physical Interpretability (SHAP)
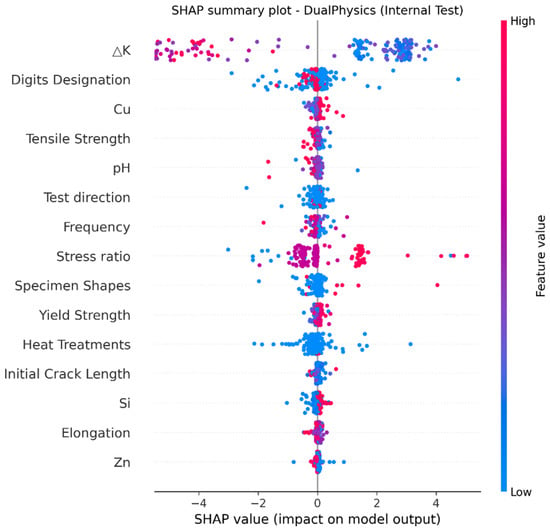
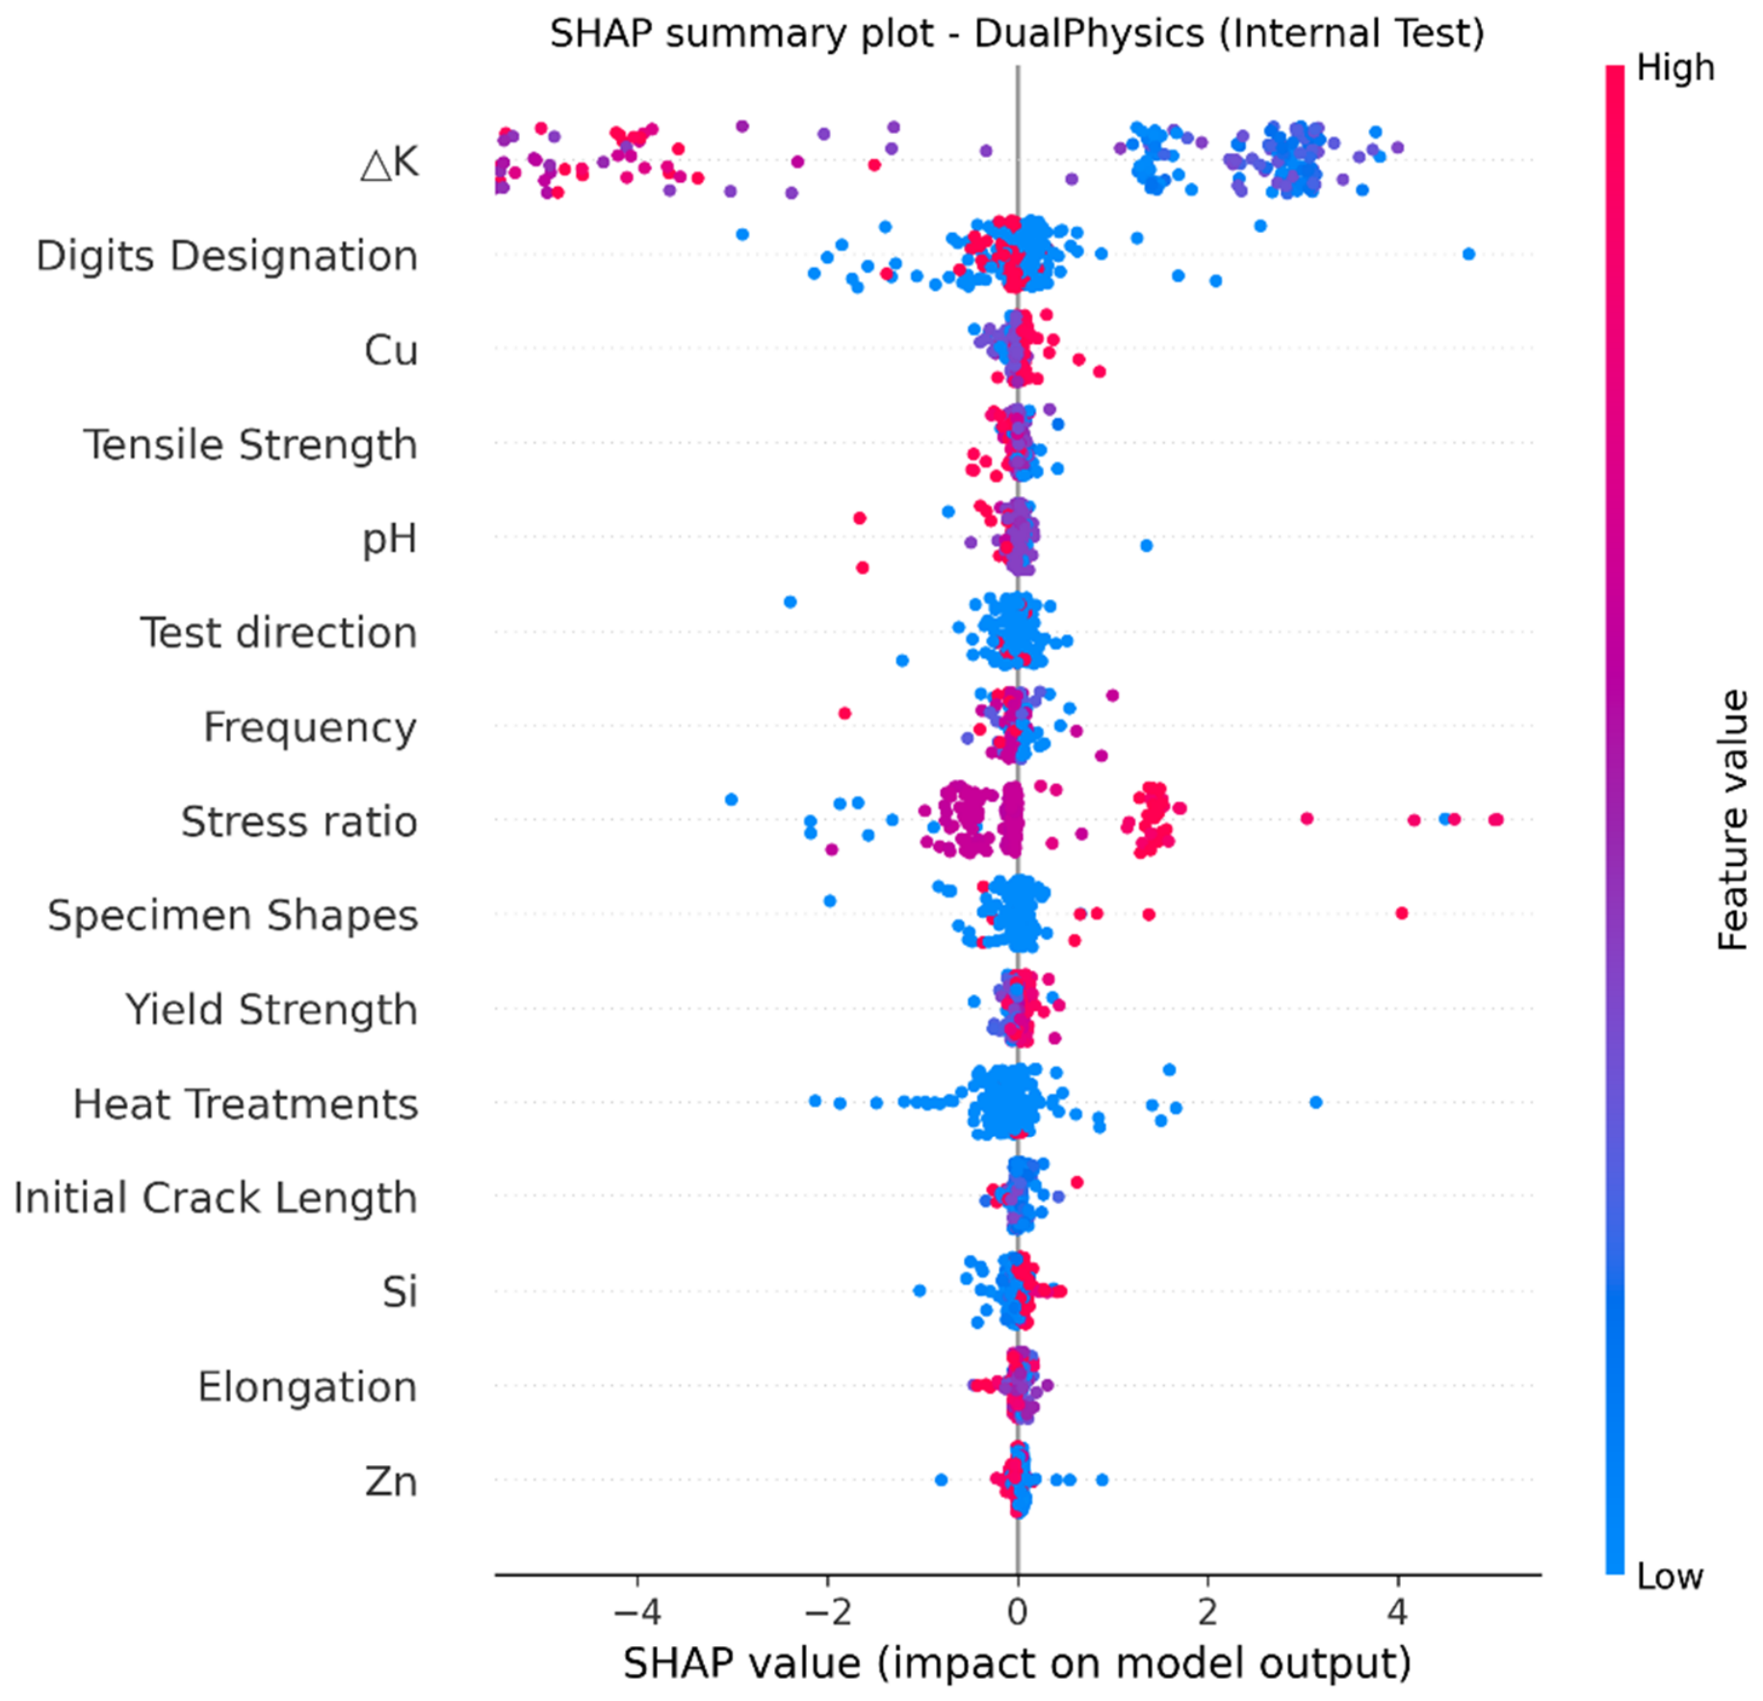
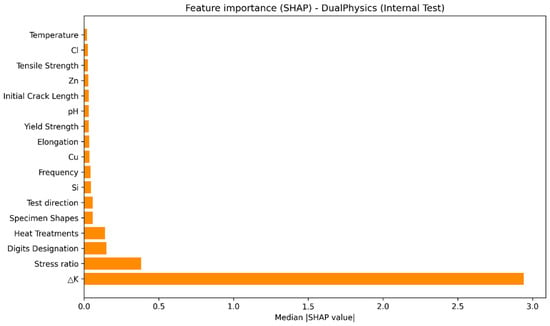
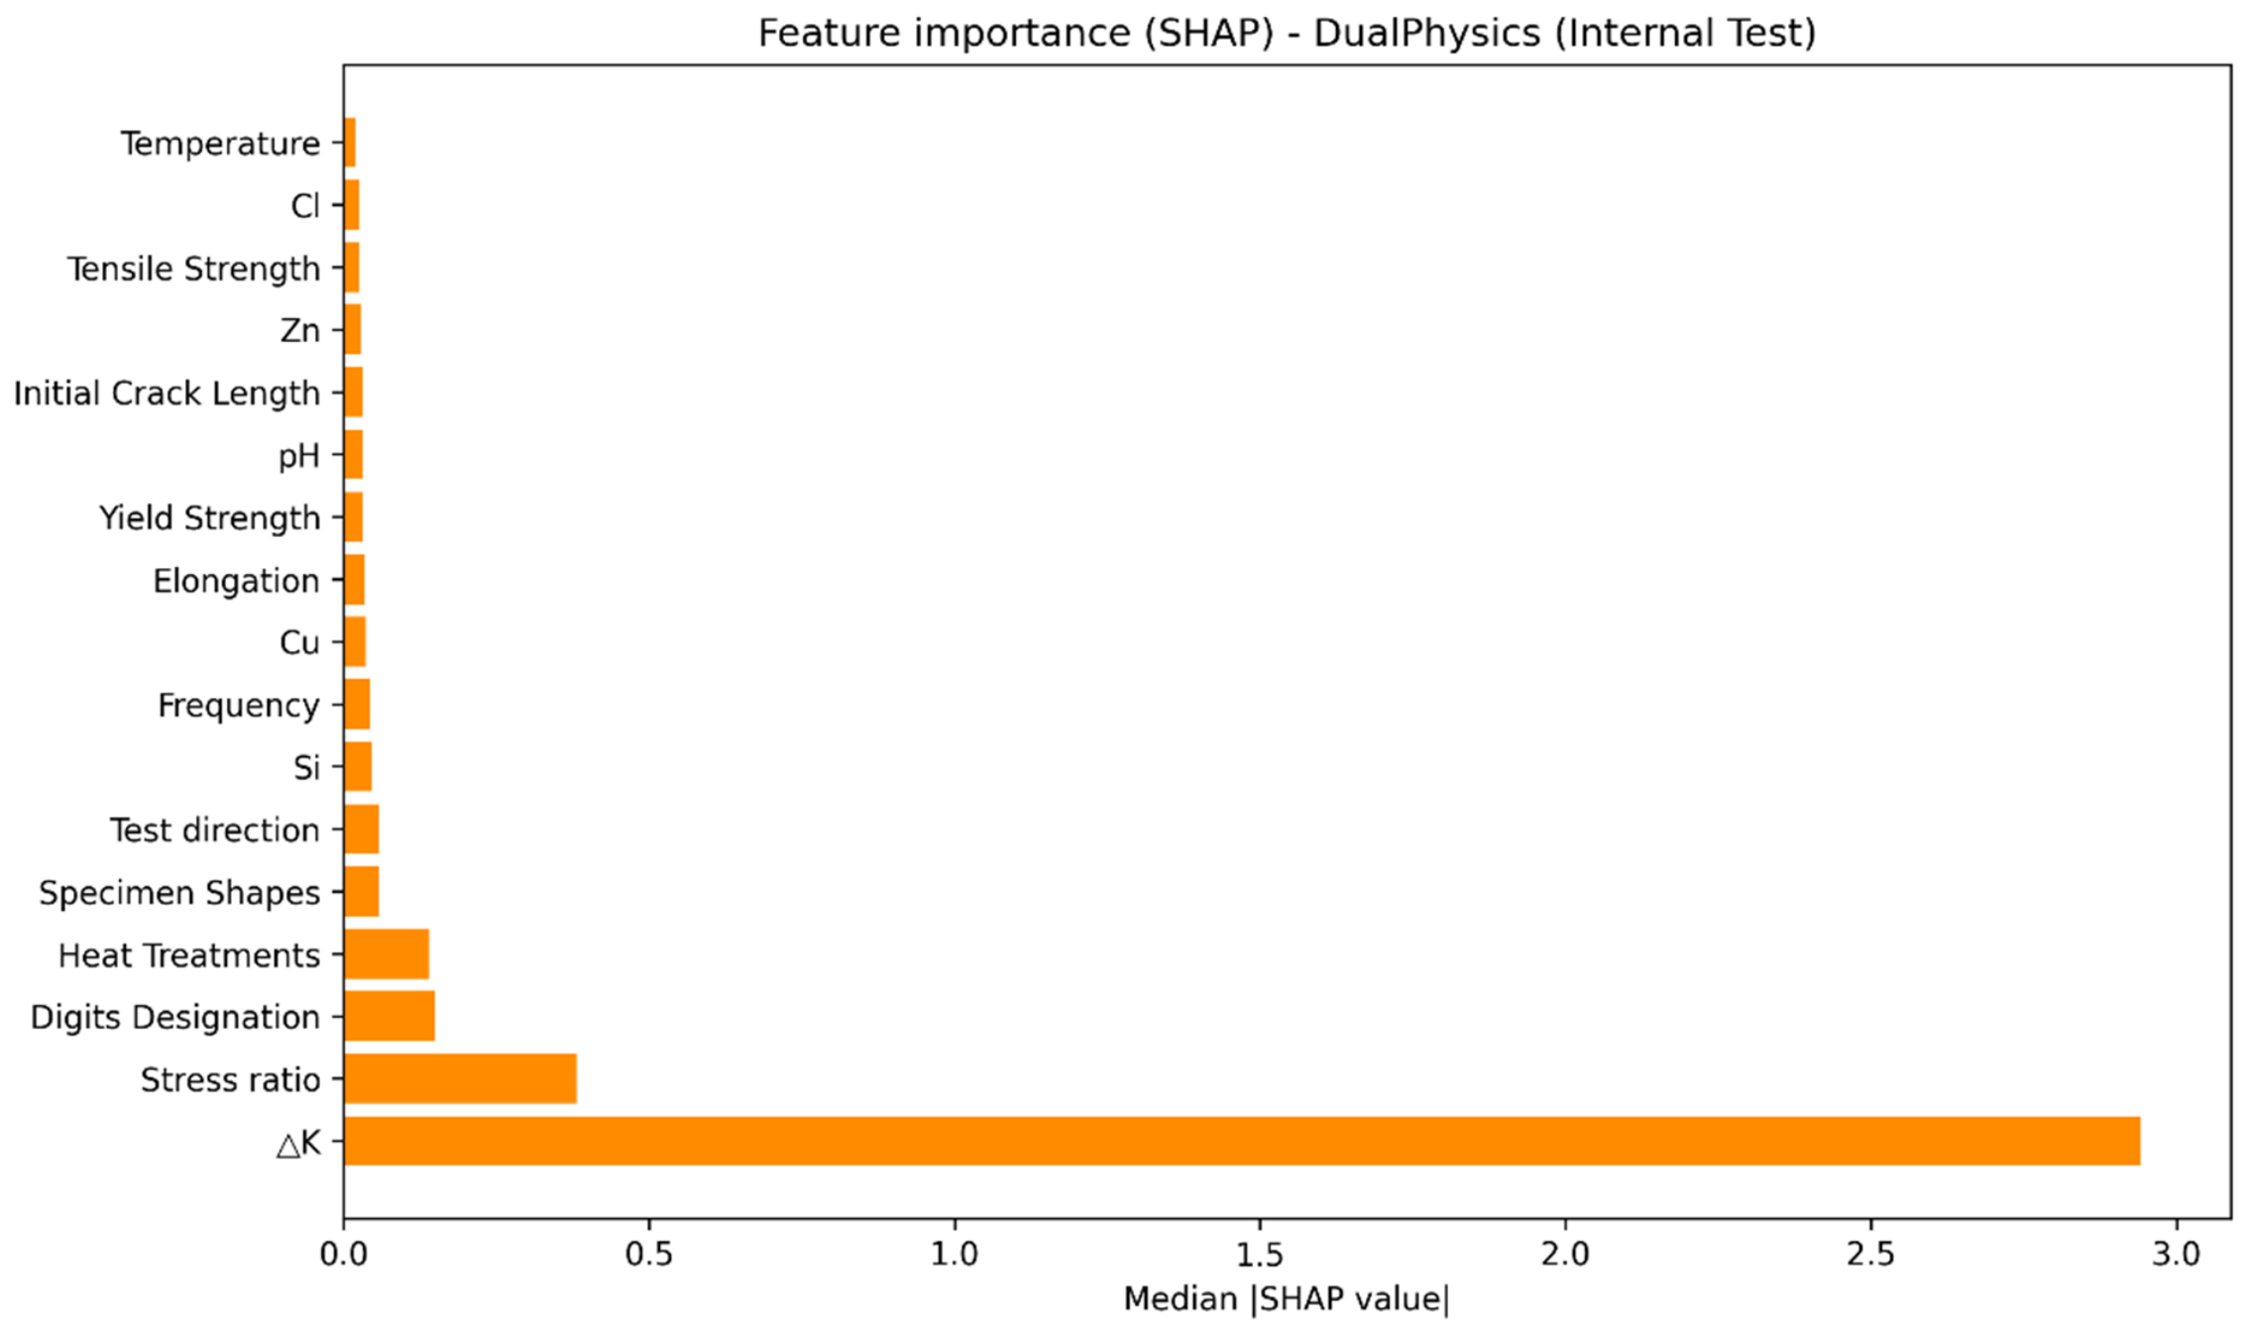
To elucidate the decision-making mechanism, SHAP analysis was performed on the combined validation set (N = 1050) comprising both internal and external samples. The SHAP summary plots are presented in Figure 11 and Figure 12. Figure 11 shows the distribution of SHAP values for each feature, with color indicating feature value. Figure 12 ranks features by their mean absolute SHAP values. Table 5 presents the SHAP feature importance ranking for the DPINN. To ensure robustness against outlier-driven extreme values, we report the median absolute SHAP value for ranking, rather than the mean. The median provides a more stable measure of central tendency when feature contributions are highly skewed, as is often the case with environmental variables that only become influential under extreme conditions.
Figure 11.
SHAP summary plot for DPINN.
Figure 12.
SHAP feature importance ranking.
Table 5.
SHAP feature importance ranking for DPINN on the combined validation set.
As shown in Table 5, ΔK ranks first (median |SHAP| ≈ 2.94), confirming the stress intensity factor range as the dominant mechanical driver. The stress ratio R ranks second, reflecting its critical role in modulating crack closure. Digits designation (alloy series) appears as the third most influential factor, acting as a proxy for intrinsic microstructural resistance. The high importance of “Digits Designation” (alloy series) reflects the fact that different alloy families—such as 2xxx (Al-Cu-Mg) and 7xxx (Al-Zn-Mg-Cu)—represent distinct microstructural states determined by their principal alloying elements and aging treatments. In 2xxx series alloys, precipitation of θ′ (Al2Cu) and S′ (Al2CuMg) phases governs the slip characteristics and corrosion susceptibility, while in 7xxx series, η′ (MgZn2) precipitates play the dominant role [34,35]. The addition of trace elements such as Sc can further refine the grain structure and alter the precipitation kinetics, leading to improved strength and corrosion resistance [34,35,36]. These microstructural differences directly influence crack initiation sites, propagation paths (transgranular vs. intergranular), and the intrinsic Paris-regime coefficients—thereby making alloy designation a critical proxy for the material’s resistance to corrosion fatigue. The SHAP analysis thus quantitatively confirms that the model leverages this microstructurally relevant information when making predictions, rather than relying on spurious correlations.
Environmental variables (pH, Cl−, temperature) show lower median importance, suggesting that within the tested ΔK regime, mechanical and material-intrinsic factors outweigh direct corrosion-acceleration effects.
Interestingly, for features such as tensile strength and temperature, the mean SHAP rank is substantially higher (i.e., smaller rank number) than the median rank (negative rank shift). This discrepancy indicates that these variables exert a strong influence only under certain extreme conditions, while having little effect on the majority of samples. This behavior highlights the model’s ability to capture non-linear, outlier-driven responses without overfitting to the bulk of the distribution.
Overall, the SHAP analysis confirms that the DPINN makes predictions based on physically meaningful features, with ΔK and stress ratio as the primary drivers, and that the dual-physics fusion does not introduce spurious correlations.
4. Conclusions
In this paper, we proposed a dual-physics-informed neural network (DPINN) that fuses Walker and Forman crack growth models via a learnable adaptive weight α. The model was trained and validated on a large dataset of aluminum alloy corrosion fatigue crack growth, with rigorous evaluation on both an internal test set and an independent external test set representing a realistic distribution shift. To assess practical deployment capability, we designed an incremental learning scenario using only a fixed 10% subset of the original training data. The main conclusions are:
- Rapid and data-efficient adaptation. Without any adaptation, all models fail catastrophically on the shifted distribution (R2 < 0 for physics-based models). However, with only 10% of the external data added to the fixed 10% original subset, DPINN already achieves R2 = 0.817 on the remaining unseen external samples. At the 40% incremental stage, DPINN crosses the high engineering reliability threshold (R2 > 0.90), reaching R2 = 0.924. After fine-tuning with 60% of the external data, DPINN stabilizes at R2 = 0.944, MSE = 0.0030, MRE = 0.86%, significantly outperforming Walker-PINN (R2 = 0.877) and GBR (R2 = 0.794). This demonstrates that DPINN can recover from severe distribution shift with a small fraction of new data;
- Physically consistent interpretability. The adaptive fusion weight α exhibits a monotonic decrease with increasing ΔK, giving more weight to the Forman model near fracture, which aligns with fracture mechanics theory. SHAP analysis confirms that ΔK and stress ratio are the dominant drivers, while alloy designation serves as a proxy for microstructural resistance. Explicit regularization of α (toward 0.5) is crucial for stability and generalization;
- Stable learning without catastrophic forgetting. Throughout the incremental steps, internal test performance remains stable (R2 > 0.95), indicating that DPINN retains knowledge of the original distribution while adapting to the new one (low forgetting rate);
- Practical value for structural health monitoring. The ability to achieve R2 > 0.94 after fine-tuning with only 60% of new data (and crossing R2 > 0.90 with only 40%) makes DPINN a deployment-ready tool for digital twin frameworks, where models must continuously assimilate sparse field data.
The current model is validated on aluminum alloys under constant-amplitude and constant-ΔK loading in neutral NaCl environments; future work will extend the framework to other alloy systems, variable amplitude loading spectra, and more diverse environmental conditions to broaden its practical applicability.
Author Contributions
Conceptualization: Y.Z. and H.W.; Methodology: Y.Z. and L.Y.; Software: X.F. and D.Z.; Validation: X.F., D.Z., and Z.W.; Formal analysis: L.Y. and Z.W.; Investigation: D.Z. and X.F.; Resources: H.W.; Data curation: Z.W. and D.Z.; Writing—original draft preparation: X.F. and Z.W.; Writing—review and editing: Y.Z. and L.Y.; Visualization: D.Z.; Supervision: L.Y. and H.W.; Project administration: Y.Z.; Funding acquisition: H.W. All authors have read and agreed to the published version of the manuscript.
Funding
This work was supported by the Advanced Materials-National Science and Technology Major Project (Grant No. 2025ZD0618902) and the Opening Project Fund of Materials Service Safety Assessment Facilities (MSAF-2023-005).
Data Availability Statement
The data presented in this study are available on request from the corresponding author.
Conflicts of Interest
The authors declare no conflicts of interest.
References
- Li, S.S.; Yue, X.; Li, Q.Y.; Peng, H.; Dong, B.; Liu, T.; Yang, H.; Fan, J.; Shu, S.; Qiu, F.; et al. Development and applications of aluminum alloys for aerospace industry. J. Mater. Res. Technol. 2023, 27, 944–983. [Google Scholar] [CrossRef] [Scilit]
- Georgantzia, E.; Gkantou, M.; Kamaris, G.S. Aluminium alloys as structural material: A review of research. Eng. Struct. 2021, 227, 111372. [Google Scholar] [CrossRef] [Scilit]
- Alexopoulos, N.; Papanikos, P. Experimental and theoretical studies of corrosion-induced mechanical properties degradation of aircraft 2024 aluminum alloy. Mater. Sci. Eng. A 2008, 498, 248–257. [Google Scholar] [CrossRef] [Scilit]
- Zhou, X.; He, S.; Dong, L.; Atluri, S.N. Real-time prediction of probabilistic crack growth with a helicopter component digital twin. Aiaa J. 2022, 60, 2555–2567. [Google Scholar] [CrossRef] [Scilit]
- Sun, H.; Liao, Z.; Hu, Z.; Wang, G.; Ruan, X.; Wang, X.; Lu, J. DA-DONN: A data-augmented and dual-optimized neural network method for fatigue crack growth rate prediction. Theor. Appl. Fract. Mech. 2025, 141, 105256. [Google Scholar] [CrossRef] [Scilit]
- Huang, T.; Li, X.; Zhang, Y.; Yao, L.; Zhang, T. Multifactorial prediction of corrosion fatigue crack growth in aluminum alloys using physics-informed neural networks. Eng. Fail. Anal. 2025, 174, 109521. [Google Scholar] [CrossRef] [Scilit]
- Paris, P.; Erdogan, F. A critical analysis of crack propagation laws. J. Basic Eng. 1963, 85, 528–533. [Google Scholar] [CrossRef] [Scilit]
- Walker, K. The Effect of Stress Ratio During Crack Propagation and Fatigue for 2024-T3 and 7075-T6 Aluminum; ASTM Special Technical Publication: West Conshohocken, PA, USA, 1970; Volume 462, pp. 1–14. [Google Scholar]
- Forman, R.G.; Kearney, V.E.; Engle, R.M. Numerical analysis of crack propagation in cyclic-loaded structures. J. Basic Eng. 1967, 89, 459–464. [Google Scholar] [CrossRef] [Scilit]
- Prawoto, Y.; Moin, A.; Tadjuddin, M.; Nik, W.W. Effect of microstructures on SCC of steel: Field failure analysis case study and laboratory test result. Eng. Fail. Anal. 2011, 18, 1858–1866. [Google Scholar] [CrossRef] [Scilit]
- Taylor, C. Corrosion informatics: An integrated approach to modelling corrosion. Corros. Eng. Sci. Technol. 2015, 50, 490–508. [Google Scholar] [CrossRef] [Scilit]
- Konda, N.; Verma, R.; Jayaganthan, R. Machine learning based predictions of fatigue crack growth rate of additively manufactured Ti6Al4V. Metals 2021, 12, 50. [Google Scholar] [CrossRef] [Scilit]
- Choi, D.-K. Data-driven materials modeling with XGBoost algorithm and statistical inference analysis for prediction of fatigue strength of steels. Int. J. Precis. Eng. Manuf. 2019, 20, 129–138. [Google Scholar] [CrossRef] [Scilit]
- Song, H.; Liu, J.; Zhang, H.; Du, J. Multi-source data driven fatigue failure analysis and life prediction of pre-corroded aluminum–lithium alloy 2050-T8. Eng. Fract. Mech. 2023, 292, 109626. [Google Scholar] [CrossRef] [Scilit]
- Chen, T.; Guestrin, C. Xgboost: A scalable tree boosting system. In Proceedings of the 22nd ACM SIGKDD International Conference on Knowledge Discovery and Data Mining, F, San Francisco, CA, USA, 13–17 August 2016; pp. 785–794. [Google Scholar]
- Peng, Y.; Zhang, Y.; Zhang, L.; Yao, L.; Guo, X. Prediction of corrosion fatigue crack growth rate in aluminum alloys based on incremental learning strategy. Int. J. Fatigue 2024, 187, 108481. [Google Scholar] [CrossRef] [Scilit]
- Dourado, A.; Viana, F.A. Physics-informed neural networks for corrosion-fatigue prognosis. In Proceedings of the Annual Conference of the PHM Society, Scottsdale, AZ, USA, 23–26 September 2019; Volume 11. [Google Scholar]
- Chen, D.; Li, Y.; Liu, K.; Li, Y. A physics-informed neural network approach to fatigue life prediction using small quantity of samples. Int. J. Fatigue 2023, 166, 107270. [Google Scholar] [CrossRef] [Scilit]
- Peng, Y.; Zhang, Y.; Zhang, L.; Yao, L.; Tong, X.; Guo, X. Dynamic prediction of aluminum alloy fatigue crack growth rate based on class incremental learning and multi-dimensional variational autoencoder. Eng. Fract. Mech. 2025, 314, 110721. [Google Scholar] [CrossRef] [Scilit]
- Li, K.; DeCost, B.; Choudhary, K.; Greenwood, M.; Hattrick-Simpers, J. A critical examination of robustness and generalizability of machine learning prediction of materials properties. npj Comput. Mater. 2023, 9, 55. [Google Scholar] [CrossRef] [Scilit]
- Li, X.; Zhang, Y.; Yao, L.; Tong, X. Research on the prediction method of corrosion fatigue crack extension rate of aluminum alloy based on BB-GBRT algorithm. Theor. Appl. Fract. Mech. 2025, 136, 104807. [Google Scholar] [CrossRef] [Scilit]
- Chang, H.; Han, E.; Wang, J.; Ke, W. Acoustic emission study of corrosion fatigue crack propagation mechanism for LY12CZ and 7075-T6 aluminum alloys. J. Mater. Sci. 2005, 40, 5669–5674. [Google Scholar] [CrossRef] [Scilit]
- Jogi, B.; Brahmankar, P.; Nanda, V.; Prasad, R. Some studies on fatigue crack growth rate of aluminum alloy 6061. J. Mater. Process. Technol. 2008, 201, 380–384. [Google Scholar] [CrossRef] [Scilit]
- Menan, F.; Henaff, G. Influence of frequency and exposure to a saline solution on the corrosion fatigue crack growth behavior of the aluminum alloy 2024. Int. J. Fatigue 2009, 31, 1684–1695. [Google Scholar] [CrossRef] [Scilit]
- Meng, X.; Lin, Z.; Wang, F. Investigation on corrosion fatigue crack growth rate in 7075 aluminum alloy. Mater. Des. 2013, 51, 683–687. [Google Scholar] [CrossRef] [Scilit]
- Idrus, H.; Afendi, M.; Chun Hoe, W. Fatigue crack initiation and growth of aluminum alloy with stress ratio effects. Key Eng. Mater. 2014, 594, 1105–1111. [Google Scholar] [CrossRef] [Scilit]
- Liu, M.; Zhang, K.; Dai, S.L.; Li, G.A.; Hao, M.; Na Yi, L. Effect of environment on fatigue crack propagation behavior of an Al-Cu-Mg Aluminum alloy. Adv. Mater. Res. 2014, 1004, 142–147. [Google Scholar] [CrossRef] [Scilit]
- Newman, J., Jr.; Anagnostou, E.; Rusk, D. Fatigue and crack-growth analyses on 7075-T651 aluminum alloy coupons under constant-and variable-amplitude loading. Int. J. Fatigue 2014, 62, 133–143. [Google Scholar] [CrossRef] [Scilit]
- Yarullin, R.; Ishtyryakov, I. Fatigue surface crack growth in aluminum alloys under different temperatures. Procedia Eng. 2016, 160, 199–206. [Google Scholar] [CrossRef] [Scilit]
- Cavalcante, T.R.F.; Pereira, G.S.; Koga, G.Y.; Bolfarini, C.; Filho, W.B.; Avila, J. Fatigue crack propagation of aeronautic AA7050-T7451 and AA2050-T84 aluminum alloys in air and saline environments. Int. J. Fatigue 2022, 154, 106519. [Google Scholar] [CrossRef] [Scilit]
- GB/T 20120.2-2006; Metallic Materials—Fatigue Testing—Part 2: Fatigue Crack Growth Method. Standardization Administration of China: Beijing, China, 2006.
- Liu, L.; Jiang, H.; He, P.; Chen, W.; Liu, X.; Gao, J.; Han, J. On the variance of the adaptive learning rate and beyond. arXiv 2019, arXiv:1908.03265. [Google Scholar]
- Smith, L.N. A disciplined approach to neural network hyper-parameters: Part 1--learning rate, batch size, momentum, and weight decay. arXiv 2018, arXiv:1803.09820. [Google Scholar]
- Temiz, C.; Yilmaz, F.; Kolemen, U. Investigation of microstructures and mechanical properties of Sc doped Al-5Cu alloys. J. Fac. Eng. Archit. Gazi Univ. 2022, 37, 75–88. [Google Scholar]
- Temiz, C.; Yılmaz, F.; Çağlar, S.; Kölemen, U.; Uzun, O. Influence of Sc addition and rapid solidification on the microstructure and mechanical properties of Al-5Cu alloys. Phys. Scr. 2025, 100, 095925. [Google Scholar] [CrossRef] [Scilit]
- Çağlar, S.; Temiz, C. Al-5Cu-0.3Sc-B4C Nanocomposites: Microstructural Refinement, Strengthening Mechanisms, and Corrosion Behavior. Nanomaterials 2025, 15, 1836. [Google Scholar] [CrossRef] [Scilit]

Disclaimer/Publisher’s Note: The statements, opinions and data contained in all publications are solely those of the individual author(s) and contributor(s) and not of MDPI and/or the editor(s). MDPI and/or the editor(s) disclaim responsibility for any injury to people or property resulting from any ideas, methods, instructions or products referred to in the content. |
© 2026 by the authors. Licensee MDPI, Basel, Switzerland. This article is an open access article distributed under the terms and conditions of the Creative Commons Attribution (CC BY) license.