


Abstract
Laser powder bed fusion (LPBF) enables the fabrication of geometrically complex metallic components, but sharp-edged features remain susceptible to localized heat accumulation because bidirectional meander scanning produces progressively shortened scanning vectors near acute apices. The resulting imbalance between repeated energy input and limited heat dissipation destabilizes melt-pool behavior and degrades surface integrity, densification and microstructural uniformity. In this study, a geometry-informed active energy modulation strategy was proposed for LPBF of Inconel 718 sharp-edged components. A dimensionless Power Reduction Factor (PRF) was formulated to couple laser power attenuation with scan-vector shortening. Coupled DEM–CFD simulations showed that power reduction in heat-accumulation-prone regions decreased peak temperature and suppressed excessive melt-pool expansion caused by adjacent-track thermal history. In situ coaxial photodiode monitoring revealed that apical heat accumulation intensified with i build height under insufficient power reduction, whereas increasing the PRF reduced the overheated zone. Among the tested conditions, PRF = 0.3 provided the most favorable balance between overheating and energy deficiency, minimizing apical surface roughness and maintaining a relatively uniform microhardness distribution above 290 HV0.1. Lower PRF values resulted in swelling and hardness degradation, while higher PRF values promoted track instability and lack-of-fusion defects. Microstructural characterization revealed a persistent intra-track hierarchy in a cellular dendritic scale, while location-dependent PDAS variations along the sharp-edged region were comparatively modest. The observed trends indicate that spatially graded power attenuation modifies local cellular-scale heterogeneity. These results demonstrate that PRF-based modulation provides a quantitative route for mitigating scan-vector-shortening-induced heat accumulation in sharp-edged geometries without additional cooling delays.
1. Introduction
Laser powder bed fusion (LPBF) has become an enabling route for manufacturing high-performance metallic components with complex geometries, owing to its layer-wise geometric flexibility and high material utilization [1,2]. Among printable nickel-based superalloys, Inconel 718 is particularly attractive for aerospace, aviation and energy applications because of its favorable processability and reliable mechanical performance under demanding service conditions [2,3]. However, the geometric freedom offered by LPBF also introduces spatially non-uniform thermal histories when local features become thin, sharp, or highly confined. In such geometry-sensitive regions, the key challenge is not only to achieve full densification within a nominal processing window, but also to maintain consistent melt-pool behavior, solidification microstructure and mechanical response across the entire component [4,5].
This issue becomes particularly pronounced in sharp-edged geometries processed by bidirectional meander scanning. As the laser approaches an acute apex, the scanning vectors are progressively shortened, which reduces the temporal interval available for heat dissipation between neighboring tracks. The resulting mismatch between continuous energy input and limited local heat removal promotes cumulative heat accumulation and drives the melt pool away from its stable processing state [6,7,8]. When the local thermal input exceeds the dissipation capacity of the surrounding material, the melt pool may undergo excessive enlargement, overmelting and surface swelling, accompanied by powder spatter, pore formation and rough track morphologies [9,10,11,12,13]. In addition to these surface and densification defects, the altered thermal gradients and cooling rates can further modify cellular solidification structures and local hardness, thereby undermining microstructural and mechanical homogeneity within the same component [3,7].
Considerable efforts have therefore been devoted to regulating LPBF thermal history through scan-path design and temporal control. Scan-vector arrangement, hatch organization, rotation angle and scanning sequence have been shown to influence residual stress, porosity, microstructure and crystallographic texture in LPBF parts [14,15,16,17]. For geometries containing short scan lines, non-laser delay paths and thermally optimized scan sequences can extend the local cooling interval and reduce overheating-induced surface deterioration [7,18,19]. Analytical, numerical and experimental studies have further confirmed that scan-path geometry, scanning length and layer-wise time strongly affect the transient temperature field, melt-track morphology and heat accumulation behavior [20,21,22]. Although these approaches improve thermal uniformity by redistributing or extending local cooling time, they usually rely on more complex path planning or additional temporal compensation. More importantly, they do not directly regulate the laser energy input according to the progressively shortened vector length at a sharp apex, leaving the geometry-induced thermal imbalance only indirectly addressed.
A more direct route for mitigating heat accumulation is to regulate the laser energy input itself. Analytical studies have shown that heat accumulation in laser-based additive manufacturing is strongly governed by the balance between repeated energy deposition and heat dissipation, indicating the importance of laser power as a controllable variable [23]. Accordingly, feedforward and feedback control strategies have been developed to tailor LPBF thermal history by adjusting process parameters before or during fabrication, including model-driven parameter optimization, online melt-pool temperature control and layer-wise correction for feature-dependent overheating [24,25,26]. Closed-loop laser-power control and layer-to-layer feedback have also been implemented to stabilize melt-pool behavior and interlayer temperature during LPBF [27,28,29]. In parallel, in situ pyrometry, infrared radiation, photodiode and acoustic signals have been exploited to correlate process signatures with melt-pool geometry, microstructural features, parameter optimization and overheating-related defect detection [30,31,32,33]. Despite these advances, most existing variable-power strategies are designed for global thermal-history stabilization, overhang correction, or defect detection rather than for the specific thermal imbalance caused by progressively shortened scanning vectors in sharp corners. Consequently, the way in which a prescribed spatial gradient of laser-power reduction affects surface formation, cellular-scale heterogeneity, and local mechanical uniformity within the same component remains insufficiently clarified.
2. Numerical Feasibility Assessment of Active Energy Modulation
2.1. DEM–CFD Model for Adjacent-Track Thermal Interaction
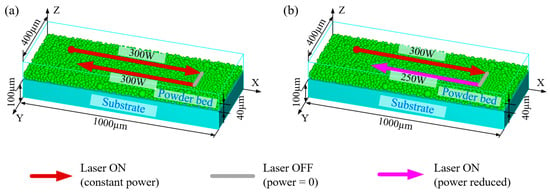
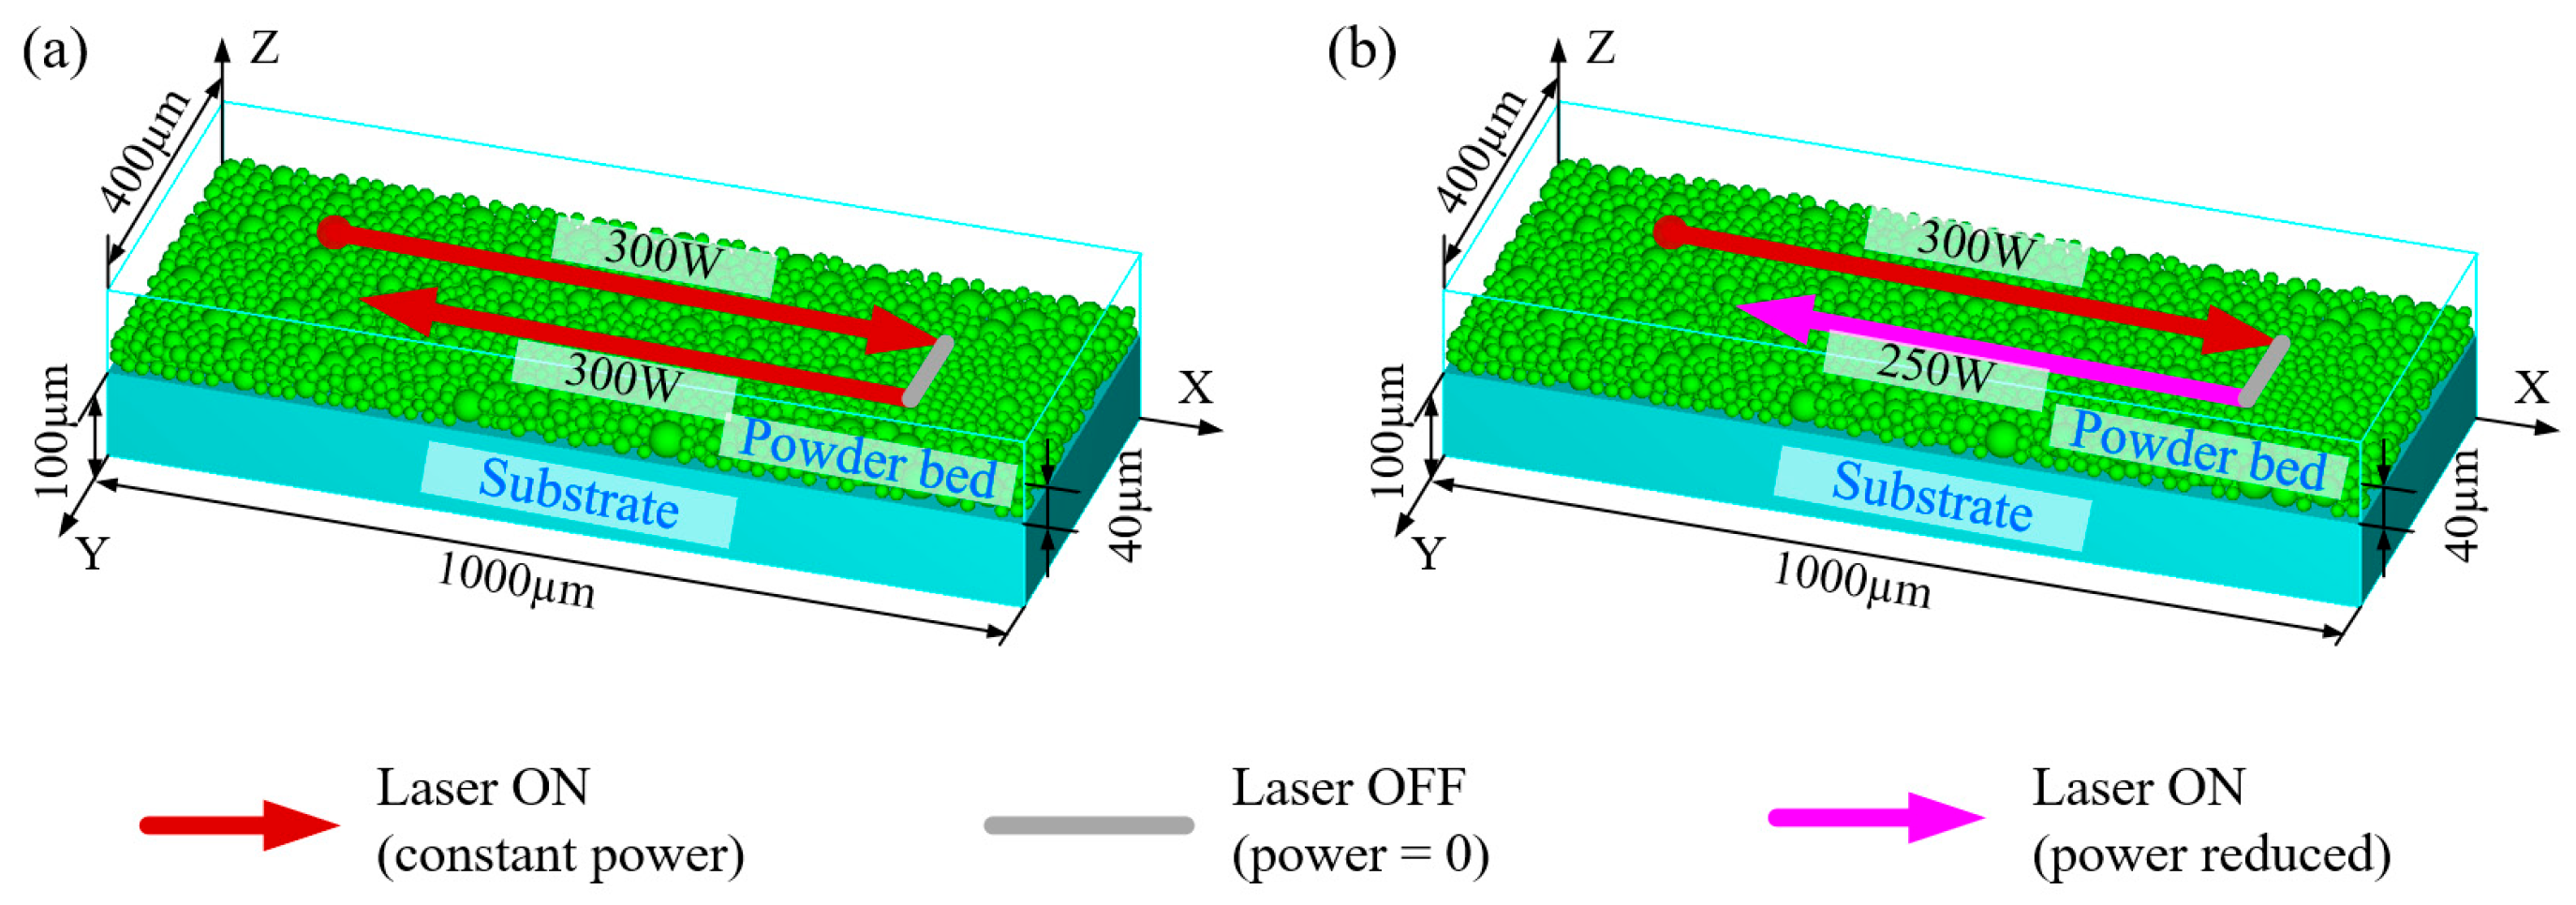
To fundamentally evaluate the feasibility of the active energy modulation strategy in mitigating localized heat accumulation, a coupled Discrete Element Method (DEM) and Computational Fluid Dynamics (CFD) model was established to simulate the transient temperature distribution and melt pool dynamics during the LPBF process. The solid substrate and single-layer powder bed were virtually reconstructed using the DEM simulation software EDEM (v2021), with a defined computational domain of 1000 μm × 400 μm × 200 μm, as illustrated in Figure 1. To account for the discrete characteristics of the powder bed, spherical Inconel 718 powder particles were generated according to the measured particle-size distribution, with a nominal particle-size range of 10–53 μm. The corresponding characteristic particle diameters were D10 = 17.5 um, D50 = 30.8 um, and D90 = 53.5 um, respectively. After gravitational deposition and stabilization, the volumetric packing fraction of the reconstructed powder bed was calculated as the ratio of the total solid volume of the deposited particles to the nominal powder-bed volume, and the obtained value was 43.12%. The resulting particle-resolved powder-bed geometry, including the actual particle arrangement and inter-particle voids, was then transferred into the CFD model for subsequent melting and solidification simulation.
Figure 1.
Schematic of the multiphysics thermal simulation: (a) control group utilizing constant laser power for both consecutive tracks; (b) optimized group implementing active energy modulation with reduced laser power for the second adjacent track.
Subsequently, the highly transient LPBF melting and solidification processes were simulated using the Finite Volume Method (FVM) within FLOW 3D. To guarantee numerical fidelity, a fine grid size of 4 μm was adopted across the computational domain. The temperature-dependent thermophysical properties of Inconel 718 employed in the simulations are detailed in Table 1.
Table 1.
Material properties of Inconel 718 and coefficients used in the simulation.
In addition, the density, thermal conductivity, and specific heat capacity were treated as temperature-dependent thermophysical properties rather than constant values. Their corresponding temperature-dependent values are listed separately in Table 2 and were introduced into the numerical model to describe the thermal response of Inconel 718 during the rapid heating, melting, and solidification stages of the LPBF process.
Table 2.
Temperature-dependent thermophysical properties of Inconel 718 used in the numerical simulation.
In this study, two different groups of numerical simulations were designed as shown in Figure 1a,b. The process parameters in these numerical simulations are detailed in Table 3. The initial temperature of both the substrate and the powder bed was uniformly set to 300 K. Both Group 1 (Figure 1a) and Group 2 (Figure 1b) simulated the formation of an 800 μm melt track utilizing a standard continuous laser power of 300 W as the first track. Group 1 served as the constant-power control and is equivalent to PRF = 0 in the framework subsequently defined in Section 3, because the laser power remained W irrespective of scan-vector length. This group aimed to elucidate the underlying mechanism of heat accumulation induced by the thermal history of the pre-scanned track. Group 2, designated as the optimized group, implemented a geometry-informed active energy modulation strategy. In this group, the laser power for the second adjacent track was actively reduced to 250 W, a representative reduced-power condition used to evaluate the feasibility of power attenuation.
Table 3.
Process parameters used for calculations.
During the simulations, the molten metal within the melt pool was assumed to be an incompressible, Newtonian laminar fluid. Its dynamic behavior was governed by the standard conservation equations for mass, momentum, and energy, described by the following:
where is the fluid velocity vector, is the stress tensor, ρ is the material density, t is the time, p is the pressure, g is the gravitational acceleration, H is the enthalpy, and K is the thermal conductivity. The momentum source term, Smom, explicitly accounts for buoyancy and the viscous drag exerted within the mushy zone, while the energy source term, Sh, represents the moving laser heat input.
To precisely track the dynamically evolving interface between the molten metal and the protective gas environment, the Volume of Fluid (VOF) method was implemented. The governing equation for the VOF method is expressed as:
where F denotes the fluid volume fraction.
The laser heat source was modeled utilizing a volumetric Gaussian distribution, where the heat flux density, q(r), varies radially according to the following Gaussian function:
where qm denotes the maximum heat flux at the center of the laser spot, r denotes the radial distance from any given point to the center of the laser spot, and D denotes the laser spot diameter.
As the laser moves across the predefined powder bed plane, with coordinates x and y denoting any arbitrary point originating from the spot center, the moving heat source during the LPBF process is described by:
where (x0, y0) denotes the initial position of the laser spot, vx and vy denote the velocity components of the laser spot in the X and Y directions, respectively, and t denotes the laser scanning time.
The boundary conditions for the simulation include the effects of gravitational force, surface tension, Marangoni effect, and recoil pressure induced by metal vapor evaporation at the melt pool interface. These are described as follows.
- (1)
- The localized heat transfer boundary condition dynamically balancing the absorbed incident laser energy against convective heat transfer and thermal radiation at the free surface above the powder bed is expressed as:where qin denotes the absorbed heat, q denotes the total incident laser energy, ht denotes the convective heat transfer coefficient, T0 denotes the ambient temperature, ε denotes the emissivity, σ denotes the Stefan-Boltzmann constant, and qev denotes the heat loss due to metal evaporation.
- (2)
- The critical heat loss induced by metal evaporation is expressed as:where ΔH* denotes the enthalpy of the metal vapor, M denotes the molar mass of the Inconel 718 powder, R is the ideal gas constant, P0 denotes the saturation vapor pressure at ambient temperature T0, and Tlv denotes the metal evaporation temperature.
- (3)
- The recoil pressure acting on the melt pool free surface caused by metal vapor evaporation, a primary driver for keyhole formation, is calculated as:where Llv denotes the latent heat of vaporization, and P0 denotes the saturation vapor pressure.
- (4)
- The temperature dependence of surface tension, ensuring that the intensely localized Marangoni convection currents are accurately replicated, is defined as:where γl denotes the surface tension at the liquidus temperature, dγ/dT is the temperature sensitivity coefficient of surface tension, and Tl denotes the liquidus temperature.
2.2. Effect of Power Attenuation on Melt-Pool Temperature and Morphology
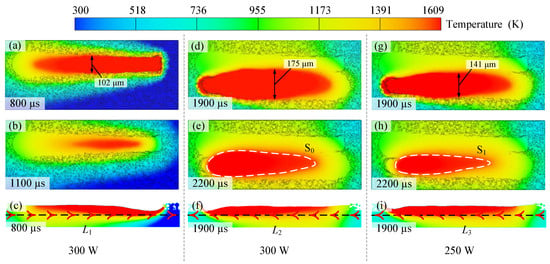
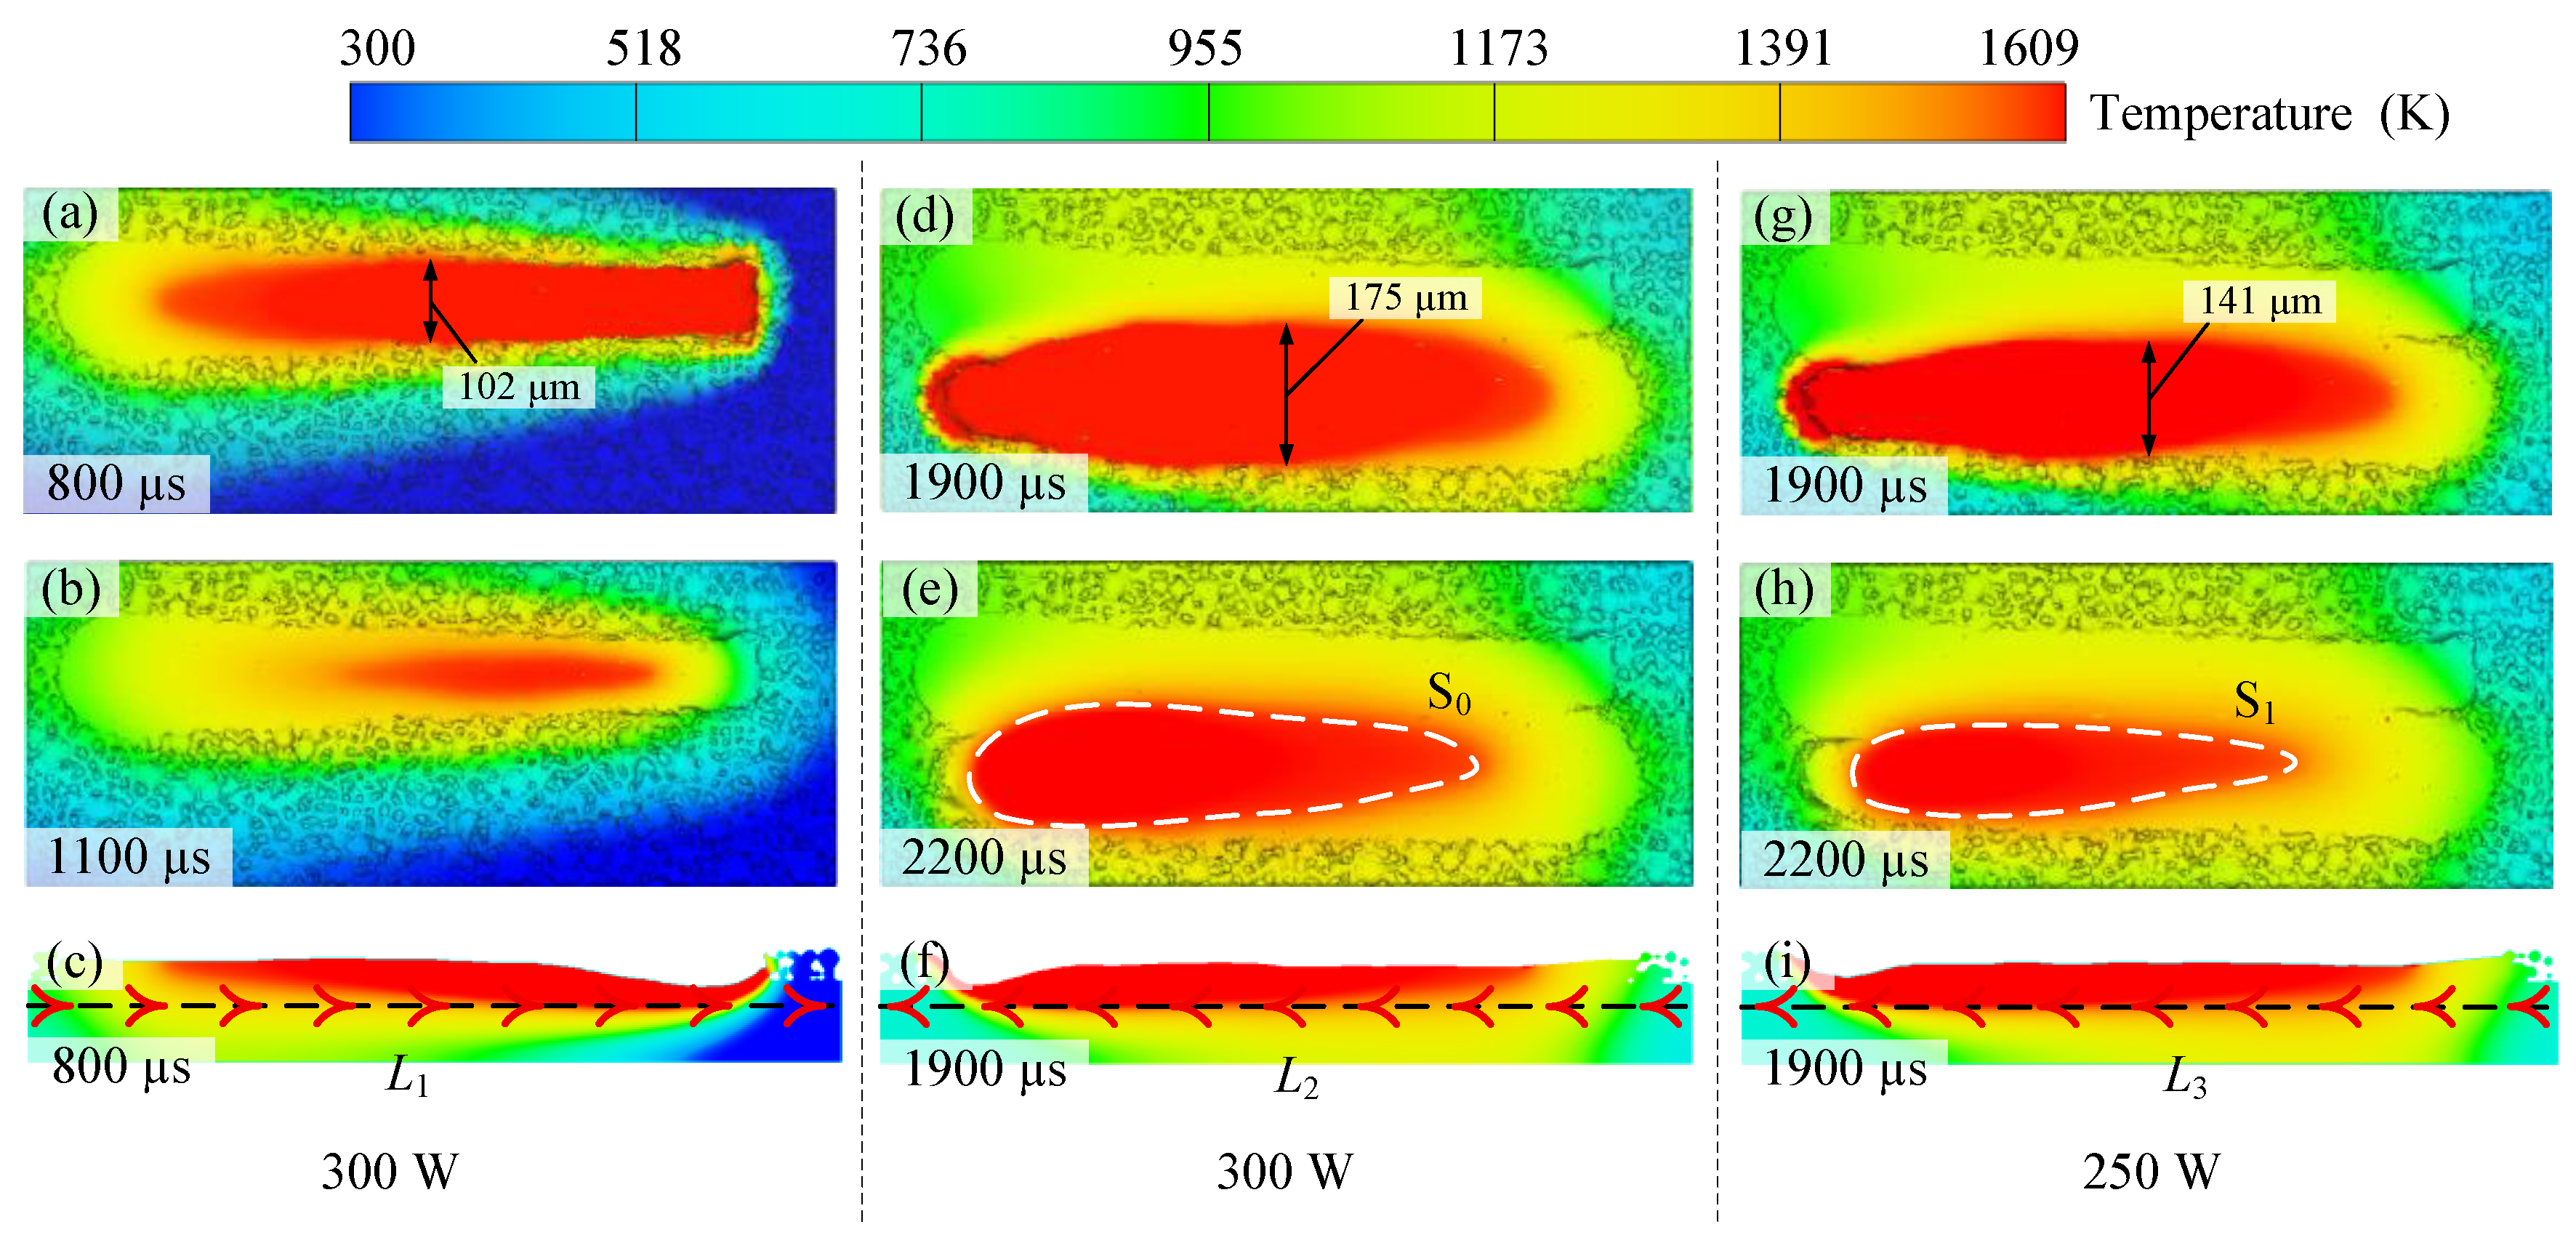
The temporal evolution of the melt pool morphology and temperature distribution at various stages is depicted in Figure 2. Upon the completion of the first laser track (300 W), the melt pool exhibited a highly regular geometrical morphology. Following a subsequent cooling period of 300 µs, the molten material solidified promptly, registering a peak temperature of 1588 K, as shown in Figure 2a,b.
Figure 2.
Simulated temporal evolution of melt pool morphologies and temperature distributions under distinct power inputs: (a–c) the first track (300 W), showing top views at the end of active scanning (800 μs, (a)) and during the cooling stage (1100 μs, (b)), alongside a side view at 800 μs (c); (d–f) the second track without power modulation (control group, 300 W), showing top views at the end of scanning (1900 μs, (d)) and during cooling (2200 μs, (e)), alongside a side view at 1900 μs (f); (g–i) the second track with active energy modulation (optimized group, 250 W), showing top views at the end of scanning (1900 μs, (g)) and during cooling (2200 μs, (h)), alongside a side view at 1900 μs (i). The arrows on the dashed lines in (c,f,i) indicate the temperature-profile extraction directions used in Figure 3. The upper limit of the temperature scale was fixed at the liquidus temperature of Inconel 718 (1609 K); therefore, red regions represent saturated high-temperature regions close to or above the liquidus temperature rather than exact quantitative melt pool boundaries.
However, during the scanning of the second track under constant laser power (300 W), the melt pool experienced significant geometrical distortion due to the elevated ambient temperature of the underlying powder bed. The melt pool width at the equivalent position substantially expanded from 102 µm to 175 µm. This continuous heat input enlarged the melt pool volume and steepened the temperature gradient, resulting in a substantial unsolidified region remaining after the standard cooling interval. The peak temperature concomitantly surged to 1729 K. These observations confirm that maintaining a constant laser power engenders severe heat accumulation in closely spaced scanning trajectories.
To suppress this inter-track thermal interference, the geometry-informed active energy modulation strategy was applied, where the laser power for the second track was actively reduced to 250 W. Under this modulated condition, the excessive expansion of the melt pool was curbed, with its width effectively constrained to 141 µm (Figure 2g). Correspondingly, the area of the unsolidified region was reduced by 35.63%, shrinking from S0 to S1, and the peak temperature dropped to 1665 K, as illustrated in Figure 2e,h. These numerical results demonstrate that progressively down-regulating the laser power in heat-accumulation-prone regions successfully optimizes both the thermal distribution and morphological stability of the melt pool. Nevertheless, a discernible discrepancy remains between the melt pool states in Figure 2a,g, indicating that a power reduction to 250 W, while effective, might still be marginally insufficient to achieve complete morphological parity with the initial track.
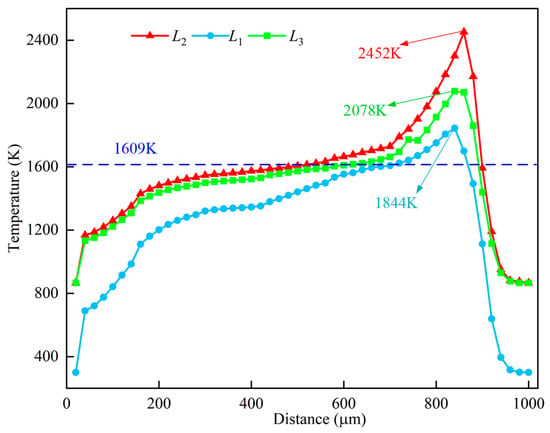
To further quantify the spatial thermal disparities induced by the power modulation, 50 equidistant data points were selected along the dashed line regions (beneath the melt pool center) to extract localized thermal profiles, as presented in Figure 3. The effective melt pool length is defined as the region bounded by the liquidus isotherm (1609 K). When the laser power was maintained constantly, the preheating effect from the preceding track caused the melt pool length at dashed line L2 to reach its maximum, accompanied by a sharp escalation in localized peak temperature from 1844 K to 2452 K. In contrast, upon implementing the geometry-informed active energy modulation (power reduction), the melt pool length at dashed line L3 was noticeably truncated, and its corresponding peak temperature plummeted to 2078 K. Conclusively, strategically attenuating the laser power can significantly suppress the inter-track heat accumulation effect, precisely regulating both the geometrical dimensions and thermal extremes of the melt pool.
3. PRF-Based Geometry-Informed Active Energy Modulation Strategy
To counteract this local thermal imbalance, a geometry-informed active energy modulation strategy was proposed to proportionately attenuate the laser power as the scanning vectors shorten in the sharp-edged regions. The crux of this approach is to quantify the precise gradient of power reduction using a dimensionless parameter termed the Power Reduction Factor (PRF). The PRF establishes the relationship between the variation in laser power and the corresponding reduction in scanning line length, governed by the following mathematical expression:
where P0 represents the standard reference laser power applied in the uniform region, h0 is the standard reference scanning length, P denotes the dynamically adjusted laser power corresponding to a given shortened scanning line length, and h is the instantaneous specific scanning line length.
The relationship between P(h) and h can be calculated as:
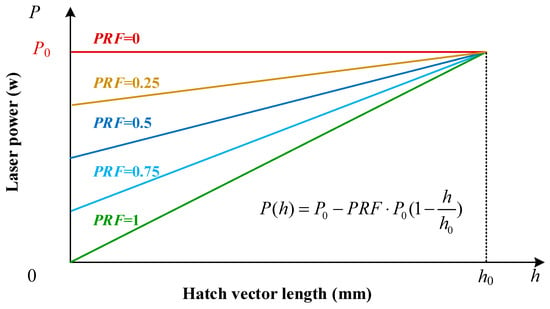
The graphical representation of this linear correlation is depicted in Figure 4. The slope of the power-length curve is exclusively dictated by the magnitude of the PRF. When PRF = 0, Equation (10) reduces to , meaning that no power attenuation is applied as the vector shortens. Thus, PRF = 0 represents the constant-power baseline rather than a zero-power condition. This condition corresponds to the numerical control case examined in Section 2. Conversely, when PRF = 1.0, the laser power decays to zero as the scanning length approaches zero. Therefore, by systematically manipulating the PRF value, the specific gradient of laser power reduction in sharp corner regions can be quantitatively controlled to achieve an optimal localized thermal balance.
Figure 4.
Linear correlation between dynamically modulated laser power and scanning vector length under varying PRF values. The distinct slopes illustrate the specifically controlled gradients of power reduction, ranging from constant power (PRF = 0) to complete decay (PRF = 1.0), aimed at achieving localized thermal balance in sharp corner regions.
4. Materials and Experimental Methods
4.1. Powder Material, LPBF System and In Situ Monitoring Setup
Gas-atomized Inconel 718 superalloy powder with a particle size distribution ranging from 15 to 53 µm, supplied by Avimetal AM Technology Co., Ltd. (Beijing, China), was utilized as the feedstock material. Prior to the LPBF processing, the powder underwent a dehydration treatment in a vacuum drying oven at 60 °C for 6 h to thoroughly eliminate residual moisture and ensure optimal powder flowability.
The specimens were fabricated using a commercial EOS M290 LPBF system (EOS GmbH—Electro Optical Systems, Krailling, Germany). To prevent severe oxidation during the high-energy laser melting process, the building chamber was continuously purged with high-purity (99.999%) argon gas until the residual oxygen concentration dropped below 200 ppm. A stainless steel substrate served as the building platform and was uniformly preheated to 80 °C to mitigate the thermal shock and alleviate localized residual stresses.
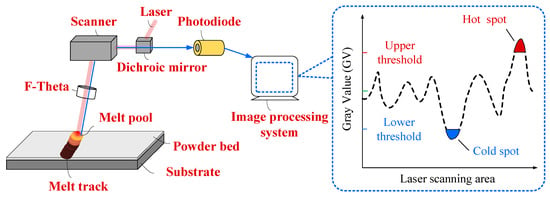
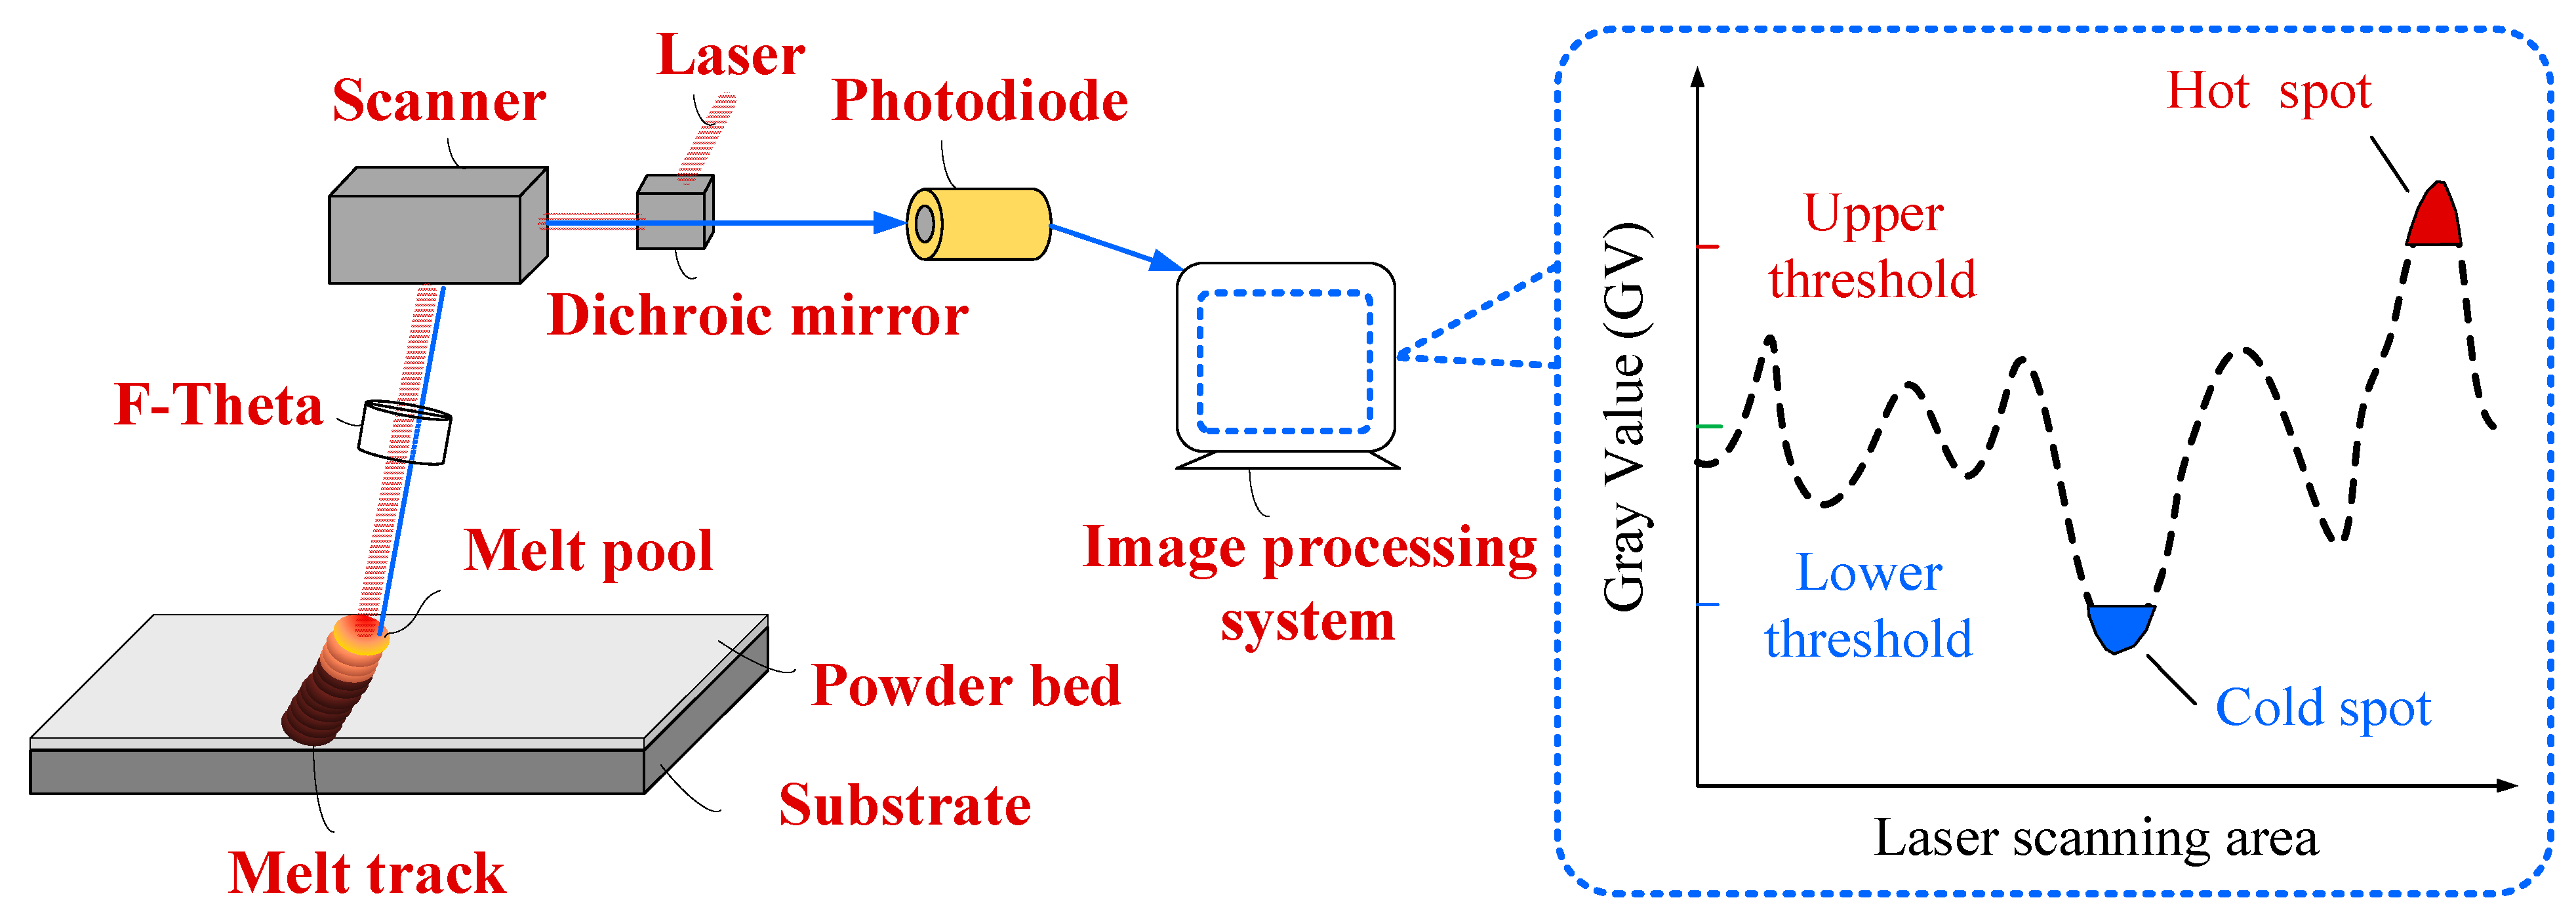
To monitor the transient thermal behavior and localized heat accumulation during the fabrication process in situ, the EOS M290 system was equipped with a high-speed coaxial photodiode-based monitoring system, which captured the evolution of melt pool radiation intensity throughout the build process. The explicit spatial configuration between the LPBF system and in situ optical monitoring system is illustrated in Figure 5. The melt-pool radiation signals acquired by the photodiode were synchronized with the scanning coordinates and reconstructed into layer-wise monitoring images, in which the emission intensity of each melt pool was quantitatively visualized. The captured layer-wise optical emission images were transmitted in real time to a connected computer, where the image data from each individual layer of the build process were systematically compiled. As schematically demonstrated in Figure 5, an image processing algorithm was implemented to calculate the average grayscale value of each layer, based on which upper and lower statistical grayscale thresholds were established. Any anomalous localized regions exceeding these predefined thresholds were automatically identified and flagged with red circular indicators for defect positioning.
Figure 5.
Configuration of the LPBF system and optical monitoring system.
4.2. Specimen Design and Implementation of PRF-Based Modulation
In the LPBF process, the morphological stability of the melt pool is highly sensitive to localized thermal fluctuations. In regions prone to heat accumulation, the continuous escalation of the powder bed temperature inevitably enlarges the melt pool dimensions. While theoretical countermeasures include increasing the scanning speed or expanding the hatch spacing, the former introduces a significant risk of insufficient melting, whereas the latter can lead to inter-track porosity. Consequently, this study adopts the active reduction in laser scanning power as the optimal mechanism to mitigate heat accumulation. The scan-vector-dependent power schedule was implemented during manufacturing-data preparation rather than through real-time feedback control. After generation of the hatch vectors, the length of each vector intersecting the triangular sharp-edged region was obtained from the scan data. The corresponding laser power was then calculated using Equation (10), with the constant-vector region defining the reference conditions W and . The calculated power value was assigned to the corresponding hatch vector before the manufacturing dataset was transferred to the EOS M290.
To isolate the variables and accurately assess the microstructural and mechanical evolution, a tailored “Stripes” filling strategy was employed for specimen fabrication. The stripe width was explicitly set to 8 mm, exactly matching the maximum width of the square section of the test specimen, ensuring that the entire geometry could be covered by a single stripe per layer. This configuration deliberately eliminates any inter-stripe overlap within the same layer, effectively averting the localized remelting phenomena typically associated with overlapping boundaries. Such remelting would otherwise introduce heterogeneous crystallographic textures and mechanical anomalies, thereby skewing the subsequent measurements of melt track continuity and microhardness.
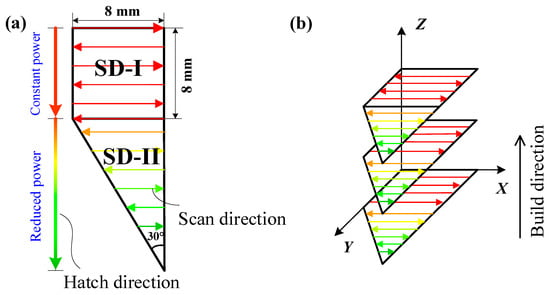
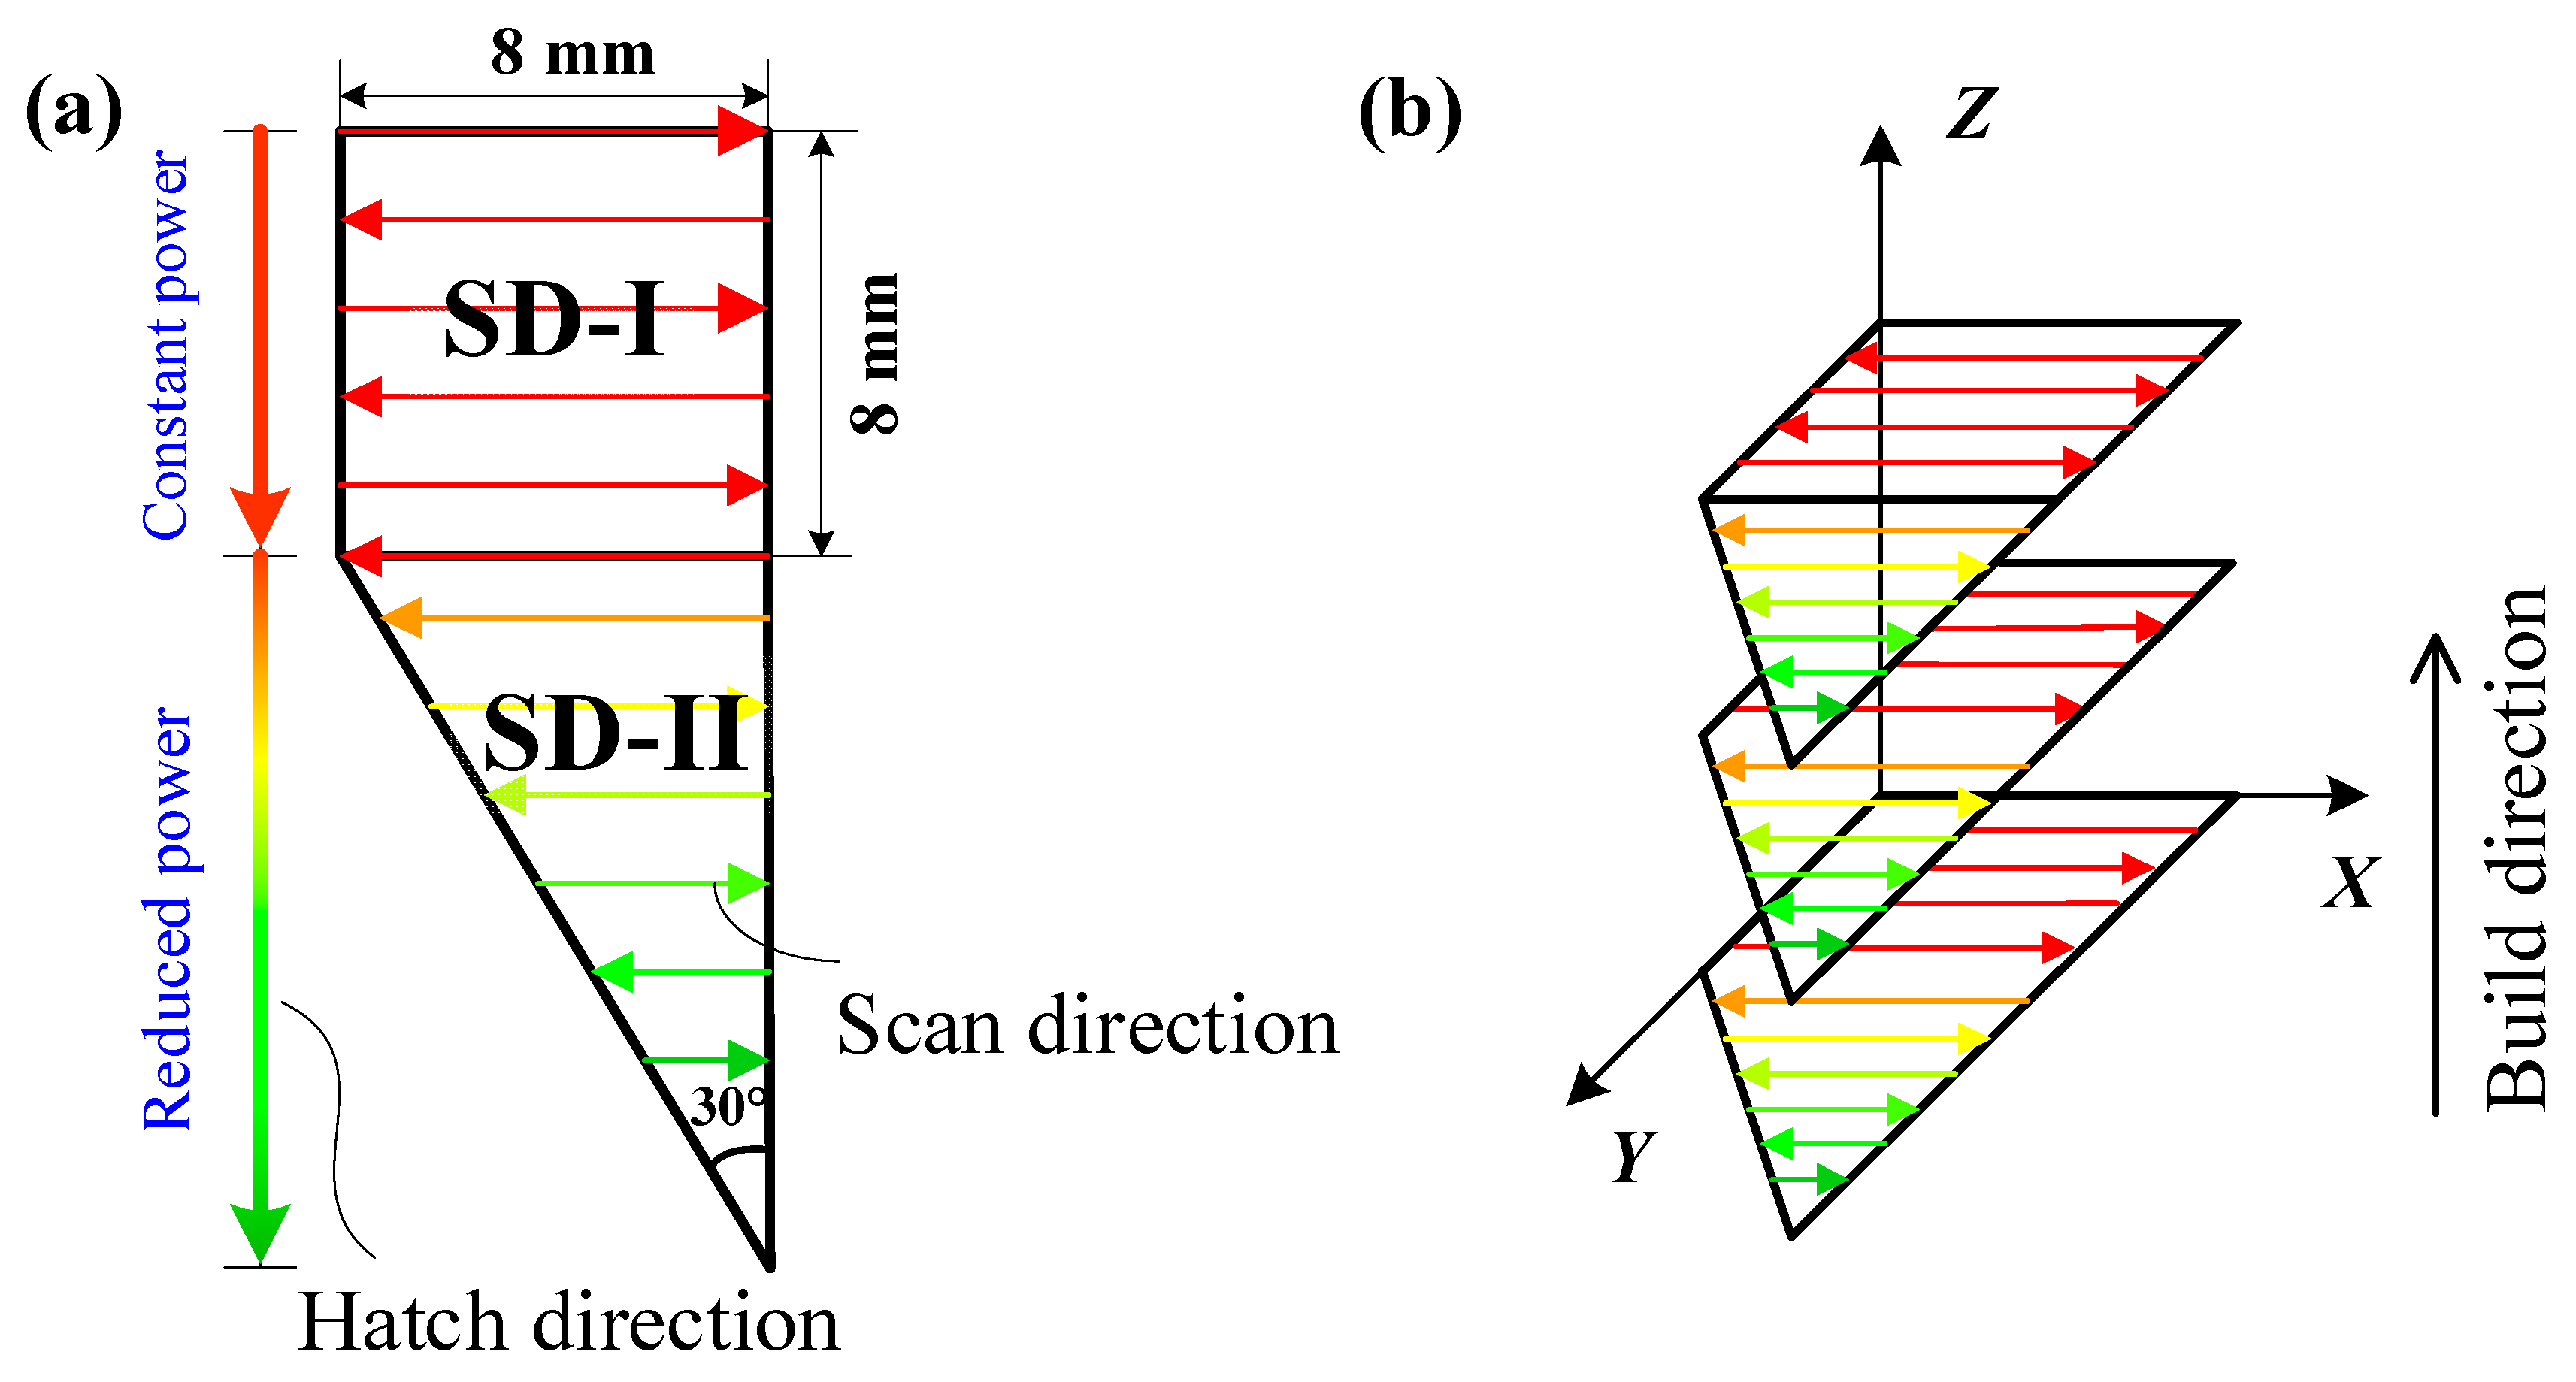
The intra-stripe hatching utilized a conventional bidirectional meander path. Under this strategy, when scanning the uniform 8 mm × 8 mm square section, designated as Region SD-I, as shown in Figure 6a, the scanning vector length remains constant. Consequently, the energy density received by the scanning area remains uniform, mitigating the risk of heat accumulation. Conversely, as the laser progresses into the 30° acute-angled triangular section, designated as Region SD-II in Figure 6a, the scanning lines become progressively shorter. This continuous reduction in track length severely truncates the cooling period for the underlying and adjacent material, ultimately instigating localized heat accumulation.
Figure 6.
Schematic of the experimental specimen geometry and laser scanning strategy: (a) top view illustrating the dimensions, scanning path, and the structural division; (b) illustration of the build direction. Different colors schematically represent different laser powers.
Therefore, in the scanning Region SD-I depicted in Figure 6a, the laser scanning power remains constant at the standard power P0 in the upper square region, where the scanning length is the standard length h0. However, in the lower triangular region, the dynamically modulated laser power P(h) decreases linearly as the scanning line length diminishes.
The core of the proposed geometry-informed active energy modulation strategy hinges on determining the precise gradient by which the laser power decreases as the scanning vectors shorten. Optimizing the PRF is critical to this approach. If the PRF is excessively low, the power reduction is insufficient, leading to residual heat accumulation in the sharp corner regions. Conversely, if the PRF is too high, the excessive power drop may inhibit the complete melting of the Inconel 718 powder. To empirically determine the optimal PRF, a targeted LPBF experimental campaign was meticulously designed.
The geometric design of the test specimen featured a trapezoidal base. As dispicted in Section 4.2, this specific geometry consisted of a uniform square region, designated as Region SD-I, with an 8 mm edge length, appended to a triangular region, designated as Region SD-II, featuring an 8 mm base and a 30° apex angle. During fabrication, the hatching direction was kept identical for all layers, and no inter-layer rotation was applied. Notably, to deliberately provoke and evaluate severe localized heat accumulation, no scanning rotation was applied between successive layers. Consequently, the scanning trajectory remained identical for every layer, as shown in Figure 6b.
During the LPBF process, the laser power was maintained at a constant 300 W while scanning Region SD-I. However, as the laser traversed Region SD-II, the power was progressively down-regulated in accordance with the established active energy modulation equation. A total of 10 distinct specimens were fabricated, varying exclusively in their assigned PRF values. These PRF values ranged from 0.1 to 1.0, increasing in uniform increments of 0.1, while all other processing parameters remained constant as detailed in Table 2.
4.3. Surface, Mechanical and Microstructural Characterization
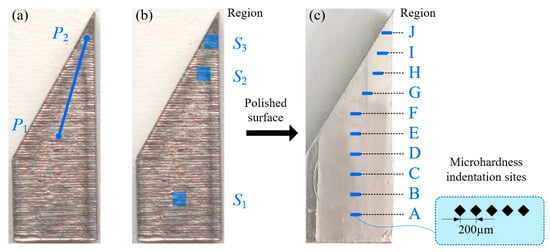
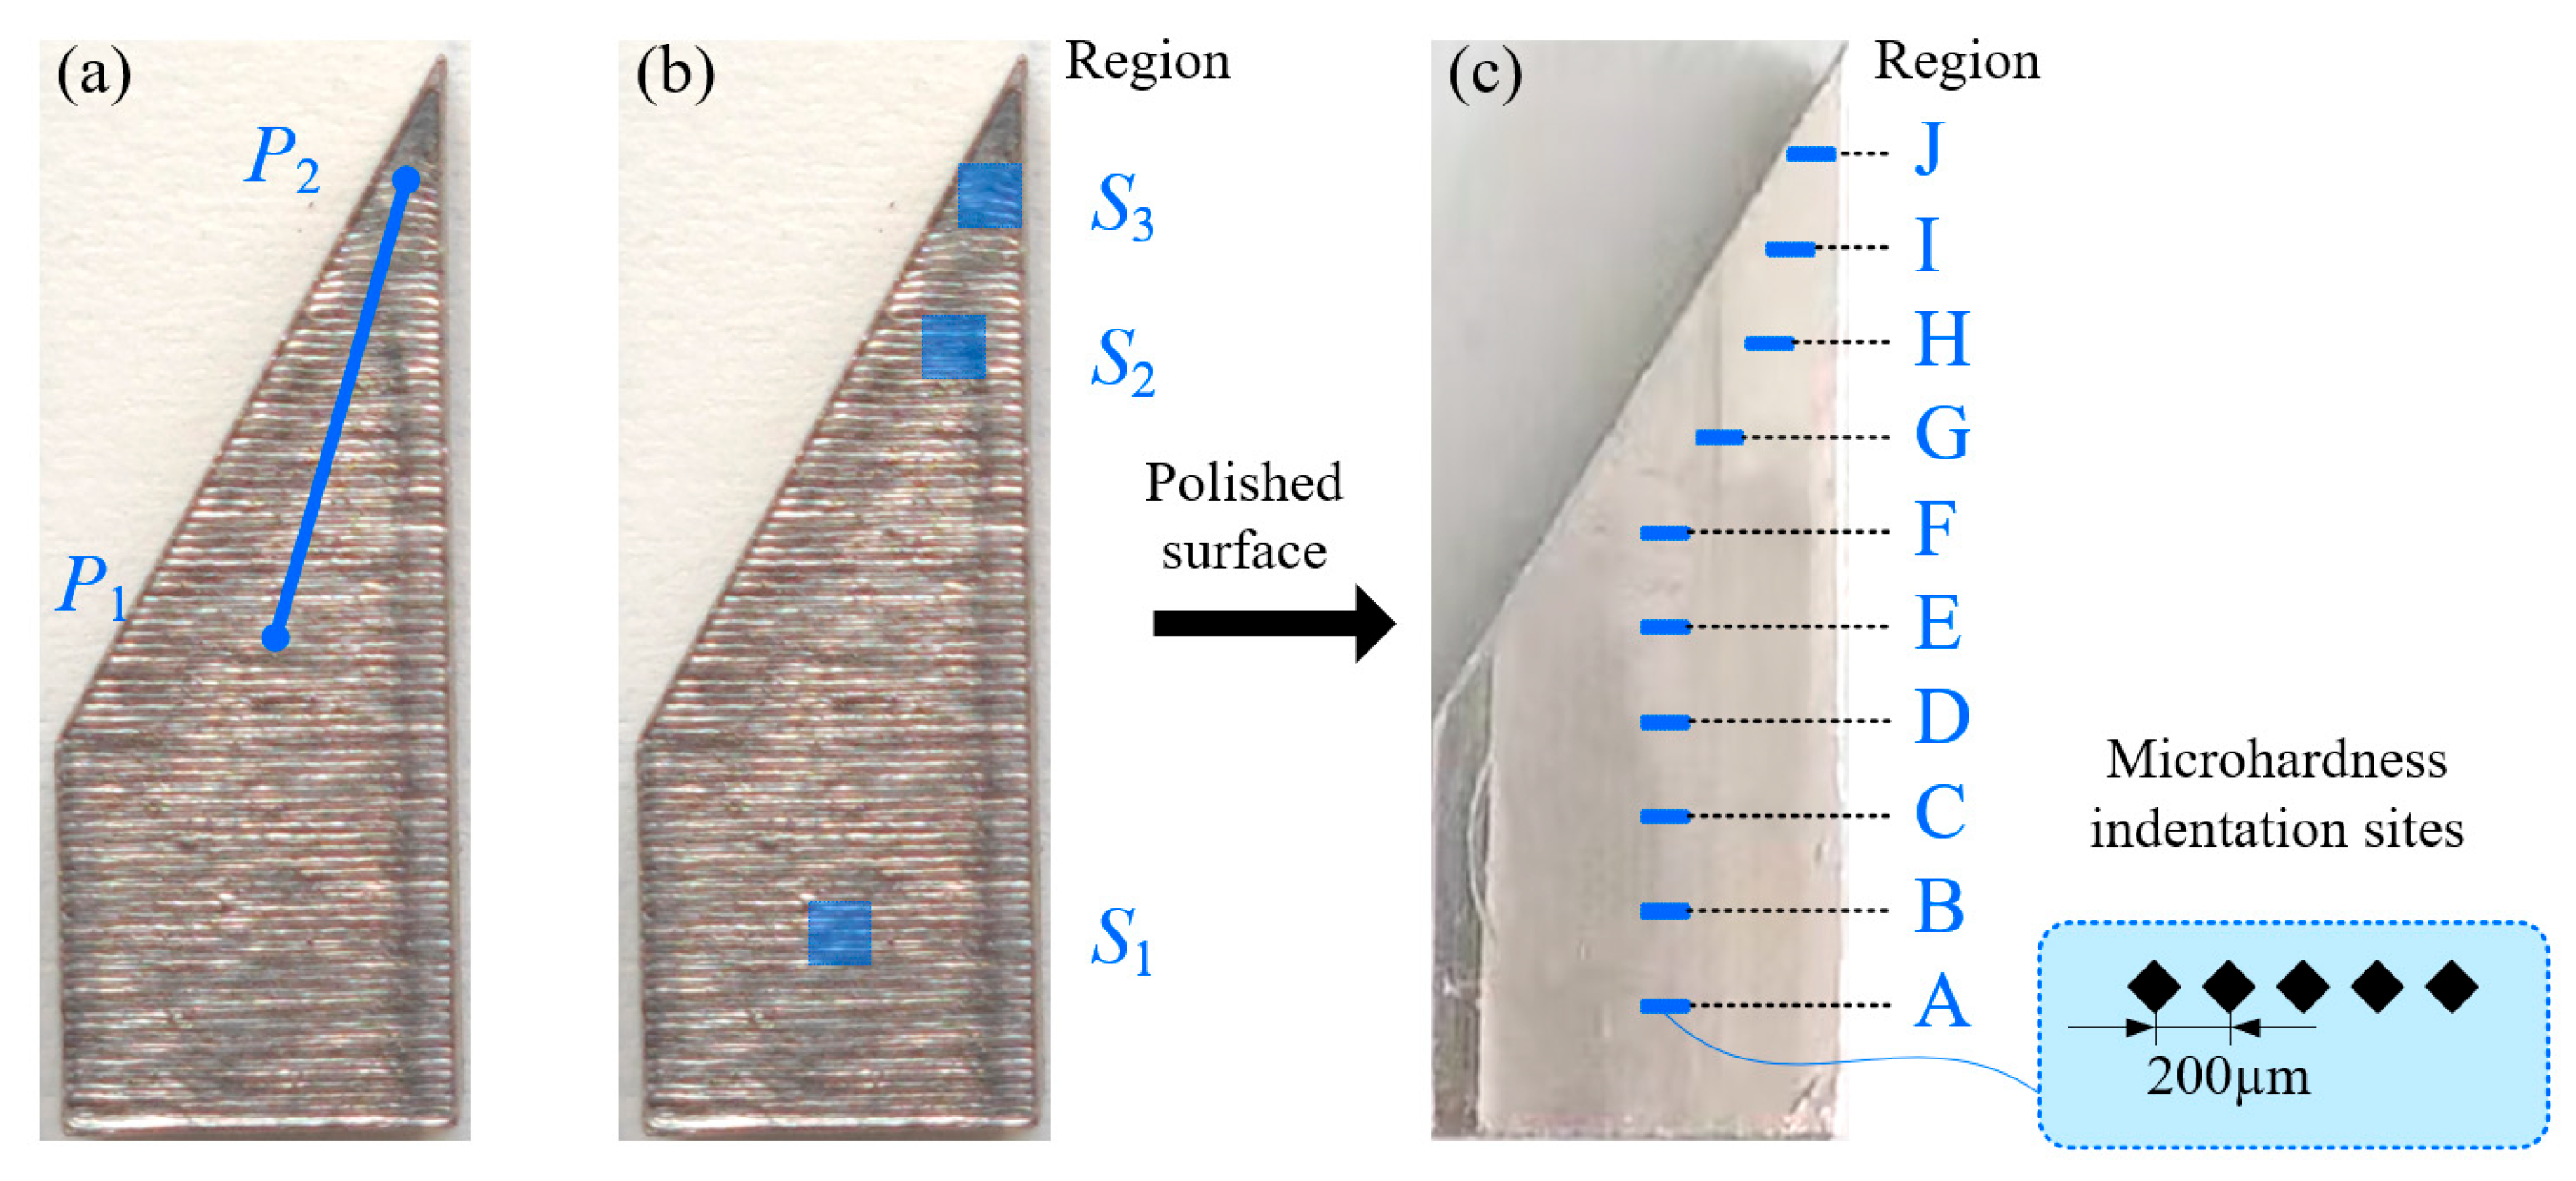
Upon completion of the build, the specimens were removed from the substrate and their top surfaces were examined using an optical microscope (OM, Olympus DSX510, Olympus Corporation, Tokyo, Japan). To quantitatively evaluate the surface integrity, the arithmetic mean roughness (Ra) of the profile undulations in the corner regions was measured (see Figure 7a). The line roughness Ra was calculated as the average absolute deviation of the height of each point from the mean height. The specimen exhibiting the most favorable profile undulations and minimum surface roughness dictated the optimal PRF value.
Figure 7.
Schematic of the designated regions for evaluating the surface quality of LPBF specimens: (a) line roughness, (b) surface topography, and (c) microhardness.
Furthermore, as illustrated in Figure 7b, three representative surface regions (S1, S2, and S3) were selected for topographical characterization. Specifically, S1 corresponds to the constant-vector-length scanning region, S2 represents the variable-vector-length region subjected to moderate heat accumulation, and S3 is located at the sharp apex where severe heat accumulation is expected. Comparative analysis of the surface morphologies in these regions was performed to elucidate the influence of localized heat accumulation on surface geometric characteristics and to assess the effectiveness of the proposed active energy modulation strategy in mitigating heat accumulation-induced surface deterioration.
To further evaluate the impact of the active energy modulation on the mechanical and metallurgical properties, three representative specimens (PRF = 0.1, 0.3, and 0.6) were selected for comparative analysis. Following standard metallographic grinding and polishing, 10 distinct localized regions were sequentially designated from the bottom edge to the sharp apex (see Figure 7c). A Vickers microhardness tester (Buehler VH1102, Buehler, Lake Bluff, IL, USA) was utilized to conduct five indentations within each region, yielding average hardness values to profile the spatial hardness distribution. Finally, the specimens were chemically etched with aqua regia. Their microstructural evolution and cellular dendrite morphologies were meticulously characterized using a scanning electron microscope (SEM, eminiSEM 360, Carl Zeiss AG, Oberkochen, Germany).
5. Results and Discussion
5.1. In Situ Monitoring of Layer-Wise Heat Accumulation
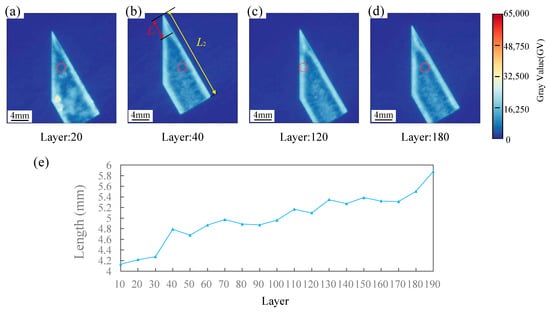
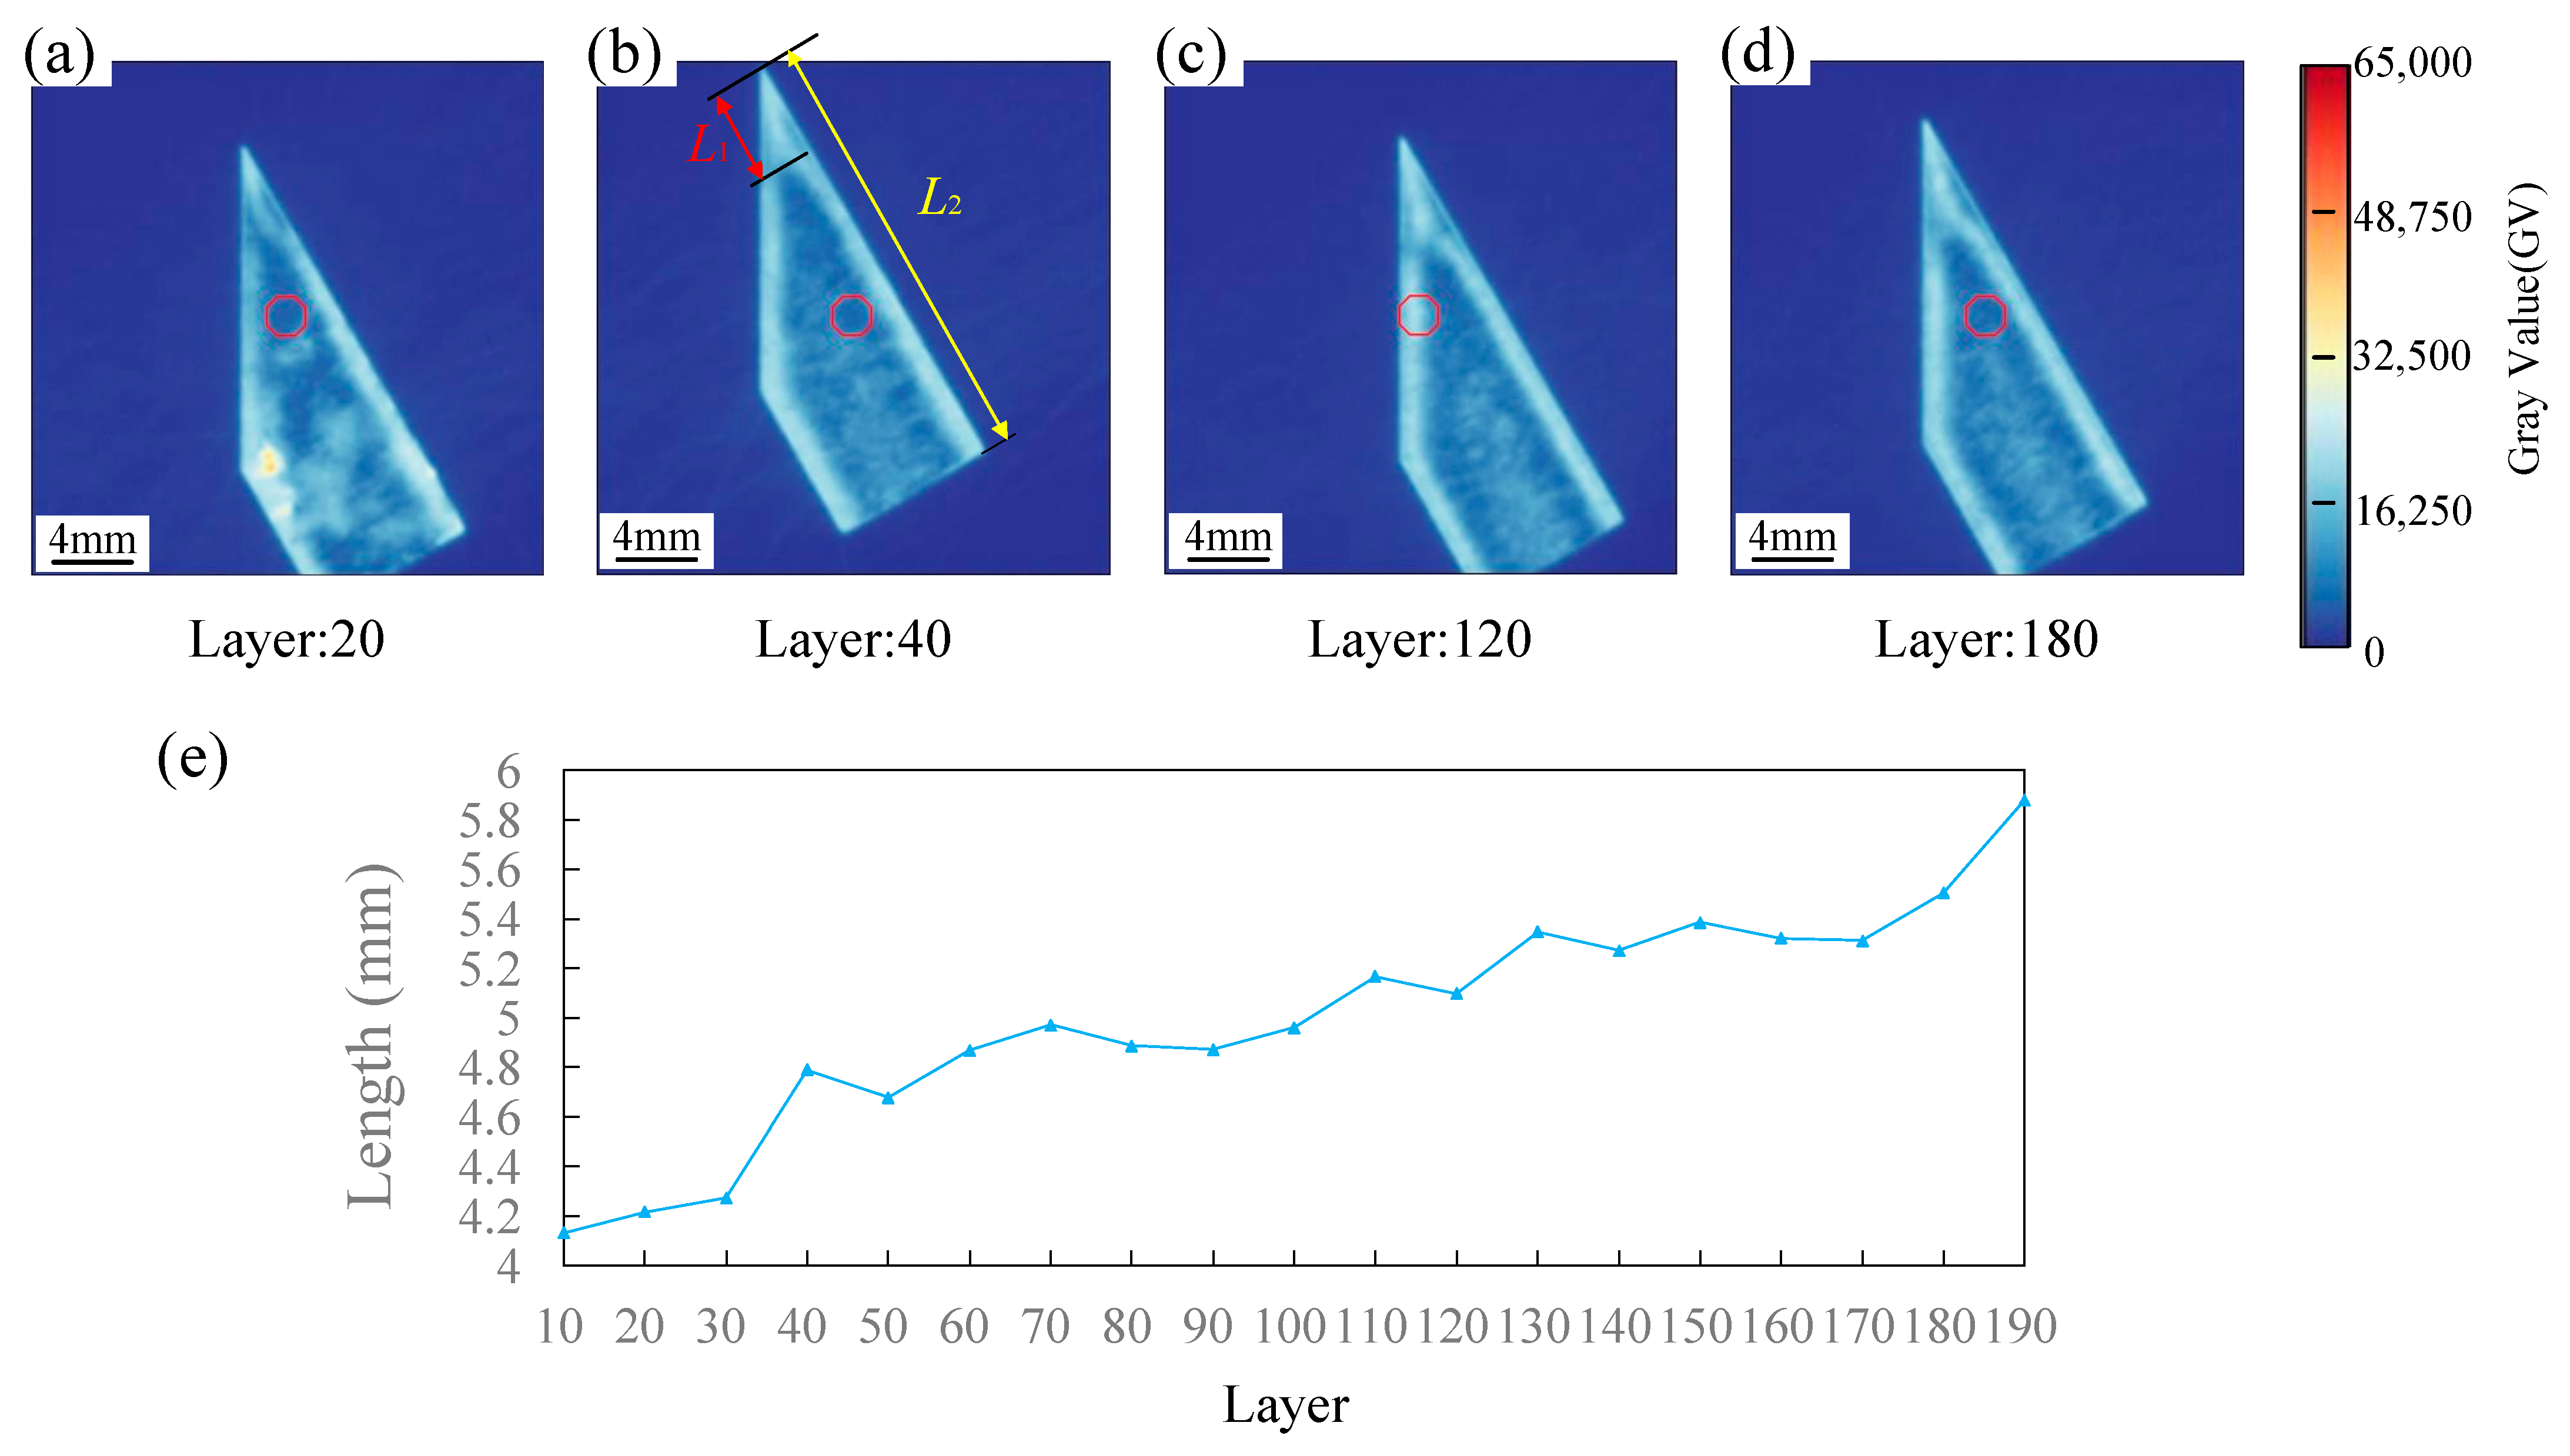
The progressive intensification of localized heat accumulation can be directly observed through the in situ monitoring data. Figure 8a–d exhibit the layer-wise grayscale intensity maps for the specimen fabricated with a PRF of 0.1. In these thermographic representations, the grayscale intensity was used as a quantitative indicator of melt-pool radiation intensity and local thermal response. Anomalous regions characterized by extreme temperature deviations are automatically demarcated by red circles. A macroscopic evaluation of the sharp apex reveals that the spatial footprint of the excessively overheated zone expands progressively as the build height increases.
Figure 8.
In situ monitoring of the heat-accumulation evolution for the PRF = 0.1 specimen: (a–d) grayscale monitoring images of four representative layers; (e) evolution of the axial extent of the connected apical high-intensity region with build layer number.
To quantify the progressive evolution of the apical anomaly, was defined as the axial extent of the connected high-intensity region, measured along the specimen centerline from the geometric apex to the farthest boundary of this region, as illustrated in Figure 8b. Using the known reference distance between the apex and the specimen base, the absolute value of was obtained by spatial calibration. The monitoring images were sampled at intervals of 10 layers, and the resulting evolution of is plotted in Figure 8e. The increasing indicates a progressive extension of the apical high-intensity region with increasing build layer number.
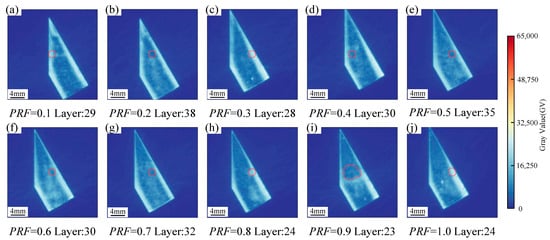
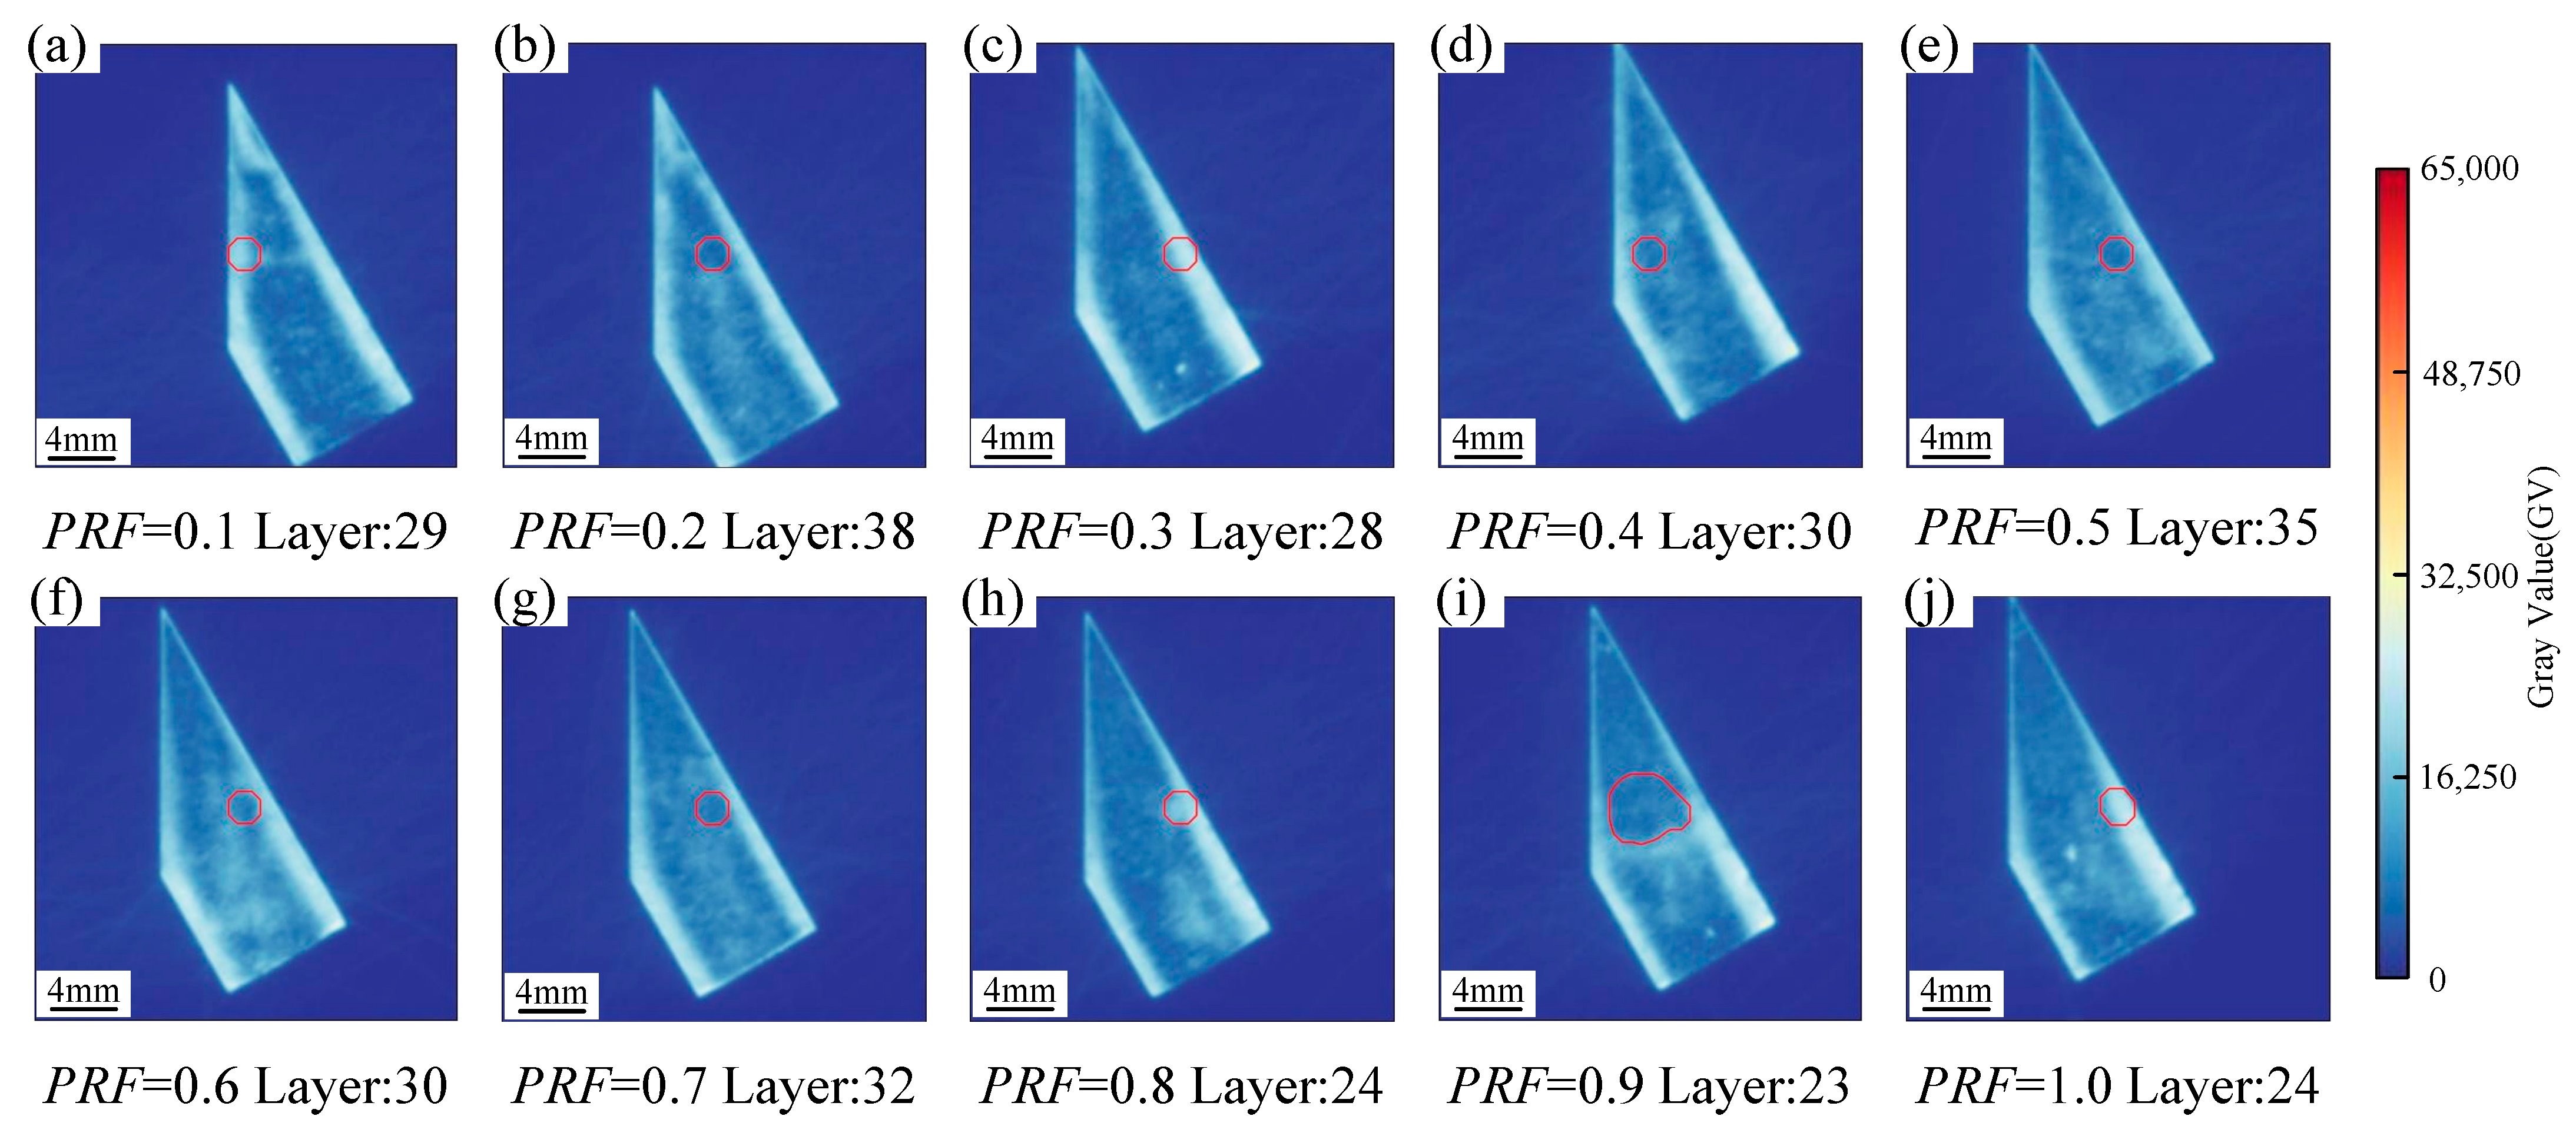
The in situ monitoring images further elucidate the substantial impact of varying PRF values on the apical thermal response. Figure 9 displays comparative grayscale maps selected from geometrically equivalent layers across specimens fabricated with different PRF gradients. Evidently, as the PRF increases, the area of the excessive thermal zone at the apex shrinks significantly. Notably, at PRF = 0.5, the high-intensity anomaly at the apex is completely eradicated, proving that active laser power reduction exerts a profound and immediate mitigating effect on localized heat accumulation. It should be noted that the disappearance of the overheated optical signature does not necessarily indicate optimal forming quality, because excessive power reduction may lead to insufficient melting. The high-intensity illuminated outlines observed along the edges of the specimens for PRF ≥ 0.5 are attributed to the contour scanning passes, which are implemented specifically to enhance dimensional accuracy. Since the contour scanning power remains identical to that of the uniform square region, these specific boundary pixels exhibit distinct, high-intensity signatures near the apex.
Figure 9.
Comparative in situ monitoring images of layers across specimens fabricated with different PRF gradients: (a–j) grayscale maps corresponding to PRF values ranging from 0.1 to 1.0, respectively.
5.2. Surface Integrity and Mechanical Response
5.2.1. Surface Morphology and Roughness
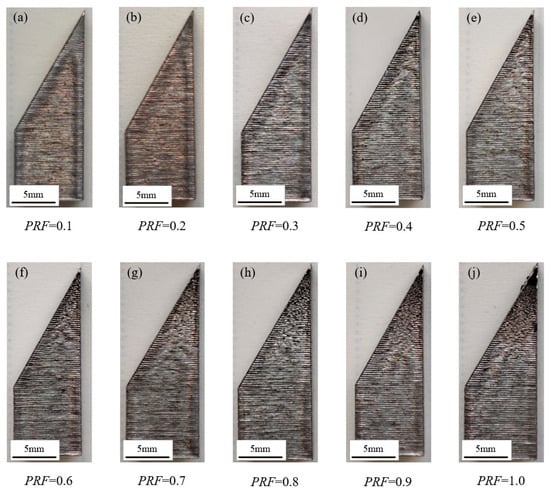
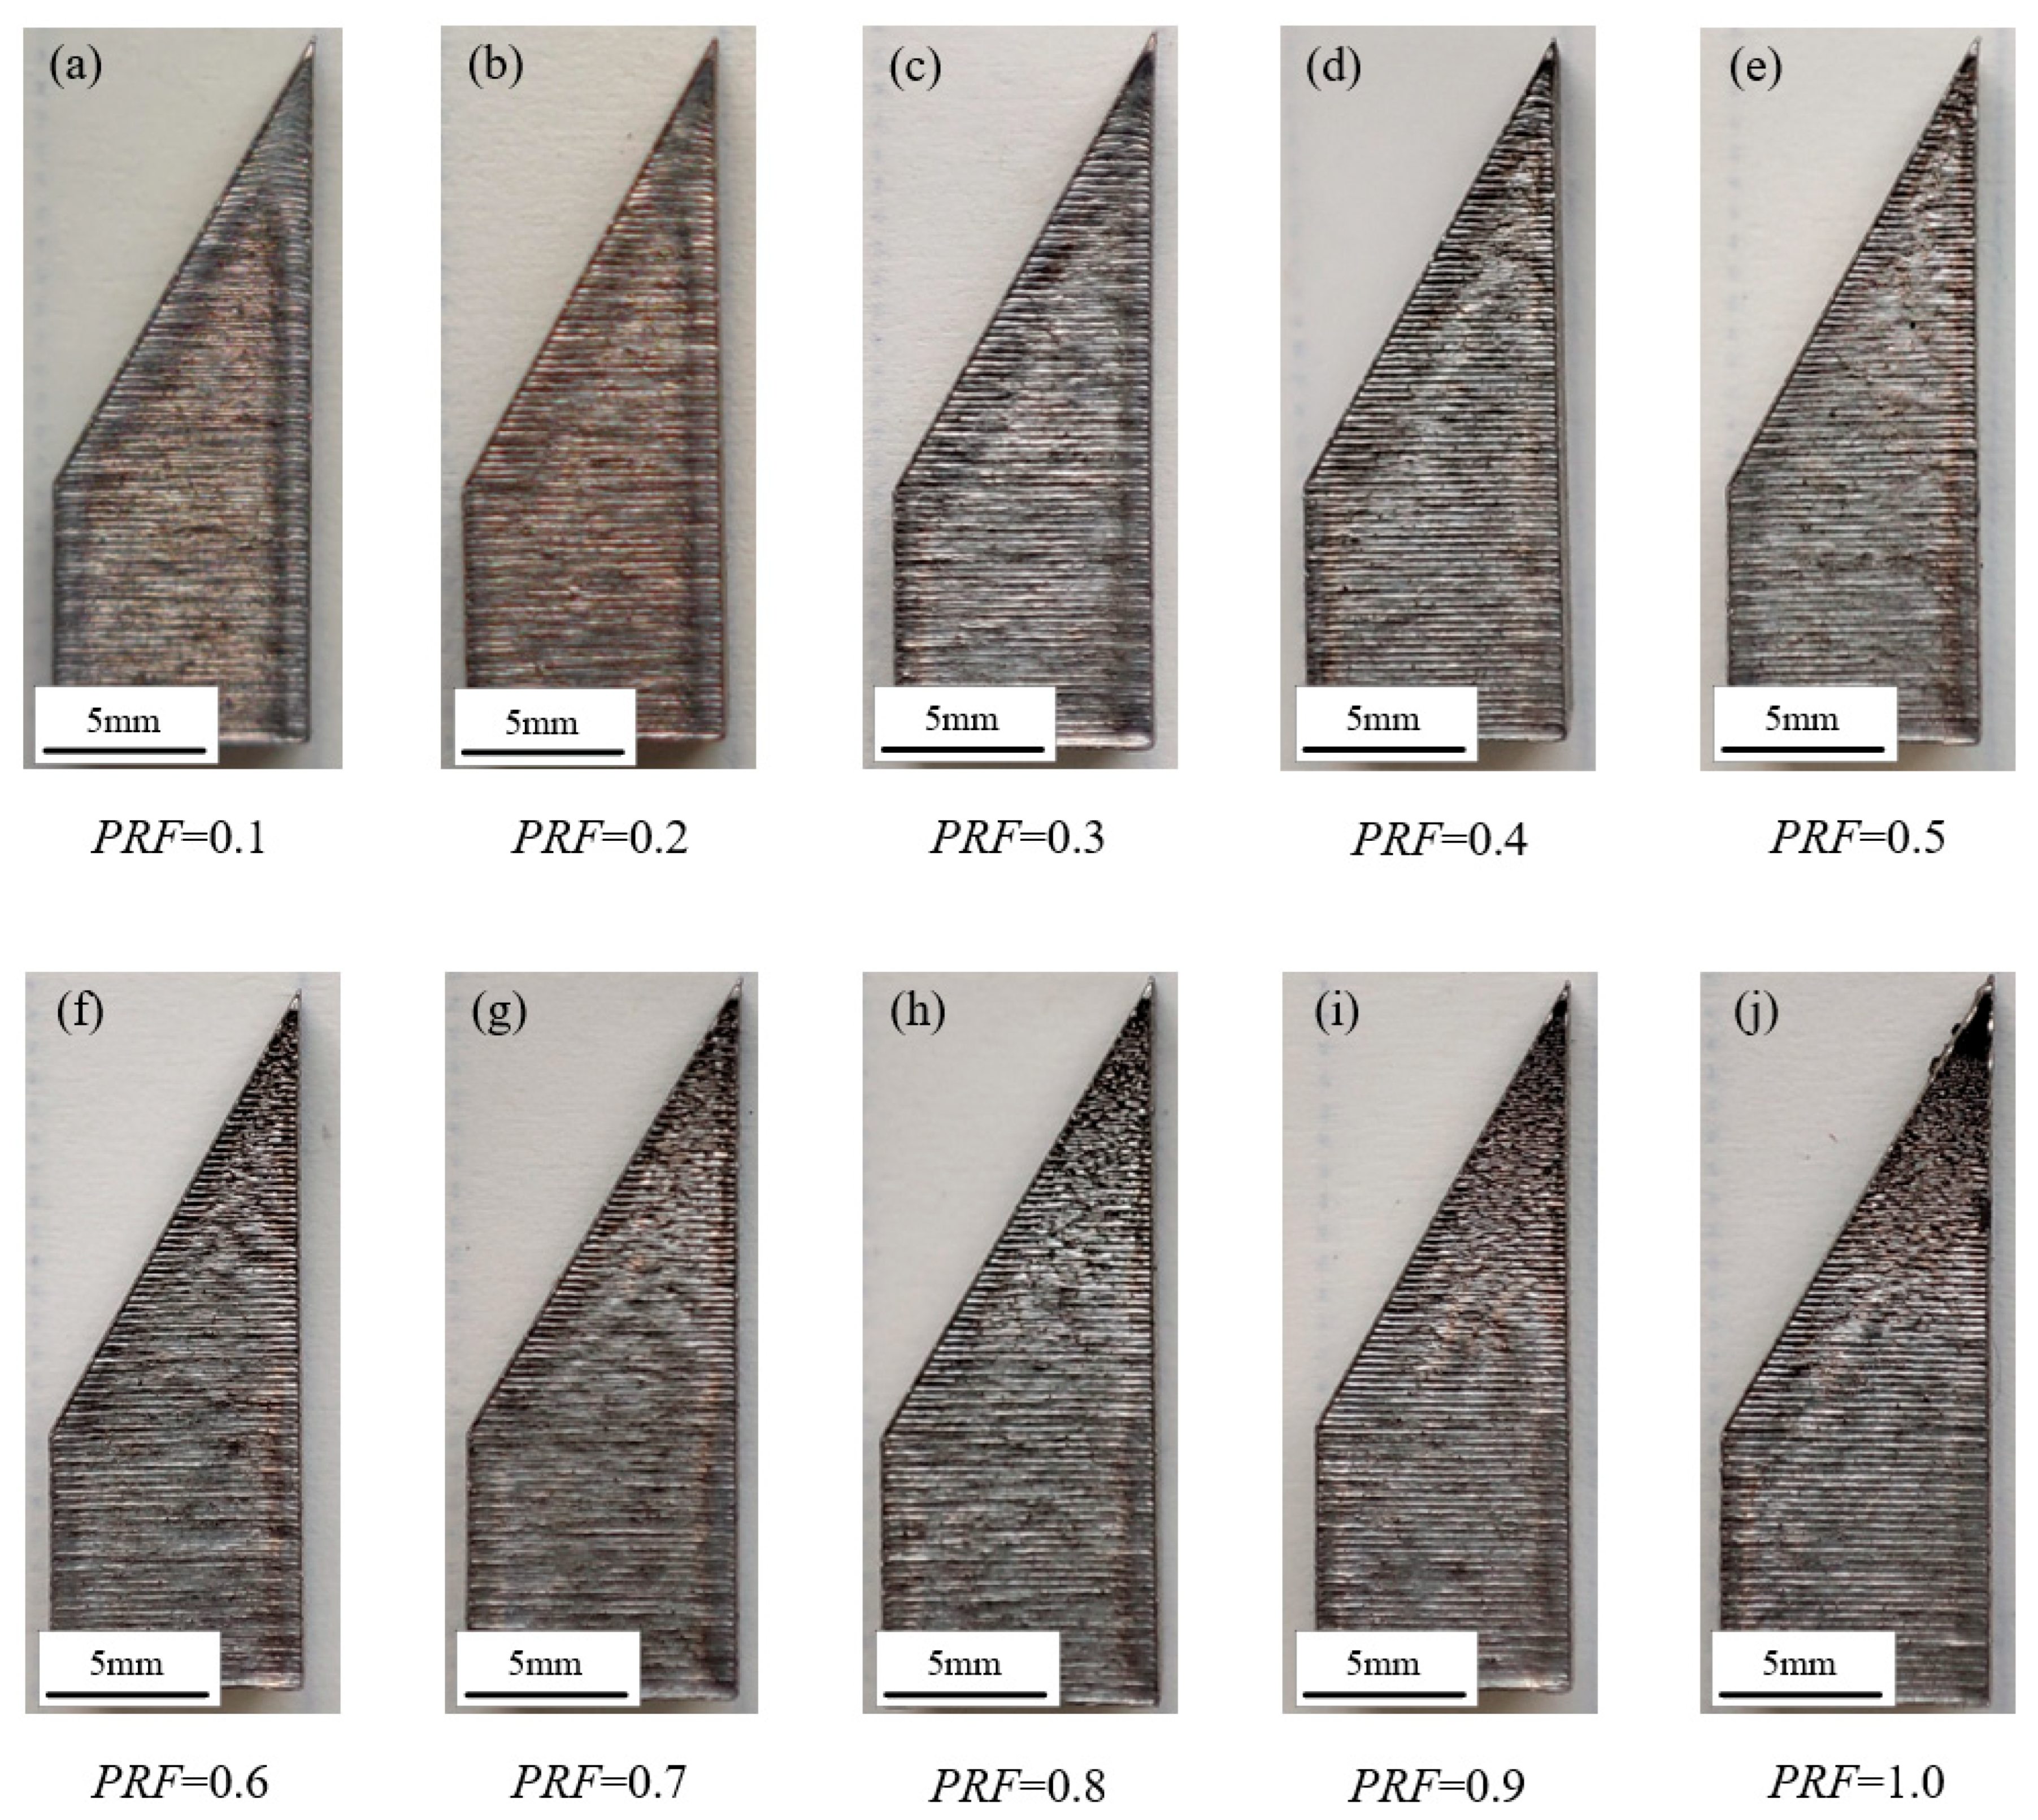
Figure 10 exhibits the panoramic top-surface morphologies of all 10 fabricated specimens, sequentially arranged according to their assigned PRF values. A macroscopic evaluation reveals that at lower PRF values (0.1 and 0.2), pronounced swelling defects are visible at the sharp apex. This indicates that the corresponding power reduction is insufficient to counteract the severe heat accumulation induced by the shortened scanning vectors. As the PRF increases to the 0.3–0.5 range, the apical swelling is significantly mitigated, and the surface topography closely mirrors the uniform, high-quality finish of the lower square region. Conversely, when the PRF exceeds 0.6, unmistakable lack-of-fusion defects begin to emerge at the apex. At an extreme PRF of 1.0, a significant unfused crater forms, demonstrating that an overly aggressive power reduction fails to provide the critical energy density required to completely melt the Inconel 718 powder.
Figure 10.
Panoramic top-surface morphologies of all 10 fabricated specimens: (a–j) specimens corresponding to PRF values ranging from 0.1 to 1.0, respectively.
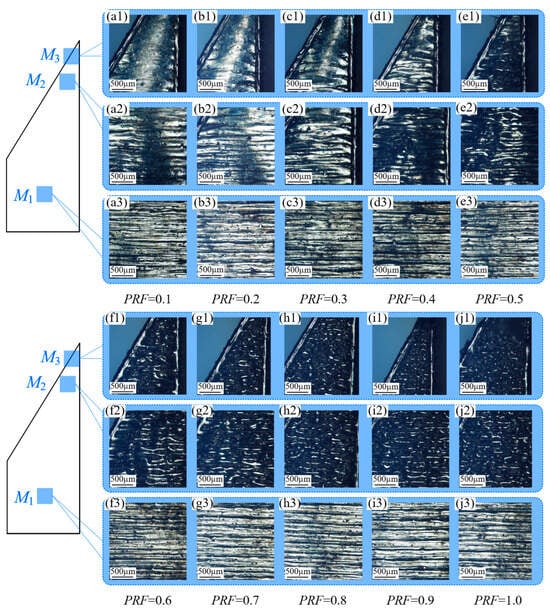
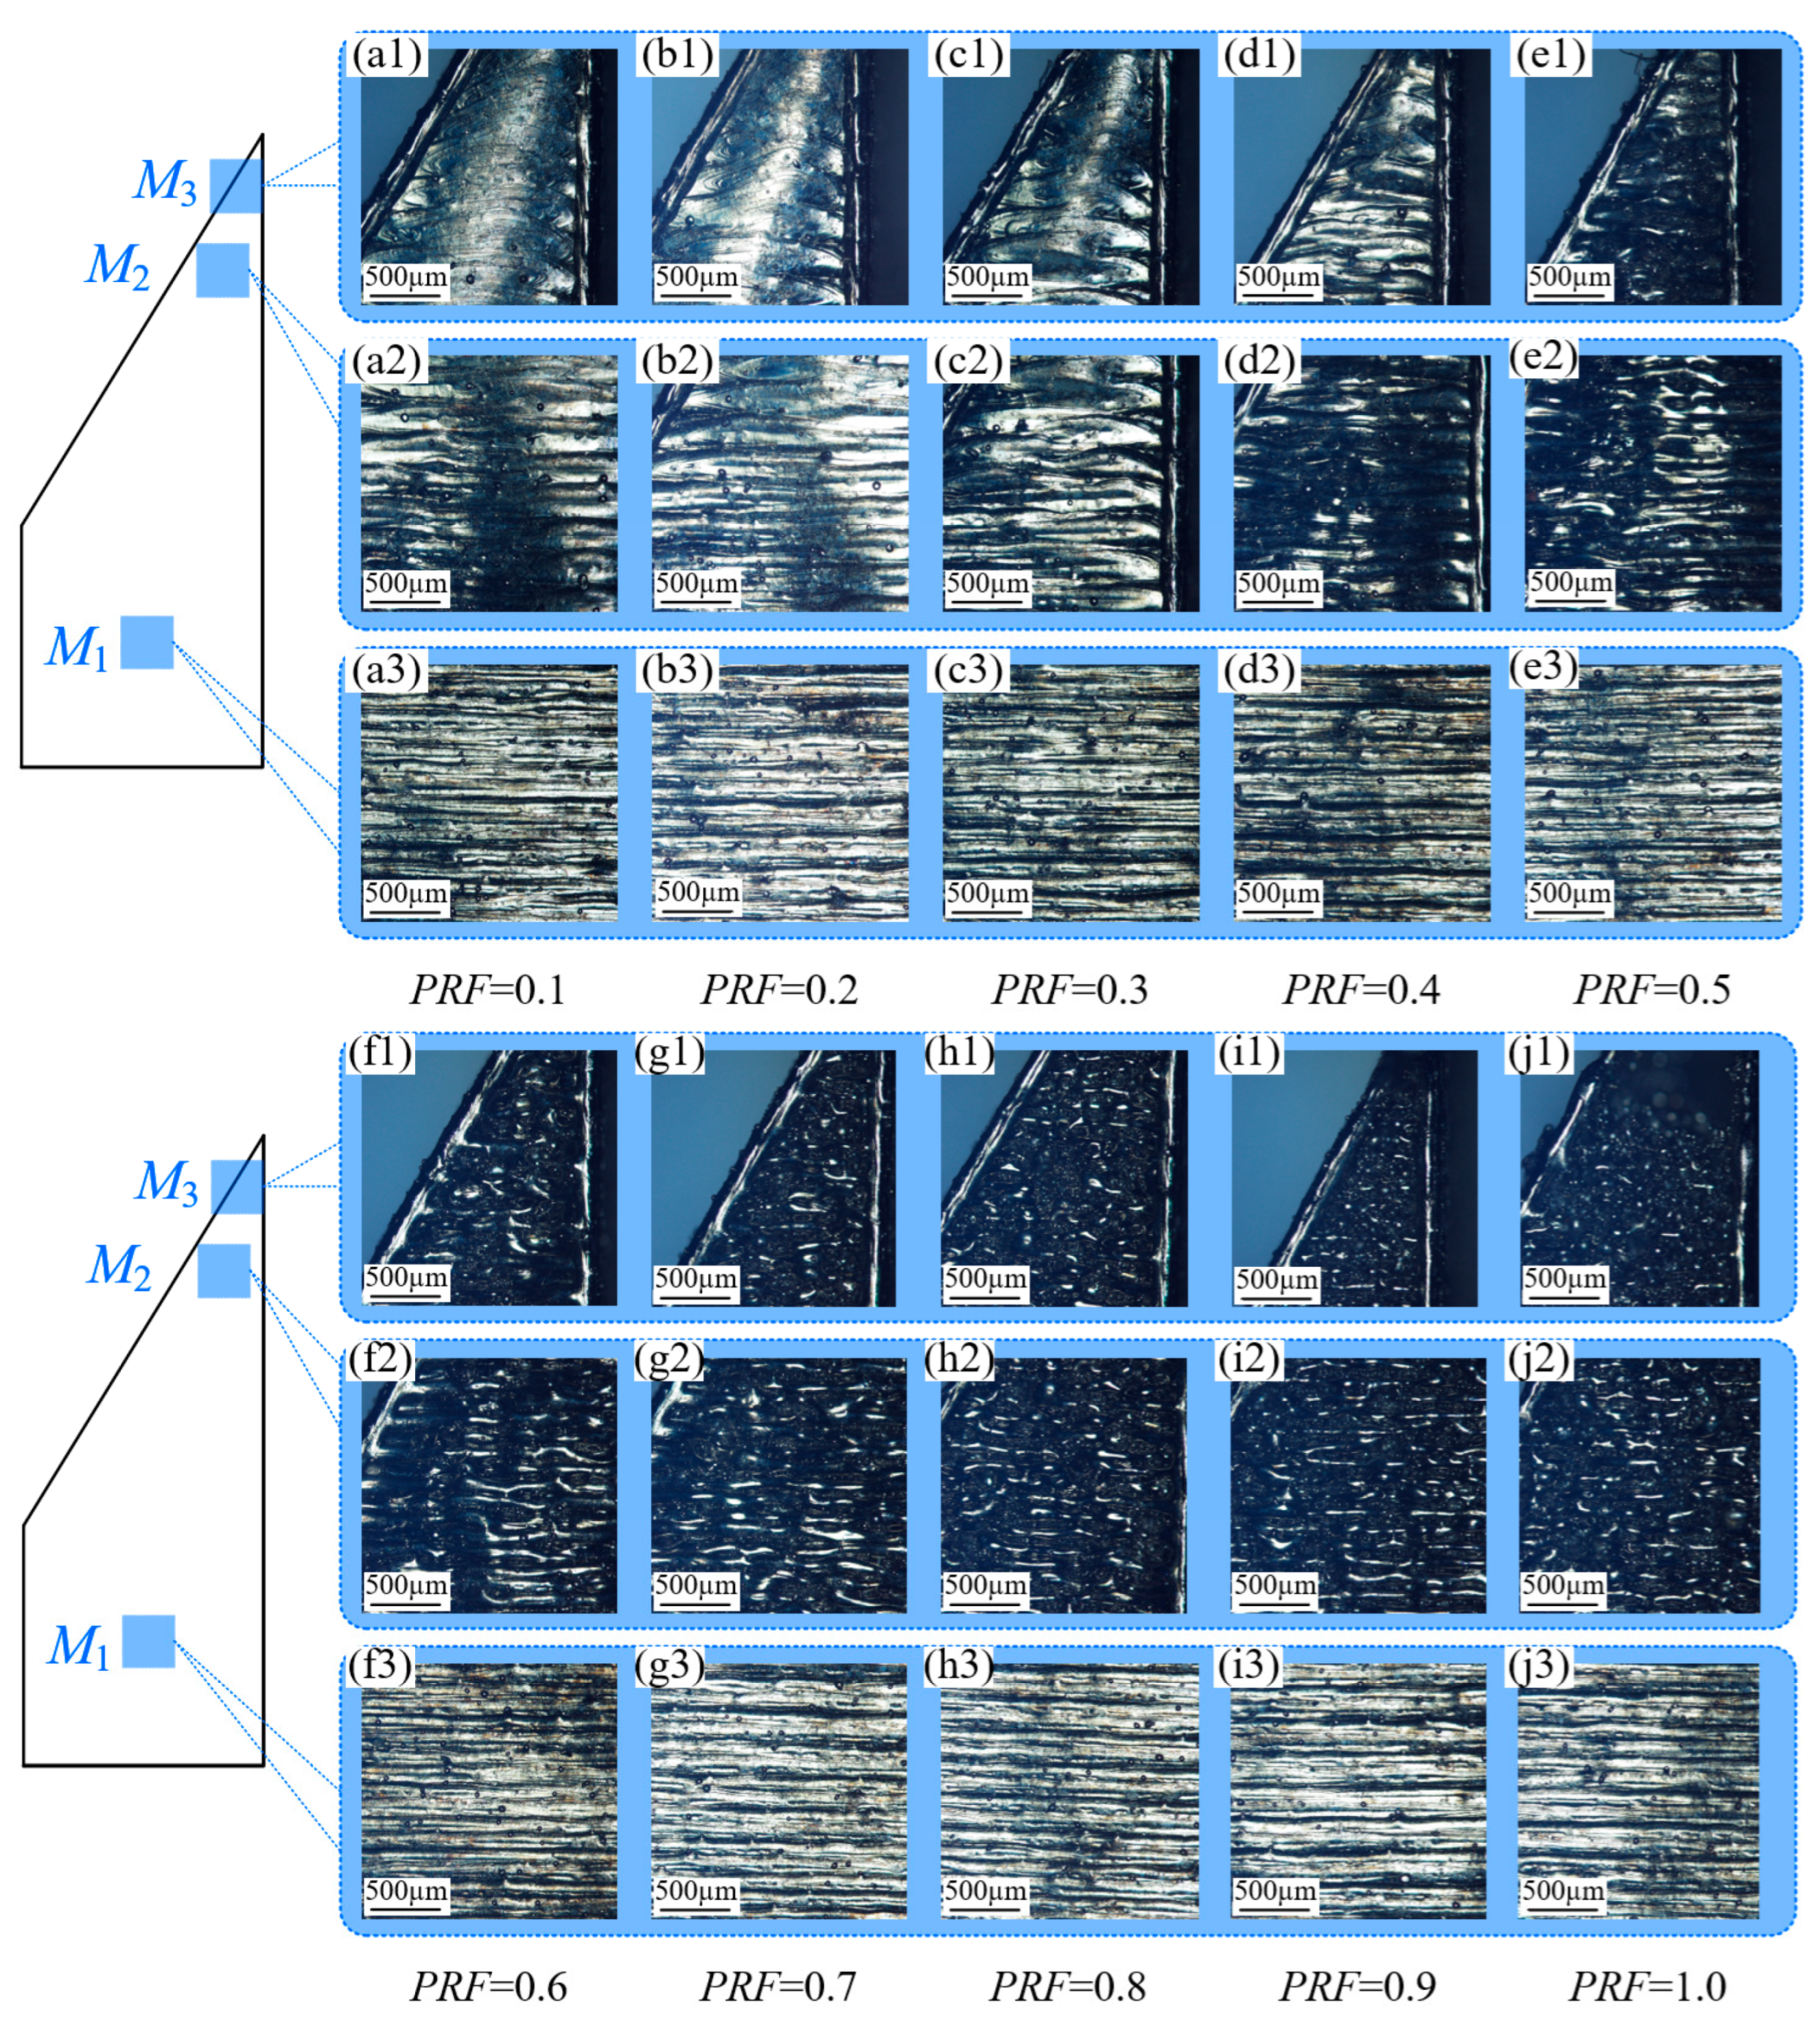
To pinpoint the optimal PRF value, ultra-depth-of-field microscopy was employed to conduct a mesoscopic examination of the localized melt tracks. As depicted in Figure 11, the melt tracks within the square regions of all specimens remain perfectly straight and dimensionally uniform. In stark contrast, the apical track morphologies exhibit extreme sensitivity to the PRF variations. A critical observation from Figure 11(a2) is that the overheating-induced swelling does not initiate precisely at the geometric boundary between the square and triangular regions; rather, it manifests only after the scanning vectors shorten beyond a critical threshold length. Beyond this threshold, the melt tracks progressively widen, and the surface profile gradually protrudes, culminating in severe swelling at the extreme apex (Figure 11(a1)).
Figure 11.
Ultra-depth-of-field magnified morphologies of different regions on the X-Y plane for specimens fabricated with PRF values ranging from 0.1 to 1.0. Panels (a1–j3) correspond to PRF = 0.1 to 1.0, respectively, where the numeric suffixes 1, 2, and 3 in each group denote Region M3, M2, and M1 (e.g., (a1–a3) represent Regions M3, M2, and M1 for PRF = 0.1).
Comparative analysis of the extreme apex (Region M3) across different specimens indicates that the morphological distortions improve as the PRF increases to 0.3. However, at PRF = 0.4, the tracks become twisted and discontinuous (Figure 11(d1)), indicating the onset of energy deficiency. As the PRF further increases to 0.9, the insufficient energy input leaves substantial volumes of un-melted powder, resulting in a conspicuous void (Figure 11(i1)). Interestingly, the sub-apex area (Region M2) presents a divergent thermal response.
Among the constant-PRF conditions tested, PRF = 0.3 provided the best overall apical surface quality, although local track instability (Figure 11(c2)) in the sub-apex region suggests that further improvement may require a non-linear or region-adaptive power-reduction profile. This localized discrepancy arises because the extreme heat accumulation at Region M3 inadvertently compensates for the lower laser energy input at PRF = 0.3. However, in Region M2, where heat accumulation is relatively less severe, a PRF of 0.3 excessively reduces the energy, leading to track instability. This critical finding suggests that achieving absolute global uniformity might necessitate a non-linear, adaptive power reduction strategy, for instance, applying a PRF of 0.3 at the extreme apex (Region M3) and a milder PRF of 0.2 at the sub-apex (Region M2).
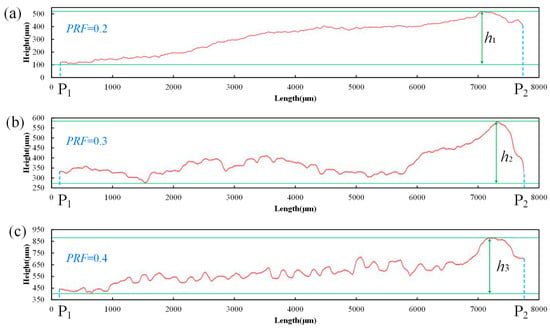
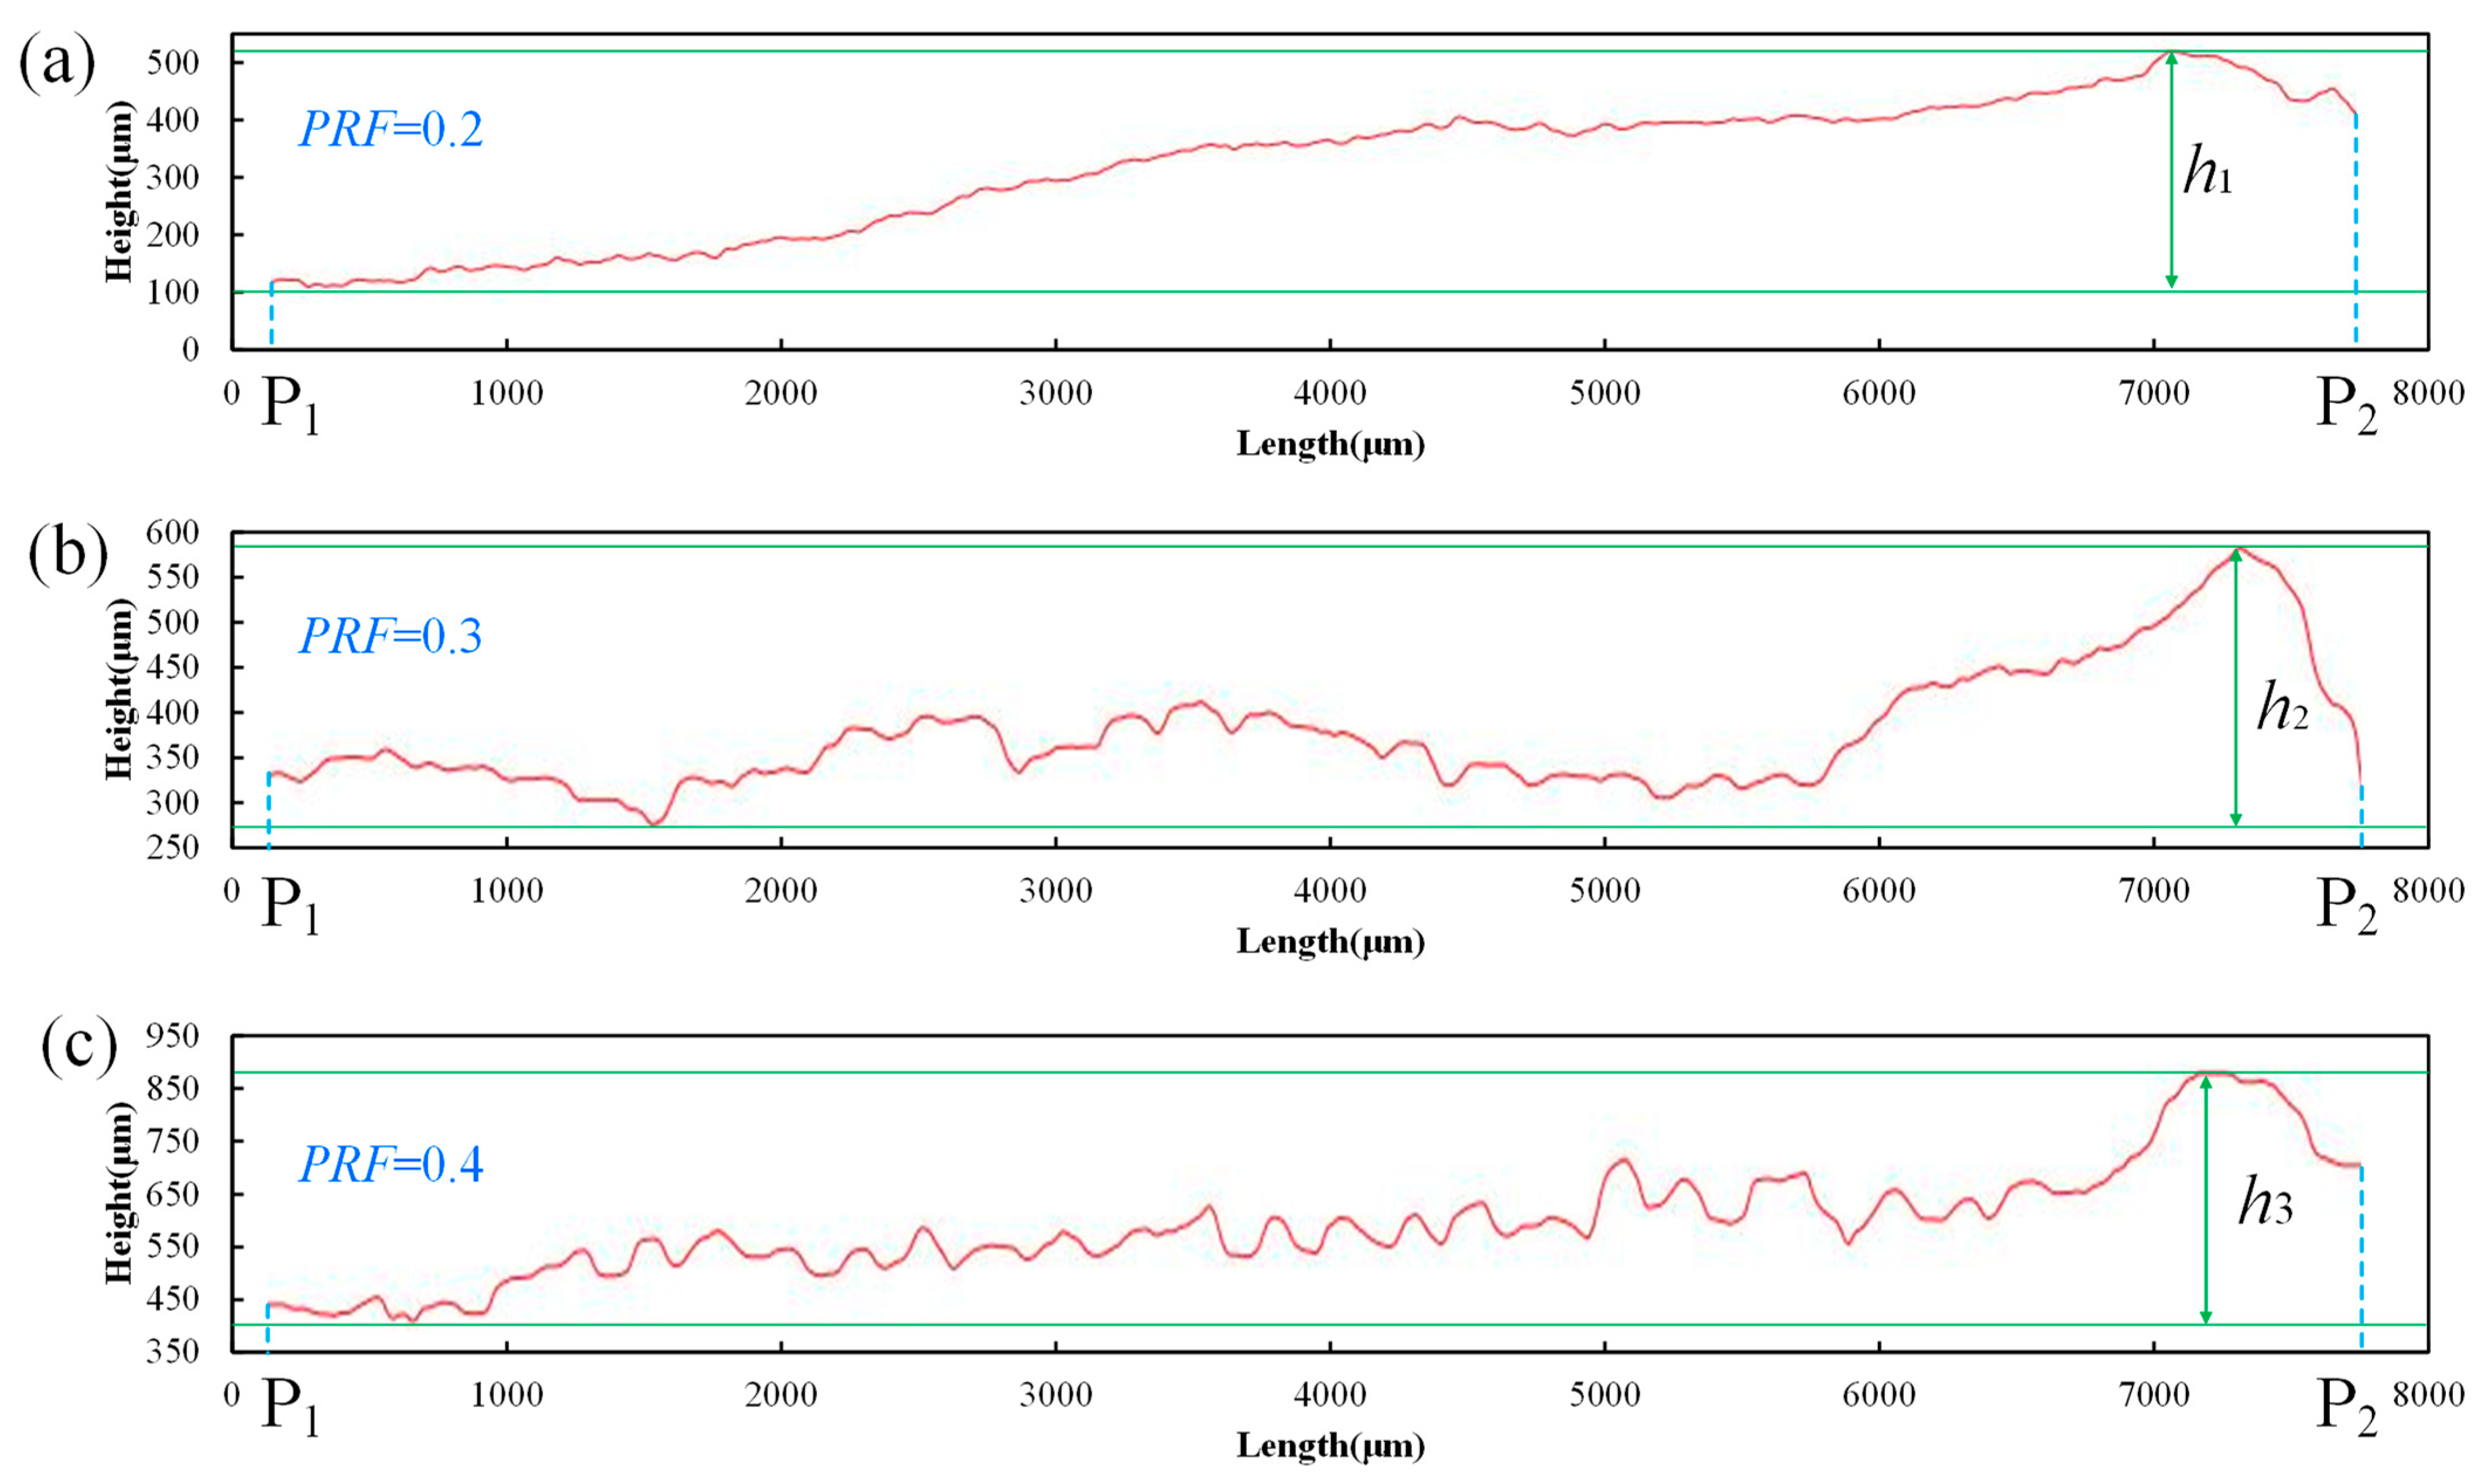
To quantify the local surface-height stability, the arithmetic mean roughness along (Figure 7a) was evaluated for PRF = 0.2, 0.3, and 0.4. The corresponding values were 10.36, 4.58, and 6.77 μm, respectively (Figure 12), confirming that PRF = 0.3 provided the lowest profile fluctuation among the compared conditions. The large isolated peak heights observed for PRF = 0.2 and 0.4 should not be interpreted as uniform errors in the overall build height. At PRF = 0.2, insufficient power attenuation led to localized overheating and swelling, producing a maximum profile height of 410.35 μm. At PRF = 0.4, the stronger power reduction promoted discontinuous track formation and partially fused particle agglomeration, resulting in sharp local peaks up to 532.15 μm. These two cases therefore represent different failure mechanisms, but both can degrade the local fidelity of the sharp-edged feature.
Figure 12.
Cross-sectional height profiles along line P1P2 at the apical region for evaluating the line roughness (Ra): (a) PRF = 0.2, (b) PRF = 0.3, and (c) PRF = 0.4.
It should be emphasized that the profiles in Figure 12 quantify local surface-height fluctuations along , rather than the deviation of the complete as-built edge contour from its nominal CAD geometry. The pronounced local protrusions under insufficient attenuation and the irregular peaks associated with excessive attenuation indicate that both thermal overload and energy deficiency can degrade local edge fidelity. A full-field CAD-to-as-built comparison, including contour deviation and apex-angle error, remains an important direction for future validation.
5.2.2. Microhardness Distribution
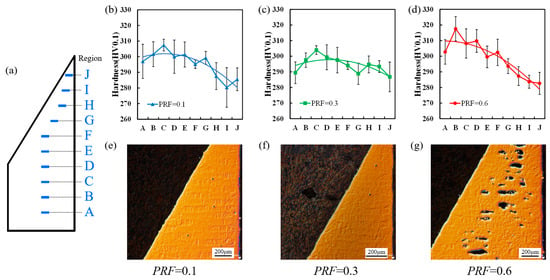
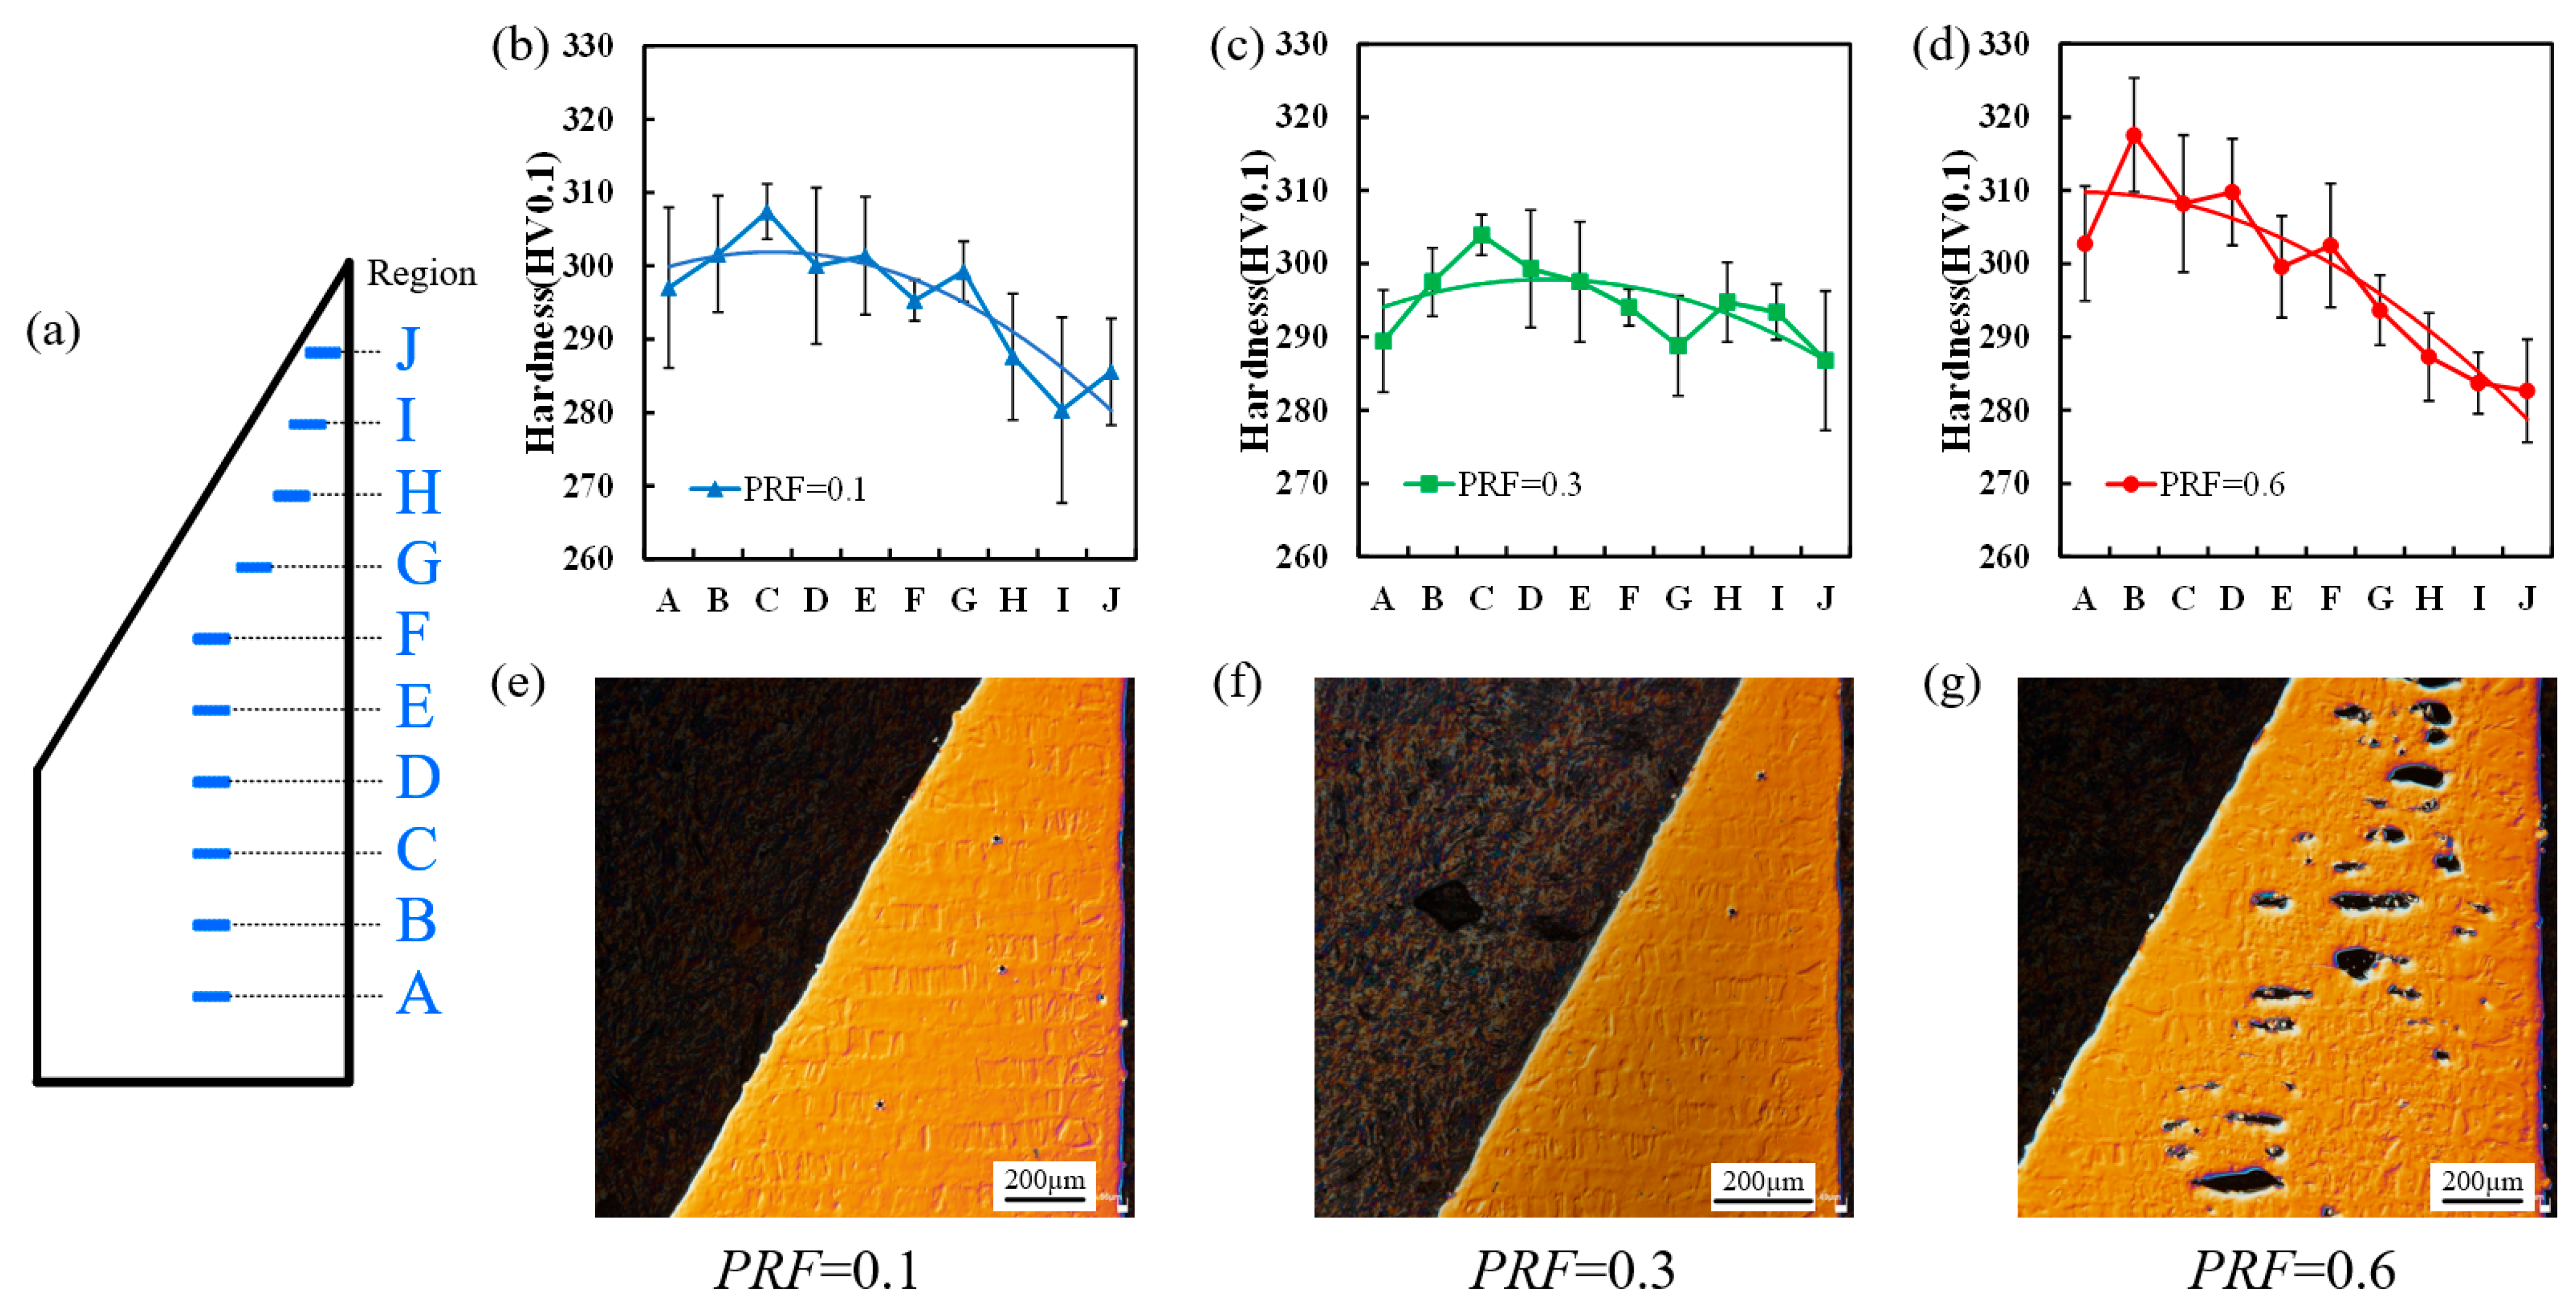
Figure 13a delineates the localized regions selected for microhardness profiling, with measurements confined within the highlighted red boundary. Figure 13b–d map the spatial hardness distribution curves across the top surfaces of specimens fabricated with PRF values of 0.1, 0.3, and 0.6. The superimposed trend lines explicitly reveal that the active energy modulation strategy dictates the spatial homogeneity of the mechanical properties. Strikingly, under the optimal PRF = 0.3, the surface microhardness remains highly stable and uniformly distributed from the square base all the way to the extreme apex, consistently plateauing above 290 HV0.1. This verifies that appropriate energy modulation promotes the mechanical performance across complex geometries.
Figure 13.
Microhardness distribution and polished surface morphologies of the fabricated specimens: (a) designated regions for microhardness profiling; (b–d) spatial hardness distribution curves measured within the highlighted region for PRF values of 0.1, 0.3, and 0.6, respectively; (e–g) macroscopic morphologies of the top surfaces after polishing.
In sharp contrast, the apical hardness for both PRF = 0.1 and PRF = 0.6 suffers a drastic degradation, albeit driven by entirely distinct metallurgical and physical mechanisms. For the PRF = 0.1 specimen, a precipitous hardness drop, falling below 290 HV0.1, initiates post-Region G and severely manifests at Region I (Figure 13b). This metallurgical deterioration is fundamentally attributed to the unresolved heat accumulation caused by insufficient power reduction. The excessive thermal buildup flattens the localized temperature cooling gradient, thereby prolonging the solidification window. This extended cooling duration invariably promotes coarsening of the cellular dendritic substructure and heterogeneous solidification features and the formation of heterogeneous microstructures, culminating in the observed drop in hardness at the apical protrusion.
Conversely, for the PRF = 0.6 specimen, the hardness deterioration initiates much earlier, plummeting from Region F to G (Figure 13d). This decline is physically driven by extreme energy deficiency. At PRF = 0.6, the actively reduced laser power drops below the critical threshold required for complete powder fusion, generating significant lack-of-fusion porosities at the apex, as corroborated by Figure 13g. These internal voids compromise the structural densification of the material, leading to a premature and severe reduction in hardness. The earlier onset of this degradation (at Region G) aligns perfectly with the fact that laser power attenuation starts to become critically insufficient at this specific scanning length.
5.3. Cellular Dendritic Substructure and PDAS Evolution
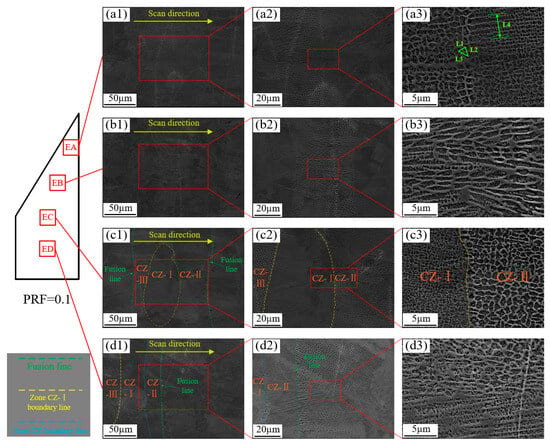
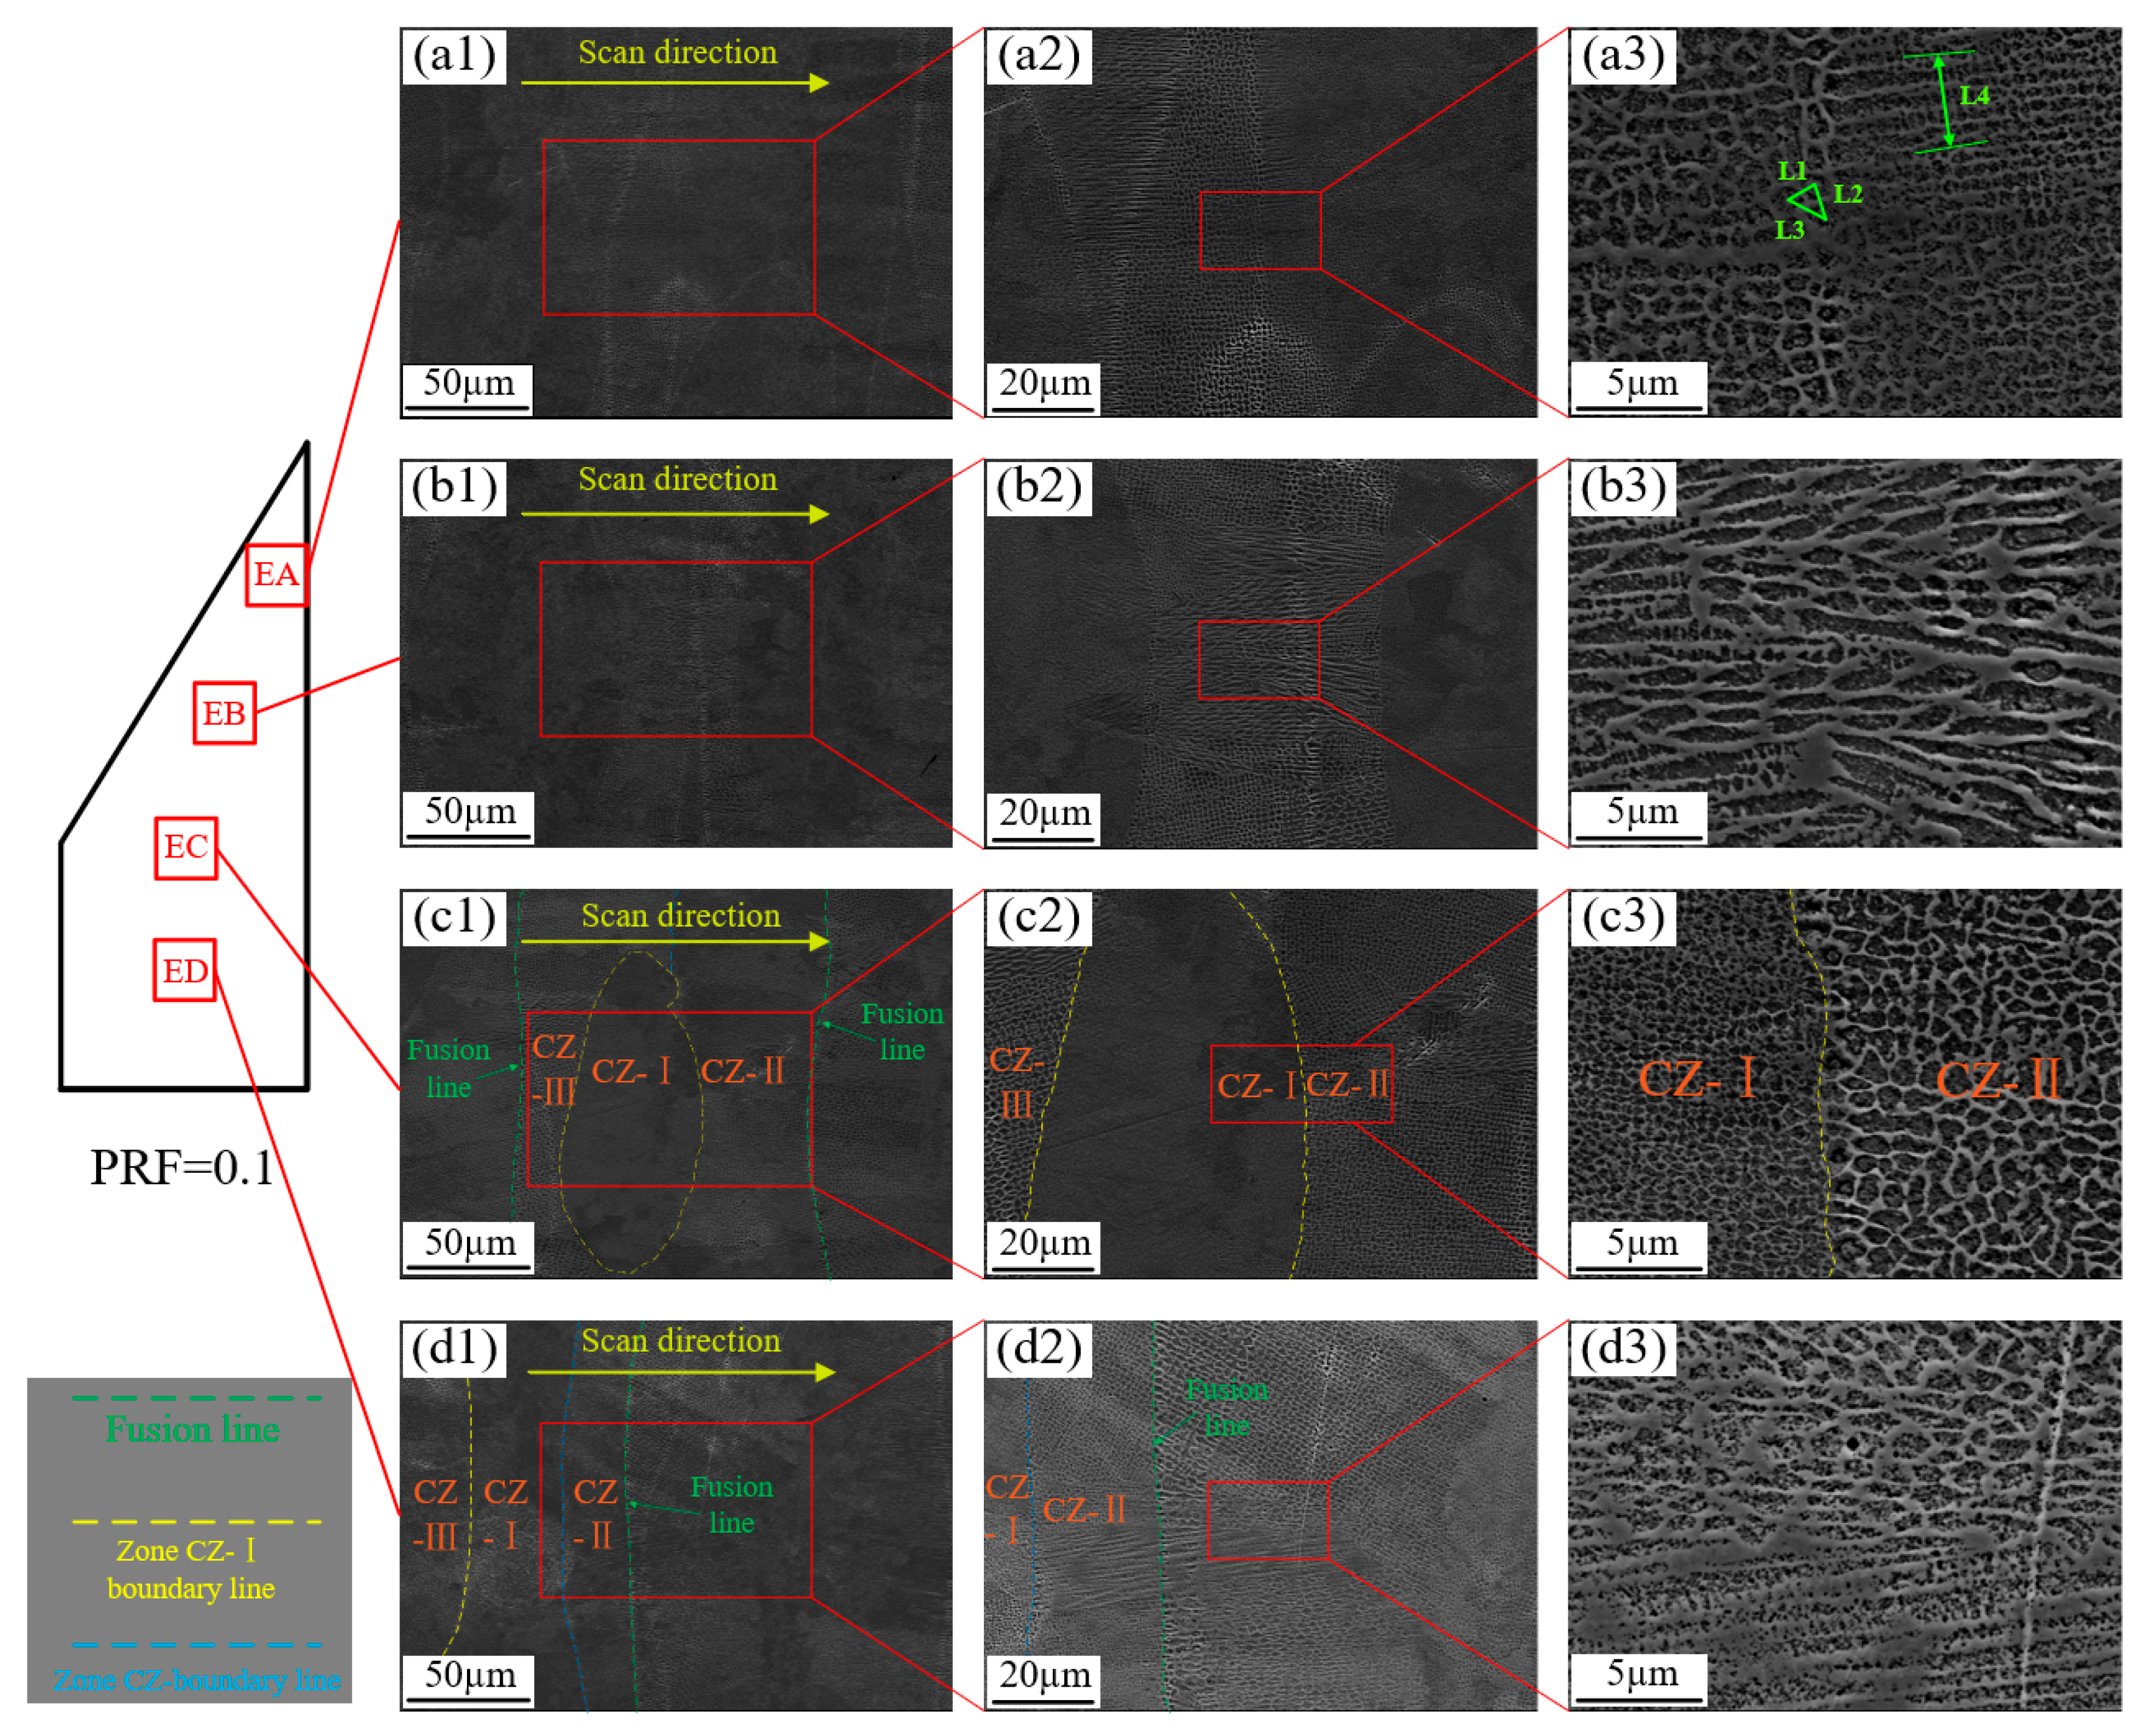
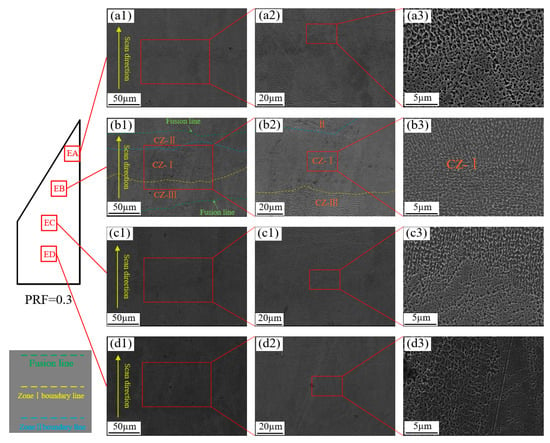
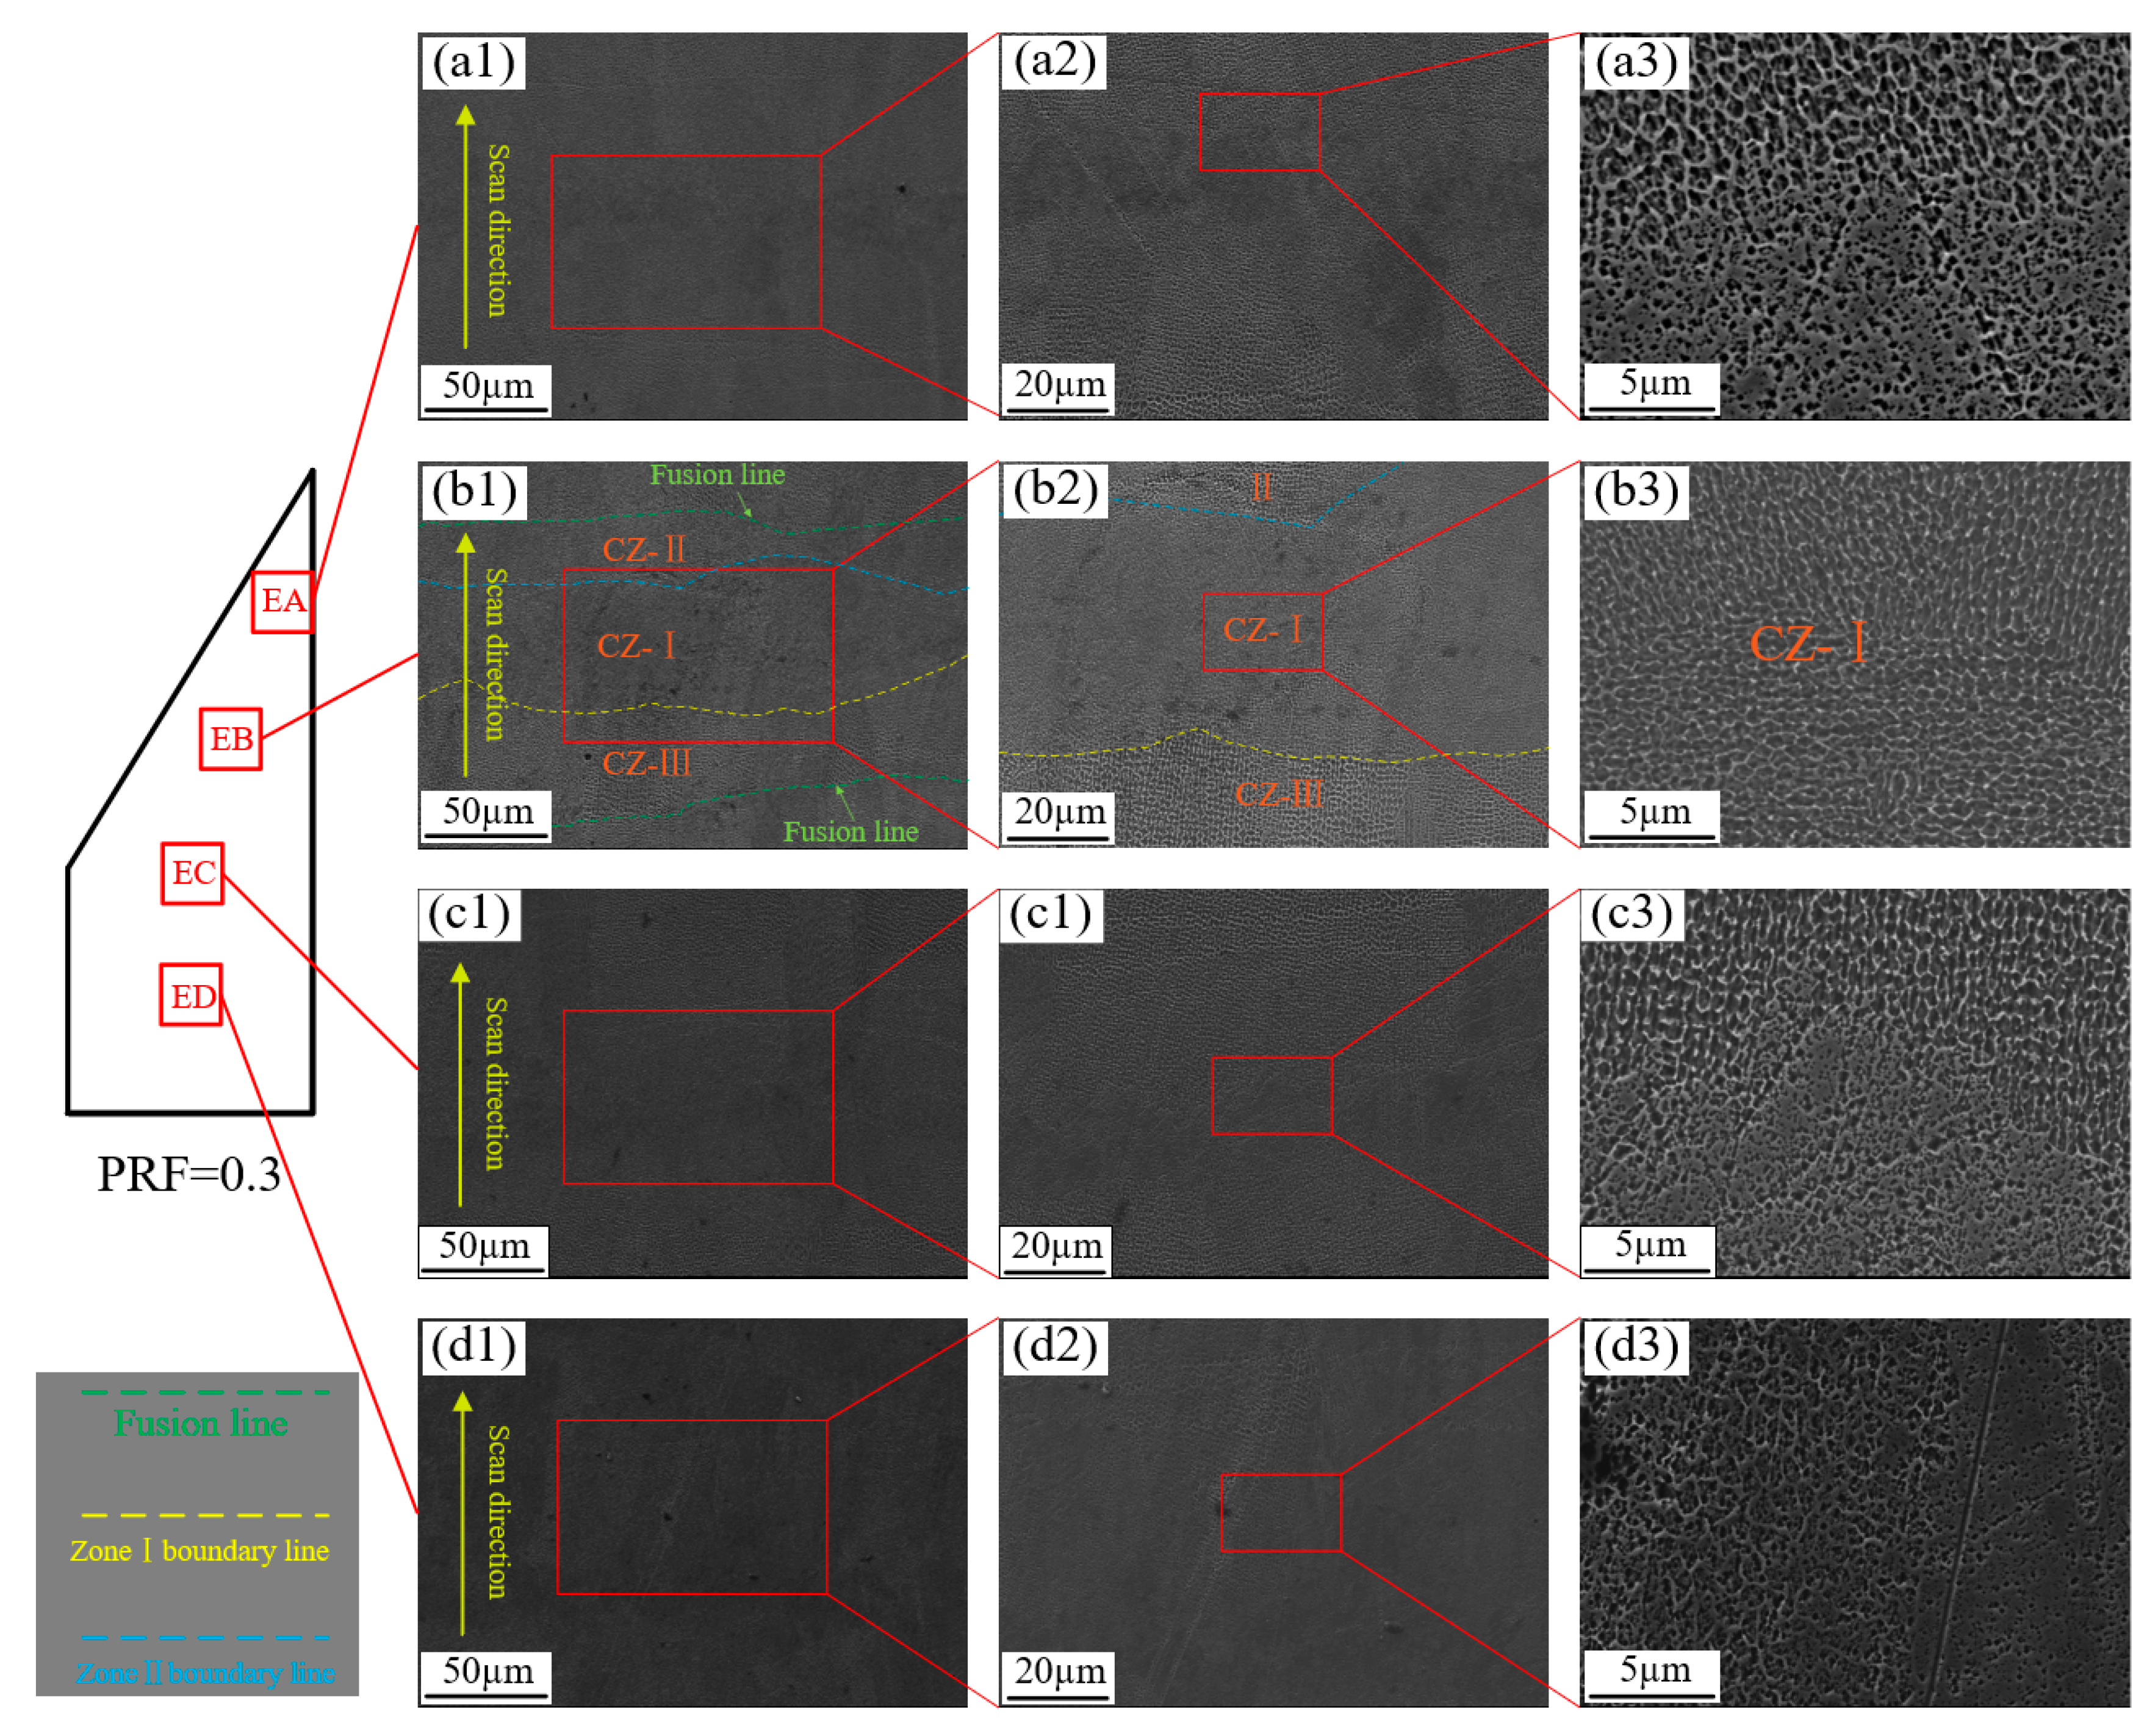
Figure 14 and Figure 15 display the high-resolution SEM micrographs of the X-Y planes for specimens fabricated with PRF values of 0.1 and 0.3. Abundant cellular structures are observed across the melt tracks. In these micrographs, the darker cellular cores are encapsulated by brighter intercellular segregation networks. Although this stark visual contrast might subjectively suggest varying crystallographic orientations, both regions intrinsically possess the identical face-centered cubic (FCC) crystal structure characteristic of the deposited Inconel 718 gamma (γ) matrix. This distinctive contrast originates from the localized elemental partitioning during the highly non-equilibrium solidification process, where heavy elements, primarily Nb and Ti, preferentially segregate into the intercellular regions (the brighter areas). Consequently, during chemical etching, the etchant selectively and more aggressively attacks the solute-depleted dendritic cores (the darker areas) compared to the solute-enriched segregation bands.
Figure 14.
SEM micrographs of the cellular dendritic substructures on the X–Y plane of the specimen fabricated with PRF = 0.1: (a1–d3) correspond to four representative sampling regions, EA, EB, EC, and ED, along the sharp-edged geometry. The numbered subpanels in each group show enlarged views of individual melt tracks and their internal cellular features.
Figure 15.
SEM micrographs of the cellular dendritic substructures on the X–Y plane of the specimen fabricated with PRF = 0.3: (a1–d3) correspond to four representative sampling regions, EA, EB, EC, and ED, along the sharp-edged geometry. The numbered subpanels in each group show enlarged views of individual melt tracks and their internal cellular features.
The spatial dimensions of these cellular structures exhibit profound intra-track heterogeneity. As illustrated in Figure 14(c1), a single melt track can be distinctly demarcated into three specific zones based entirely on cellular dimensions: Region CZ-III (the coarsest cells), Region CZ-I (the finest cells), and Region CZ-II (intermediate cells). Interestingly, Region CZ-I exhibits two morphological distributions: it either manifests as an elliptical zone embedded between Regions CZ-II and CZ-III (Figure 14(c1)) or as an elongated band longitudinally dividing the track into three distinct segments (Figure 14(d1)).
A similar intra-track heterogeneity is observed in the PRF = 0.3 specimen (Figure 15). Across both PRF conditions, the most consistent microstructural feature is the coexistence of three cellular-size zones within individual melt-track regions: Region CZ-I exhibits the finest cellular spacing, Region CZ-III the coarsest spacing, and Region CZ-II an intermediate scale. This hierarchy is considerably more pronounced than the variation observed among the macroscopic sampling locations along the sharp-edged geometry. The repeated occurrence of these zones suggests that local solidification conditions vary within and between overlapping melt tracks.
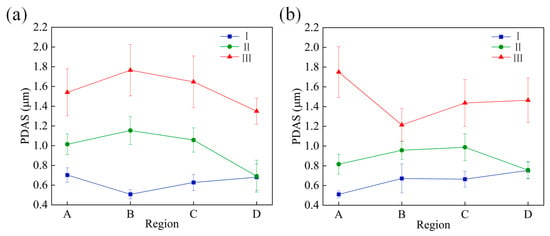
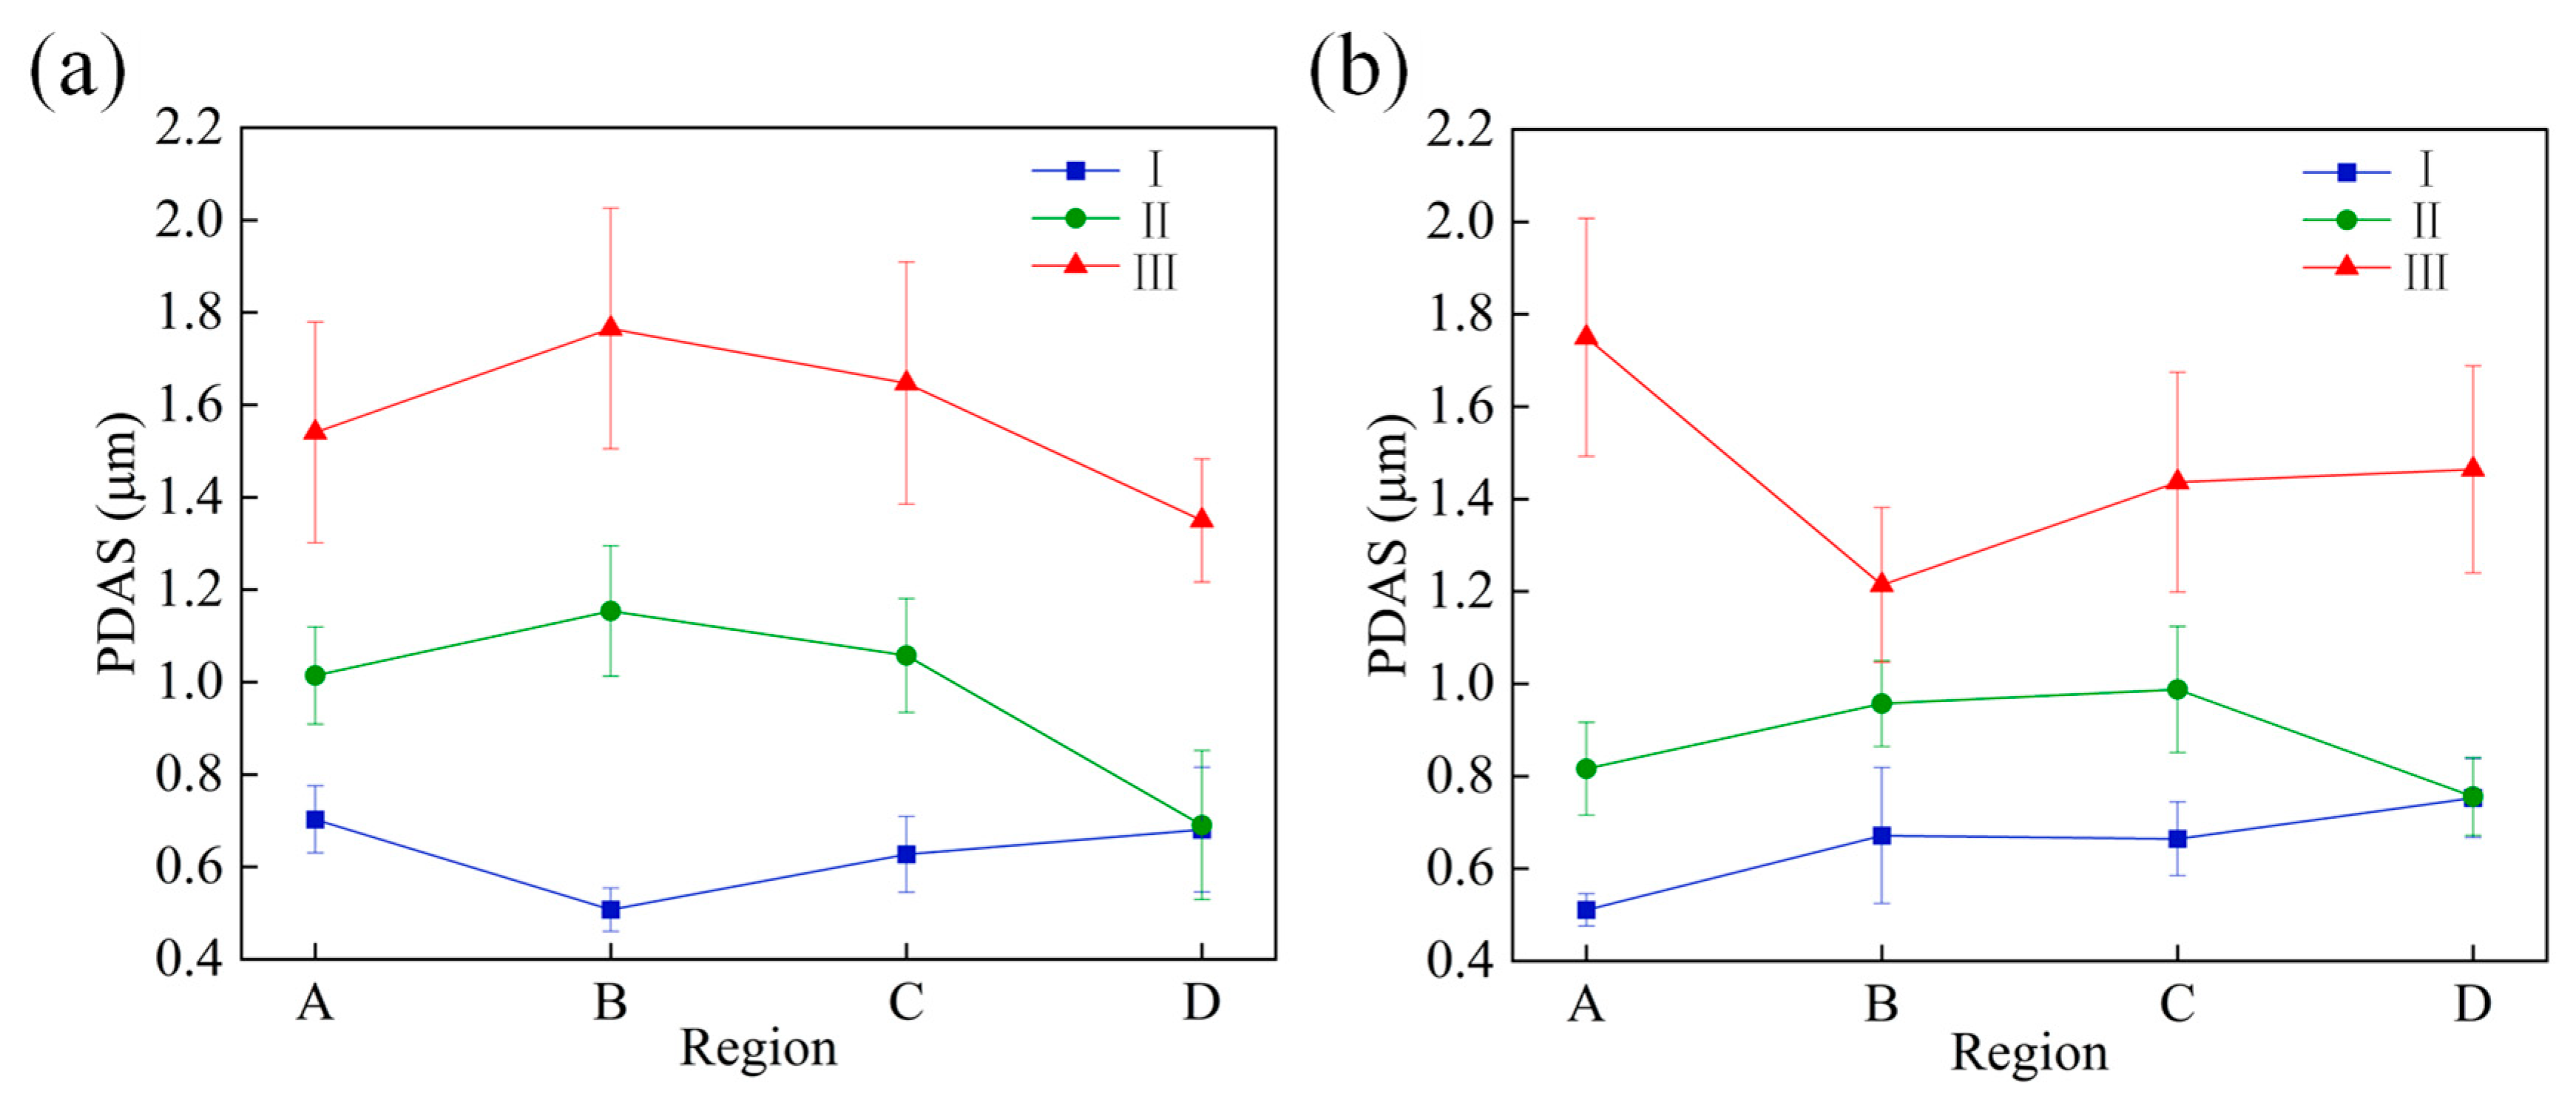
To quantitatively ascertain the influence of the active laser power attenuation on the microstructural evolution, the primary dendrite arm spacing (PDAS, µm) was systematically measured across four distinct regions (EA, EB, EC, and ED). To ensure morphological accuracy, the PDAS for equiaxed cells was calculated by averaging three orthogonal dimensions (L1, L2, L3), whereas for columnar cells, it was derived by averaging the linear distance spanning five adjacent cells (L4).
The quantitative PDAS analysis in Figure 16 was performed on the cellular structures directly observed in the representative SEM micrographs shown in Figure 14 and Figure 15. These experimental micrographs therefore provide the morphological basis for distinguishing the three intra-track cellular zones used in the PDAS statistics. Across the investigated sampling locations, the most robust quantitative feature is the ordering PDASI < PDASII < PDASIII. By comparison, the changes in PDAS among sampling locations EA–ED are less pronounced and are not uniformly monotonic for all three cellular regions. Some location-dependent variation is visible, particularly toward the EA–EB portion of the sharp-edged region, but its magnitude is smaller than the separation among Regions CZ-I–CZ-III. Therefore, the PDAS results support a modest influence of local power attenuation and spatial thermal history on cellular-scale heterogeneity, rather than a strict one-to-one dependence of PDAS on position or laser power.
Figure 16.
PDAS evolution under PRF-based active energy modulation: (a) PDAS statistics of cellular Regions CZ-I–CZ-III at sampling locations A–D for the specimen fabricated with PRF = 0.1; (b) corresponding PDAS statistics for PRF = 0.3.
5.4. Transferability to Layer-Rotated Scan Strategies and Complex Geometries
The present experiments intentionally maintained an identical hatch orientation across all layers to isolate the thermal consequence of progressive scan-vector shortening. Therefore, the PRF value identified here should not be interpreted as a universal parameter for arbitrary scan rotations or component geometries. For a layer-wise rotated strategy, the proposed framework can in principle be implemented by recalculating the vector length for each hatch vector in each layer , after intersection of the rotated hatch pattern with the local slice contour. The corresponding vector power can then be assigned from the PRF relation . In this sense, the modulation rule follows the layer-specific local geometry rather than a fixed global orientation.
However, scan rotation simultaneously changes the spatial distribution of short vectors, the thermal interaction with the preceding layer, local scan sequence, and heat-dissipation boundary conditions. Consequently, neither the optimal PRF = 0.3 identified for the present specimen nor a single linear power-reduction gradient can be assumed to transfer directly to real parts. Practical application would require layer-wise vector recalculation together with geometry- and process-specific calibration, and may benefit from region-adaptive or non-linear power modulation. The present configuration should therefore be regarded as a controlled validation case for the proposed geometry-informed framework rather than a universal parameter set.
6. Conclusions
This study developed and validated a geometry-informed active energy modulation strategy to mitigate localized heat accumulation during the LPBF fabrication of sharp-edged Inconel 718 components. The PRF-based framework quantitatively linked laser-power attenuation with the progressive shortening of scanning vectors and was shown to improve thermal stability, surface integrity and local microstructural-mechanical uniformity. The main conclusions are summarized as follows:
- (1)
- Coupled DEM–CFD simulations confirmed that adjacent-track thermal history can substantially intensify melt-pool overheating and morphological distortion under constant laser power. Reducing the laser power in the heat-accumulation-prone region lowered the peak temperature and restricted excessive melt-pool expansion, demonstrating the feasibility of active power attenuation for stabilizing local melt-pool behavior.
- (2)
- In situ coaxial photodiode monitoring revealed that heat accumulation at the sharp apex intensified progressively with increasing build layers when the power reduction was insufficient. Increasing the PRF effectively reduced the high-intensity overheated zone, indicating that geometry-informed laser power modulation can suppress the cumulative thermal imbalance induced by scan-vector shortening.
- (3)
- The surface morphology, roughness and microhardness results identified PRF = 0.3 as the most favorable modulation condition among the tested parameters. At lower PRF values, insufficient power reduction caused overheating-induced swelling and hardness degradation near the apex. At higher PRF values, excessive power attenuation led to track instability and lack-of-fusion defects. In contrast, PRF = 0.3 minimized apical surface roughness and maintained a relatively uniform microhardness distribution above 290 HV0.1 across the specimen.
- (4)
- Microstructural characterization revealed a persistent intra-track hierarchy in cellular dendritic scale, with Region CZ-I exhibiting the smallest PDAS, Region CZ-III the largest, and Region CZ-II intermediate values. By comparison, the PDAS variations among sampling locations along the sharp-edged geometry were less pronounced. The partial convergence of cellular scales at selected apical locations suggests that local power attenuation and thermal history modify cellular-scale heterogeneity.
The PRF-based active energy modulation strategy provides a quantitative route for balancing local energy input and heat dissipation in sharp-edged LPBF geometries without introducing additional cooling delays. Although the optimal PRF value depends on the material system, geometry and processing window, the proposed framework may be extended to other alloys and complex features through targeted calibration and validation.
Author Contributions
Conceptualization, Q.Z., X.D. and S.G.; Methodology, Q.Z., K.W. and S.G.; Software, K.W.; Validation, S.G., D.Z. and S.Z.; Formal analysis, Q.Z. and K.W.; Investigation, Q.Z., D.Z. and S.Z.; Resources, X.D. and S.G.; Data curation, Q.Z., D.Z. and S.Z.; Writing—original draft, Q.Z.; Writing—review & editing, X.D., K.W. and S.G.; Visualization, K.W.; Supervision, X.D. and S.G.; Project administration, X.D.; Funding acquisition, X.D. All authors have read and agreed to the published version of the manuscript.
Funding
This research was funded by National Natural Science Foundation of China under Grant No. 52575593.
Data Availability Statement
The original contributions presented in this study are included in the article material. Further inquiries can be directed to the corresponding authors.
Conflicts of Interest
The authors declare no conflicts of interest.
References
- Mukherjee, T.; Elmer, J.W.; Wei, H.L.; Lienert, T.; Zhang, W.; Kou, S.; DebRoy, T. Control of grain structure, phases, and defects in additive manufacturing of high-performance metallic components. Prog. Mater. Sci. 2023, 138, 101153. [Google Scholar] [CrossRef] [Scilit]
- Volpato, G.M.; Tetzlaff, U.; Fredel, M.C. A comprehensive literature review on laser powder bed fusion of Inconel superalloys. Addit. Manuf. 2022, 55, 102871. [Google Scholar] [CrossRef] [Scilit]
- Piglione, A.; Attard, B.; Rielli, V.V.; Maldonado, C.-T.S.; Attallah, M.M.; Primig, S.; Pham, M.-S. On the constitutive relationship between solidification cells and the fatigue behaviour of IN718 fabricated by laser powder bed fusion. Addit. Manuf. 2021, 47, 102347. [Google Scholar] [CrossRef] [Scilit]
- Banait, S.; Liu, C.; Campos, M.; Pham, M.; Pérez-Prado, M. Effect of microstructure on the effectiveness of hybridization on additively manufactured Inconel 718 lattices. Mater. Des. 2023, 236, 112484. [Google Scholar] [CrossRef] [Scilit]
- Meng, G.; Gong, Y.; Zhang, J.; Jiang, Z.; Ren, Q.; Zhao, J. Microstructure and mechanical properties of Inconel 718 thin walls prepared by laser direct energy deposition and selective laser melting. Thin-Walled Struct. 2023, 193, 111284. [Google Scholar] [CrossRef] [Scilit]
- Promoppatum, P.; Yao, S.C. Influence of scanning length and energy input on residual stress reduction in metal additive manufacturing: Numerical and experimental studies. J. Manuf. Process. 2020, 49, 247–259. [Google Scholar] [CrossRef] [Scilit]
- Liu, Y.; Li, J.; Xu, K.; Cheng, T.; Zhao, D.; Li, W.; Teng, Q.; Wei, Q. An optimized scanning strategy to mitigate excessive heat accumulation caused by short scanning lines in laser powder bed fusion process. Addit. Manuf. 2022, 60, 103256. [Google Scholar] [CrossRef] [Scilit]
- Chaudry, M.A.; Mohr, G.; Hilgenberg, K. Experimental and numerical comparison of heat accumulation during laser powder bed fusion of 316L stainless steel. Prog. Addit. Manuf. 2022, 7, 1071–1083. [Google Scholar] [CrossRef] [Scilit]
- Duan, X.; Long, T.; Zhu, K.; Li, W.; Fuh, Y.H.J. Formation mechanism of pore defects and surface ripples under different process parameters via laser powder bed fusion by numerical simulation and experimental verification. Int. J. Adv. Manuf. Technol. 2024, 135, 883–898. [Google Scholar] [CrossRef] [Scilit]
- Ren, Z.; Gao, L.; Clark, S.J.; Fezzaa, K.; Shevchenko, P.; Choi, A.; Everhart, W.; Rollett, A.D.; Chen, L.; Sun, T. Machine learning–aided real-time detection of keyhole pore generation in laser powder bed fusion. Science 2023, 379, 89–94. [Google Scholar] [CrossRef] [Scilit] [PubMed]
- Gu, H.; Wei, C.; Li, L.; Han, Q.; Setchi, R.; Ryan, M.; Li, Q. Multi-physics modelling of molten pool development and track formation in multi-track, multi-layer and multi-material selective laser melting. Int. J. Heat Mass Transf. 2020, 151, 119458. [Google Scholar] [CrossRef] [Scilit]
- Khorasani, M.; Ghasemi, A.H.; Leary, M.; O’Neil, W.; Gibson, I.; Cordova, L.; Rolfe, B. Numerical and analytical investigation on melt pool temperature of laser-based powder bed fusion of IN718. Int. J. Heat Mass Transf. 2021, 177, 121477. [Google Scholar] [CrossRef] [Scilit]
- Lindström, V.; Lupo, G.; Yang, J.; Turlo, V.; Leinenbach, C. A simple scaling model for balling defect formation during laser powder bed fusion. Addit. Manuf. 2023, 63, 103431. [Google Scholar] [CrossRef] [Scilit]
- Jia, H.; Sun, H.; Wang, H.; Wu, Y.; Wang, H. Scanning strategy in selective laser melting (SLM): A review. Int. J. Adv. Manuf. Technol. 2021, 113, 2413–2435. [Google Scholar] [CrossRef] [Scilit]
- Pant, P.; Salvemini, F.; Proper, S.; Luzin, V.; Simonsson, K.; Sjöström, S.; Hosseini, S.; Peng, R.L.; Moverare, J. A study of the influence of novel scan strategies on residual stress and microstructure of L-shaped LPBF IN718 samples. Mater. Des. 2022, 214, 110386. [Google Scholar] [CrossRef] [Scilit]
- Zhong, Q.; Wei, K.; Ouyang, T.; Li, X.; Zeng, X. Effect of rotation angle on surface morphology, microstructure, and mechanical properties of Inconel 718 alloy fabricated by high power laser powder bed fusion. J. Mater. Sci. Technol. 2023, 154, 30–42. [Google Scholar] [CrossRef] [Scilit]
- Al-Lami, J.; Dessolier, T.; Rogers, S.R.; Pirzada, T.; Pham, M. Dislocation distribution, crystallographic texture evolution, and plastic inhomogeneity of Inconel 718 fabricated by laser powder bed fusion. Adv. Eng. Mater. 2025, 27, 2400524. [Google Scholar]
- Ramani, K.S.; He, C.; Tsai, Y.L.; Okwudire, C.E. SmartScan: An intelligent scanning approach for uniform thermal distribution, reduced residual stresses and deformations in PBF additive manufacturing. Addit. Manuf. 2022, 52, 102643. [Google Scholar] [CrossRef] [Scilit]
- Kim, S.I.; Hart, A.J. A spiral laser scanning routine for powder bed fusion inspired by natural predator-prey behaviour. Virtual Phys. Prototyp. 2022, 17, 239–255. [Google Scholar] [CrossRef] [Scilit]
- Zagade, P.R.; Gautham, B.P.; De, A.; DebRoy, T. Analytical modelling of scanning strategy effect on temperature field and melt track dimensions in laser powder bed fusion. Addit. Manuf. 2024, 82, 104046. [Google Scholar] [CrossRef] [Scilit]
- Kusano, M.; Watanabe, M. Controlling heat accumulation through changing time per layer in laser powder bed fusion of nickel-based superalloy. J. Manuf. Process. 2024, 131, 187–198. [Google Scholar] [CrossRef] [Scilit]
- Cao, L. Mesoscopic-scale numerical investigation including the influence of scanning strategy on selective laser melting process. Comput. Mater. Sci. 2021, 189, 110263. [Google Scholar] [CrossRef] [Scilit]
- Hagenlocher, C.; O’Toole, P.; Xu, W.; Brandt, M.; Easton, M.; Molotnikov, A. Analytical modelling of heat accumulation in laser based additive manufacturing processes of metals. Addit. Manuf. 2022, 60, 103263. [Google Scholar] [CrossRef] [Scilit]
- Riensche, A.; Bevans, B.D.; Smoqi, Z.; Yavari, R.; Krishnan, A.; Gilligan, J.; Piercy, N.; Cole, K.; Rao, P. Feedforward control of thermal history in laser powder bed fusion: Toward physics-based optimization of processing parameters. Mater. Des. 2022, 224, 111351. [Google Scholar] [CrossRef] [Scilit]
- Rezaeifar, H.; Elbestawi, M.A. On-line melt pool temperature control in L-PBF additive manufacturing. Int. J. Adv. Manuf. Technol. 2021, 112, 2789–2804. [Google Scholar] [CrossRef] [Scilit]
- Vasileska, E.; Demir, A.G.; Colosimo, B.M.; Previtali, B. A novel paradigm for feedback control in LPBF: Layer-wise correction for overhang structures. Adv. Manuf. 2022, 10, 326–344. [Google Scholar] [CrossRef] [Scilit]
- Wang, R.; Standfield, B.; Dou, C.; Law, A.C.; Kong, Z.J. Real-time process monitoring and closed-loop control on laser power via a customized laser powder bed fusion platform. Addit. Manuf. 2023, 66, 103449. [Google Scholar] [CrossRef] [Scilit]
- Kavas, B.; Balta, E.C.; Tucker, M.; Rupenyan, A.; Lygeros, J.; Bambach, M. Layer-to-layer closed-loop feedback control application for inter-layer temperature stabilization in laser powder bed fusion. Addit. Manuf. 2023, 78, 103847. [Google Scholar] [CrossRef] [Scilit]
- Nahr, F.; Novotny, T.; Kunz, D.; Kleinhans, U.; Chechik, L.; Bartels, D.; Schmidt, M. Advanced process control in laser-based powder bed fusion–Smart Fusion feedback-loop control as a path to uniform properties for complex structures? J. Mater. Res. Technol. 2025, 34, 604–618. [Google Scholar] [CrossRef] [Scilit]
- Liu, Y.; Li, J.; Cheng, T.; Fan, Z.; Li, W.; Xia, W.; Wei, Q. Parameter automatic optimization strategy for laser powder bed fusion using neural network infrared radiation intensity prediction model. Addit. Manuf. 2024, 92, 104373. [Google Scholar] [CrossRef] [Scilit]
- Vallabh, C.K.P.; Sridar, S.; Xiong, W.; Zhao, X. Predicting melt pool depth and grain length using multiple signatures from in-situ single camera two-wavelength imaging pyrometry for laser powder bed fusion. J. Mater. Process. Technol. 2022, 308, 117724. [Google Scholar] [CrossRef] [Scilit]
- Li, Z.; Zhang, Z.; Zhang, S.; Wang, J.; Bai, Z.; Du, Z.; Huang, K.; Zhang, Q.; Su, Y.; Wen, G.; et al. In-situ monitoring in laser powder bed fusion based on acoustic signal time-frequency synchrosqueezing transform and multi-scale spatially interactive fusion convolutional neural network. J. Manuf. Process. 2024, 126, 471–486. [Google Scholar] [CrossRef] [Scilit]
- Hasan, N.; Saha, A.K.; Wessman, A.; Shafae, M. Machine learning-based layer-wise detection of overheating anomaly in LPBF using photodiode data. Manuf. Lett. 2024, 41, 1423–1431. [Google Scholar] [CrossRef] [Scilit]

Disclaimer/Publisher’s Note: The statements, opinions and data contained in all publications are solely those of the individual author(s) and contributor(s) and not of MDPI and/or the editor(s). MDPI and/or the editor(s) disclaim responsibility for any injury to people or property resulting from any ideas, methods, instructions or products referred to in the content. |
© 2026 by the authors. Licensee MDPI, Basel, Switzerland. This article is an open access article distributed under the terms and conditions of the Creative Commons Attribution (CC BY) license.