


Abstract
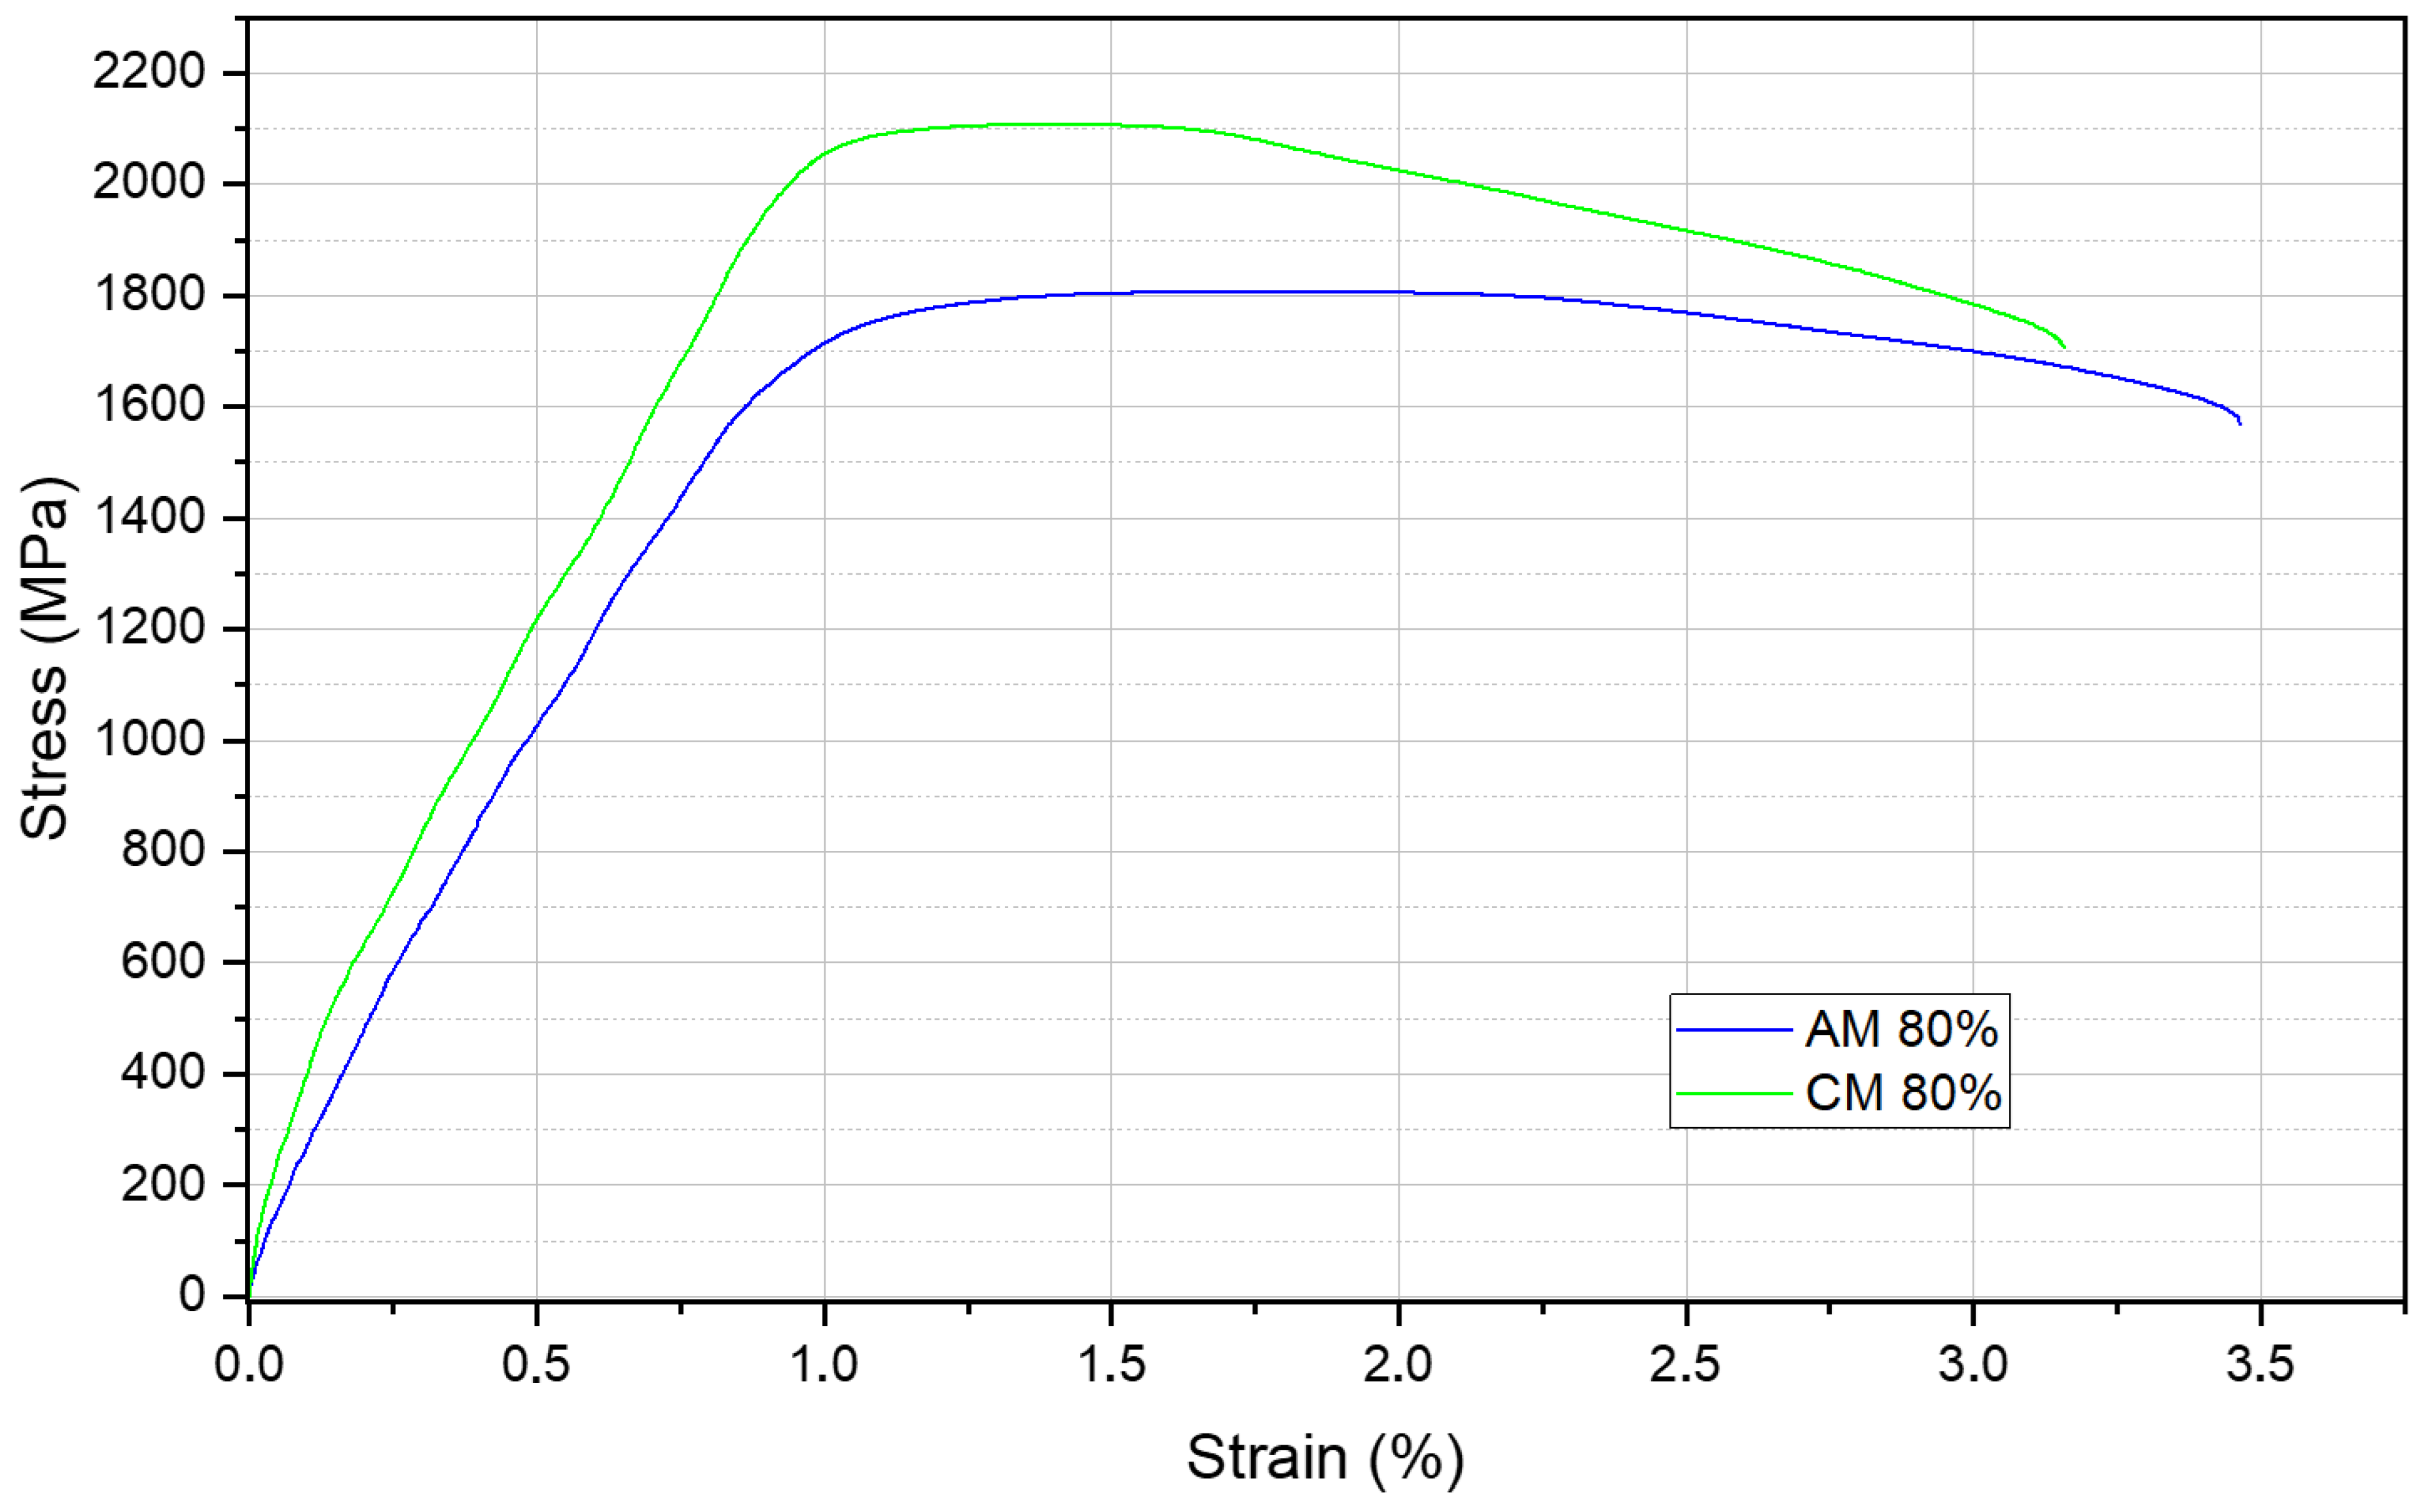
This study compares the microstructure, texture evolution, and mechanical behavior of Maraging 300 steel produced by selective laser melting (SLM) and conventional manufacturing (CM), subjected to solid solution treatment, cold rolling (up to 89.4% reduction), and aging. Results showed that while both routes achieved similar hardness, AM maintained stable hardness at extreme deformations, whereas CM peaked at 80.7% reduction. Tensile tests at ~80% reduction revealed that CM achieved higher ultimate tensile strength (2105 MPa) than AM (1807 MPa), but AM demonstrated superior ductility (16.7% vs. 10.8%). Electron Backscatter Diffraction (EBSD) analyses indicated that the AM material accommodated strain more homogeneously due to its initial fine cellular substructure, leading to greater crystallographic fragmentation, whereas CM exhibited pronounced strain localization. In conclusion, the initial microstructural state dictated by the manufacturing route fundamentally governs the deformation mechanisms, explaining the distinct strength–ductility balance observed between additively and conventionally processed Maraging 300 steel.
1. Introduction
In recent years, additive manufacturing (AM) has gained prominence as a versatile production technology with key advantages such as fabricating complex geometries near net shape, producing prototypes or small batches without molds, and enabling functional material gradients or part repair [1,2]. Among the AM techniques for metals, selective laser melting (SLM) stands out. It builds components layer by layer by melting metallic powder with a controlled laser beam guided by a 3D digital model [3]. It also enables the creation of intricate designs with mechanical properties comparable to those achieved by conventional methods like forging or machining, making it especially useful for producing complex mold inserts with conformal cooling channels that improve thermal control and reduce production cycle times, since the need for complex post-production processes is decreased [3].
Despite the growing industrial adoption of SLM, there remain unsolved issues and controversies in the scientific data on how process parameters affect the microstructure and mechanical properties of SLM-produced parts, both in the as-built condition and after heat treatment [3]. Furthermore, comparing the mechanical properties of alloys produced by SLM to those produced by traditional methods, such as casting and machining, is of great importance for the application of such materials.
Among the alloys successfully produced by SLM, there are not only Al and Ti alloys, and stainless steels, but also Maraging steel, specifically AISI Maraging steel grade 300. Maraging steels are martensitic matrices containing a very low amount of carbon, resulting in a ductile martensite that reaches high tensile strength and hardness by secondary nanosized precipitation through heat treatment (aging) [4].
The present work focuses on Maraging C300 steel, an ultra-high-strength alloy used in the aerospace, tooling, medical, and energy industries. Its exceptional ultimate tensile strength (above 2000 MPa) and toughness result from secondary hardening, caused by the precipitation of intermetallic compounds within a low-carbon martensitic matrix [5]. Moreover, higher ductility values can be achieved by controlling the amount and morphology of reversed austenite through different heat treatments.
Given these properties and, furthermore, the given martensitic cubic matrix of Maraging steels, these alloys present high shape stability at higher temperatures, making them widely employed in mold and die manufacturing using both traditional and additive methods.
To fully understand the mechanical response of these alloys under different processing routes, a detailed analysis of their crystallographic texture is essential. In polycrystalline materials, macroscopic properties such as deformation behavior, fracture toughness, and susceptibility to crack propagation are fundamentally governed by the preferred orientation of the grains [6,7]. Advanced microtexture quantification, routinely performed via Electron Backscatter Diffraction (EBSD) and represented by the orientation distribution function (ODF), alongside Kernel Average Misorientation (KAM) and Taylor Factor mapping, allows for a precise correlation between texture evolution, slip system activation, and local strain accommodation [7,8]. In BCC martensitic matrices, severe plastic deformation processes like cold rolling promote the continuous rotation of the crystal lattice towards stable orientations, typically developing the fiber (<111>//ND), which is known to enhance toughness [7,8]. In contrast, conventionally manufactured (CM) Maraging steel presents a more homogeneous initial microstructure with a significantly lower defect density.
This work aims to compare and deeply characterize Maraging C300 steel produced by the traditional fabrication route and by the SLM additive manufacturing process in terms of microstructure, mechanical properties, and in-detail crystallographic texture, before and after cold rolling and precipitation hardening heat treatment.
2. Materials and Methods
The Maraging 300 steel samples were produced by selective laser melting (SLM), and their chemical composition is presented in Table 1. The additively manufactured samples were fabricated at the INCT-BIOFABRIS laboratory, State University of Campinas (UNICAMP, Campinas, Brazil), using an EOSINT M280 system. The gas atomized powder was processed with the following parameters: laser power of 200 W, layer thickness of 50 μm, and laser beam diameter of 100 μm. In addition, the scanning strategy used was rotation of 67° after every layer built and vertical building orientation. The resultant calculated volumetric energy density, based on the volume rate of production, was 36.36 J/mm3. Argon atmosphere was used during processing to minimize oxidation.
Table 1.
Chemical composition in wt.% of the Maraging 300 steel.
In addition, conventionally manufactured samples with the same nominal chemical composition were produced through a combination of Vacuum Induction Melting (VIM) and Vacuum Arc Remelting (VAR) processes in order to reduce the carbon content to below 0.03 wt.% and ensure the high purity required for Maraging steels. Throughout this work, the additively manufactured samples are identified as “AM”, while the conventionally processed samples are designated as “CM”.
Prior to deformation, all samples were subjected to a solid solution heat treatment at 840 °C for 60 min. Since additively manufactured samples are known to exhibit elemental microsegregation, and as-built Maraging steels often contain retained austenite, this homogenization step was pivotal to establishing a comparable baseline for both groups of samples. According to the metastable Fe-Ni phase diagram, 840 °C is well within the fully austenitic region for an alloy with 18 wt.% Ni. Thus, this treatment minimized the influence of the specific fabrication thermal history. After air cooling, both materials are expected to exhibit a homogeneous martensitic matrix, allowing for a more direct comparison of the microstructural and mechanical changes induced by the subsequent thermomechanical steps.
Subsequently, both AM and CM samples were cold-rolled at room temperature using a laboratory rolling mill (Coelho Machinery, model LE-200B, Sao Paulo, Brazil) operating at a rolling speed of 8 m/min. For the AM samples, the rolling direction was perpendicular to the building direction. Thickness reductions of 48.8%, 65.8%, 80.7%, and 89.4% were achieved without the occurrence of visible defects such as cracking or delamination. The initial and final thicknesses of the rolled samples are presented in Table 2. Following cold rolling, both groups of samples were aged at 480 °C for 3 h [9]. This specific aging condition was selected as it represents the classical peak-aging regime for Maraging 300 steel. Applying a uniform thermal treatment allowed the establishment of a reliable baseline to isolate and directly compare the microstructural and mechanical effects of the different manufacturing routes and prior deformation levels, preventing the compounding effects of overaging or excessive austenite reversion.
Table 2.
Comparison of thickness evolution (initial and final) under different reduction levels for additively manufactured and conventionally processed Maraging 300 steel.
For X-ray diffraction (XRD) and hardness measurements, the samples were sectioned into specimens with a minimum surface area of 1 cm2 and mechanically polished using SiC abrasive papers ranging from 100 to 600 mesh. XRD analyses were performed using a Rigaku SmartLab SE (Rigaku Holdings Corporation, Tokyo, Japan) diffractometer equipped with CoKα radiation (λ = 0.1789 nm), within the angular range of 40° ≤ 2θ ≤ 110°, using a step size of 0.02°. Phase identification and diffraction pattern analyses were carried out using Panalytical X’Pert HighScore Plus v3d software.
Crystallographic texture analyses were conducted through orientation distribution function (ODF) calculations based on the measured (110), (200), and (211) pole figures. Rockwell hardness measurements were performed using a Mitutoyo HR-300 hardness tester (Mitutoyo, Kanagawa, Japan) with a total load of 1471 N and dwell time of 10 s. Five indentations were performed for each condition. For microstructural characterization, the samples were ground using SiC abrasive papers up to 2500 mesh, followed by polishing with diamond suspensions of 6, 3, and 1 μm. Chemical etching was performed using a 2 vol.% Nital solution.
Microstructural characterization was performed using scanning electron microscopy (SEM) with a PHILIPS XL-30 microscope and a field emission gun scanning electron microscope (FEG-SEM, Tescan Mira, Tescan, Czech Republic) equipped with ultra-high-resolution capability. The FEG-SEM system was coupled with Energy-Dispersive X-ray Spectroscopy (EDS) for chemical analysis and elemental mapping, as well as an Electron Backscatter Diffraction (EBSD) detector for crystallographic orientation and microtexture characterization. EBSD analyses were carried out at an accelerating voltage of 20 kV, a working distance of 13 mm, and a sample tilt angle of 70°. The measurements were performed using a step size of 0.35 μm over an analyzed area of 60 × 50 μm2. Between 50 and 500 indexed grains were analyzed for each condition. The same acquisition parameters were maintained for all specimens to ensure statistical consistency in the comparative analyses. The acquired data were processed using HKL Channel 5 software.
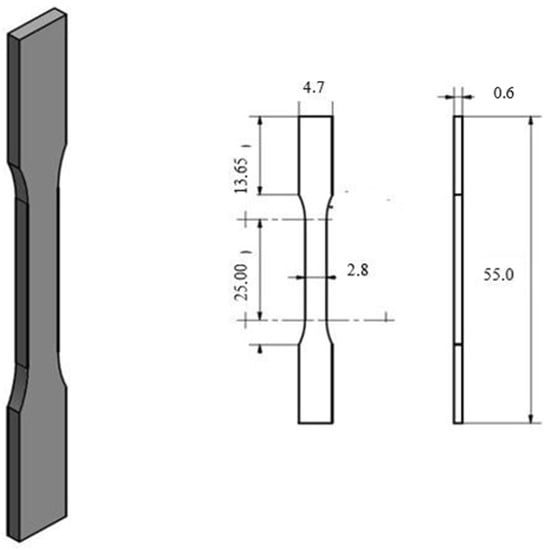
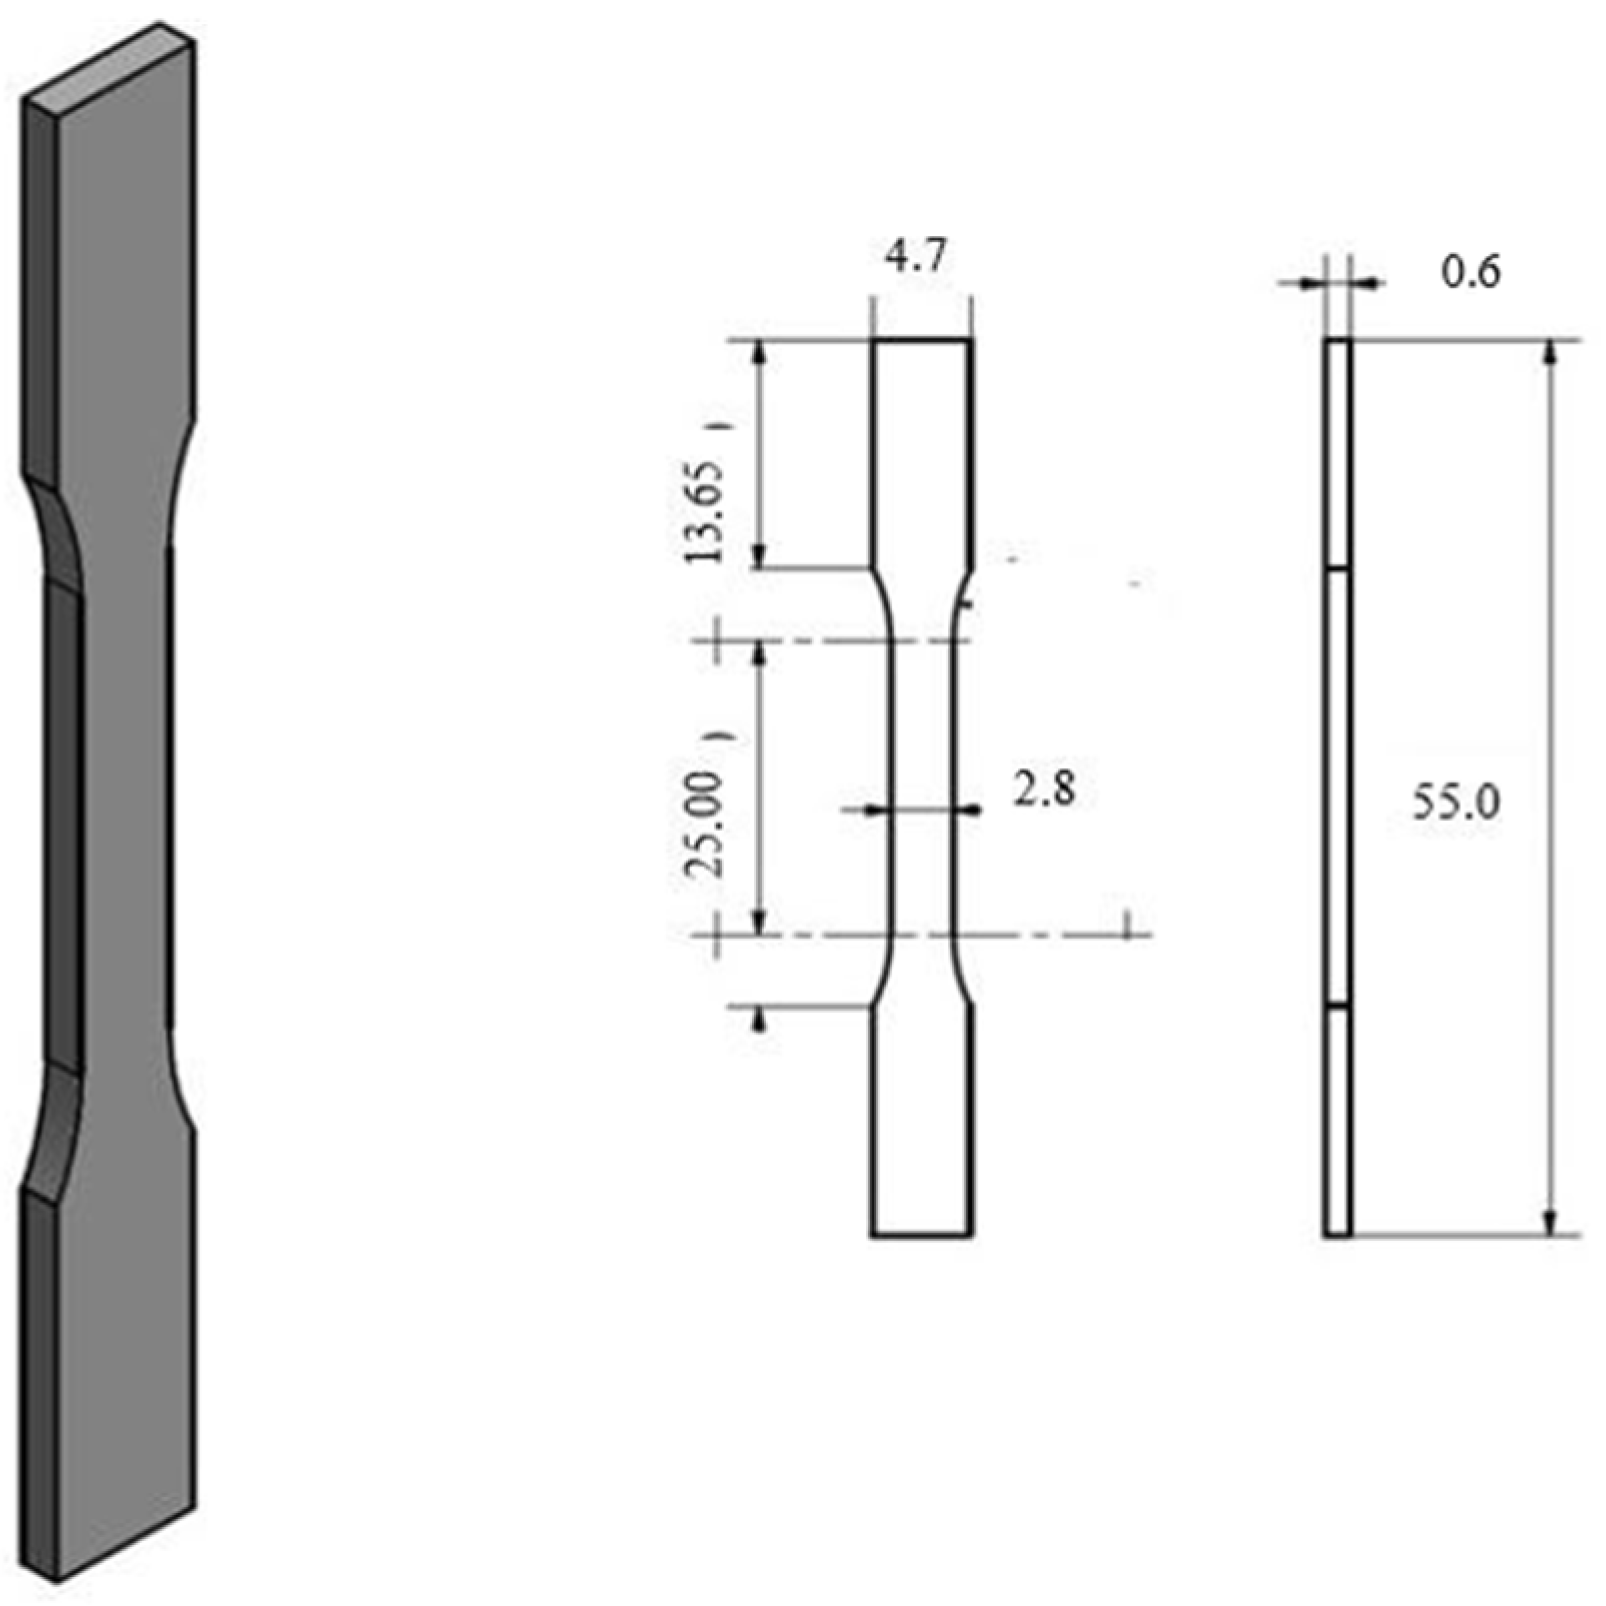
Tensile tests were performed on the solid solution-treated and aged samples using an MTS Landmark universal testing machine (MTS, Eden Prairie, MN, USA) in accordance with the ASTM E8 standard [10], at a crosshead speed of 0.5 mm/min. For each condition, three tensile tests were performed. Throughout the text, the quantitative results are presented as the average values accompanied by their corresponding standard deviations. The geometry and dimensions of the tensile specimens are shown in Figure 1. For the AM samples, the tensile test specimens were machined parallel to the rolling direction. For each condition, 3 tensile tests were performed, and the averages of the quantitative values are presented along with the standard deviations. The geometry and dimensions of the tensile specimens are shown in Figure 1.
Figure 1.
Schematic drawing with the dimensions and geometry of the tensile test samples.
3. Results and Discussion
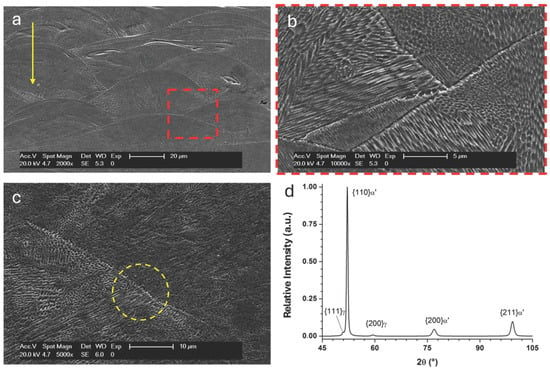
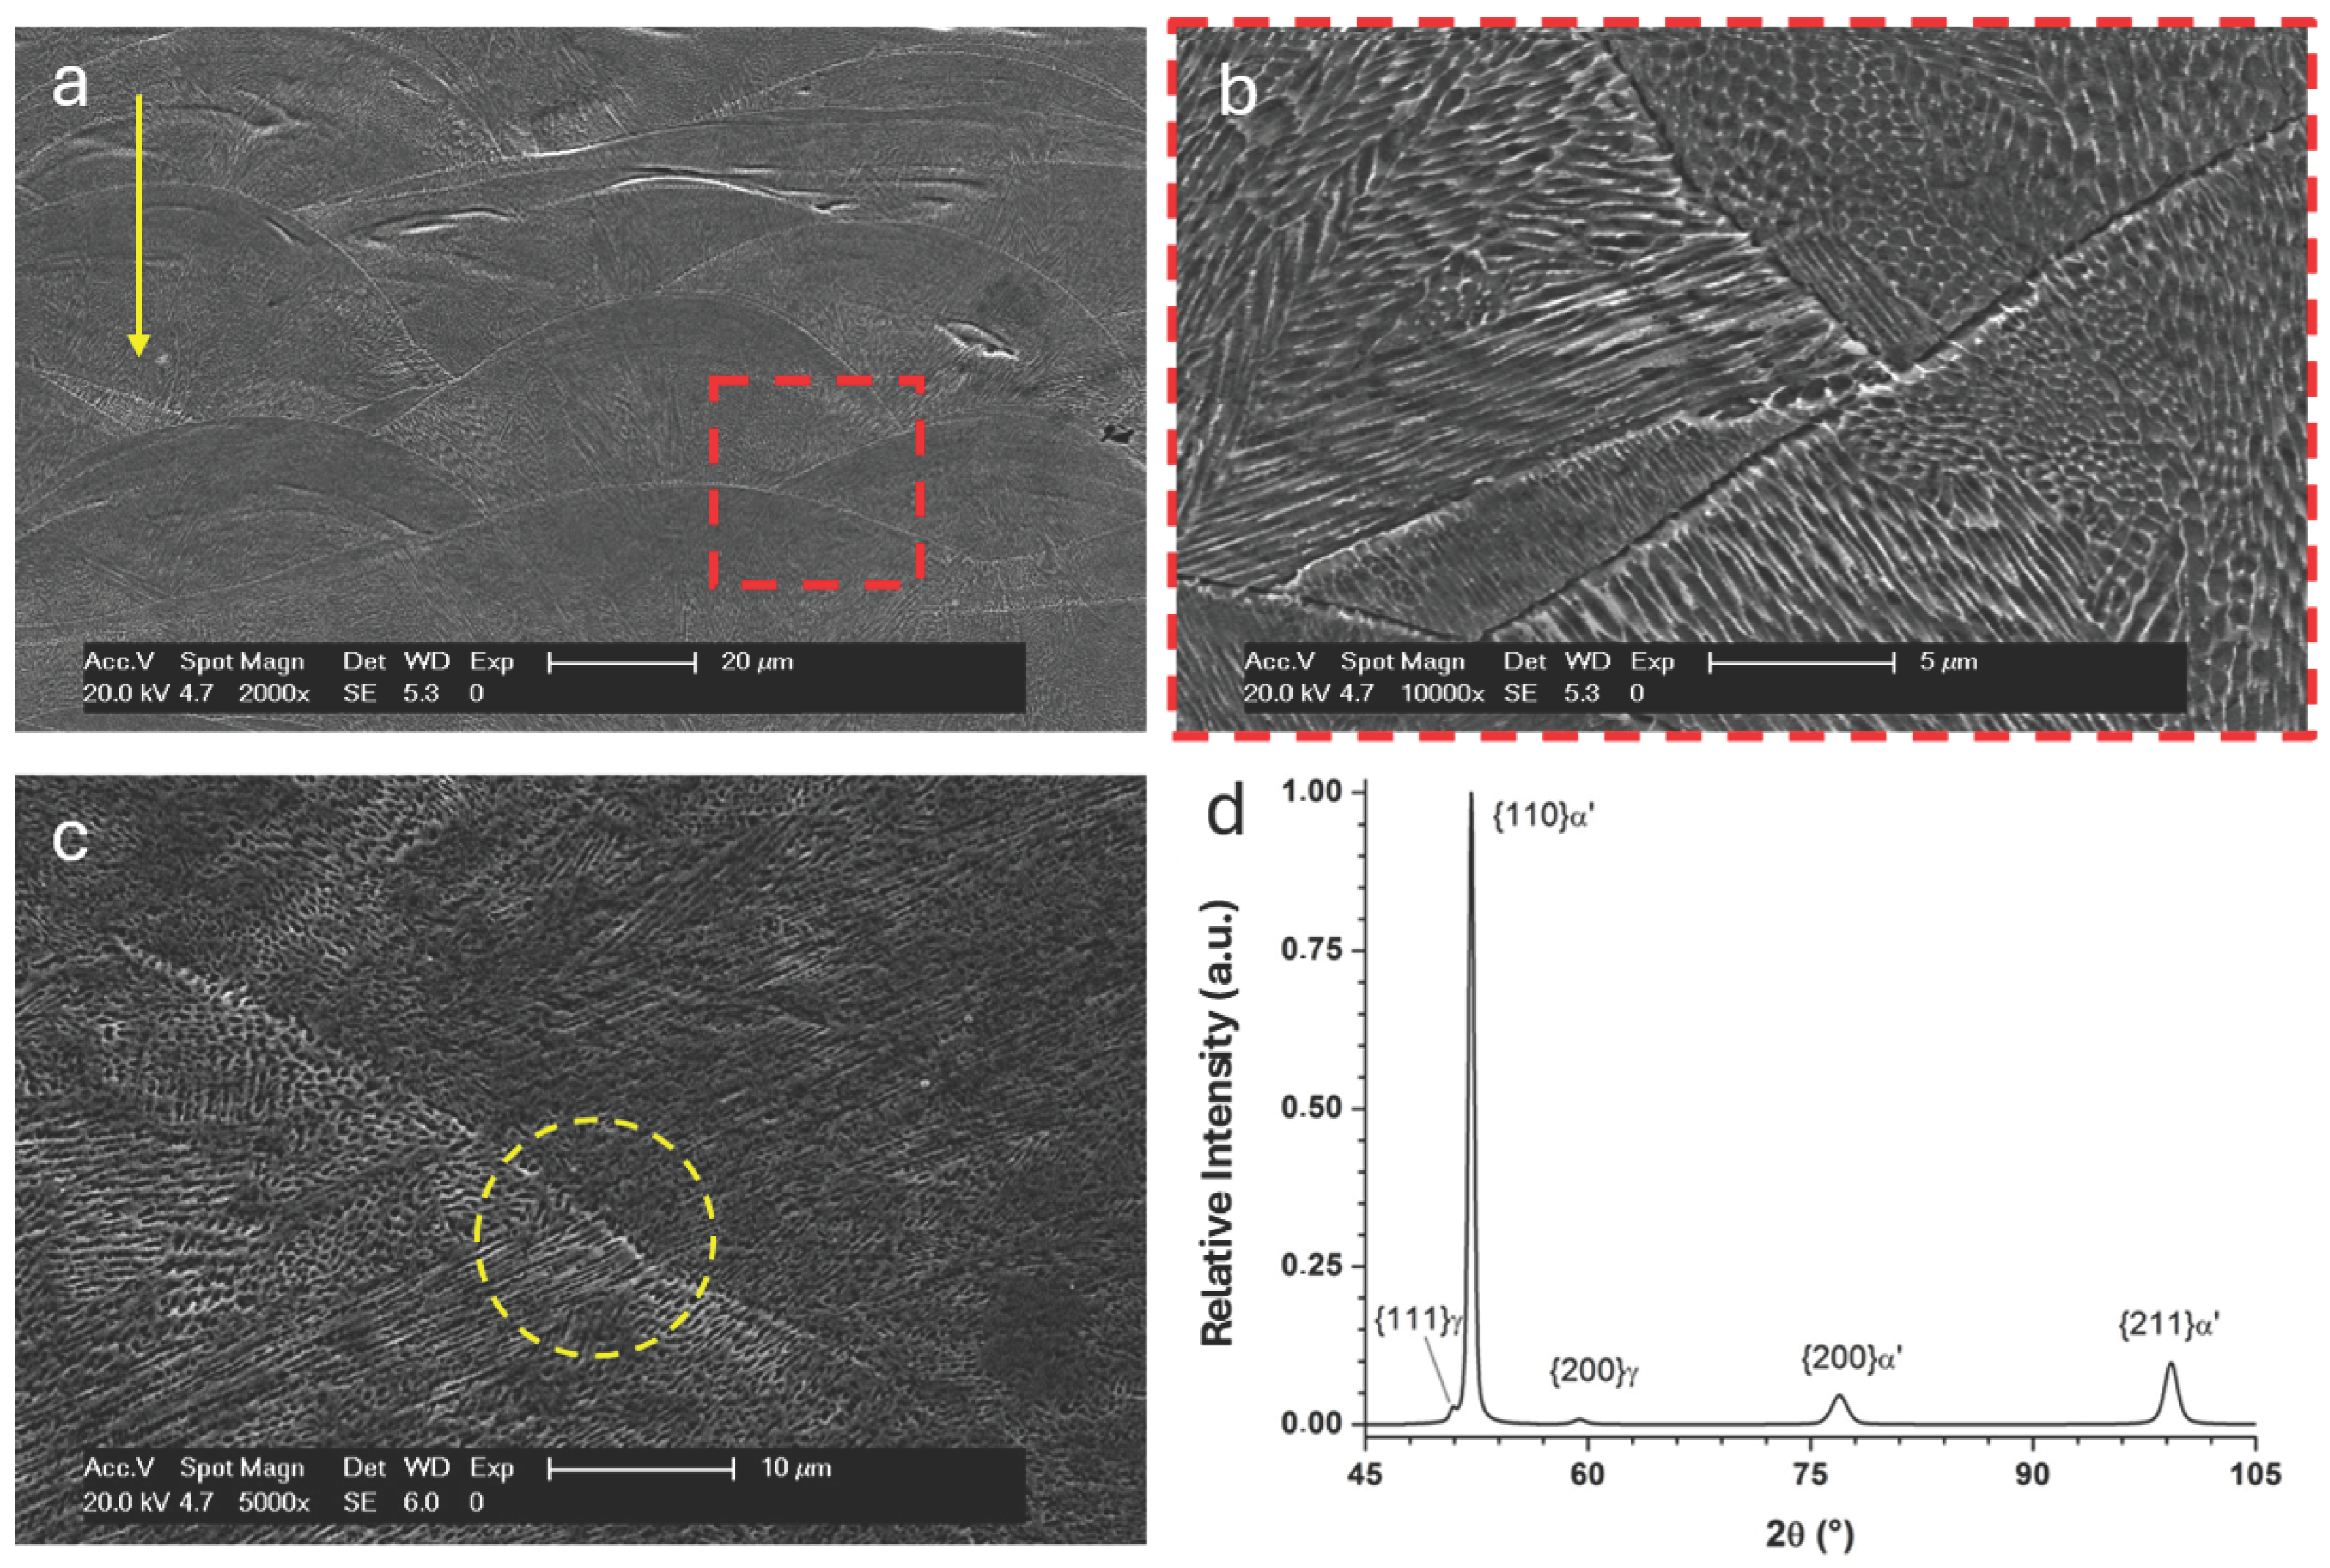
Figure 2 presents the initial microstructure of the AM Maraging 300 steel after fabrication without any heat treatment. From Figure 2a,b, the columnar/cellular structure that grows along the building direction can be observed, which is a very common microstructure found in metallic materials processed by AM due to the solidification process and heat flow direction [2,5,9]. The yellow arrow indicates the building direction. Figure 2c shows in more detail the top view of the cellular/columnar structure. The yellow dashed circle indicates the region where the columns continue growing even through different layers of material due to the heat flow that follows the building direction. This type of microstructure is known to present elemental segregation; usually the walls of the cells (light-gray areas) are richer in Ni or Ti, and this could lead to facilitated austenite reversion during heat treatment [11,12]. The XRD pattern in Figure 2d shows a minor presence of retained austenite in the as-printed sample, as well as peaks associated with the nearly cubic martensitic matrix. The volume fraction of retained austenite in the as-built AM sample was 4.78%, calculated by fitting the diffraction pattern using a Pseudo-Voigt peak shape function . Conversely, the XRD pattern of the as-received CM sample showed no detectable retained austenite .
Figure 2.
Initial microstructure characterization of the as-built Maraging 300 steel produced by additive manufacturing. (a,b) SEM image showing the typical cellular/columnar structure aligned with the building direction due to directional heat flow during solidification. (c) Top view of the cellular structure, highlighting the continuity of columnar growth through successive deposited layers (yellow dashed circle). (d) X-ray diffraction pattern of the as-built AM sample, indicating the predominantly martensitic matrix and the presence of a small amount of retained austenite.
Table 3 presents the Rockwell C hardness results for all conditions of CM and AM materials, the as-received, deformed, and deformed and aged (480 °C/3 h) samples. Observing the deformed and aged samples’ hardness values, it is evident that the AM material presents stable values even with an increase in the plastic deformation percentage up to 89.4%. For the CM material, the hardness values increase with the deformation level, although for the higher-deformation condition, it drops more than 8%. When comparing the two different processing routes, it is clear that both are comparable and present very similar values of hardness. Only the ‘80.7% + Aging’ condition presents a 13% higher hardness for the CM process when compared to the AM value.
Table 3.
Rockwell C hardness values of all samples.
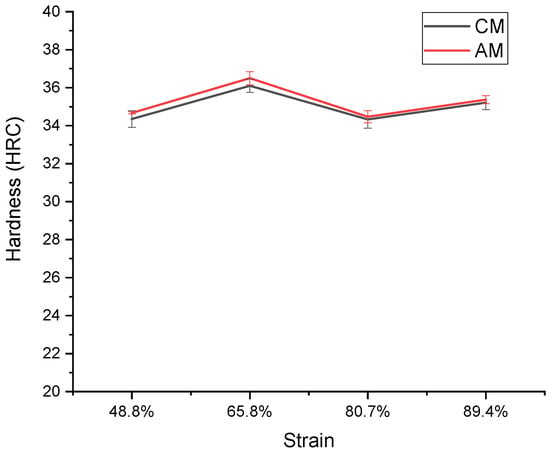
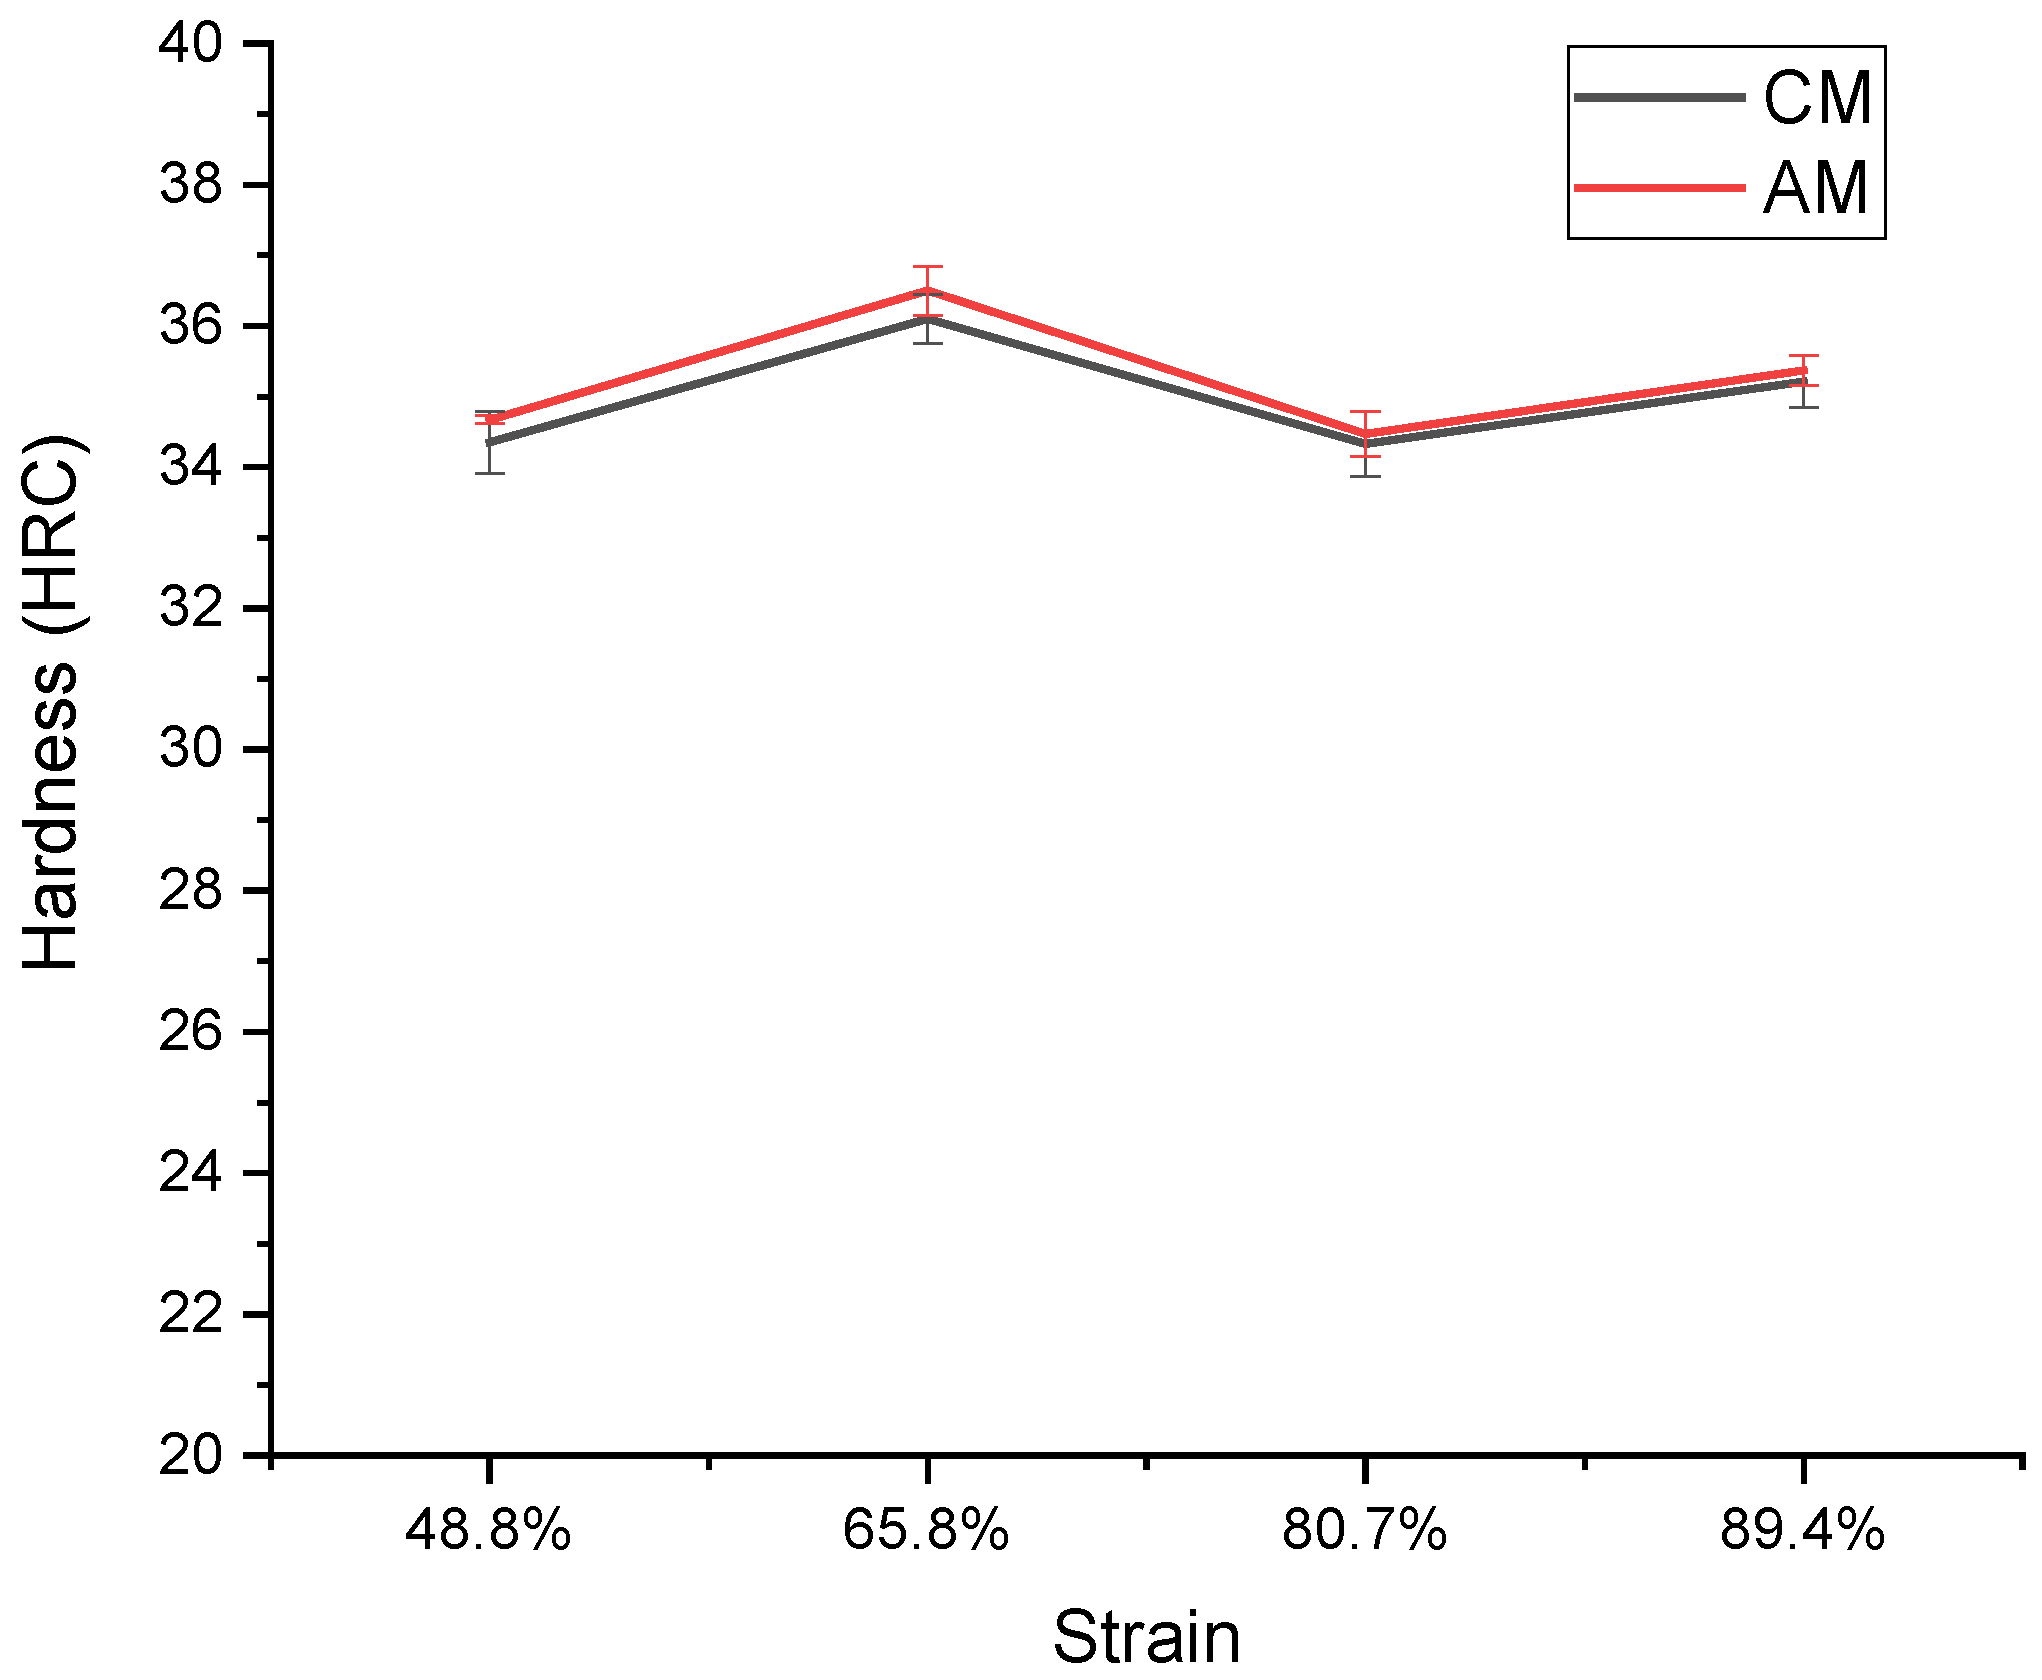
Figure 3 presents the hardness values of the samples before any heat treatment. As shown in the graph, Maraging 300 steel produced by SLM exhibits hardness values similar to those of the material obtained by conventional methods, although microstructural differences influence its mechanical response. In the as-fabricated state, the SLM material exhibits superior hardness compared to the conventional solid solution condition, due to microstructural refinement, the high dislocation density generated by rapid thermal cycles, and the microsegregation of alloying elements, which hinder dislocation movement and increase the material’s strength [13,14,15].
Figure 3.
Hardness values of the conventionally manufactured (CM) and additively manufactured (AM) Maraging 300 steel samples under different cold deformation conditions prior to aging treatment. The AM material exhibits slightly higher hardness in the as-built condition, while both processing routes show similar hardening behavior with increasing deformation.
With increasing plastic deformation, the hardness evolution in the additive route follows a trend similar to that of the conventional material, due to progressive work hardening. However, at higher deformation levels, the values vary, and this behavior may be associated with the greater microstructural heterogeneity of the SLM-produced material, which promotes non-uniform distribution of internal stresses and possible local variations in the microstructure, resulting in point differences in the measured hardness [2,16,17].
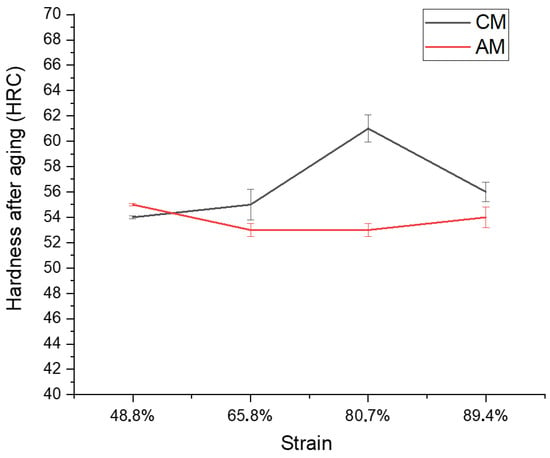
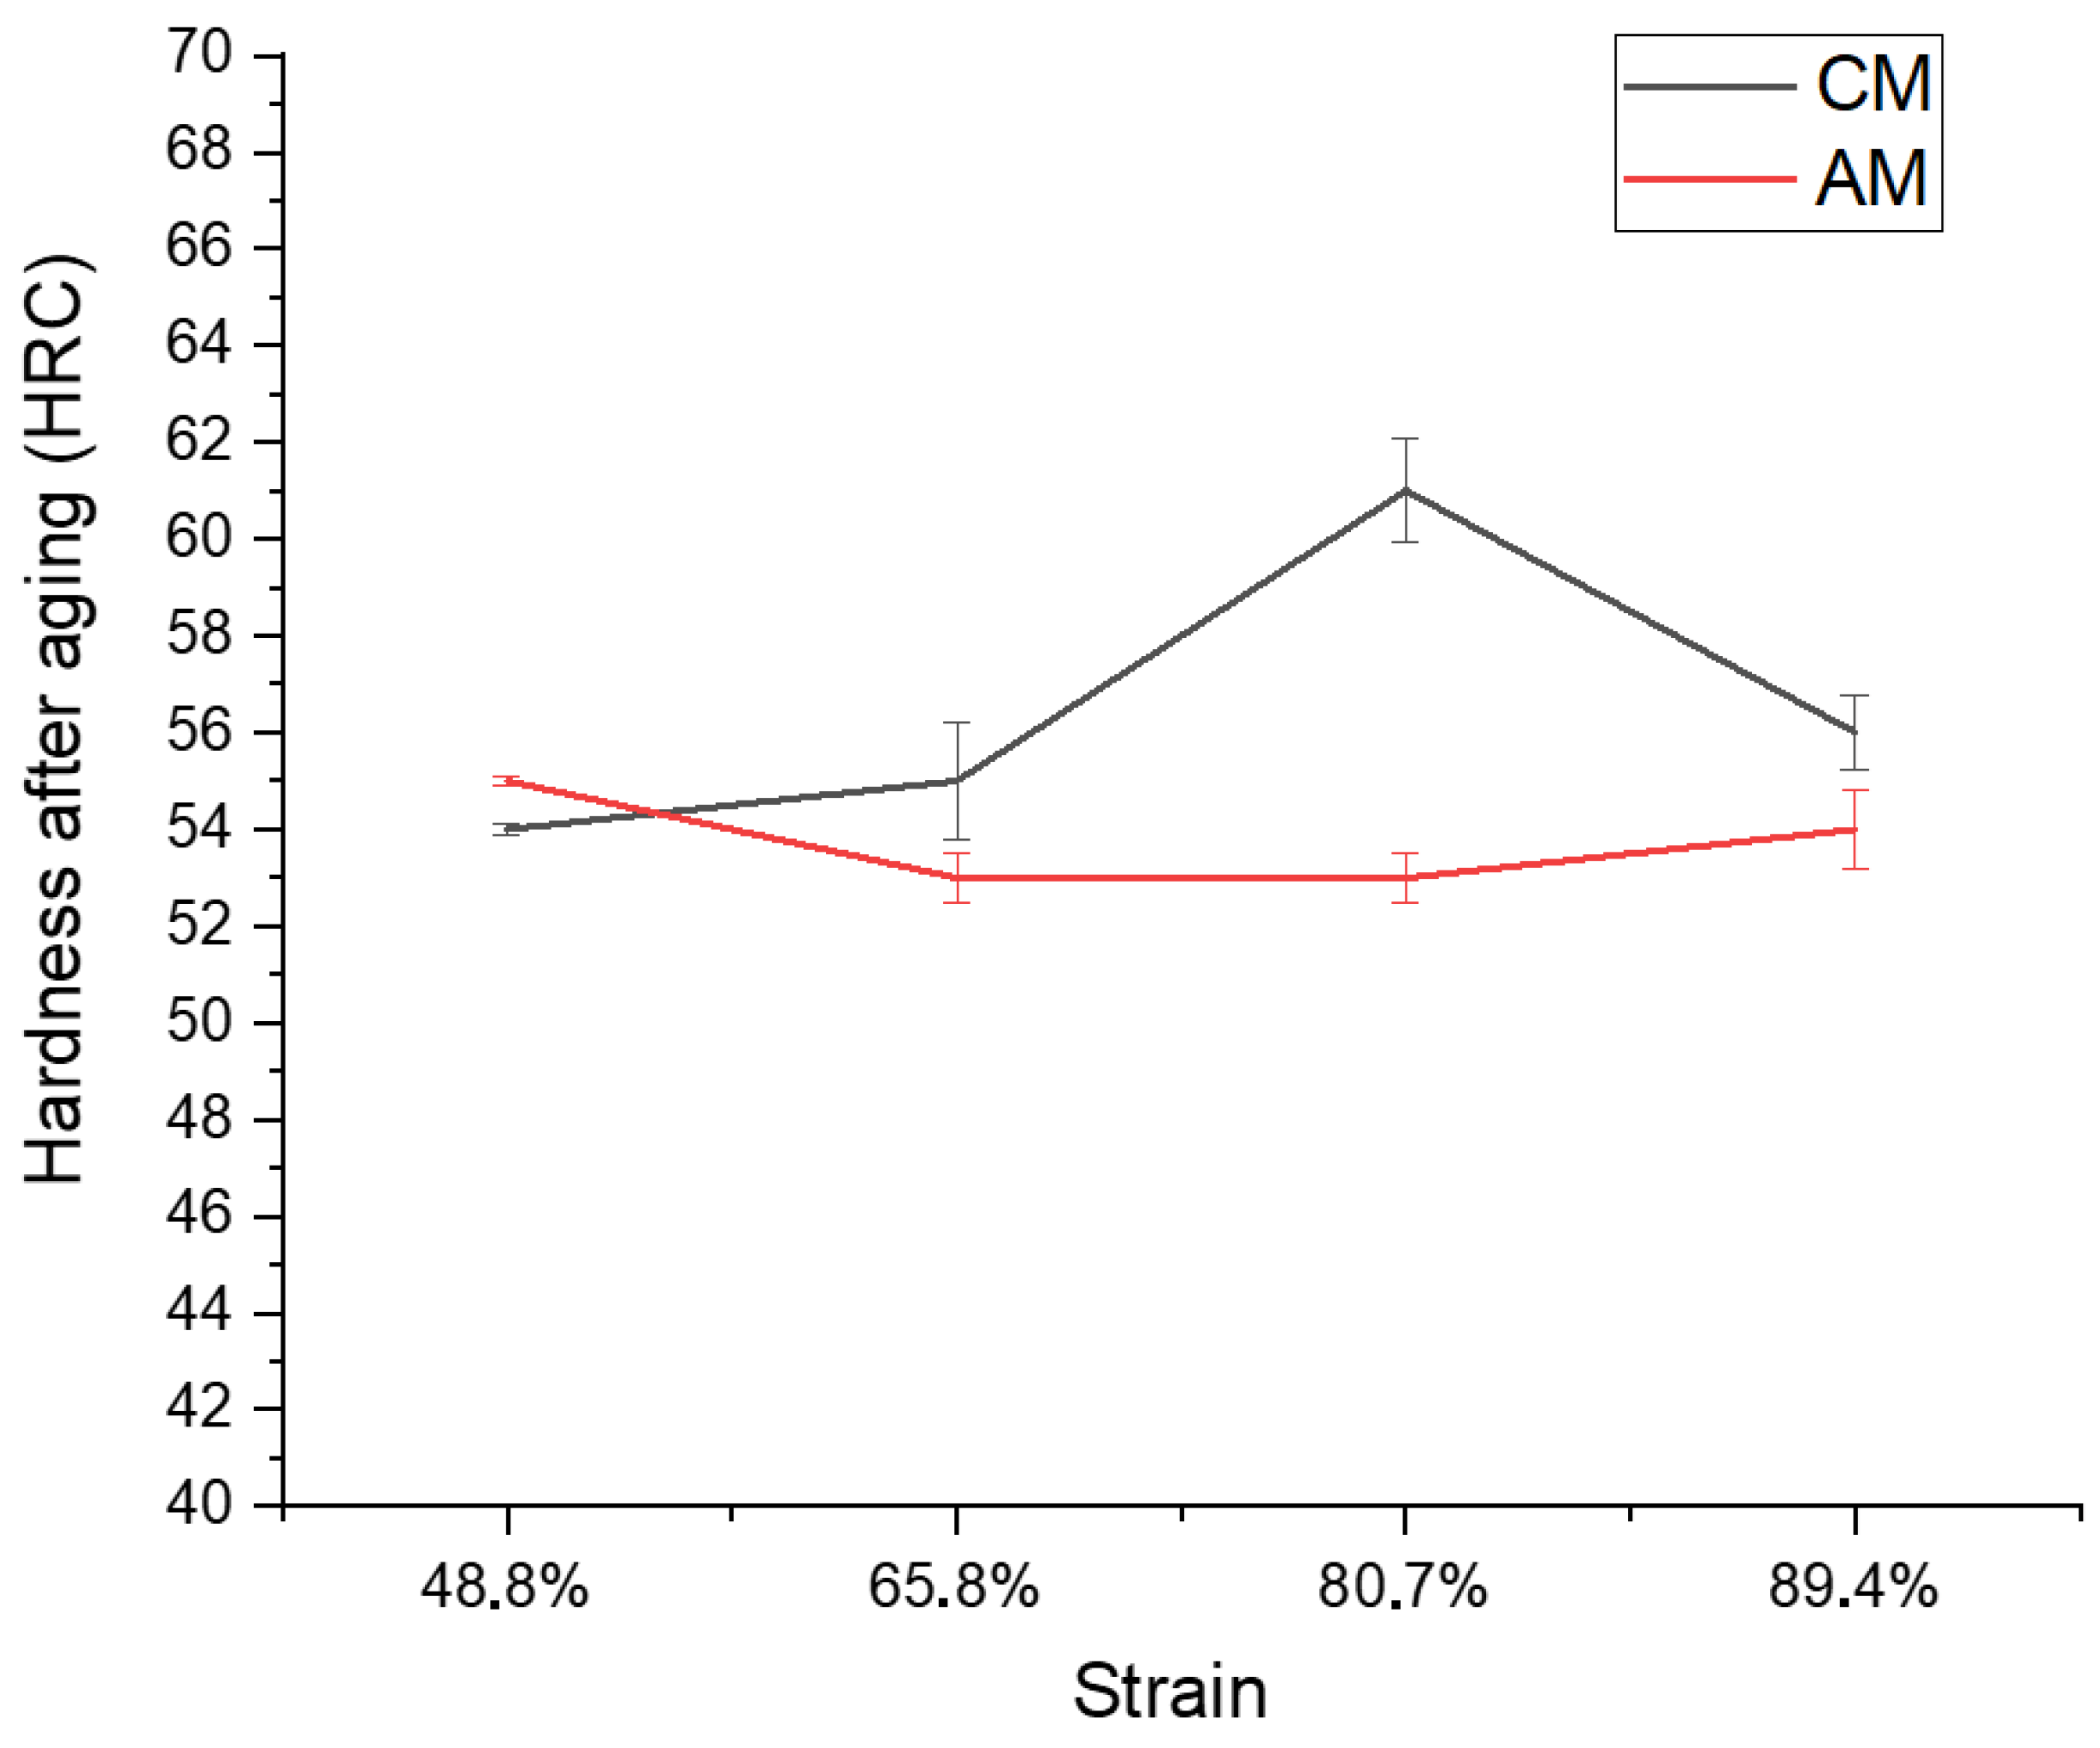
Figure 4 presents the hardness values of the samples after heat treatment. Following aging, a significant increase in the hardness of Maraging 300 is observed, which is associated with the precipitation of hardening intermetallic phases that act as barriers to dislocation movement [18,19]. The presence of these precipitates, mainly Ni3Ti and Fe2Mo, can be safely assumed, as the well-established knowledge regarding the aging behavior of Maraging steels forms the basis for this assumption [5,20,21]. Furthermore, the precipitates formed during aging treatments (at 480 °C for different times) were extensively investigated by Niu et al. [20] via Transmission Electron Microscopy (TEM) and Atom Probe Tomography (APT). Therefore, these precipitates are the main mechanism responsible for the hardening under this condition, as widely reported for Maraging steels.
Figure 4.
Hardness values of conventionally manufactured (CM) and additively manufactured (AM) Maraging 300 steel samples subjected to different cold deformation levels after aging treatment. The increase in hardness after aging is associated with precipitation hardening, while the subsequent deformation contributes to the evolution of crystalline defects and strain hardening mechanisms.
With subsequent plastic deformation, there is an increase in the density of crystalline defects, such as dislocations and subgrain boundaries, which can act as preferential diffusion pathways (pipe diffusion) and as additional nucleation sites, favoring redistribution and possible refinement of the precipitates [19,22,23].
In the case of material produced by additive manufacturing, the influence of residual stresses inherited from the process must also be considered. During aging, some of the stored energy may initially be consumed in relieving these stresses, which can locally retard the precipitation kinetics or modify its spatial distribution [2,24].
When subjected to high deformations, a distinct behavior is observed between the two processing routes. In the conventional material, the hardness gradually increases from 54 HRC (48.8% reduction) to 55 HRC (65.8% reduction), reaching a maximum value of 61 HRC at 80.7% deformation, followed by a reduction to 56 HRC at 89.4%. This peak suggests the activation of an additional hardening mechanism at high deformation levels, possibly associated with deformation-induced reversed austenite transformation and/or intense refinement of the martensitic structure, promoting a temporary increase in strength. Furthermore, this peak condition can be attributed to the combined effect of severe cold deformation and subsequent precipitation hardening. The high density of defects introduced during rolling may provide additional nucleation sites and short-circuit diffusion paths during aging, favoring a more effective precipitation response. Previous work comparing cold-rolled and non-cold-rolled Maraging 350 steel investigated the influence of plastic deformation on the nucleation and growth of precipitates and austenite reversion. The evidence suggests that the increase in defects in the matrix results in a more distributed nucleation and a smaller size of the precipitated phases throughout the material [20]. In addition, this condition can be attributed to the combined effect of severe cold deformation and subsequent precipitation hardening.
In contrast, the material produced by SLM exhibits a more discreet variation in hardness, maintaining values between 53 and 55 HRC throughout the entire strain range analyzed. This behavior indicates a lower additional capacity for work hardening at extreme strains, possibly due to the high initial dislocation density and pre-existing microstructural refinement, which may lead to earlier saturation of the hardening mechanisms.
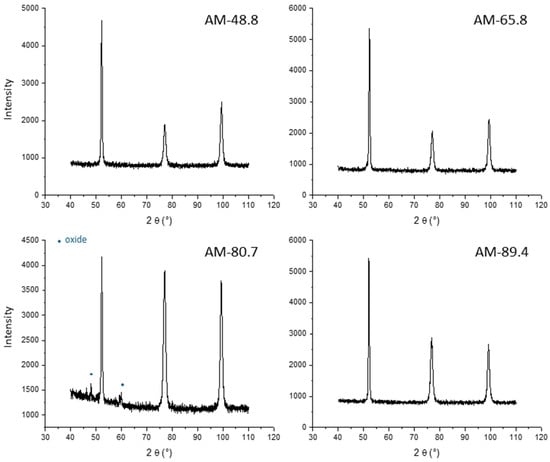
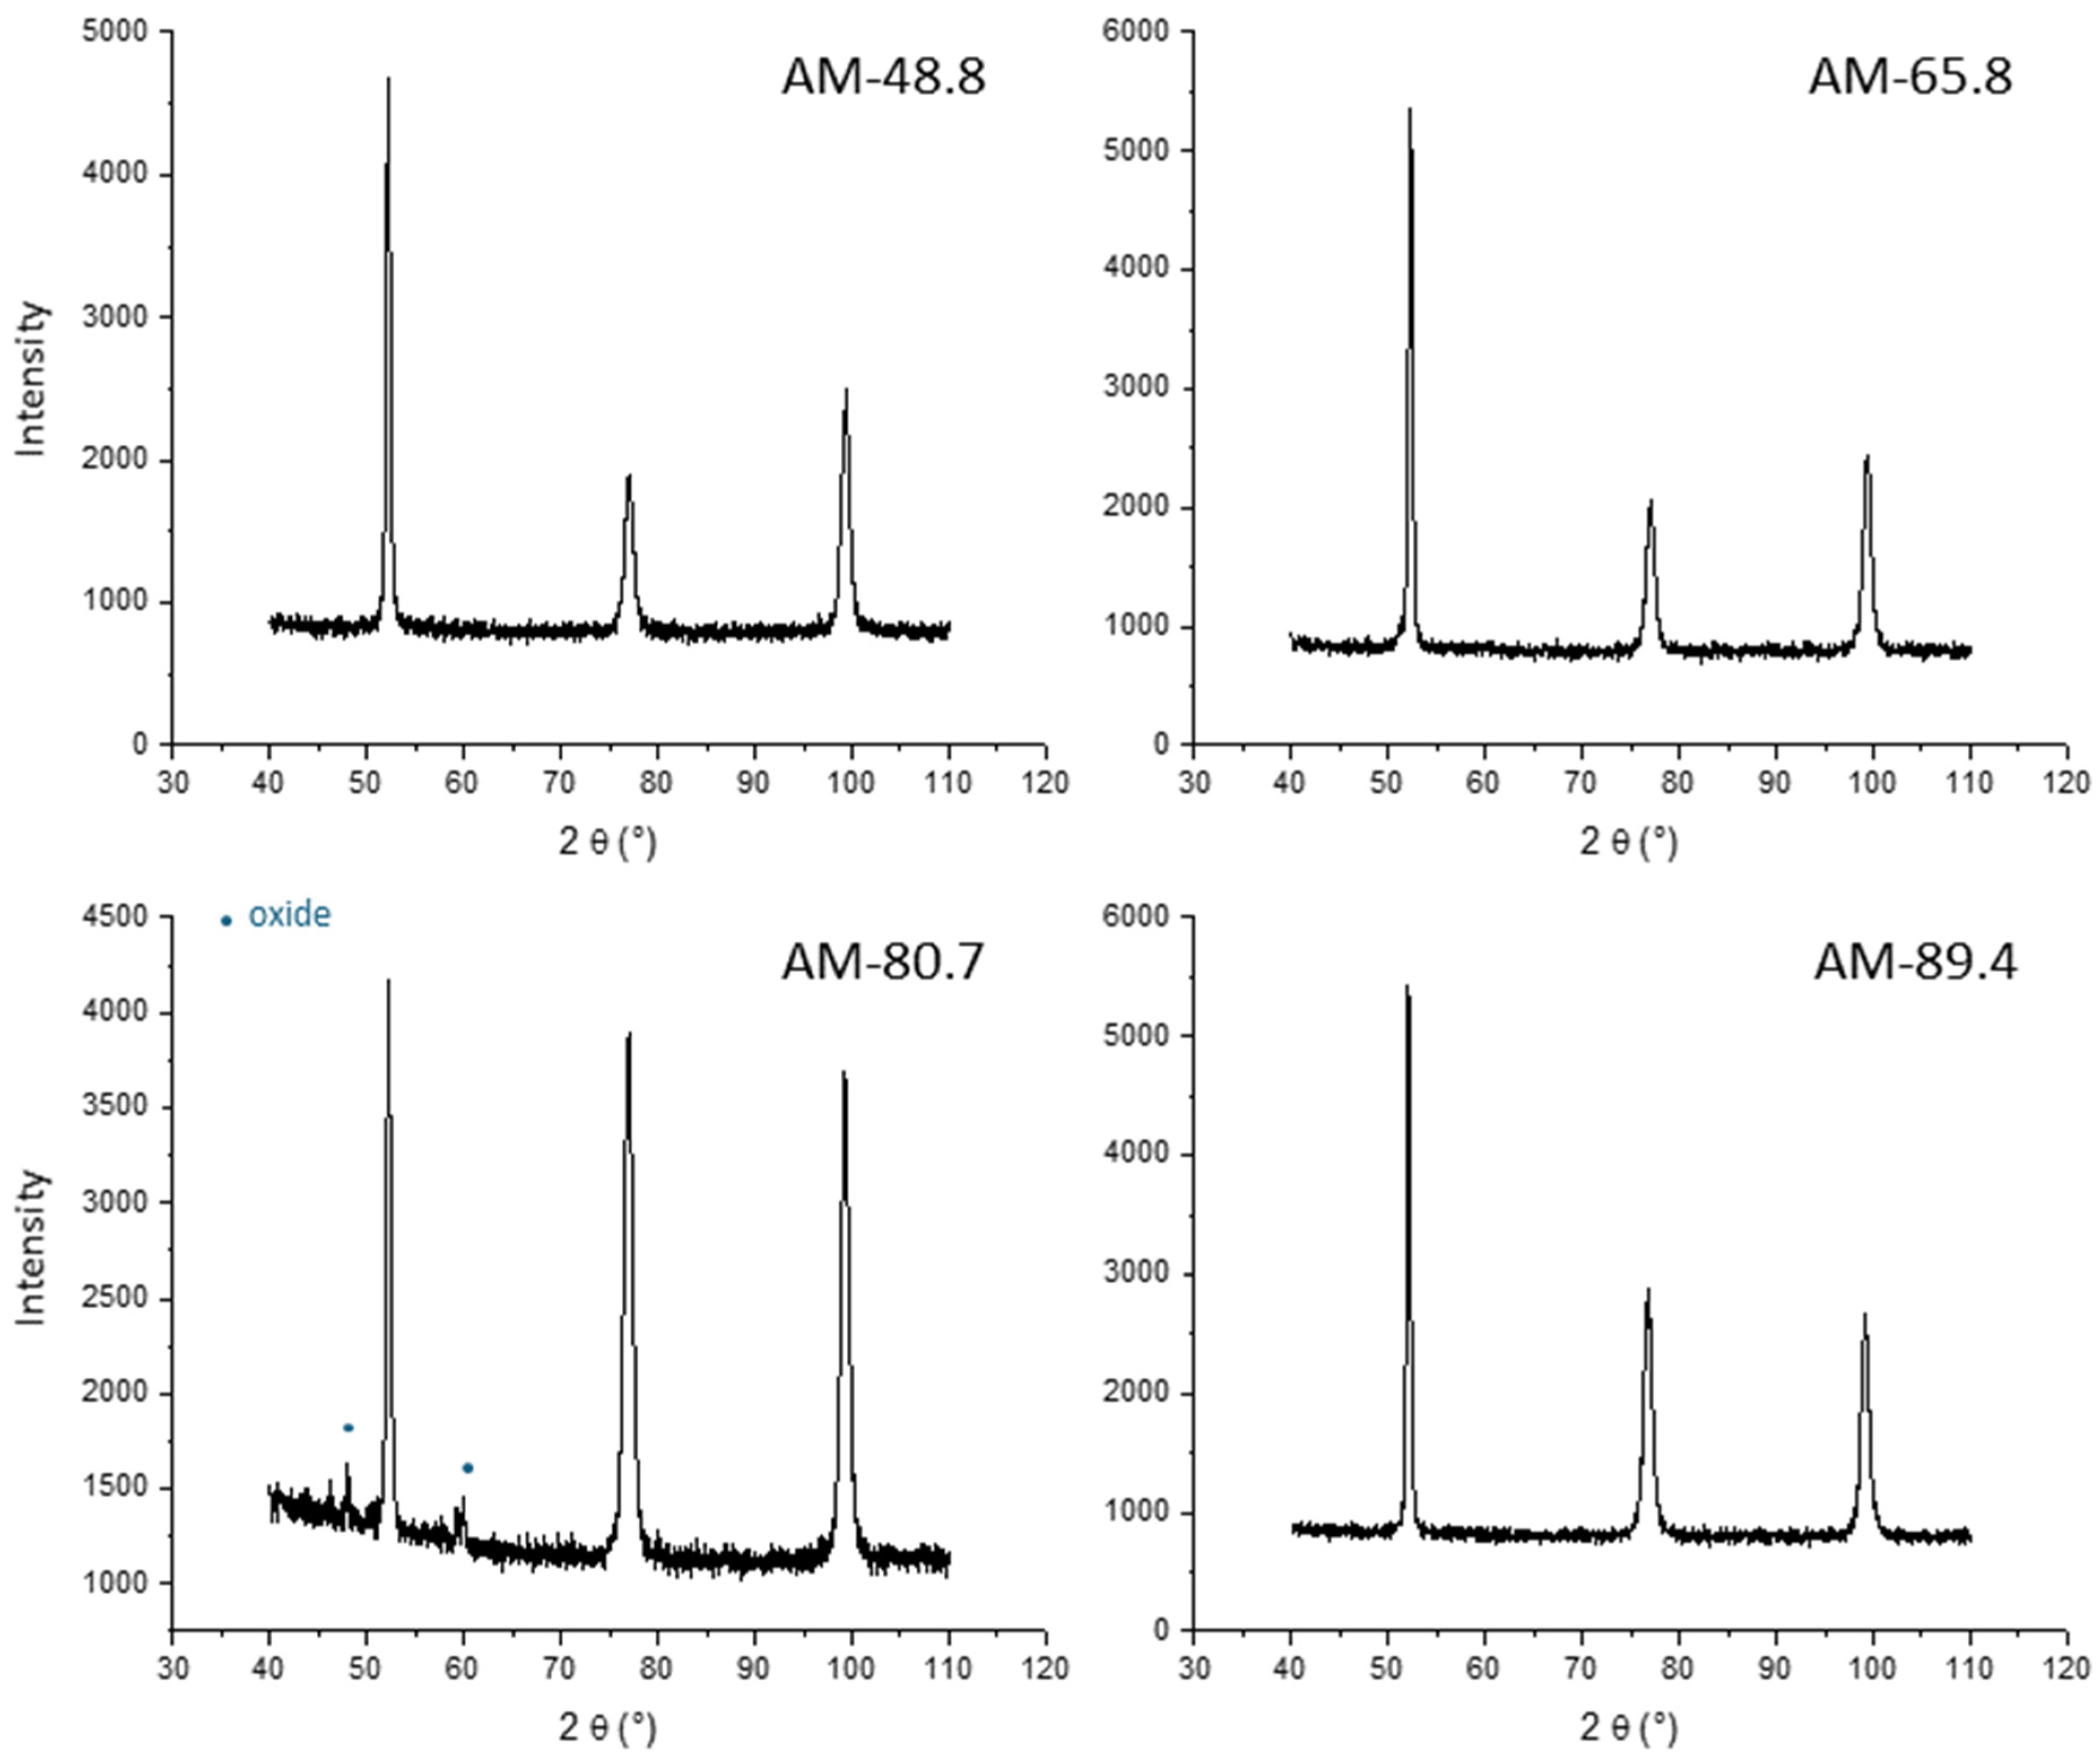
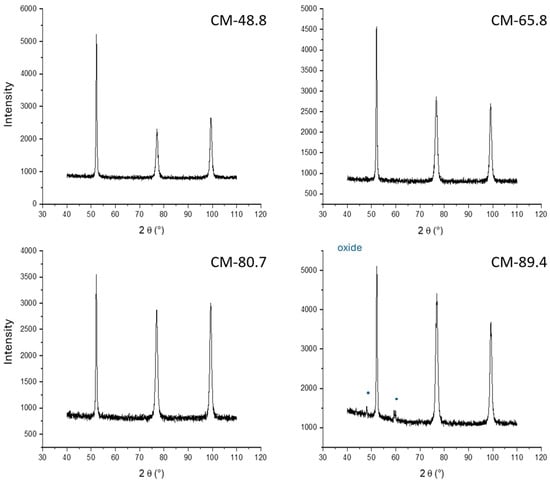
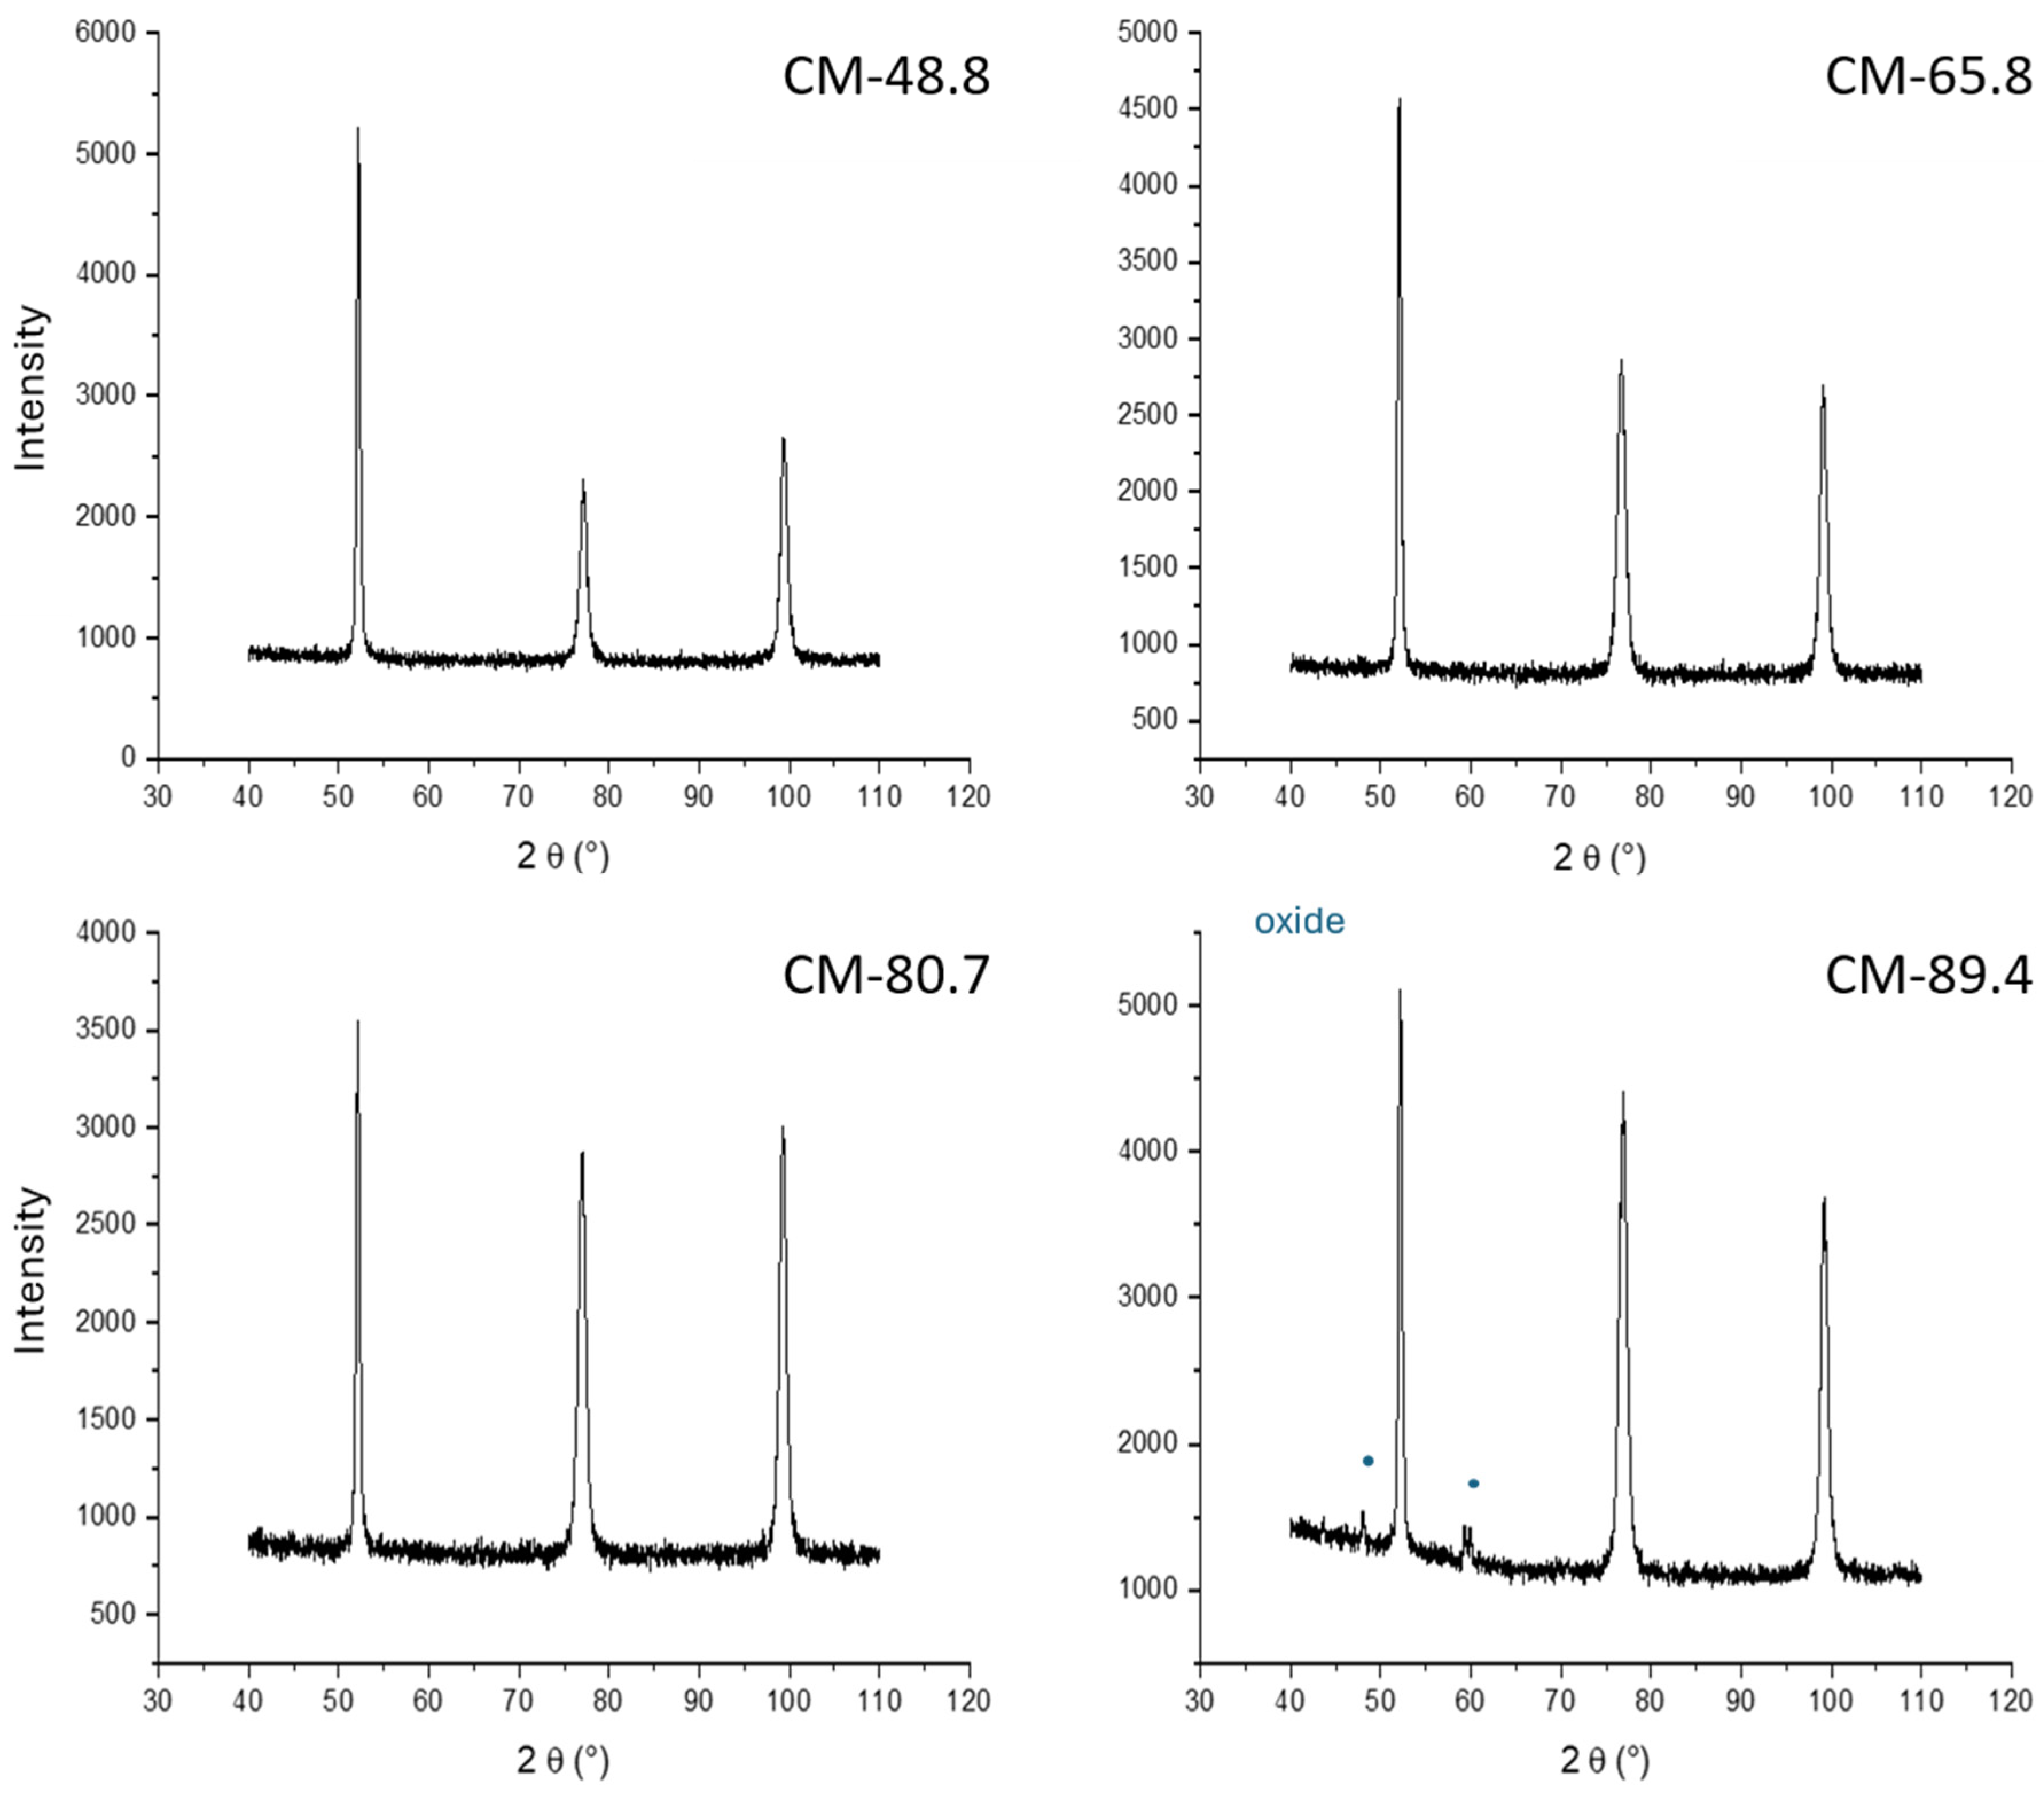
Figure 5 and Figure 6 show the XRD results for the AM and CM deformed samples, respectively. For all samples, the peaks of the BCC structure are evident, and this is related to the cubic martensitic matrix. It can be concluded that retained austenite is no longer present in any of the deformed samples, or its fraction falls below the detection limit of the XRD technique.
Figure 5.
X-ray diffraction patterns of the deformed additively manufactured (AM) Maraging 300 steel samples, showing the predominance of the BCC martensitic phase after cold rolling.
Figure 6.
X-ray diffraction patterns of the deformed conventionally manufactured (CM) Maraging 300 steel samples, characterized by diffraction peaks associated with the BCC martensitic matrix.
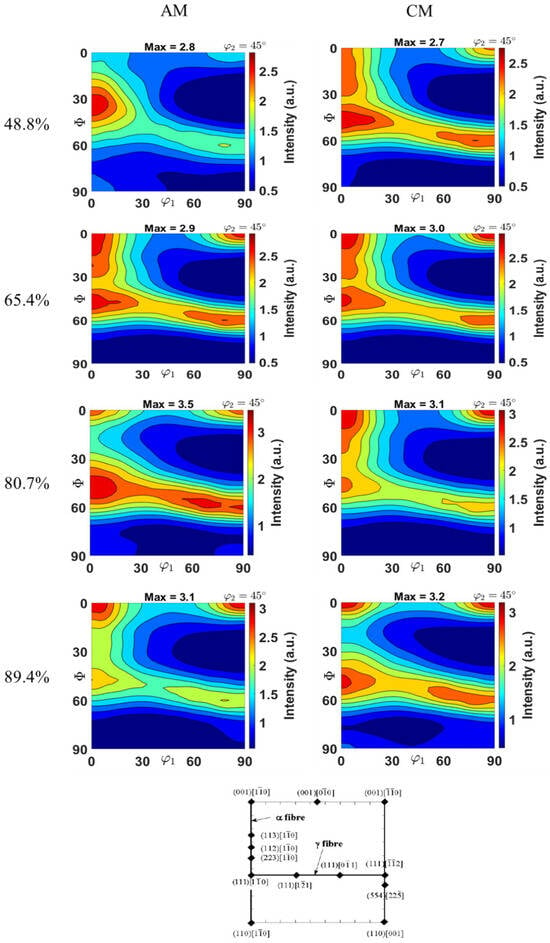
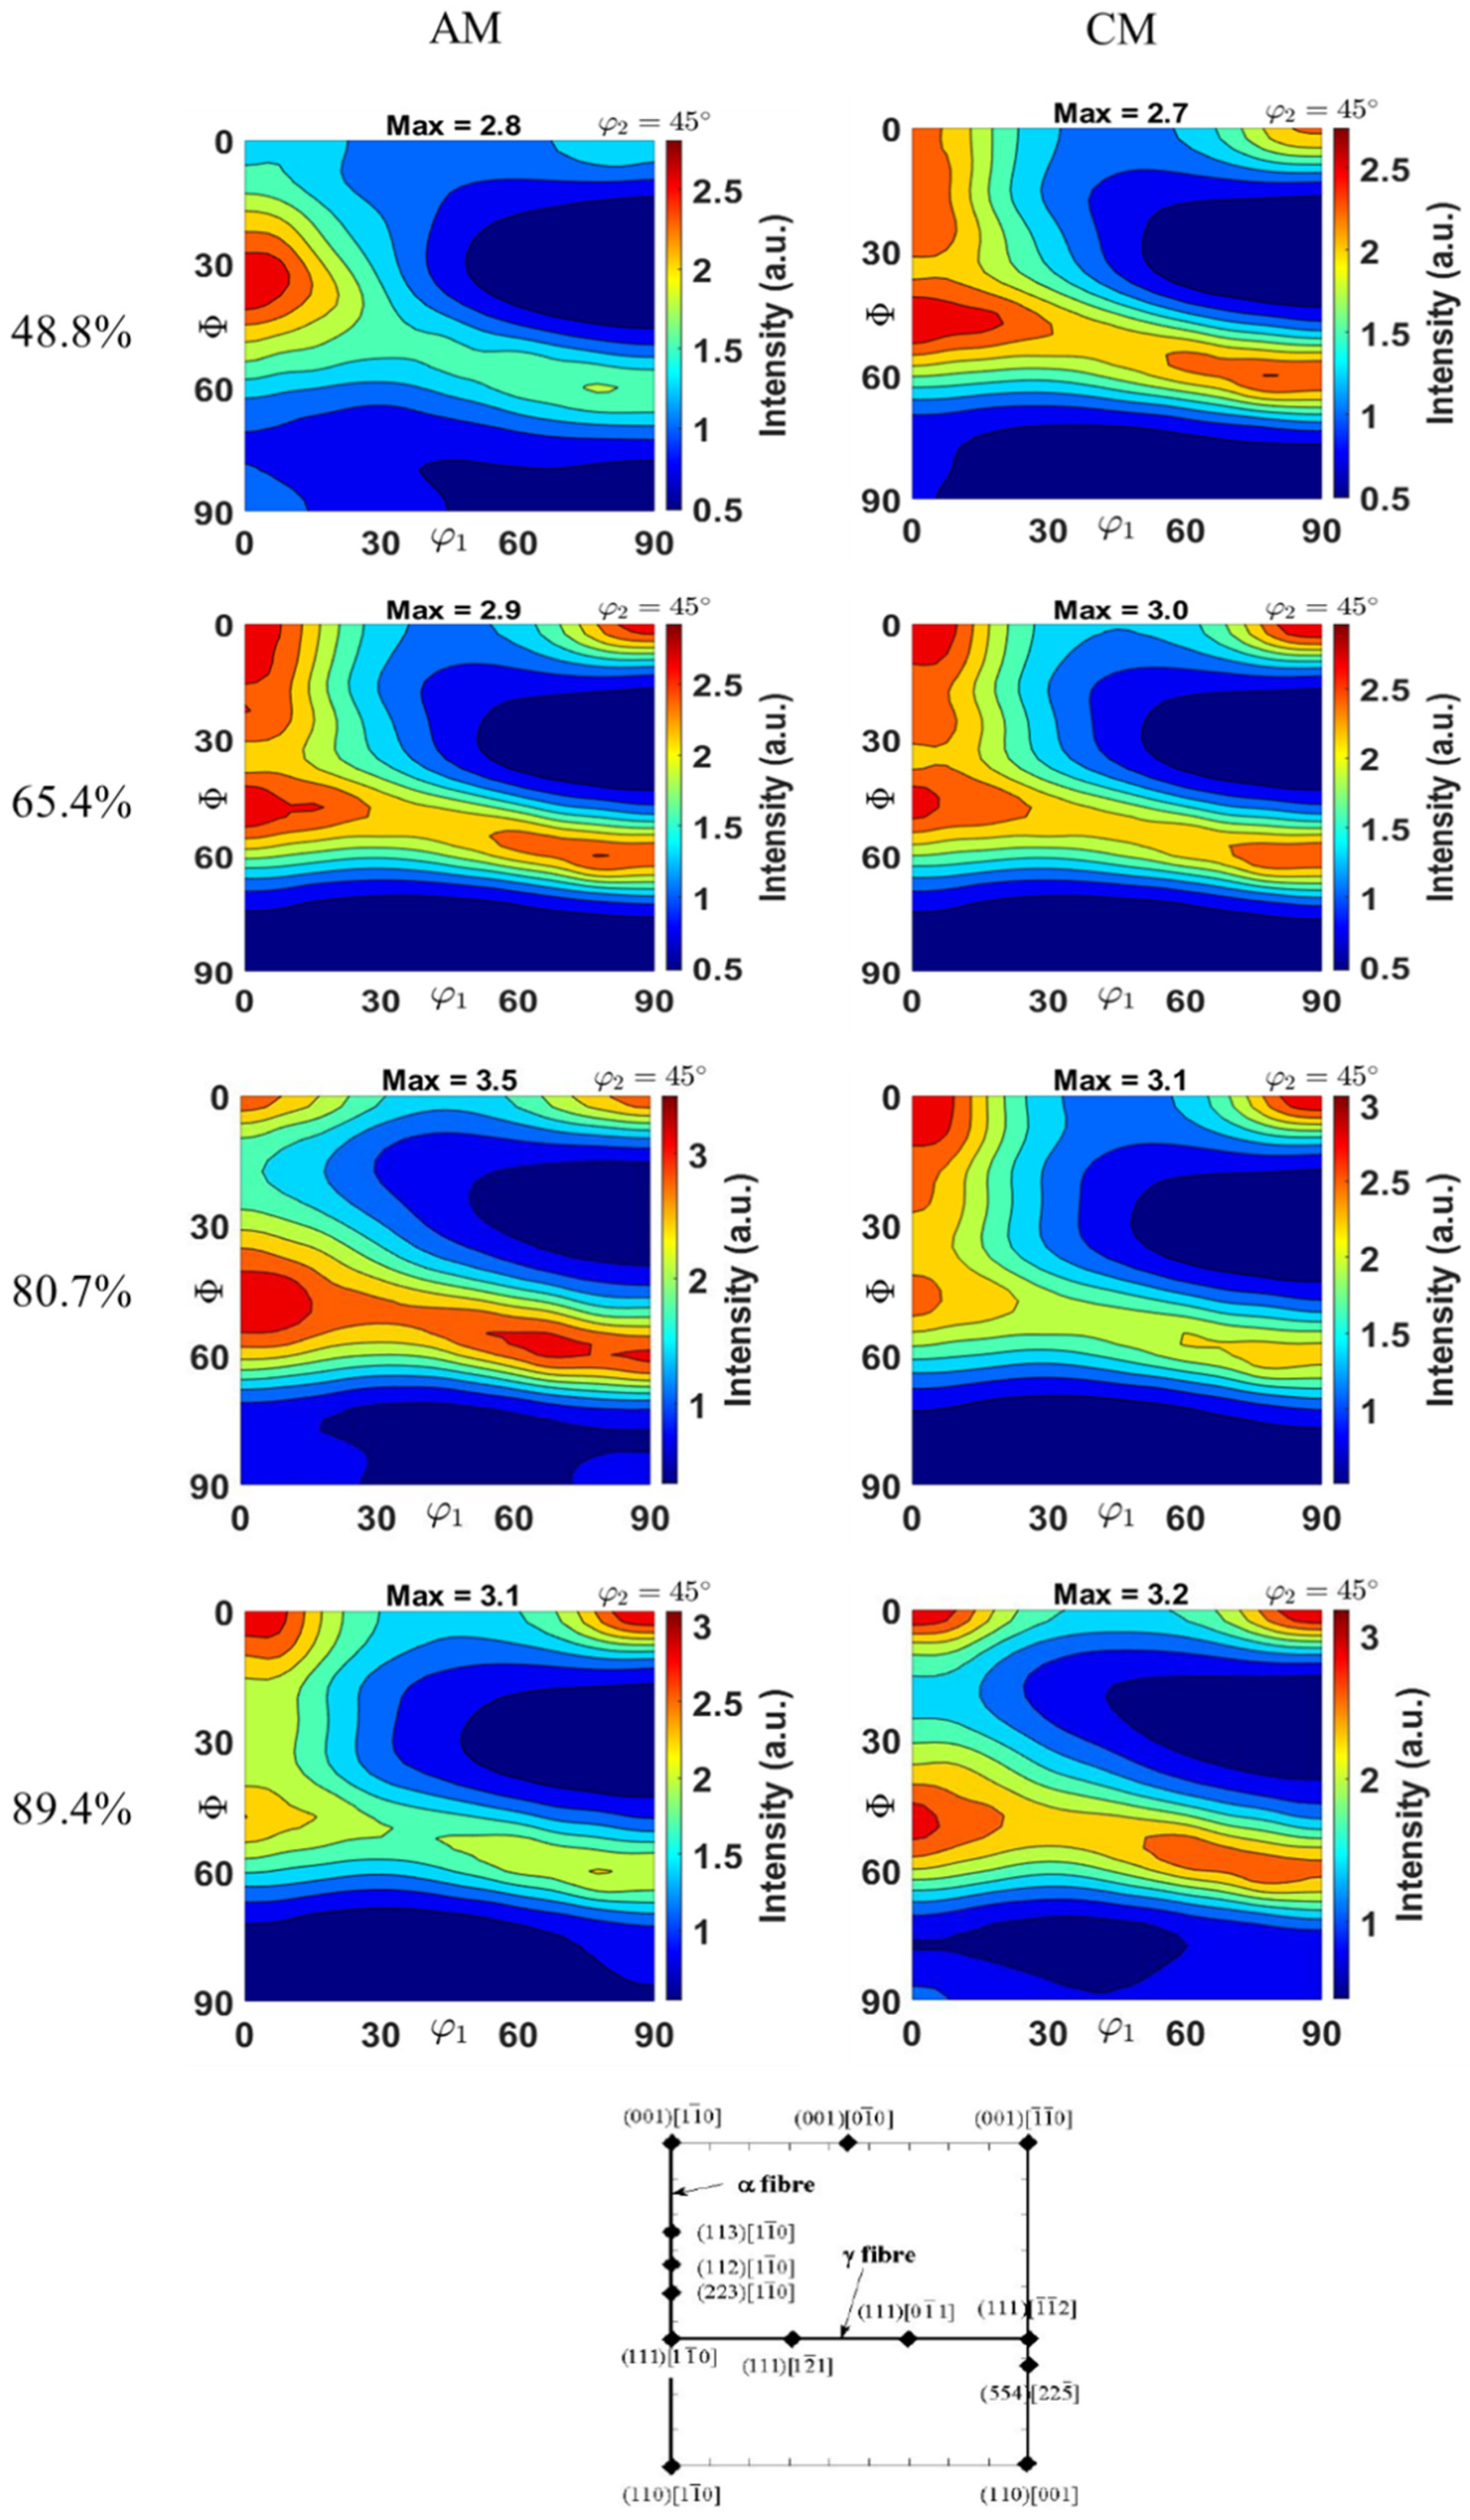
Figure 7 presents the ODFs for both materials (AM and CM) under the different deformation conditions. These images were generated based on the pole figures of the planes (110)α’, (200)α’ and (211)α’. At the bottom of the figure, there is a fiber/texture guide that was used as a base to analyze the ODF intensities.
Figure 7.
Orientation distribution functions (ODFs) of the additively manufactured (AM) and conventionally manufactured (CM) Maraging 300 steel samples at different cold rolling reductions, calculated from the (110)α’, (200)α’ and (211)α’ pole figures.
The early onset of a shear-band-dominated deformation regime in Maraging obtained through additive manufacturing stems primarily from its initial microstructural condition, characterized by high dislocation density, significant residual stresses, and heterogeneity associated with rapid solidification. These factors imply greater stored energy and lower stability of homogeneous plastic deformation, favoring early strain hardening saturation and the consequent localization of deformation at reduction levels lower than those observed in conventional materials. In contrast, Maraging processed by conventional routes exhibits a more homogeneous microstructure and lower initial defect density, which delays the transition to the localized deformation regime and preserves the progressive intensification of the γ-fiber at higher deformation levels [25,26,27].
A quantitative evaluation of the textural evolution was performed by extracting the maximum ODF intensity for each deformation condition (Table 4). The AM material exhibits a progressive strengthening of the fiber up to an 80.7% reduction, reaching a maximum ODF intensity of 3.5, followed by a decrease to 3.1 at an 89.4% reduction. This decrease is consistent with the orientation dispersion associated with early shear-band formation. In contrast, the CM material shows a gradual increase in the maximum ODF intensity from 2.7 to 3.2 with increasing cold rolling reduction. This indicates a more stable texture development, mainly associated with the fiber and the rotated cube component. The texture components were identified based on the standard BCC rolling texture skeleton in the ODF section. The analysis focused mainly on the -fiber , the -fiber , and the rotated cube component, which are typical texture features in cold-rolled BCC steels. Since the measured texture intensities were relatively low, the interpretation was made in terms of dominant fibers and component regions rather than sharp individual ideal orientations. The maximum ODF intensities were also quantified for each condition. For the AM samples, the maximum intensity increased from 2.8 at 48.8% reduction to 3.5 at 80.7% reduction, followed by a decrease to 3.1 at 89.4% reduction. This decrease indicates orientation dispersion and weakening of the -fiber, likely associated with shear-band formation at high deformation levels. For the CM samples, the maximum ODF intensity increased progressively from 2.7 to 3.2 with increasing cold rolling reduction, indicating a more stable development of the BCC rolling texture, mainly associated with the -fiber and rotated cube component.
Table 4.
Maximum ODF intensities and main texture features identified from the (φ2 = 45°) ODF section of cold-rolled AM and CM Maraging 300 steel.
Because the CM-80.7% condition exhibited a peak in hardness values (Figure 4) and represented the greatest contrast in hardness compared to the corresponding AM-80.7% condition, this specific reduction level was selected to investigate the strength–ductility balance between the AM and CM samples. This comparative investigation was conducted through tensile testing, fractography analysis, and EBSD.
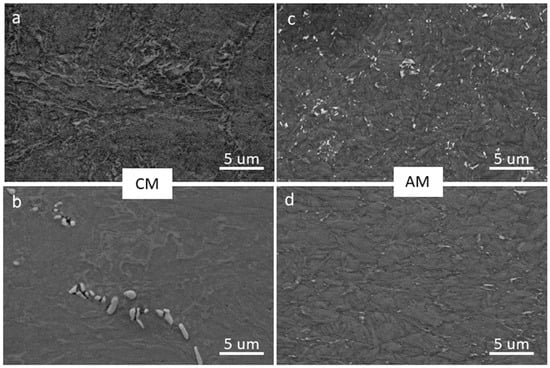
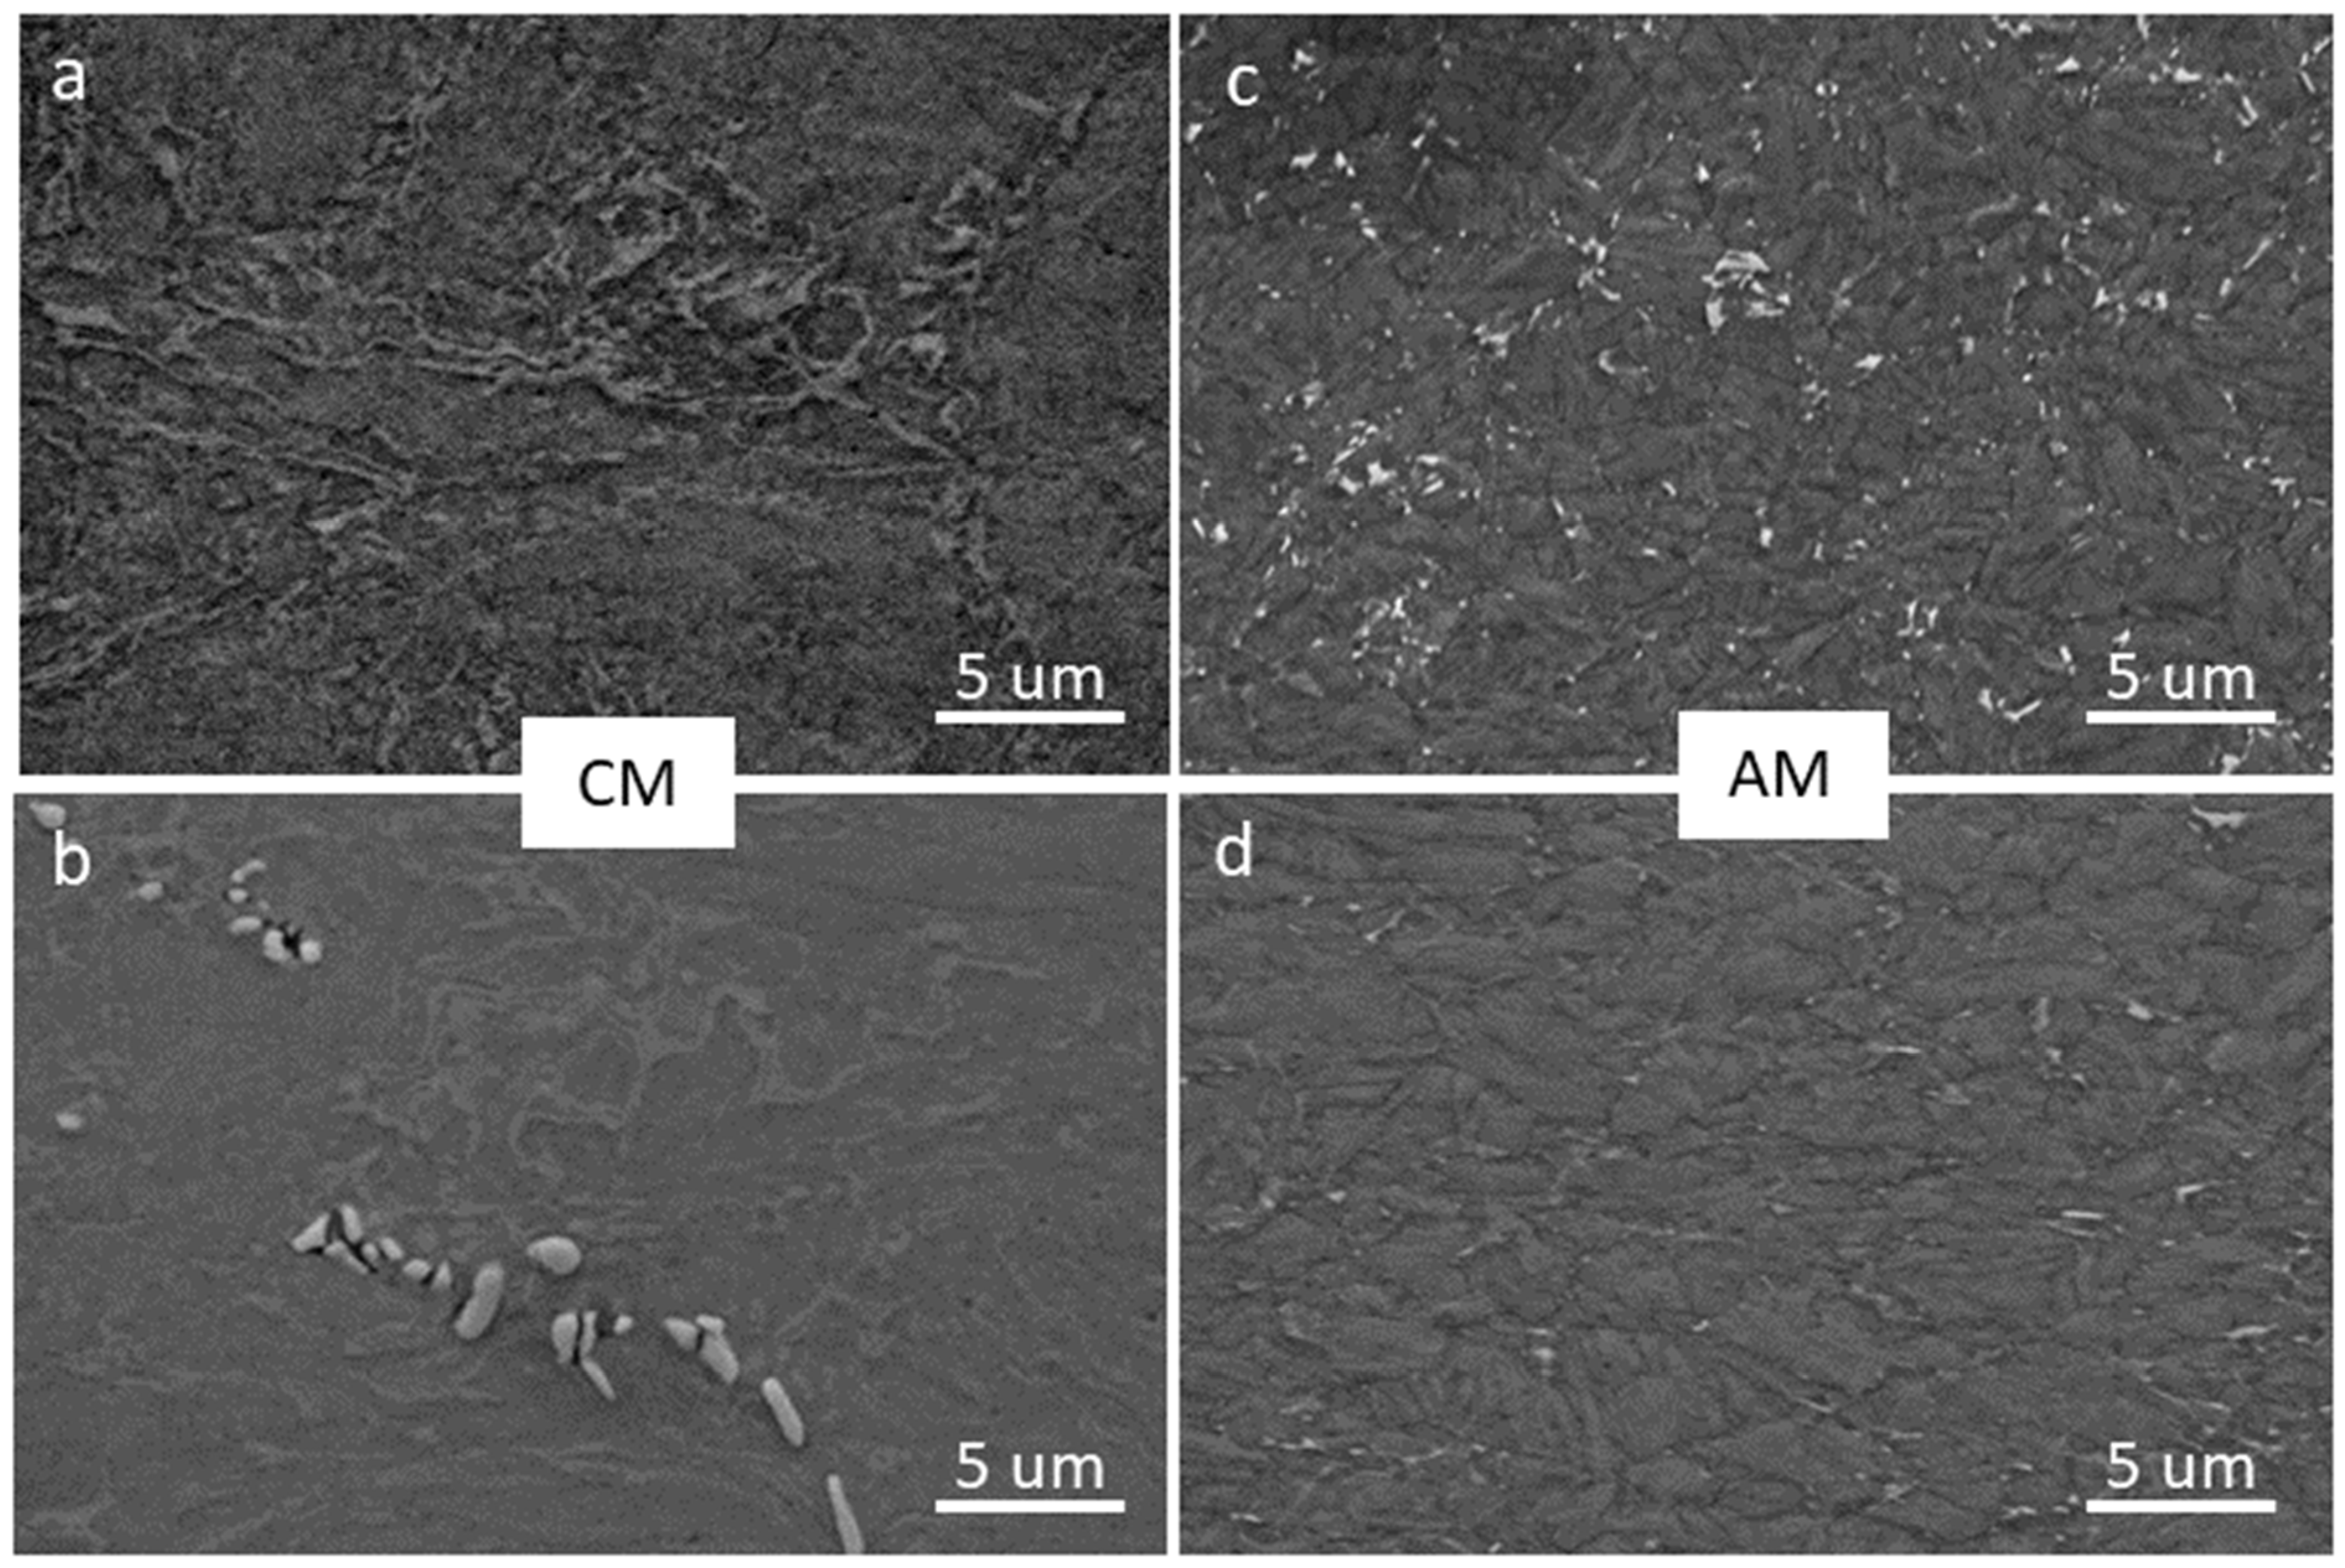
Figure 8 presents the SEM micrographs of the samples subjected to tensile testing, all of which show the presence of retained austenite in light gray. Figure 8c also reveals the presence of non-metallic inclusions, which appear as bright particles within the matrix. Such inclusions, particularly Ti and Al oxides, are a common finding in conventionally manufactured (CM) Maraging steels [28,29,30]. Because their exact chemical nature was not directly confirmed by EDS analysis in the present work, they are more accurately referred to as non-metallic inclusions exhibiting oxide-like morphology and contrast. Their chemical nature was not directly confirmed in the present work by EDS analysis. Therefore, through morphological examination, they can be referred to as non-metallic inclusions, presenting oxide-like shape and contrast.
Figure 8.
SEM micrographs of the Maraging 300 steel samples subjected to tensile testing, showing the presence of retained austenite regions (light-gray contrast) within the martensitic matrix. (a) and (b) for CM; (c) and (d) for AM.
Since the CM-80% condition presented the peak in the hardness values (Figure 4), while also being the condition with a higher hardness value contrast when compared to the AM-80% condition, this reduction level was selected to investigate the strength–ductility balance between AM and CM samples. The investigation was conducted through tensile tests, fractography analysis and EBSD.
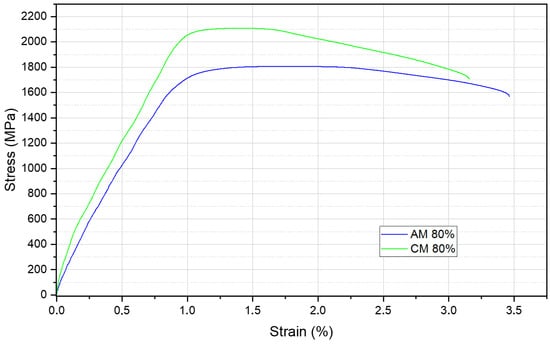
Figure 9 shows the tensile test results from the samples CM-80.7 (green) and AM-80.7 (blue). Even though the CM sample achieved a higher UTS value, the AM sample presented a rupture deformation percentage 9% higher. The ductility values were calculated based on the transversal section area reduction, resulting in 10.8% for CM-80.7 and 16.7% for AM-80.7. Table 5 presents the main values extracted from the tensile test curves (Figure 9).
Figure 9.
Engineering stress–strain curves of the conventionally manufactured (CM-80.7) and additively manufactured (AM-80.7) Maraging 300 steel samples obtained from tensile testing.
Table 5.
Mechanical property values extracted from the stress - strain curves.
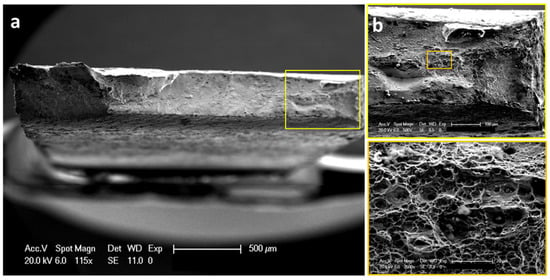
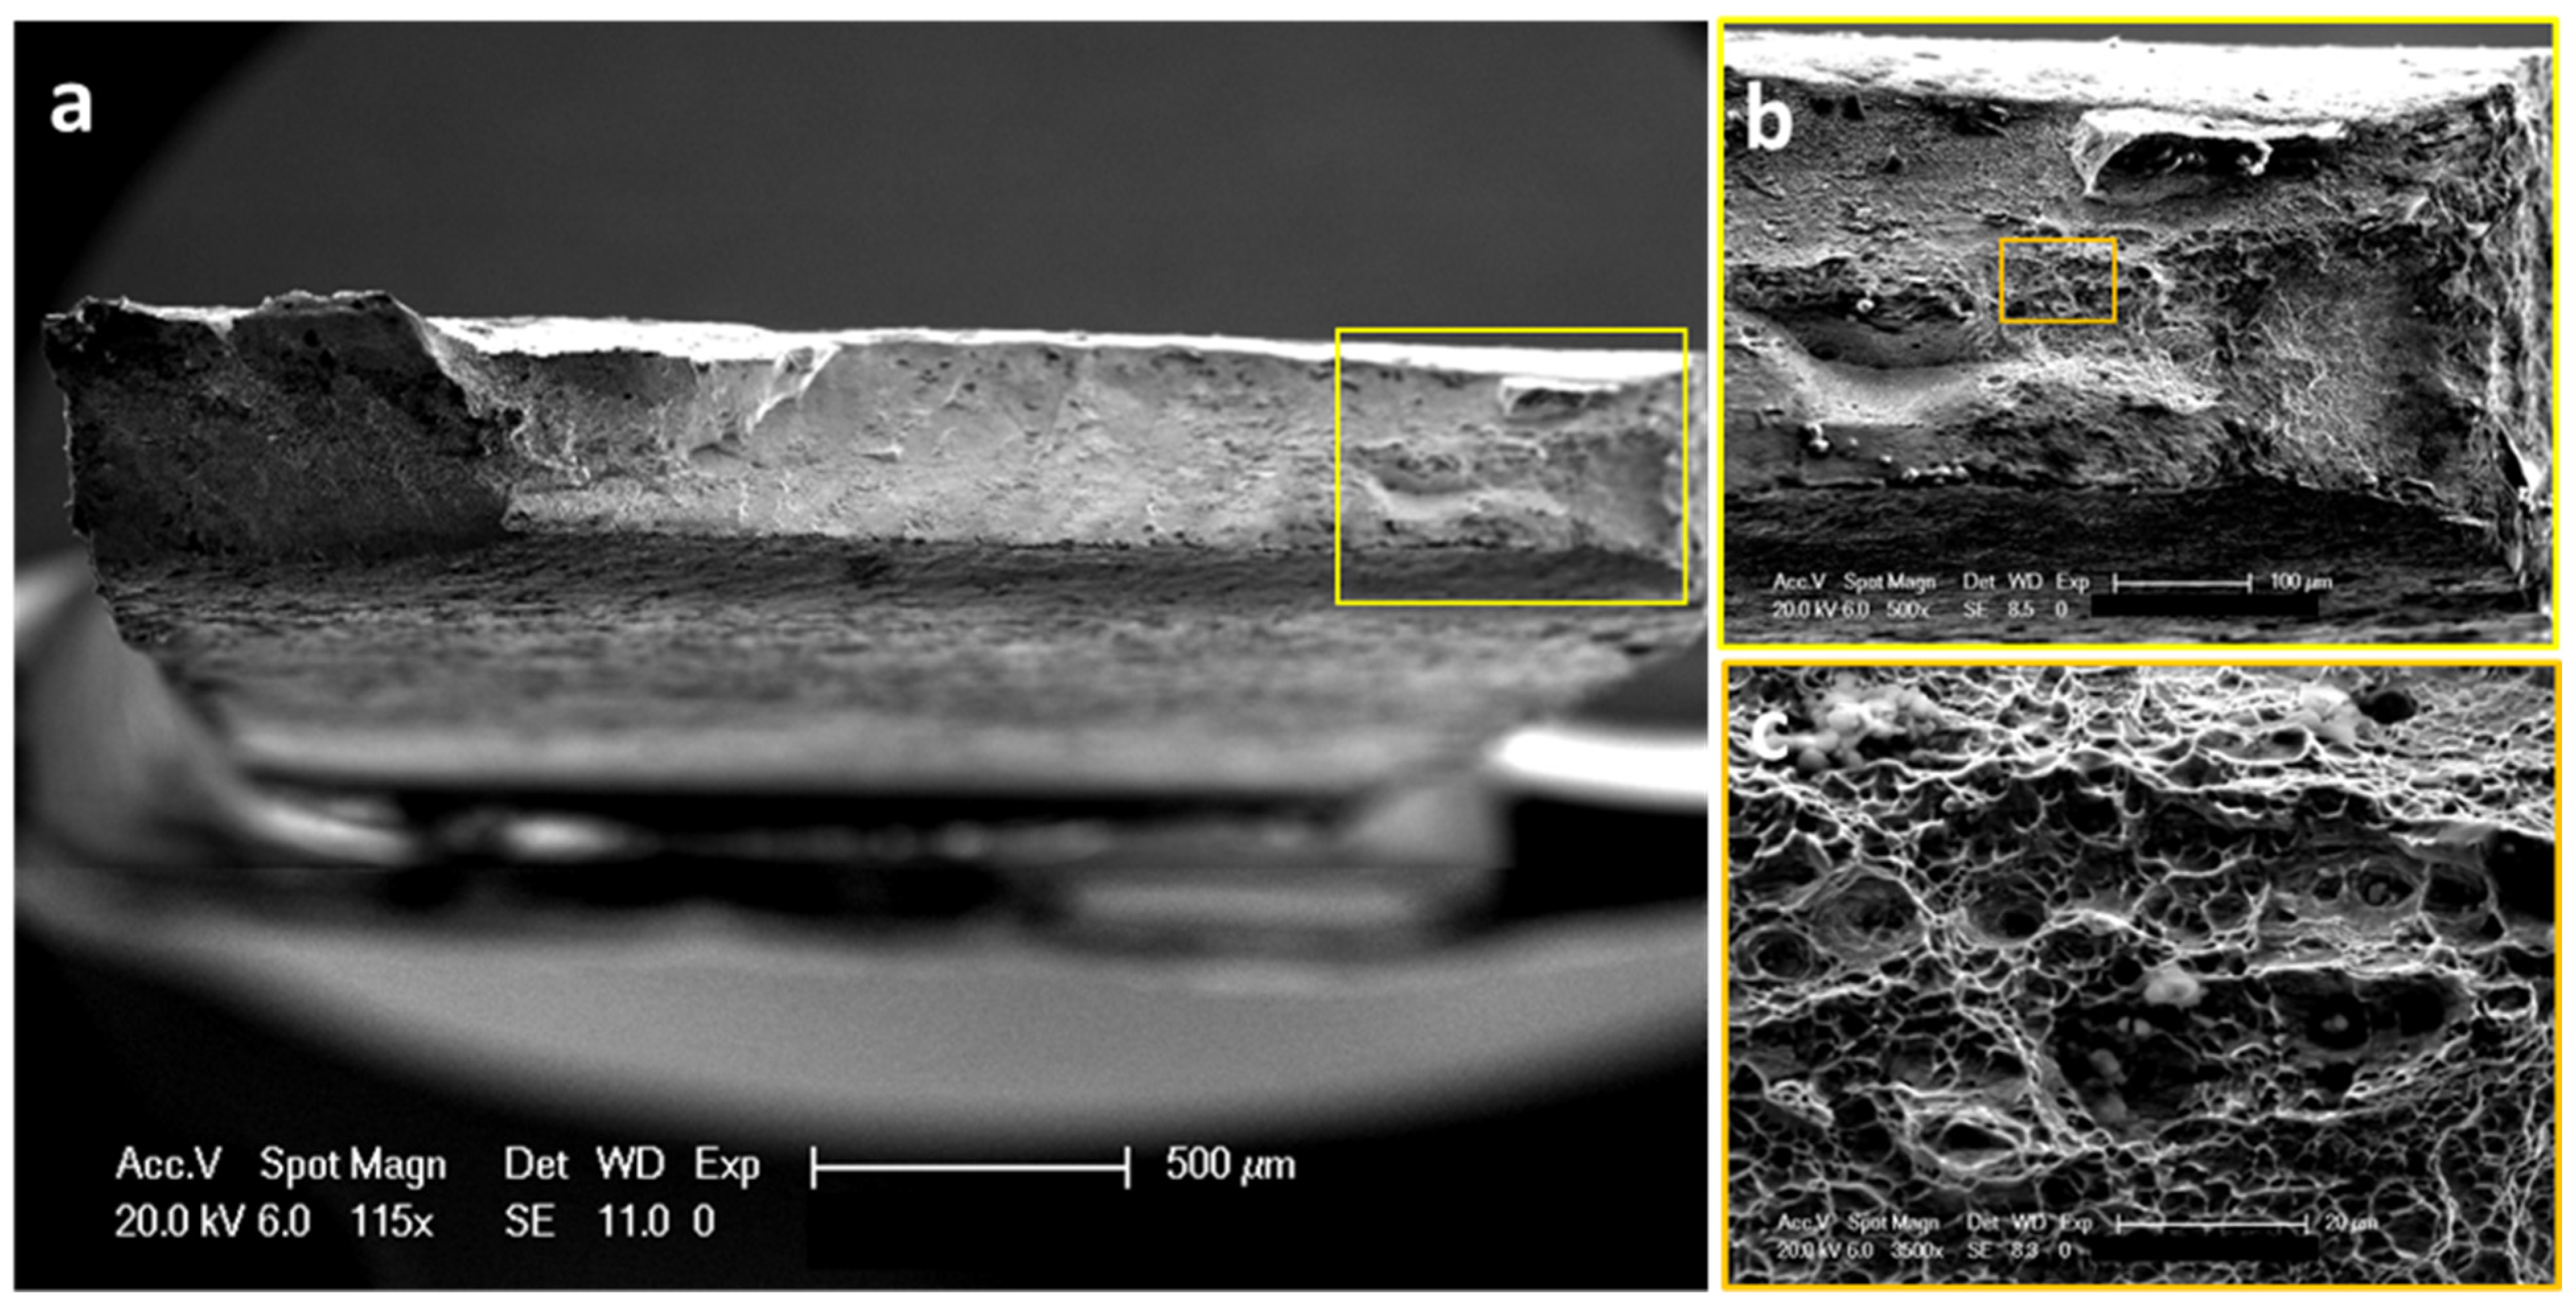
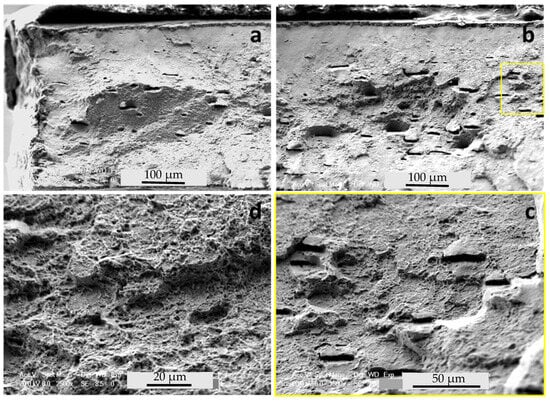
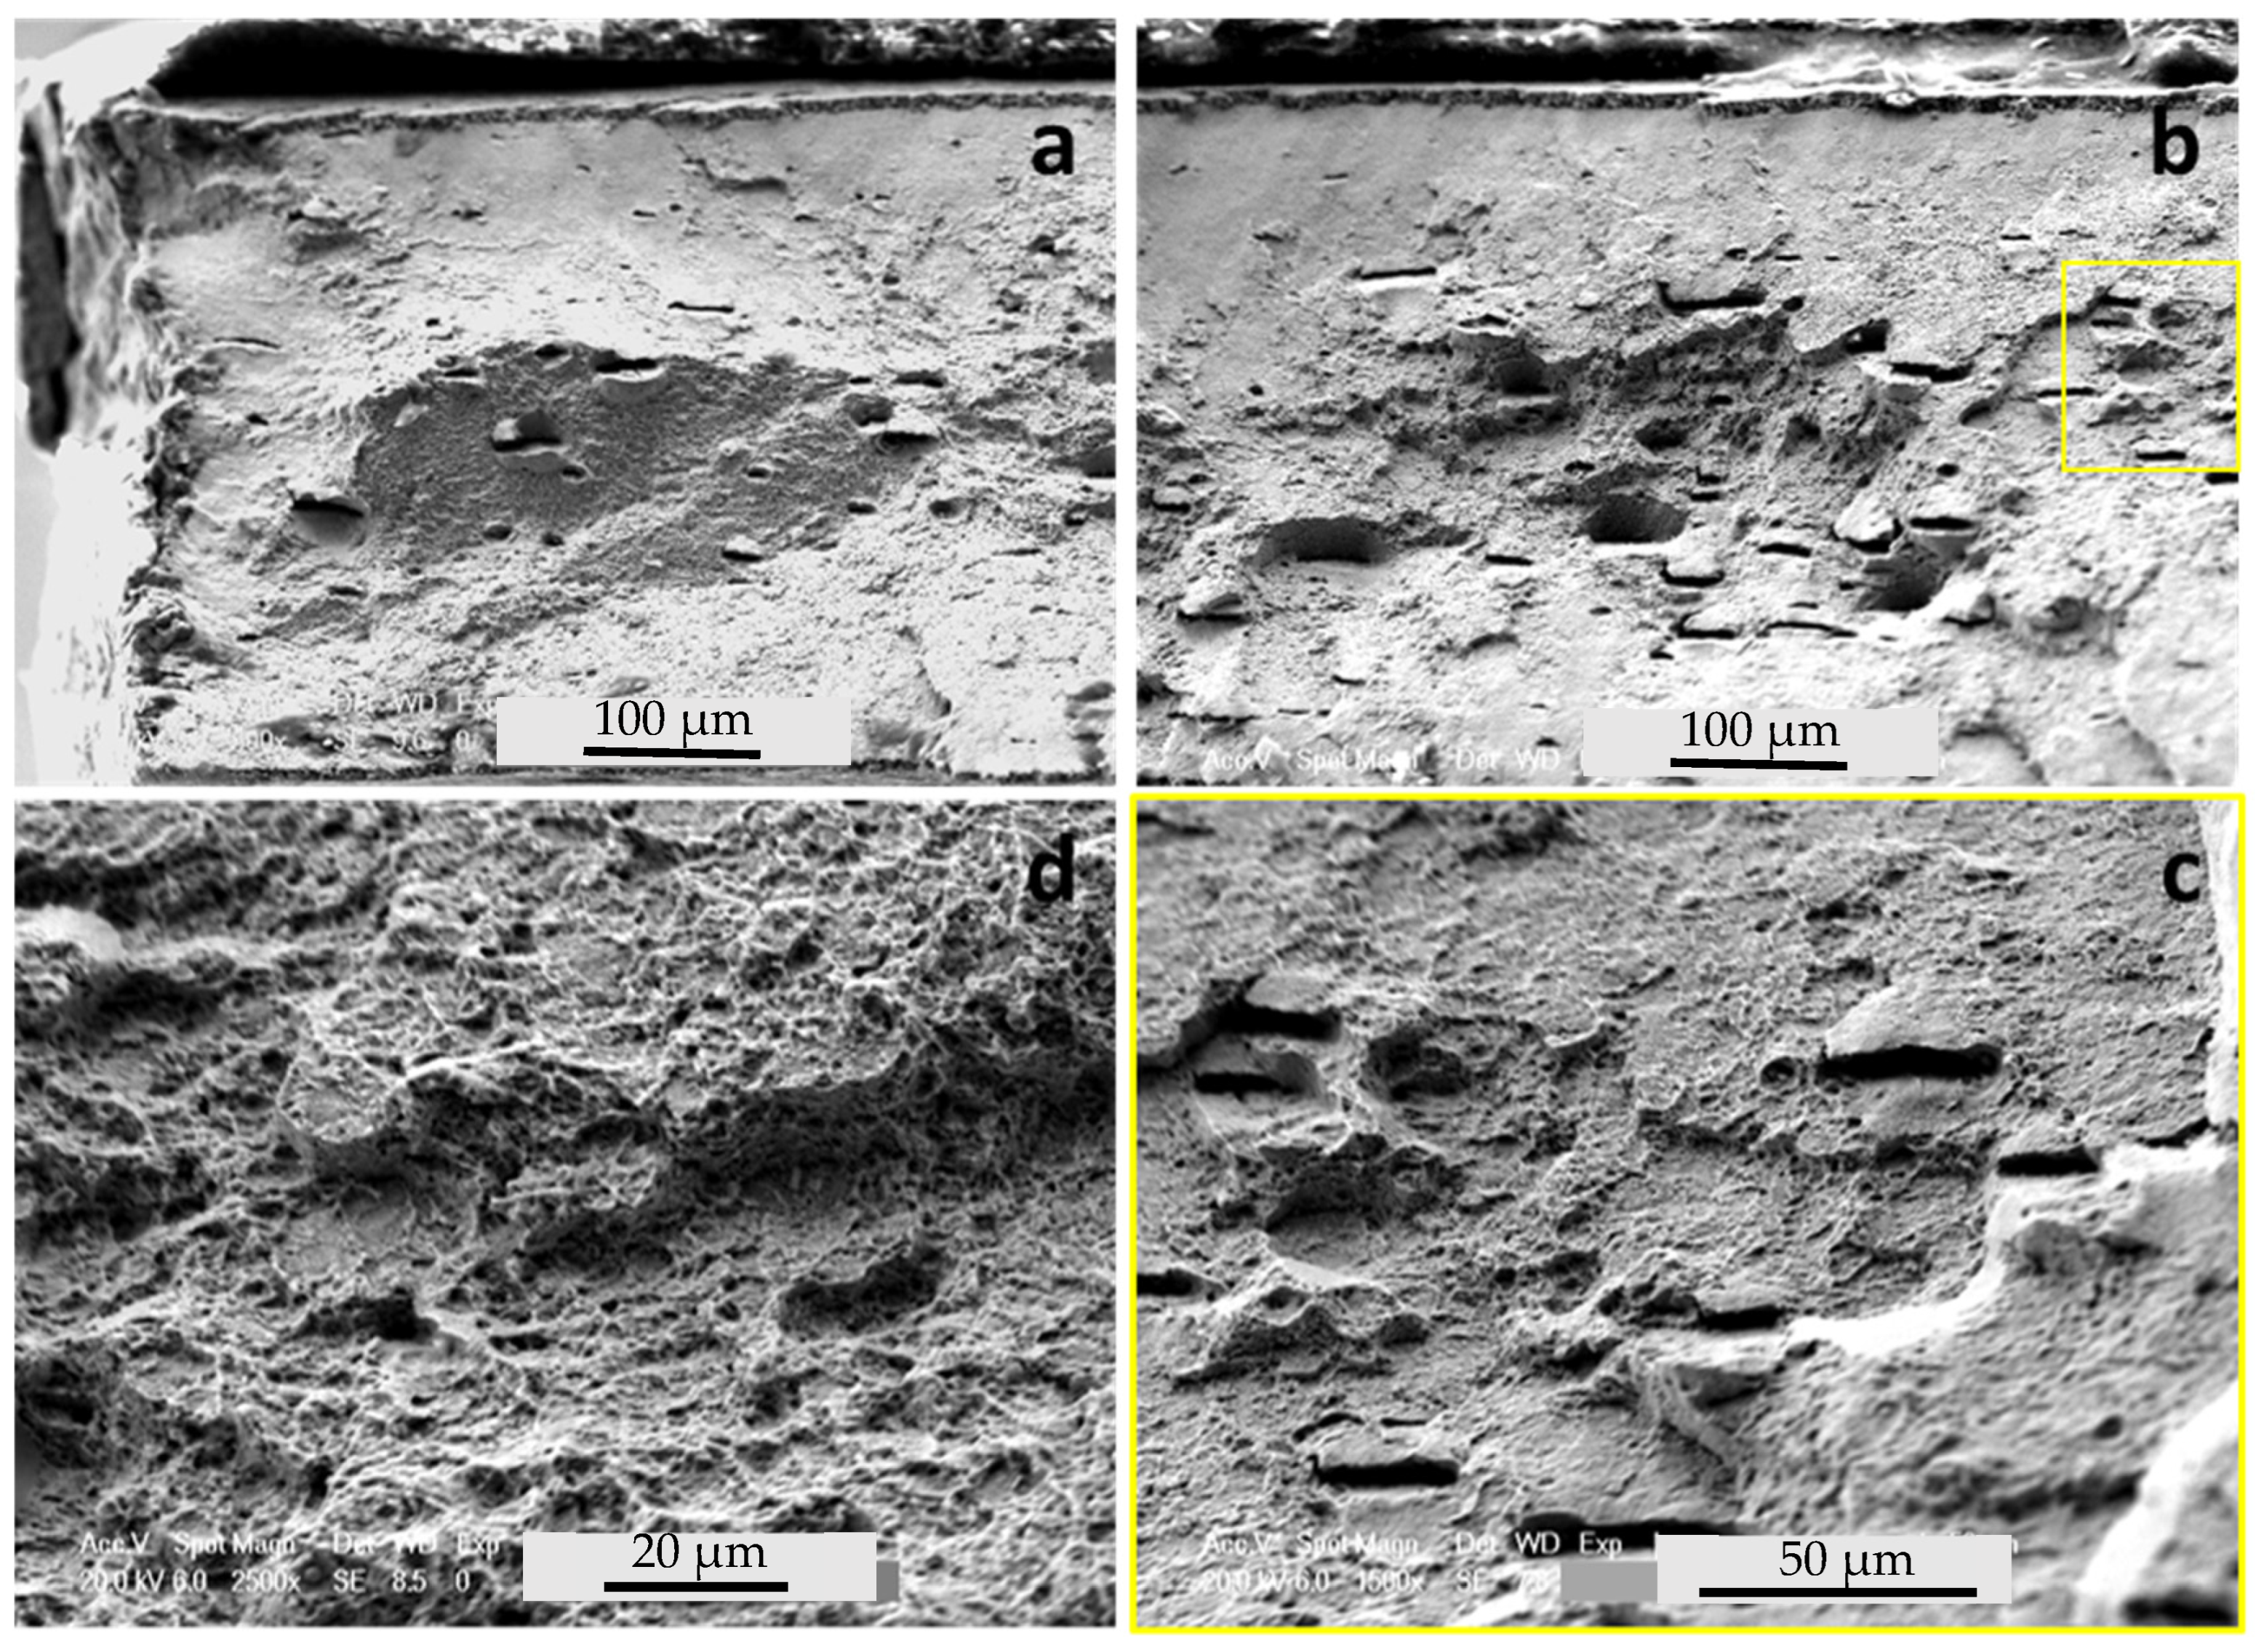
Figure 10 and Figure 11 present the fractographies for the two samples tested (Figure 9). Sample CM-80.7 (Figure 10) presents clear ductile behavior, as can be seen in detail in Figure 10b, as the dimples and cavities due to plastic deformation are evident. Observing Figure 11, one can see the fractography from sample AM-80.7, which shows a different behavior when compared to the previous sample. First, some flat regions, similar to cleavage surfaces, are observed on the top part of the fracture and several aligned cracks along the entire fracture surface (Figure 11a,b). A closer look is shown in Figure 11c. Second, despite these flat regions, a detailed look (Figure 11d) evidences the plastic deformation behavior with the presence of dimples all along the fracture. It is important to note that the fractographic analysis presented in this work was qualitative, aimed at identifying the dominant fracture features associated with each manufacturing route. The CM sample exhibited a predominantly ductile fracture morphology, characterized by extensive dimples and microvoid coalescence. In contrast, the AM sample showed mixed fracture features, including localized planar regions, aligned cracks, and ductile dimples. A detailed quantitative assessment of these features remains a subject for future investigations.
Figure 10.
SEM fractographies of the conventionally manufactured CM-80.7 Maraging 300 steel sample after tensile testing. (a) conventionally manufactured CM-80.7 Maraging 300 steel sample after tensile testing; (b,c) are magnifica-tions of the delineated region.
Figure 11.
SEM fractographs of the fracture surface of Maraging 300 steel after tensile testing. Images (a,b) show general views of the fractured surface, revealing heterogeneous regions of plastic deformation and cavities distributed along the section. Image (c), corresponding to the region highlighted in (b), shows cavities and pull-out regions in greater detail, associated with the nucleation, growth, and coalescence of microvoids with elongated shape. Image (d), obtained at higher magnification, reveals the presence of dimples, indicating a significant contribution of ductile fracture mechanisms.
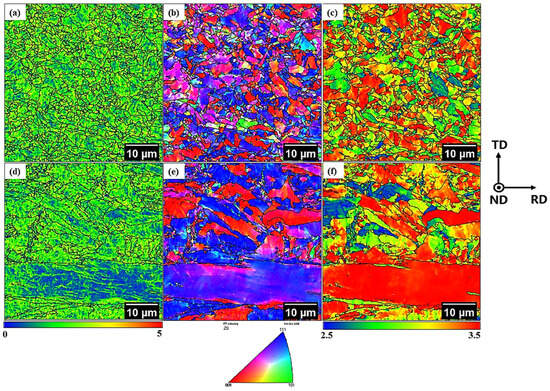
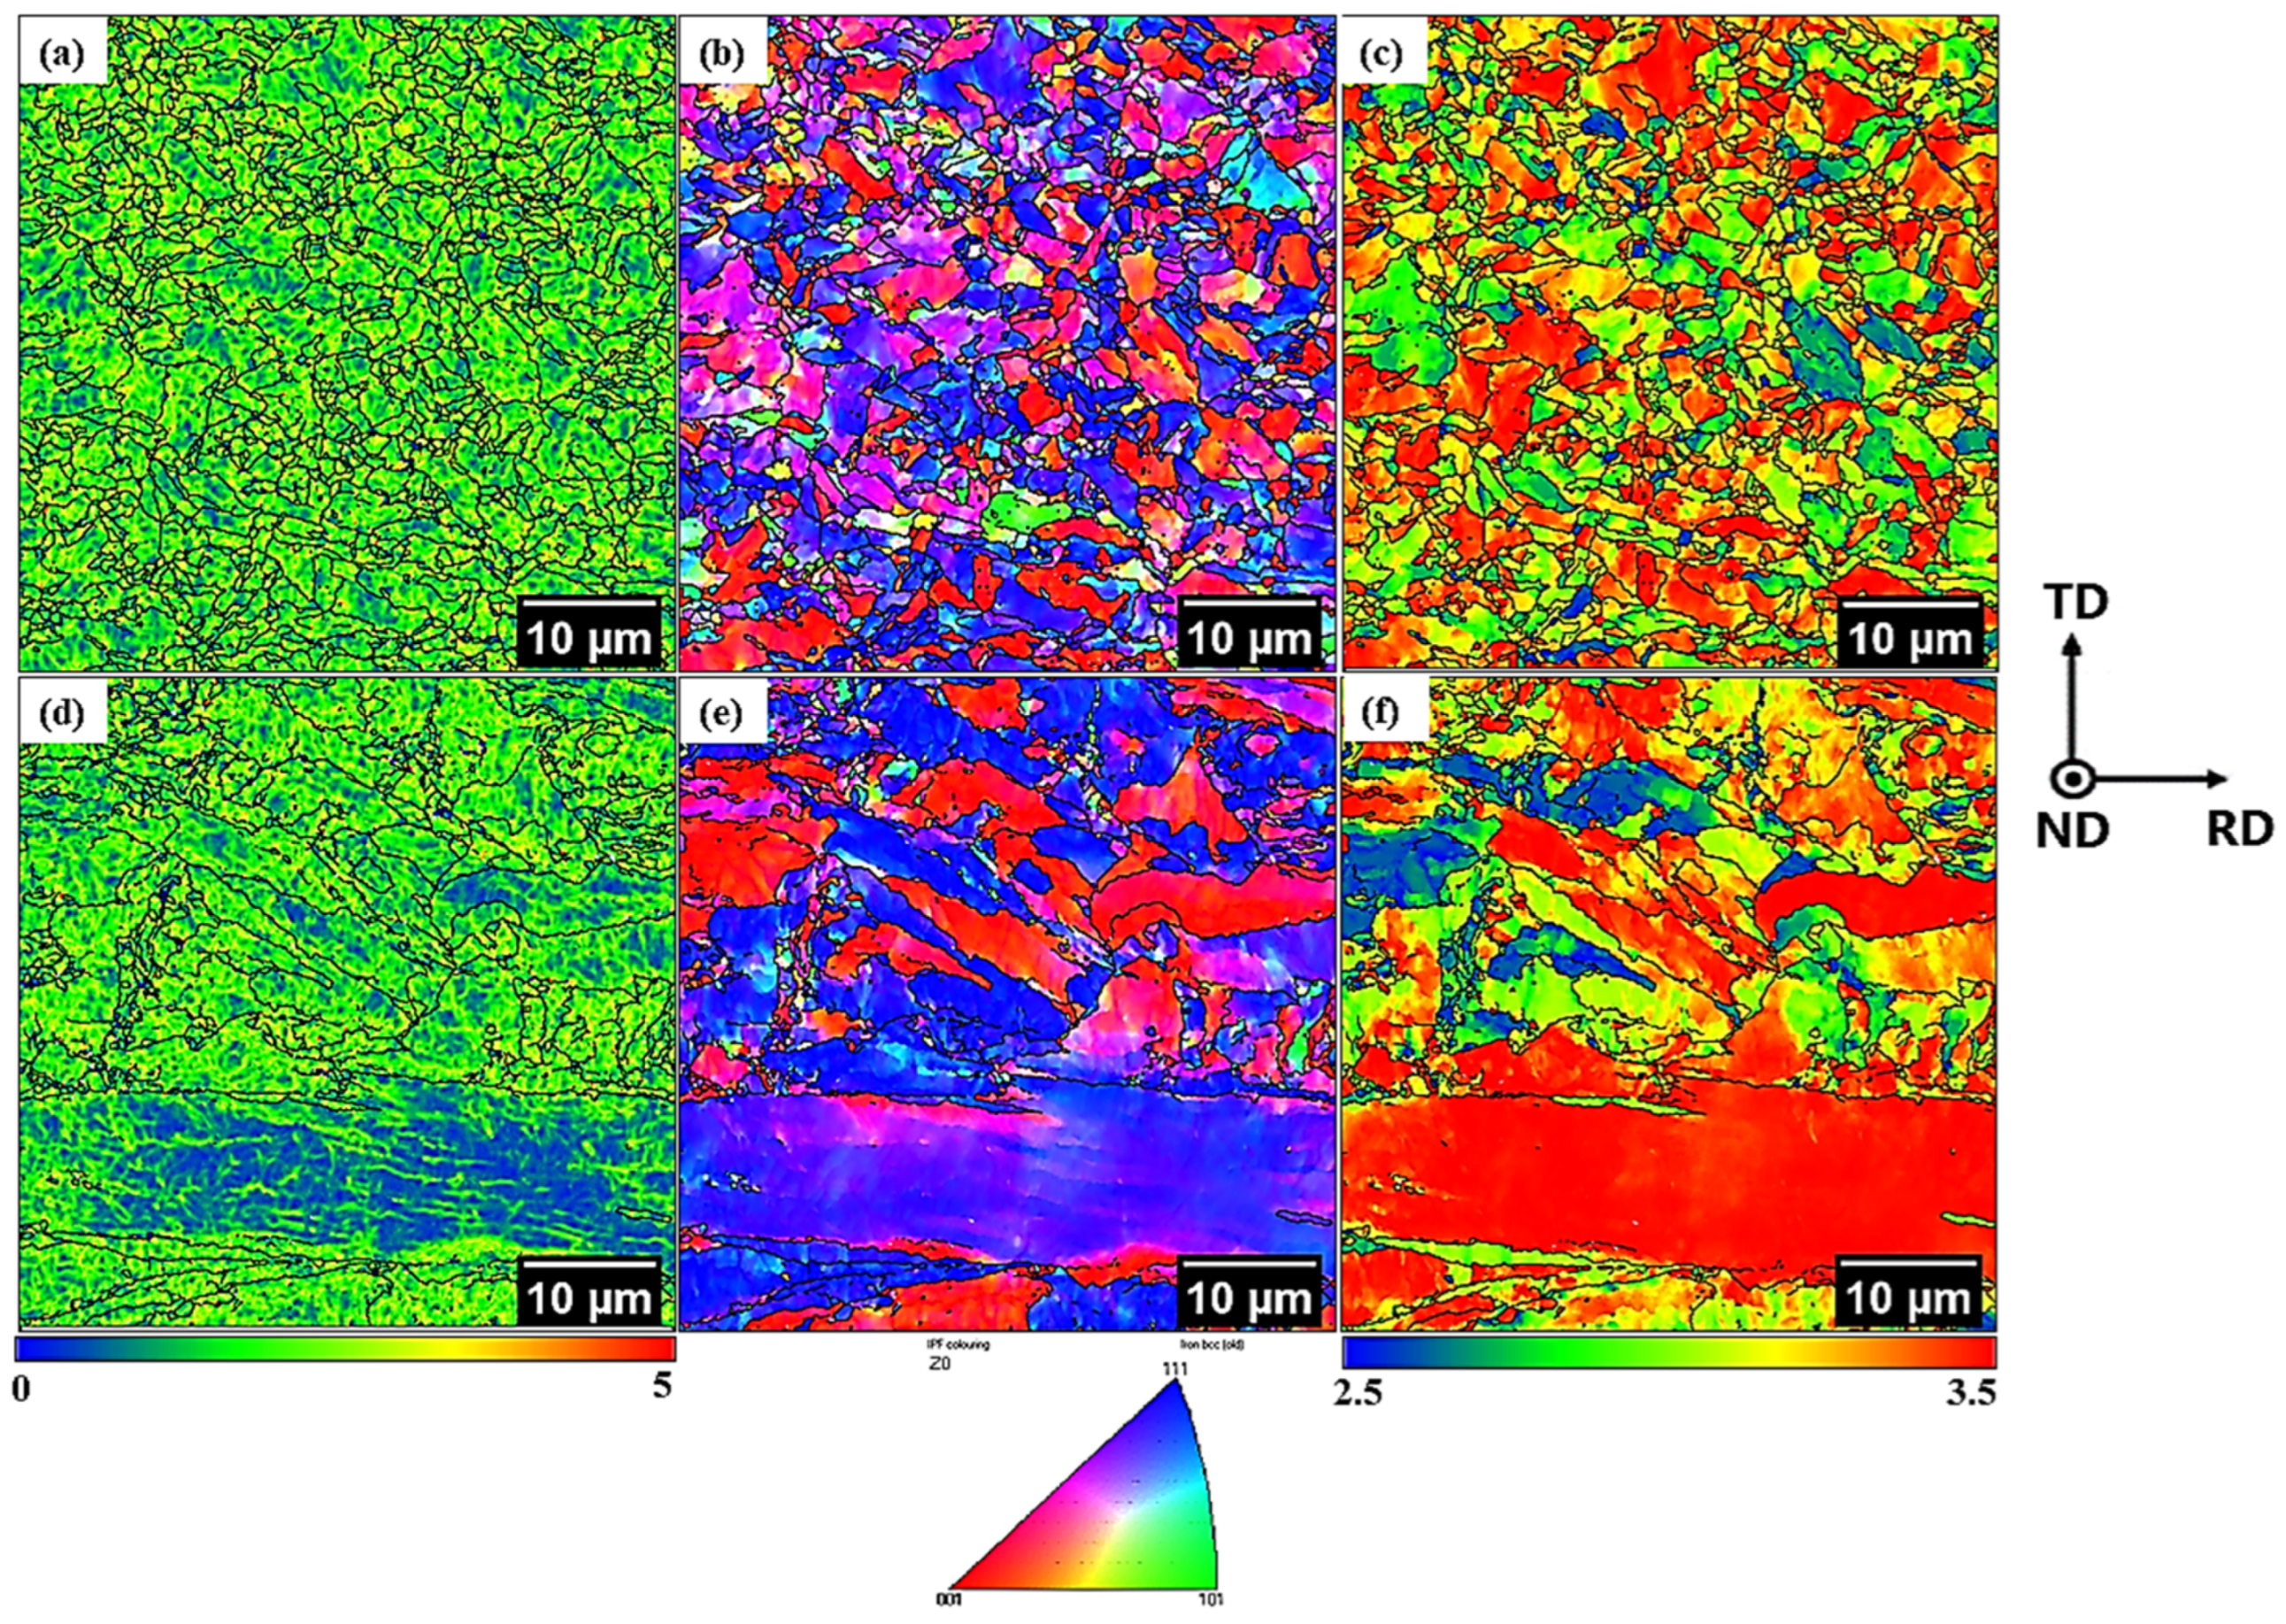
Figure 12 presents the EBSD maps obtained after tensile tests on Maraging 300 steel produced by additive manufacturing (AM) and conventional manufacturing (CM), both previously solution-heat-treated and cold-rolled with a thickness reduction of approximately 80%. The maps correspond to the Kernel Mean Disorientation (KAM), Inverse Pole Figure (IPF), and Taylor Factor distributions (Figure 12a–c, respectively), allowing correlation between local strain accumulation, crystallographic texture evolution, and strain accommodation mechanisms after severe plastic deformation and tensile loading. The evaluation of the KAM maps was based on the direct values ranging from 0° to 5°, as shown in the color scale at the bottom of the figure. These KAM values reveal distinct strain accommodation behaviors between the two manufacturing routes. For the additive manufacturing sample (Figure 12a), the distribution of local misorientation is comparatively more homogeneous, although localized regions with increased KAM values are still observed near the strain bands and grain boundaries. This behavior suggests that plastic deformation was distributed more uniformly throughout the microstructure during tensile loading.
Figure 12.
EBSD maps of additively manufactured (a–c) and conventionally processed (d–f) Maraging 300 steel after ~80% cold rolling and tensile deformation: KAM maps (a,d) showing local strain accumulation and GND distribution, IPF maps (b,e) revealing crystallographic orientation evolution and texture fragmentation, and Taylor Factor maps (c,f) indicating slip accommodation behavior and strain localization.
This behavior may be strongly associated with the characteristic cellular/columnar martensitic structure formed during SLM processing. As discussed earlier in this work, the rapid solidification conditions inherent in additive manufacturing produce high dislocation density, fine cellular substructures, and high energy stored in the martensitic matrix. Similar microstructural characteristics have been widely reported for SLM-produced 18Ni-300 Maraging steels and are known to significantly influence subsequent deformation behavior. Pantleon and co-workers [31] demonstrated that KAM values are directly related to local lattice curvature and geometrically necessary dislocation density (GND), making KAM maps particularly useful for evaluating local strain accumulation in plastically deformed materials. Under the additive manufacturing conditions presented here, the refined martensitic substructure and high density of internal interfaces appear to promote a more effective redistribution of strain during tensile deformation, reducing severe local stress concentration.
In contrast, the CM sample (Figure 12d) exhibits more pronounced KAM gradients, concentrated along elongated strain bands. These regions indicate a more pronounced local strain accumulation and an increase in GND density after tensile deformation. The strain localization in the CM sample is consistent with the higher maximum tensile strength obtained experimentally (~2105 MPa), combined with lower ductility (~10.8%), compared to the AM condition (~1807 MPa and ~16.7% ductility). Recent studies on 18Ni-300 steels manufactured by additive manufacturing have also shown that strain localization behavior is strongly influenced by local crystallographic misorientation inherited from the manufacturing route. Law et al. [32] reported that slip preferentially nucleates in grains exhibiting greater internal misorientation, with strain bands frequently intersecting regions with high KAM values. This interpretation agrees well with current observations.
The IPF maps also reveal important differences in texture evolution between the AM and CM conditions. This crystallographic texture plays a fundamental role during tensile testing. In BCC materials, the main slip systems are {110}<111>, {112}<111>, and {123}<111>. Thus, depending on the orientation of the grains relative to the loading direction, some grains exhibit greater ease in activating slip systems, while others accumulate higher internal stresses [33,34,35]. The color heterogeneity observed in the IPF maps of sample MA indicates precisely different local responses to plastic deformation. The AM sample (Figure 12b) exhibits highly fragmented crystallographic orientations with heterogeneous color distribution, indicating intense lattice rotation induced by severe deformation. Nevertheless, preferential orientations associated with the γ-fiber (<111>//ND) are still evident. As demonstrated by the ODF analysis presented earlier in this work, the AM material initially evolves through strengthening of the γ-fiber during cold rolling [33]. However, at high deformation levels, the texture intensity decreases due to orientation dispersion associated with the early formation of shear bands. Similar behavior has been reported for SLM Maraging steels subjected to severe deformation, where the high stored energy and heterogeneous defect distribution inherited from additive manufacturing accelerate the transition from homogeneous slip to localized shear-band-dominated deformation [23,34].
The fragmentation of crystallographic orientations observed in sample AM is therefore directly related to the instability of the homogeneous plastic flow promoted by: high initial dislocation density; residual stresses; cellular martensitic morphology; and local microsegregation generated during rapid solidification. In contrast, sample CM (Figure 12e) exhibits larger orientation clusters and more continuous deformation bands aligned in the lamination direction. This behavior suggests a more stable crystallographic rotation regime during deformation, delaying the onset of severe shear localization. The evolution of the more organized texture observed in the conventional material is fully consistent with the ODF results discussed earlier in this work. The Taylor Factor maps further corroborate these observations. The Taylor Factor represents the amount of crystallographic slip required to accommodate an imposed macroscopic deformation. Regions exhibiting higher Taylor Factor values are less favorably oriented for slip activation and therefore tend to accumulate higher internal stresses during deformation [35,36,37,38].
For sample AM (Figure 12c), the Taylor Factor distribution remains comparatively uniform, with a predominance of intermediate values distributed throughout the microstructure. This result suggests a more distributed strain accommodation among the grains, despite the crystallographic heterogeneity introduced by additive manufacturing. Interestingly, Sanjari et al. [39] investigated the texture and evolution of the Taylor Factor in SLM Maraging steels and concluded that the mechanical response is strongly influenced by grain morphology, retained austenite, and local stress concentration conditions, and not only by crystallographic texture. On the other hand, sample CM (Figure 12f) exhibits elongated regions with high Taylor Factor values concentrated along the strain bands. These regions have grains that are less favorably oriented for plastic deformation and, therefore, more susceptible to local stress accumulation and strain localization. A clear demonstration can also be seen between the Taylor Factor and KAM distributions, where regions with higher Taylor Factor values simultaneously exhibit steeper local misdirection gradients.
Calcagnotto et al. [40] demonstrated that regions with a high Taylor factor frequently coincide with greater GND accumulation and local deformation mismatch in severely deformed steels. The results presented here follow the same trend. Although the CM condition exhibited greater strength, the EBSD analysis indicates that the AM material accommodated the deformation more homogeneously, contributing to its superior ductility. This interpretation is also corroborated by the fracture surface analysis presented earlier in this work, where the AM sample showed the coexistence of localized planar regions and ductile cavities, indicating complex local deformation mechanisms, while the CM material exhibited a predominantly homogeneous ductile fracture morphology. Therefore, the EBSD results demonstrate that the deformation behavior after severe rolling and tensioning strongly depends on the initial microstructural condition imposed by the manufacturing route. The material manufactured by additive manufacturing exhibits greater crystallographic fragmentation, earlier activation of shear-band-mediated deformation, and more distributed strain accommodation, while the conventionally processed material shows greater strain localization and higher internal stress concentration in preferential strain bands. These differences explain the distinct balance between strength and ductility observed experimentally for both processing routes.
4. Conclusions
The present study evaluated the influence of severe cold rolling deformation on the microstructural evolution, crystallographic texture, hardness, and mechanical behavior of conventionally manufactured (CM) and additively manufactured (AM) Maraging 300 steel. The results demonstrated that both processing routes exhibit comparable mechanical performance after thermomechanical processing, although significant differences in texture evolution and deformation mechanisms were observed as a consequence of their distinct initial microstructural conditions.
The additively manufactured material exhibited the characteristic cellular/columnar microstructure associated with the rapid solidification inherent to the selective laser melting process, together with retained austenite and pronounced microstructural heterogeneity. After solid solution treatment and subsequent cold rolling, the initial solidification structure was no longer preserved, indicating substantial microstructural modification promoted by thermomechanical processing.
Hardness measurements revealed that both AM and CM conditions reached similar hardness levels after aging treatment, confirming the effectiveness of precipitation hardening in both manufacturing routes. However, the conventionally processed material exhibited a pronounced hardness peak at 80.7% rolling reduction, followed by a decrease at the highest deformation level, whereas the AM samples showed comparatively stable hardness values throughout the investigated deformation range. This behavior suggests earlier saturation of strain hardening mechanisms in the additively manufactured condition, likely associated with its elevated initial dislocation density, residual stress state, and microstructural heterogeneity inherited from the additive manufacturing process.
Crystallographic texture analyses demonstrated the progressive development of γ-fiber and α-fiber components with increasing rolling reduction for both processing routes. In the AM material, the γ-fiber intensity increased up to approximately 80% deformation and subsequently decreased at 89.4% reduction, indicating the onset of a deformation regime dominated by shear-band formation and orientation dispersion. In contrast, the CM material preserved the progressive intensification of the texture components at higher deformation levels, reflecting the greater stability of homogeneous plastic deformation in the conventionally processed microstructure.
Mechanical testing indicated that the CM-80.7 condition achieved higher ultimate tensile strength, whereas the AM-80.7 sample exhibited superior elongation at fracture. Fractographic analyses revealed predominantly ductile fracture behavior for the conventionally processed sample, characterized by extensive microvoid coalescence and dimple formation. Conversely, the additively manufactured condition presented mixed fracture characteristics, combining cleavage-like regions and aligned cracks with localized ductile deformation features.
Overall, the results demonstrate that the initial microstructural condition imposed by additive manufacturing strongly influences the deformation mechanisms, texture evolution, and fracture behavior of Maraging 300 steel subjected to severe cold rolling. Nevertheless, the additively manufactured material exhibited mechanical properties comparable to those of the conventionally processed steel, highlighting the potential of selective laser melting for the production of high-strength Maraging steels for advanced structural applications.
Author Contributions
Conceptualization, H.F.G.A.; methodology, R.C.A.V.G.B. and M.N.S.L.; software, M.N.S.L.; validation, L.M.F., M.B. and H.F.G.A.; formal analysis, R.C.A.V.G.B. and M.N.S.L.; investigation, R.C.A.V.G.B., M.N.S.L., L.F.G.H. and F.N.C.F.; resources, S.F.R. and H.F.G.A.; data curation, R.C.A.V.G.B. and M.N.S.L.; writing—original draft preparation, R.C.A.V.G.B.; writing—review and editing, L.M.F., M.B., S.F.R., M.N.S.L. and H.F.G.A.; visualization, R.C.A.V.G.B. and M.N.S.L.; supervision, H.F.G.A.; project administration, H.F.G.A.; funding acquisition, H.F.G.A. All authors have read and agreed to the published version of the manuscript.
Funding
This research was funded by the Research and Support Coordination for the Improvement of Higher Education Personnel of Brazil (CAPES). Brazilian National Council for Scientific and Technological Development (CNPq), grant number 408380/2022-5. Fundação de Amparo à Pesquisa e ao Desenvolvimento Científico e Tecnológico do Maranhão (FAPEMA) and PRPGI–IFMA.
Data Availability Statement
The datasets generated and/or analyzed during the current study are available from the corresponding author on reasonable request.
Acknowledgments
The authors gratefully acknowledge the team of the Materials Characterization Laboratory (LACAM) and the Analytical Center from the Federal University of Ceará (UFC), as well as the Laboratory for Mechanical and Thermomechanical Testing—LabEnsaios of the Federal Institute of Maranhão. This work is part of doctoral research in Physical and Mechanical Properties of Materials within the Post-Graduate Program in Materials Science and Engineering at the Department of Metallurgical and Materials Engineering (UFC).
Conflicts of Interest
The authors declare no conflicts of interest.
References
- Zafar, M.Q.; Sajjad, R.; Anwar, M.T.; Mustafa, M.S.; Husnain, N.; Bin Aqeel, A.; Khan, M.B. A review on metal additive manufacturing-types, applications and future trends. Recent Prog. Mater. 2025, 7, 6. [Google Scholar] [CrossRef] [Scilit]
- DebRoy, T.; Wei, H.L.; Zuback, J.S.; Mukherjee, T.; Elmer, J.W.; Milewski, J.O.; Beese, A.M.; Wilson-Heid, A.; De, A.; Zhang, W. Additive manufacturing of metallic components–process, structure and properties. Prog. Mater. Sci. 2018, 92, 112–224. [Google Scholar] [CrossRef] [Scilit]
- Ben Said, L.; Ayadi, B.; Alharbi, S.; Dammak, F. Recent Advances in Additive Manufacturing: A Review of Current Developments and Future Directions. Machines 2025, 13, 813. [Google Scholar] [CrossRef] [Scilit]
- Rohrbach, K.; Schmidt, M. Maraging steels. In Properties and Selection: Irons, Steels, and High-Performance Alloys; ASM International: Materials Park, OH, USA, 1990; pp. 793–800. [Google Scholar]
- Feitosa, A.L.M.; da Fonseca, D.P.M.; de Carvalho, L.G.; Padilha, A.F. Dilatometric Insights into Classical and Modern Maraging Steels: A Comparative Analysis of Grades 300, 350, and 400. Tecnol. Metal. Mater. Min. 2025, 22, e3002. [Google Scholar] [CrossRef] [Scilit]
- Engler, O.; Zaefferer, S.; Randle, V. Introduction to Texture Analysis: Macrotexture, Microtexture, and Orientation Mapping, 3rd ed.; CRC Press: Boca Raton, FL, USA, 2024. [Google Scholar] [CrossRef] [Scilit]
- Masoumi, M.; de Barros, I.F.; Herculano, L.F.G.; Coelho, H.L.F.; de Abreu, H.F.G. Effect of microstructure and crystallographic texture on the Charpy impact test for maraging 300 steel. Mater. Charact. 2016, 120, 203–209. [Google Scholar] [CrossRef] [Scilit]
- Leão, P.B.P. Microscale Analyses of SAE1075 Steel Under Different Stages of Lab-Simulated Process Routes Based on Wire Manufacturing for Tensile Armor Application in Flexible Pipes. Ph.D. Thesis, Universidade Federal do Ceará, Fortaleza, Brazil, 2023. [Google Scholar]
- Decker, R.F.; Novak, C.J.; Landig, T.W. Developments and projected trends in maraging steels. JOM 1967, 19, 60–66. [Google Scholar] [CrossRef] [Scilit]
- ASTM E8/E8M-16a; Standard Test Methods for Tension Testing of Metallic Materials. ASTM International: Con-shohocken, PA, USA, 2020.
- Peinado, G.; Carvalho, C.; Jardini, A.; Souza, E.; Avila, J.A.; Baptista, C. Microstructural and Mechanical Characterization of Additively Manufactured Parts of Maraging 18Ni300M Steel with Water and Gas Atomized Powders Feedstock. Int. J. Adv. Manuf. Technol. 2024, 130, 223–237. [Google Scholar] [CrossRef] [Scilit]
- Santana, A.; Eres-Castellanos, A.; Królicka, A.; Clarke, A.J.; Capdevila, C.; Caballero, F.G. Solute Redistribution During Aging in a Laser-Based Powder Bed Fusion-Produced Fe-18Ni-9Co-5Mo-Ti Maraging Steel. JOM 2025, 77, 9351–9365. [Google Scholar] [CrossRef] [Scilit]
- Li, H.; Yang, Q.; Yan, J.; Liu, B.; Liu, Y. Microstructural Evolution and Mechanical Properties of Maraging Steel by Additive Manufacturing. Mater. Sci. Eng. A 2024, 915, 147201. [Google Scholar] [CrossRef] [Scilit]
- Tan, C.; Zhou, K.; Kuang, M.; Ma, W.; Kuang, T. Microstructural Characterization and Properties of Selective Laser Melted Maraging Steel with Different Build Directions. Sci. Technol. Adv. Mater. 2018, 19, 746–758. [Google Scholar] [CrossRef] [Scilit]
- Kempen, K.; Yasa, E.; Thijs, L.; Kruth, J.P.; Van Humbeeck, J. Microstructure and Mechanical Properties of Selective Laser Melted 18Ni-300 Steel. Phys. Procedia 2011, 12, 255–263. [Google Scholar] [CrossRef] [Scilit]
- Li, R.; Liu, J.; Shi, Y.; Wang, L.; Jiang, W. Selective Laser Melting of a Novel Sc and Zr Modified Al-6.2 Mg Alloy: Processing, Microstructure, and Properties. Powder Technol. 2017, 319, 117–128. [Google Scholar] [CrossRef] [Scilit]
- Casati, R.; Lemke, J.N.; Vedani, M. Microstructural and Mechanical Properties of As Built, Solution Treated and Aged 18 Ni (300 Grade) Maraging Steel Produced by Selective Laser Melting. La Metall. Ital. 2017, 109, 11–20. [Google Scholar]
- Decker, R.F.; Floreen, S. Maraging Steels—The First 30 Years. In Proceedings of the International Symposium on Tool Steels; ASM International: Metals Park, OH, USA, 1969; pp. 1–38. [Google Scholar]
- Davis, J.R. (Ed.) ASM Specialty Handbook: Tool Materials; ASM International: Materials Park, OH, USA, 1994. [Google Scholar]
- Feitosa, A.; Ribamar, G.; Escobar, J.; Sonkusare, R.; Boll, T.; Coury, F.; Ávila, J.; Oliveira, J.; Padilha, A. Precipitation and reverted austenite formation in maraging 350 steel: Competition or cooperation? Acta Mater. 2024, 270, 119865. [Google Scholar] [CrossRef] [Scilit]
- Niu, M.; Zhou, G.; Wang, W.; Shahzad, M.B.; Shan, Y.; Yang, K. Precipitate evolution and strengthening behavior during aging process in a 2.5 GPa grade maraging steel. Acta Mater. 2019, 179, 296–307. [Google Scholar] [CrossRef] [Scilit]
- Porter, D.A.; Easterling, K.E. Phase Transformations in Metals and Alloys; Chapman & Hall: London, UK, 1992. [Google Scholar]
- Jägle, E.A.; Choi, P.-P.; Van Humbeeck, J.; Raabe, D. Precipitation and austenite reversion behavior of a maraging steel produced by selective laser melting. J. Mater. Res. 2014, 29, 2072–2079. [Google Scholar] [CrossRef] [Scilit]
- Mercelis, P.; Kruth, J.P. Residual Stresses in Selective Laser Sintering and Selective Laser Melting. Rapid Prototyp. J. 2006, 12, 254–265. [Google Scholar] [CrossRef] [Scilit]
- Raabe, D.; Ponge, D.; Dmitrieva, O.; Sander, B. Nanoprecipitate-Hardened 1.5 GPa Steels with Unexpected High Ductility by Transformation-Induced Plasticity. Scr. Mater. 2009, 60, 1141–1144. [Google Scholar] [CrossRef] [Scilit]
- Li, X.; Wang, X.; Saunders, M.; Suvorova, A.; Zhang, L.C.; Liu, Y.; Fang, M.H.; Huang, Z.; Sercombe, T.B. Selective Laser Melting of Advanced Metallic Materials: The Role of Powder Layer Thickness and Microstructure Evolution. Mater. Des. 2016, 95, 21–31. [Google Scholar] [CrossRef] [Scilit]
- Raabe, D. Overview of the Lath Martensite Structure and Crystallographic Texture in Steels. Acta Mater. 2012, 60, 495–510. [Google Scholar] [CrossRef] [Scilit]
- Tian, J.; Wang, W.; Li, H.; Yang, K.; Jiang, Z. Understanding main factors controlling high cycle fatigue crack initiation and propagation of high strength maraging stainless steels with Ti addition. Mater. Sci. Eng. A 2021, 804, 140589. [Google Scholar] [CrossRef] [Scilit]
- Karr, U.; Schuller, R.; Fitzka, M.; Schönbauer, B.; Tran, D.; Pennings, B.; Mayer, H. Influence of inclusion type on the very high cycle fatigue properties of 18Ni maraging steel. J. Mater. Sci. 2017, 52, 5954–5967. [Google Scholar] [CrossRef] [Scilit]
- Bhar, R.; Jourdan, J.; Descotes, V.; Jardy, A. An experimental study of the inclusion behavior during maraging steel processing. Metall. Res. Technol. 2019, 116, 517. [Google Scholar] [CrossRef] [Scilit]
- Pantleon, W. Resolving the geometrically necessary dislocation content by conventional electron backscattering diffraction. Scr. Mater. 2008, 58, 994–997. [Google Scholar] [CrossRef] [Scilit]
- Law, W.K.; Wang, H.; Song, C.; Wong, K.-C.; Lim, C.S.; Sun, Z. Influence of microstructural heterogeneity on the plastic strain localisation in selective laser melted 18Ni-300 maraging steel. Int. J. Plast. 2025, 191, 104400. [Google Scholar] [CrossRef] [Scilit]
- Engler, O.; Randle, V. Introduction to Texture Analysis: Macrotexture, Microtexture, and Orientation Mapping, 2nd ed.; CRC Press: Boca Raton, FL, USA, 2009. [Google Scholar]
- Bunge, H.-J. Texture Analysis in Materials Science: Mathematical Methods; Elsevier: Amsterdam, The Netherlands, 2013. [Google Scholar]
- Abreu, H.F.G. Influência da Textura Cristalográfica na Anisotropia Magnética das Ligas Fe-Mo-NiC. Ph.D. Thesis, Universidade Federal do Rio de Janeiro, Rio de Janeiro, Brazil, 1998. [Google Scholar]
- Suwas, S.; Ray, R.K. Crystallographic Texture of Materials; Springer: London, UK, 2014. [Google Scholar]
- Eres-Castellanos, A.; Santana, A.; De-Castro, D.; Jimenez, J.A.; Rementeria, R.; Capdevila, C.; Caballero, F.G. Effect of processing parameters on texture and variant selection of as-built 300 maraging steel processed by laser powder bed fusion. Sci. Rep. 2022, 12, 16168. [Google Scholar] [CrossRef] [Scilit] [PubMed]
- Roters, F.; Eisenlohr, P.; Bieler, T.R.; Raabe, D. Crystal Plasticity Finite Element Methods: In Materials Science and Engineering; John Wiley & Sons: Weinheim, Germany, 2011. [Google Scholar]
- Sanjari, M.; Mahmoudiniya, M.; Pirgazi, H.; Tamimi, S.; Ghoncheh, M.H.; Shahriairi, A.; Hadadzadeh, A.; Amirkhiz, B.S.; Purdy, M.; de Araujo, E.G.; et al. Microstructure, texture, and anisotropic mechanical behavior of selective laser melted maraging stainless steels. Mater. Charact. 2022, 192, 112185. [Google Scholar] [CrossRef] [Scilit]
- Calcagnotto, M.; Ponge, D.; Demir, E.; Raabe, D. Orientation gradients and geometrically necessary dislocations in ultrafine grained dual-phase steels studied by 2D and 3D EBSD. Mater. Sci. Eng. A 2010, 527, 2738–2746. [Google Scholar] [CrossRef] [Scilit]

Disclaimer/Publisher’s Note: The statements, opinions and data contained in all publications are solely those of the individual author(s) and contributor(s) and not of MDPI and/or the editor(s). MDPI and/or the editor(s) disclaim responsibility for any injury to people or property resulting from any ideas, methods, instructions or products referred to in the content. |
© 2026 by the authors. Licensee MDPI, Basel, Switzerland. This article is an open access article distributed under the terms and conditions of the Creative Commons Attribution (CC BY) license.