


Abstract
Aluminum alloy hot rolling features diverse varieties, large variations in incoming strip thickness, and strong process nonlinearity. Traditional rolling force prediction models rely on simplified physical assumptions and poor adaptability, making it hard to satisfy high-precision production requirements. This paper presents a mechanism–data dual-driven PSO-BP neural network method for rolling force prediction which is applicable to the rolling temperature range of 320 °C to 520 °C. The SIMS mechanism model is employed as a physical constraint, and a hybrid PSO-GD algorithm optimizes the initial weights and thresholds of the BP network, avoiding the local optimum issue of conventional BP. The rolling mechanism model is embedded into the loss function to deeply integrate physical laws and data-driven learning. Validation using 508 sets of field data from 5083 aluminum alloy hot rolling shows that the model achieves a MAPE of 5.0794% and R2 of 0.9254, significantly outperforming the traditional mechanism model (8.91%) and standard BP (8.77%). The proposed model preserves physical interpretability while utilizing data-driven adaptability, offering an effective approach for high-precision rolling force prediction and improving the dimensional accuracy of hot-rolled aluminum alloy sheets.
1. Introduction
The traditional rolling force prediction model is mainly based on rolling theory, such as the SIMS formula, Stone formula, and Orowan differential equation [1,2]. This type of mechanism model has clear physical significance, but its prediction accuracy is limited by the deviation between simplified assumptions and actual working conditions. In aluminum alloy rolling, when there are complex conditions such as uneven temperature, variable speed rolling, high pressure, dynamic roll profile control, and non-steady-state rolling at the head and tail, the prediction performance is poor. With the development of machine learning technology, data-driven modeling methods have gradually been applied in the field of rolling force prediction, such as artificial neural networks, support vector machines, and random forests [3,4]. Liu et al. proposed a multi-layer extreme learning machine hot rolling force prediction model based on PSO-GA optimization, which improved the prediction accuracy and stability by optimizing the network structure and initial parameters through intelligent algorithms [5]. Ren et al. constructed a hot rolling force prediction model based on the random forest regression algorithm and optimized hyperparameters through grid search, effectively improving prediction accuracy and operational efficiency [6]. The deep feedforward neural network model constructed by Ma et al. achieved the high-precision data-driven prediction of hot rolling force, but its model architecture is relatively single, and the training data source is limited to a single production line [7]. Wang et al. proposed a rolling force prediction model based on the PSO-BP neural network, which significantly improved the prediction accuracy of the rolling force of the double stand furnace coil rolling mill, with an error rate controlled within 10% [8]. Ding et al. proposed an online calculation model for the precision rolling force of hot-rolled strip steel based on the whale algorithm, which improves the accuracy of rolling force setting in non-steady-state hot rolling environments [9]. The machine learning model proposed by ThakurSumanKant et al. significantly improves the prediction accuracy of rolling force and torque in the process of medium thick plate rolling by integrating nonlinear parameters. However, the generalization ability and interpretability of the model are still limited by the source and scale of training data [10]. Shaheera Rashwan et al. proposed a rolling force prediction model that combines genetic algorithm and semi-supervised support vector regression, which reduced the RMSE by 66.9% and 32.1% in oval and round passes, respectively. However, the model still has obvious limitations in terms of data scale and cross-sectional generality [11].
To overcome the limitations of a single modeling method, the mechanism and data-driven modeling approach has attracted widespread attention from scholars both domestically and internationally in recent years, becoming one of the research hotspots in this field. Guo et al. proposed a new method for predicting rolling forces that combines the SIMS model and deep learning. The experiment showed that the prediction accuracy improved by 21.72% compared to traditional methods [12]. Zhang et al. used the method of error spacing compensation to achieve the organic integration of neural network models and existing theoretical models, achieving the unity of accuracy and physical rationality. However, the model’s generalization ability and dynamic adaptability still have shortcomings [13]. RAKHOONHWANG et al. constructed a hot rolling prediction framework that integrates mathematical models with neural networks, which can simultaneously achieve high-precision estimations of both rolling force and temperature. However, this method only stays at the feature-level fusion and lacks the deep embedding of physical mechanisms and network structures [14]. Dong et al. combined the rolling mechanism with a data-driven approach and proposed the Fusion-DNN model for rolling force prediction. Although its accuracy and robustness are better than traditional methods, the model’s structure is complex, and hyperparameter optimization thus relies on experience [15]. Shang et al. proposed a hot rolling force prediction method that integrates data-driven and physical modeling. The model’s interpretability and uncertainty quantification were achieved through LA-NAM, effectively improving prediction stability under small samples [16]. Niu et al. proposed a rolling force prediction method for the entire hot rolling process based on transfer learning and the Inception-LSTM neural network. The method achieved a determination coefficient, R2, of 0.985 on the F1 stand benchmark model, and the training time of the transferred model was significantly reduced [17]. Zhou et al. proposed a data mechanism fusion prediction model for hot rolling force. By optimizing the mechanism model through CPSO and weighted fusion with the ELM data-driven model, the prediction accuracy was significantly improved. However, this fusion strategy uses “fixed weights” and has weak adaptability to different working conditions and materials. The model validation of steel grades is limited, and there are limitations in its generalization application [18].
In response to problems of insufficient fusion depth, weak model adaptability, and poor compatibility with aluminum alloy hot rolling conditions in existing research, this paper conducts a study on mechanism–data dual-driven rolling force prediction for aluminum alloy hot rolling. Based on the SIMS mechanism model of aluminum alloy hot rolling, the stress state coefficient calculation formula is optimized to improve the adaptability of the mechanism model to aluminum alloy hot rolling conditions. We built a PSO-GD hybrid optimization BP neural network to solve the local convergence problem of traditional BP networks through PSO global optimization and GD local fine-tuning. We innovatively embedded the rolling mechanism model into the neural network loss function, achieving a deep integration of physical and data-driven laws, and therefore constructed a dual drive prediction model for aluminum alloy hot rolling force. Based on on-site measured data, the prediction accuracy and stability of the model are verified, providing theoretical and engineering support for high-precision prediction of rolling force in aluminum alloy hot rolling production lines.
2. Mathematical Rolling Force Model
At present, the theoretical calculation models for rolling force mainly include the Kalman equation, Orowan equation, and Stone formula. The hot rolling force of aluminum alloy is generally derived from the SIMS formula based on the Orowan deformation zone force balance theory. The model expression is:
In the formula: is the rolling force, KN; is the stress state coefficient; is the deformation resistance of rolled aluminum alloy, MPa; is the length of the flattened contact arc, mm; is the width of the rolled piece, mm; is the thickness of the slab inlet, mm; h is the thickness of the slab outlet, mm; is the flattening radius of the rolling mill, , mm; is the elastic modulus of the rolling mill material, Mpa; is the Poisson’s ratio of the rolling mill material.
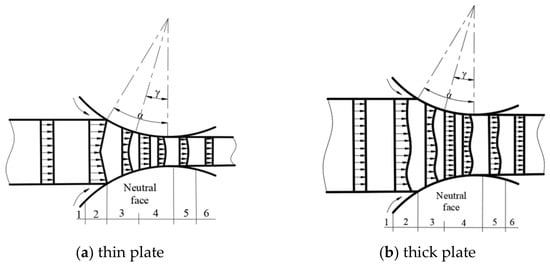
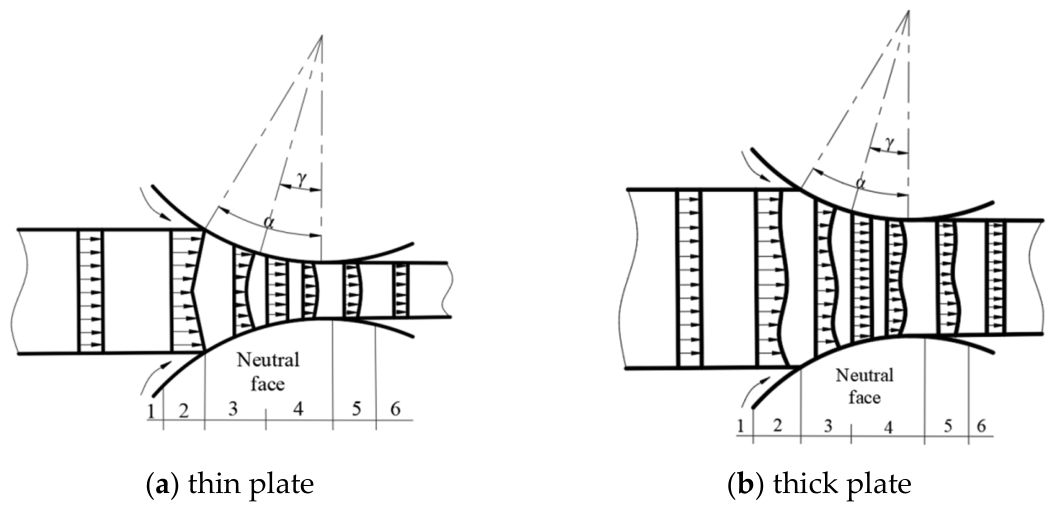
As shown in Figure 1, during the rolling of thin strip, the deformation zone is relatively long and the thickness of the rolled piece is thin. All metal particles on the contact surface slide and flow, and the external friction coefficient is small. Moreover, the friction coefficient on the contact arc changes in a curve, and the degree of uneven deformation is small. The difference in thickness direction can be ignored. However, as the slab thickness and other factors increase, especially in the initial passes of hot rolling and rough rolling of thick aluminum alloy plates, there is generally a situation of rolling thick plates with a small reduction ratio. Most of the deformation zones are the adhesive zone, and the external friction coefficient is high. The frictional force on the contact arc remains unchanged or changes truly little, and the deformation on the thickness section of the rolled piece is very uneven. The middle layer of metal does not deform and the outer region hinders the surface layer of metal to produce forced widening, resulting in significant strain and texture distribution non-uniformity from the surface to the center of the plate, indirectly leading to a sharp decrease in the accuracy of traditional rolling force calculation models [19,20,21].
Figure 1.
Diagram of metal flow characteristics during the rolling process. 1 and 6: outer end; 2 and 5: deformation transition zone; 3: backslip zone; 4: Forward slip zone.
2.1. Deformation Resistance
The deformation resistance of metal materials refers to the ability of metals to resist plastic deformation and is also one of the main force and energy parameters of metal components. The magnitude of deformation resistance depends on the chemical composition, microstructure, and original process state of the metal, and is closely related to the process conditions at the time of deformation. The deformation resistance model is an expression of the functional relationship between physical quantities related to stress and deformation conditions during metal plastic deformation. According to the theory of plastic deformation, deformation resistance can be calculated using the rheological stress , according to Equation (2).
The rheological stress is calculated according to Formula (3) [22]:
Among them, , and represent material regression constants; represents the specified temperature of the material (°C); is the degree of deformation of the material during the rolling process, and is the rate of deformation of the material.
2.2. Stress State Coefficient
The stress state coefficient is an important parameter that characterizes the stress state during the rolling process, mainly used to describe the influence of changes in the geometric dimensions of the workpiece on the rolling force, and can reflect the stress distribution characteristics of the material in the deformation zone [18]. The value of this coefficient is usually closely related to geometric factors such as the contact arc length of the rolling mill, the width of the workpiece, and the thickness reduction, and is a key link in calculating the rolling unit pressure and total rolling force. Among numerous theoretical models of stress state coefficients, the model derived by Sims based on Orowan rolling theory is the most widely used. This model can adapt well to the deformation characteristics of metals under hot rolling conditions through reasonable mechanical assumptions, providing a reliable theoretical basis for the calculation of force and energy parameters in the hot rolling process. The stress state coefficient can be represented by Equations (4) and (5).
Among them, represents the degree of deformation of the material during the rolling process, represents the thickness after rolling, represents the radius of the rolling mill, and represents the neutral angle.
Based on the SIMS equation, scholars at home and abroad have successively proposed various simplified formulas for calculating stress state coefficients. Based on the research conditions and calculation requirements in this article, the following formula is used to calculate the stress state coefficient.
Among them, is the contact arc length, represents the average thickness of rolling, and the front and back tensile stresses, coefficient , is the neutral angle, radians, is the bite angle, radians.
In this formula, both the stress correction coefficient for the influence of external regions and that for external friction effects are simplified to constants, with their specific values determined through the regression analysis of experimental data by previous researchers. However, these two constants fail to account for the dynamic variations in external zone constraints and friction conditions during actual rolling processes under varying operating conditions (e.g., temperature, speed, lubrication), resulting in poor model stability when predicting across different operating conditions.
3. Optimizing the Mechanism Model
The hot rolling force of aluminum alloy is influenced by multiple factors, such as equipment parameters, process parameters, and material parameters, and the rationality of characteristic parameters directly determines the prediction accuracy and training efficiency of the model. Based on the characteristics of aluminum alloy hot rolling process and on-site engineering practice experience, 12 key input features were determined through correlation analysis and engineering significance screening, covering the three categories of rolling equipment, rolling process, and material properties. At the same time, rolling force was used as the output feature of the model. The specific feature parameters and statistical characteristics are shown in Table 1.
Table 1.
Important characteristic parameters.
Due to the dimensional inconsistency, outliers, and uneven distribution of the rolling data collected on site, directly using it for model training can lead to slow convergence and reduced prediction accuracy. Therefore, preprocessing operations such as standardization and outlier processing are required to improve data quality. If the unit of data is unspecified, or if the distribution is biased, data scaling can be improved by manually adjusting the distribution of the data to enhance learning. In our example, when dealing with artificial neural network models, the minimum–maximum scaling is used as follows:
Among them, is one of the numerical features, and and represent the minimum and maximum values of , respectively. Finally, the scaled data is considered as the final input for processing learning data.
To improve the prediction accuracy of the mechanism model, Equation (8) was used to replace the original stress state coefficient equation.
Here, k1 is the width correction coefficient, k2 is the stress correction coefficient for external zone effects, and k3 is the stress correction coefficient for external friction effects, with values ranging from [0, 2], and determined through PSO-BP neural network training. H denotes the inlet thickness, and h denotes the outlet thickness.
The primary purpose of introducing these three correction coefficients—k1, k2, k3—is to effectively compensate for systematic discrepancies between theoretical assumptions and actual hot rolling conditions of aluminum alloys while maintaining the physical interpretability of the classical rolling force mechanism model. Specifically: the width correction coefficient k1 addresses deviations in the plane strain assumption caused by metal transverse flow (spreading); the external zone influence stress correction coefficient k2 quantifies the additional constraint effect of undeformed metal outside the deformation zone on the internal stress field; while the external friction influence stress correction coefficient k3 comprehensively regulates the overall contribution of complex friction force distributions to stress states. By incorporating these physically meaningful correction coefficients and employing a PSO-BP neural network for data-driven optimal fitting, the model achieves a balance between robust mechanism analysis and precise data modeling, significantly enhancing rolling prediction performance under complex rolling conditions.
4. Data-Driven Modeling of Rolling Force
4.1. Deep Neural Network Modeling
Artificial neural network (ANN) is a supervised learning model that simulates the structure of biological neurons. Deep neural network (DNN) achieves powerful nonlinear fitting and feature mining capabilities through multiple hidden layers, making it suitable for industrial parameter prediction tasks with multi-factor coupling. From a mathematical perspective, DNN is a multi-layer nonlinear mapping model consisting of an input layer, a hidden layer, and an output layer. It relies on trainable weights, biases, and activation functions to complete information processing and has universal approximation properties. Due to the inability to directly determine the optimal parameters, this study adopts the backpropagation algorithm to iteratively optimize network parameters based on the gradient backpropagation of the loss function. For deep neural networks containing L-layer hidden structures, the inter layer signal transmission relationship can be expressed as the following formula:
Among them, is the value of the -th node in the hidden layer of the -th layer, is the number of nodes, is the activation function, and and are the weights and biases between the l-th layer and the l + 1th layer.
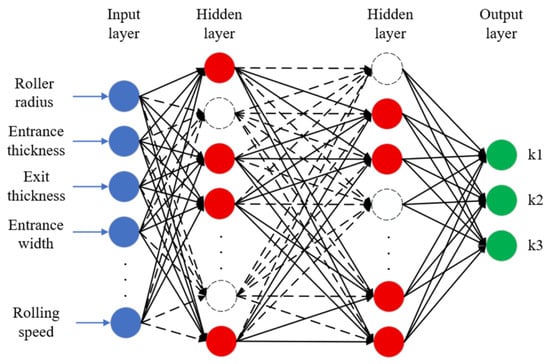
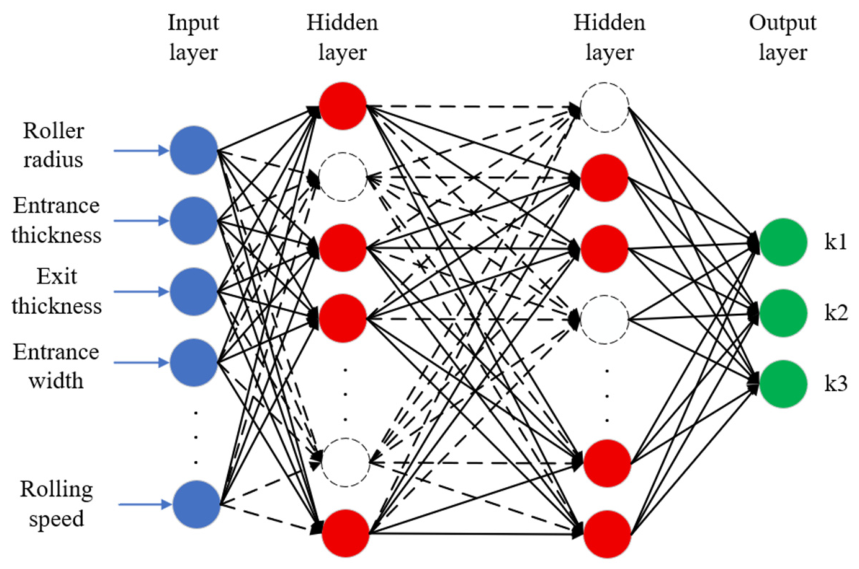
This study adopts a three-layer neural network structure, where the input layer has 12 dimensions, which are important feature parameters; hidden layer 1 contains 16 neurons, and Dropout (deactivation rate 0.2) is introduced to randomly suppress the participation of some neurons in training, effectively reducing the risk of overfitting and improving the generalization ability of the model. At the same time, combined with the LayerNorm layer, it effectively solves the gradient anomaly problem caused by the multi-field coupling effect of thermo-mechanical coupling, significantly improving the convergence stability of the model under noise interference; combined with the LeakyReLU activation function, the gradient vanishing phenomenon is effectively alleviated, ensuring that the parameters are continuously updated during the training process, greatly enhancing the predictive robustness of the model under extreme working conditions. Hidden layer 2 uses eight neurons, also equipped with Dropout (inactivation rate 0.2), LayerNorm, and LeakyReLU layers, to further suppress overfitting and maintain the stability of feature expression. The output layer is designed with three neurons, and an autonomously improved activation function is used to constrain the output values within the range of [0, 2], corresponding to three rolling force correction coefficients (k1~k3). By monitoring the dynamics of the validation set loss to evaluate the model’s status, training is stopped when the validation loss shows no significant decrease over consecutive iterations and the model tends to converge, in order to avoid redundant iterations and overfitting, thereby improving the model’s generalization performance. Its structure is shown in Figure 2.
Figure 2.
DNN model structure.
4.2. Improved PSO Neural Network Model
Traditional deep neural networks use a random initialization of weights and biases during training, which can lead to slow model convergence, susceptibility to local optima, and unstable predictive performance. In response to this issue, this article constructs a hybrid optimization model combining particle swarm optimization (PSO) and gradient descent (GD).
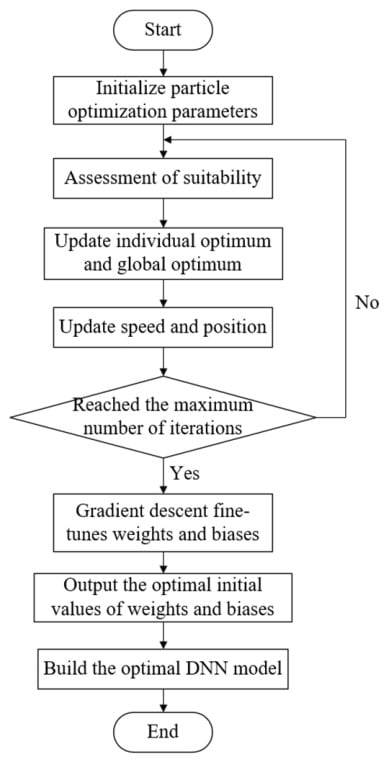
For the optimization process: Firstly, all weight matrices and bias vectors in the neural network model are flattened and concatenated into a single one-dimensional vector, which is directly defined as the position vector of particles in the particle swarm algorithm, achieving accurate mapping between neural network parameters and particle positions. Then, initialize the particle swarm according to the preset parameters, randomly initialize the velocity vector for each particle, and record the individual optimal position (pbest) and the global optimal position (gbest) of the entire population separately, completing the initialization work before optimization. In the iterative optimization stage of particle swarm optimization algorithm, the predicted loss value of the neural network on the training dataset is used as the fitness function of the particles. The smaller the fitness value, the better the model parameters correspond to the particles. Each particle corresponds to a full set of weights and biases of the BP neural network. By sequentially calculating the fitness of each particle, the individual best and global best are dynamically updated. Strictly follow the velocity position update formula of particle swarm algorithm, adjust the flight velocity and spatial position of particles by combining inertia weight, individual learning factor, and group learning factor, so that the entire population gradually converges to the optimal parameter region. The specific formula is as follows:
After completing the PSO global search, the parameters corresponding to the globally optimal particles are loaded into the neural network model as the initial parameters for the gradient descent stage. Then, high-precision local fine-tuning is performed through the Adam optimizer to further reduce model loss. At the same time, the performance of the validation set is monitored during the training process to save the optimal model, and the saved weight model is used for subsequent BP network prediction. The specific process is shown in Figure 3. The core parameters of the hybrid optimization algorithm set in this study are: the number of particles is 40, the inertia weight ω is a dynamic weight (decreasing linearly from 0.9 to 0.4), the individual learning factor c1 is 1.5, the social learning factor c2 is 1.5, the maximum number of iterations is 100, the learning rate of the gradient descent stage is set to 0.001, the number of training rounds is 6000, and the batch size is 32. Through this parameter configuration and hybrid optimization process, the model can quickly lock in the optimal parameter interval and achieve accurate convergence, improving the training efficiency and prediction performance of the neural network.
Figure 3.
Optimization of hidden layer weights and biases in neural networks.
4.3. Construction of Mechanism and Data-Driven Aluminum Hot Rolling Force Prediction Model
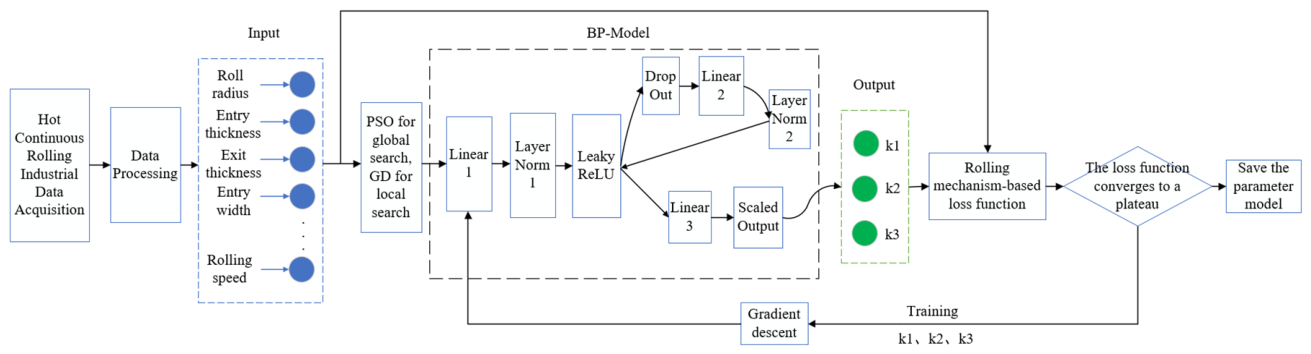
This study proposes an improved BP neural network prediction model based on the particle swarm optimization (PSO) algorithm. By introducing PSO algorithm to globally optimize the initial weights and thresholds of the neural network, gradient descent (GD) is introduced to fine tune the globally optimized weights and thresholds, effectively overcoming the local convergence problem in the traditional BP network training process. At the same time, the BP neural network predicts three rolling force correction coefficients and cleverly combines the mechanism model as the loss function to ultimately predict the rolling force. This model not only retains the advantage of the strong interpretability of mechanism models, but also fully utilizes the adaptive learning ability of data-driven models, thereby significantly improving the accuracy and computational efficiency of rolling force prediction while ensuring the physical rationality of the model. The model’s flow chart is shown in Figure 4.
Figure 4.
PSO-BP structure flow chart.
This study innovatively integrates the rolling mechanism model into the neural network loss function and constructs a hybrid modeling method that combines data-driven and mechanism knowledge deep fusion by using the rolling theory formula in the third part as a constraint condition. This design significantly improves the physical interpretability of the model, making the predicted results strictly conform to the physical laws of rolling, enhancing small sample learning ability and effectively reducing data requirements with mechanism prior knowledge. More importantly, it significantly improves the credibility of the project, making the predicted results more easily accepted on site.
This study uses 2608 sets of 5083 aluminum alloy rolling data as samples, with all specimens maintaining consistent heat treatment regimes and rolling processes. The dataset is divided into a training set (2100 sets) and an independent test set (508 sets), where the training set is further randomly divided into a training subset (1680 sets) and a validation subset (420 sets) at an 8:2 ratio. Stratified sampling and cross-validation were not used in the dataset division. The model was trained using a hybrid PSO-GD optimization algorithm: global optimization was first performed via PSO, followed by local fine-tuning using GD. The training process incorporated early stopping mechanisms and dynamic learning rate adjustment based on validation data. Upon completion, the optimized model weights were applied to a separate test set for preliminary evaluation. Rolling force predictions were calculated using a custom loss function integrated with the mechanism model, with predictive performance comprehensively assessed using three metrics: Mean Absolute Error (MMAE), Root Mean Square Error (RMSE), and Mean Absolute Percentage Error (MAPE).
5. Effect Analysis and Verification
By comparing and evaluating the prediction results based on performance indicators such as Mean Absolute Error (MMAE), Root Mean Square Error (RMSE), and Mean Absolute Percentage Error (MAPE), the expression is as follows:
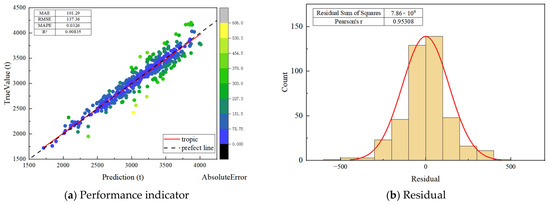
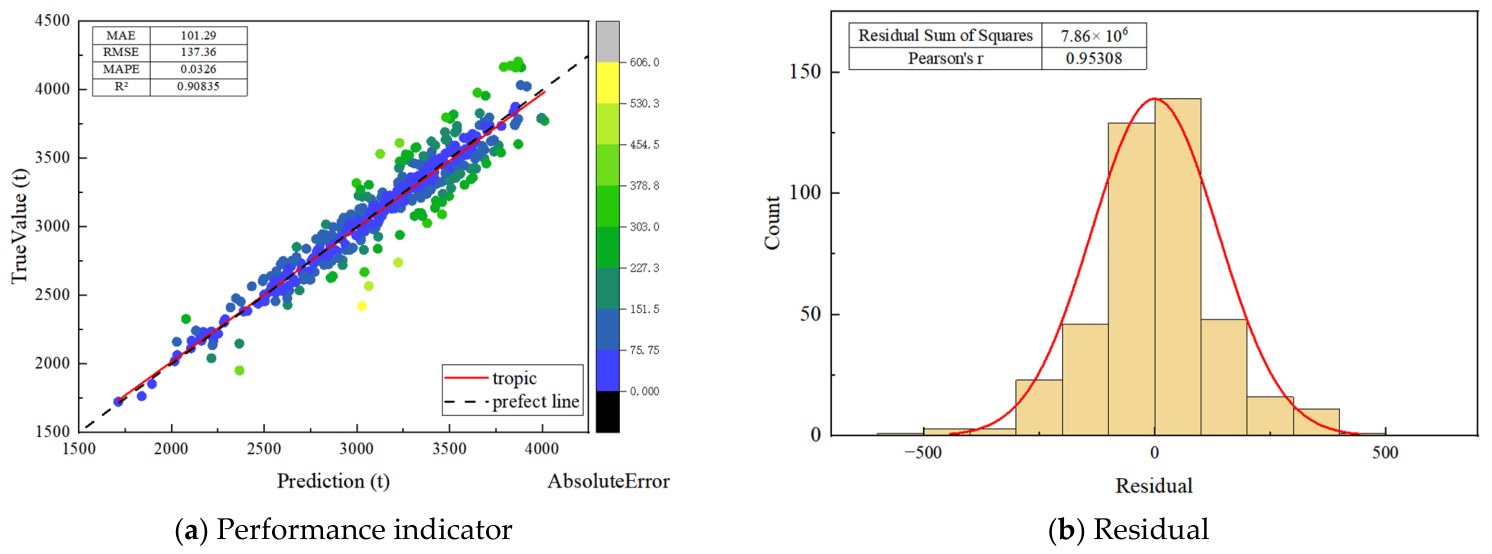
Analyzing the validation set metrics, based on the PSO-BP model training results shown in Figure 5, it can be seen from Figure 5a that the model’s coefficient of determination R2 is 0.90835, indicating that the model can explain 90.835% of the variance in the target variable (rolling force), with only about 9.165% of the variance not captured by the model. This result far exceeds the typical standards required for predictive models in industrial applications (usually R2 > 0.8 is considered to have excellent predictive capability). At the same time, the performance metrics of this model are 101.29 t, 137.36 t, and 3.26%, respectively. The scatter plot shows that the sample points are closely distributed on both sides of the diagonal line, with no obvious deviation bands, intuitively validating the effectiveness of the selected process features and network topology.
Figure 5.
Model performance evaluation on the validation set.
Further observing the residual distribution shown in Figure 5b, it can be seen that the model’s prediction errors exhibit favorable statistical properties. The residual values are primarily concentrated within the range of −100 t to 100 t, with the cumulative number of samples in this range reaching approximately 268 (−100 t: 129, 100 t: 139), accounting for the vast majority of the total sample size. The residuals show a symmetrically decreasing trend on both sides: the distribution pattern of positive residuals (100 t: 139, 200 t: 48, 300 t: 16, 400 t: 11, 500 t: 1) is basically consistent with that of negative residuals (−100 t: 129, −200 t: 46, −300 t: 23, −400 t: 3, −500 t: 14, −600 t: 1), with no significant bias observed. At the same time, the number of extreme residuals (absolute value greater than 400 t) is very small (about 16), indicating that the model does not exhibit systematic bias or significant interference from outliers. The concentration and symmetry characteristics of the residuals collectively corroborate the high accuracy and strong robustness of the PSO-BP model in the rolling force prediction task.
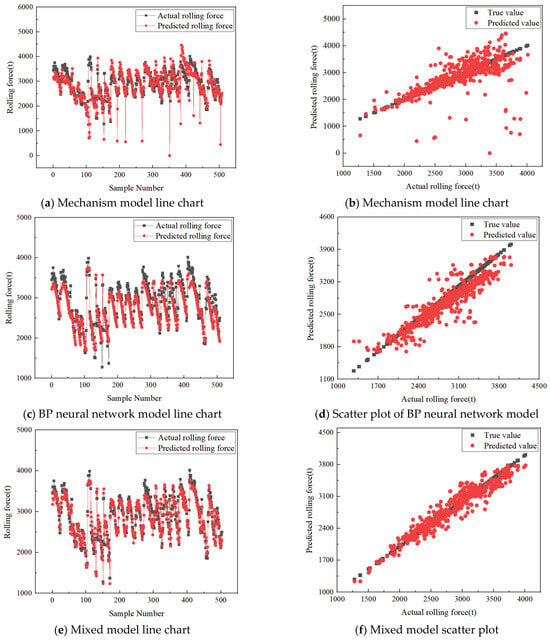
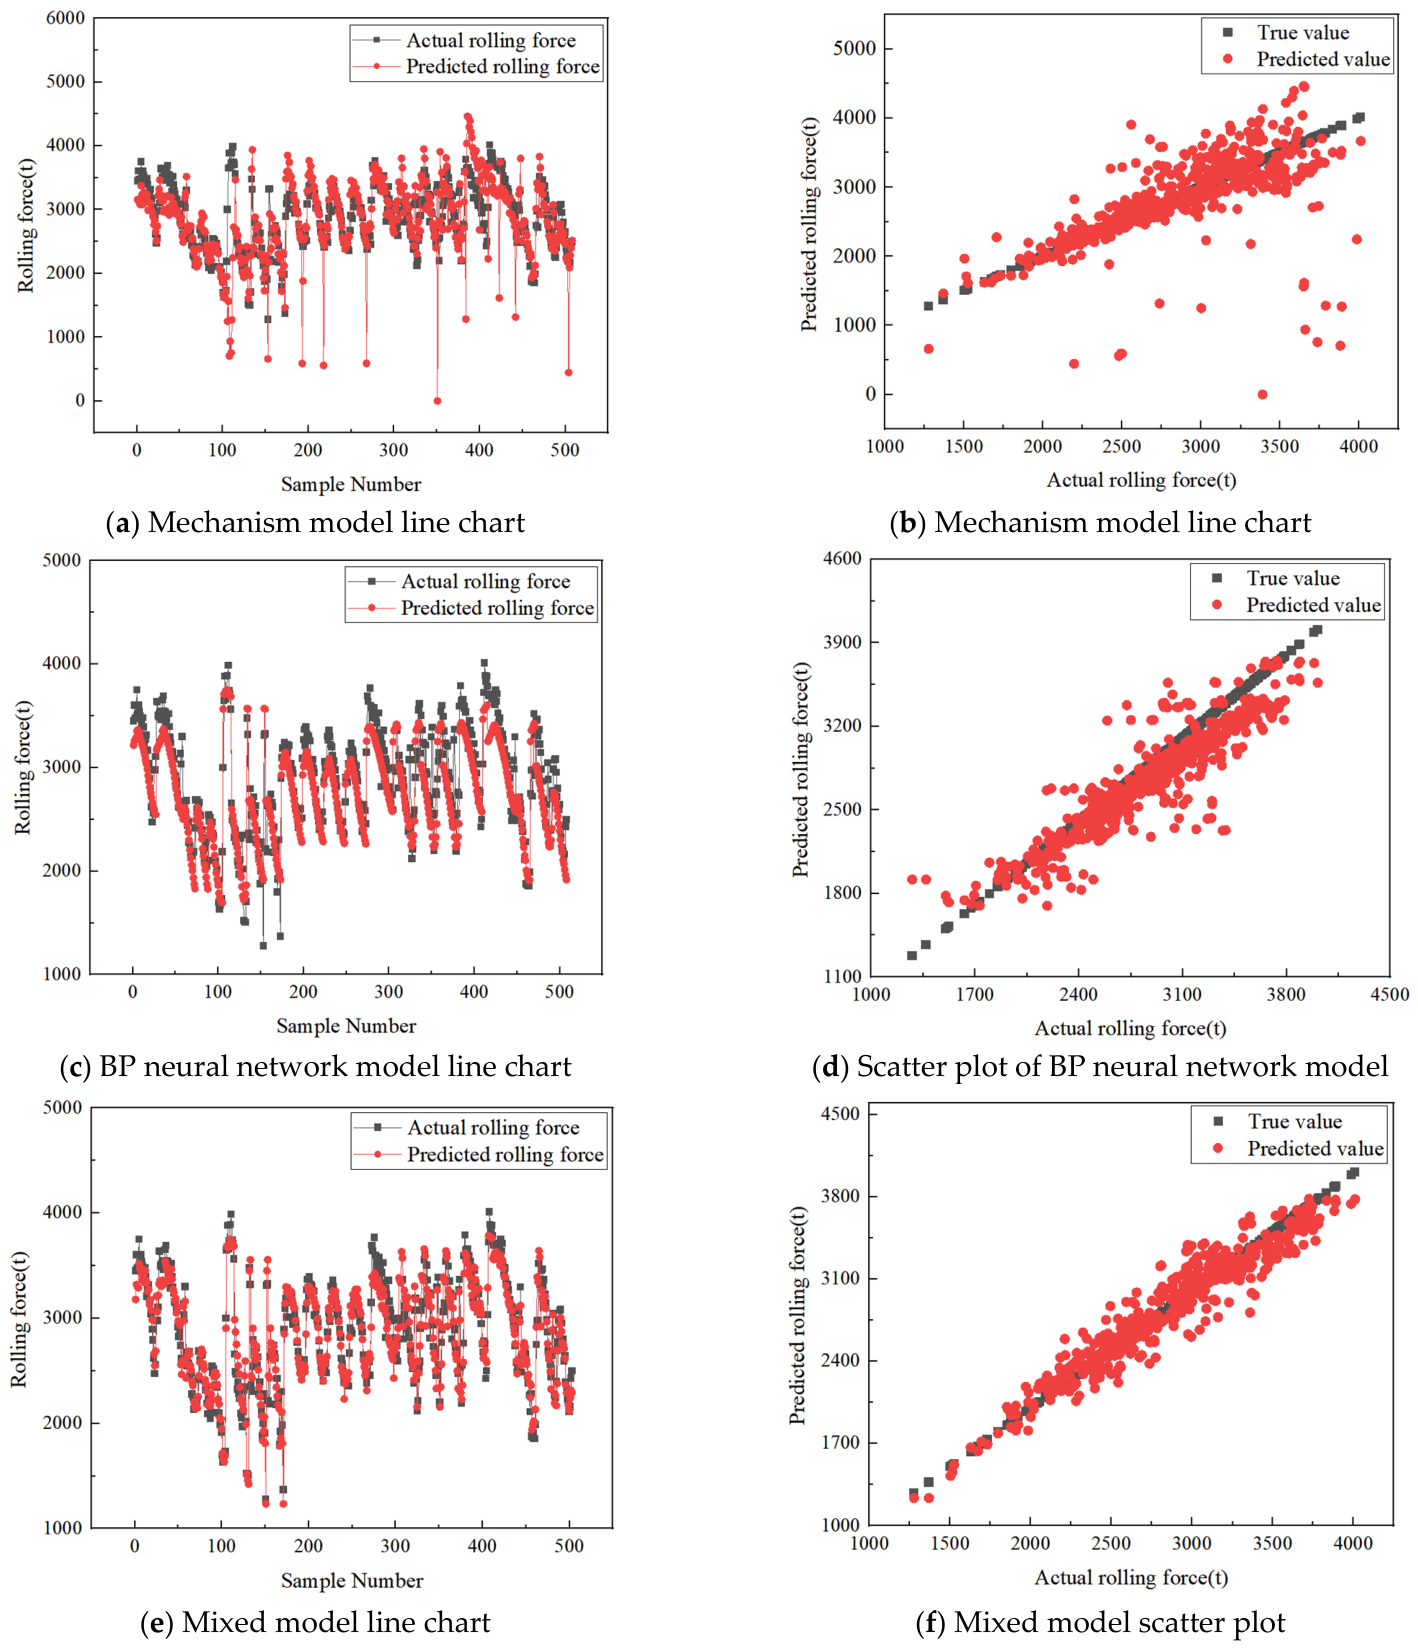
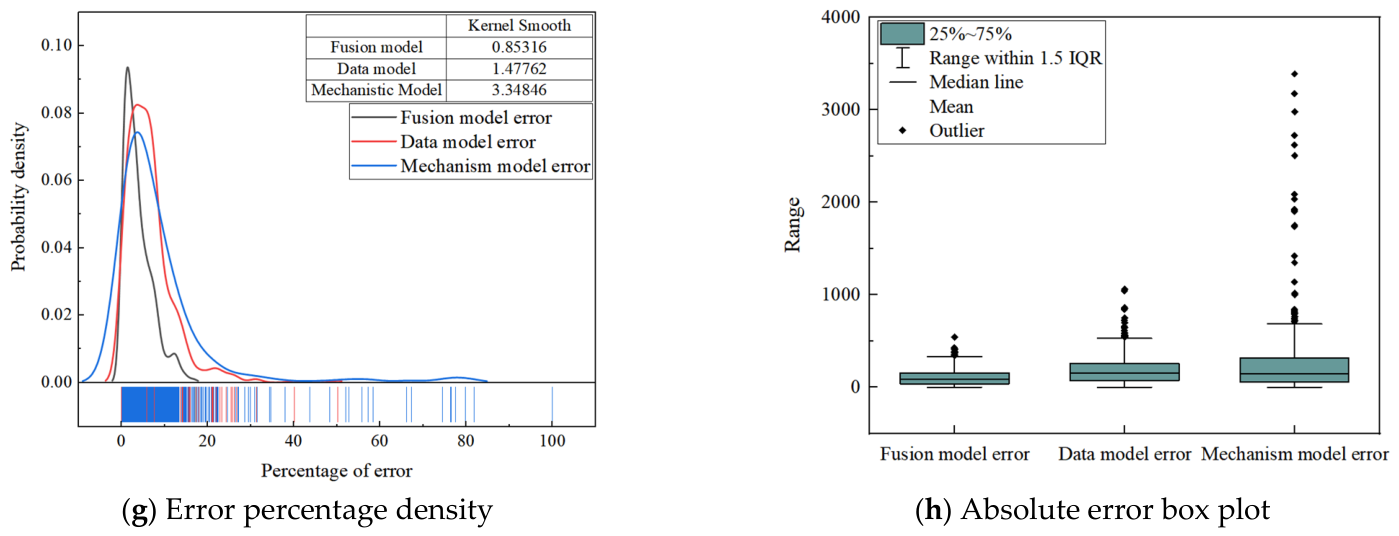
The mechanism model, BP neural network model, and PSO-BP model were applied to 508 datasets in the test set respectively, and their prediction accuracy was analyzed. The results showed that the average absolute error of the mechanism model was 267.63 t, the Root Mean Square Error was 493.4 t, and the average absolute percentage error was 8.91%. The indicators of the BP neural network model are 191.08 t, 249.13 t, and 8.77%. The indicators of the PSO-BP model are 110.88 t, 3.87%, 146.26 t, and 5.0794%. The actual application effect comparison is shown in Figure 6. The PSO-BP model is significantly better than the other two models in various error indicators, demonstrating higher prediction accuracy and stability.
Figure 6.
Comparison of rolling force prediction model results.
6. Conclusions
This study focuses on the high-precision prediction of rolling force in the hot rolling process of 5083 aluminum alloys, proposes a hybrid modeling strategy that integrates mechanism models and data-driven methods, and constructs an improved BP neural network (PSO-BP) prediction model optimized via particle swarm optimization. By embedding the rolling force mechanism model into the neural network loss function and synergistically optimizing the network’s initial weights and biases using PSO combined with gradient descent (GD), the model achieves improved prediction accuracy and generalization performance on the collected dataset while retaining physical interpretability. The main conclusions and limitations of this work are summarized as follows:
Effectiveness of the hybrid modeling strategy: The proposed mechanism–data dual-driven model effectively combines rolling physical laws with data self-learning capacity within the scope of the tested working conditions. The mechanistic component introduces physical constraints to improve model interpretability, while the data-driven module compensates for the deficiency of pure mechanism models in capturing complex nonlinear behaviors through adaptive learning of measured on-site data.
Noticeable improvement in prediction accuracy on the experimental dataset: Validated using 508 groups of measured production data for 5083 aluminum alloy hot rolling, the PSO-BP model achieves a Mean Absolute Percentage Error (MAPE) of 5.0794%, which outperforms the standalone traditional mechanism model (8.91%) and the conventional BP neural network (8.77%). The coefficient of determination R2 = 0.9254 demonstrates strong fitting capacity for rolling force fluctuations under the measured process windows.
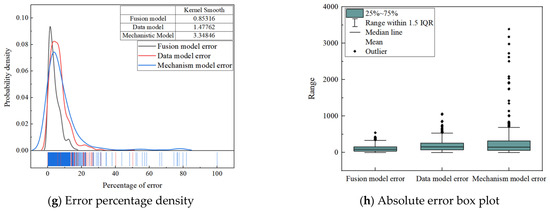
Improved prediction stability within the tested working condition range: Compared with pure mechanism and single data-driven models, the PSO-BP model delivers more concentrated prediction outputs and fewer abnormal prediction points under the tested production parameters, showing enhanced robustness for the investigated hot rolling scenarios. The error distribution characteristics further support this observation: the probability density curve of the fusion model peaks nearest to zero error, and the box plot analysis reveals a narrower interquartile error range, a median error closer to zero, and fewer outliers relative to the two benchmark models.
The experimental data only covers a limited range of rolling parameters (temperature, reduction, rolling speed, slab specification). The model’s performance under extreme working conditions, different alloy grades, or distinct mill equipment configurations remains unvalidated.
Author Contributions
Conceptualization, P.W. and L.G.; methodology, M.Y.; formal analysis, Y.-M.M. and T.L.; resources, P.W. and L.G.; data curation, Y.-M.M., T.L. and X.-H.Q.; writing—original draft preparation, Y.-M.M. and T.L.; writing—review and editing, M.Y., H.-G.H. and L.G.; visualization, P.W. and X.-H.Q.; supervision, X.-H.Q.; project administration, M.Y. and H.-G.H. All authors have read and agreed to the published version of the manuscript.
Funding
This work was supported by the National Engineering Research Center for Advanced Manufacturing Technology and Equipment of Heavy Castings and Forgings (Erzhong (Deyang) Heavy Equipment Co., Ltd.) (Q2304-9).
Data Availability Statement
The original contributions presented in this study are included in the article. Further inquiries can be directed to the corresponding author.
Acknowledgments
The authors sincerely appreciate Ming-Jian Huang and Yong-Ji Sun for their work related to result validation, and Zi-Da Zhang and Xin Liu for assistance in the literature investigation throughout this research.
Conflicts of Interest
Author Mr. Tao Luo, Mr. Peng Wei, Mr. Xiao-Hu Qi and Mr. Lin Gao were employed by the company Erzhong (Deyang) Heavy Equipment Co., Ltd. The remaining authors declare that the research was conducted in the absence of any commercial or financial relationships that could be construed as a potential conflict of interest.
References
- Sims, R.B. The Calculation of Roll Force and Torque in Hot Rolling Mills. Proc. Inst. Mech. Eng. 1954, 168, 191–200. [Google Scholar] [CrossRef] [Scilit]
- Xia, Z.S.; Zheng, S.B. Research about Calculating Model for Rolling Load in Production of High-precision Sheet and Strip. Hebei Metall. 2007, 2, 13–16. [Google Scholar]
- Pan, Z.Y. Discussion on Application and Development of Machine Learning in the Era of Big Data. Electron. Compon. Inf. Technol. 2022, 6, 66–69. [Google Scholar]
- Ding, J.G.; Jin, L.; Sun, L.R.; Li, H.; Li, X.; Zhang, D.H. Research status and prospect of intelligent modeling method for hot strip rolling process. Metall. Ind. Autom. 2022, 46, 25–37. [Google Scholar]
- Liu, J.; Liu, X.; Le, B.T. Rolling Force Prediction of Hot Rolling Based on GA-MELM. Complexity 2019, 2019, 3476521. [Google Scholar]
- Ren, Y.; Su, N.; Yang, J.; Gao, X.; Wang, H.; Yue, M. Prediction of Rolling Force for Hot Strip Rolling Based on RFR. Northeastern University, Technical Committee on Control and Decision of Cyber-Physical Systems, Chinese Association of Automation. In Proceedings of the 33rd Chinese Control and Decision Conference; Inner Mongolia University of Science and Technology: Baotou, China, 2021; Volume 7, pp. 402–407. [Google Scholar]
- Ma, W.; Li, W.G.; Zhao, Y.T. Prediction of hot-rolled roll force based on deep learning. J. Iron Steel Res. 2019, 31, 805–815. [Google Scholar]
- Wang, Z.; Zhang, G.; Wang, J.P.; Yang, J.D.; Yang, Q.; Yin, L.Q. Prediction of rolling force for two-stand steckel mill based on PSO-BP neural network. Iron Steel Res. 2017, 45, 23–26. [Google Scholar]
- Ding, J.G.; Liu, F.L.; Yu, K.; Li, X.; Zhang, D.H. Prediction of hot rolling force based on WOA-ELM-LSTM in unsteady process. J. Iron Steel Res. 2024, 36, 85–94. [Google Scholar]
- Kant, S.T.; Alok, D.K.; Kumar, B.J. Application of machine learning methods for the prediction of roll force and torque during plate rolling of micro-alloyed steel. J. Alloys Metall. Syst. 2023, 4, 100044. [Google Scholar] [CrossRef] [Scilit]
- Rashwan, S.; ElShenawy, E.; Youssef, B.; Abdou, M.A. Roll force prediction using hybrid genetic algorithm with semi-supervised support vector regression. J. Electr. Syst. Inf. Technol. 2024, 11, 44. [Google Scholar] [CrossRef] [Scilit]
- Guo, J.T.; Wang, L.; Yu, J.B.; Ji, X.M. Prediction on rolling force in hot rolling of wide and thick plate based on deep learning. Forg. Stamp. Technol. 2022, 47, 167–174. [Google Scholar]
- Zhang, S.H.; Jiang, X.R.; You, F.X. Investigation on the Model of Rolling Force by Integrating Industrial Big Data. J. Netshape Form. Eng. 2020, 12, 8–14. [Google Scholar]
- Hwang, R.; Jo, H.; Kim, K.S.; Hwang, H.J. Hybrid Model of Mathematical and Neural Network Formulations for Rolling Force and Temperature Prediction in Hot Rolling Processes. IEEE Access 2020, 8, 153123–153133. [Google Scholar] [CrossRef] [Scilit]
- Dong, Z.; Li, X.; Luan, F.; Meng, L.; Ding, J.; Zhang, D. Fusion of theory and data-driven model in hot plate rolling: A case study of rolling force prediction. Expert Syst. Appl. 2024, 245, 123047. [Google Scholar]
- Shang, F.; Chen, H.; Sun, B.; Li, Z.; Miao, R.; Zhou, X.; Xing, C.; Zhang, P. Fusion of data-driven and physical modelling for hot-rolling mill force prediction. Ironmak. Steelmak. 2025. [Google Scholar] [CrossRef] [Scilit]
- Niu, G.; Zhang, M.; Yang, Y.; Huang, Z. A Hot Rolling Full Process Rolling Force Prediction Method Based on Transfer Learning and Inception-LSTM Neural Network: Regular Article. ISIJ Int. 2025, 65, 97–103. [Google Scholar]
- Zhou, X.; Xiong, T.; Qiu, H.; Hu, X.; Ma, Y.; Wang, B. Data-mechanism fusion prediction of rolling force in hot rolling mill. J. Mech. Sci. Technol. 2026, 40, 575–584. [Google Scholar]
- Zhang, S.P.; Li, Z.L.; Hu, Z.H.; Yang, X.S.; Deng, T.; Chen, Z.Q.; Li, C.Y. Numerical simulation study of the height-orientation strain distribution in hot-rolled plates of 7B50 aluminum alloy. Light Alloy Fabr. Technol. 2025, 53, 26–34. [Google Scholar]
- Wang, X.; Zhang, W.; Ai, Y. A novel model based on quartic velocity field for hot rolling force of aluminum alloy thick plate. Int. J. Adv. Manuf. Technol. 2023, 127, 5119–5125. [Google Scholar] [CrossRef] [Scilit]
- Yan, M.; Huang, H.G.; Zhang, C.Y.; Du, F.S.; Zhang, S.B. Effects of head and end plane shape of slab on metal removal of head and tail in aluminum alloy plate rough rolling. Trans. Nonferrous Met. Soc. China 2017, 27, 1102–1108. [Google Scholar]
- Yang, G.P. Establishment of Copper Yielf Stress Model in Hot Rolling. J. South. Inst. Metall. 1997, 3, 197–202. [Google Scholar] [CrossRef]
- Lundberg, S.-E. Evaluation of friction in the hot rolling of steel bars by means of on line forward slip measurements. Scand. J. Metall. 2004, 33, 129–145. [Google Scholar] [CrossRef] [Scilit]

Disclaimer/Publisher’s Note: The statements, opinions and data contained in all publications are solely those of the individual author(s) and contributor(s) and not of MDPI and/or the editor(s). MDPI and/or the editor(s) disclaim responsibility for any injury to people or property resulting from any ideas, methods, instructions or products referred to in the content. |
© 2026 by the authors. Licensee MDPI, Basel, Switzerland. This article is an open access article distributed under the terms and conditions of the Creative Commons Attribution (CC BY) license.