


Abstract
First-principles calculations were performed to predict the temperature-dependent elastic properties of fcc-disordered Pt–Rh alloys over a range of compositions. Special quasirandom structures (SQSs) were employed to represent the atomic disorder in the fcc solid-solution phase. The vibrational contribution to the free energy was evaluated using the phonon quasi-harmonic approximation, enabling the calculation of finite-temperature free energies and coefficients of thermal expansion for the fcc-disordered Pt–Rh alloys. The elastic stiffness constants at different compositions were determined using the energy–strain method. By combining the calculated thermal expansion coefficients with elastic stiffness data obtained at various volumes, the temperature-dependent elastic stiffness constants of the fcc-disordered Pt–Rh alloys were determined.
1. Introduction
Platinum (Pt) is one of the few elements that exhibits superior corrosion resistance owing to its low chemical reactivity with other elements. Pt maintains a single face-centered cubic (fcc) crystal structure from room temperature up to its melting point. Rhodium (Rh) is one of the most common alloying elements for Pt. Rh has a higher melting point than Pt and, similar to Pt, also retains a single fcc structure up to melting. Pt–Rh alloys form a continuous fcc solid-solution phase across the entire composition range up to very high temperatures [1]. The strengthening mechanism in the Pt–Rh alloy system is primarily derived from solid-solution strengthening. Consequently, Pt–Rh alloys do not suffer from the degradation of mechanical strength during prolonged high-temperature exposure, unlike conventional high-temperature alloy systems such as Ni- and Co-based superalloys, which rely on precipitation strengthening.
For the development of high-temperature applications, in addition to phase stability, mechanical properties such as the bulk modulus, shear modulus, Young’s modulus, and thermal expansion are of critical importance. Multiscale modeling approaches, ranging from microstructural prediction methods such as phase-field (PF) simulations to macroscopic stress analyses using the finite element method (FEM), require a variety of input parameters, including thermodynamic stability, interfacial energy, elastic properties, and thermal expansion coefficients. Unfortunately, experimental data for Pt–Rh alloys remain limited, particularly with respect to elastic properties and thermal expansion. Most available experimental data are restricted to the pure constituent elements [2,3]. Nevertheless, several theoretical studies have investigated the phase stability of the Pt–Rh binary system and predicted the existence of ordered phases, namely PtRh-I41/amd and PtRh3-I4/mmm, at low temperatures [4,5,6,7,8,9]. Several first-principles studies have also examined the mechanical properties of Pt–Rh alloys. Wei et al. [10] investigated the temperature-dependent mechanical and thermal properties of Pt–40 at.% Rh using the virtual crystal approximation (VCA). Phasha et al. [11] studied the elastic properties of Pt–Rh alloys at 0 K across the full compositional range using a similar VCA-based approach. More recently, Li et al. [12] investigated the mechanical properties of Pt–Rh alloys containing up to 40 at.% Rh using first-principles calculations. In that study, only the 0 K elastic properties were calculated directly; however, temperature-dependent bulk moduli were estimated using the Debye–Grüneisen model to account for finite-temperature effects.
In the present work, special quasirandom structures (SQSs) were generated to mimic the atomic disorder of the fcc solid solution, and first-principles calculations were performed to determine the ground-state energies of the disordered configurations. Finite-temperature free energies and thermal expansion were evaluated from vibrational contributions using the phonon quasi-harmonic approximation. Furthermore, the temperature-dependent elastic properties of disordered fcc Pt–Rh alloys were calculated using the stress–strain method.
2. Methods
2.1. First-Principles Calculations
First-principles calculations based on density functional theory (DFT) were performed to obtain the ground-state structures and elastic properties. The Helmholtz free energy of a structure as a function of volume and temperature, , can be expressed as
where is the ground-state energy and is the lattice vibrational free-energy contribution.
The lattice vibrational contribution was calculated from the phonon density of states (PDOS). The supercell method, as implemented in the Alloy Theoretic Automated Toolkit (ATAT) [13] version 3.36, was employed for the phonon calculations. The minimum separation between perturbed atoms was set to approximately 10–12 Å to ensure that interactions between displaced atoms and their periodic images were negligible. An atomic displacement of 0.1 Å was applied to each perturbed atom in the finite-displacement calculations. To improve the accuracy of the force-constant calculations, the 1st-order Methfessel–Paxton smearing scheme [14] was adopted during the DFT calculations. The lattice vibrational free energy was evaluated within the quasi-harmonic approximation (QHA) [15] according to Shang et al. [16]:
where ℏ, , and denote the reduced Planck constant, the volume-dependent phonon frequency, and the corresponding volume-dependent phonon density of states, respectively.
The equilibrium volume at each temperature was determined by minimizing the Helmholtz free energy with respect to volume. The volumetric coefficient of thermal expansion (CTE), , at constant pressure is given by:
Assuming isotropic thermal expansion for cubic crystal, the linear coefficient of thermal expansion was obtained from the volumetric CTE.
The Vienna Ab initio Simulation Package (VASP) [17,18] version 5.4.4 was used for all first-principles calculations. The projector augmented-wave (PAW) method [19] was employed to describe the electron-ion interactions, while the exchange-correlation energy was treated within the generalized gradient approximation (GGA) using the Perdew–Burke–Ernzerhof (PBE) functional [20]. The PAW potentials included the valence-electron configuration for Pt and configuration for Rh. All calculations were performed with spin polarization enabled. A -centered Monkhorst–Pack [21] k-point mesh was used for Brillouin-zone integration during both structural relaxations and static total-energy calculations. The 1st-order Methfessel–Paxton smearing scheme [14] with a smearing width of 0.2 eV was employed to determine the electronic occupations. For the final static calculations, the Blöchl-corrected tetrahedron method [22] was used to obtain highly accurate total energies and electronic densities of states (DOS). The k-point meshes used for each structure are summarized in Table 1. The meshes were chosen to ensure convergence of the total energy to better than 0.1 meV using a plane-wave cutoff energy of 500 eV.
Table 1.
Calculated enthalpy of formation, crystal symmetry, lattice parameters, and k-mesh of all compounds considered in this study.
For the phonon calculations, the structural relaxations were terminated based on the force convergence criterion rather than the total-energy criterion. The maximum residual force on each atom was set to 0.1 meV/Å. Owing to the larger supercells generated for the finite-displacement phonon calculations, a reduced computational cost was achieved by employing a -centered k-point mesh for all phonon calculations. The quasi-harmonic phonon calculations were carried out as follows. First, all structures were fully relaxed with respect to the atomic positions, cell shape, and cell volume. Six additional structures were then generated by isotropically scaling the fully relaxed lattice vector to 0.98, 0.99, 1.01, 1.02, 1.03, and 1.04 times. For each scaled structure, constrained-volume structural relaxations were performed, in which the atomic position and cell shape were optimized while the cell volume was fixed. Subsequently, harmonic phonon calculations were carried out for each relaxed structure at the corresponding volume. The resulting volume-dependent phonon densities of states (PDOSs) were then used to evaluate the vibrational free energy within the quasi-harmonic approximation.
2.2. Elastic Properties Calculations
The elastic stiffness constants () were calculated using the stress–strain method [23]. The fully relaxed structure () was subjected to a homogeneous deformation according to:
where
is the deformation matrix, is the identity matrix, and denotes the deformed structure.
The deformation matrix contains nine independent components. However, three of these correspond to rigid-body rotations, which do not contribute to the elastic energy. Therefore, can be decomposed into a symmetric strain tensor and an antisymmetric rotation tensor:
where
and
where the strain and rotation components are defined as:
For infinitesimal deformations:
Since represents a pure rotation, Equation (4) can be rewritten as:
Within linear elasticity, the components correspond to the engineering strains. The elastic energy associated with the deformation is:
where is the equilibrium volume, are the elastic stiffness constants, and denotes the residual stress of the reference structure. The corresponding stresses are given by:
The equilibrium volume at each temperature, , was obtained from the quasi-harmonic phonon calculations by minimizing the Helmholtz free energy with respect to volume:
The finite-temperature elastic stiffness constants at 500, 1000, and 1500 K were then evaluated using the corresponding equilibrium volumes . The bulk modulus (B), shear modulus (G), and Young’s modulus (E) were calculated using the Voigt approximation [24]:
where
Finally, Poisson’s ratio () was obtained from:
In this work, we employed the quasi-static approximation rather than the full quasi-harmonic approach [25]. In quasi-static approximation, the temperature dependence of the elastic constants is obtained by combining the volume dependence of the elastic stiffness with the equilibrium thermal expansion predicted by the QHA. The full QHA elastic constants calculations require the phonon free energy to be evaluated for each strained configuration. Consequently, phonon calculations must be performed for every strained structure at each volume, resulting in a substantially greater computational demand.
2.3. Disordered Structures Generation
Several approaches have been developed to describe the disordered atomic configurations of alloy systems. Among the most widely used are the single-site coherent potential approximation (CPA) [26], the cluster expansion method (CEM) [27,28], the virtual crystal approximation (VCA) [29], and the special quasirandom structure (SQS) [30]. Although CPA successfully describes chemical and magnetic disorder in random alloys, its mean-field nature prevents it from capturing local environment effects, such as atomic relaxations and local lattice distortions. The CEM is a versatile and powerful method for describing short-range ordering; however, finite-temperature calculations based on CEM are often computationally demanding. The VCA is computationally efficient but neglects local lattice distortions, chemical disorder, and short-range ordering.
The SQS approach constructs a periodic supercell whose multisite correlation functions closely reproduce those of an ideal random alloy for a given supercell size. Consequently, it is particularly well suited for first-principles calculations of the properties of disordered alloys, including elastic properties, while maintaining a manageable computational cost. The SQS approach has been successfully applied to predict the elastic properties of multicomponent alloys [31]. Since the SQS method is closely related to the CEM, the same cluster correlation functions are used to quantify the degree of randomness. The correlation function for a configuration associated with cluster , is defined as:
where is the cluster function associated with cluster , and denotes the average over all clusters that are symmetry-equivalent to cluster . For a perfectly random alloy, the correlation functions are independent of the lattice site and are determined solely by the average composition. An SQS is therefore constructed by minimizing the difference between the correlation functions of the supercell and those of the corresponding perfectly random alloy. In the present work, the SQS approach is adopted to represent the fully disordered fcc solid solution. Consequently, possible short-range chemical ordering is not explicitly considered. The SQSs were generated using the module implemented in the ATAT software package [13].
3. Results and Discussions
3.1. Disordered Structures
Experimentally, no ordered phases have been reported in the Pt-Rh binary system. However, several first-principles studies have predicted the existence of the ordered PtRh-I41/amd and PtRh3-I4/mmm phases at low temperatures [4,5,6,7,8,9]. The thermodynamic stability of their ordered phases is limited. Based on our finite-temperature first-principles calculations, the PtRh-I41/amd and PtRh3-I4/mmm phases are stable only below approximately 200 K and 150 K, respectively. At higher temperatures, configurational entropy stabilizes the disordered fcc solid solution, which is the dominant phase throughout most of the Pt-Rh phase diagram.
Since the objective of the present work is to investigate the properties of the disordered fcc phase, the SQS approach was adopted to represent the fully disordered atomic configuration. Although the SQS method does not explicitly account for short-range chemical ordering, it reproduces the correlation functions of an ideal random alloy using a relatively small periodic supercell and is considerably more computationally efficient than averaging over numerous randomly generated large supercells [32].
Previous first-principles studies have modeled disordered Pt-Rh alloys using conventional random supercells, For example, Phasha et al. [11] employed a supercell based on an fcc unit cell to calculate the elastic constant of Pt-Rh alloys containing up to 50 at.% Rh. As the Rh concentration increased, the calculated elastic constants, particularly and the bulk modulus, were noticeably lower than the available experimental values [33]. This discrepancy may be associated with the limited ability of a relatively small random supercell to reproduce the correlation functions of a fully disordered alloy [32]. Therefore, the SQS approach was adopted in the present study to provide a more accurate representation of the disordered fcc structure while maintaining computational efficiency.
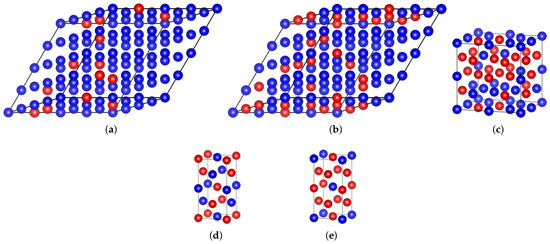
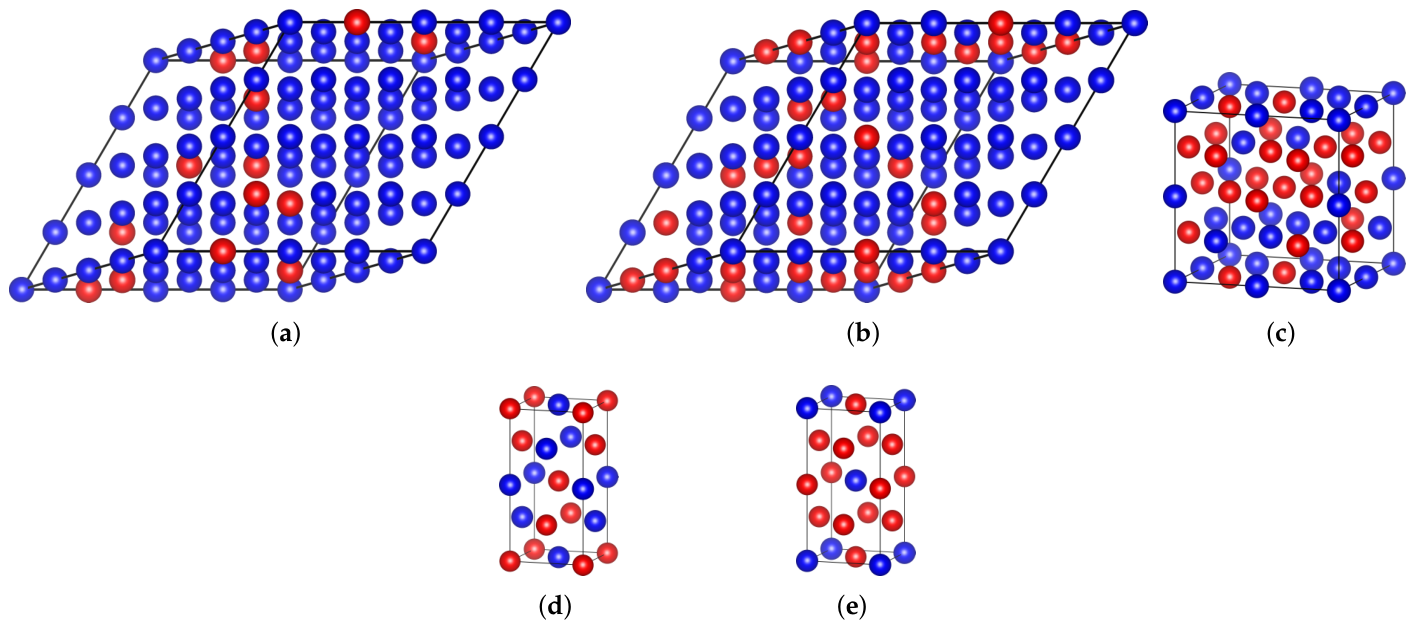
Three SQSs were generated to represent fcc-disordered Pt-Rh alloys containing 12.5, 25, and 50 at.% Rh. Two additional compositions, 75 and 87.5 at.% Rh, were obtained by interchanging the Pt and Rh atomic species in the 25 and 12.5 at.% Rh SQSs, respectively. Figure 1a–c illustrates the generated SQS unit cells for the 12.5, 25, and 50 at.% Rh compositions. To facilitate the subsequent elastic constant calculations, the generated SQS supercells were constrained to have equal lattice-vector lengths. As an example, Table 2 lists the correlation functions of the 50 at.% Rh SQS. The calculated correlation functions closely reproduce those of an ideal random alloy up to the 5th nearest neighbor pair clusters and for all triplet clusters with a maximum diameter less than twice the nearest neighbor distance. For the 12.5 and 25 at.% Rh compositions, 64-atom supercells were generated. Compared with the equiatomic composition, constructing an SQS at off-equiatomic compositions is more challenging because the target composition, correlation functions, and cell-shape constraints must all be satisfied simultaneously. Consequently, a larger supercell provides greater configurational freedom, allowing a better approximation of the correlation functions of an ideal random alloy while preserving the desired unit-cell geometry.
Figure 1.
Unit cells of the SQSs representing the fcc-disordered Pt–Rh alloys at (a) 12.5 at.% Rh (64 atoms), (b) 25 at.% Rh (64 atoms), and (c) 50 at.% Rh (32 atoms), together with the (d) PtRh-I41/amd and (e) PtRh3-I4/mmm crystal structures. The blue and red atoms represent Pt and Rh, respectively.
Table 2.
Calculated correlation functions of the 32-atom SQS at 50 at.% Rh compared with those of an ideal random alloy for pair (2-body) and triplet (3-body) clusters of different sizes.
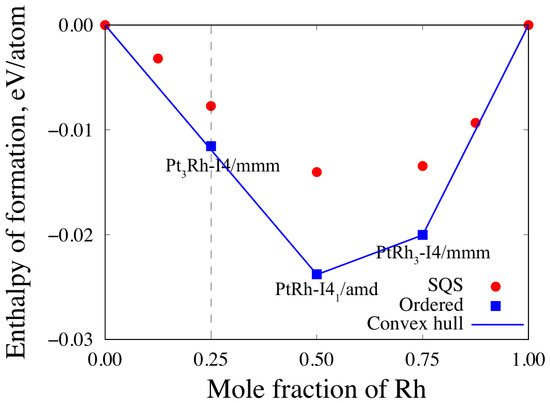
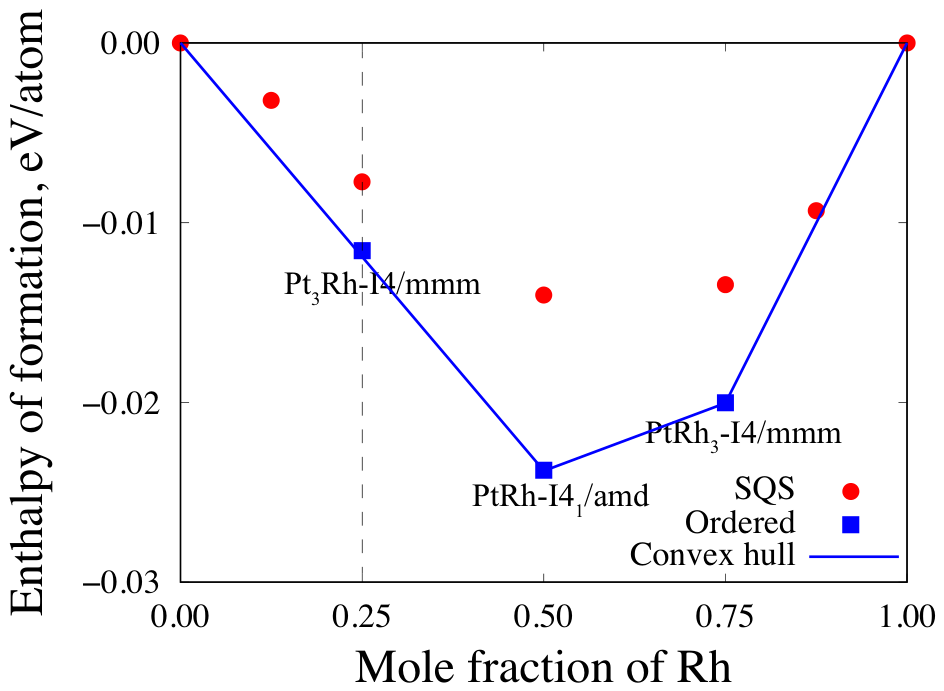
Figure 2 shows the calculated 0 K enthalpies of formation obtained from first-principles calculations for the fcc-disordered SQS together with the ordered Pt3Rh-I4/mmm, PtRh-I41/amd, and PtRh3-I4/mmm phases. At 0 K, the disordered fcc structures are metastable with respect to the corresponding ordered phases. In particular, the fcc-disordered structure at 50 at.% Rh has higher formation enthalpy than the PtRh-I41/amd ordered phase. Similarly, the ordered Pt3Rh-I4/mmm and PtRh3-I4/mmm are energetically more favorable than the disordered fcc structures at the corresponding compositions.
Figure 2.
Calculated enthalpies of formation of the fcc-disordered SQSs at different compositions, together with those of the Pt3Rh-I4/mmm, PtRh-I41/amd, and PtRh3-I4/mmm ordered phases.
The calculated convex hull further indicates that Pt3Rh-I4/mmm is not a thermodynamically stable ground-state phase. Instead, the coexistence of fcc-Pt and PtRh-I41/amd yields a lower energy at the same overall composition. Consequently, the formation enthalpy of Pt3Rh-I4/mmm lies slightly above the convex hull by only 0.4 meV/atom (68.27 J/mol-atom), indicating that this phase is metastable with respect to phase separation into fcc-Pt and PtRh-I41/amd.
These results are consistent with the semi-grand canonical lattice Monte Carlo simulations of Pohl et al. [8], who predicted that only the PtRh-I41/amd and PtRh3-I4/mmm ordered phases are thermodynamically stable at very low temperatures (below approximately 250 K). The calculated ground-state properties and the corresponding k-point meshes used in the present calculations are summarized in Table 1.
3.2. Coefficient of Thermal Expansion
As described in the Section 2, all first-principles calculations were performed with spin polarization enabled. Although both Pt and Rh are non-magnetic, the calculated magnetic moments converged to zero for all structures, confirming their non-magnetic ground states. Spin-polarized calculations were retained throughout this work to maintain a consistent computational setup that can be readily extended to future studies involving other alloying elements. To verify that the use of spin polarization does not influence the results, additional harmonic phonon calculations were performed for pure Pt with spin polarization disabled. The phonon spectra and vibrational properties were found to be identical to those obtained from the spin-polarization calculations, confirming that enabling spin polarization has no effect on the calculated properties of the Pt and Rh.
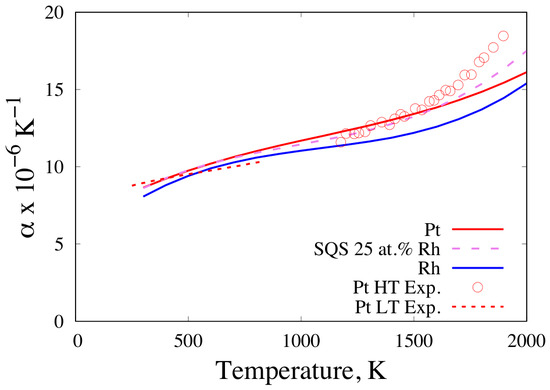
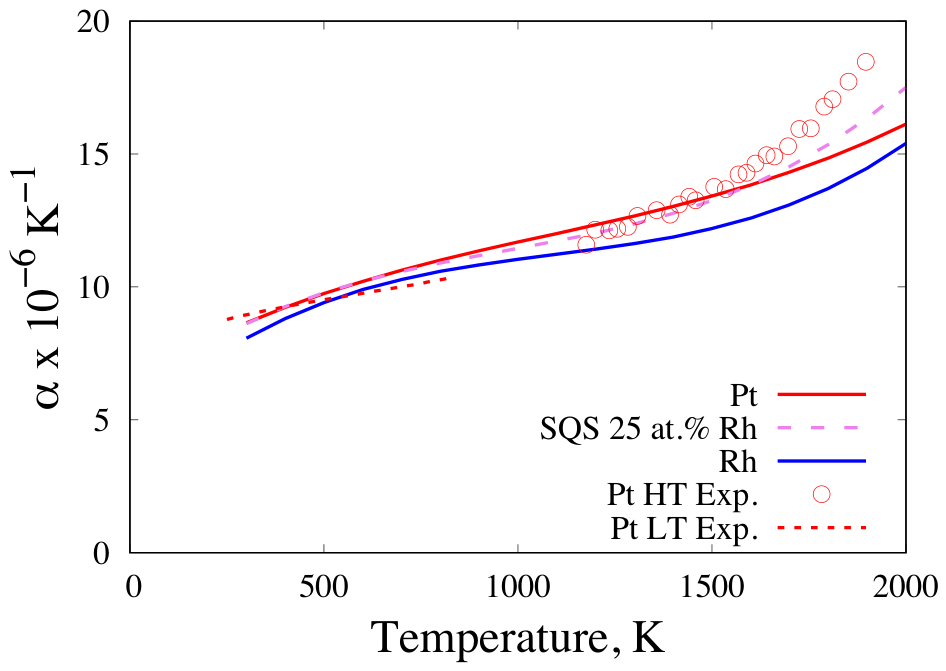
Figure 3 compares the calculated CTEs of fcc Pt and fcc Rh with two sets of experimental data for Pt reported in the literatures [34,35]. The calculated CTEs show good agreement with the experimental measurements at low and intermediate temperatures. However, noticeable deviations appear above approximately 1500 K. This discrepancy is likely associated with the limitation of the QHA, which neglects explicit anharmonic lattice vibrations. At sufficiently high temperatures, anharmonic effects become increasingly important and may contribute significantly to the thermal expansion [36]. Although there is no universal temperature above which anharmonic effects dominate, they generally become significant at approximately 0.6–0.8 of the melting temperature () for simple metallic solid solutions. Several computational packages, such as Phono3py [37] and ALAMODE [38], enable the calculation of anharmonic vibrational contributions beyond QHA. However, their calculations are substantially more computationally demanding than QHA calculations, particularly for the low-symmetry SQS supercell used in the present work, which belongs to the space group. The calculated CTEs of the Pt-Rh SQSs exhibit trends similar to those of pure Pt and Rh. The CTE of the 25 at.% Rh SQS lies between those of Pt and Rh over most of the investigated range. Above approximately 1500 K, however, it becomes slightly higher than that of pure Pt. At 300 K, the calculated CTEs of pure Pt and Rh are K−1 and K−1, respectively, which agree well with the corresponding experimental values of K−1 for Pt and K−1 for Rh [39]. This agreement demonstrates the reliability of the present first-principles approach for predicting thermal expansion. The fitted CTE equations for Pt, Rh, and the Pt-Rh SQSs at different compositions are summarized in Table 3. These CTEs were subsequently used as a part of evaluating the temperature-dependent elastic properties.
Figure 3.
Calculated linear coefficients of thermal expansion of fcc Pt, the 25 at.% Rh SQS, and fcc Rh, compared with the low-temperature (LT) [34] and high-temperature (HT) [35] experimental measurements for fcc Pt.
Table 3.
CTE equations for fcc Pt, the SQSs at 25, 50, and 75 at.% Rh, and fcc Rh.
3.3. Elastic Properties
After structural relaxation, the SQSs deviate slightly from the ideal cubic symmetry owing to the absence of long-range symmetry in the disordered atomic arrangement. Nevertheless, in the previous sections, the elastic moduli were derived using the Voigt approximation for cubic crystals. Therefore, it is necessary to verify that the relaxed SQSs retain an approximately cubic elastic response. Table 4 lists the calculated 0 K elastic stiffness constants for the 50 at.% Rh SQS. The diagonal elastic constants, , , and , are nearly identical, with a standard deviation (SD) of only 0.699 GPa. Similar behavior is observed for the off-diagonal elastic constants corresponding to the cubic (, , and ), and the shear elastic constants corresponding to the cubic (, , and ), whose standard deviation are 0.455 and 0.257 GPa, respectively. Furthermore, the coupling elastic constants (, , , , , and ) are all close to zero. These results indicate that the elastic response of the relaxed SQS remains very close to that of a cubic crystal despite the slight reduction in structural symmetry. Therefore, the cubic Voigt approximation introduced in the previous section provides an appropriate description of the elastic behavior of the SQSs. Table 5 summarizes the calculated 0 K elastic properties over the entire composition range. Furthermore, the effect of SQS supercell size on the calculated elastic constants was investigated. At the equiatomic composition, the elastic constants obtained from the 16-atom and 32-atom SQS supercells differ by only approximately 0.5%, with the 16-atom SQS consistently yielding slightly higher values. This small difference indicates that the calculated elastic constants are well converged with respect to the SQS supercell size. According to the mechanical stability criteria for cubic crystals [40,41]:
where all calculated structures satisfy the mechanical stability criteria for cubic crystals.
Table 4.
Elastic stiffness matrix (, GPa) of the fcc-disordered SQS at 50 at.% Rh.
Table 5.
Calculated 0 K elastic properties with standard deviation (SD) of the fcc Pt–Rh alloy system.
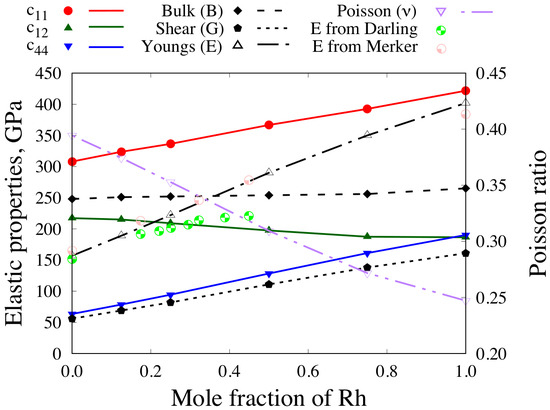
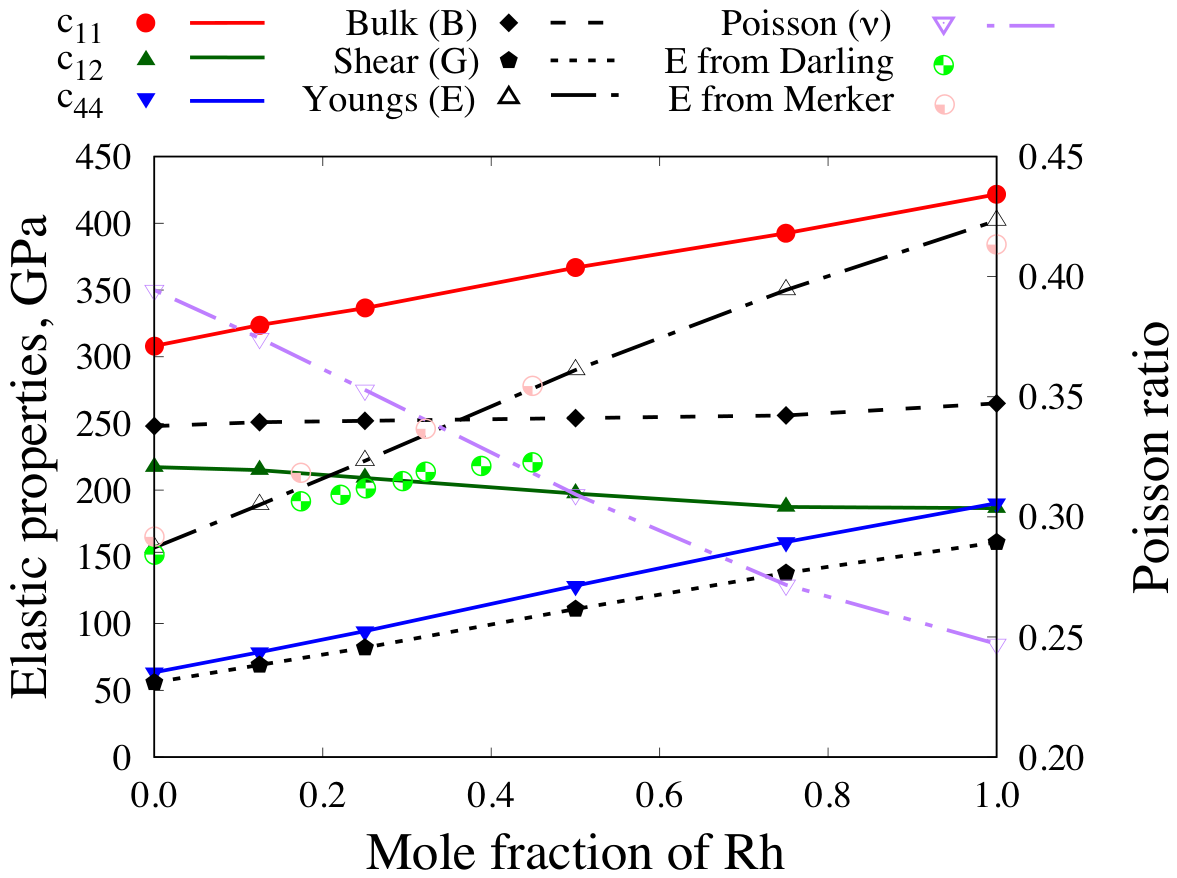
Figure 4 presents the calculated 0 K elastic properties (, , , B, G, E, and ) of the fcc-disordered Pt-Rh alloys as a function of Rh concentration. All elastic properties vary smoothly and monotonically across the entire composition range, with no evidence of abrupt changes or anomalous behavior. The bulk modulus remains nearly constant with increasing Rh concentration, indicating that the resistance to uniform compression is only weakly affected by alloying. In contrast, both the shear modulus and Young’s modulus increase significantly as the Rh concentration increases, reflecting the enhanced resistance of the alloy to shear and elastic deformation. The increase in Young’s modulus is primarily attributed to the increase in the shear modulus, since the bulk modulus exhibits only minor compositional dependence. This enhancement of Young’s modulus is consistent with experimental observations [33,42,43] and is one of the principal reasons why Rh is commonly used as an alloying element in Pt-based alloys. Two sets of experimental measurements of Young’s modulus at room temperature (25 °C) are included in Figure 4 for comparison. A noticeable discrepancy exists between the two datasets. The measurements reported by Darling et al. [42] show a substantially lower Young’s modulus with increasing Rh concentration, whereas the data reported by Merker et al. [33] are in much better agreement with the present calculations. The difference between the two experimental datasets may be attributed to differences in the experimental techniques, instrumentation, or sample quality. It is also worth noting that the measurements of Darling et al. were reported in 1961, whereas those of Merker et al. were published four decades later using more modern experimental methods.
Figure 4.
Calculated 0 K elastic properties of the fcc-disordered Pt-Rh alloys across the composition range, compared with experiment measurement of Young’s modulus at room temperature [33,42].
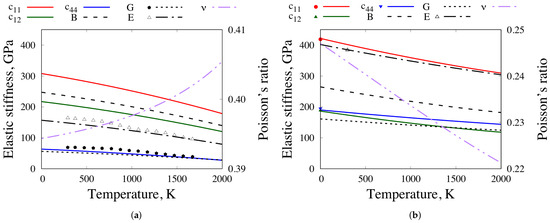
Figure 5a compares the calculated temperature-dependent Young’s and shear moduli of pure fcc Pt with the experimental measurements reported by Hamada et al. [44]. Overall, the calculated elastic properties are in good agreement with the experimental data over the investigated temperature range. The calculated values are consistently slightly lower than the experimental measurements. This slight underestimation is likely associated with the choice of the exchange-correlation functional employed in the DFT calculations. The PBE-GGA is known to slightly overestimate the equilibrium lattice parameter of many metallic systems, leading to a modest reduction in the predicted elastic stiffness. In contrast, calculations based on the local density approximation (LDA) generally underestimate the equilibrium lattice parameter and consequently tend to predict higher elastic constants. Therefore, the small discrepancy between the calculated and experimental elastic properties is consistent with the well-known behavior of the PBE-GGA functional.
Figure 5.
Calculated temperature-dependent elastic properties of (a) pure fcc Pt compared with experimental data [44] and (b) pure fcc Rh compared with elastic properties extrapolated to 0 K from experimental measurements [3] and experimental measurements at room temperature [33].
It can be seen that the experimentally measured elastic properties decrease with temperature slightly faster than the calculated values. A plausible explanation for this discrepancy is the increasing importance of anharmonic lattice vibrations at elevated temperatures, which are not explicitly included in QHA. Consistent with this interpretation, the experimental CTE exhibits a more pronounced increase at high temperatures than predicted by the present calculations, indicating a greater degree of bond softening. As a result, the experimentally measured elastic constants decrease more rapidly than those predicted by the QHA. Between 300 and 800 K, where anharmonic effects are expected to be relatively small, the difference between the calculated and experimental Young’s modulus remains nearly constant. Assuming that this nearly constant offset primarily originates from the use of the PBE-GGA exchange-correlation functional, the calculated Young’s modulus can be shifted to match the experimental value at low temperature. Comparing the shifted curve with the experimental data then provides a rough estimate of the anharmonic contribution. Based on this procedure, the anharmonic effect is estimated to reduce Young’s modulus of pure Pt by approximately 14% at 1700 K. Therefore, the calculated elastic properties above approximately 1500 K should be regarded as quasi-harmonic predictions, and their absolute values may be systematically overestimated at very high temperatures. Nevertheless, the calculated compositional trends are expected to remain reliable because the same approximation is applied consistently to all compositions. The calculated elastic properties of pure Rh, shown in Figure 5b, exhibit trends similar to those observed for pure fcc Pt. Overall, the calculated elastic properties are in good agreement with the 0 K extrapolated experimental data reported by Maurer et al. [3]. The experimental measurement of Young’s modulus at room temperature [33] agrees well with the calculated results. A notable difference between Pt and Rh is observed in the temperature dependence of Poisson’s ratio. For fcc Pt, Poisson’s ratio increases gradually with increasing temperature, whereas the opposite trend is found for fcc Rh, with Poisson’s ratio decreasing as the temperature increases. This contrasting behavior arises from the different temperature dependences of the bulk and shear moduli in the two elements, which influence the evolution of Poisson’s ratio according to Equation (21). The calculated finite-temperature elastic properties of Pt and Rh satisfy the mechanical stability criteria over the entire temperature range from 0 to 2000 K.
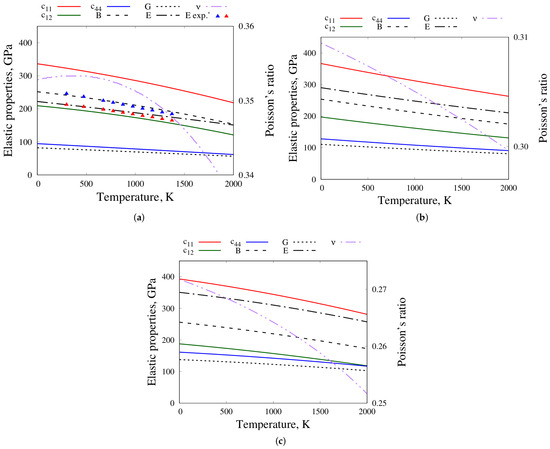
From room temperature to the temperatures relevant for high-temperature applications, the disordered fcc solid solution is the thermodynamically stable phase across the entire Pt-Rh composition range [1]. Therefore, SQS were employed to represent the disordered atomic configurations in the calculation of elastic properties of Pt-Rh alloys. Owing to computational limitations, finite-temperature elastic properties were calculated only for the SQSs containing 25, 50, and 75 at.% Rh. Figure 6 presents the calculated temperature-dependent elastic properties of the fcc-disordered Pt-Rh alloys at (a) 25, (b) 50, and (c) 75 at.% Rh. With increasing temperature, nearly all elastic properties decrease monotonically, reflecting the progressive softening of the lattice. The only exception is Poisson’s ratio of the SQS at 25 at.% Rh. As shown in Figure 6a, Poisson’s ratio initially increases with temperature, reaches a maximum at approximately 400 K, and then gradually decreases at higher temperatures. This behavior is similar to that observed for pure Pt, whose Poisson’s ratio also increases at low temperatures before decreasing at elevated temperatures. As the Rh concentration increases, the temperature dependence of the elastic properties gradually evolve toward that of pure fcc Rh. Figure 6a also includes the experimental measurements of the temperature-dependent Young’s modulus reported by Merker et al. [33]. Although the experimental compositions (approximately 17.4 and 32.2 at.% Rh) do not exactly match the 25 at.% Rh SQS, the calculated composition lies between the two experimental alloys. As expected, the calculated Young’s modulus falls between the two experimental datasets and is closer to the lower-Rh composition. Furthermore, the calculated values exhibit the same slight underestimation observed for pure Pt, which is attributed primarily to the systematic error associated with the PBE exchange-correlation functional. Overall, the agreement between the calculated and experimental trends provides additional validation of the present methodology for predicting the finite-temperature elastic properties of Pt-Rh alloys.
Figure 6.
Calculated temperature-dependent elastic properties of (a) the fcc-disordered Pt–Rh alloy at 25 at.% Rh, compared with the experimental measurements of Young’s modulus (E exp.*) at 17.4 and 32.2 at.% Rh reported by Merker et al. [33]; (b) the fcc-disordered Pt–Rh alloy at 50 at.% Rh; and (c) the fcc-disordered Pt–Rh alloy at 75 at.% Rh.
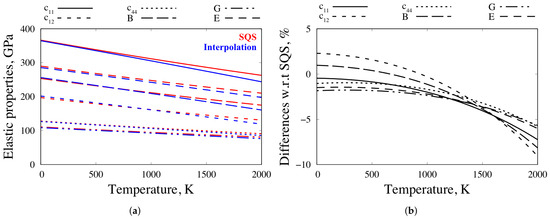
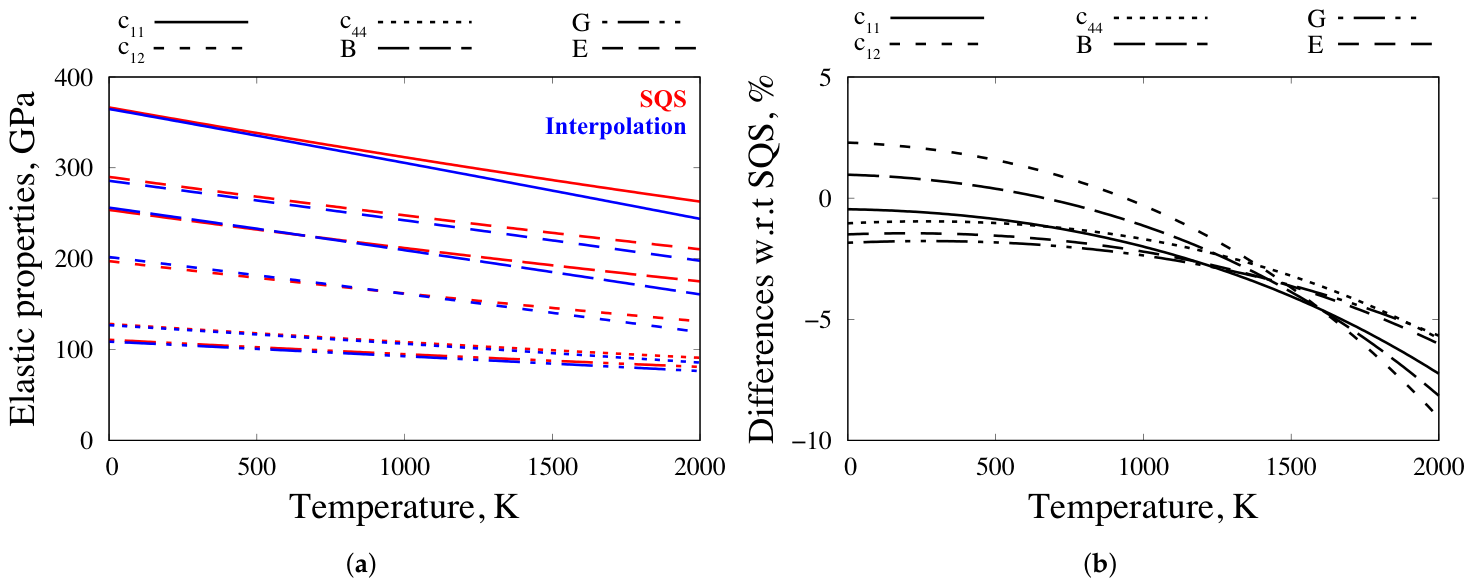
For typical Pt-Rh alloys used in engineering applications, the Rh content is generally below 7 wt.% Rh (approximately 12.5 at.% Rh), where Rh is added to improve both the mechanical properties and corrosion resistance. Accurate first-principles calculations at this composition require a relatively large SQS to adequately represent the disordered atomic configuration. However, the computational cost associated with finite-temperature phonon and elastic properties calculations for such large supercell are prohibitively high. Consequently, interpolation between the calculated compositions represents a practical alternative. Figure 7a compares the finite-temperature elastic properties obtained directly from the equiatomic (50 at.% Rh) SQS with those estimated by linear interpolation between pure elements. At low temperatures, the interpolated elastic properties agree closely with the direct SQS calculations. As the temperature increases, the differences gradually become larger. At 2000 K, the largest absolute deviation is approximately 19 GPa for . Figure 7b presents the corresponding relative differences with respect to the SQS results. Although exhibits the largest absolute deviation, the largest relative deviation is observed for , reaching approximately at 2000 K. Overall, the interpolated elastic properties remain in good agreement with the direct SQS calculations over the investigated temperature range. The good agreement between the direct SQS calculations and the linear interpolation can be understood from the thermodynamic behavior of the disordered fcc Pt–Rh solid solution. According to the CALPHAD methodology [45], the molar Gibbs free energy of the disordered fcc phase can be expressed as:
where is the molar Gibbs free energy of the fcc phase, is the Gibbs free energy of pure element i in the fcc structure, is the mole fraction of element i, R is the gas constant, T is the absolute temperature, and is the excess Gibbs free energy of mixing. Without the excess term, the above expression reduces to the ideal-solution model, in which the Gibbs free energy is given by the weighted average of the pure-element Gibbs free energies together with the configurational entropy of an ideal random solution. The excess Gibbs free energy therefore represents the deviation of the real alloy from ideal-solution behavior. For a substitutional solid solution described by a single-sublattice model, the excess Gibbs free energy can be obtained from first-principles calculations as:
where is the Gibbs free energy of the SQS at any corresponding composition. Within the CALPHAD framework, the excess Gibbs free energy is commonly represented using the Redlich–Kister polynomial [46]:
where is the -order binary interaction parameter for . In general, these interaction parameters are temperature-dependent and are commonly expressed as linear functions of temperature:
Figure 7.
(a) Comparison of the elastic properties obtained from direct SQS calculations and linear interpolation for the equiatomic fcc-disordered Pt–Rh alloy. (b) Differences between the direct SQS calculations and the linear interpolation.
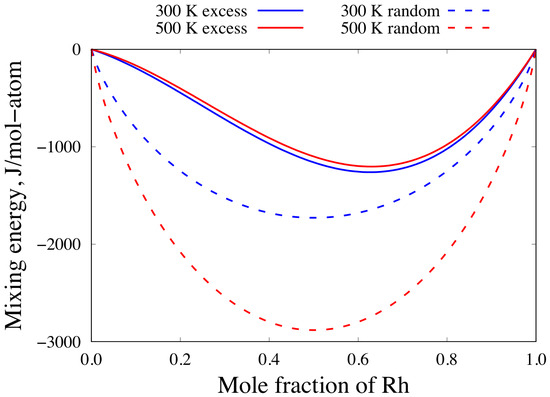
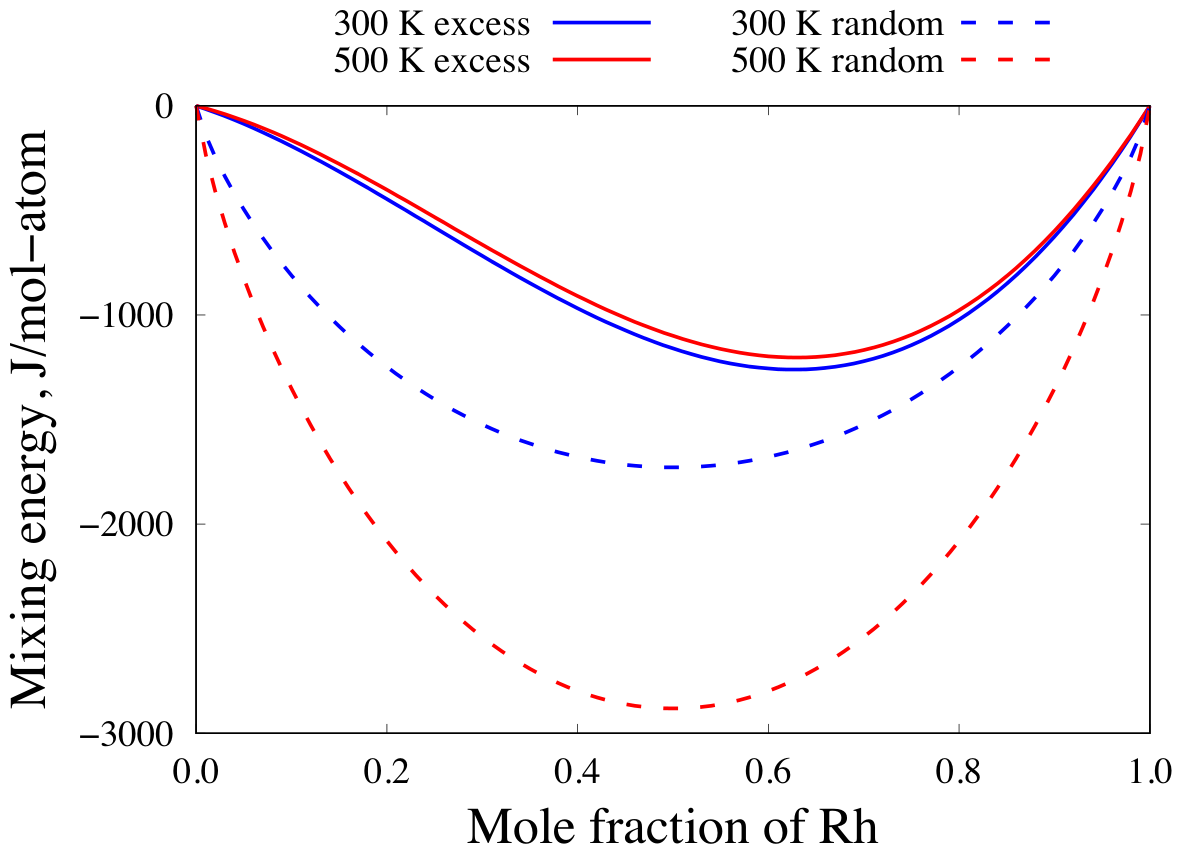
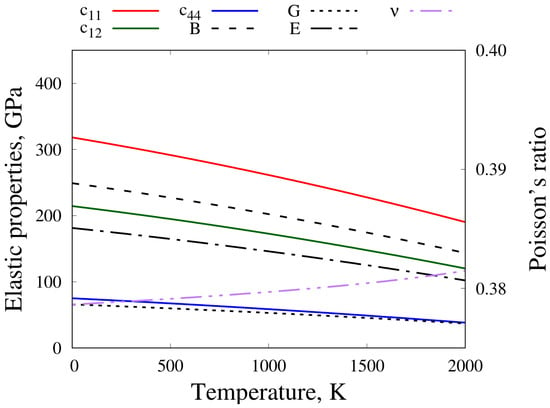
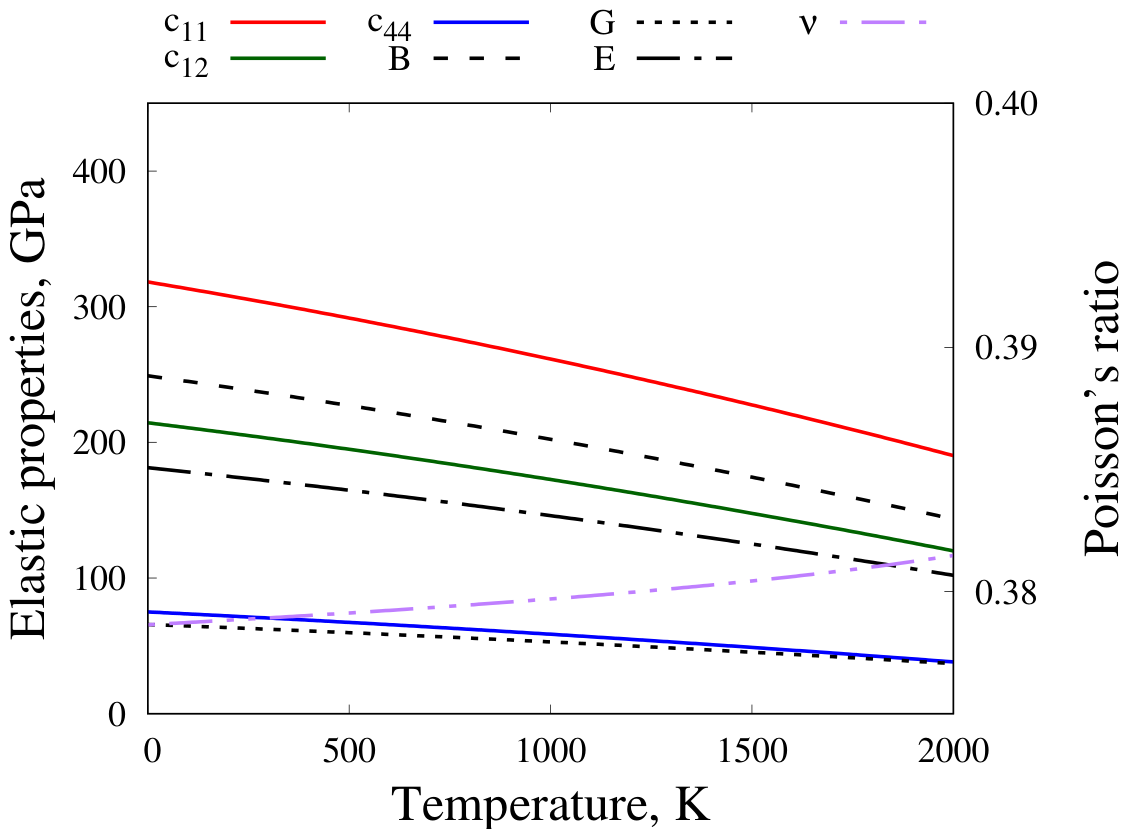
Figure 8 presents the calculated excess Gibbs free energy of mixing of the fcc-disordered Pt-Rh solid solution obtained from finite-temperature first-principles calculations together with the configurational Gibbs free energy of an ideal random solution at 300 and 500 K. It can be seen that the excess Gibbs free energy is considerably smaller than the configurational contribution at 300 K. At 500 K, the excess term becomes only a small fraction of the configurational Gibbs free energy. On the Pt-rich side, the excess Gibbs free energy is particularly small, indicating that the thermodynamic behavior of Pt-rich Pt-Rh alloys approaches that of an ideal solid solution. This near-ideal solution behavior also explains why linear interpolation provides a good approximation of the elastic properties. Since the excess Gibbs free energy is relatively small, the elastic properties vary almost linearly with composition. Furthermore, the calculated excess Gibbs free energy is slightly negative, indicating a weak energetic preference for mixing. Consistent with this behavior, the elastic stiffness constants obtained directly from SQS calculations are slightly higher than those predicted by linear interpolation, as shown in Figure 7a. Based on this observation, the same interpolation approach was applied to estimate the finite-temperature elastic properties of the fcc-disordered Pt-12.5 at.% Rh alloy using pure Pt and the 25 at.% Rh SQS as the end members. The interpolated elastic properties are shown in Figure 9. All elastic properties vary smoothly and monotonically with temperature, while Poisson’s ratio remains nearly constant over the entire temperature range. According to Equation (21), this behavior indicates that the ratio between Young’s modulus and the shear modulus remains approximately constant as the temperature increases.
Figure 8.
Calculated excess Gibbs free energy of mixing of the fcc-disordered Pt–Rh solid solution, together with the Gibbs free energy of ideal random mixing, at 300 and 500 K.
Figure 9.
Temperature-dependent elastic properties of the fcc-disordered Pt–Rh alloy at 12.5 at.% Rh.
4. Conclusions
Special quasirandom structures (SQSs) were generated to represent the disordered fcc Pt-Rh solid solution at various compositions while maintaining a unit-cell geometry suitable for elastic constants calculations. Using the generated SQSs, the coefficients of thermal expansion (CTEs) were determined within the quasi-harmonic approximation, and the 0 K elastic properties were calculated using first-principles density functional theory. The calculated elastic properties exhibit a smooth compositional dependence, Young’s modulus increasing monotonically as the Rh concentration increases, in agreement with experimental observations. By combining the calculated thermal expansion with the volume-dependent elastic properties, the finite-temperature elastic properties of the fcc-disordered Pt-Rh alloys were successfully determined. The calculated excess Gibbs free energy of mixing indicates that the disordered fcc Pt-Rh solid solution exhibits near-ideal solution behavior. Consequently, linear interpolation of the elastic properties provides an excellent approximation to the direct SQS calculations. This approach enables the finite-temperature elastic properties of technologically important Pt-12.5 at.% Rh alloys to be estimated accurately from calculations performed on the pure Pt and the 25 at.% Rh SQS, thereby substantially reducing the computational cost associated with large SQS calculations.
Author Contributions
Conceptualization, A.S., R.S., Y.K. and K.H.; methodology, A.S.; validation, A.S.; formal analysis, A.S.; investigation, A.S.; resources, R.S.; data curation, A.S.; writing—original draft preparation, A.S.; writing—review and editing, R.S., Y.K. and K.H.; visualization, A.S.; supervision, R.S. and K.H.; project administration, R.S. and K.H.; funding acquisition, R.S. and K.H. All authors have read and agreed to the published version of the manuscript.
Funding
This work was supported by Innovative Science and Technology Initiative for Security (grant number JPJ004596) and the Grants-in-Aid for Scientific Research “KAKENHI” (grant number 21H01607). Funding agency: Acquisition, Technology & Logistics Agency (ATLA) and Japan Society for the Promotion of Science (JSPS).
Data Availability Statement
The raw data required to reproduce these findings cannot be shared at this time as the data also form part of an ongoing study. The process data required to reproduce the calculation results are available from the corresponding author on reasonable request.
Acknowledgments
The authors gratefully acknowledge the Numerical Materials Simulator supercomputing resources of the Research Network and Facility Services Division (RNFS) of the National Institute for Materials Science (NIMS), Japan.
Conflicts of Interest
Author K.H. was employed by the NETS Co., Ltd. The remaining authors declare that the research was conducted in the absence of any commercial or financial relationships that could be construed as a potential conflict of interest.
References
- Massalski, T.; Okamoto, H.; Subramanian, P. Binary Alloy Phase Diagrams, 2nd ed.; ASM International: Georg County, OH, USA, 1990. [Google Scholar]
- Macfarlane, R.; Rayne, J.; Jones, C. Anomalous temperature dependence of shear modulus c44 for platinum. Phys. Lett. 1965, 18, 91–92. [Google Scholar] [CrossRef] [Scilit]
- Maurer, D.; Heichele, R.; Lingg, N.; Müller, V.; Rieder, K.H. Elastic Properties of Purified Single-Crystalline Rhodium. Phys. Status Solidi A 1997, 160, 403–411. [Google Scholar] [CrossRef] [Scilit]
- Lu, Z.W.; Wei, S.H.; Zunger, A. Long-range order in binary late-transition-metal alloys. Phys. Rev. Lett. 1991, 66, 1753–1756. [Google Scholar] [CrossRef] [Scilit] [PubMed]
- Lu, Z.W.; Klein, B.M.; Zunger, A. Ordering tendencies in Pd-Pt, Rh-Pt, and Ag-Au alloys. J. Phase Equilib. 1995, 16, 36–45. [Google Scholar] [CrossRef] [Scilit]
- Platzgummer, E.; Sporn, M.; Koller, R.; Forsthuber, S.; Schmid, M.; Hofer, W.; Varga, P. Temperature-dependent segregation on Pt25Rh75 (111) and (100). Surf. Sci. 1999, 419, 236–248. [Google Scholar] [CrossRef] [Scilit]
- Yuge, K.; Seko, A.; Kuwabara, A.; Oba, F.; Tanaka, I. First-principles study of bulk ordering and surface segregation in Pt-Rh binary alloys. Phys. Rev. B 2006, 74, 174202. [Google Scholar] [CrossRef] [Scilit]
- Pohl, J.; Albe, K. Phase equilibria and ordering in solid Pt–Rh calculated by means of a refined bond-order simulation mixing model. Acta Mater. 2009, 57, 4140–4147. [Google Scholar] [CrossRef] [Scilit]
- Welker, P.; Wieckhorst, O.; Kerscher, T.C.; Müller, S. Predicting the segregation profile of the Pt25Rh75 (100) surface from first-principles. J. Phys. Condens. Matter 2010, 22, 384203. [Google Scholar] [CrossRef] [Scilit] [PubMed]
- Wei, Y.; Zhang, M.; Hu, C.; Yuan, Z.; Wang, X.; Jiang, H.; Wang, X.; Cai, H.; Zhang, G.; Wang, X.; et al. First-Principles Investigation on the High-Temperature Mechanical Properties and Thermal Properties of Pt-40Rh. Trans. Indian Inst. Met. 2023, 76, 1545–1552. [Google Scholar] [CrossRef] [Scilit]
- Phasha, M.; Möller, H.; Moema, J.; du Preez, W.; Maringa, M. Structural and elastic properties of binary FCC Pt-Rh alloys— A first-principles study. MATEC Web Conf. 2023, 388, 01002. [Google Scholar] [CrossRef] [Scilit]
- Li, Z.; Xiong, K.; Jin, C.; Wu, H.; Zhang, S.; Deng, L.; Yang, R.; Liao, N.; Wang, Y. A First-Principles Study on the Effect of Rh Content on the Lattice, Electronic and Mechanical Properties of Pt-Rh Solid Solution. Adv. Theory Simul. 2026, 9, e01884. [Google Scholar] [CrossRef] [Scilit]
- van de Walle, A.; Asta, M.; Ceder, G. The alloy theoretic automated toolkit: A user guide. Calphad 2002, 26, 539–553. [Google Scholar] [CrossRef] [Scilit]
- Methfessel, M.; Paxton, A.T. High-Precision Sampling for Brillouin-Zone Integration in Metals. Phys. Rev. B 1989, 40, 3616–3621. [Google Scholar] [CrossRef] [Scilit] [PubMed]
- Andersson, J.O.; Helander, T.; Höglund, L.; Shi, P.; Sundman, B. Thermo-Calc & DICTRA, computational tools for materials science. Calphad 2002, 26, 273–312. [Google Scholar] [CrossRef] [Scilit]
- Shang, S.; Wang, Y.; Liu, Z.K. First-principles calculations of phonon and thermodynamic properties in the boron-alkaline earth metal binary systems: B-Ca, B-Sr, and B-Ba. Phys. Rev. B 2007, 75, 024302. [Google Scholar] [CrossRef] [Scilit]
- Kresse, G. Efficient iterative schemes for ab initio total-energy calculations using a plane-wave basis set. Phys. Rev. B 1996, 54, 11169–11186. [Google Scholar] [CrossRef] [Scilit] [PubMed]
- Kresse, G.; Joubert, D. From ultrasoft pseudopotentials to the projector augmented-wave method. Phys. Rev. B 1999, 59, 1758. [Google Scholar] [CrossRef] [Scilit]
- Blóchl, P.E. Projector augmented-wave method. Phys. Rev. B 1994, 50, 17953–17979. [Google Scholar] [CrossRef] [Scilit] [PubMed]
- Perdew, J.P.; Burke, K.; Ernzerhof, M. Generalized Gradient Approximation Made Simple. Phys. Rev. Lett. 1996, 77, 3865–3868. [Google Scholar] [CrossRef] [Scilit] [PubMed]
- Monkhorst, H.J.; Pack, J.D. Special points for Brillouin-zone integrations. Phys. Rev. B 1976, 13, 5188–5192. [Google Scholar] [CrossRef] [Scilit]
- Blóchl, P.E.; Jepsen, O.; Andersen, O.K. Improved tetrahedron method for Brillouin-zone integrations. Phys. Rev. B 1994, 49, 16223–16233. [Google Scholar] [CrossRef] [Scilit] [PubMed]
- Le Page, Y.; Saxe, P. Symmetry-general least-squares extraction of elastic data for strained materials from ab initio calculations of stress. Phys. Rev. B 2002, 65, 104104. [Google Scholar] [CrossRef] [Scilit]
- Simmons, G.; Wang, H. Single Crystal Elastic Constants and Calculated Aggregate Properties; The MIT Press: Cambridge, MA, USA, 1971. [Google Scholar]
- Wang, Y.; Wang, J.J.; Zhang, H.; Manga, V.R.; Shang, S.L.; Chen, L.Q.; Liu, Z.K. A first-principles approach to finite temperature elastic constants. J. Phys. Condens. Matter 2010, 22, 225404. [Google Scholar] [CrossRef] [Scilit] [PubMed]
- Gyorffy, B.L. Coherent-Potential Approximation for a Nonoverlapping-Muffin-Tin-Potential Model of Random Substitutional Alloys. Phys. Rev. B 1972, 5, 2382–2384. [Google Scholar] [CrossRef] [Scilit]
- Sanchez, J.; Ducastelle, F.; Gratias, D. Generalized cluster description of multicomponent systems. Phys. A Stat. Mech. Its Appl. 1984, 128, 334–350. [Google Scholar] [CrossRef] [Scilit]
- Sanchez, J.M. Cluster expansion and the configurational theory of alloys. Phys. Rev. B 2010, 81, 224202. [Google Scholar] [CrossRef] [Scilit]
- Bellaiche, L.; Vanderbilt, D. Virtual crystal approximation revisited: Application to dielectric and piezoelectric properties of perovskites. Phys. Rev. B 2000, 61, 7877–7882. [Google Scholar] [CrossRef] [Scilit]
- Zunger, A.; Wei, S.H.; Ferreira, L.G.; Bernard, J.E. Special quasirandom structures. Phys. Rev. Lett. 1990, 65, 353–356. [Google Scholar] [CrossRef] [Scilit] [PubMed]
- Tasnádi, F.; Wang, F.; Odén, M.; Abrikosov, I.A. Special quasirandom structure method in application for advanced properties of alloys: A study on Ti0.5Al0.5N and TiN/Ti0.5Al0.5N multilayer. Comput. Mater. Sci. 2015, 103, 194–199. [Google Scholar] [CrossRef] [Scilit]
- von Pezold, J.; Dick, A.; Friák, M.; Neugebauer, J. Generation and performance of special quasirandom structures for studying the elastic properties of random alloys: Application to Al-Ti. Phys. Rev. B 2010, 81, 094203. [Google Scholar] [CrossRef] [Scilit]
- Merker, J.; Lupton, D.; Töpfer, M.; Knake, H. High Temperature Mechanical Properties of the Platinum Group Metals: Elastic Properties of Platinum, Rhodium and Iridium and Their Alloys at High Temperatures. Platin. Met. Rev. 2001, 45, 74–82. [Google Scholar] [CrossRef] [Scilit]
- Edsinger, R.; Reilly, M.; Schooley, J. Thermal Expansion of Platinum and Platinum-Rhodium Alloys. J. Res. Natl. Bur. Stand. 1986, 91, 333. [Google Scholar] [CrossRef] [Scilit] [PubMed]
- Kraftmakher, Y.A. Modulation Method for Studying Thermal Expansion. In Thermal Expansion 6; Peggs, I.D., Ed.; Springer: Boston, MA, USA, 1978; pp. 155–164. [Google Scholar] [CrossRef] [Scilit]
- Fultz, B. Vibrational thermodynamics of materials. Prog. Mater. Sci. 2010, 55, 247–352. [Google Scholar] [CrossRef] [Scilit]
- Togo, A.; Chaput, L.; Tanaka, I. Distributions of phonon lifetimes in Brillouin zones. Phys. Rev. B 2015, 91, 094306. [Google Scholar] [CrossRef] [Scilit]
- Tadano, T.; Gohda, Y.; Tsuneyuki, S. Anharmonic force constants extracted from first-principles molecular dynamics: Applications to heat transfer simulations. J. Phys. Condens. Matter 2014, 26, 225402. [Google Scholar] [CrossRef] [Scilit] [PubMed]
- Corruccini, R.; Gniewek, J. Thermal Expansion of Technical Solids at Low Temperatures: A Compilation from the Literature; Monograph 29 Series; U.S. Department of Commerce, National Bureau of Standards: Gaithersburg, MD, USA, 1961. [Google Scholar]
- Born, M.; Huang, K. Dynamical Theory of Crystal Lattices; Oxford University Press: Oxford, UK, 1954. [Google Scholar]
- Mouhat, F.; Coudert, F.X. Necessary and sufficient elastic stability conditions in various crystal systems. Phys. Rev. B 2014, 90, 224104. [Google Scholar] [CrossRef] [Scilit]
- Darling, A.S. Rhodium-Platinum Alloys: A Critical Review of their Constitution and Properties. Platin. Met. Rev. 1961, 5, 58–65. [Google Scholar] [CrossRef] [Scilit]
- Zarinejad, M.; Rimaz, S.; Tong, Y.; Wada, K.; Pahlevani, F. Dependence of Mechanical Properties of Platinum-Rhodium Binary Alloys on Valence Electron Parameters: Increasing valence electron ratio improves alloy properties. Johns. Matthey Technol. Rev. 2023, 67, 290–299. [Google Scholar] [CrossRef] [Scilit]
- Hamada, T.; Hitomi, S.; Ikematsu, Y.; Nasu, S. High-Temperature Creep of Pure Platinum. Mater. Trans. JIM 1996, 37, 353–358. [Google Scholar] [CrossRef] [Scilit]
- Ohtani, H. The CALPHAD Method. In Springer Handbook of Materials Measurement Methods; Czichos, H., Saito, T., Smith, L., Eds.; Springer: Berlin/Heidelberg, Germany, 2006; pp. 1001–1030. [Google Scholar] [CrossRef] [Scilit]
- Redlich, O.; Kister, A.T. Algebraic Representation of Thermodynamic Properties and the Classification of Solutions. Ind. Eng. Chem. 1948, 40, 345–348. [Google Scholar] [CrossRef] [Scilit]

Disclaimer/Publisher’s Note: The statements, opinions and data contained in all publications are solely those of the individual author(s) and contributor(s) and not of MDPI and/or the editor(s). MDPI and/or the editor(s) disclaim responsibility for any injury to people or property resulting from any ideas, methods, instructions or products referred to in the content. |
© 2026 by the authors. Licensee MDPI, Basel, Switzerland. This article is an open access article distributed under the terms and conditions of the Creative Commons Attribution (CC BY) license.