


Abstract
Austenitic stainless steels exhibit excellent corrosion resistance owing to the formation of passive films composed of a dense Cr-rich inner layer and porous Fe-rich outer layer. The corrosion resistance and passive film characteristics of N-containing austenitic stainless steel (NASS) were investigated in various pH and Cl−-containing environments and compared with those of commercial 304 SS. Microstructural analysis revealed that NASS had larger grains but more favorable crystal structures for the adsorption of passivating species. NASS exhibited a lower corrosion current density, higher pitting potential, and superior repassivation behavior in acidic and neutral environments, whereas 304 SS exhibited better corrosion resistance under strongly alkaline conditions. NASS formed a passive film with lower defect density and a higher fraction of compact Cr-rich species, contributing to its enhanced passive film stability and repassivation ability. Immersion tests demonstrated that pit initiation was delayed in the NASS group compared with the 304 SS group. These results indicate that the corrosion resistance of NASS in acidic and neutral environments originates from the improved stability and protective characteristics of the passive film.
1. Introduction
Fe–Cr–Ni ternary austenitic stainless steels (ASSs), such as 304 stainless steel, have been extensively employed in a wide range of industrial applications owing to their excellent corrosion resistance, formability, weldability, and mechanical properties. Ni plays an essential role in stabilizing the austenitic structure of stainless steel, improving its corrosion resistance and providing excellent strength at both high and low temperatures. Owing to these advantages, Ni-containing stainless steels have been widely used in the chemical industry, manufacturing, buildings, and infrastructure, resulting in a growing demand for Ni that has exceeded its supply, leading to persistently high prices [1]. Ni, which accounts for a substantial portion of the raw material cost of ASSs, has maintained a relatively high market price in recent years, on the order of $20,000 per ton according to the London Metal Exchange [2]. In contrast, industrial N is considerably less expensive, at approximately $110 per ton, making N-containing stainless steels a cost-effective alternative to conventional Ni-based alloys [3]. In this context, N-containing stainless steels have been proposed and actively studied as promising alternatives, as N is a strong austenite stabilizer [4,5].
N is known to not only provide economic advantages but also improve the microstructural homogeneity of stainless steels [6,7]. In addition, interstitially dissolved N in ASSs promotes repassivation during corrosion and enhances resistance to intergranular corrosion [8,9,10]. Numerous studies have shown that N improves pitting corrosion resistance [11,12,13], while other studies have reported that the corrosion resistance of N-containing steels may deteriorate [14,15]. Therefore, the effect of N on corrosion behavior remains controversial.
The corrosion resistance of stainless steels is mainly governed by the barrier properties of the passive films formed on their surfaces. Generally, because stainless steels contain both Fe and Cr, they form a duplex passive film structure composed of a dense and highly protective Cr-rich inner layer and Fe-rich outer layer. However, in chloride (Cl−) containing corrosive environments, the localized breakdown of the passive film can induce pitting corrosion, which propagates deeply in the vertical direction. The pitting process generally proceeds through pit nucleation, metastable pitting, and stable pitting stages. Before the formation of stable pits, current fluctuations associated with metastable pitting may occur; such transient events can be suppressed through self-healing. Therefore, metastable pitting behavior can be used as an indicator of the repassivation ability [16].
Among various environmental factors, pitting behavior is strongly influenced by the hydrogen ion concentration (pH). In acidic solutions with pH values below 4, the oxide layer on the iron surface, which acts as a diffusion barrier, dissolves, allowing oxygen to approach the metal interface and cause depolarization reactions that accelerate corrosion [17]. Despite this importance, as summarized in Table S1, previous studies on N-containing stainless steels have mainly focused on passive film characterization under fixed, neutral NaCl conditions. Although electrochemical parameters have been widely used to assess film performance, the pH-dependent protective role of N has not been sufficiently explored. Moreover, studies directly linking electrochemical tests with the initiation–growth–deepening sequence remain scarce. Accordingly, in this study, the corrosion behaviors of N-containing austenitic stainless steel (NASS) and 304 SS were compared in solutions with controlled pH and Cl− concentrations. Based on electrochemical analyses and post-corrosion surface observations, the stability of the passive film and the characteristics of pitting corrosion were evaluated to clarify the effect of N addition on localized corrosion resistance.
2. Materials and Methods
2.1. Materials and Solutions
NASS was compared with commercial 304 SS in this study. Table 1 shows the main chemical compositions of the alloys determined using inductively coupled plasma-optical emission spectroscopy (ICP-OES; PDA-7000, Shimadzu, Kyoto, Japan). The test solutions containing 0.1 M, 0.5 M, and 1.0 M NaCl were added to an appropriate amount of H2SO4 or NaOH, and then the pH value was measured using a pH meter (MM4-pH, DKK-TOA, Tokyo, Japan). A cyclic polarization test was conducted to analyze the polarization behavior in 0.1 M, 0.5 M, and 1.0 M NaCl solutions at pH 3, 5, 7 (neutral), 9, and 11. To evaluate the stability and resistance of the passive films, potentiostatic polarization tests and electrochemical impedance spectroscopy (EIS) were performed in a 1.0 M NaCl solution at pH 3, 7 (neutral), and 11. The electrochemical test solutions were purged with N2 gas for 1 h to remove dissolved O2. For the accelerated immersion test, a 6% FeCl3 solution was prepared according to ASTM G48.
Table 1.
Chemical compositions of NASS and 304 stainless steel (wt%).
2.2. Microstructural Analysis
The microstructures of NASS and 304 SS were analyzed using field-emission scanning electron microscopy (FE-SEM; MIRA3, Tescan, Brno, Czech Republic), energy-dispersive spectroscopy (EDS; Ultim Max Infinity 65, Oxford Instruments, Abingdon, UK), and electron backscatter diffraction (EBSD; Symmetry, Oxford Instruments, Abingdon, UK). The specimen was cold-mounted and ground with 220-, 400-, 800-, 1200-, and 2000-grit SiC paper, polished with 3 μm and 1 μm diamond polishing paste, finished with 0.03 μm colloidal silica, cleaned with alcohol and deionized water, and dried in air. The crystal structure was analyzed using X-ray diffraction (XRD; D/MAX-2100, Rigaku, Tokyo, Japan) with Cu Kα radiation (λ = 1.5418 Å) at a voltage of 40 kV and current of 30 mA. The 2θ range of 20~100° was scanned at a speed of 10°/min.
2.3. Electrochemical Experiments
The electrochemical experiments were conducted using an electrochemical potentiostat (Gamry Interface 1010E, Gamry Instruments, Warminster, PA, USA). In this study, NASS and 304 SS with dimensions of 10 mm × 10 mm were used as the working electrodes, and a Pt coil was used as the counter electrode. For the reference electrodes, Ag/AgCl electrode was used for acidic and neutral conditions (pH 3, 5 and 7 (neutral)), while Hg/HgO electrode was employed for the alkaline conditions (pH 9 and 11), considering the electrochemical stability of each electrode under the respective pH conditions. The working electrodes were cathodically polarized at −0.9 V for 90 s to remove impurities on the surface, and the open circuit potential was monitored for 1800 s to stabilize the test system.
For the cyclic polarization test, the potential was scanned from −0.25 V to 1.0 V and then back to the initial potential at a scanning rate of 0.167 mV/s. The corrosion current density (icorr) was calculated by Tafel extrapolation using the EC-Lab simulation program module. After surface etching in an acidic solution containing a 3:1:4 ratio of HCl, HNO3, and H2O for 2 min to remove the passive films formed on the NASS and 304 SS surfaces and characterize the reformed passive films, a potentiostatic polarization test was conducted at a fixed potential of 0.3 V for 3600 s. EIS measurements were performed in the frequency range from 105 to 10−2 Hz using a sinusoidal voltage with an amplitude of 10 mV. The EIS measurement data were fitted to appropriate equivalent circuits using Gamry Echem Analyst software version 6.03. The Mott–Schottky analysis was scanned from −0.1 V to 1.0 V at 103 Hz using an AC signal of 5 mV to evaluate the semiconducting properties of the passive film. All electrochemical experiments were repeated three times to ensure reproducibility of the results.
2.4. XPS Surface Analysis
The bonding structure and thickness of the passive film were analyzed using X-ray photoelectron spectroscopy (XPS; K-Alpha+, Thermo Fisher Scientific, Waltham, MA, USA) at the Converging Materials Core Facility of Dong-Eui University using a micro-focused monochromated Al-Kα X-ray source (hν = 1486.6 eV). The XPS wide scan was conducted using a constant analyzer pass energy of 200 eV with an energy step size of 1.0 eV, while the corresponding values for XPS narrow scan were 50 eV and 0.1 eV. The binding energies of the Cr 2p3/2, Fe 2p3/2, and N 1s spectra were calibrated based on the C core level (284.6 eV). After Shirley background subtraction, the Cr 2p3/2, Fe 2p3/2, O 1s, and N 1s spectra were deconvoluted.
2.5. Immersion Test
For the immersion test, NASS and 304 SS samples with dimensions of 20 mm × 20 mm were exposed to an accelerated corrosive solution for up to 84 h. After immersion, the specimens were washed with ethanol and ultrasonically cleaned in a distilled water bath to analyze their surfaces. To compare the morphology of the pitting corrosion stages (initiation–growth–deepening), pitting corrosion was determined visually according to ASTM G 46–21 [18], and then the number of pits and the total pit area were calculated using the Image J® software program version 1.54. The maximum pitting depth was measured using high-resolution 3D optical microscopy (3D-OM; VHX–7000, KEYENCE, Osaka, Japan) at a magnification of 100×.
3. Results
3.1. Microstructures
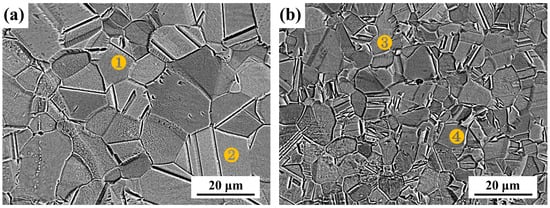
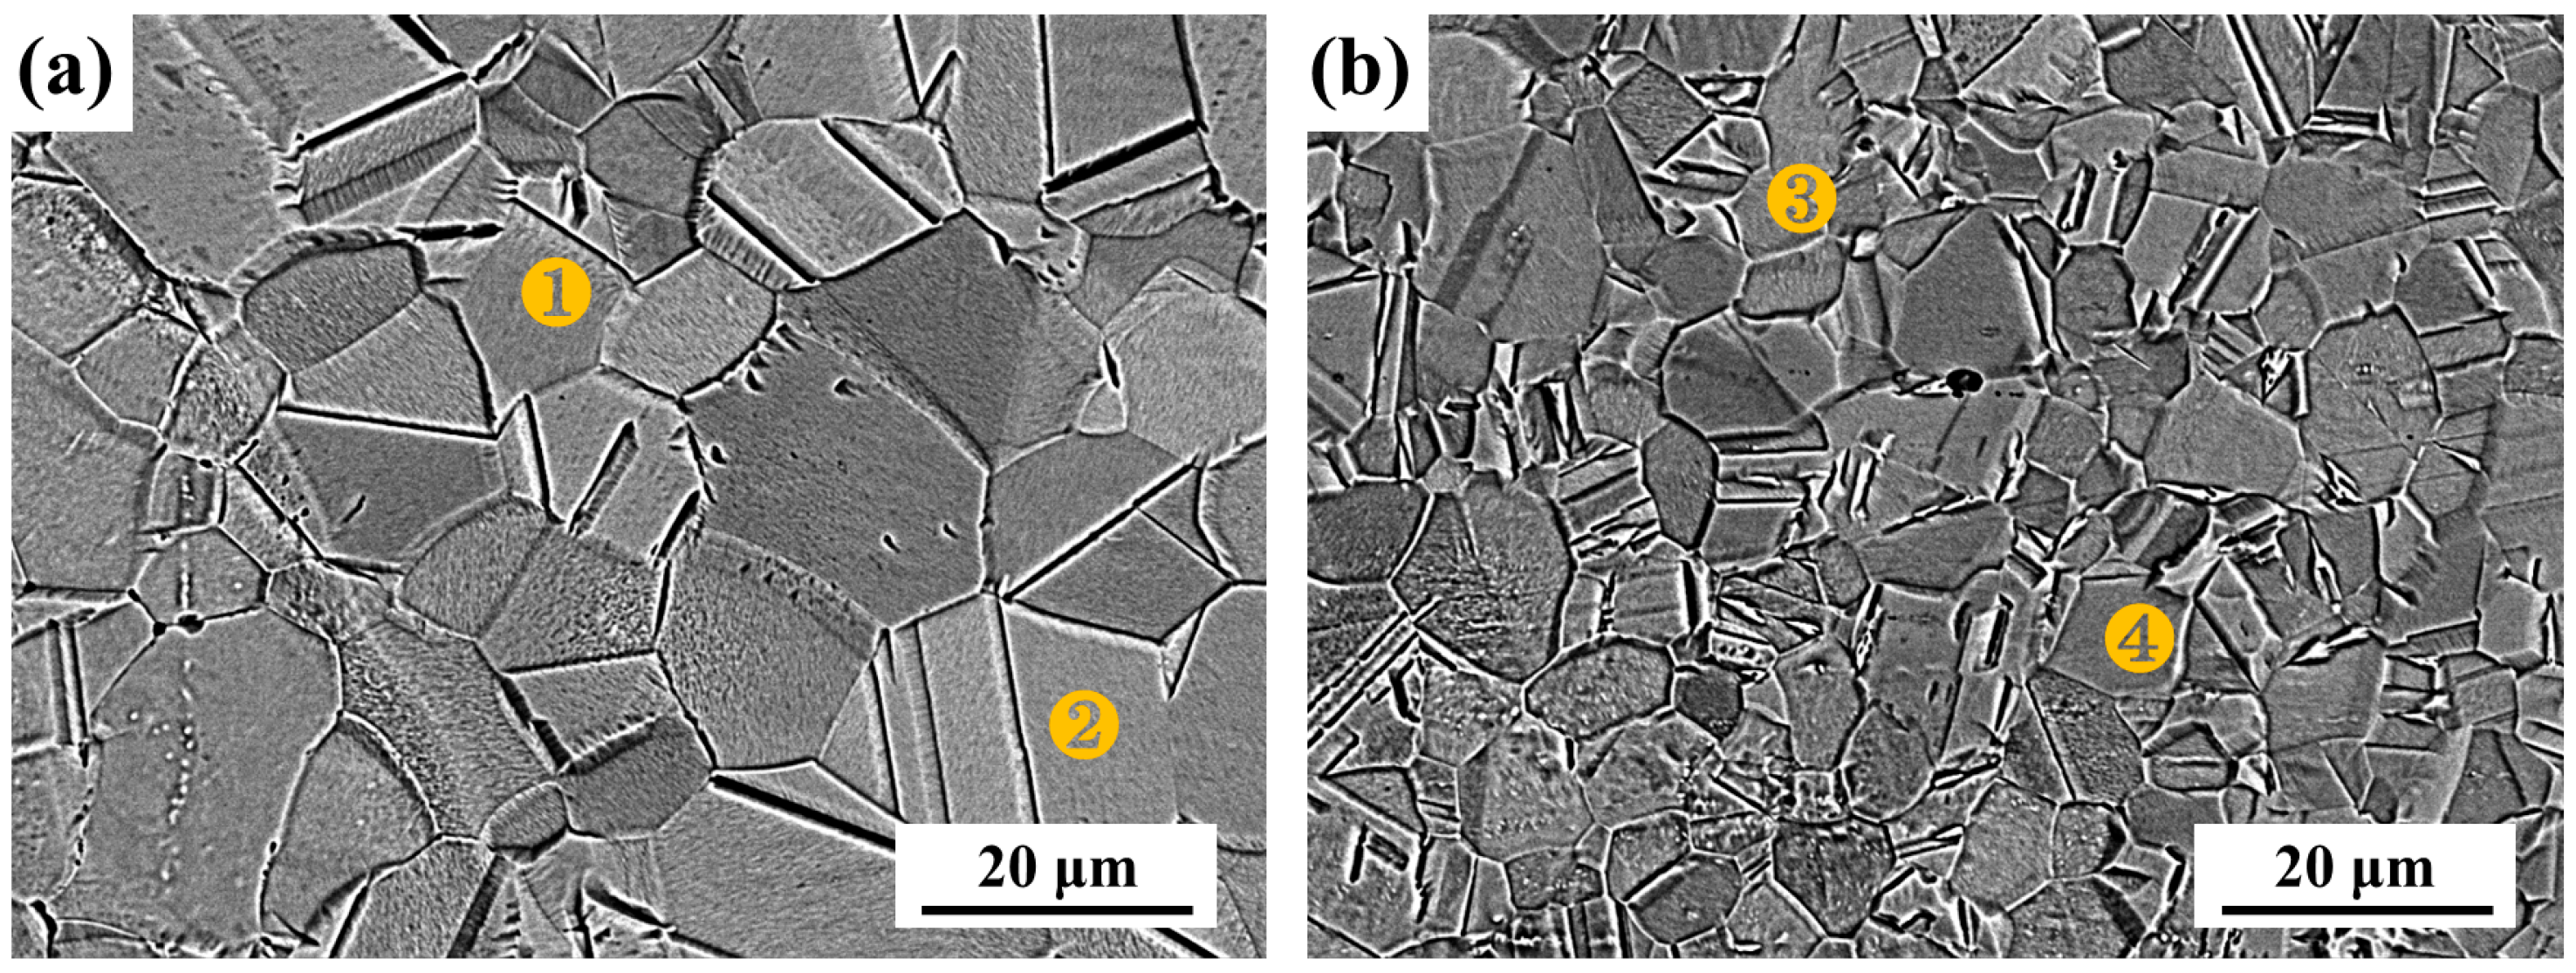
The metallographic structures of NASS and 304 SS are shown in the SEM images in Figure 1. EDS analysis was performed to confirm that the alloying elements were dissolved in the steel; the results are presented in Table 2. The microstructures of NASS and 304 SS are composed of equiaxed grains and annealing twins; no precipitates or intermetallic compounds are apparent. As shown in Table 2, all the alloying elements were distributed evenly in the matrix. The Mn content of the NASS is 5.16 and 5.09 wt% at points 1 and 2, respectively, while that of 304 SS is 0.80 and 0.89 wt% at points 3 and 4, respectively. The Ni content of NASS is 2.55 and 2.70 wt% at points 1 and 2, which is lower than that of 304 SS at points 3 (6.29 wt%) and 4 (6.06 wt%). The relatively small amount of N incorporated into both alloys was not measured using EDS. The EDS analysis confirmed that NASS was a high-Mn, low-Ni alloy.
Figure 1.
SEM images of (a) NASS and (b) 304 SS surface.
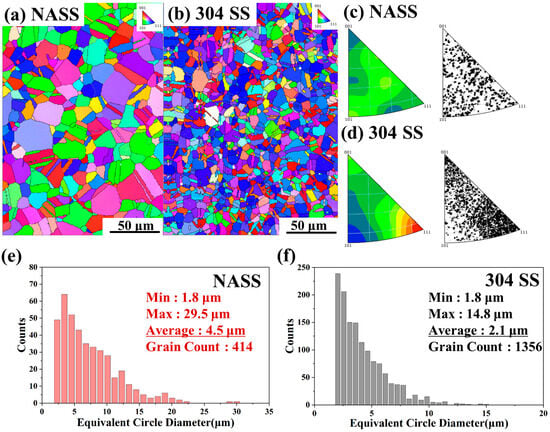
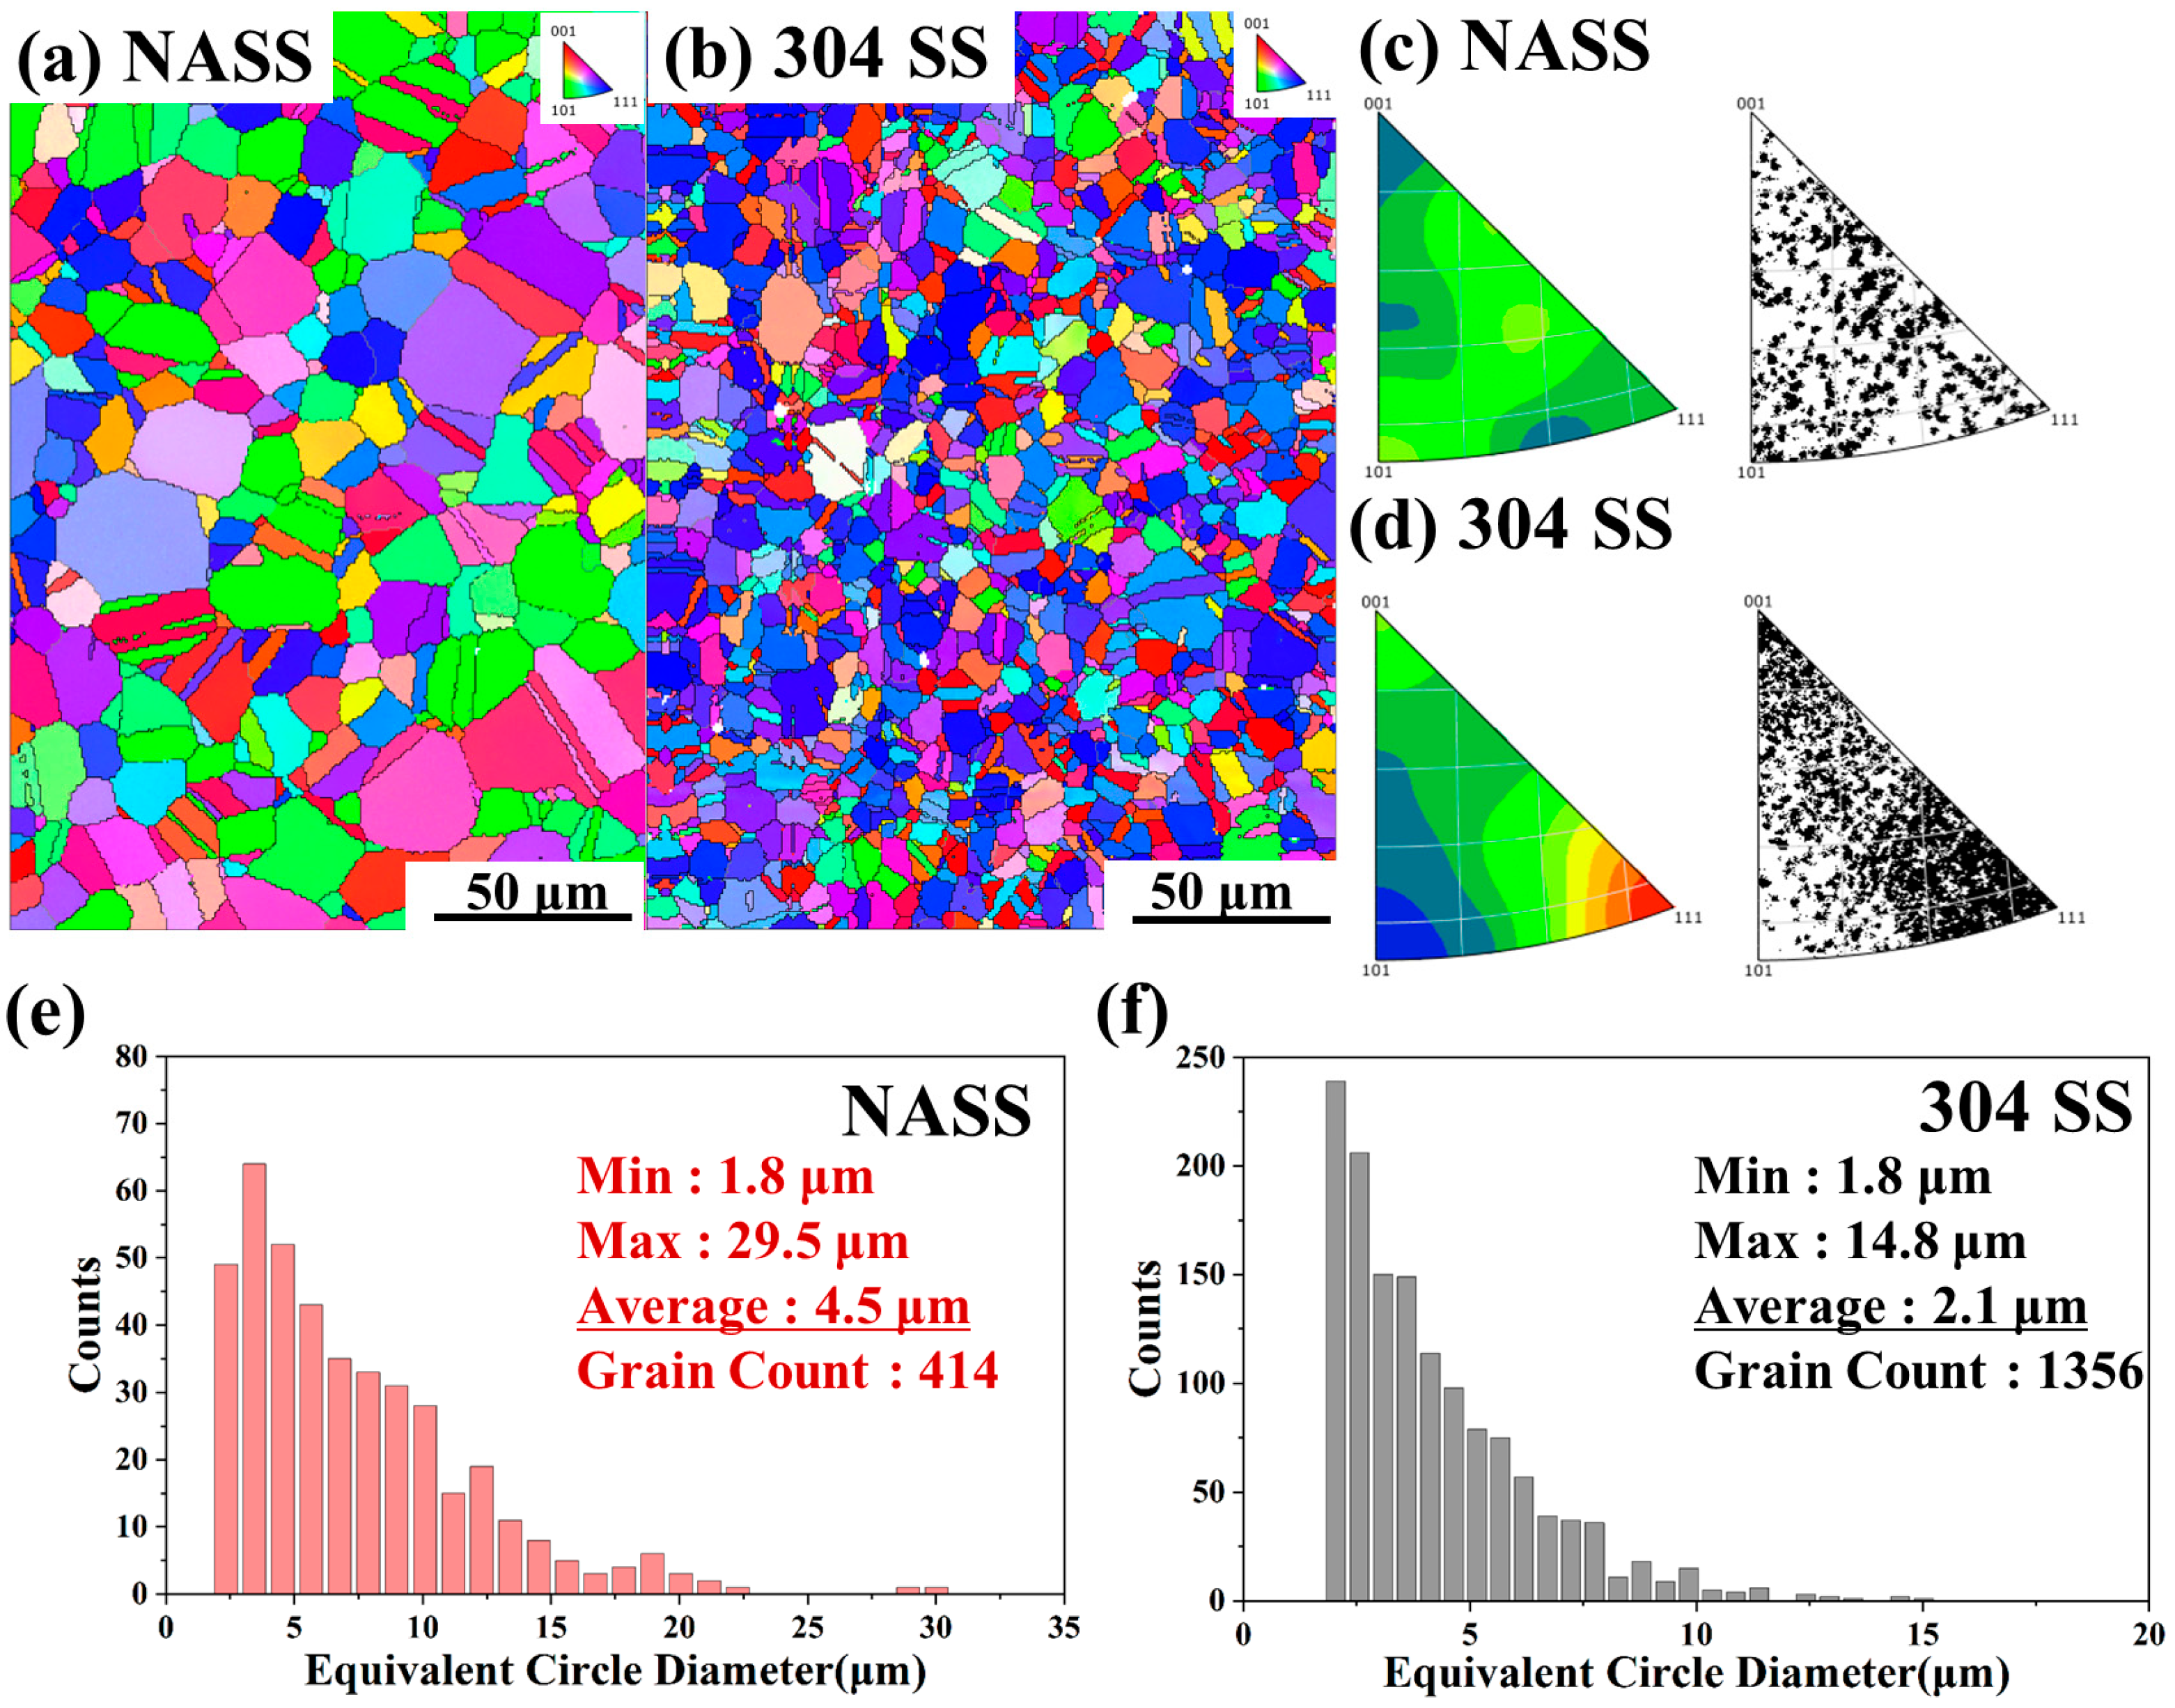
Figure 2 shows the grain orientation and size measured using EBSD. Similar to the SEM results, both alloys exhibited face-centered cubic (fcc) structures with equiaxed grains and annealing twins. The inverse pole figure (IPF) images of NASS (Figure 2a,c) show a random texture, while those of 304 SS (Figure 2b,d) reveal a strong texture, which is distributed in the <001> and <111> orientations. Reportedly, the (111) planes are less prone to adsorbing passivating species that protect the alloy from corrosion; therefore, they tend to exhibit high corrosion rates [19]. In Figure 2e, the NASS exhibits a grain size of up to 29.5 μm and an average of 4.5 μm. Figure 2f shows that the grain size of 304 SS reached a maximum of 14.8 μm, with an average size of 2.1 μm. Although 304 SS has a finer microstructure than NASS, the influence of the micron grain size on the corrosion resistance of stainless steels has not been clearly established [20,21].
Figure 2.
Microstructures of NASS and 304 SS; (a,b) IFP mapping image; (c,d) IFP heat map; (e,f) grain size map.
Table 2.
Relative proportions of the elements in the phases indicated by the SEM images in Figure 3, as measured using EDS (wt%): (a) NASS and (b) 304 SS.
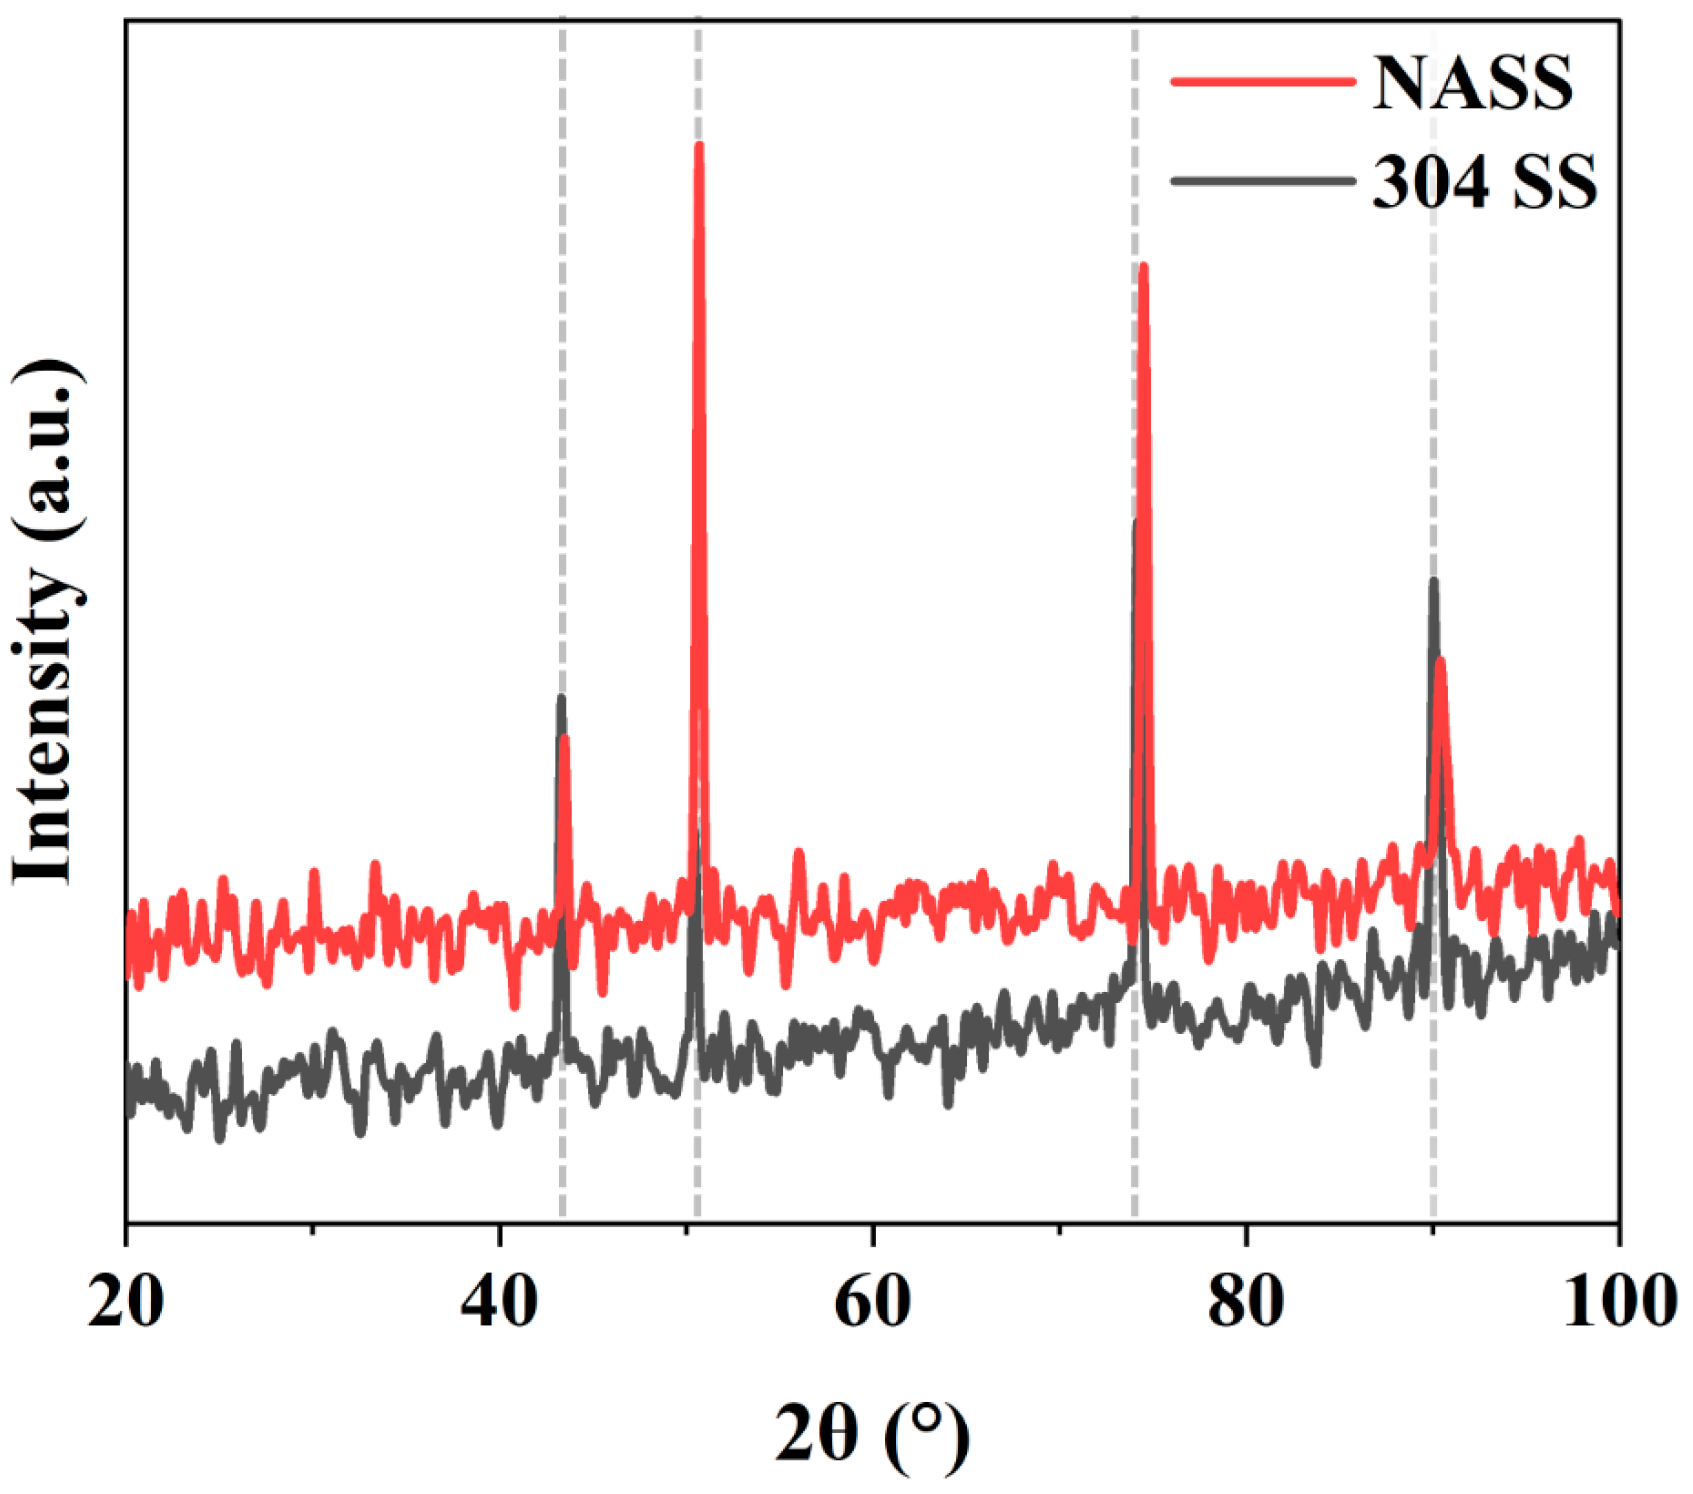
XRD was used to analyze the crystal and lattice structures. As shown in Figure 3, the XRD patterns feature five main diffraction peaks. NASS and 304 SS possessed an fcc austenitic phase (γ). The diffraction peaks of NASS were shifted to the right relative to those of 304 SS; this indicates the presence of interstitial N in the Fe lattice structure of NASS.
Figure 3.
XRD patterns of NASS and 304 SS.
3.2. Corrosion Resistance in Various pH and Chloride Environments
3.2.1. Cyclic Polarization Test
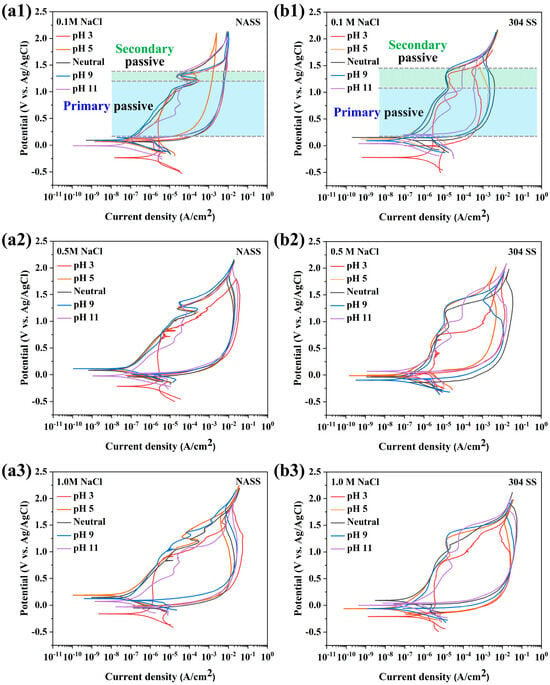
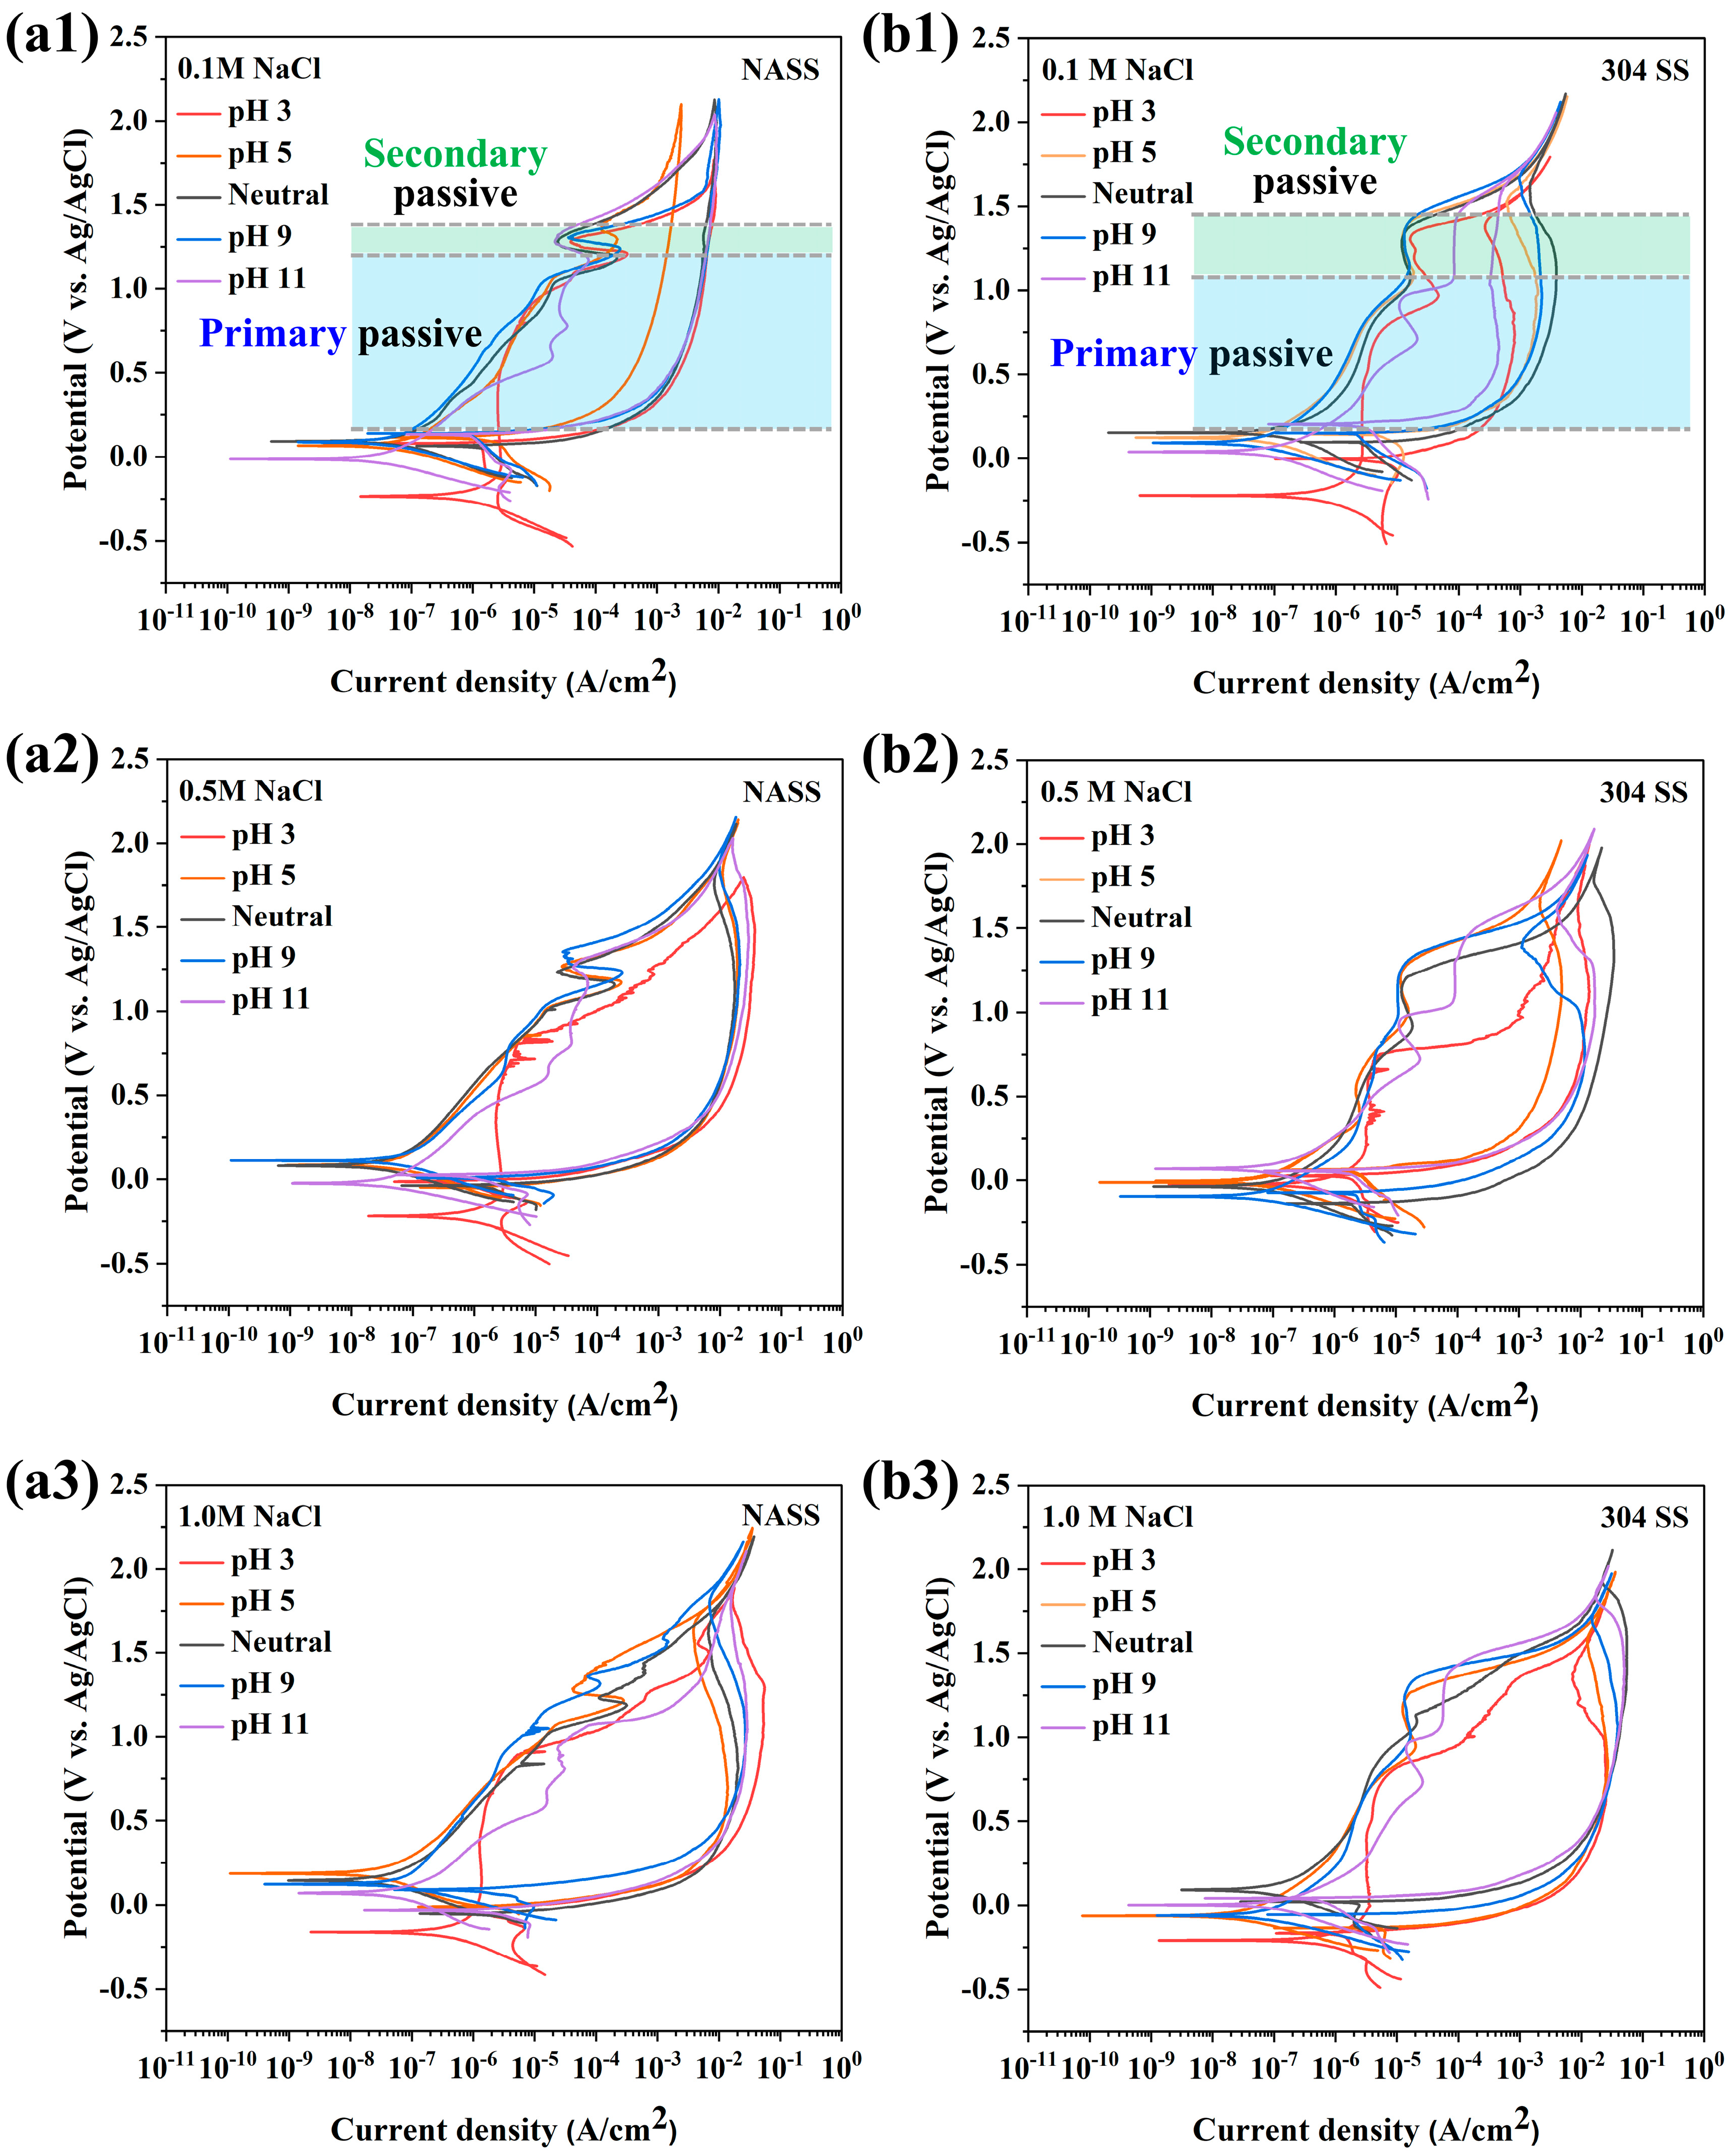
The corrosion resistance properties of NASS and 304 SS in various pH and Cl− environments were analyzed in cyclic polarization tests. The cyclic polarization curves are shown in Figure 4, and the polarization parameters, corrosion current density (icorr), corrosion potential (Ecorr), repassivation potential (Erep), and pitting potential (Epit) are listed in Table 3. A comparison of the shapes of the NASS and 304 SS polarization curves confirmed that, in most environments, the alloys exhibited similar electrochemical processes in the primary and secondary passivation regions. The primary passive region of NASS appears between 0.2 and 1.2 V, and then the anode current density increases upon reaching the transpassivation region. In general, stainless steel contains Cr and Ni as alloying elements, and Cr3+ oxidizes to Cr6+ in the transpassivation potential range [22,23]. Owing to the oxidative dissolution of Cr, a secondary passive region with enriched hydroxide and Fe was formed between 1.25 and 1.5 V. As the current density rapidly increased above ~1.5 V, oxygen evolution began. In the case of 304 SS, the primary passive region was observed within the potential range of 0.2–1.0 V. Following transpassivation, the secondary passive region of 304 SS was detected between 1.0 and 1.5 V. Therefore, NASS exhibits a wider primary passive region and a narrower secondary passive region compared with 304 SS.
Figure 4.
Cyclic polarization curves of NASS and 304 SS in pH-controlled NaCl solutions of varying concentrations; (a1–a3) NASS in 0.1, 0.5 and 1.0 M NaCl solutions; (b1–b3) 304 SS in 0.1, 0.5 and 1.0 M NaCl solutions.
Table 3.
Electrochemical parameters obtained from the cyclic polarization curves in Figure 4.
The effects of pH and Cl− concentration on the polarization behavior were systematically examined. Higher Cl− concentration increased the hysteresis loop area. At 1.0 M NaCl, both alloys showed high icorr across all pH values, indicating faster corrosion rates. These results suggest that Cl− promotes localized damage in alloys [24]. Therefore, lower Cl− concentrations improve the stability of the passive film. In addition, the corrosion rate tends to increase as the solution becomes more acidic or alkaline. In particular, both alloys tended to exhibit inferior corrosion resistance at pH 3.
The icorr value of 304 SS was higher than that of NASS in all environments, indicating that NASS had a more protective passive film against Cl− than 304 SS. Furthermore, comparing the current fluctuations in the cyclic polarization curves of the two alloys, transient spikes occurred for NASS. These spikes, indicating metastable pitting, signify repassivation [23,25]. In addition, NASS exhibited more positive Epit values than 304 SS in the pH range of 3–9, indicating better pitting corrosion resistance. However, in strongly basic aqueous solutions (pH 11), 304 SS showed a more positive Epit than NASS, confirming that 304 SS possesses a wider plateau of constant current densities. NASS demonstrated high corrosion resistance in acidic and neutral environments containing Cl− ions, whereas 304 SS displayed high corrosion resistance in strongly basic solutions.
3.2.2. Potentiostatic Polarization Test
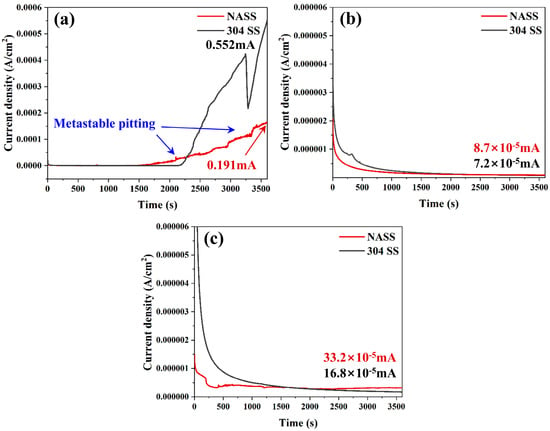
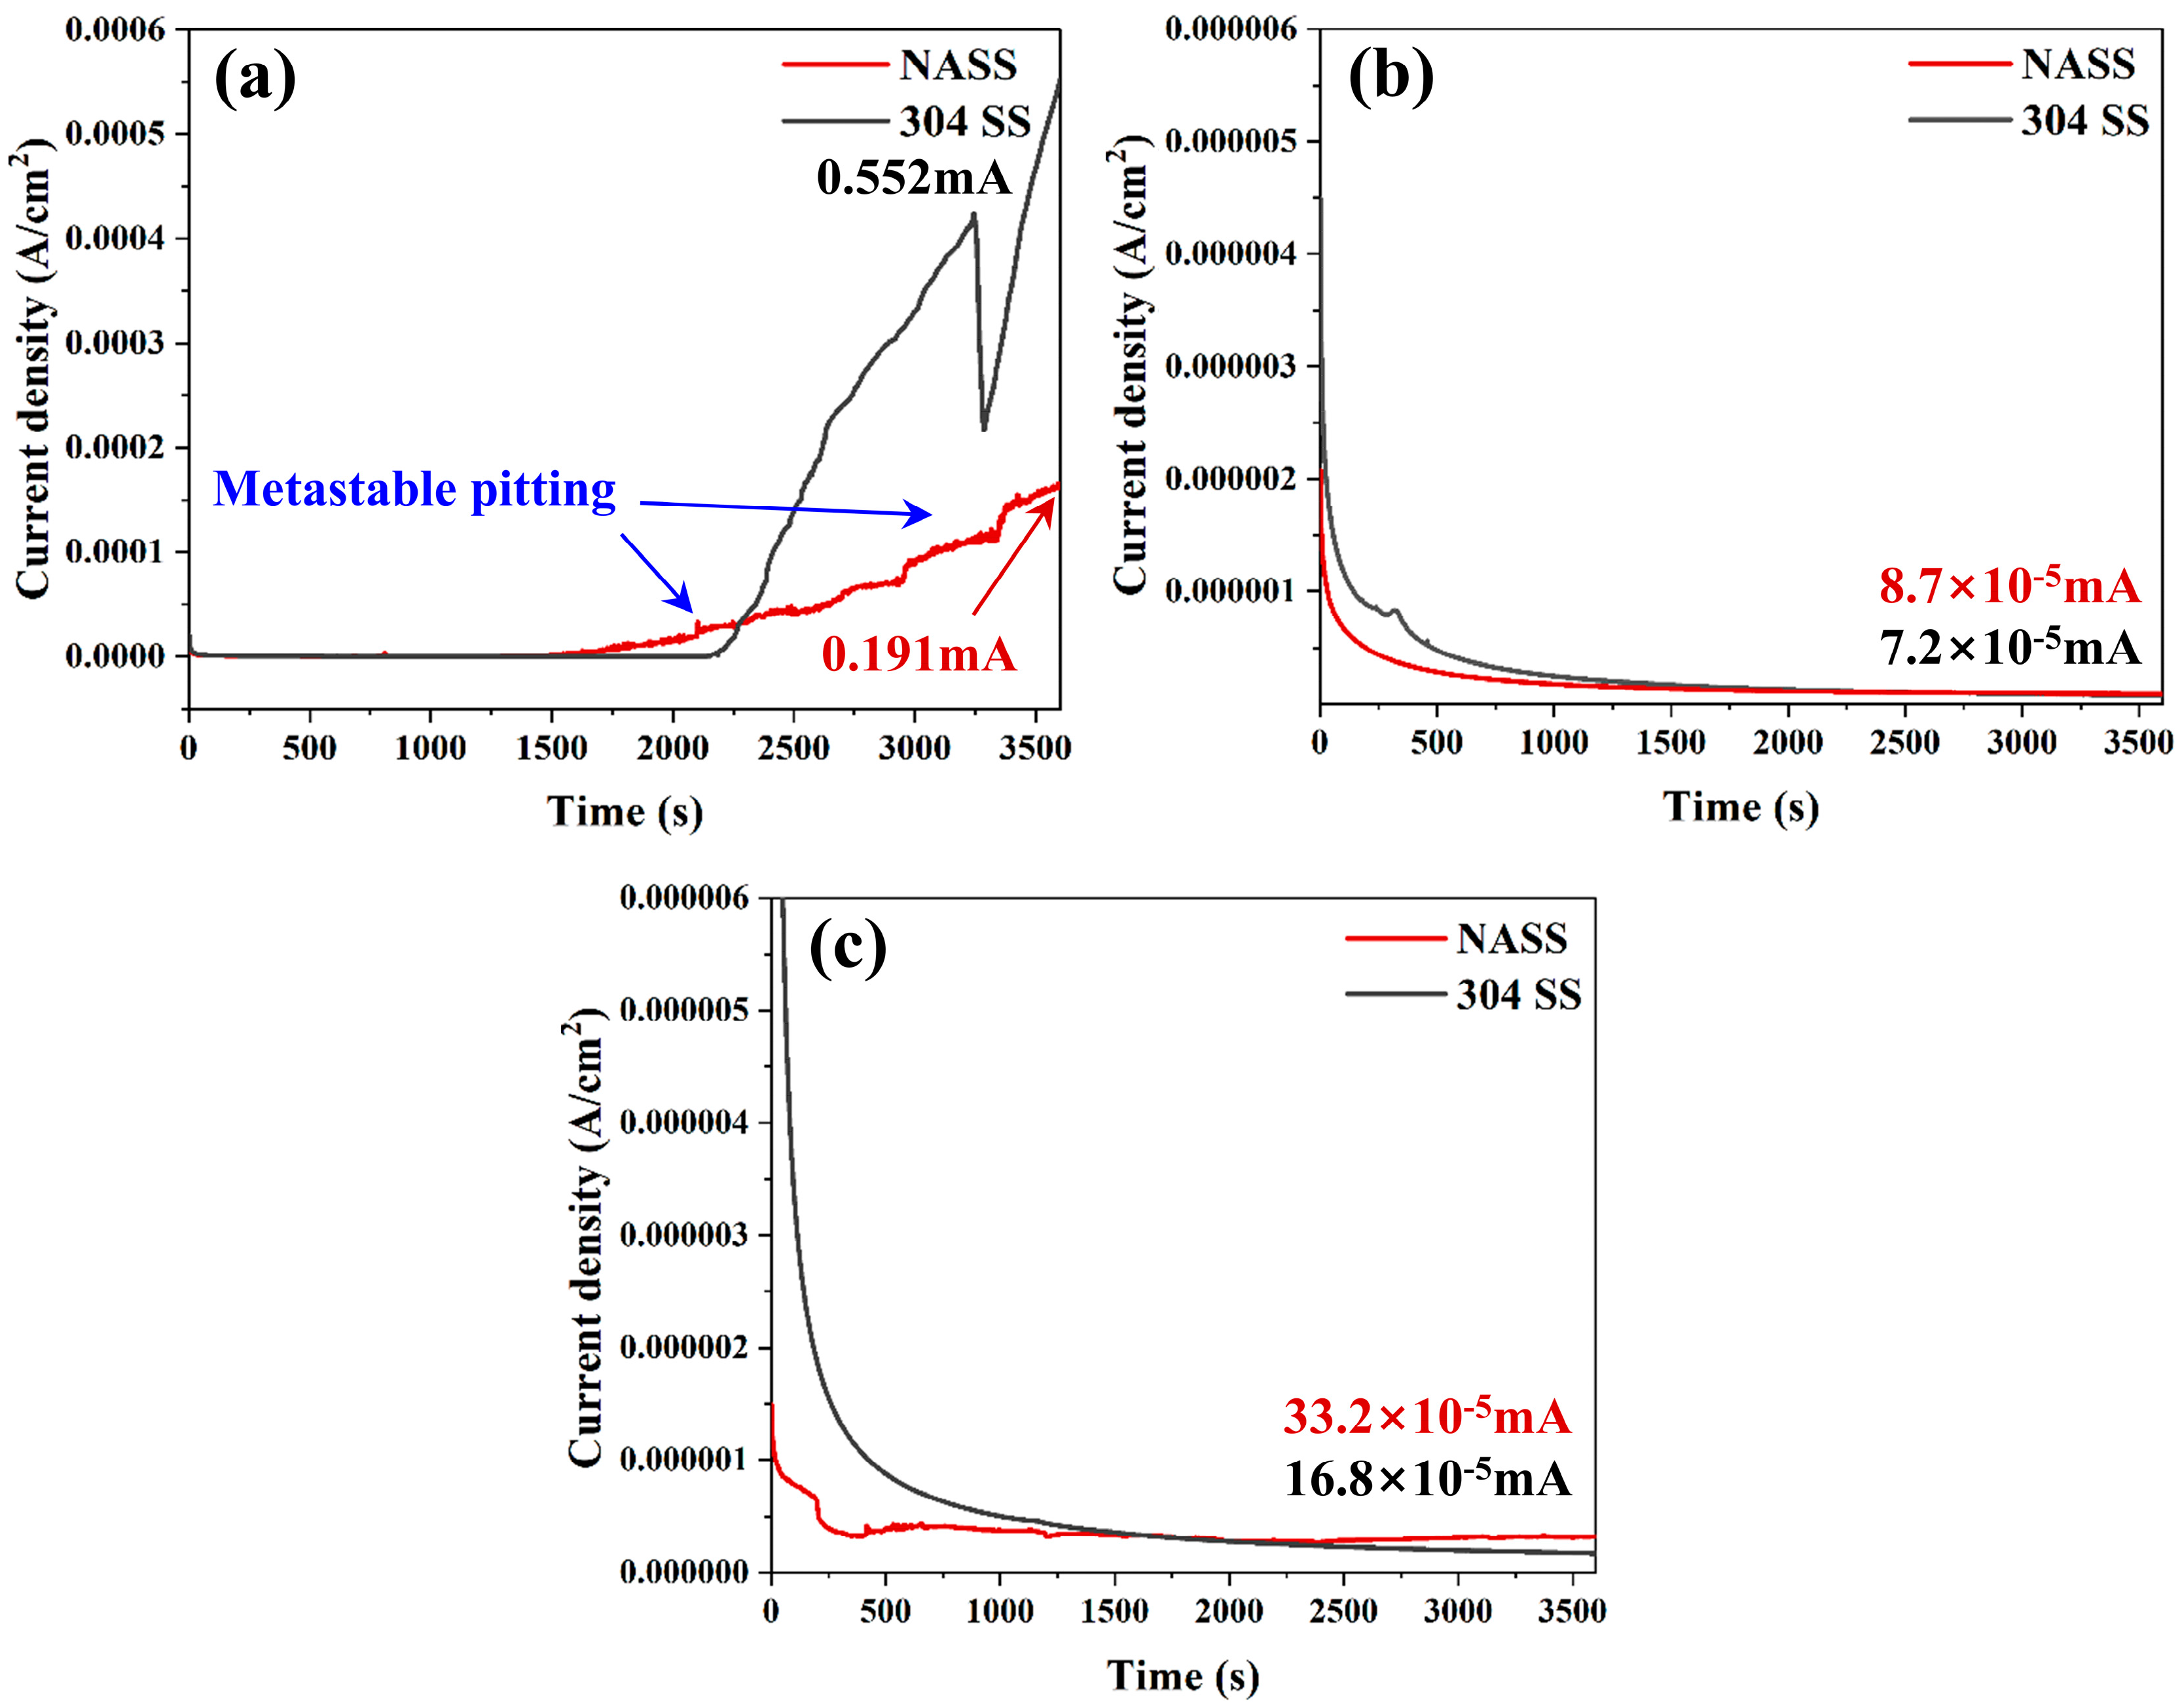
Figure 5 presents the results of the potentiostatic polarization tests conducted to evaluate the stability of the passive film under representative conditions in 1.0 M NaCl solutions at pH 3, 7 (neutral), and 11. NASS was the first to reach a steady stable state in the dynamic process, in which the formation of a passive film and metal dissolution occur simultaneously before the current density stabilizes. At pH 3, the formation time of the stable pitting of NASS was 1539 s, while that of 304 SS was 2094 s, as shown in Figure 5a. However, after pitting initiation, NASS retards pit growth by promoting repassivation, which can be confirmed by the metastable pitting behavior. In addition, the current densities of NASS and 304 SS measured at 3600 s were 0.191 and 0.552 mA, respectively, confirming that the corrosion rate of NASS was slow. Figure 5b shows the potentiostatic polarization curves in a neutral aqueous solution; no initiation of pitting was observed in either NASS or 304 SS, and similar current densities were observed in the passivation state. In a basic aqueous solution, as shown in Figure 5c, the passive films of both alloys were stable, but the current density was higher than that in a neutral aqueous environment. The current density of the NASS was lower than that of 304 SS until ~1650 s, after which the current density of 304 SS was lower, indicating a slow corrosion rate of 304 SS in the basic environment. These results support the cyclic polarization test, which revealed that 304 SS tended to have excellent corrosion resistance in a basic environment. Conversely, the fact that pitting initiates at pH 3 indicates that this environment is more corrosive than the neutral and basic environments. Moreover, NASS has excellent repassivation ability and can delay the growth and deepening of pits, even in harsh environments.
Figure 5.
Potentiostatic polarization curves of NASS and 304 SS in 1.0 M NaCl solution at pH (a) 3, (b) 7 (neutral), and (c) 11.
3.2.3. Electrochemical Impedance Spectroscopy
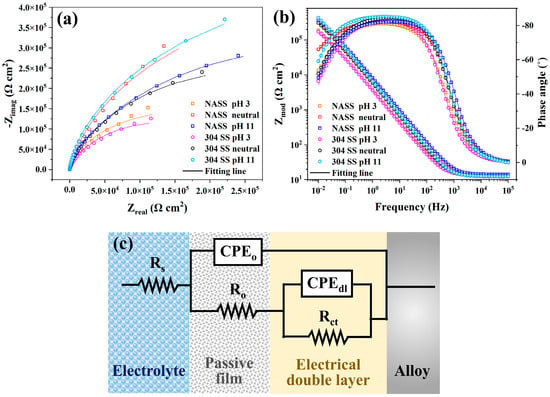
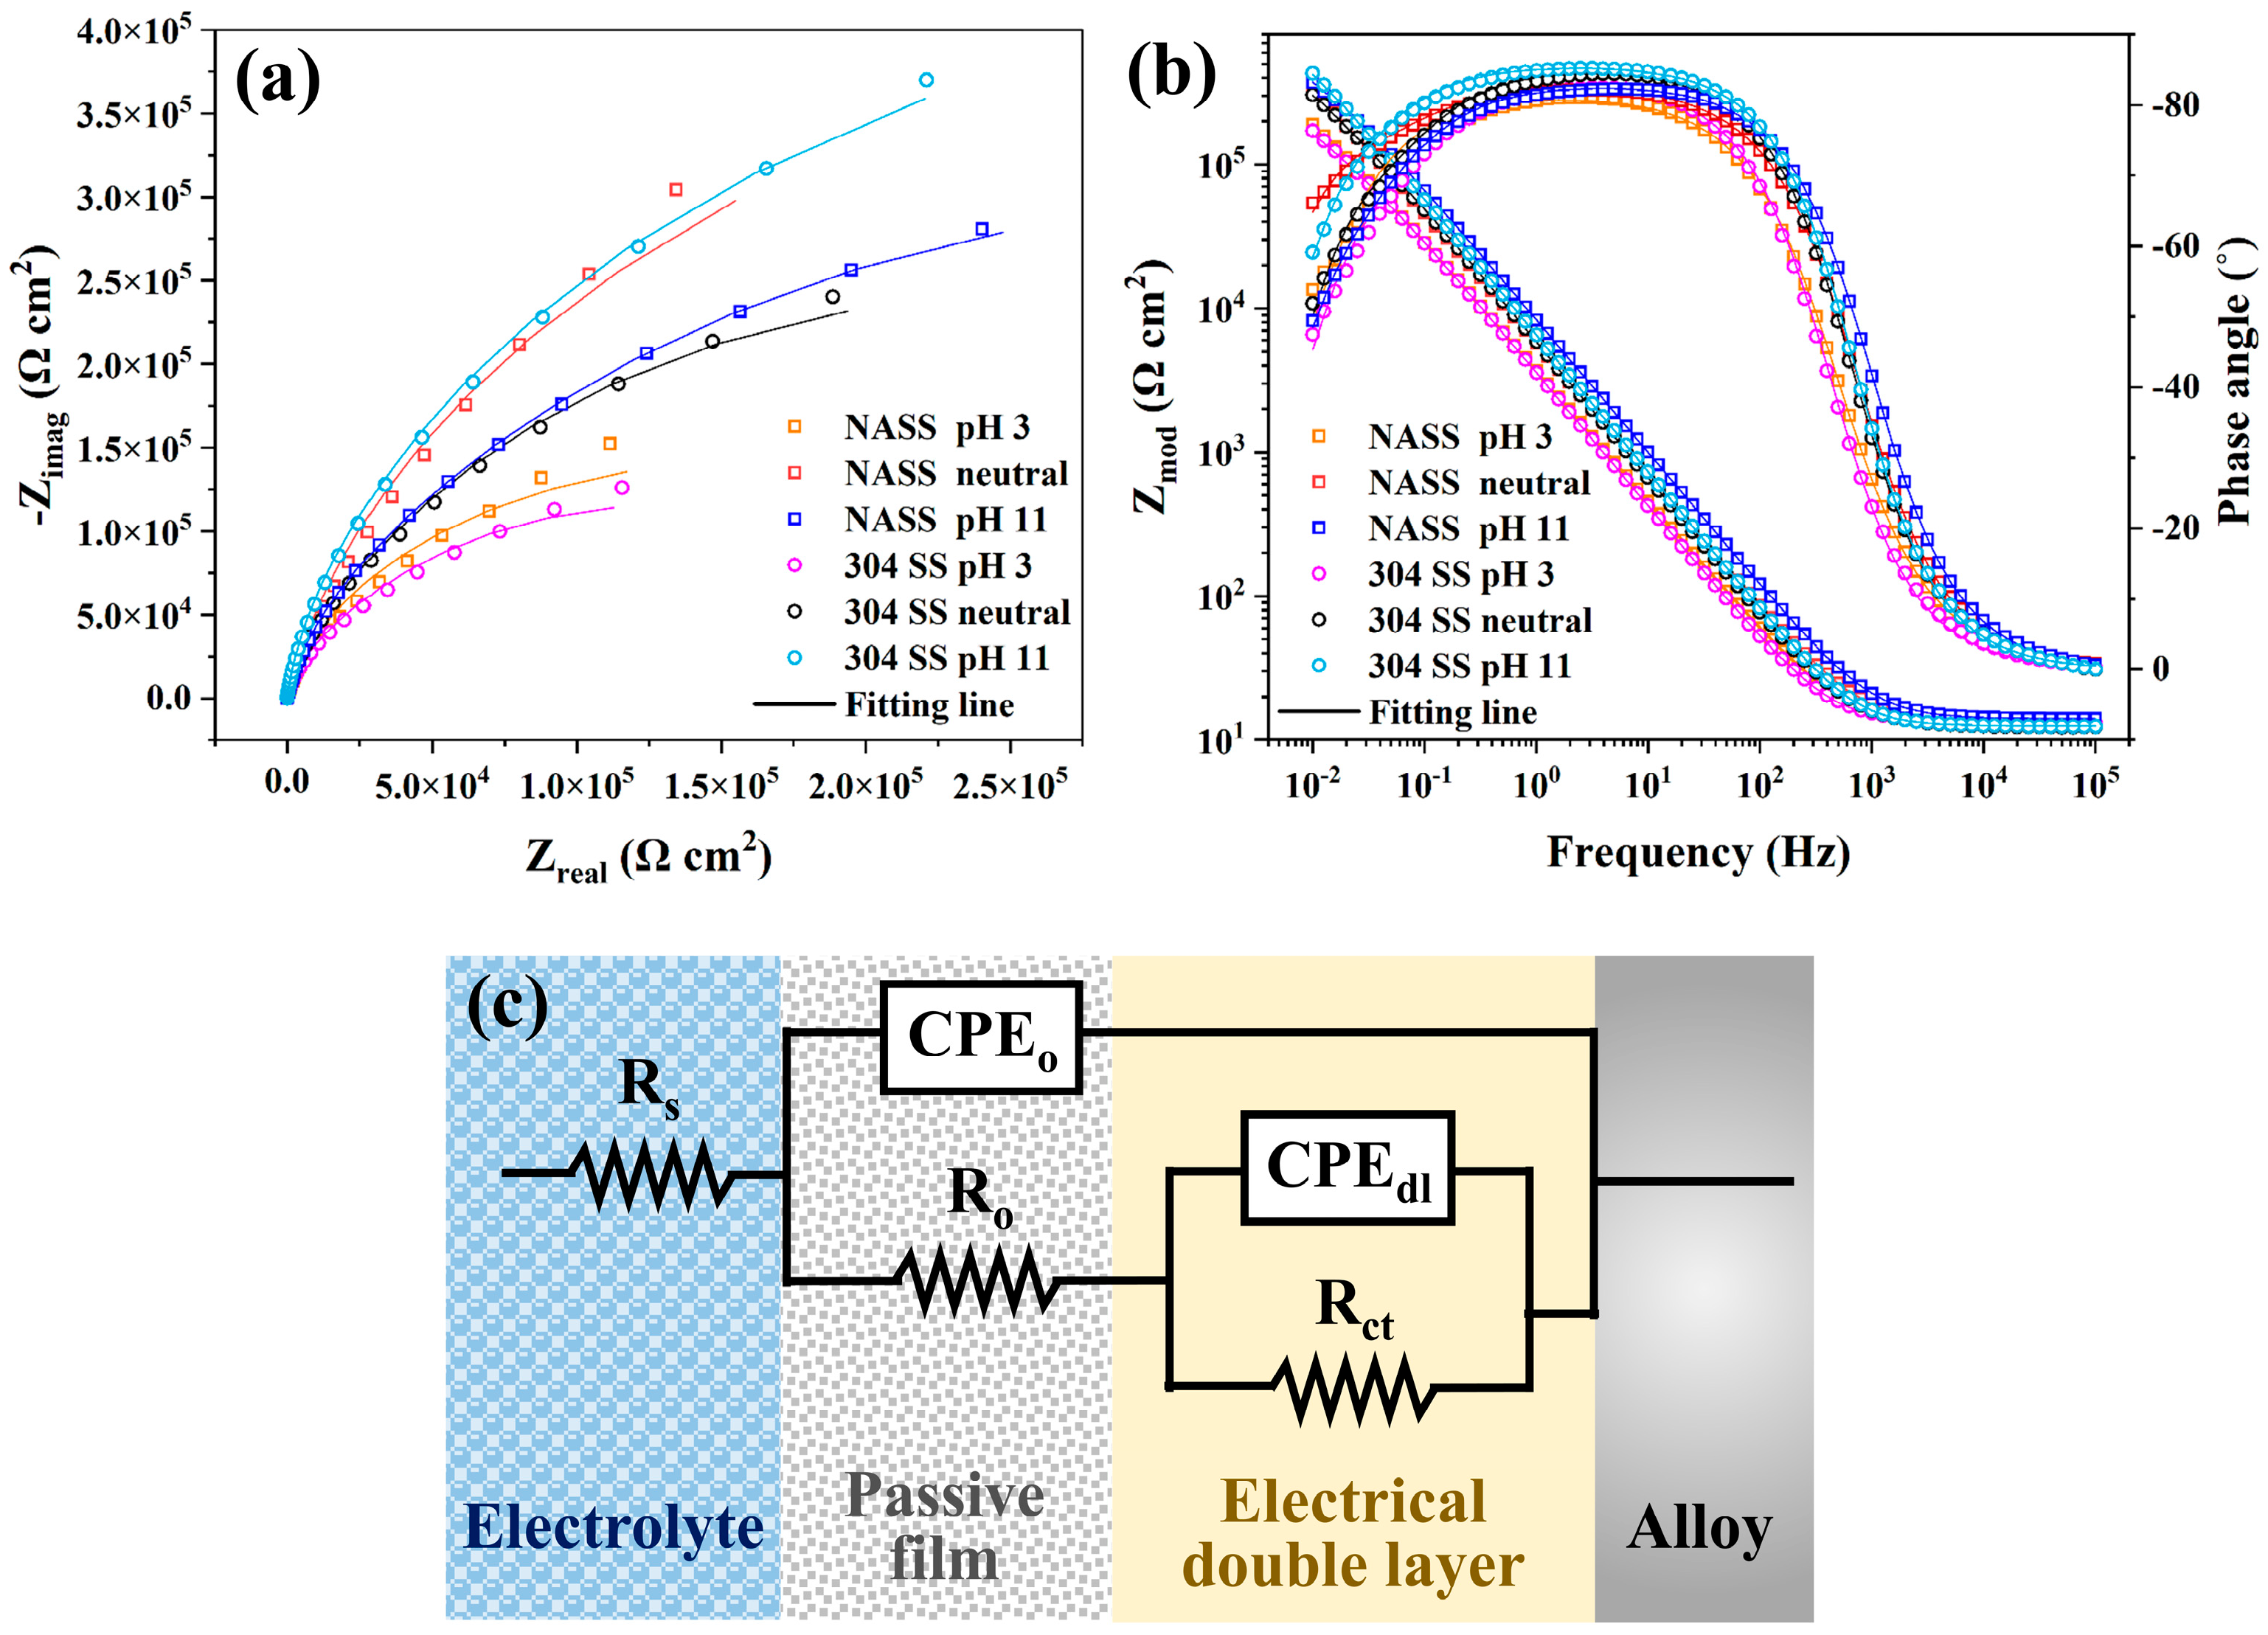
To analyze the electrochemical interaction between the material and electrolytes in a corrosive environment, the impedance was measured to compare the resistance of the structure. Figure 6a,b depict the Nyquist and Bode plots measured in environments containing 1.0 M NaCl at pH 3, 7 (neutral), and 11. The experimental data points were fitted using curve-fitting algorithms and are represented by solid lines. The Nyquist plots evaluate the corrosion resistance by reflecting the diameters of the capacitive semicircles, with larger semicircle diameters indicating enhanced corrosion resistance. The Bode impedance spectrum exhibits a nearly linear slope (close to −1) in the frequency range of 10−2 to 105 Hz. Within the range of 10−2–10−1 Hz, the |Z| values correspond to the corrosion resistance. In the Bode phase-angle plots, the proximity to a phase angle of 90°, resembling an ideal capacitor, signifies increased charge-transfer resistance. Figure 6c illustrates the electrochemical equivalent circuit model used to analyze the corrosion properties of the NASS and 304 SS surfaces; the model parameters are summarized in Table 4. In the electrochemical equivalent circuit model, the capacitances of the passive film and electric double layer are represented using a constant phase element (CPE), denoted as CPEo and CPEdl, respectively. The impedance (ZCPE) of the CPE is defined as
where ω is the angular frequency (in rad/s), i2 = −1 is the imaginary number, and Q and n signify the fitting parameters of the CPE. In the EIS results obtained from the electrochemical equivalent circuit model, the value of Y0 (Z−1) represents the admittance, indicating the magnitude of the current applied to the CPE; Rs represents the solution resistance; Ro signifies the passive film resistance at the film–solution interface; and Rct denotes the charge-transfer resistance at the electrical double layer. The polarization resistance (Rp) is determined by the sum of Rs, Ro and Rct, and serves as a comprehensive indicator of the total resistance.
Figure 6.
EIS results of NASS and 304 SS in 1.0 M NaCl solution at pH 3, 7 (neutral), and 11. (a) Nyquist and (b) Bode plots; (c) the electrochemical equivalent circuit model used for fitting.
Table 4.
Equivalent circuit curve-fitting parameters for EIS results of NASS and 304 SS.
The EIS analysis revealed that in NaCl (1.0 M) solutions with pH values of 3, 7 (neutral), and 11, NASS exhibited a lower film admittance and higher resistance of the passive film compared with 304 SS. This indicates that the passive film of NASS behaves closer to an ideal capacitor, resulting in lower electrical conductivity. Accordingly, in acidic and neutral environments, NASS showed higher total resistance than 304 SS, demonstrating superior corrosion resistance. This suggests that a more protective barrier is formed on the surface, effectively restricting the access of aggressive species to the metal–electrolyte interface and thereby suppressing the corrosion process. Conversely, in alkaline environments, the higher Rct of 304 SS contributed to a greater total resistance, which is consistent with the trends observed in the cyclic polarization and potentiostatic polarization tests. The underlying differences in passive film characteristics responsible for these behaviors will be discussed in detail through passive film analysis.
3.3. Characterization of Passive Films
3.3.1. Mott–Schottky Analysis
Mott–Schottky analysis was conducted to elucidate the electronic structure of the passive films on stainless steel and examine their semiconductor properties. According to the Mott–Schottky theory, a space-charge layer forms at the interface between the electrode surface and electrolyte. The semiconductor properties of a passive film are influenced by the movement of charge carriers within the space-charge layer. The capacitance of the space-charge layer (C) varies with the applied potential (E) and follows the Mott–Schottky relationship, which can be expressed as
In this context, ε represents the dielectric constant of the semiconductor; ε0 is the permittivity of vacuum; ND and NA are the donor and acceptor densities, respectively; EFB denotes the flat band potential; and e is the elementary charge of an electron. The Boltzmann constant, κ, has a value of 1.38 × 10⁻²³ J∙K−1, and T is the absolute temperature in kelvin. Using the Mott–Schottky plot, the characteristics of the passive film on stainless steel can be evaluated: a positive slope indicates n-type semiconductor behavior, whereas a negative slope indicates p-type semiconductor behavior. The slope is determined using the following equation:
In Equation (4), denotes the slope of the linear region of the Mott–Schottky plot, which can be utilized to determine the values of NA and ND.
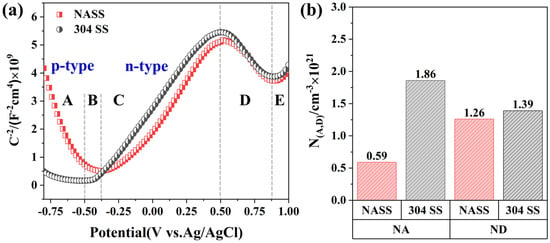
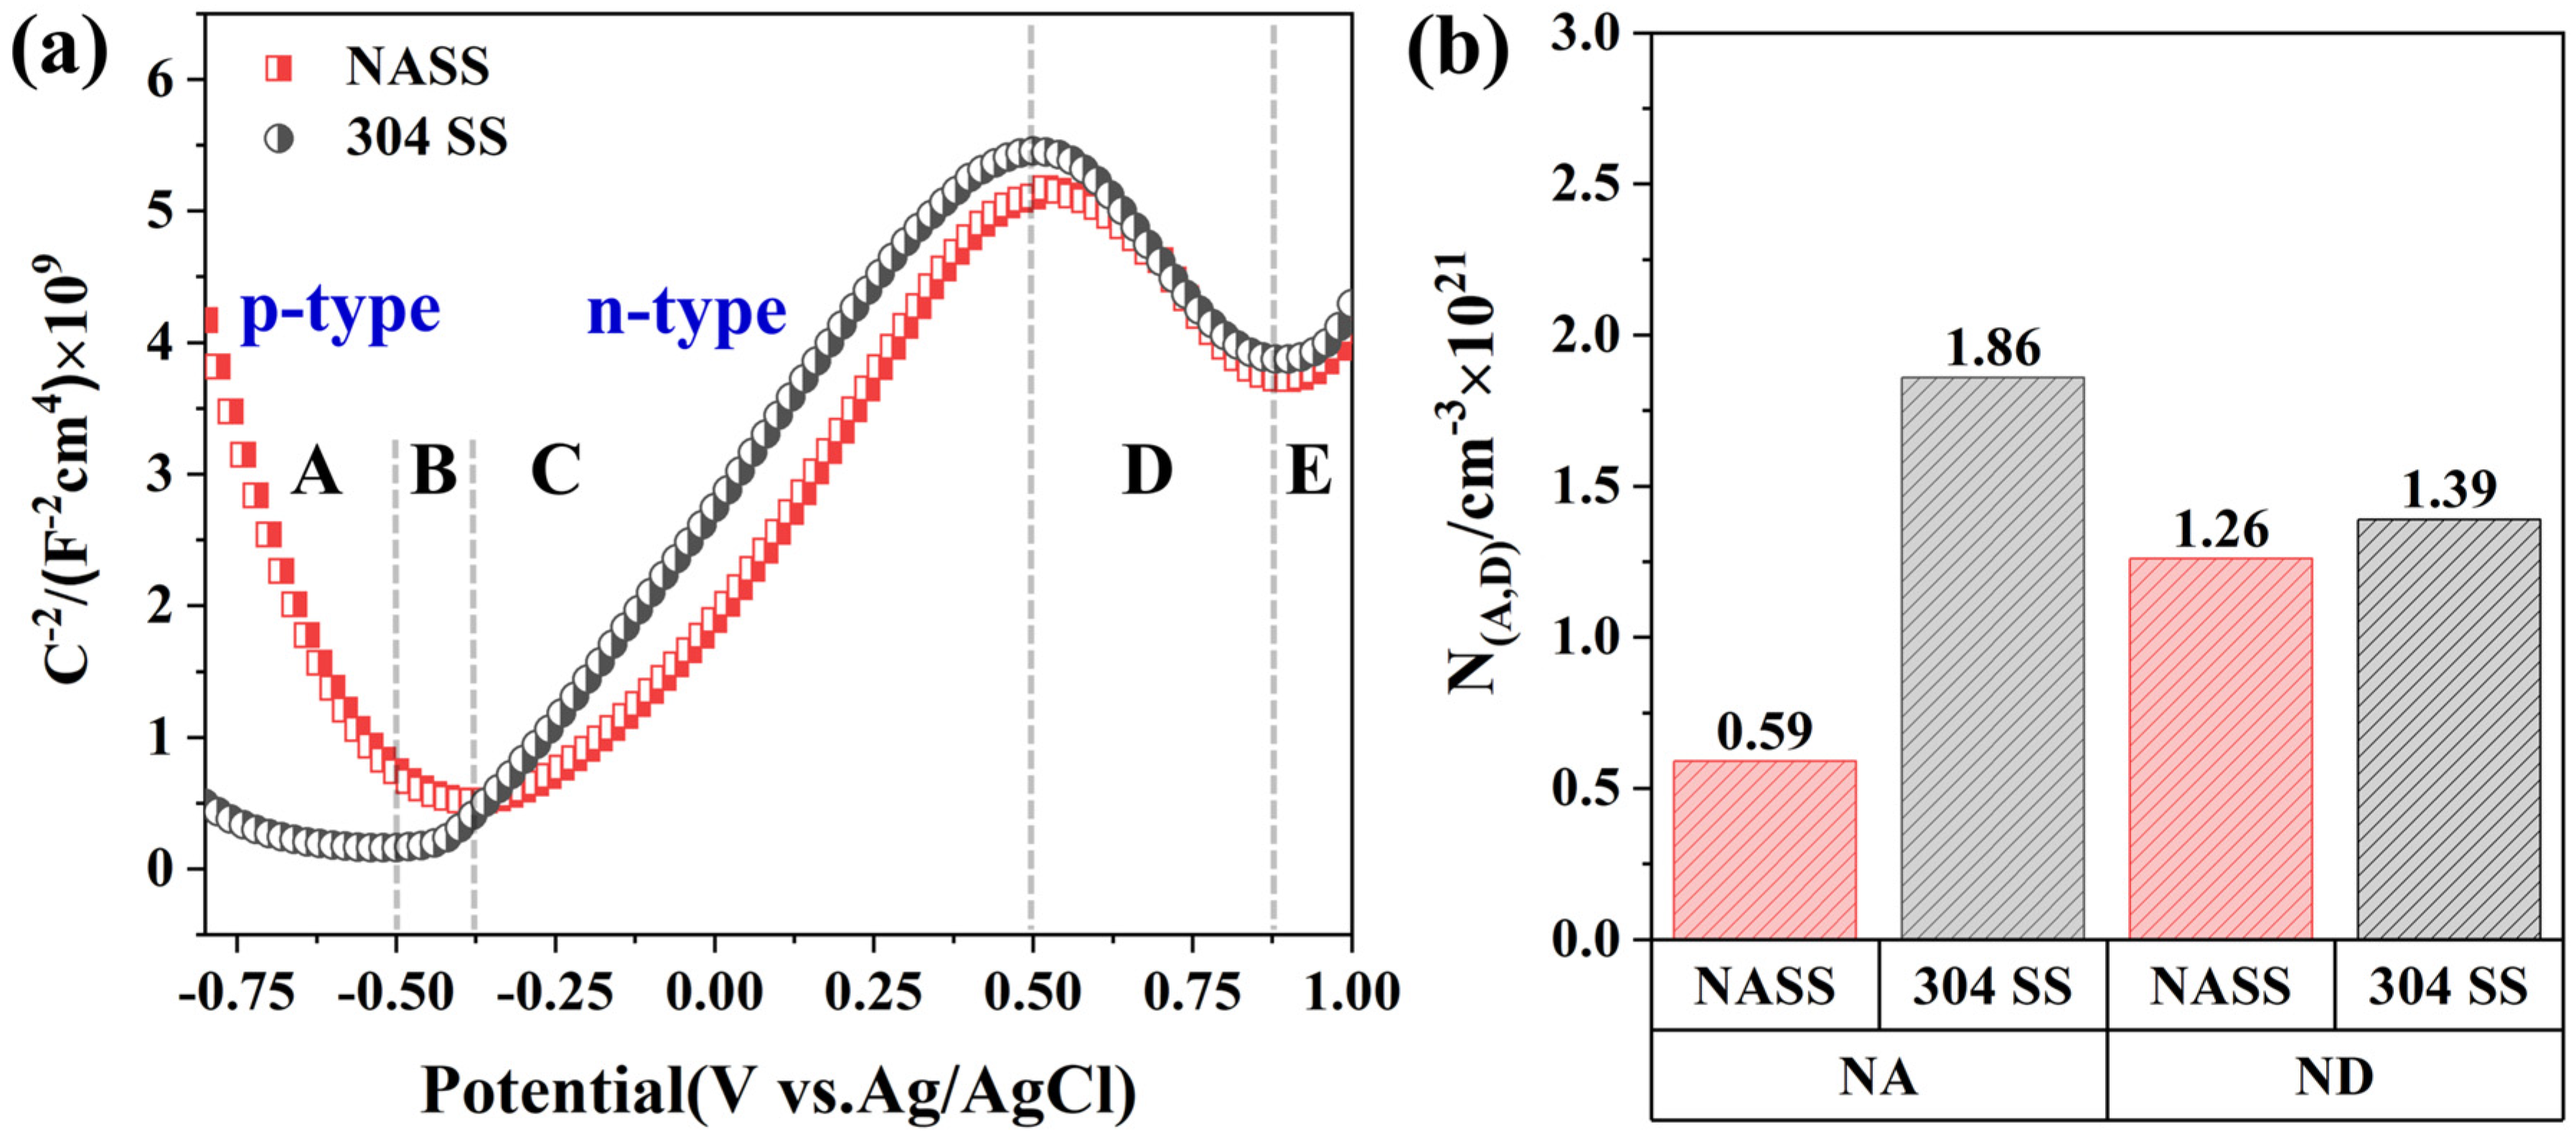
Figure 7a depicts the Mott–Schottky plots for the passive films on NASS and 304 SS, while Figure 7b compares the respective donor (NA) and acceptor (ND) densities. Region A (approximately −0.8 to −0.5 V) exhibits a negative slope, indicating that the passive film exhibits p-type semiconductor characteristics. Therefore, the impurities near the valence band create holes that act as ionic charge carriers owing to cation vacancies. Region C (approximately −0.3 to 0.5 V) shows a positive slope, indicating n-type semiconductor behavior where impurities near the conduction band supply electrons, also serving as ionic charge carriers through cation interstitials and oxygen vacancies. Region B (from approximately −0.5 to −0.3 V), located between A and C, signifies electrostatic equilibrium between the donor and acceptor densities at the flat band potential of the semiconductor and solution interface, determining the redox potential for charge transfer. Region D (approximately 0.5 to 0.85 V) displays a second negative slope, likely owing to the formation of an inversion layer caused by the high voltage, which is unrelated to the semiconductor characteristics. Region E (approximately 0.85 to 1.0 V) shows a second positive slope, indicating n-type semiconductor characteristics. The literature suggests that the stainless steel passive film comprises a double layer: inner Cr oxide (Cr2O3) and outer Fe oxide (Fe2O3, Fe3O4, or Fe hydroxide) layers [26]. In the space charge region, the p-type behavior is attributed to the Cr2O3 inner layer, where acceptor defects lead to the accumulation of holes. A higher NA reflects an increased density of these defects, which weakens the barrier properties of the passive film. In contrast, the n-type behavior is associated with the outer Fe oxide layer, where donor defects govern the formation of electron depletion. These space charge regions act as Schottky barriers, with the semiconducting response shifting between accumulation and depletion depending on the applied potential relative to the flat band potential. Above the flat band potential, the space-charge region is governed by the outer Fe oxide layer, resulting in n-type behavior. Below it, the inner Cr2O3 layer becomes dominant, giving rise to p-type behavior [27].
Figure 7.
Mott–Schottky analysis of NASS and 304 SS passive films in 1.0 M NaCl solution: (a) plots and (b) doping densities.
The NA and ND values of NASS and 304 SS were determined from the slope of the Mott–Schottky plot using Equation (4). The values of NA and ND were influenced by nonstoichiometric defects within the space-charge region or by the characteristics of the passive film. NASS exhibited lower NA and ND values than 304 SS, indicating lower cation and oxygen vacancy densities. A high donor density diminishes passive film stability and may accelerate electrochemical reactions, compromising the corrosion resistance. Specifically, ND serves as an indicator of the propensity of the passive film to attract Cl− ions, potentially initiating the formation of pitting corrosion nuclei. Consequently, NASS, with a donor density lower than that of 304 SS, maintains a relatively stable passive film, conferring excellent corrosion resistance.
3.3.2. XPS Analysis
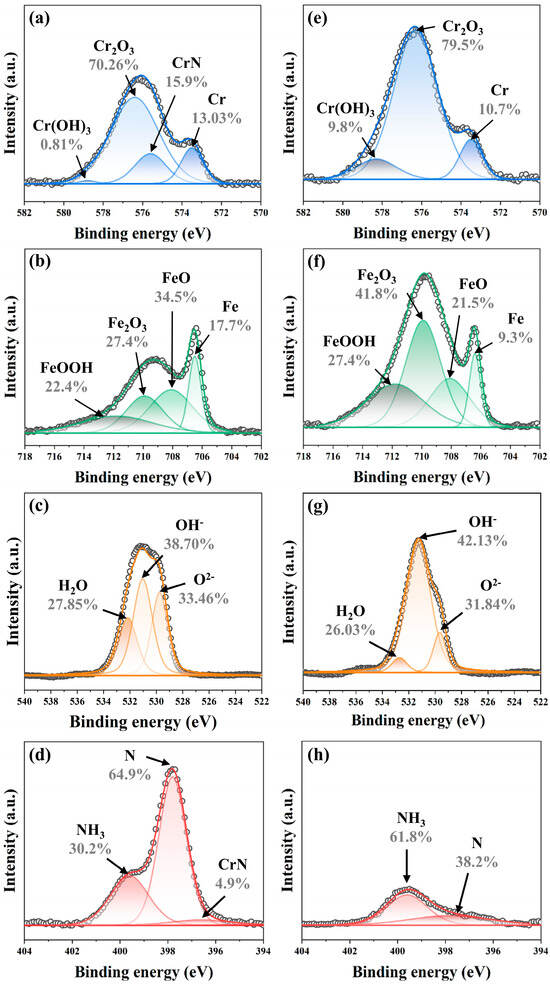
The composition of the primary and secondary passive films formed on the NASS and 304 SS surfaces after polarization at 0.3 VAg/AgCl for 1 h was analyzed using XPS to examine the role of N on passivity, and the corresponding XPS spectra of Cr 2p3/2, Fe 2p3/2, O 1s, and N 1s are shown in Figure 8. As shown in Figure 8a,e, the Cr 2p3/2 spectra of NASS and 304 SS exhibited three constituent peaks corresponding to metallic Cr (578.8 eV), Cr2O3 (576.4 eV), and Cr(OH)3 (573.5 eV), whereas an additional CrN (575.6 eV) peak was detected only in the NASS. Overall, the amount of Cr oxides was higher in the 304 SS than in the NASS, which may indicate the formation of a thicker Cr oxide layer on 304 SS. By contrast, the Crox/Crhy ratios, defined as the relative fractions of compact Cr2O3 to porous Cr(OH)3 in the Cr oxide film, were 86.74 and 8.11 for NASS and 304 SS, respectively. Accordingly, despite the thinner Cr oxide layer formed on NASS, its protective performance was superior owing to the higher proportion of Cr2O3 [28]. Simultaneously, N enrichment in the ASS was thought to promote N doping in the Cr oxide layer. When the N content exceeds the amount stabilized in other forms, N may substitute O to form Cr2O2N−. These species are expected to react with the O vacancies, leading to the formation of Cr2O3 and CrN [29]. The presence of CrN, accounting for ~15.9% of the Cr spectra in NASS, indicates a reduced defect density in the passive film, which ultimately contributes to its superior repassivation behavior.
Figure 8.
Detailed XPS spectra of (a) Cr 2p3/2, (b) Fe 2p3/2, (c) O 1s, and (d) N 1s of passive films formed on NASS and (e) Cr 2p3/2, (f) Fe 2p3/2, (g) O 1s, and (h) N 1s of passive films formed on 304 SS.
Figure 8b and Figure 8f show the Fe 2p3/2 spectra of NASS and 304 SS, respectively, revealing peaks of metallic Fe (706.5 eV), FeO (708.1 eV), Fe2O3 (709.9 eV), and FeOOH (711.8 eV). The presence of Fe3O4 in the passive film should be considered because its XPS spectrum can be divided into FeO and Fe2O3 peaks [30,31]. Similarly, although the content of Fe oxides was higher in 304 SS than in NASS, the Feox/Fehy ratio was 0.69 in NASS and 0.32 in 304 SS, indicating a relatively low fraction of porous Fe hydroxides in NASS.
Three peaks (Figure 8c,g), representing O2− (529.8 eV), OH− (531.5 eV), and H2O (533.8 eV), were used to analyze the O 1s spectra. As O2− and OH− are associated with Cr- and Fe-based oxides and hydroxides, the O2−/OH− ratio was used to identify the dominant constituents of the passive film. The intensities of O2− and OH− in NASS were comparable, resulting in a ratio of 38.70%, whereas in 304 SS, the fraction of hydroxides associated with OH− was markedly higher, resulting in a ratio of 42.13%. The higher OH− fraction in 304 SS reflects the dominance of porous hydroxide species, Cr(OH)3 and Fe(OH)3, in the passive film, which is associated with the higher NA and ND values observed in the Mott–Schottky analysis. In contrast, the lower OH− fraction in NASS indicates the formation of a more compact passive film with reduced defect density, conferring greater resistance to ionic transport. This renders the passive film of 304 SS more susceptible to penetration by aggressive species such as Cl− in acidic and neutral Cl−-containing environments, thereby increasing its vulnerability to passive film breakdown.
As shown in Figure 8d,h, the N 1s spectra reveal two chemical states, N (397.8 eV) and NH3 (399.7 eV), whereas an additional peak corresponding to CrN (396.7 eV) appears only for NASS. The increased NH3 intensity in the spectrum of NASS was attributed to its relatively high N concentration, which promoted NH3 formation through the reaction of dissolved N in the aqueous solution. The interaction between the N species and H ions can suppress local acidification within the pit, inhibiting further pit growth. Moreover, NH3, acting as an electron donor, may inhibit the oxidation of the Cr2O3 passive film and prevent its hydration, functioning as a corrosion inhibitor. As a result, excessive thickening of the passive film through hydration can be suppressed, which may explain why the Cr-rich passive film on NASS remains relatively thin yet stable [32].
3.4. Pitting Behavior
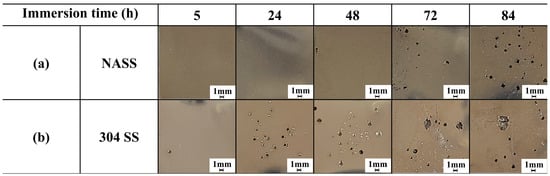
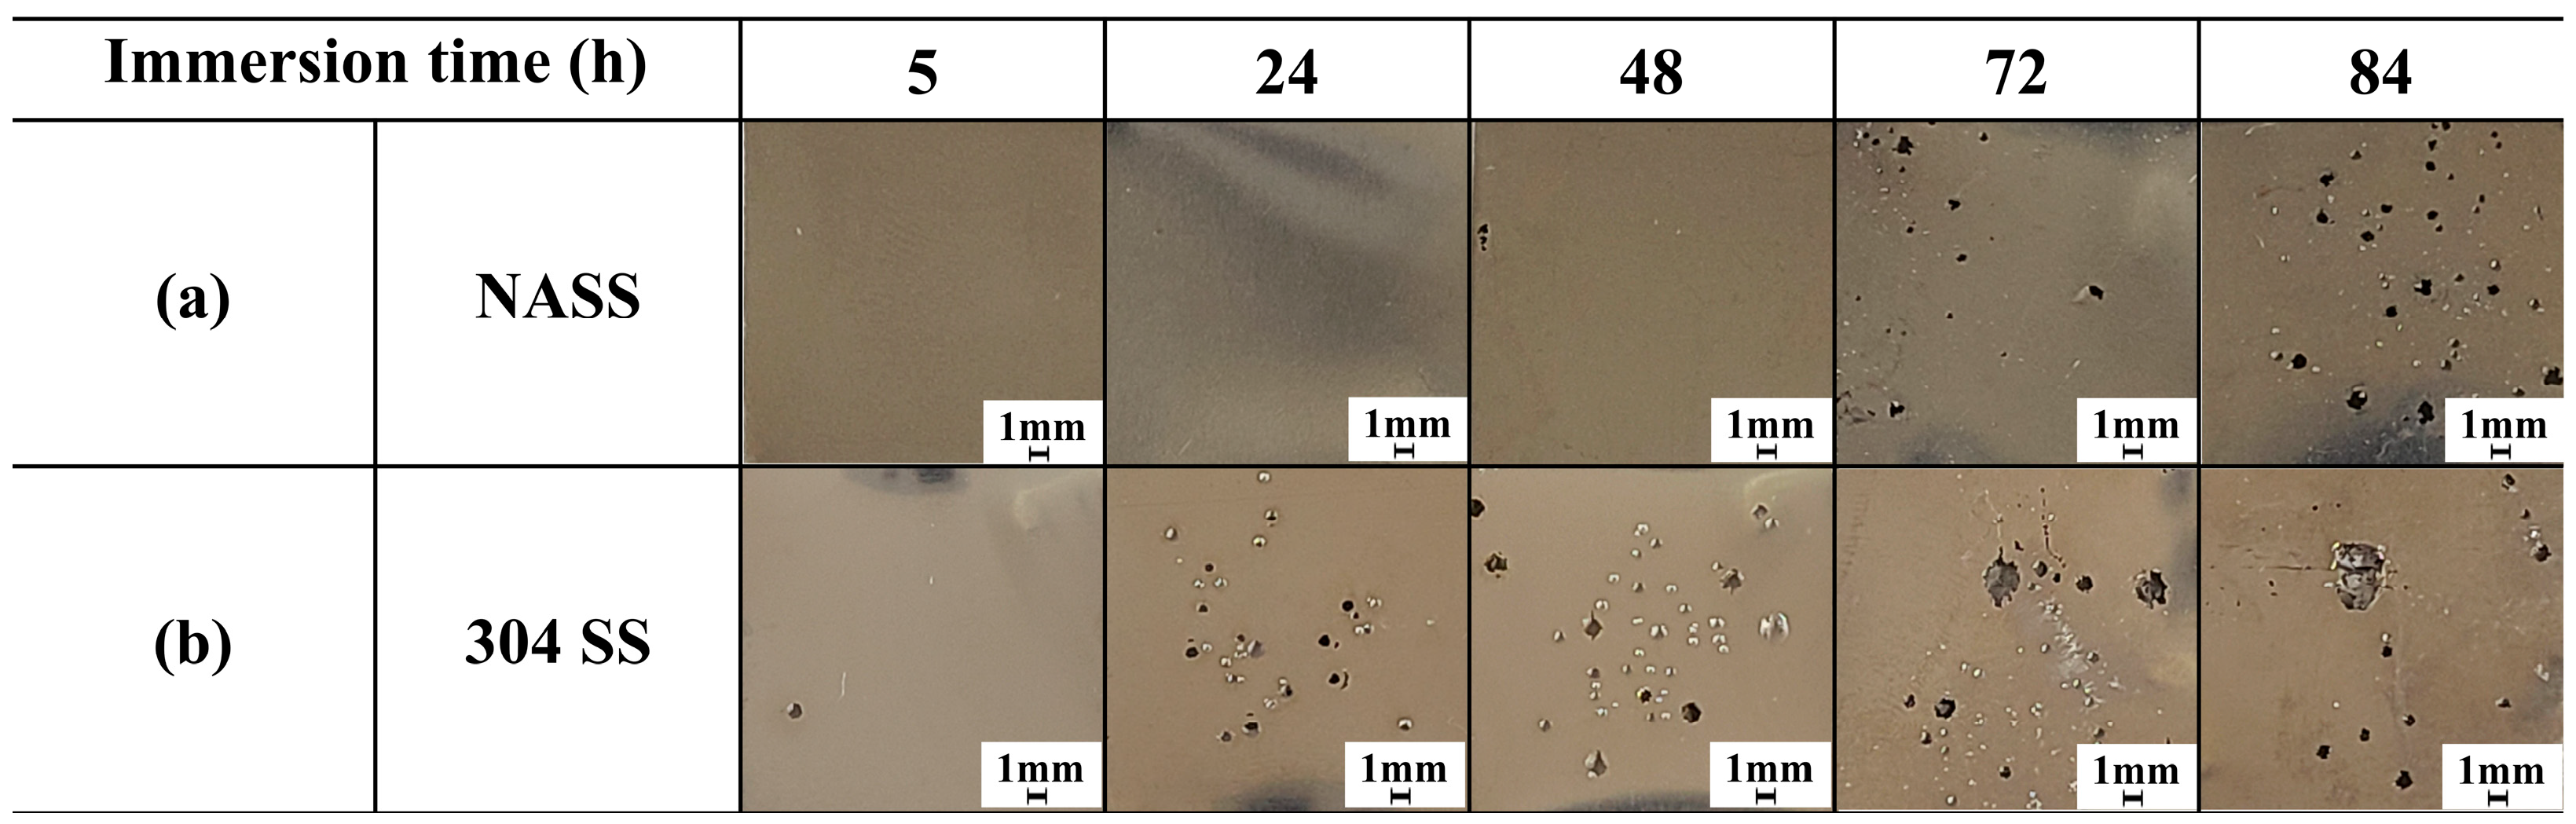
To elucidate the pitting mechanism in NASS and 304 SS, immersion tests were conducted to observe the specimen surfaces at varying immersion times using a digital camera, as shown in Figure 9. The number of pits and total pit area (%) were quantified using Image J software, and the maximum pit depth was measured using 3D-OM, as summarized in Table 5. Visual inspection revealed that pit initiation occurred after 48 h in NASS, whereas pits were observed after 5 h in 304 SS, indicating earlier pit initiation in 304 SS. As the immersion time increased, NASS developed densely distributed small pits with relatively narrow openings, whereas 304 SS exhibited larger pits with wider openings. Accordingly, the corroded area fraction of 304 SS was higher than that of NASS under all immersion conditions. Furthermore, the 3D optical microscopy analysis revealed that relatively shallow pits formed in NASS for up to 48 h and grew into deep pits with a maximum depth of ~508.5 μm after 72 h. By contrast, 304 SS exhibited deep pits of 631.4 μm within only 5 h—the earliest time pits were observed. Ultimately, perforation occurred in both the 1.2 mm thick NASS and 304 SS specimens after 72 and 48 h of immersion, respectively.
Figure 9.
Visual inspection of the corroded surfaces of NASS and 304 SS after immersion for varying times.
Table 5.
Quantitative analysis of corrosion damage, including number of pits, total pit area, and maximum pit depth, after varying immersion times.
4. Discussion
The corrosion resistance of austenitic stainless steels exposed to various pH and Cl−-containing environments is largely governed by the composition, stability, and repassivation ability of the passive film formed on the surface. In this study, the NASS alloy, which was designed by reducing the Ni content and increasing the N content, exhibited relatively larger grains than commercial 304 SS, but showed crystallographic orientations favorable for the adsorption of passivating species. In addition, N addition led to the formation of CrN and NH3 species in the passive NASS film. CrN, formed via N substitution for O in the Cr oxide lattice, reacts with O vacancies to promote the formation of a dense inner Cr2O3 layer, reducing the defect density of the passive film. Upon localized film breakdown, this densified Cr2O3 layer enables rapid repassivation, while NH3 generated within the pit cavity neutralizes the locally acidified environment, maintaining conditions favorable for passive film stability. Together, these N-derived effects accelerate repassivation kinetics, suppressing the transition from metastable to stable pit growth. Consequently, NASS exhibited superior corrosion resistance and self-healing behavior across both acidic and neutral Cl− environments.
As pH increases, Fe oxide/hydroxide species become more stable and predominate in the outer passive layer, while the relative Cr content decreases [33]. This pH-dependent compositional change results in a thicker Fe-rich outer layer on 304 SS, which may contribute to the higher Rct observed under alkaline conditions. In contrast, the passive film on NASS, which is predominantly composed of compact Cr2O3, is optimized for corrosion resistance in acidic and neutral environments where Cr-rich films provide superior barrier properties against Cl− penetration. Furthermore, chromium oxide is known to exhibit amphoteric behavior, and at sufficiently high anodic potentials in strongly alkaline environments, Cr2O3 may become susceptible to transpassive dissolution as chromate (CrO42−) [34]. This potential-dependent instability of the Cr2O3-rich film may partially account for the relatively lower Rct of NASS compared to 304 SS at pH 11.
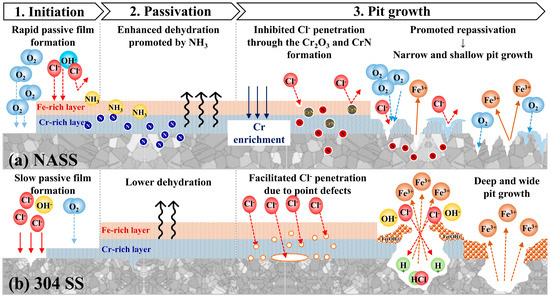
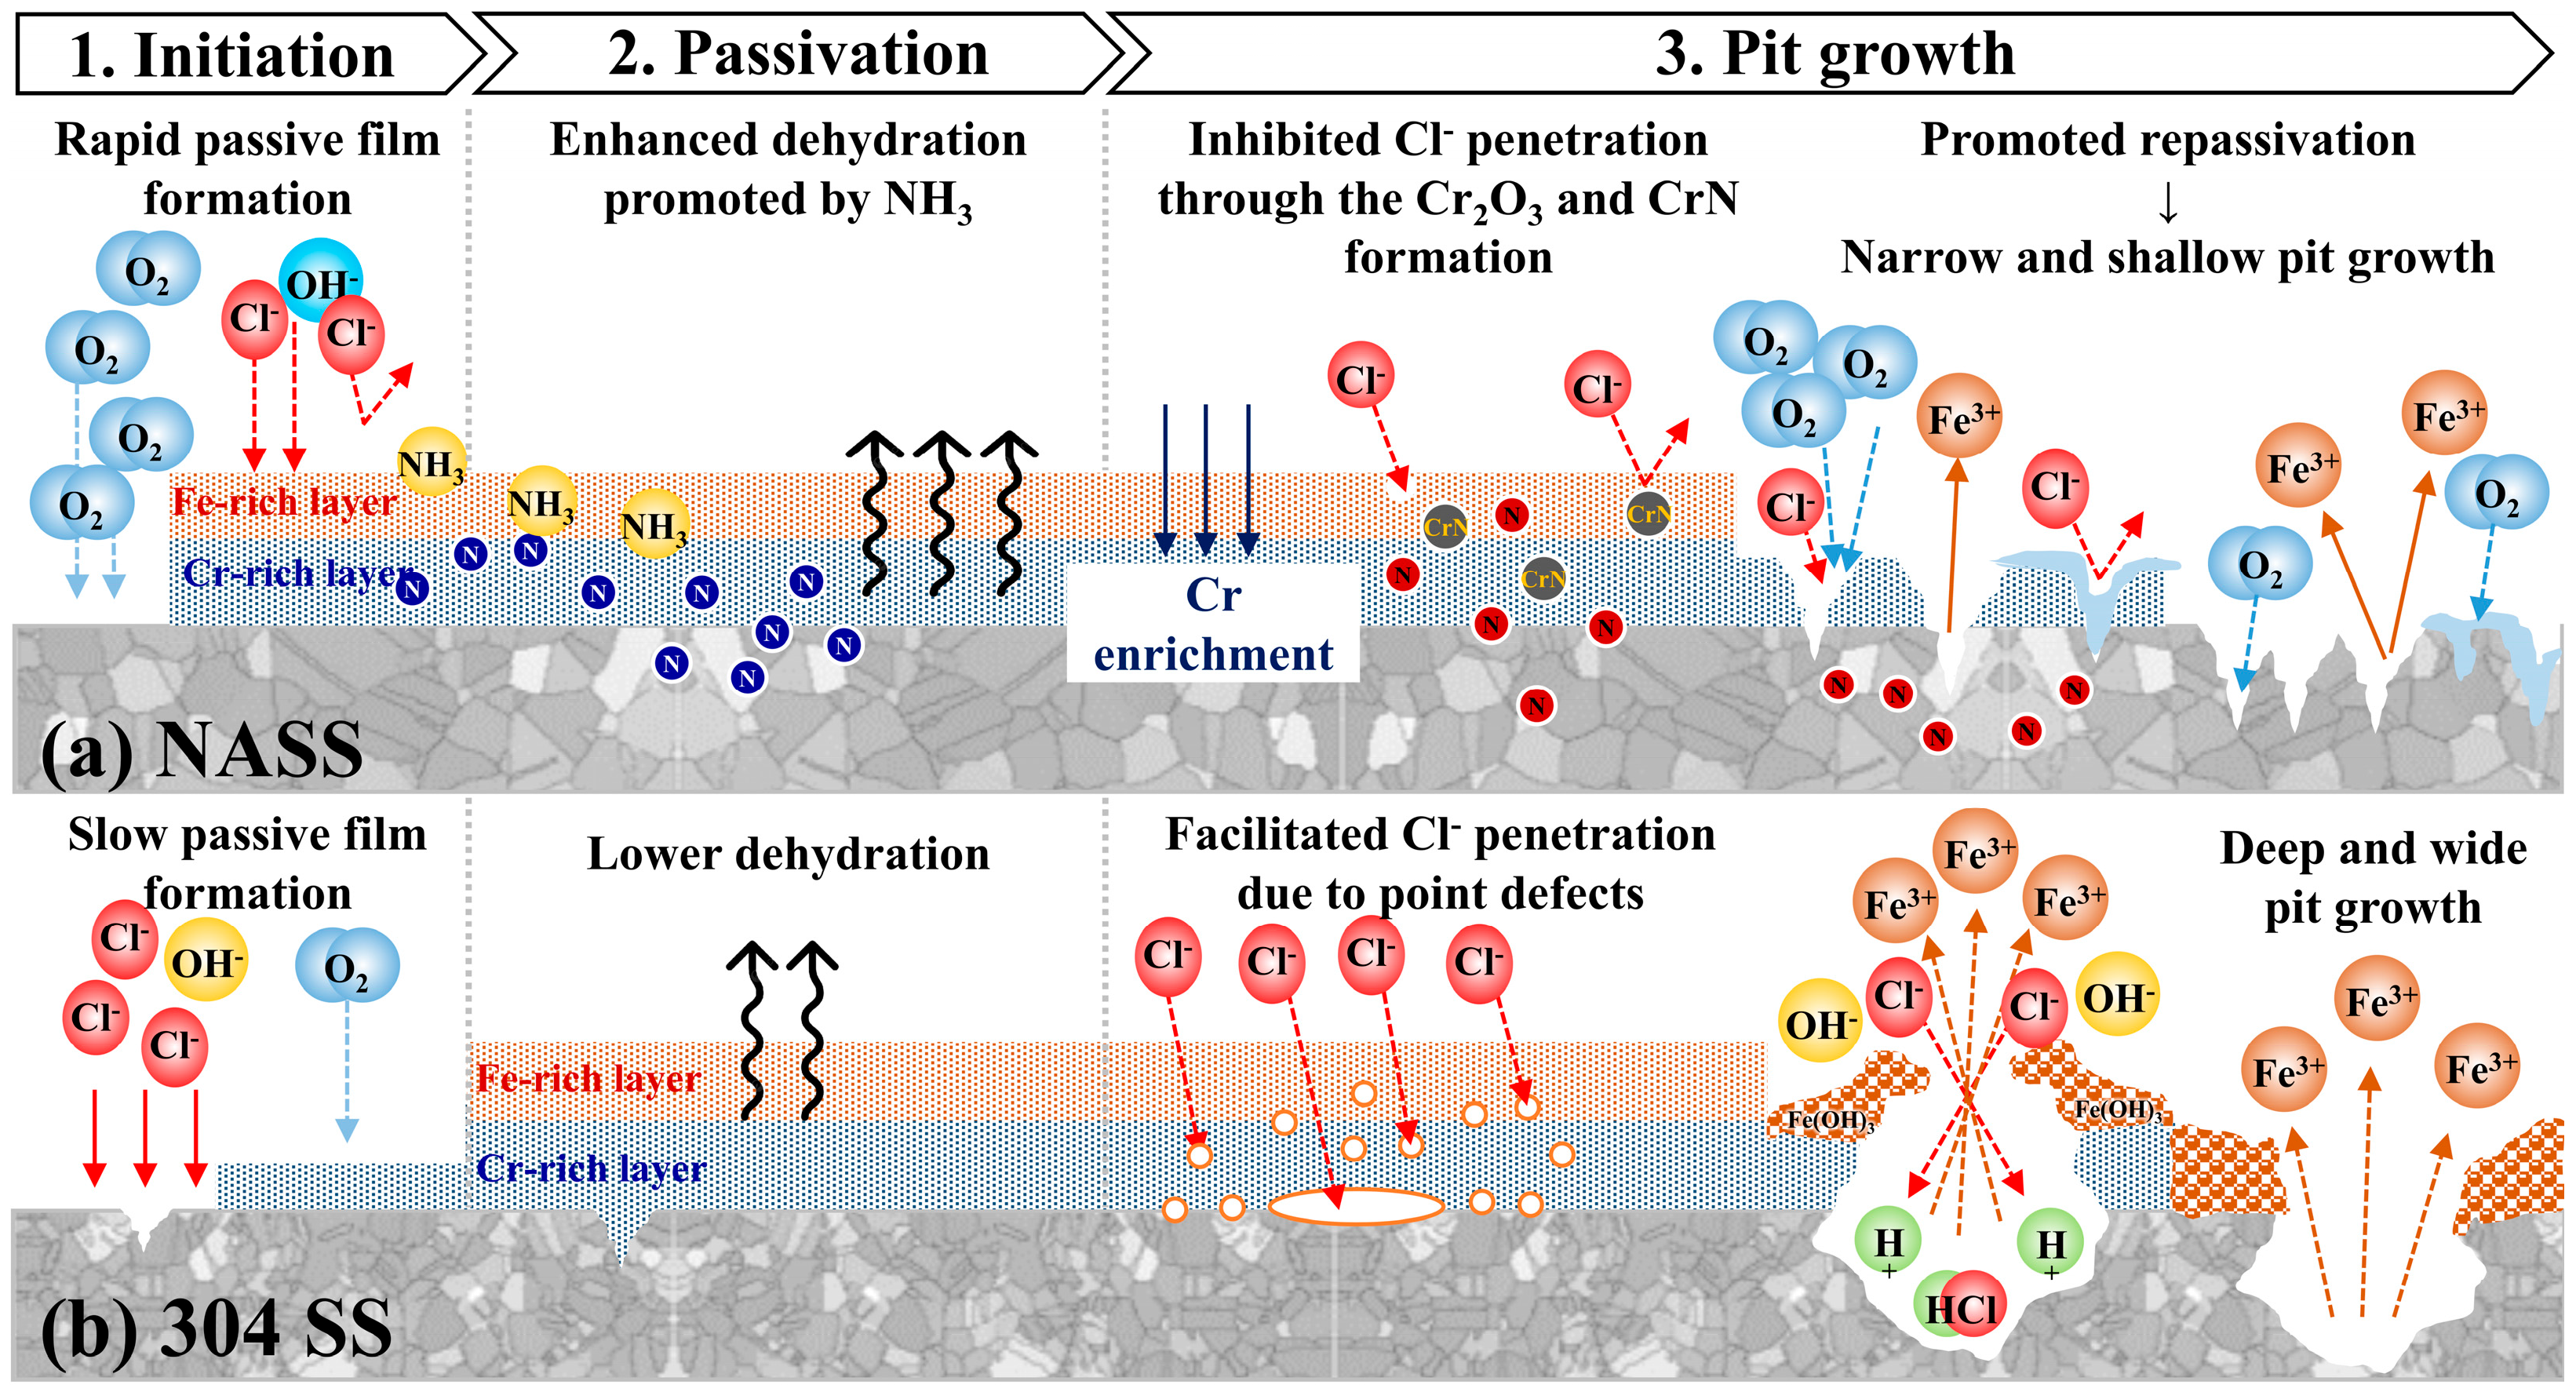
These passive film differences also affected pitting morphology. Pit initiation was delayed in NASS, which developed numerous small pits. In contrast, 304 SS developed wide and deep pits. The contrasting pit morphologies reflect a high nucleation rate coupled with a high repassivation rate in NASS, as opposed to stable pit propagation in 304 SS. Overall, the differences in pitting behavior observed between NASS and 304 SS under various pH and Cl− environments are considered to originate from differences in the composition and stability of their passive films; a schematic of the proposed pitting mechanism is presented in Figure 10.
Figure 10.
Schematic of the pitting mechanism of (a) NASS and (b) 304 SS.
5. Conclusions
In this study, the corrosion resistance of NASS and 304 SS was evaluated in relation to the characteristics of the passive film formed in various pH and Cl−-containing environments. The results are summarized as follows.
Both NASS and 304 SS exhibited single-phase fcc austenitic structures with equiaxed grains and annealing twins. Although NASS had relatively larger grains than 304 SS, its crystallographic characteristics were more favorable for the adsorption of passivating species, whereas 304 SS exhibited a stronger preferred orientation along the <001> and <111> directions. In addition, the XRD peak shifts in NASS suggest the presence of interstitial N dissolved in the lattice.
As the Cl− concentration increased, both alloys showed larger hysteresis loops and higher icorr values, indicating increased susceptibility to localized corrosion, with the poorest behavior observed at pH 3. Nevertheless, NASS exhibited lower icorr, higher Epit, and metastable pitting behavior in most acidic and neutral environments, indicating its superior repassivation ability. The EIS and potentiostatic polarization results confirmed that NASS formed a more stable passive film under acidic and neutral conditions, whereas 304 SS performed better under strongly alkaline conditions.
Mott–Schottky analysis showed that NASS had lower donor and acceptor densities than 304 SS, indicating a lower defect density and higher passive film stability. XPS analysis further revealed the presence of CrN and NH3 species only in NASS, together with a much higher Cr2O3/Cr(OH)3 ratio. These features suggest that the addition of N promotes the formation of a compact Cr-rich inner layer and enhances the repassivation performance of NASS.
Immersion tests showed that pit initiation was delayed in NASS until 48 h, whereas 304 SS exhibited pit formation as early as 5 h. NASS developed small pits with narrow openings, whereas 304 SS formed larger and deeper pits at an earlier stage. Perforation occurred after 72 h in the NASS group and after 48 h in the 304 SS group, confirming that NASS was more effective in delaying pit initiation and suppressing pit growth.
Supplementary Materials
The following supporting information can be downloaded at: https://www.mdpi.com/article/10.3390/met16050544/s1. Table S1. Summary of previous studies on the effect of nitrogen (N) on passive film characteristics and corrosion behavior of austenitic stainless steels. References [35,36] are cited in the supplementary materials.
Author Contributions
Conceptualization, J.B. and S.L.; methodology, J.B. and D.S.; validation, J.B., D.S. and S.L.; formal analysis, J.B. and D.S.; investigation, J.B. and D.S.; data curation, J.B.; writing—original draft preparation, J.B.; writing—review and editing, J.B., D.S. and S.L.; visualization, J.B.; supervision, S.L.; project administration, S.L. All authors have read and agreed to the published version of the manuscript.
Funding
This research received no external funding.
Data Availability Statement
The original contributions presented in this study are included in the article/Supplementary Material. Further inquiries can be directed to the corresponding author.
Conflicts of Interest
The authors declare no conflicts of interest.
References
- Wang, X.Q.; Wu, T.; Zhong, H.; Su, C.W. Bubble Behaviors in Nickel Price: What Roles Do Geopolitical Risk and Speculation Play? Resour. Pol. 2023, 83, 103707. [Google Scholar] [CrossRef] [Scilit]
- London Metal Exchange. Lme, n.d. T.L.M. Exchange, LME Nickel. 2026. Available online: https://www.lme.com/Metals/Non-ferrous/LME-Nickel#Price+graphs (accessed on 3 May 2026).
- IMARC Group. Nitrogen Prices, Trend, Chart, Demand, Market Analysis, News, Historical and Forecast Data Report. 2026. Available online: https://www.imarcgroup.com/nitrogen-pricing-report (accessed on 3 May 2026).
- Yu, X.; Zhu, B.Y.; Bu, Y.; Zhang, X.D.; Shi, L.M. Post-Fire and Cold-Formed Properties of a Novel High Nitrogen Stainless Steel S35657. J. Constr. Steel Res. 2025, 227, 109305. [Google Scholar] [CrossRef] [Scilit]
- Gao, F.; Qiao, Y.; Chen, J.; Yang, L.; Zhou, H.; Zheng, Z.; Zhang, L. Effect of Nitrogen Content on Corrosion Behavior of High-Nitrogen Austenitic Stainless Steel. npj Mater. Degrad. 2023, 7, 75. [Google Scholar] [CrossRef] [Scilit]
- Odnobokova, M.V.; Belyakov, A.N.; Dolzhenko, P.D.; Kostina, M.V.; Kaibyshev, R.O. On the Strengthening Mechanisms of High Nitrogen Austenitic Stainless Steels. Mater. Lett. 2023, 331, 133502. [Google Scholar] [CrossRef] [Scilit]
- Metikoš-Huković, M.; Babić, R.; Grubač, Z.; Petrović, Ž.; Lajçi, N. High Corrosion Resistance of Austenitic Stainless Steel Alloyed with Nitrogen in an Acid Solution. Corros. Sci. 2011, 53, 2176–2183. [Google Scholar] [CrossRef] [Scilit]
- Borgioli, F.; Galvanetto, E.; Bacci, T. Corrosion Behaviour of Low Temperature Nitrided Nickel-Free, AISI 200 and AISI 300 Series Austenitic Stainless Steels in NaCl Solution. Corros. Sci. 2018, 136, 352–365. [Google Scholar] [CrossRef] [Scilit]
- Chen, S.; Sun, L.; Cao, W.; Zhao, T.; Qiu, J.; Li, W. Research on the Pitting Behavior of High Nitrogen Austenitic Stainless Steel 316LN in Sodium Chloride Solution by Using Modified Potentiostatic Pulse Test. J. Electroanal. Chem. 2022, 922, 116739. [Google Scholar] [CrossRef] [Scilit]
- Aamani, S.; Das, C.R.; Martha, S.K.; Albert, S.K.; Panigrahi, B.B. Influence of Nitrogen on Grain Size-Dependent Sensitisation and Corrosion Resistance of 316L(N) Austenitic Stainless Steels. Trans. Indian. Inst. Met. 2022, 75, 2169–2177. [Google Scholar] [CrossRef] [Scilit]
- Linhares, B.G.; da Silva, A.V.B.; Alcanfor, A.A.C.; Pascoal, C.V.P.; Girão, D.C.; Perez, G.; Araújo, W.S. Enhanced Pitting Resistance of Novel Low-Nickel Austenitic Stainless Steel QN1803 Compared to Conventional 300-Series Grades in Aggressive Chloride Environments. Mater. Chem. Phys. 2026, 352, 132031. [Google Scholar] [CrossRef] [Scilit]
- Wang, Y.; Wang, W.; Xiao, Q.; Yu, J.; Ji, Y.; Deng, K. Effect of Nitrogen Content on the Cavitation Erosion Resistance of 316LN Stainless Steel. Metals 2025, 15, 1270. [Google Scholar] [CrossRef] [Scilit]
- Lu, P.C.; Cui, J.H.; Feng, H.; Li, H.B.; Dai, J.; Ren, G.Q.; Jiang, Z.H. A Novel Approach for Enhancing Corrosion Resistance of High-Nitrogen Stainless Steels by Optimizing Inclusion Characteristics: Utilizing Newly Designed Slag and Ce-Mg Alloy during Pressurized Electro-Slag Remelting. Corros. Sci. 2026, 264, 113771. [Google Scholar] [CrossRef] [Scilit]
- Ha, H.; Kwon, H. Effects of Cr2N on the Pitting Corrosion of High Nitrogen Stainless Steels. Electrochim. Acta 2007, 52, 2175–2180. [Google Scholar] [CrossRef] [Scilit]
- Sahlaoui, H.; Makhlouf, K.; Sidhom, H.; Philibert, J. Effects of Ageing Conditions on the Precipitates Evolution, Chromium Depletion and Intergranular Corrosion Susceptibility of AISI 316L: Experimental and Modeling Results. Mater. Sci. Eng. A 2004, 372, 98–108. [Google Scholar] [CrossRef] [Scilit]
- Li, L.; Li, X.; Dong, C.; Huang, Y. Computational Simulation of Metastable Pitting of Stainless Steel. Electrochim. Acta. 2009, 54, 6389–6395. [Google Scholar] [CrossRef] [Scilit]
- Abdallah, M. Corrosion Behaviour of 304 Stainless Steel in Sulphuric Acid Solutions and Its Inhibition by Some Substituted Pyrazolones. Mater. Chem. Phys. 2003, 82, 786–792. [Google Scholar] [CrossRef] [Scilit]
- ASTM G46-21; Standard Guide for Examination and Evaluation of Pitting Corrosion. ASTM International: West Conshohocken, PA, USA, 2021.
- Dong, S.; Chen, X.; La Plante, E.C.; Gussev, M.; Leonard, K.; Sant, G. Elucidating the Grain-Orientation Dependent Corrosion Rates of Austenitic Stainless Steels. Mater. Des. 2020, 191, 108583. [Google Scholar] [CrossRef] [Scilit]
- Zheng, Z.J.; Gao, Y.; Gui, Y.; Zhu, M. Corrosion Behaviour of Nanocrystalline 304 Stainless Steel Prepared by Equal Channel Angular Pressing. Corros. Sci. 2012, 54, 60–67. [Google Scholar] [CrossRef] [Scilit]
- Abbasi Aghuy, A.; Zakeri, M.; Moayed, M.H.; Mazinani, M. Effect of Grain Size on Pitting Corrosion of 304L Austenitic Stainless Steel. Corros. Sci. 2015, 94, 368–376. [Google Scholar] [CrossRef] [Scilit]
- Song, G. Transpassivation of Fe-Cr-Ni Stainless Steels. Corros. Sci. 2005, 47, 1953–1987. [Google Scholar] [CrossRef] [Scilit]
- Man, C.; Dong, C.; Cui, Z.; Xiao, K.; Yu, Q.; Li, X. A Comparative Study of Primary and Secondary Passive Films Formed on AM355 Stainless Steel in 0.1 M NaOH. Appl. Surf. Sci. 2018, 427, 763–773. [Google Scholar] [CrossRef] [Scilit]
- Wang, Y.; Xing, Z.Z.; Luo, Q.; Rahman, A.; Jiao, J.; Qu, S.J.; Zheng, Y.G.; Shen, J. Corrosion and Erosion-Corrosion Behaviour of Activated Combustion High-Velocity Air Fuel Sprayed Fe-Based Amorphous Coatings in Chloride-Containing Solutions. Corros. Sci. 2015, 98, 339–353. [Google Scholar] [CrossRef] [Scilit]
- Choudhary, S.; Kelly, R.G.; Birbilis, N. On the Origin of Passive Film Breakdown and Metastable Pitting for Stainless Steel 316L. Corros. Sci. 2024, 230, 111911. [Google Scholar] [CrossRef] [Scilit]
- Cheng, H.; Luo, H.; Wang, X.; Pan, Z.; Jiang, Y.; Li, X. Electrochemical Corrosion and Passive Behavior of a New High-Nitrogen Austenitic Stainless Steel in Chloride Environment. Mater. Chem. Phys. 2022, 292, 126837. [Google Scholar] [CrossRef] [Scilit]
- Hakiki, N.B.; Boudin, S.; Rondot, B.; Belo, M.D.C. The Electronic Structure of Passive Films Formed on Stainless Steels. Corros. Sci. 1995, 37, 1809–1822. [Google Scholar] [CrossRef] [Scilit]
- Brooks, A.R.; Clayton, C.R.; Doss, K.; Lu, Y.C. On the Role of Cr in the Passivity of Stainless Steel. J. Electrochem. Soc. 1986, 133, 2459–2464. [Google Scholar] [CrossRef] [Scilit]
- Wang, Q.; Zhang, B.; Ren, Y.; Yang, K. A Self-Healing Stainless Steel: Role of Nitrogen in Eliminating Detrimental Effect of Cold Working on Pitting Corrosion Resistance. Corros. Sci. 2018, 145, 55–66. [Google Scholar] [CrossRef] [Scilit]
- Krawiec, H.; Vignal, V.; Heintz, O.; Oltra, R.; Olive, J.-M. Influence of the Chemical Dissolution of MnS Inclusions on the Electrochemical Behavior of Stainless Steels. J. Electrochem. Soc. 2005, 152, B213. [Google Scholar] [CrossRef] [Scilit]
- Macdonald, D.D. The History of the Point Defect Model for the Passive State: A Brief Review of Film Growth Aspects. Electrochim. Acta. 2011, 56, 1761–1772. [Google Scholar] [CrossRef] [Scilit]
- Ningshen, S.; Kamachi Mudali, U.K.; Mittal, V.K.; Khatak, H.S. Semiconducting and Passive Film Properties of Nitrogen-Containing Type 316LN Stainless Steels. Corros. Sci. 2007, 49, 481–496. [Google Scholar] [CrossRef] [Scilit]
- Freire, L.; Carmezim, M.J.; Ferreira, M.A.; Montemor, M.F. The Passive Behaviour of AISI 316 in Alkaline Media and the Effect of pH: A Combined Electrochemical and Analytical Study. Electrochim. Acta 2010, 55, 6174–6181. [Google Scholar] [CrossRef] [Scilit]
- Zydorczak, B.; May, P.M.; Meyrick, D.P.; Bátka, D.; Hefter, G. Dissolution of Cr2O3(s) and the Behavior of Chromium in Concentrated NaOH Solutions. Ind. Eng. Chem. Res. 2012, 51, 16537–16543. [Google Scholar] [CrossRef] [Scilit]
- Zagorski, K.; Doraczynska, A. Potentiodynamic Polarization Behaviour of Two 17Cr13Ni2·5 Mo Austenitic Steels with Different N Contents. Corros. Sci. 1976, 16, 405–410. [Google Scholar] [CrossRef] [Scilit]
- Donik, Č.; Kocijan, A. Comparison of the Corrosion Behaviour of Austenitic Stainless Steel in Seawater and in a 3.5% NaCl Solution. Mater. Tehnol. 2014, 48, 937–942. [Google Scholar]

Disclaimer/Publisher’s Note: The statements, opinions and data contained in all publications are solely those of the individual author(s) and contributor(s) and not of MDPI and/or the editor(s). MDPI and/or the editor(s) disclaim responsibility for any injury to people or property resulting from any ideas, methods, instructions or products referred to in the content. |
© 2026 by the authors. Licensee MDPI, Basel, Switzerland. This article is an open access article distributed under the terms and conditions of the Creative Commons Attribution (CC BY) license.