


Abstract
The L-shaped columns of recycled aggregate concrete-filled steel tubes (L-RACFSTs) with a 40% coarse aggregate replacement ratio were selected as the research subject, and axial compression and eccentric compression tests were conducted. Based on validated finite element numerical simulation methods, a parametric analysis was carried out, incorporating key parameters such as steel strength, width-to-thickness ratios of the square steel tube and connecting plate, and load eccentricity. The mechanical properties of L-RACFSTs under axial compression and eccentric compression loads were studied. The results show the following: (1) At a 40% replacement rate, axial compression specimens exhibited obvious in-plane deformation of the column limbs, whereas eccentric compression specimens showed overall bending toward the inner side of the column. (2) As the strength of the steel increases, the axial and eccentric compressive bearing capacities of the specimens gradually increase. It is recommended that structural steel with a strength grade of Q355 is adopted. (3) When the width of a square steel tube is fixed, the axial and eccentric compressive bearing capacities of the test specimen gradually increase as the width-to-thickness ratio decreases. (4) In contrast, for a connecting plate of a fixed width, an increase in the width-to-thickness ratio results in a decrease in bearing capacity. Additionally, due to the increased width of the connecting plate, bearing capacity will decrease in some cases. (5) The bearing capacity under eccentric loading decreases gradually as the eccentricity increases; it is recommended that the eccentricity be kept below 120 mm.
1. Introduction
Urban development and renewal, by generating a large number of new construction projects, result in greenhouse gas emissions that contribute to global warming and increased consumption of natural resources [1,2]. Due to the extensive use of concrete, approximately 50 billion tons of sand and gravel are consumed globally each year, resulting in significant carbon dioxide (CO2) emissions; cement production accounts for about 90% of the CO2 emissions associated with concrete worldwide [3,4,5]. The construction industry, as a major source of CO2 emissions, contributes to global warming; as a result, people are beginning to recognize the impacts of concrete use, such as shortages of natural aggregates and environmental pollution [6,7,8]. To achieve sustainable development in the construction industry, it is necessary to prevent further environmental degradation, reduce the use of natural resources, and mitigate carbon emissions to address the increasingly severe issue of global climate change [9,10,11]. Therefore, crushing waste concrete into recycled coarse aggregate (RCA) for reuse to produce recycled aggregate concrete (RAC) can significantly reduce construction waste, lower construction costs, and conserve energy [10,12,13].
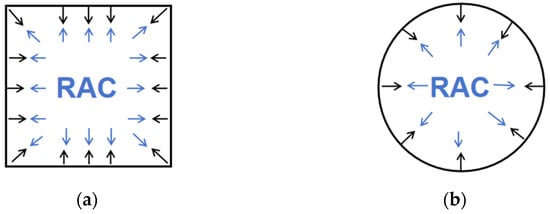
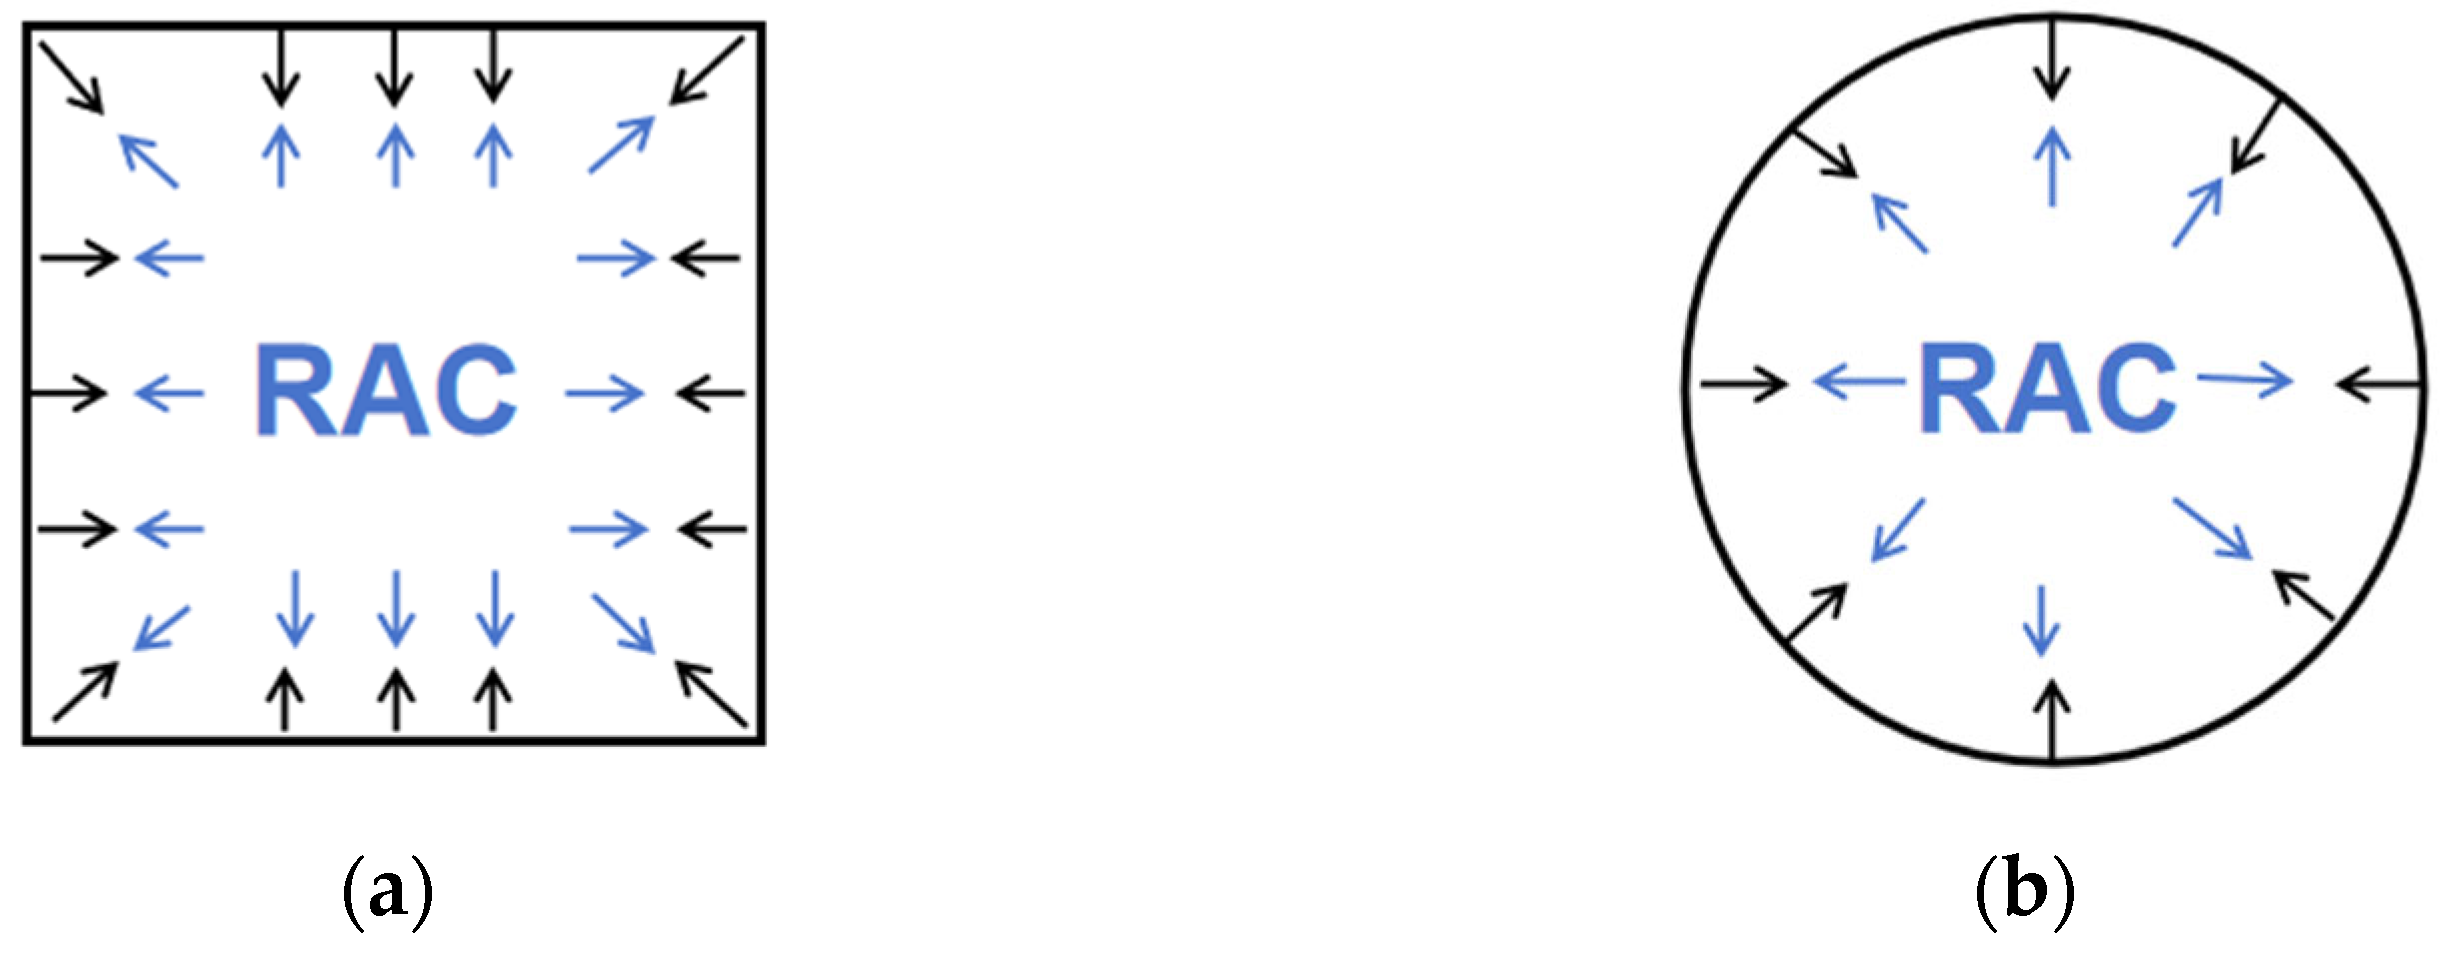
RAC is widely used as an effective method for treating construction waste. Numerous studies both domestically and internationally have shown that, compared to ordinary concrete, RAC exhibits relatively poorer mechanical properties, such as axial compressive strength and modulus of elasticity [8,14,15,16,17,18]. To address this issue, researchers have proposed using steel-tube RAC as a structural element, in which RAC is filled into steel tubes. The confining pressure exerted by the steel tubes on the RAC, combined with the support provided by the RAC to the steel tubes, effectively enhances the strength of the RAC [19,20,21,22,23], as Figure 1 shows.
Figure 1.
Schematic diagram of the interaction between steel tubes and concrete: (a) square columns; (b) circular columns.
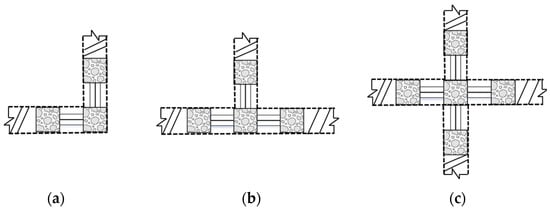
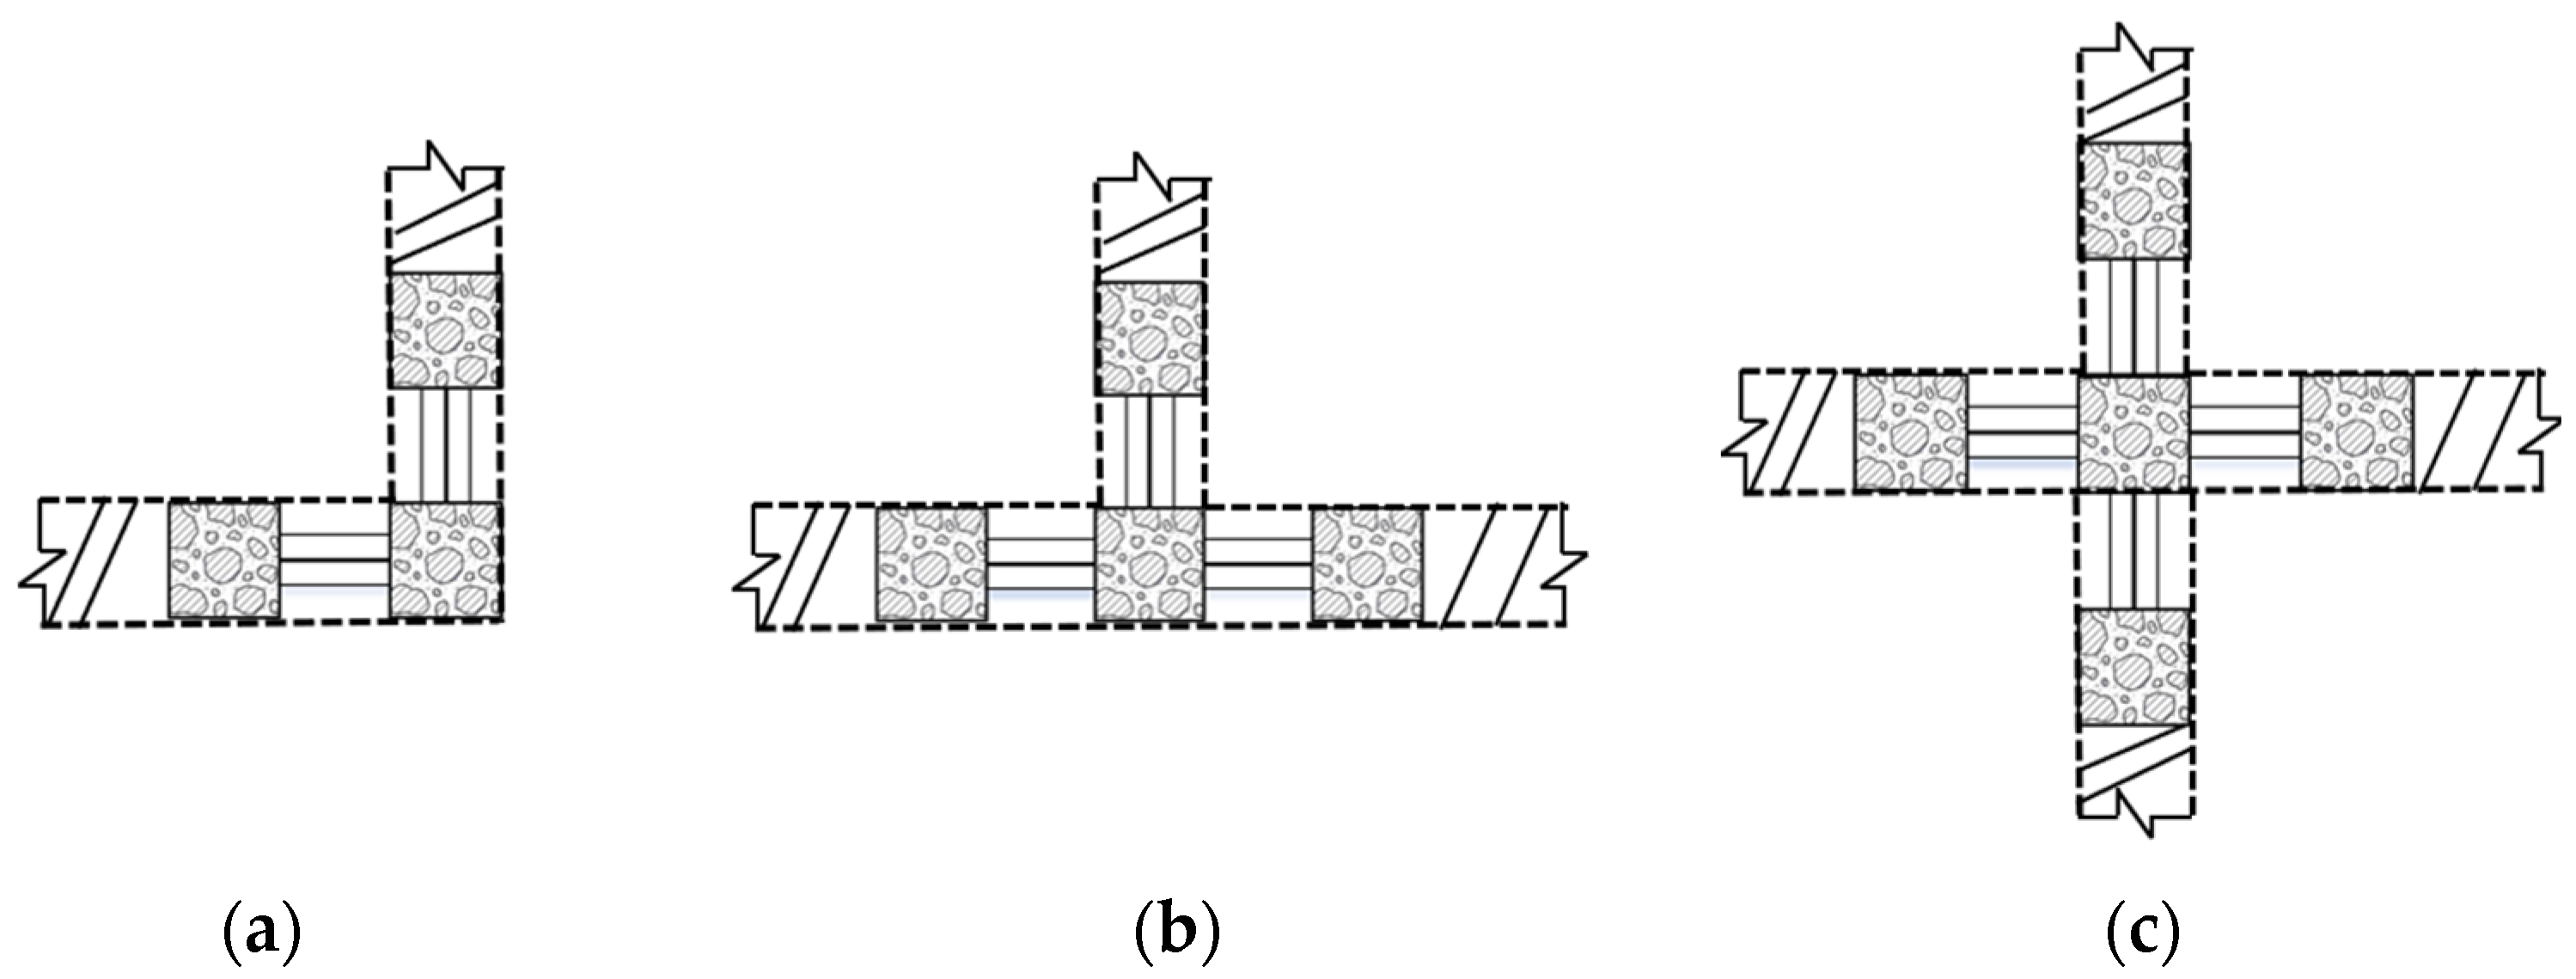
As living standards improve, people are placing increasingly higher demands on their living environments. In traditional residential structures, the square and rectangular columns commonly used protrude from the walls, taking up interior space and affecting furniture arrangement [24]. An L-RACFST is a composite member formed by filling a square steel tube with RAC. It allows columns to be embedded within walls, resulting in a flush wall surface, and is therefore widely used in residential steel structures. Depending on their location, special-shaped columns can be L-shaped (corner columns), T-shaped (side columns), or cross-shaped (central columns), according to refs. [25,26,27,28], as shown in Figure 2. Filling the irregular columns with RAC to form an L-RACFST effectively reduces carbon emissions, combining “green” building materials with prefabricated construction methods.
Figure 2.
Schematic of concrete-filled square steel tubular composite special-shaped columns. (a) L-shaped column; (b) T-shaped column; (c) cross-shaped column.
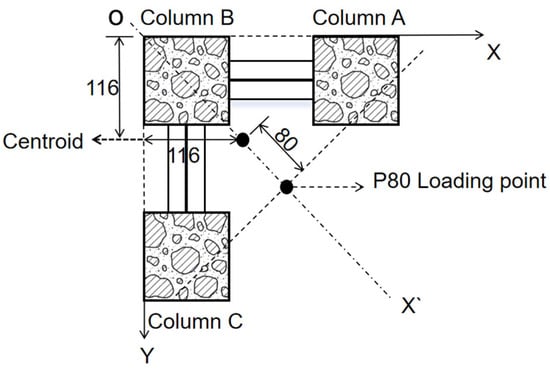
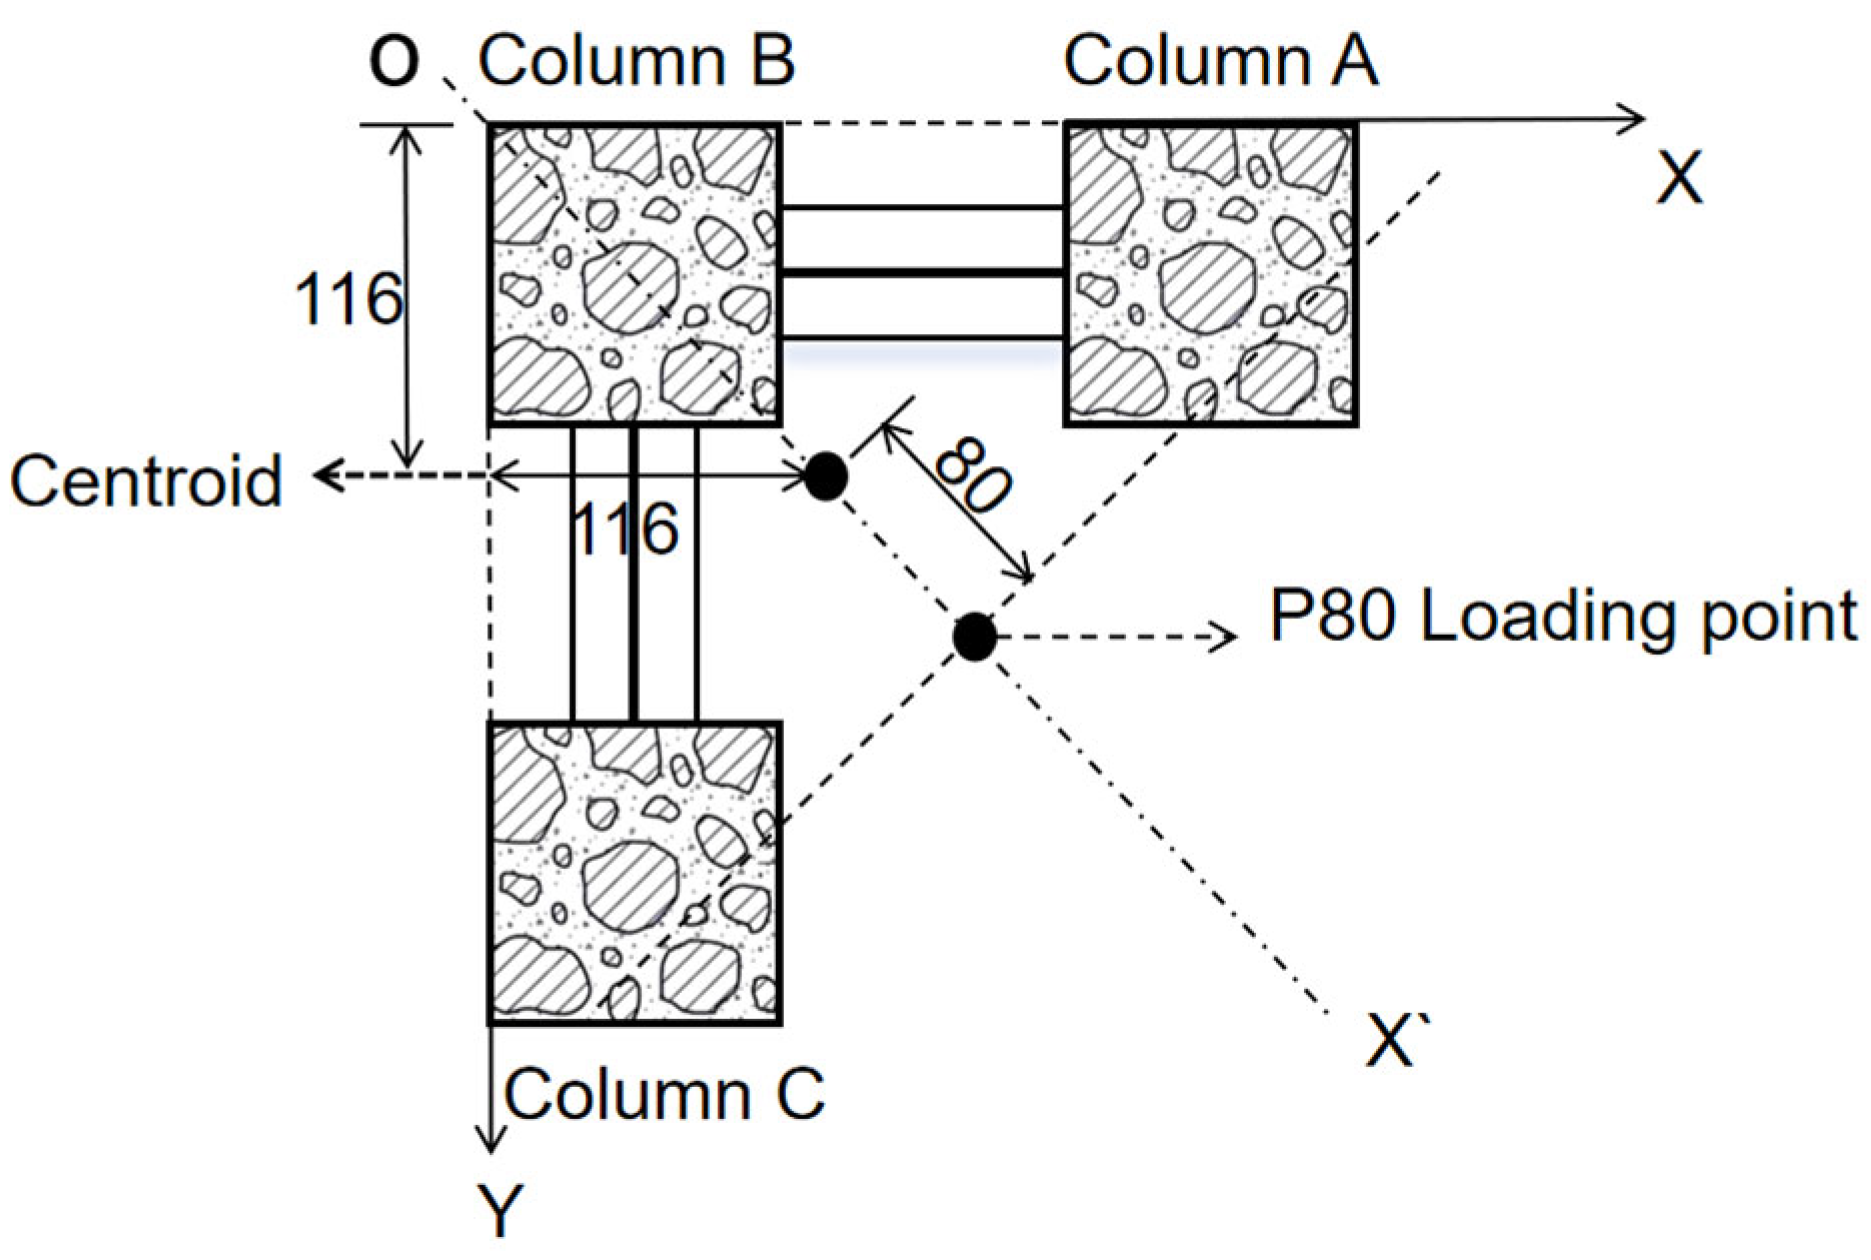
According to the findings of Ma et al. [29,30], when the coarse aggregate replacement rate is below 40%, the mechanical properties of the L-RACFST are minimally affected by the replacement rate; however, when the coarse aggregate replacement rate exceeds 40%, the mechanical properties of the L-RACFST differ significantly from those of ordinary concrete. Therefore, in the L-RACFST studied in this paper, the RAC coarse aggregate replacement rate is set at 40%. In engineering structures, L-shaped columns are used as corner columns and are often subjected to compressive forces; therefore, this paper primarily investigates their mechanical properties under axial and eccentric compressive loads. The point of axial loading is located at the center of mass, while the point of eccentric loading is located on the axis of symmetry OX’, 80 mm from the center of mass, i.e., with an eccentricity of 80 mm, as shown in Figure 3.
Figure 3.
Schematic of loading points (mm).
2. General Description of Experiments
2.1. Preparation of Materials
- (1)
- Cement: “P.O 32.5 ordinary Portland cement” (Tianlu brand, Tangshan, China); fine aggregate: natural sand, with a particle size of 0.3–0.5 mm, a field moisture content of 0.6%, and a gradation classification of Zone 2.
- (2)
- Coarse aggregate: The natural coarse aggregate used in this test was crushed stone with a particle size range of 5 mm to 15 mm. Recycled coarse aggregates for concrete are classified into Class I, Class II, and Class III based on performance requirements. Class I has properties similar to those of natural sand and gravel, while Class III has properties similar to those of cement mortar. The recycled coarse aggregate from this experiment can be used in the preparation of standard RAC; its performance indicators meet the quality requirements for Class II aggregates, as determined in accordance with GB/T 25177 [31]. See Table 1 for details.Table 1. Performance characteristics of coarse aggregates.
2.2. Experimental Program
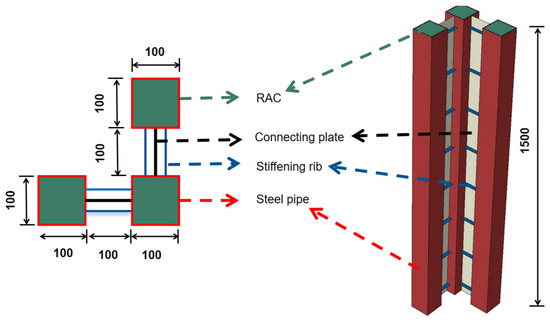
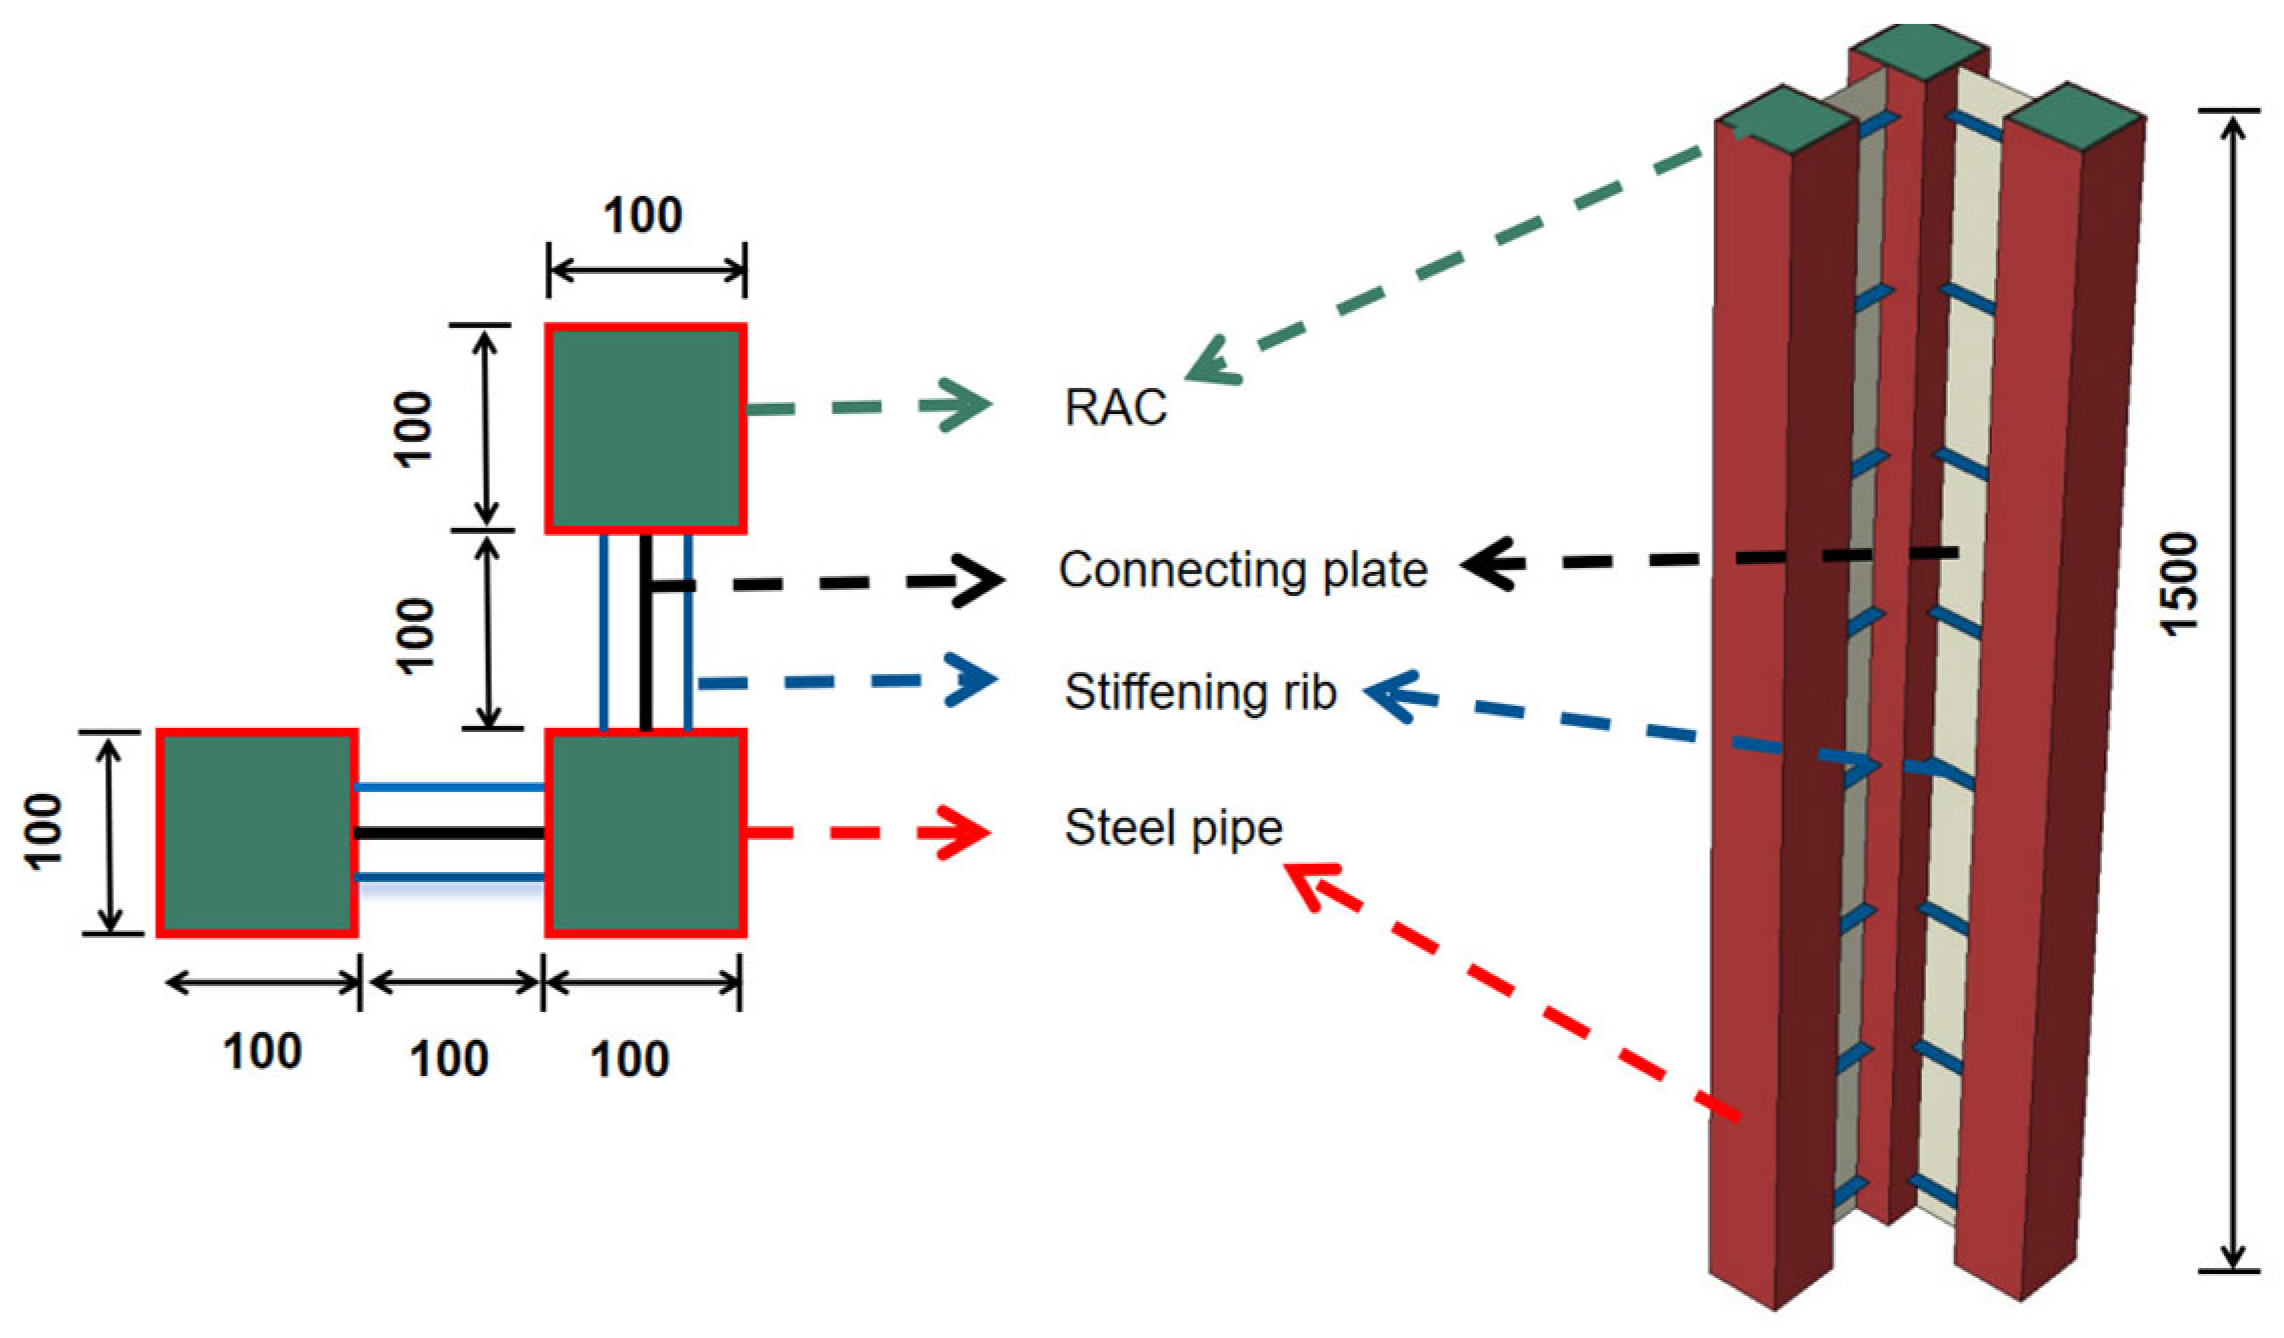
Using the prepared RAC with a coarse aggregate replacement rate of 40%, test specimens of the required dimensions for compressive strength and elastic modulus tests were prepared in accordance with GB/T 50081 [32]. RAC from the same batch was poured into L-shaped hollow square steel tubes made of Q235 steel. The steel tube and connecting plate had a thickness of 3.75 mm, and the stiffening ribs were 5.75 mm thick. This resulted in the test specimens Z-40 and P80-40 required for the experiments (Z-Y, PX-Y; “Z” represents axial compression, “P” represents eccentric compression, “X” represents the eccentricity value, and “Y” represents the replacement rate of recycled coarse aggregate in recycled concrete). Details of the specimens are shown in Figure 4. The tests were conducted after 28 days of curing under natural conditions; the mix design containing 40% RAC and the mechanical properties of the material are listed in Table 2.
Figure 4.
Details of the L-shaped column.
Table 2.
The 40% RAC material data.
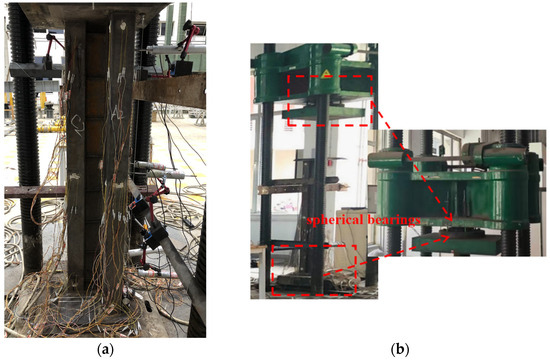
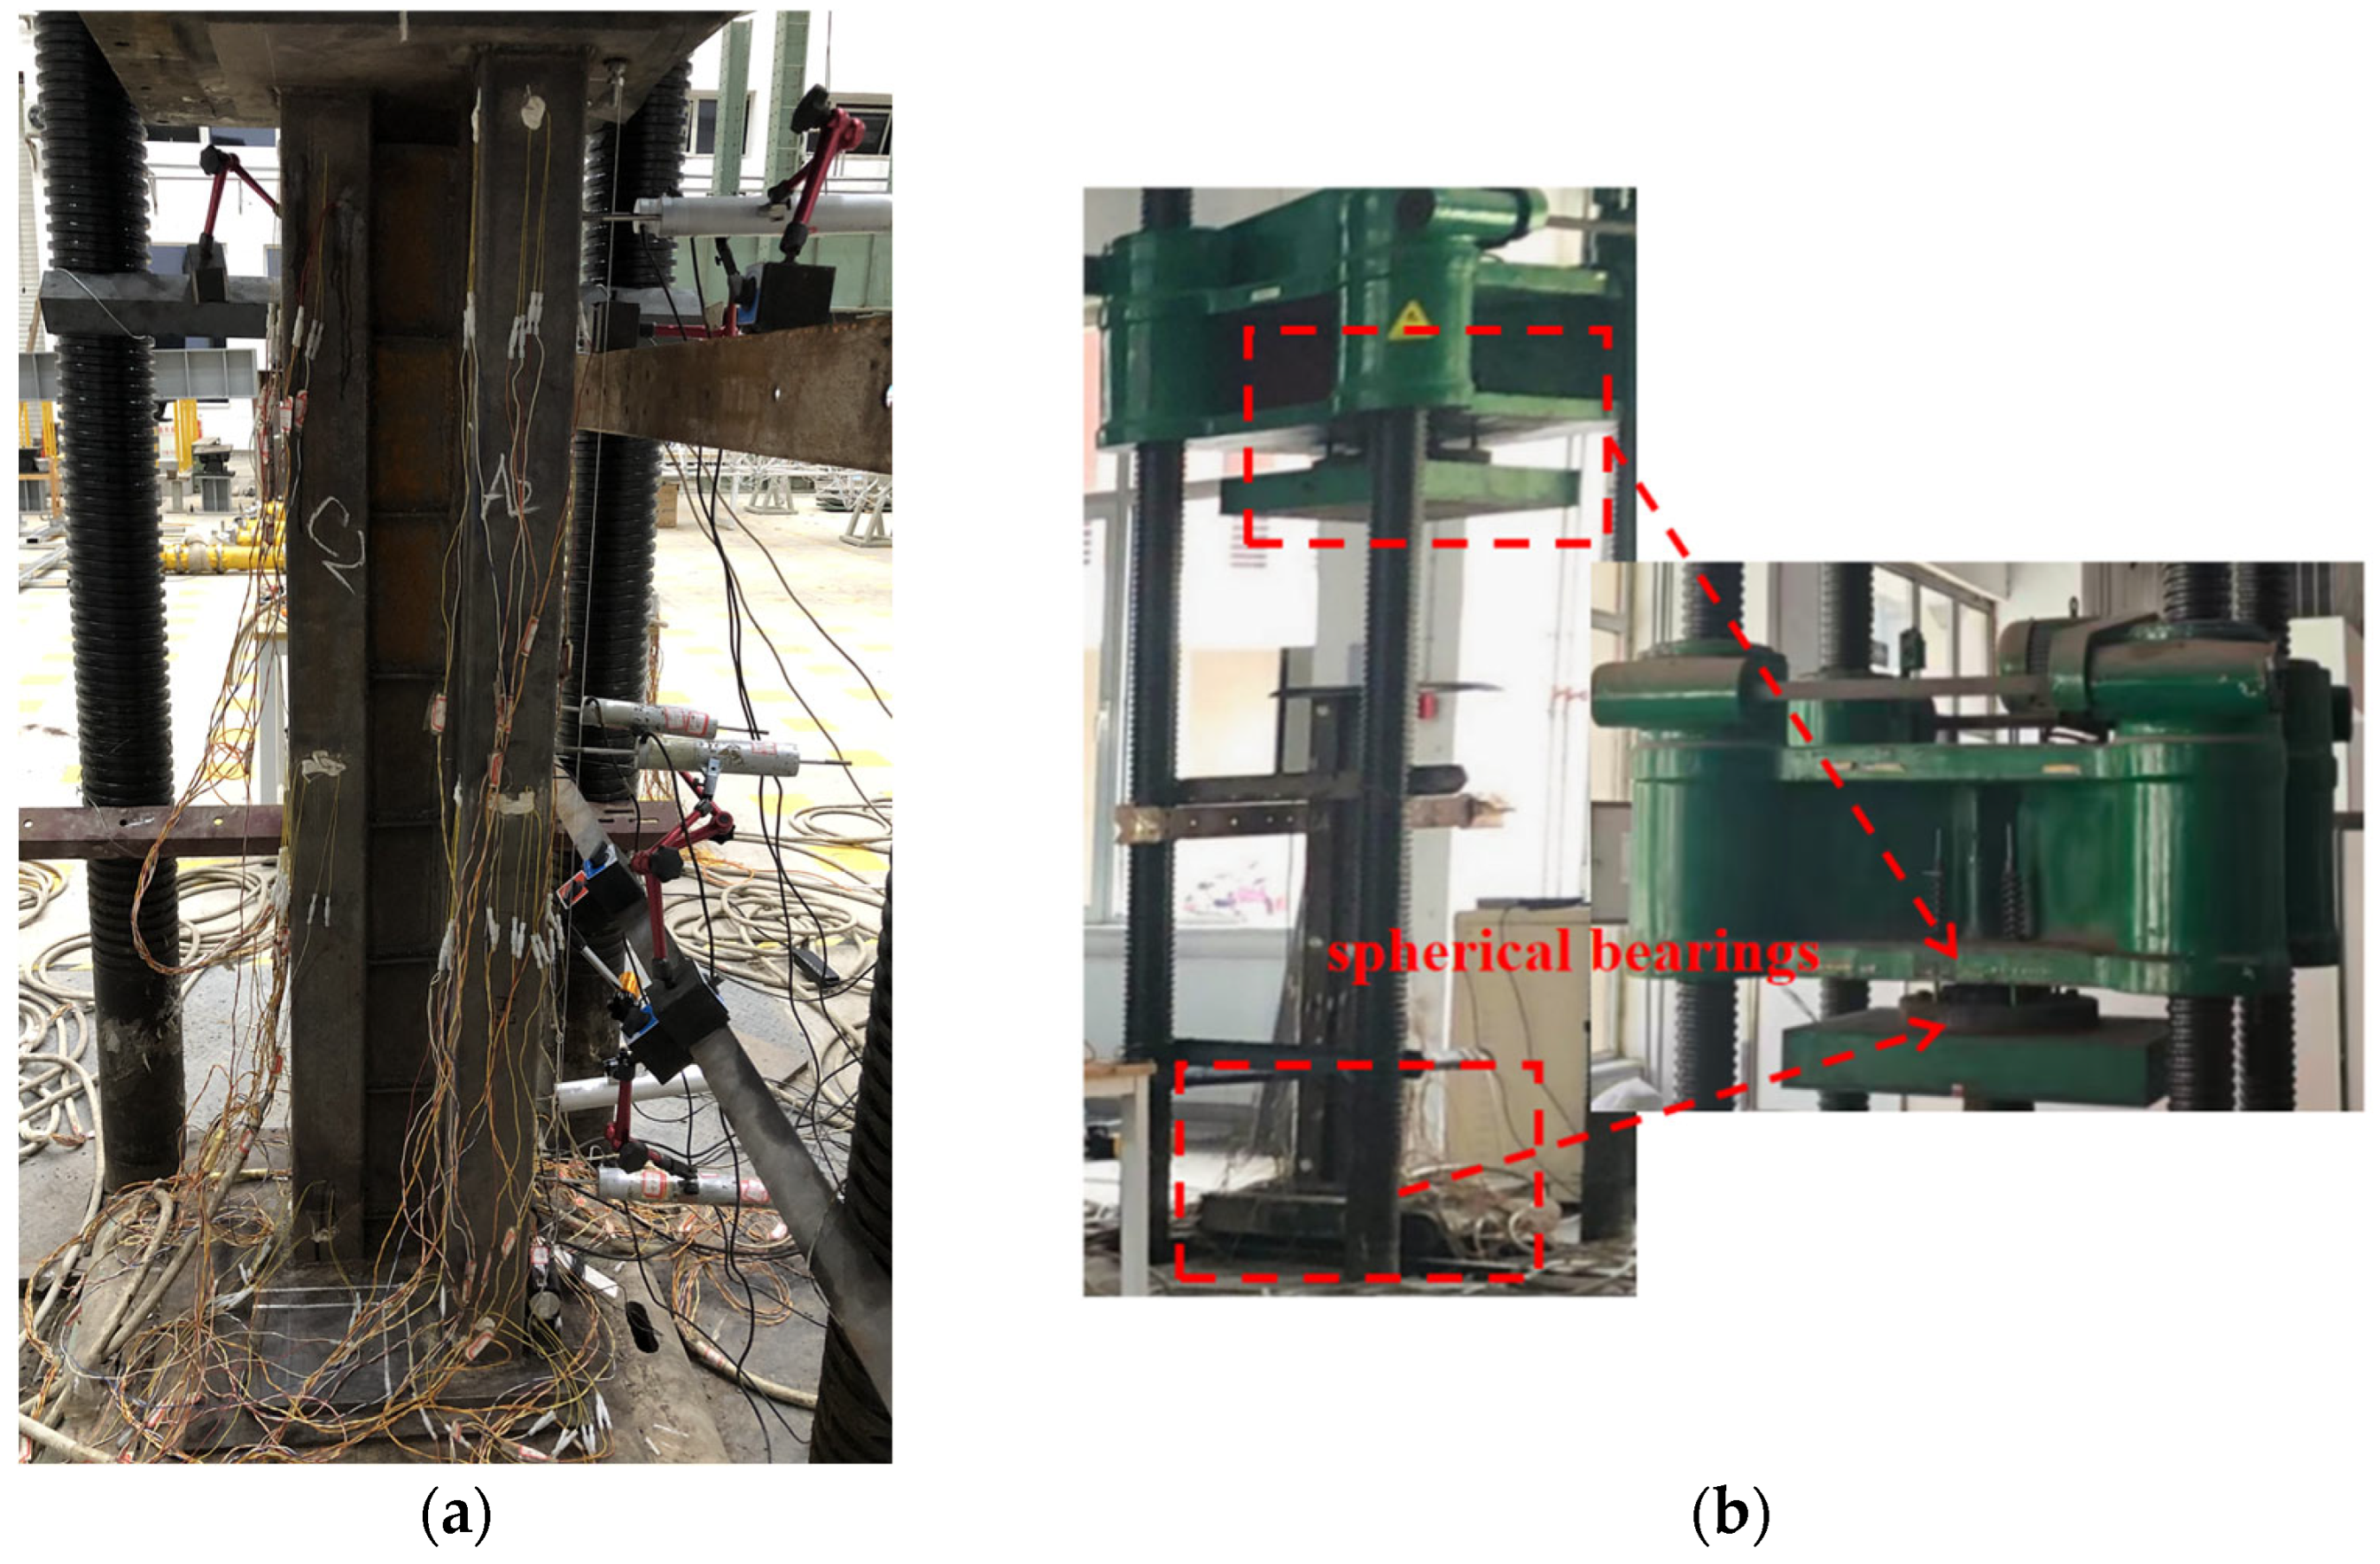
Compression tests on the L-RACFST were conducted using a 500 T electro-hydraulic servo pressure testing machine (Jilin guanteng Automation Technology Co., Ltd., Jilin, China), as shown in Figure 5. The loading point of the test specimen is aligned with the center of the testing machine’s loading plate. Spherical bearings at both ends of the testing machine provide a hinged boundary condition, allowing for rotational freedom, as shown in Figure 5b. Loading procedure: (1) During the preloading phase, a 200 kN load is applied in two stages to verify that the instrument is operating normally; (2) prior to the onset of a decline in bearing capacity, load control shall be employed, with loading conducted in stages of 200 kN each; (3) once the load begins to decrease, the procedure switches to displacement loading, applying 2 mm of displacement per step until the specimen fails. The duration of each load step, for both preloading and main loading, is 5–10 min.
Figure 5.
Experimental equipment. (a) Test specimen; (b) spherical bearings.
2.3. Experimental Phenomena
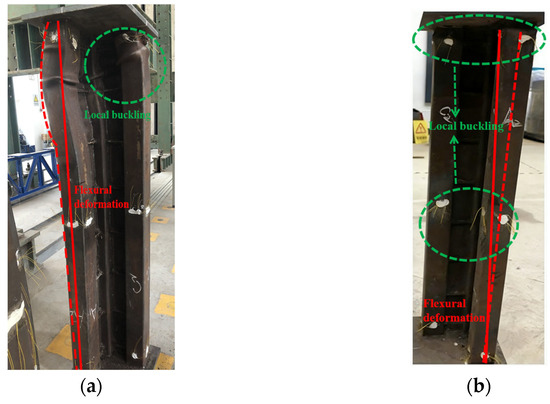
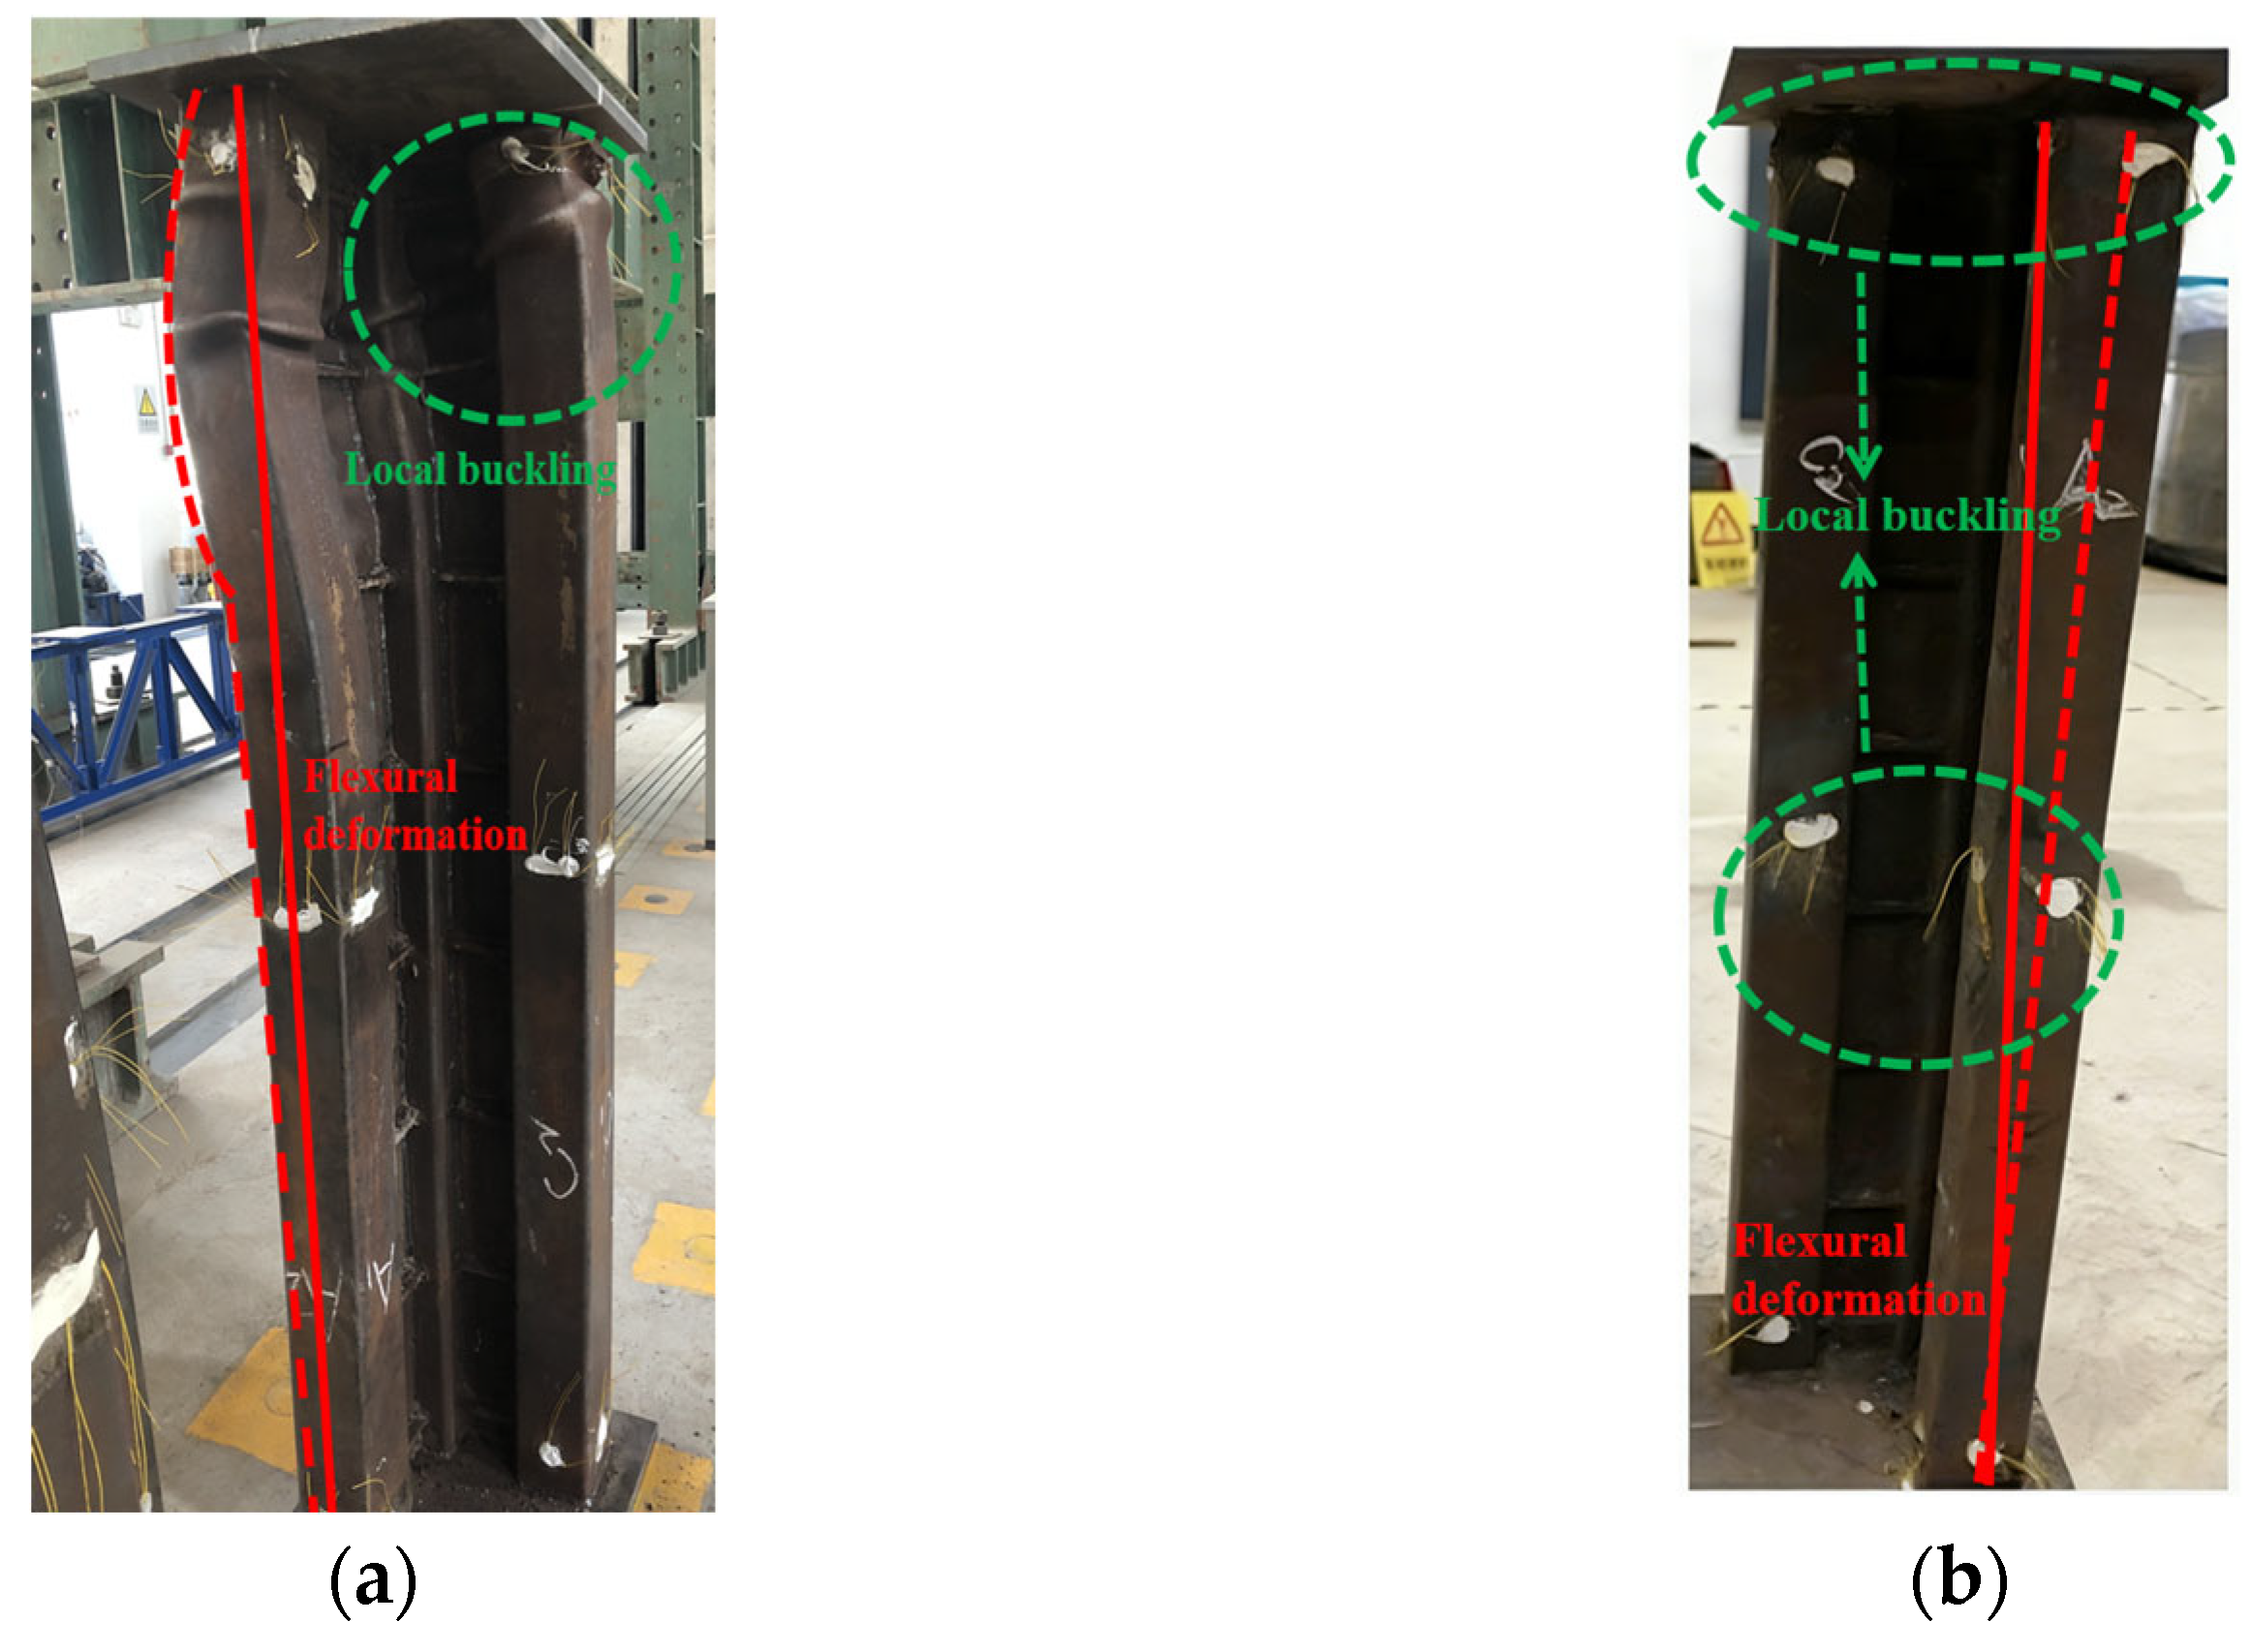
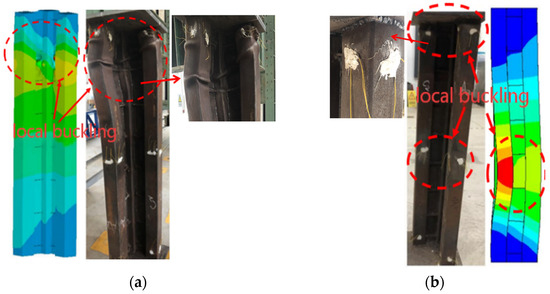
During the axial compression test of the L-RACFST, as the load was applied at the center of gravity according to the loading plan, a cracking sound was heard from the RAC, and the RAC failed; out-of-plane bending deformation had occurred at the top of Column A, and localized buckling had occurred at the base of the single-leg column; Column C exhibited in-plane bending deformation, with tensile bulging at the connection surface with the gusset plate, possibly caused by an initial bending defect in the steel pipe of Column C. Wrinkling is observed on all gusset plates, while the stiffeners show no significant deformation on their own, as shown in Figure 6a.
Figure 6.
Post-test condition. (a) Axial load; (b) eccentric load.
The same load was applied at a loading point 80 mm from the center of the shape. Initially, columns A and C exhibited out-of-plane bending, while Column B showed no significant deformation. As the load was applied, columns A and C exhibited pronounced out-of-plane bending, with local buckling at the top. Column B bent along with the entire specimen, but no local buckling was observed. This may be due to insufficient compaction of the concrete at the top of the column, resulting in low local compressive strength at the column head. At the end of the test, the specimen exhibited overall bending toward the inner side of the column near the top, as shown in Figure 6b.
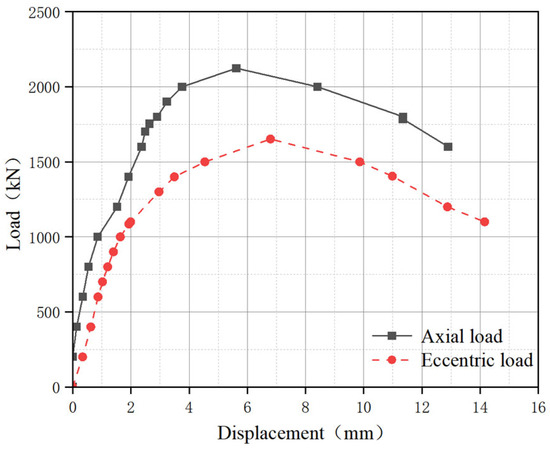
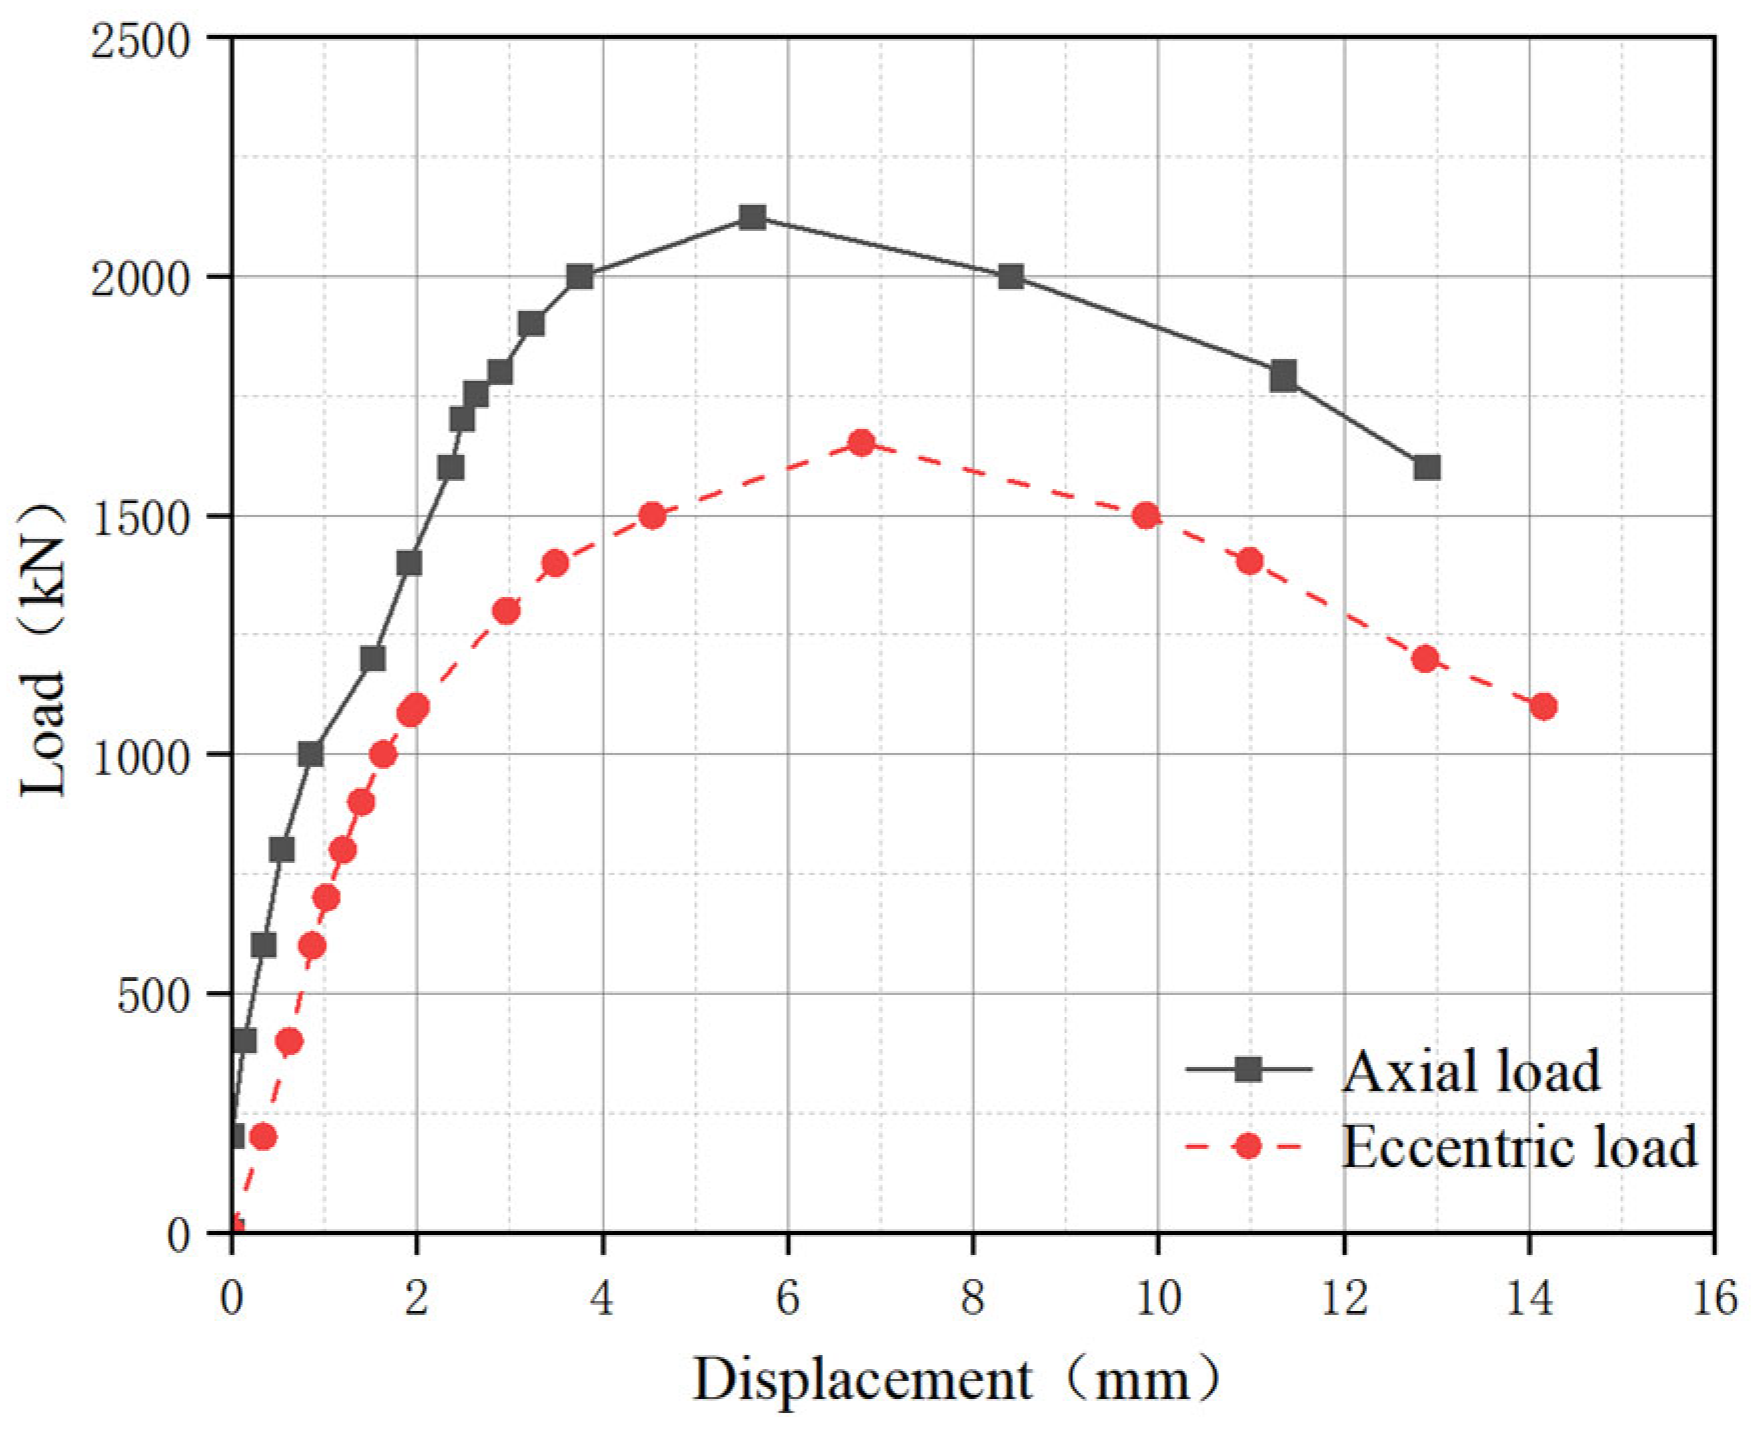
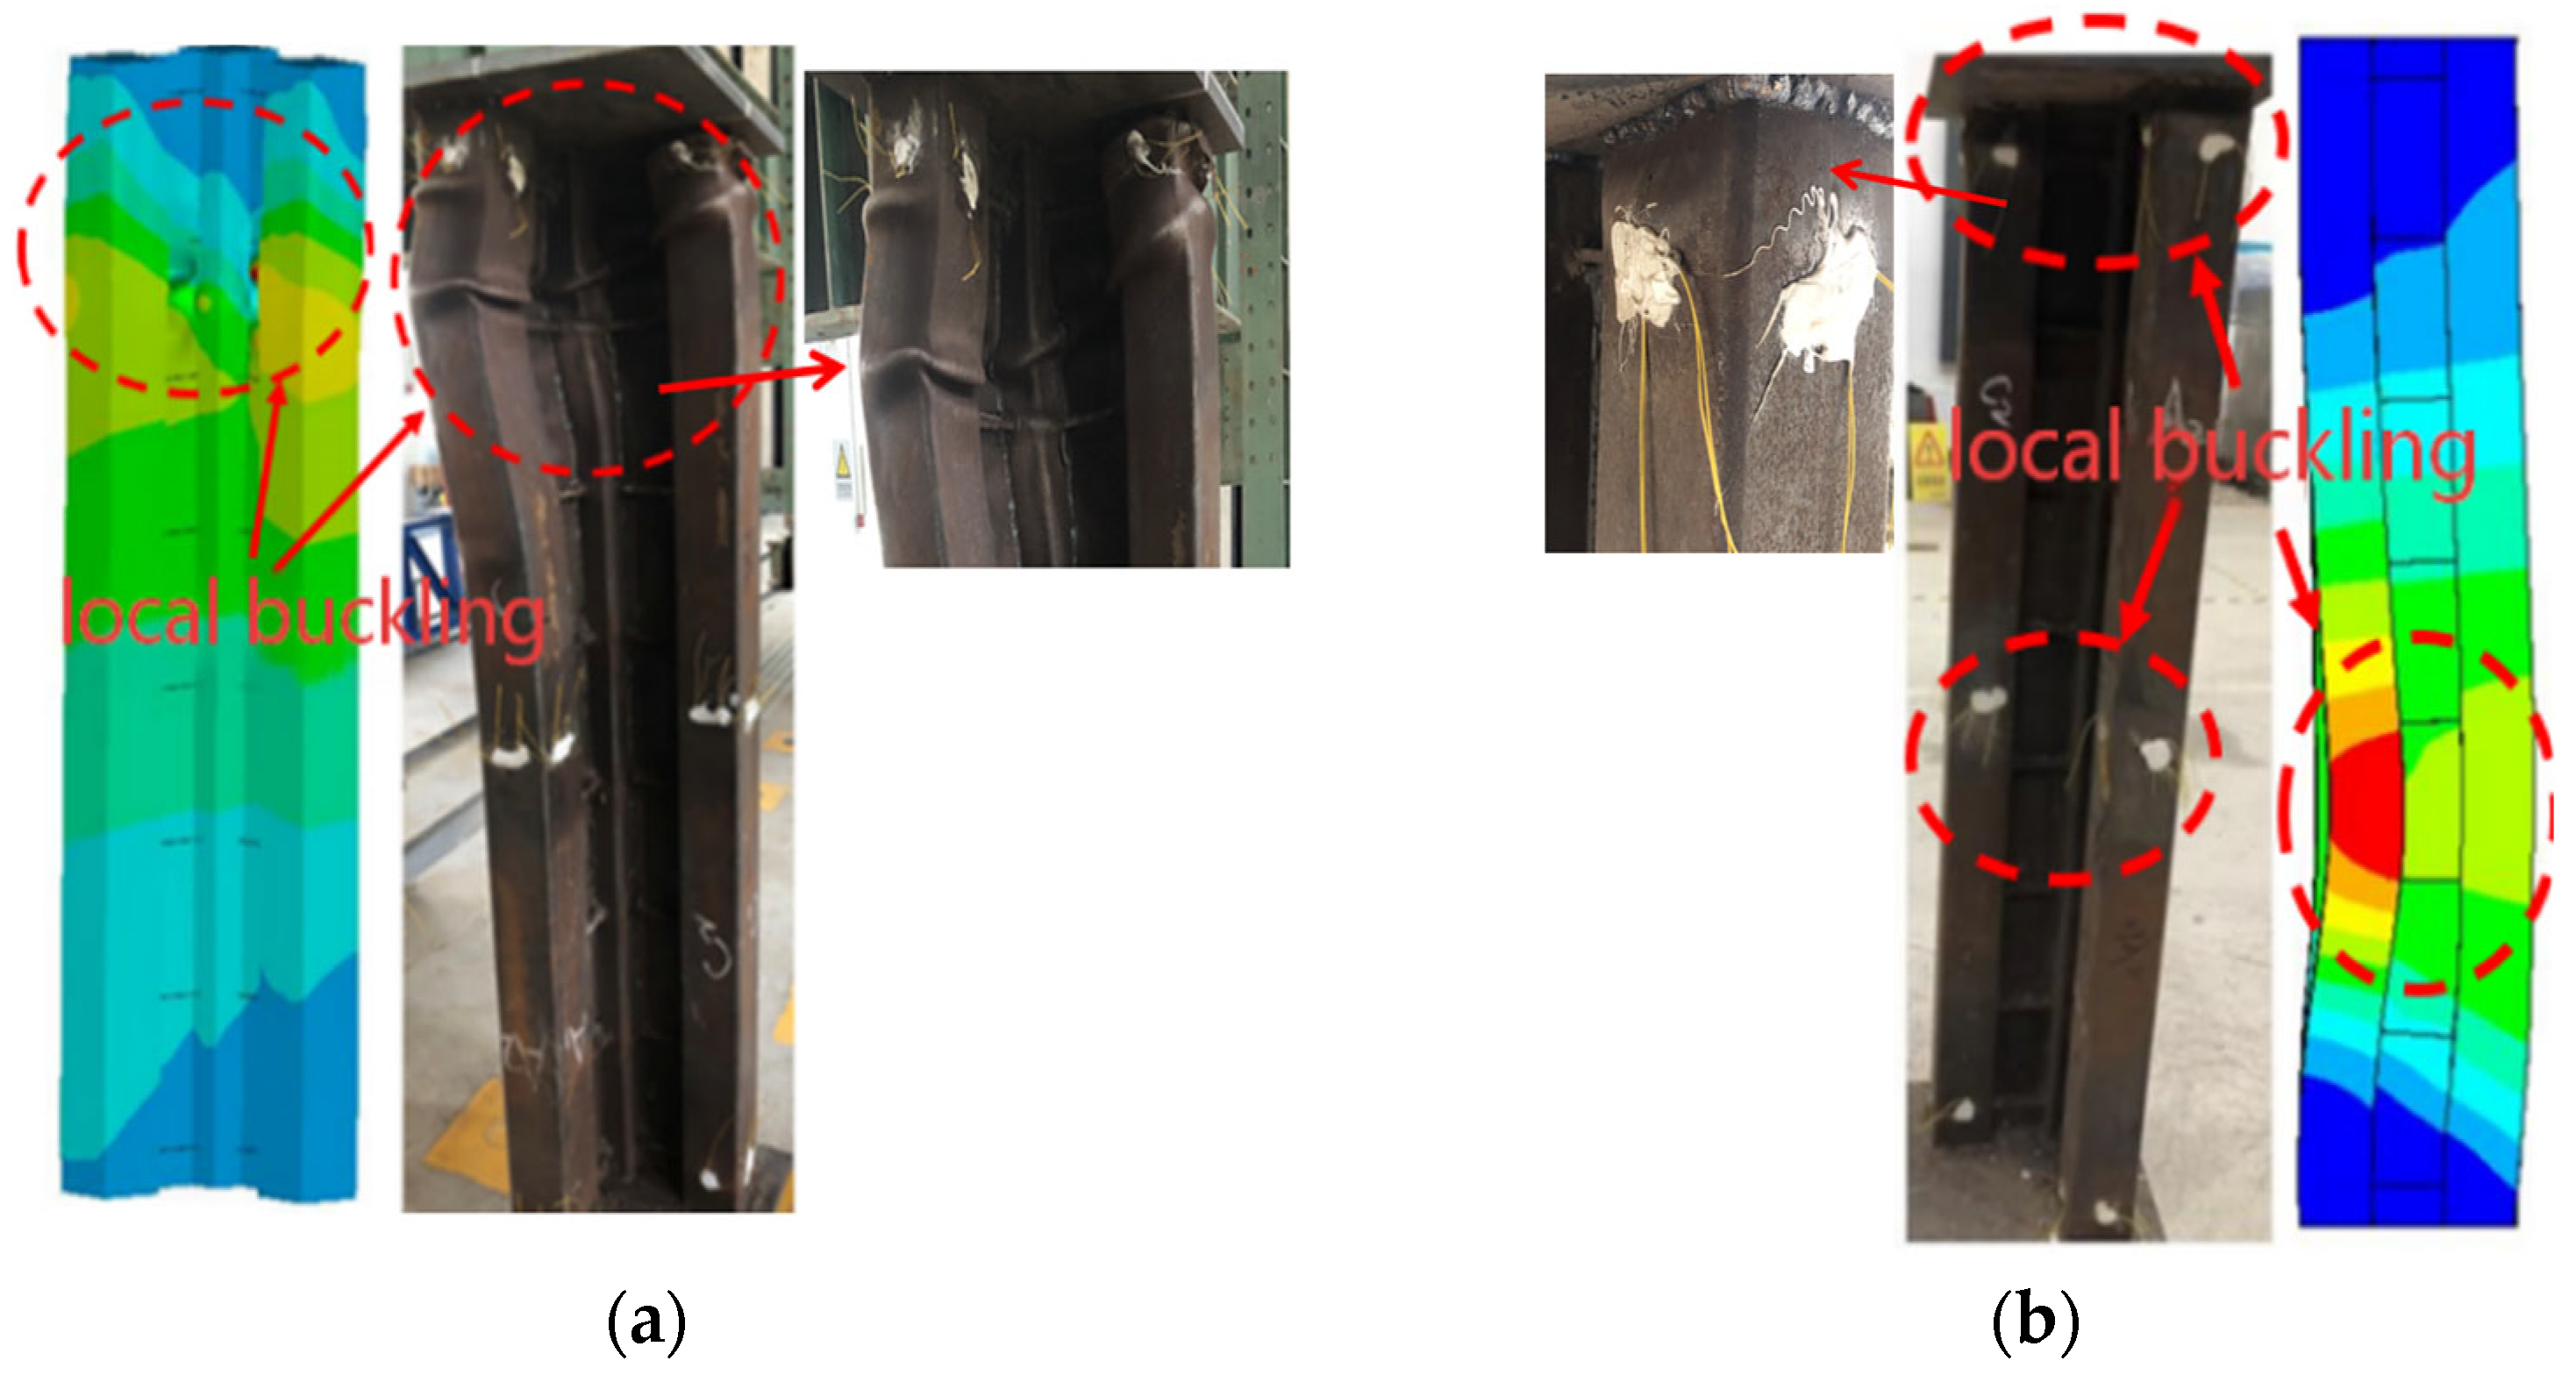
The load–displacement curve was obtained through experiments to provide a basis for verifying the reliability of the finite element model, as shown in Figure 7.
Figure 7.
Load–displacement curve.
3. Finite Element Model
3.1. Establishment of Finite Element Model
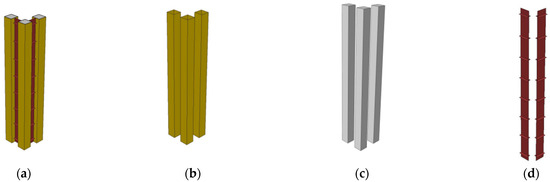
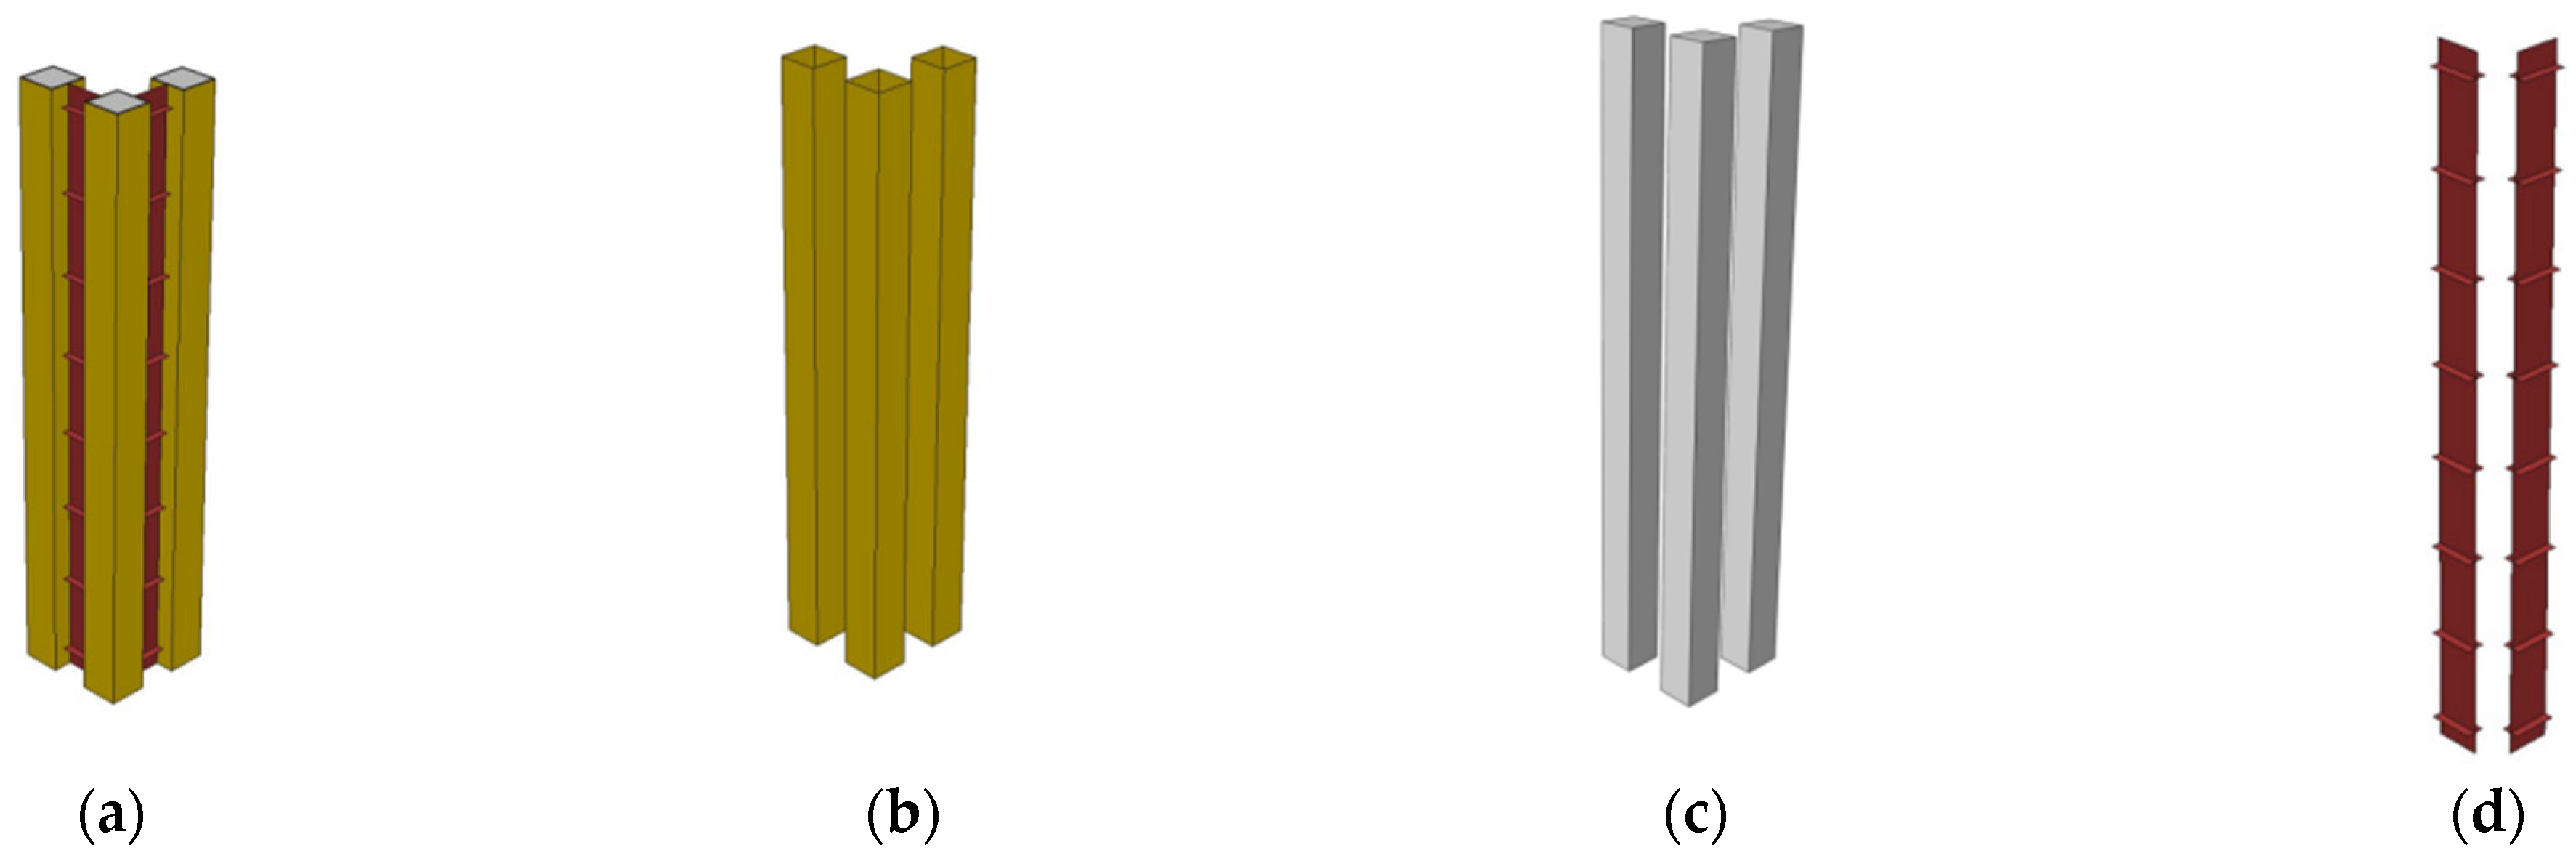
The L-RACFST consists of RAC, square steel tubes, connecting plates, and stiffeners, and was analyzed using ANSYS (18.2) simulation software. The RAC structure is modeled using the SOLID65 solid element, while the steel pipes, stiffeners, and connecting plates are modeled using the SHELL181 finite-strain shell element. The contact between the steel pipe and the RAC is of the face-to-face type [33,34]. In this numerical model, the side of the RAC is treated as a rigid surface and simulated with the TARGE170 contact element, while the side of the square steel tube is treated as a flexible surface and simulated with the CONTA173 contact element. In the numerical simulation, the grid is divided into units of 0.01 m.
It should be noted that there are discrepancies between the contact behavior observed in numerical simulations and that observed in actual experiments. The numerical simulation and experimental boundary conditions are consistent. During axial and eccentric load experiments, the L-RACFST is hinged at both ends; therefore, during numerical simulation, the translational degrees of freedom in the X, Y, and Z directions are constrained at all nodes at the base of the column. Under axial compression, the center of gravity of the node serves as the point of application for the axial load, while the point of application for the eccentric load is located 80 mm from this point.
The finite element numerical model is shown in Figure 8. The load application locations are shown in Figure 3.
Figure 8.
Finite element model. (a) Overall model; (b) steel tube; (c) RAC; (d) connection plate.
3.2. Material Constitutive Models
The RAC constitutive model used in this paper is based on the constitutive relations for steel-pipe RAC proposed by Du et al. [35]. The constitutive model is based on the RAC constitutive model of Yang [36] and Xiao et al. [37]. By introducing the coefficient , which is related to the RAC replacement rate, and the coefficient , which is related to the type of fine aggregate, the peak strain and peak stress of the concrete were adjusted. The calculation formula for the RAC constraint on square steel tubes is as follows:
Remark 1.
denotes the peak compressive strain of concrete; represents the peak compressive stress; is the cubic compressive strength of concrete; is the adjustment coefficient for the type of fine aggregate; and indicates the replacement ratio of recycled coarse aggregate. In this study, since only recycled coarse aggregate was used in the concrete mix and recycled fine aggregate was not considered, the fine aggregate adjustment coefficient was taken as 1.0, and the replacement ratio of recycled coarse aggregate was set to 40%.
The steel components, including the steel tubes, connecting plates, and stiffener ribs, were modeled using an idealized elastic–plastic constitutive model [33].
Remark 2.
, is the yield strength of steel.
3.3. Application of Initial Imperfections
In numerical simulations, the simulated experimental process assumes ideal conditions. Specifically, it is assumed that the steel pipe and the RAC are in full contact, that no residual stresses are generated in the steel during welding, and that the test specimen remains perfectly straight. However, during the actual fabrication, transportation, cutting, and welding of test specimens, initial defects such as residual stresses, initial bending, and insufficient filling between the RAC and the steel pipe are inevitably generated; moreover, these initial defects are inherent and cannot be ignored.
Therefore, in this study, during the nonlinear numerical simulation process, an eigenvalue buckling analysis is first performed, and the elastic deformation of one-thousandth of the result from the eigenvalue buckling analysis is used as the initial defect to consider the initial defects that arise in both ideal numerical simulations and actual experimental processes.
4. Model Validation
4.1. Comparative Analysis of Failure Modes
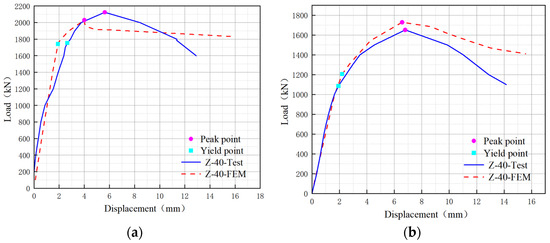
A comparison of the numerical simulation results with experimentally observed failure modes revealed that the simulation results were similar to the observed failure modes.
As shown in Figure 9a, under axial loading, both the numerical simulation and the test specimens exhibited out-of-plane bending. Furthermore, all specimens experienced local buckling in the lower to middle sections of the edge columns, with similar bending magnitudes and consistent bending directions.
Figure 9.
Comparative analysis of failure modes. (a) Axial load; (b) eccentric load.
As shown in Figure 9b, under eccentric loading, the failure modes of the two structures are similar: both specimens exhibit lantern-shaped deformation at the top, and the locations of local buckling at the top of the connecting plate and on the single-leg steel tube are similar, as are the deformations.
4.2. Comparison of Load–Displacement Curves
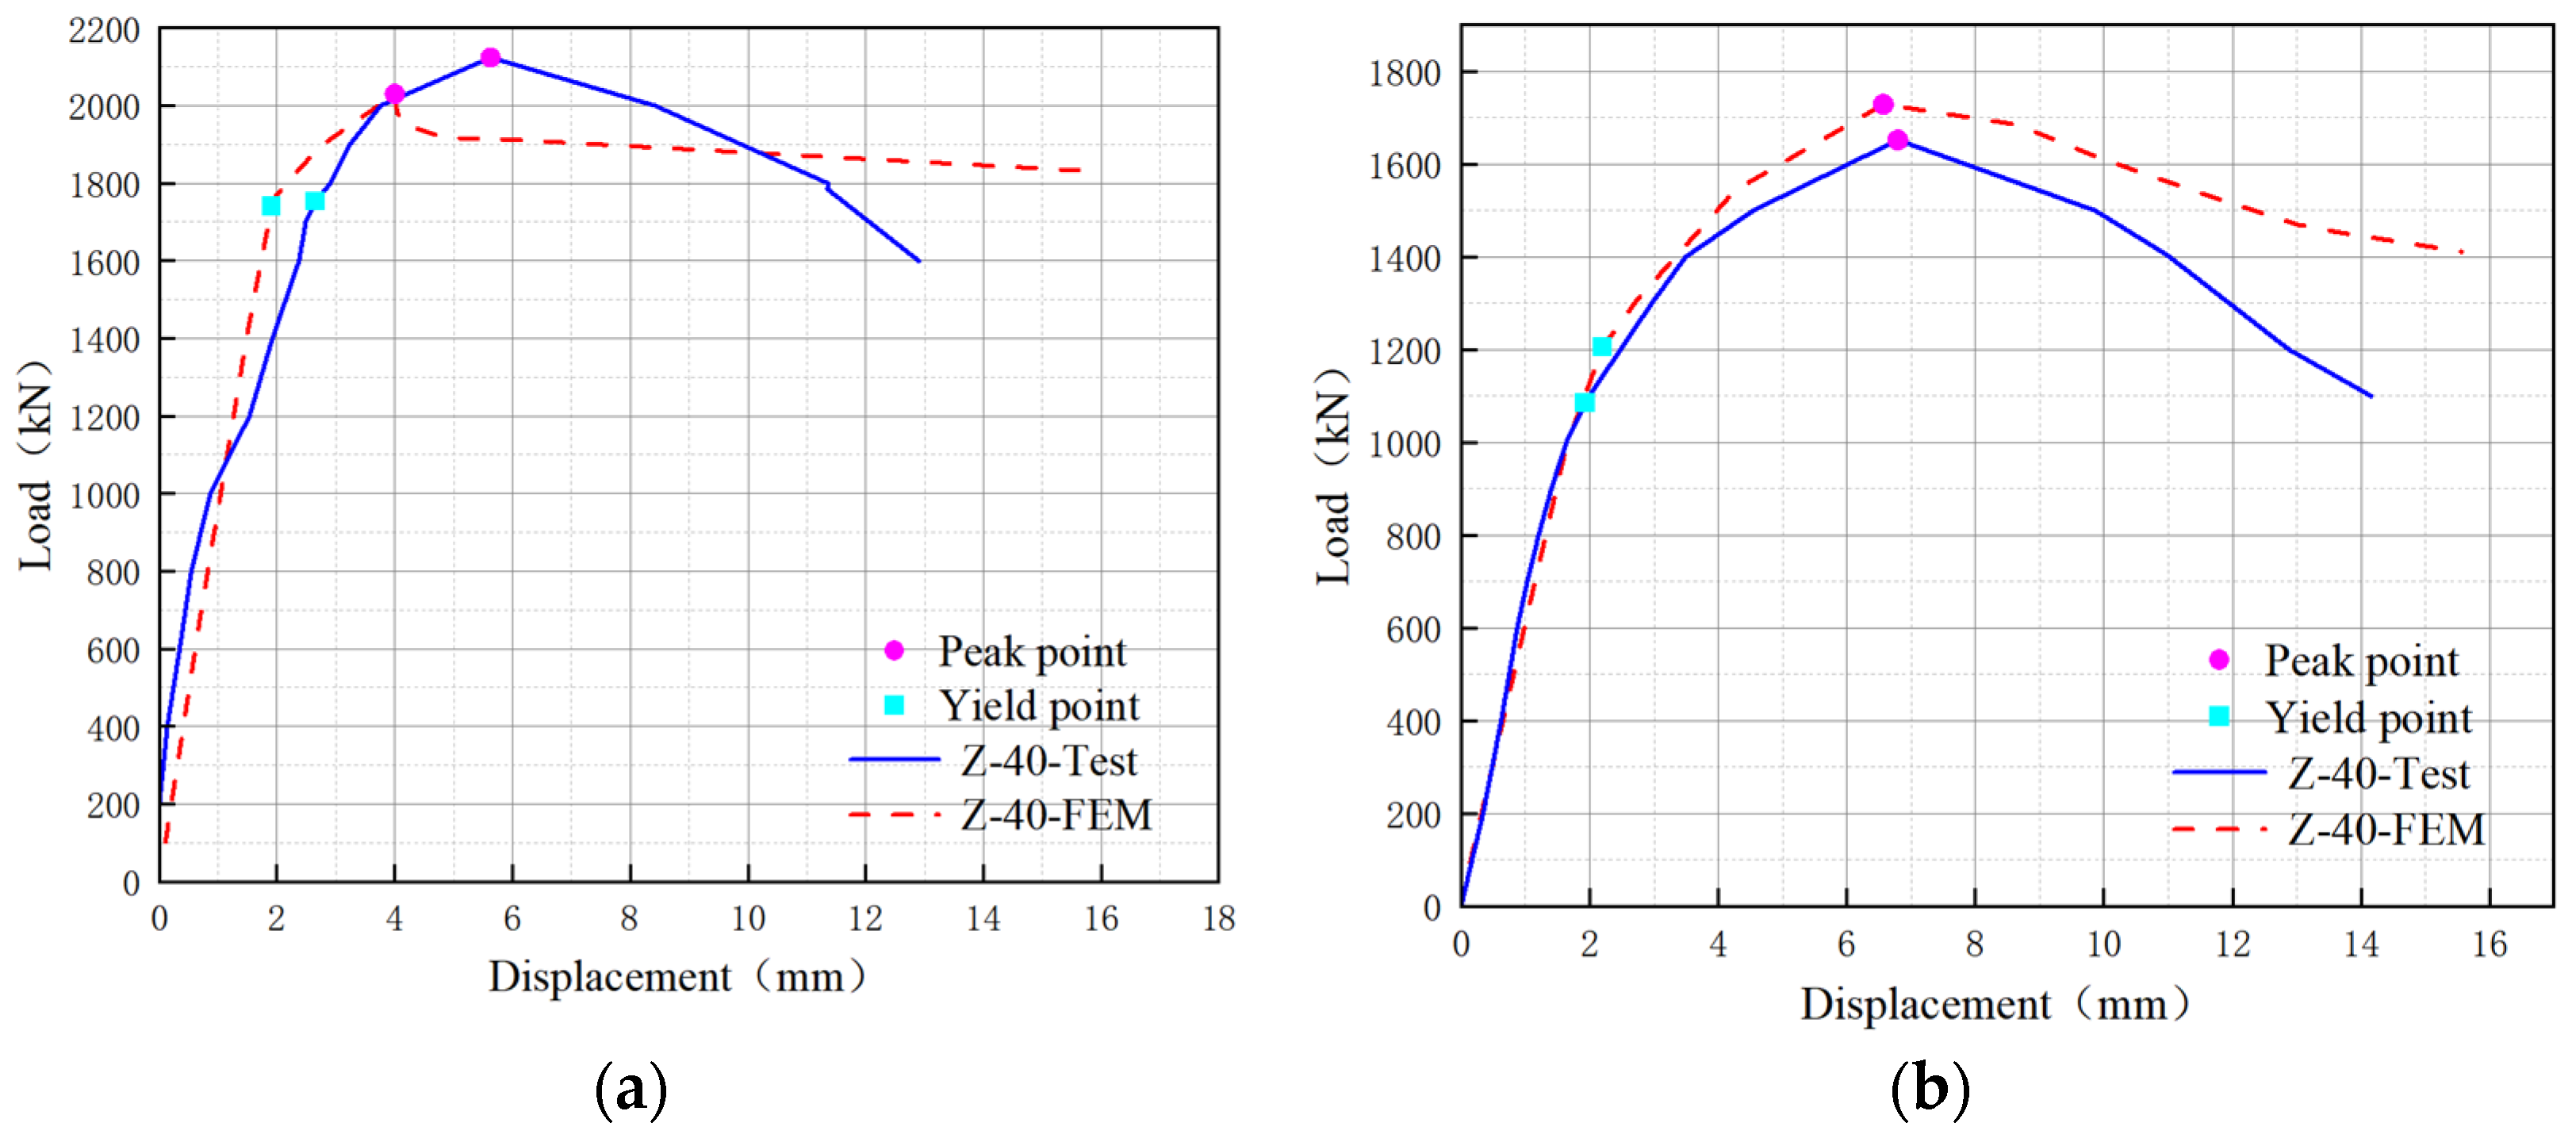
The experimental and finite element numerical simulations of the bearing capacity are listed in Table 3, and the load–displacement curves are shown in Figure 10. As shown in Figure 10, the experimental and numerical simulation load–displacement curves exhibit similar deformation trends. During the initial stage of loading, the specimen undergoes elastic deformation, and the slopes of the two curves are similar. This indicates that the stiffness of the experimental specimens is similar to that of the numerical simulation specimens.
Table 3.
Test and FEM data.
Figure 10.
Load–displacement curve. (a) Axial load; (b) eccentric load.
Under axial loading, as the load increases, the specimen enters the elastic–plastic deformation stage. At this point, plastic deformation occurs in the specimen, but it has not yet reached its ultimate strength, meaning it can still bear the load. As the load continues to increase, the specimen enters the plastic deformation stage, eventually failing. A comparison shows that the error in the yield load is 0.68%, while the error in the peak load is 4.43%.
Under an eccentric load, when the load reaches the yield load and continues to increase, the specimen enters the elastic–plastic deformation stage. At this point, the two curves follow similar trends but begin to diverge. This indicates that, as the specimen enters the elastic–plastic stage, any initial defects present in the specimen exert a certain influence on the experimental results, though this influence is relatively minor. As the load continued to increase, the specimen gradually entered the plastic deformation stage until failure. At this point, the two curves remained similar in shape but showed a greater divergence than in the previous segment. This indicates that once the specimen entered the elastic–plastic stage, the initial defects in the test specimen had a significant impact on its strength and overall stability. The yield load and peak load obtained from the numerical simulation in this study were 9.96% and 4.45% higher, respectively, than those observed in the experiments.
The significant difference in yield loads is attributed to the fact that the boundary conditions in the finite element simulation are idealized, whereas those in the experiments are not perfectly rigid. This results in a certain deviation in stiffness during the elastic–plastic stage, which affects the yield strength.
In summary, the failure modes of the specimens under compression, simulated using the numerical method described in this paper, are consistent with the experimental results. The specimens exhibited similar stiffness and deformation behavior, and the errors in yield load and peak load were all within the permissible range; therefore, the finite element numerical simulation method employed in this study is effective for the parametric analysis of the specimens.
5. Parametric Study
5.1. Effect of Steel Yield Strength
In the experiment, the test specimens were made of Q235 steel; however, in actual engineering applications, high-strength structural steel is often used to increase the overall stiffness of the specimens. Increased steel strength improves the stiffness of steel pipes and connecting plates, thereby contributing to the overall stability and strength of the test specimen. This paper simulates the effects of the strength of various steel grades—Q235, Q355, Q390, Q420, and Q460—on the axial and eccentric compression bearing capacities of test specimens.
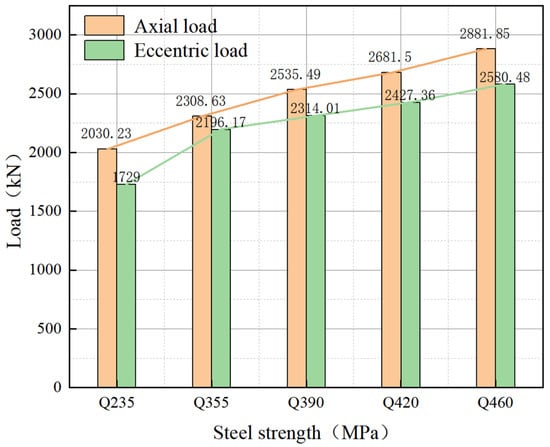
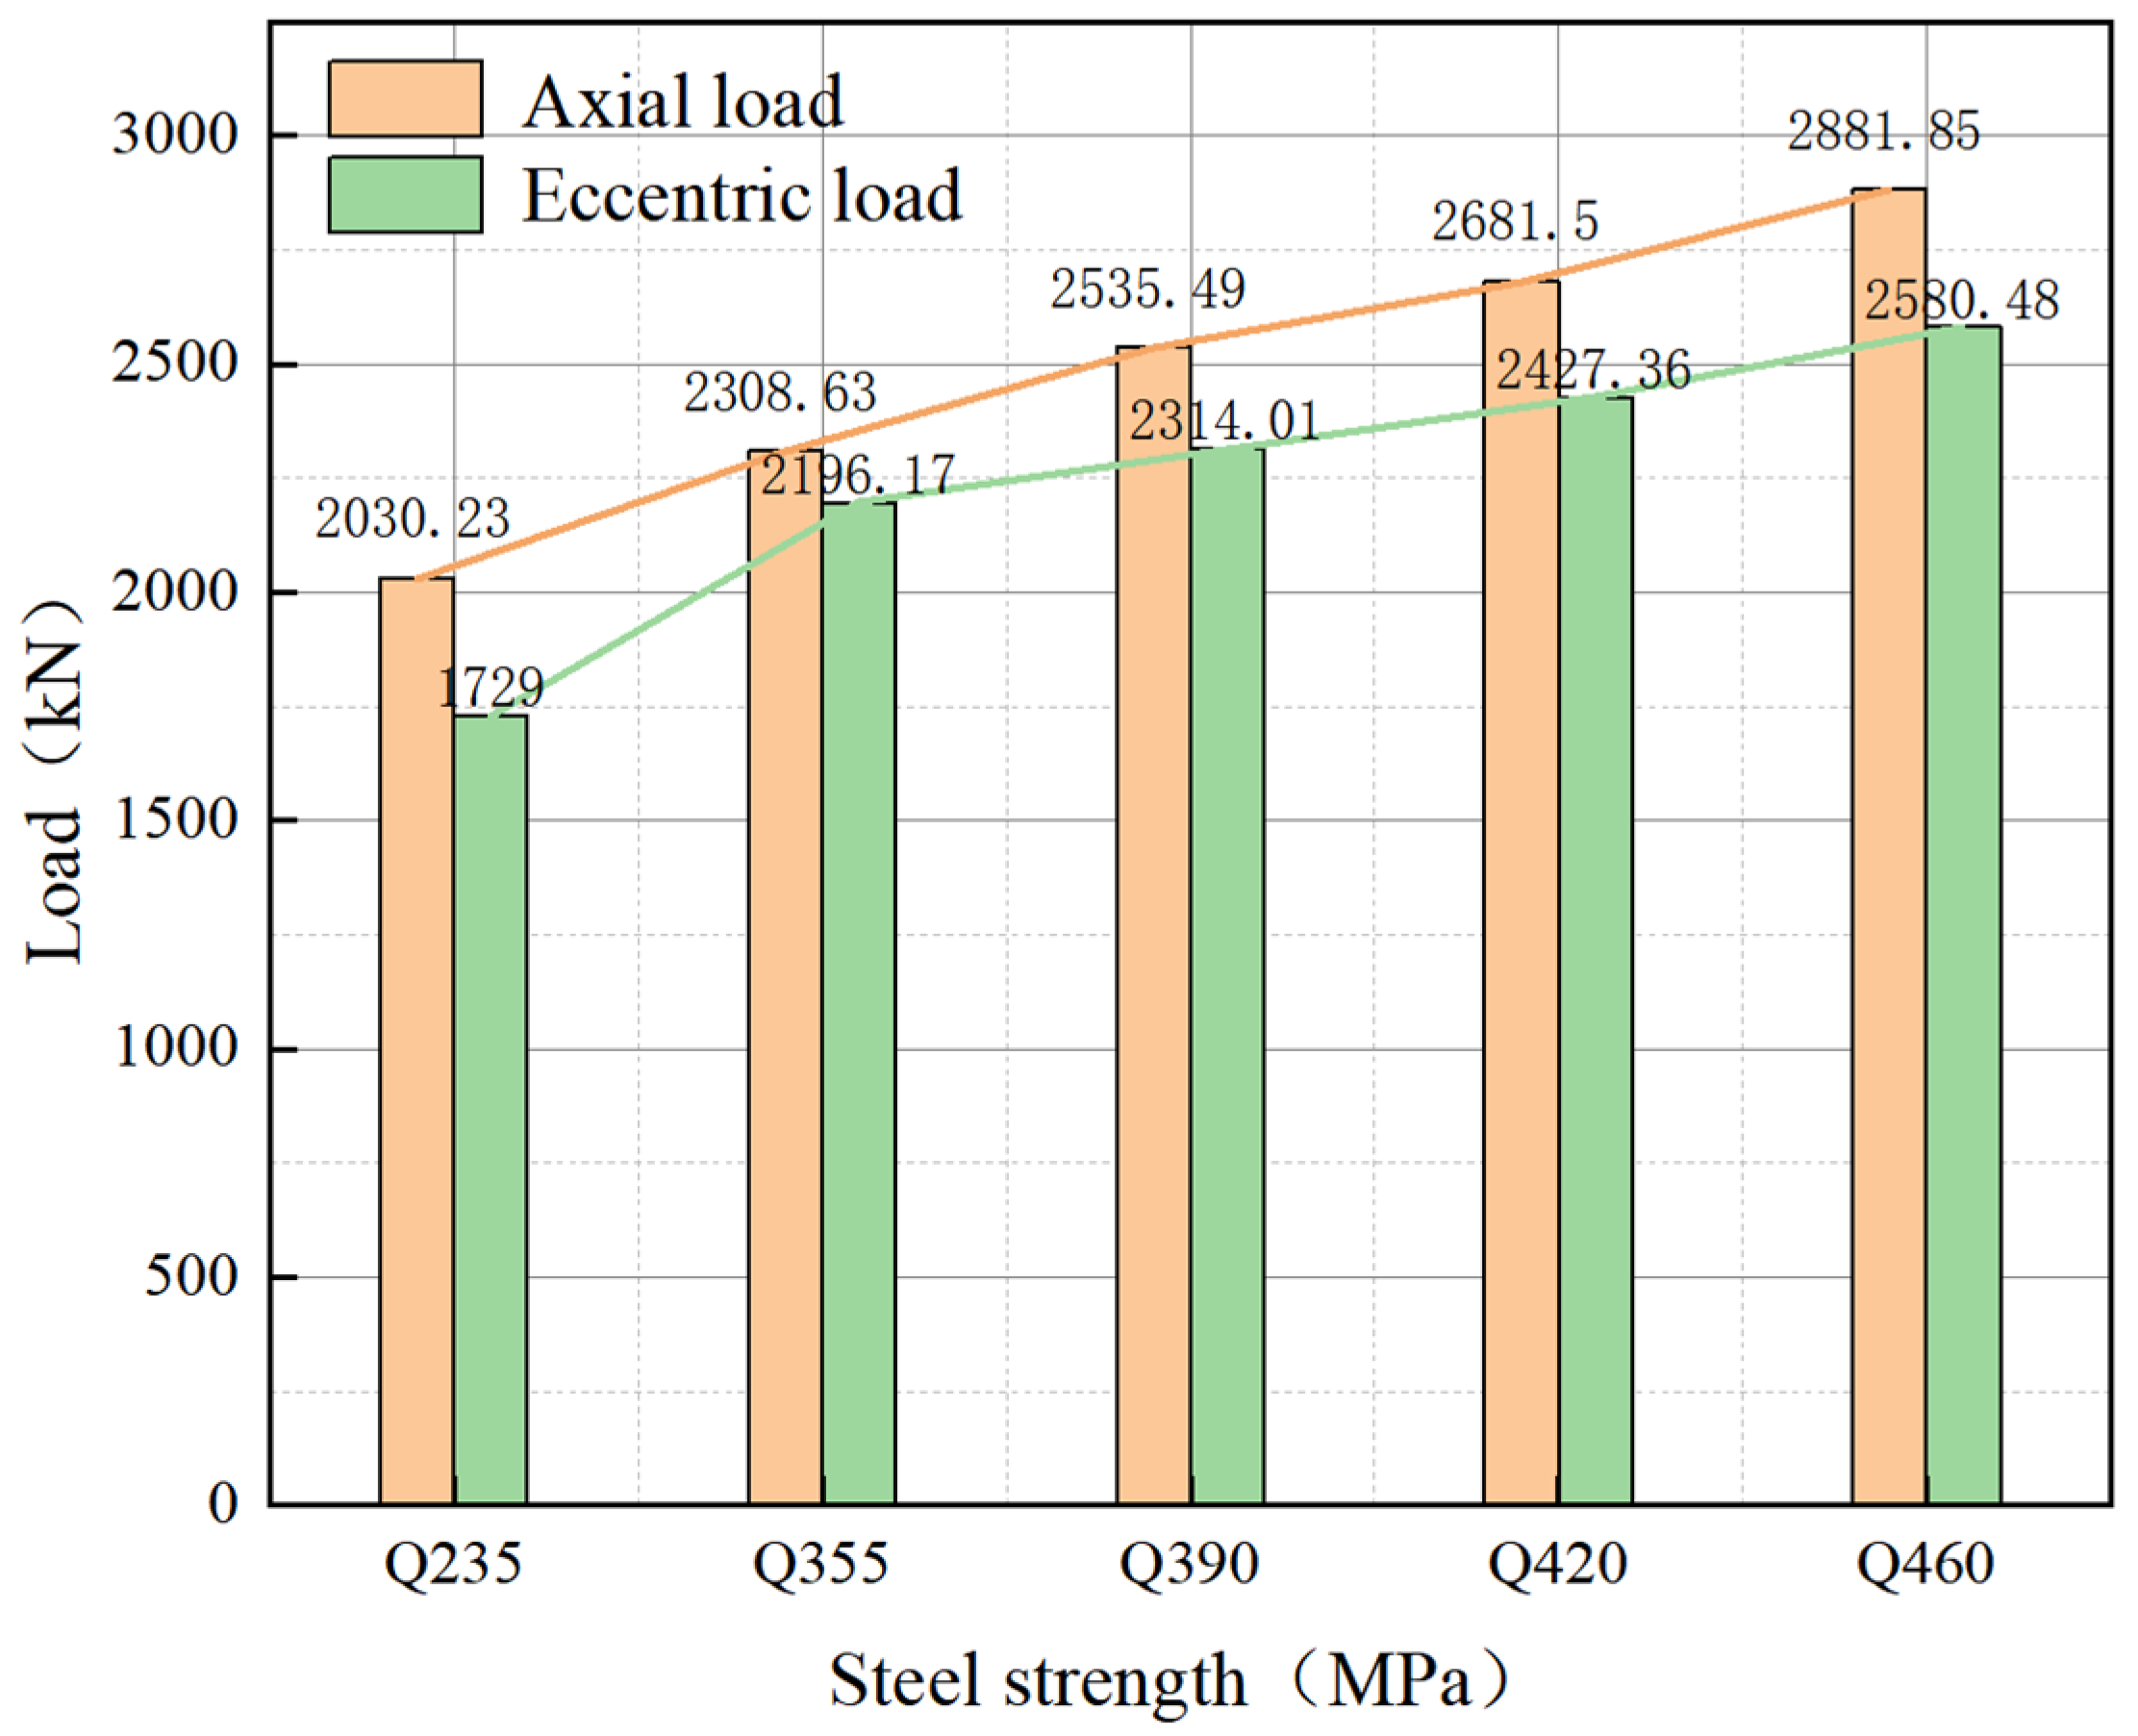
Based on the five steel strength grades considered in this paper, under axial compression, a one-grade increase in steel strength results in an approximately 10% increase in the specimen’s peak bearing capacity. However, the increase in the specimen’s eccentric bearing capacity with rising steel strength is nonlinear; when the steel strength increases from Q235 to Q355, the maximum increase in the specimen’s eccentric bearing capacity is 27.01%. As shown in Figure 11, the peak loading capacity of the test specimens gradually increases with the increase in steel strength. For the same steel strength, the bearing capacity of the L-RACFST under an eccentricity of 80 mm is lower than that under axial compression conditions. This indicates that the application of eccentricity reduces the beneficial effect of increased steel strength on bearing capacity.
Figure 11.
Load–steel strength curve.
In summary, as the strength of the steel increases, the compressive strength of the column cross-section and the confinement effect of the steel tube on the RAC are enhanced, improving the stiffness and stability of the specimen and thereby increasing its bearing capacity. Therefore, increasing the steel’s strength is one of the effective methods for improving the compressive bearing capacity of the test specimen. Given economic factors, it is recommended that the steel grade be specified as Q355 in engineering designs.
5.2. Effects of Square Steel Tube Width-to-Thickness Ratio
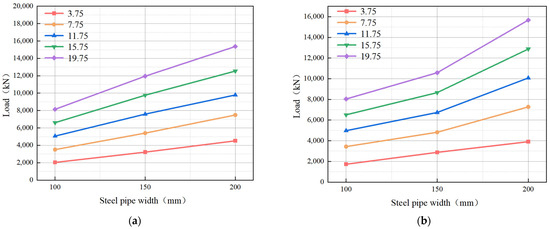
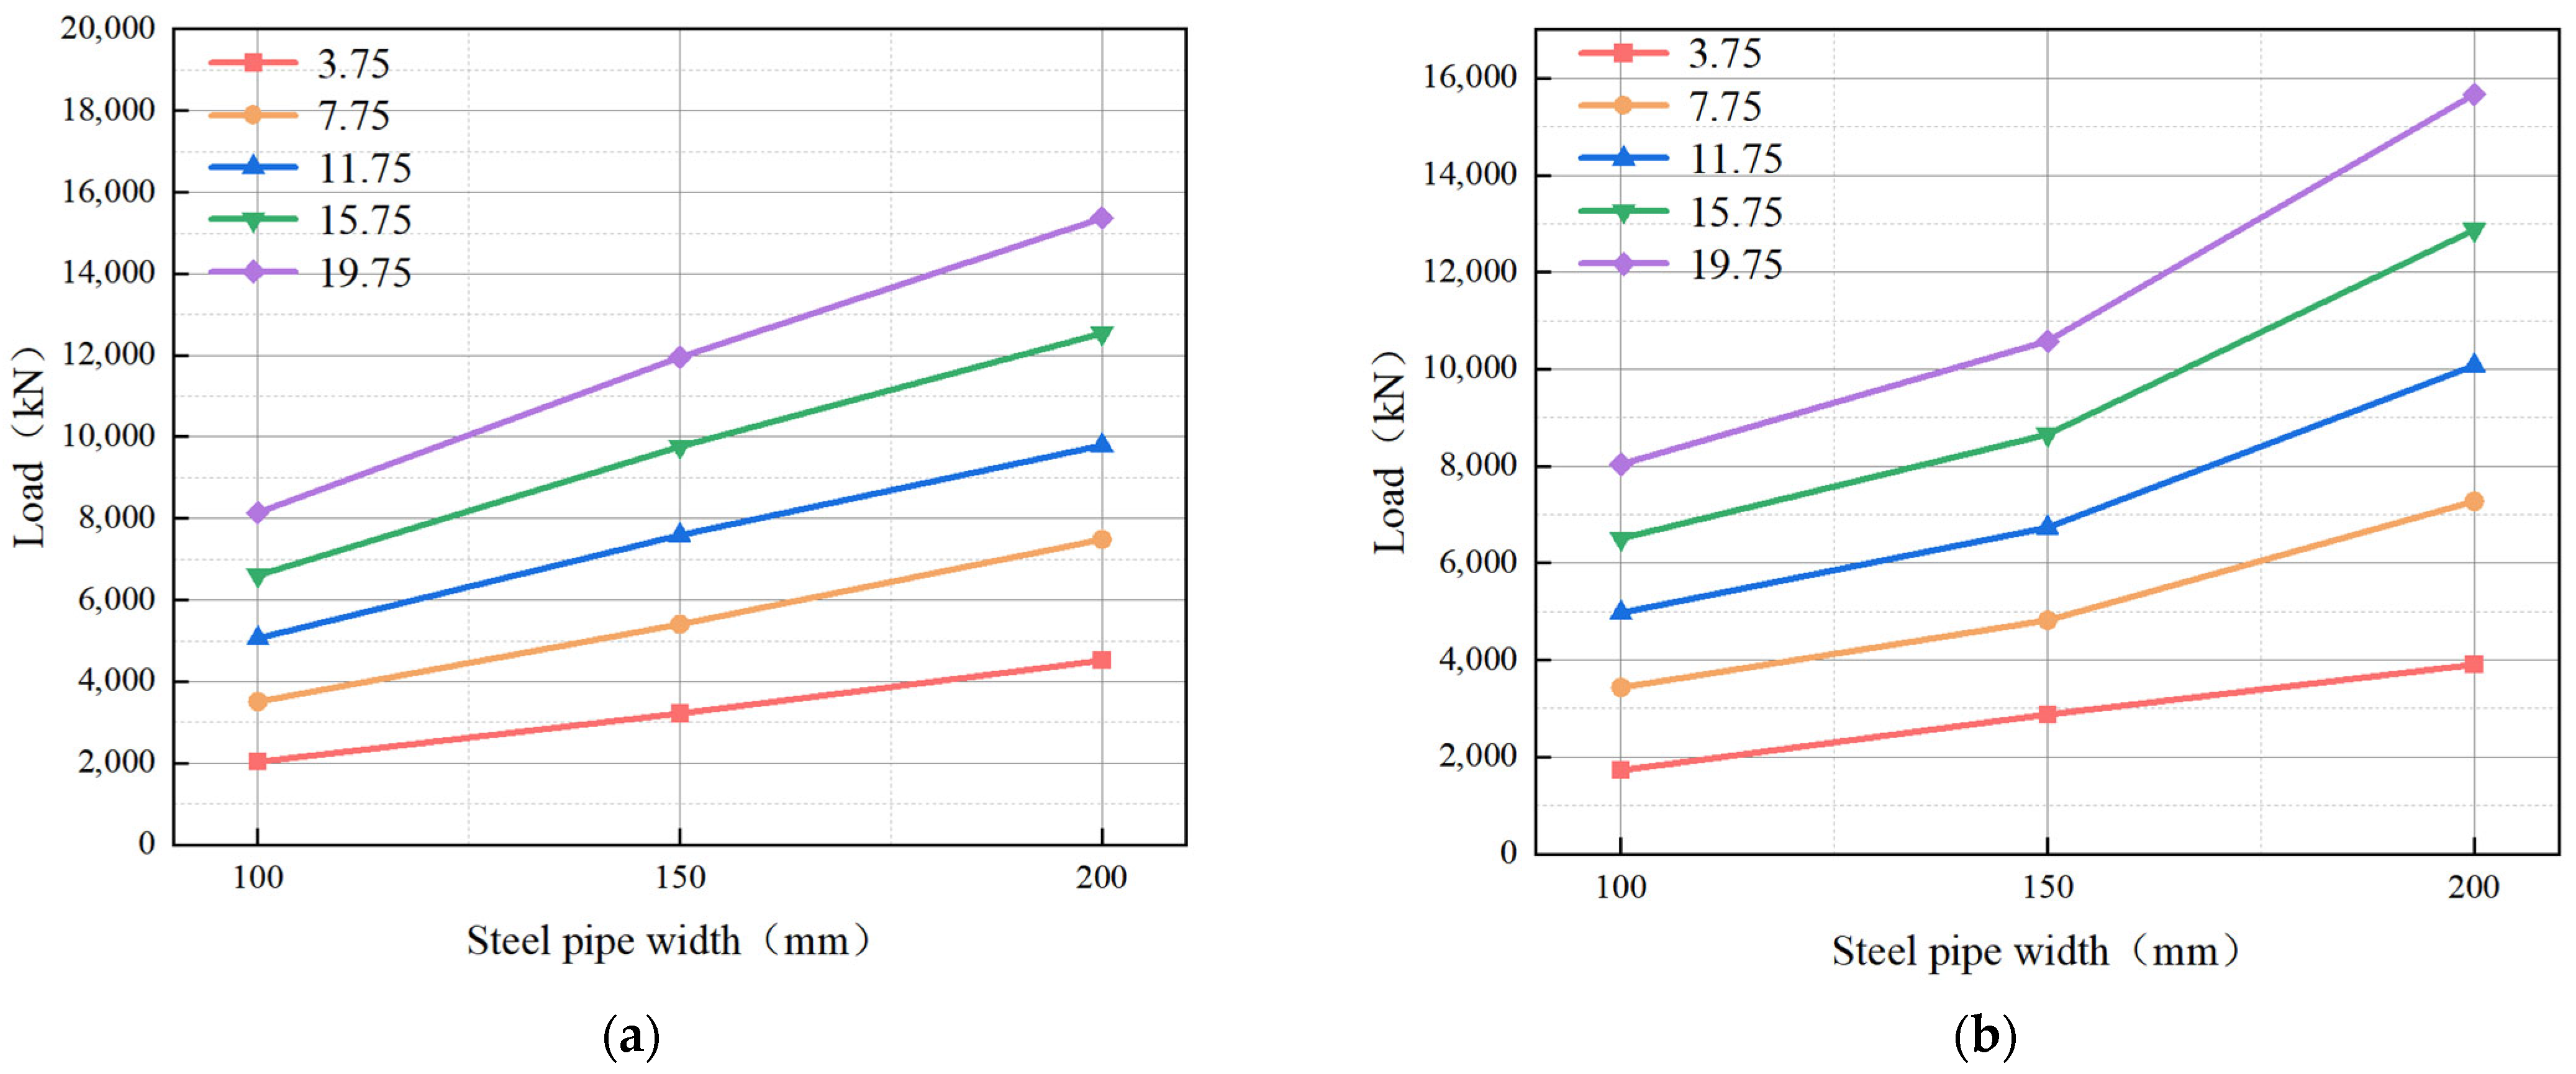
The width-to-thickness ratio of a square steel tube refers to the ratio of the width to the thickness of a single-leg steel tube in an L-RACFST. This study selected three square steel tube widths: 100 mm, 150 mm, and 200 mm. At the same time, considering that the width-to-thickness ratio of the square steel tube may affect its stability as the width increases, this study investigated the compressive mechanical properties of the test specimens at different square steel tube widths, with tube thicknesses of 3.75 mm, 7.75 mm, 11.75 mm, 15.75 mm, and 19.75 mm. Table 4 lists the bearing capacities of test specimens under different width-to-thickness ratios for square steel tubes, and Figure 12 shows the trend in these values.
Table 4.
Load statistics of specimens with different square tube width-to-thickness ratios.
Figure 12.
Load–steel pipe width curve. (a) Axial load; (b) eccentric load.
For three different steel tube widths, as the tube thickness increased in increments from 3.75 mm to 19.75 mm, the axial bearing capacity increased by approximately 70%, 40%, 30%, and 23% per increment, respectively. For eccentric loads, as the tube thickness increased from 7.75 mm to 19.75 mm, the increase per increment was similar to that observed for axial loads. For specimens of the same steel thickness, the axial and eccentric compressive strengths increased by averages of approximately 50% and 41%, respectively, when the steel tube width was increased from 100 mm to 150 mm; and by averages of approximately 35% and 47%, respectively, when the steel tube width was increased from 150 mm to 200 mm.
As shown in Figure 12, an increase in steel thickness results in a decrease in the width-to-thickness ratio. Changes in the width-to-thickness ratio alter the buckling behavior of a concrete-filled steel tube. However, this has little effect on the variation in bearing capacity. The reason is that, under axial loading, changes in the width-to-thickness ratio have no significant effect on overall stability; under eccentric loading, changes in the width-to-height ratio do not affect the overall stability of the single-leg column.
In summary, with the same steel thickness, the width of the steel tube is increased. Or in the case of the same steel tube width, increasing the thickness of the steel can improve the compressive bearing capacity of the specimen. This is because the increase in the thickness of the steel tube increases the compressive strength of the steel section. The constraint of the steel tube on RAC increases with the decrease in the width–thickness ratio. Therefore, in engineering design, this method can be used to improve the compressive bearing capacity of components. However, considering the influence of economic factors, the optimal width-to-thickness ratio of the components needs to be adopted.
5.3. Effect of the Connection Plate’s Width-to-Thickness Ratio
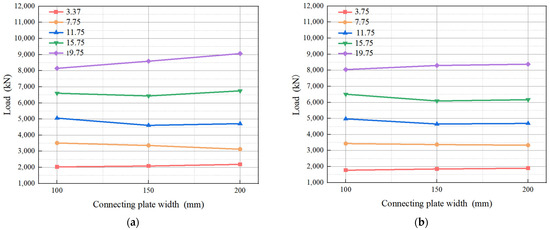
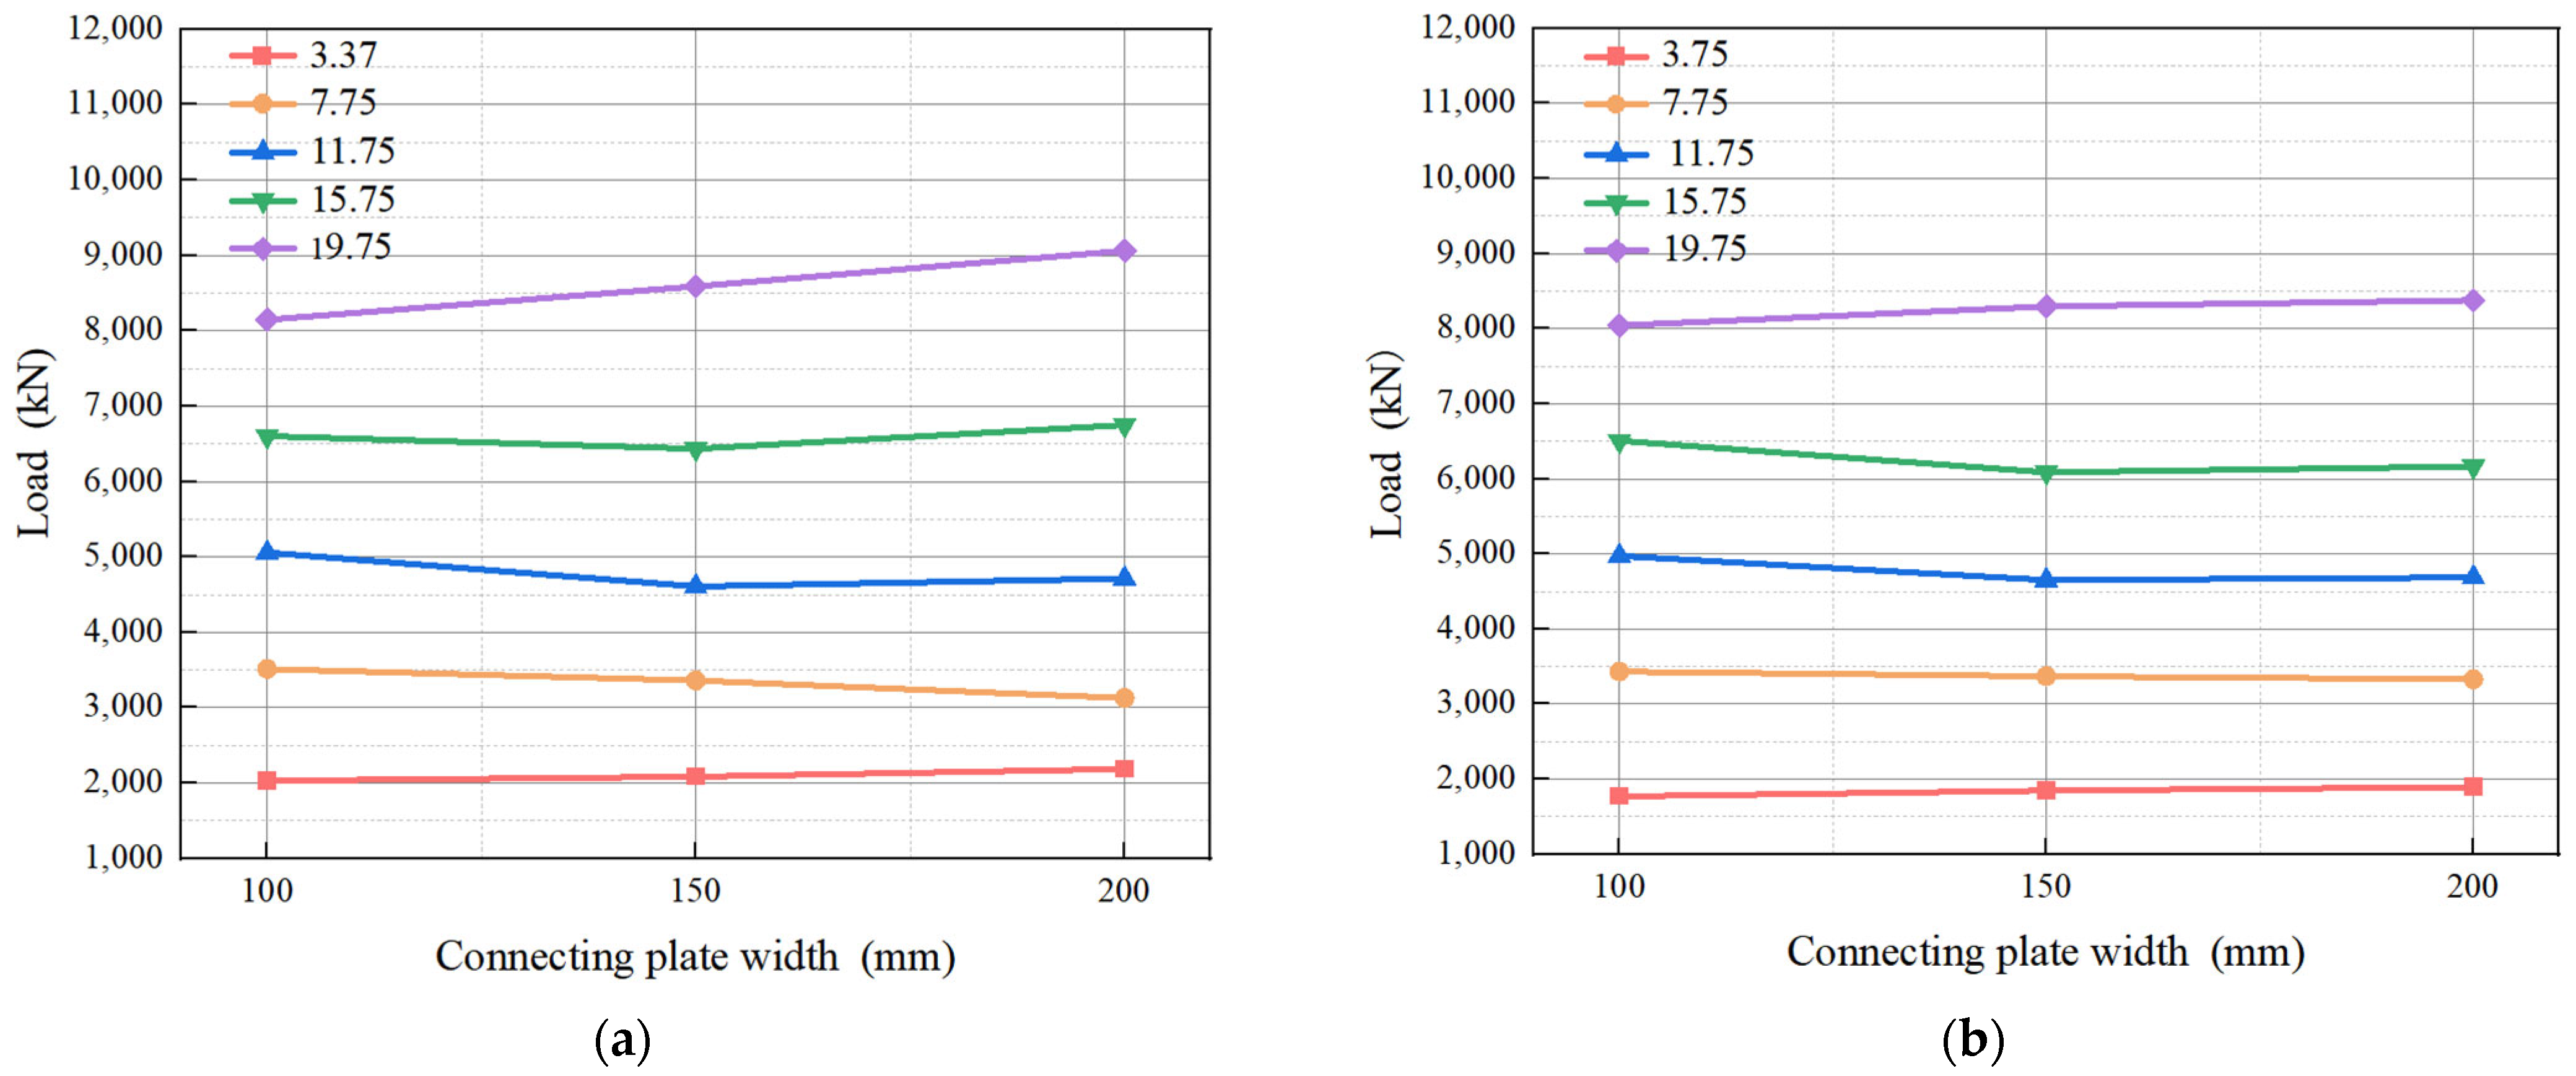
The width–thickness ratio of the connecting plate refers to the ratio of the width to the thickness of the connecting plate. This study examines the dimensions of connecting plates with widths of 100 mm, 150 mm, and 200 mm, and thicknesses of 3.75 mm, 7.75 mm, 11.75 mm, 15.75 mm, and 19.75 mm, respectively, to investigate the effect of the width-to-thickness ratio of the connecting plates on the compressive bearing capacity of the test specimens. Table 5 lists the compressive bearing capacities of the test specimens for different width-to-thickness ratios of the connecting plates, and Figure 13 shows the trend of these values.
Table 5.
Load statistics of specimens with different plate width-to-thickness ratios.
Figure 13.
Load–connecting plate width curves. (a) Axial load; (b) eccentric load.
For three different connection plate widths, as the connecting plates thickness increases in increments from 3.75 mm to 19.75 mm, the axial bearing capacity increases by averages of approximately 60%, 40%, 35%, and 28% per increment, while the eccentric bearing capacity increases by approximately 85%, 40%, 31%, and 32% per increment.
Under the same steel thickness, the width of the connecting plate increases, and the section size of the column increases. The steel ratio of the section and the stability of the column section are improved. The reason for the small increase in the compressive bearing capacity of the specimen is that the section changes from strength failure to buckling failure. The compressive strength of the section of the connecting plate is nonlinearly related to the width of the connecting plate. However, when the connecting plate thickness is 7.75 mm, 11.75 mm, or 15.75 mm, increasing the connecting plate width actually reduces the member’s compressive strength. This may be due to the increased width of the connecting plate, which reduces its stability and, consequently, the test specimen’s overall stability.
In summary, when the width of the connecting plate is fixed, the compressive load on the specimen gradually increases as the width-to-thickness ratio of the connecting plate decreases. This is because when the width-to-thickness ratio of the connecting plate is small, its strength increases and its support for the single-leg steel tube is enhanced, thereby improving the strength of the test specimen. Therefore, in structural design, once the width of the connecting plate has been selected, the optimal width-to-thickness ratio for the connecting plate in the test specimen should be determined, considering both economic and practical considerations.
5.4. Effect of Eccentricity
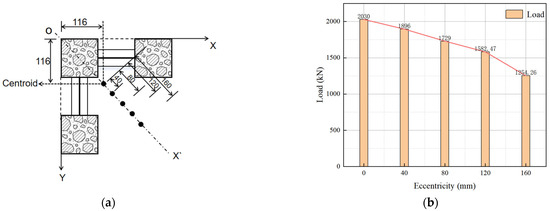
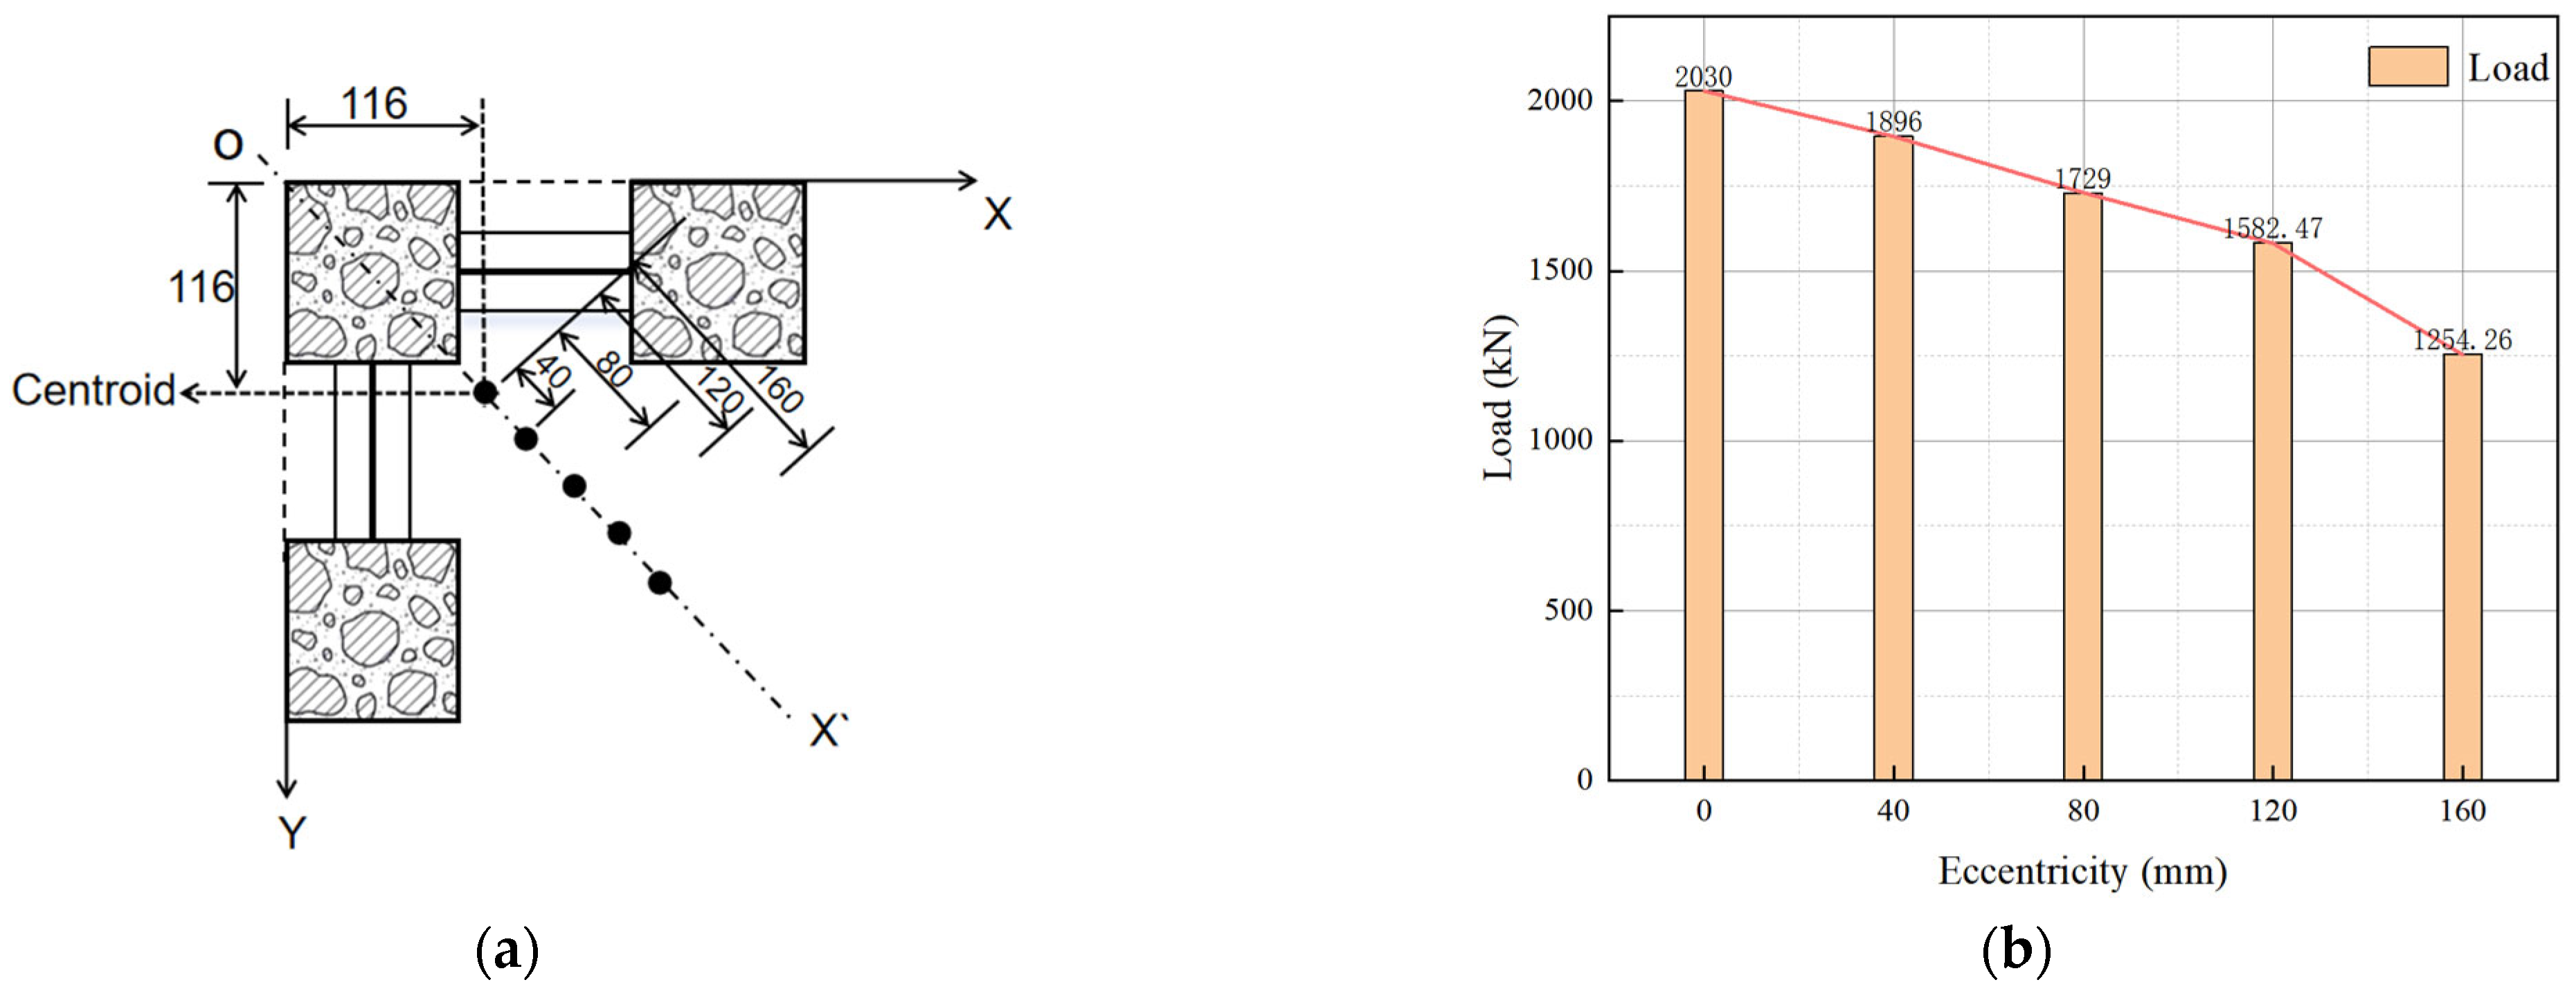
The compression point of the L-RACFST used as a corner column is affected by many factors, and only the 80 mm eccentricity is considered in the experiment. Therefore, based on the experimental results, this paper analyzes the bearing capacity of test specimens under different eccentricities. On the OX’ axis, eccentricities of 0 mm (center of mass), 40 mm, 80 mm, 120 mm, and 160 mm were selected as eccentric loading points to investigate the effect of eccentricity on the lateral bearing capacity of the specimen, as shown in Figure 14.
Figure 14.
Load points and loads. (a) Eccentric loading points (mm); (b) load–eccentricity curve.
The offset bearing capacity of the test specimen under different eccentricities is shown in Figure 13. As the eccentricity increased, the test specimen’s bearing capacity under eccentric loading gradually decreased as the loading point was moved sequentially from the center of mass to points with eccentricities of 40 mm, 80 mm, 120 mm, and 160 mm, decreasing by 6.60%, 14.83%, 22.07%, and 38.23%, respectively. It can be seen that when the eccentricity is less than 120 mm, the lateral bearing capacity of the specimen decreases relatively steadily as the eccentricity increases; however, when the eccentricity exceeds 120 mm, the rate of decrease in the specimen’s lateral bearing capacity accelerates.
In summary, the larger the eccentricity, the greater the decrease in bearing capacity. Because the bending moment of the specimen is larger and faster when the load increment is the same, with the increase in eccentricity, the section bears a larger bending distance, and the L-RACFST enters the elastic–plastic stage earlier until it is destroyed. Therefore, in structural design, when using L-RACFSTs as corner columns, it is recommended that the eccentricity of the load application point be less than 120 mm.
6. Conclusions
In this paper, an L-RACFST with a coarse aggregate replacement rate of 40% is studied, and a parametric analysis is conducted using validated numerical simulation methods. With a RAC replacement rate of 40%, the following conclusions were reached:
- (1)
- With increasing steel strength, the compressive load-bearing capacity of the test specimens gradually increases. It is recommended that the steel strength be set to Q355.
- (2)
- Under identical square steel tube widths, the compressive strength of the test specimen gradually increases as the width-to-thickness ratio of the square steel tube decreases.
- (3)
- Under a fixed connection plate width, the compressive bearing capacity of the specimen gradually increases as the width-to-thickness ratio of the connection plate decreases. Furthermore, under thicknesses of 7.75, 11.75, and 15.75 mm, an increase in connection plate width results in a decrease in compressive bearing capacity.
- (4)
- With increasing eccentricity, the specimen’s bearing capacity under eccentric loading gradually decreases. It is recommended that the eccentricity of the specimen be kept below 120 mm.
Author Contributions
T.M.: conceptualization, testing, software, writing—original draft and review, validation, formal analysis, methodology; X.G.: data curation, writing—review and editing; Z.M.: investigation, resources; Z.H.: supervision, visualization. All authors have read and agreed to the published version of the manuscript.
Funding
Research Project on Construction Science and Technology of the Department of Housing and Urban Rural Development of Hebei Province; Grant IDs: ZD-2022-05.
Data Availability Statement
The original contributions presented in this study are included in the article. Further inquiries can be directed to the corresponding author.
Conflicts of Interest
Tengfei Ma was employed by the company Central Research Institute of Building and Construction Co. Ltd. The authors declare that they have no known competing financial interests or personal relationships that could have appeared to influence the work reported in this paper.
Abbreviations
The following abbreviations are used in this manuscript:
| L-RACFST | L-shaped column of recycled aggregate concrete-filled steel tubes |
| CO2 | carbon dioxide |
| RAC | recycled aggregate concrete |
References
- Habert, G.; Miller, S.A.; John, V.M.; Provis, J.L.; Favier, A.; Horvath, A.; Scrivener, K.L. Environmental impacts and decarbonization strategies in the cement and concrete industries. Nat. Rev. Earth Environ. 2020, 1, 559–573. [Google Scholar] [CrossRef] [Scilit]
- Akintayo, B.D.; Babatunde, O.M.; Olanrewaju, O.A. Comparative analysis of cement production methods using a life cycle assessment and a multicriteria decision-making approach. Sustainability 2024, 16, 484. [Google Scholar] [CrossRef] [Scilit]
- Bostanci, C.S.; Limbachiya, M.; Kew, H. Use of recycled aggregates for low carbon and cost effective concrete construction. J. Clean. Prod. 2018, 189, 176–196. [Google Scholar] [CrossRef] [Scilit]
- Bahmani, H.; Mostafaei, H.; Rostampour, M.A. Utilization of stone quarry sludge in the development of environmentally friendly high-strength concrete. J. Compos. Sci. 2025, 9, 648. [Google Scholar] [CrossRef] [Scilit]
- Andrew, R.M. Global CO2 emissions from cement production. Earth Syst. Sci. Data 2018, 10, 195–217. [Google Scholar] [CrossRef] [Scilit]
- Huntzinger, D.N.; Eatmon, T.D. A life-cycle assessment of Portland cement manufacturing: Comparing the traditional process with alternative technologies. J. Clean. Prod. 2009, 17, 668–675. [Google Scholar] [CrossRef] [Scilit]
- Adaloudis, M.; Roca, J.B. Sustainability tradeoffs in the adoption of 3D Concrete Printing in the construction industry. J. Clean. Prod. 2021, 307, 127201. [Google Scholar] [CrossRef] [Scilit]
- Bahmani, H.; Mostafaei, H.; Shabani, K.; Santos, P. Development of High-Performance Eco-Friendly Concrete Incorporating Recycled Fine Aggregates: Mechanical, Microstructural and Carbon Footprint Assessment. Buildings 2026, 16, 973. [Google Scholar] [CrossRef] [Scilit]
- Sobuz, M.H.R.; Datta, S.D.; Rahman, M. Evaluating the properties of demolished aggregate concrete with non-destructive assessment. In Advances in Civil Engineering: Select Proceedings of ICACE 2020; Springer: Singapore, 2021; pp. 223–233. [Google Scholar]
- Attri, G.K.; Gupta, R.C.; Shrivastava, S. Comparative environmental impacts of recycled concrete aggregate and manufactured sand production. Process Integr. Optim. Sustain. 2022, 6, 737–749. [Google Scholar] [CrossRef] [Scilit]
- Okeke, I.J.; Kamath, D.; Nimbalkar, S.U.; Cresko, J. The role of low-carbon fuels and carbon capture in decarbonizing the US clinker manufacturing for cement production: CO2 emissions reduction potentials. Energies 2024, 17, 5233. [Google Scholar] [CrossRef] [Scilit]
- Mostafaei, H.; Chamasemani, F.N.; Mashayekhi, M.; Hamzehkolaei, N.S.; Santos, P. Sustainability Enhancement and Evaluation of a Concrete Dam Using Recycling. Appl. Sci. 2025, 15, 2479. [Google Scholar] [CrossRef] [Scilit]
- Azúa, G.; González, M.; Arroyo, P.; Kurama, Y. Recycled coarse aggregates from precast plant and building demolitions: Environmental and economic modeling through stochastic simulations. J. Clean. Prod. 2019, 210, 1425–1434. [Google Scholar] [CrossRef] [Scilit]
- Chen, J.; Zhou, Y.; Yin, F. A practical equation for the elastic modulus of recycled aggregate concrete. Buildings 2022, 12, 187. [Google Scholar] [CrossRef] [Scilit]
- Poon, C.S.; Shui, Z.H.; Lam, L. Effect of microstructure of ITZ on compressive strength of concrete prepared with recycled aggregates. Constr. Build. Mater. 2004, 18, 461–468. [Google Scholar] [CrossRef] [Scilit]
- Prasittisopin, L.; Tuvayanond, W.; Kang, K.H.T.; Kaewunruen, S. Concrete Mix Design of Recycled Concrete Aggregate (RCA): Analysis of Review Papers, Characteristics, Research Trends, and Underexplored Topics. Resources 2025, 14, 21. [Google Scholar] [CrossRef] [Scilit]
- Hamad, B.S.; Dawi, A.H. Sustainable normal and high strength recycled aggregate concretes using crushed tested cylinders as coarse aggregates. Case Stud. Constr. Mater. 2017, 7, 228–239. [Google Scholar] [CrossRef] [Scilit]
- Bai, G.; Zhu, C.; Liu, C.; Liu, B. An evaluation of the recycled aggregate characteristics and the recycled aggregate concrete mechanical properties. Constr. Build. Mater. 2020, 240, 117978. [Google Scholar] [CrossRef] [Scilit]
- Chrysanidis, T.; Tegos, I. Axial and transverse strengthening of r/c circular columns: Conventional and new type of steel and hybrid jackets using high-strength mortar. J. Build. Eng. 2020, 30, 101236. [Google Scholar] [CrossRef] [Scilit]
- Zhao, H.-Y.; Han, L.-H.; Hou, C.; Lyu, W.-Q. Performance of recycled aggregate concrete-filled high-strength steel tubes under axial compression, tension and torsion. Thin-Walled Struct. 2023, 184, 110478. [Google Scholar] [CrossRef] [Scilit]
- Zhang, X.; Zhu, Y.; Zhang, W.; Kong, W.; Lin, Y.; Chen, Y. Research on axial compression performance of recycled aggregate concrete-filled steel tubular column. J. Constr. Steel Res. 2025, 229, 109541. [Google Scholar] [CrossRef] [Scilit]
- Long, Y.-L.; Li, B.-S.; Liu, Y.-M.; Chen, G.-M.; Xiong, M.-X. Compressive behavior of recycled aggregate concrete-filled square steel tubular columns with FRP–confined concrete core. Structures 2025, 78, 108915. [Google Scholar] [CrossRef] [Scilit]
- Wang, Y.; Wei, C.; Fang, Y.; Zhou, X.; Geng, Y. Seismic behaviour of concrete-filled steel tubular columns with 100% recycled coarse and fine aggregates: Experiments and modeling. Eng. Struct. 2025, 344, 121294. [Google Scholar] [CrossRef] [Scilit]
- Ma, T.-F.; Chen, Z.-H.; Kashan, K.; Du, Y.-S. Experimental and numerical analysis of L-Shaped column composed of recycled aggregate concrete-filled square steel tubes under eccentric compression. Adv. Steel Constr. 2023, 19, 177–184. [Google Scholar]
- Li, H.; Tong, Y.; Yin, J.; Zhang, H.; Yan, C. Study on axial compression behavior of cross-shaped and L-shaped multi-cavity concrete-filled steel tube special shaped column. Int. J. Steel Struct. 2022, 22, 153–175. [Google Scholar] [CrossRef] [Scilit]
- Sui, Y.; Tu, Y.; Guo, Q.; Zhang, J.; Ke, F. Study on the behavior of multi-cell composite T-shaped concrete-filled steel tubular columns subjected to compression under biaxial eccentricity. J. Constr. Steel Res. 2019, 159, 215–230. [Google Scholar] [CrossRef] [Scilit]
- Zheng, Y.; Zeng, S. Design of L-shaped and T-shaped concrete-filled steel tubular stub columns under axial compression. Eng. Struct. 2020, 207, 110262. [Google Scholar] [CrossRef] [Scilit]
- Ma, T.F.; Chen, Z.H.; Kashan, K.; Du, Y.; Zhang, Y. Eccentric load-carrying capacity calculation of L-Shaped columns with recycled aggregate concrete-filled tubes. Structures 2024, 59, 105606. [Google Scholar] [CrossRef] [Scilit]
- Ma, T.F.; Chen, Z.H.; Du, Y.S. Axial compression behaviour of L-shaped column composed of recycled aggregate concrete-filled square steel tubes. Ind. Build. 2023, 53, 1–6. [Google Scholar]
- Ma, T.; Gao, X.; Hao, Z.; Ma, Z. Eccentric mechanical properties and parametric analysis of recycled concrete composite special-shaped columns made of square steel tubes. J. Liaoning Tech. Univ. (Nat. Sci.) 2026, 45, 66–72. [Google Scholar]
- GB/T 25177-2010; Recycled Coarse Aggregates for Concrete. Standards Press of China: Beijing, China, 2010.
- GB/T 50081-2019; Standard for Test Methods of Concrete Physical and Mechanical Properties. China Architecture & Building Press: Beijing, China, 2019.
- Rang, B. Theoretical Analysis and Experimental Study on Special-Shaped Column Composed of Concrete-Filled Square Steel Tubes. Ph.D. Thesis, Tianjin University, Tianjin, China, 2009; pp. 30–91. [Google Scholar]
- Zhou, T. Mechanical Behavior and Engineering Application of Special-Shaped Column Composed of Concrete-Filled Square Steel Tubes. Ph.D. Thesis, Tianjin University, Tianjin, China, 2012; pp. 39–102. [Google Scholar]
- Li, J.Q.; Chen, Z.H.; Du, Y.S.; Wu, Y.; Liu, X. Study on constitutive model of core concrete of recycled aggregate concrete filled steel tubular columns under compression. Ind. Build. 2021, 51, 108–115+15. [Google Scholar]
- Yang, Y.F. Theoretical research on load-deformation relations of recycled aggregate concrete-filled steel tubular members. Ind. Build. 2007, 37, 1–6+124. [Google Scholar]
- Xiao, J.Z.; Lan, Y. Investigation on the tensile behavior of recycled aggregate concrete. Chin. J. Build. Mater. 2006, 9, 154–158. [Google Scholar]

Disclaimer/Publisher’s Note: The statements, opinions and data contained in all publications are solely those of the individual author(s) and contributor(s) and not of MDPI and/or the editor(s). MDPI and/or the editor(s) disclaim responsibility for any injury to people or property resulting from any ideas, methods, instructions or products referred to in the content. |
© 2026 by the authors. Licensee MDPI, Basel, Switzerland. This article is an open access article distributed under the terms and conditions of the Creative Commons Attribution (CC BY) license.