


Abstract
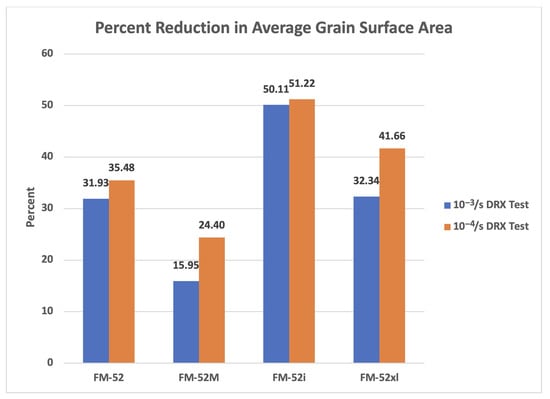
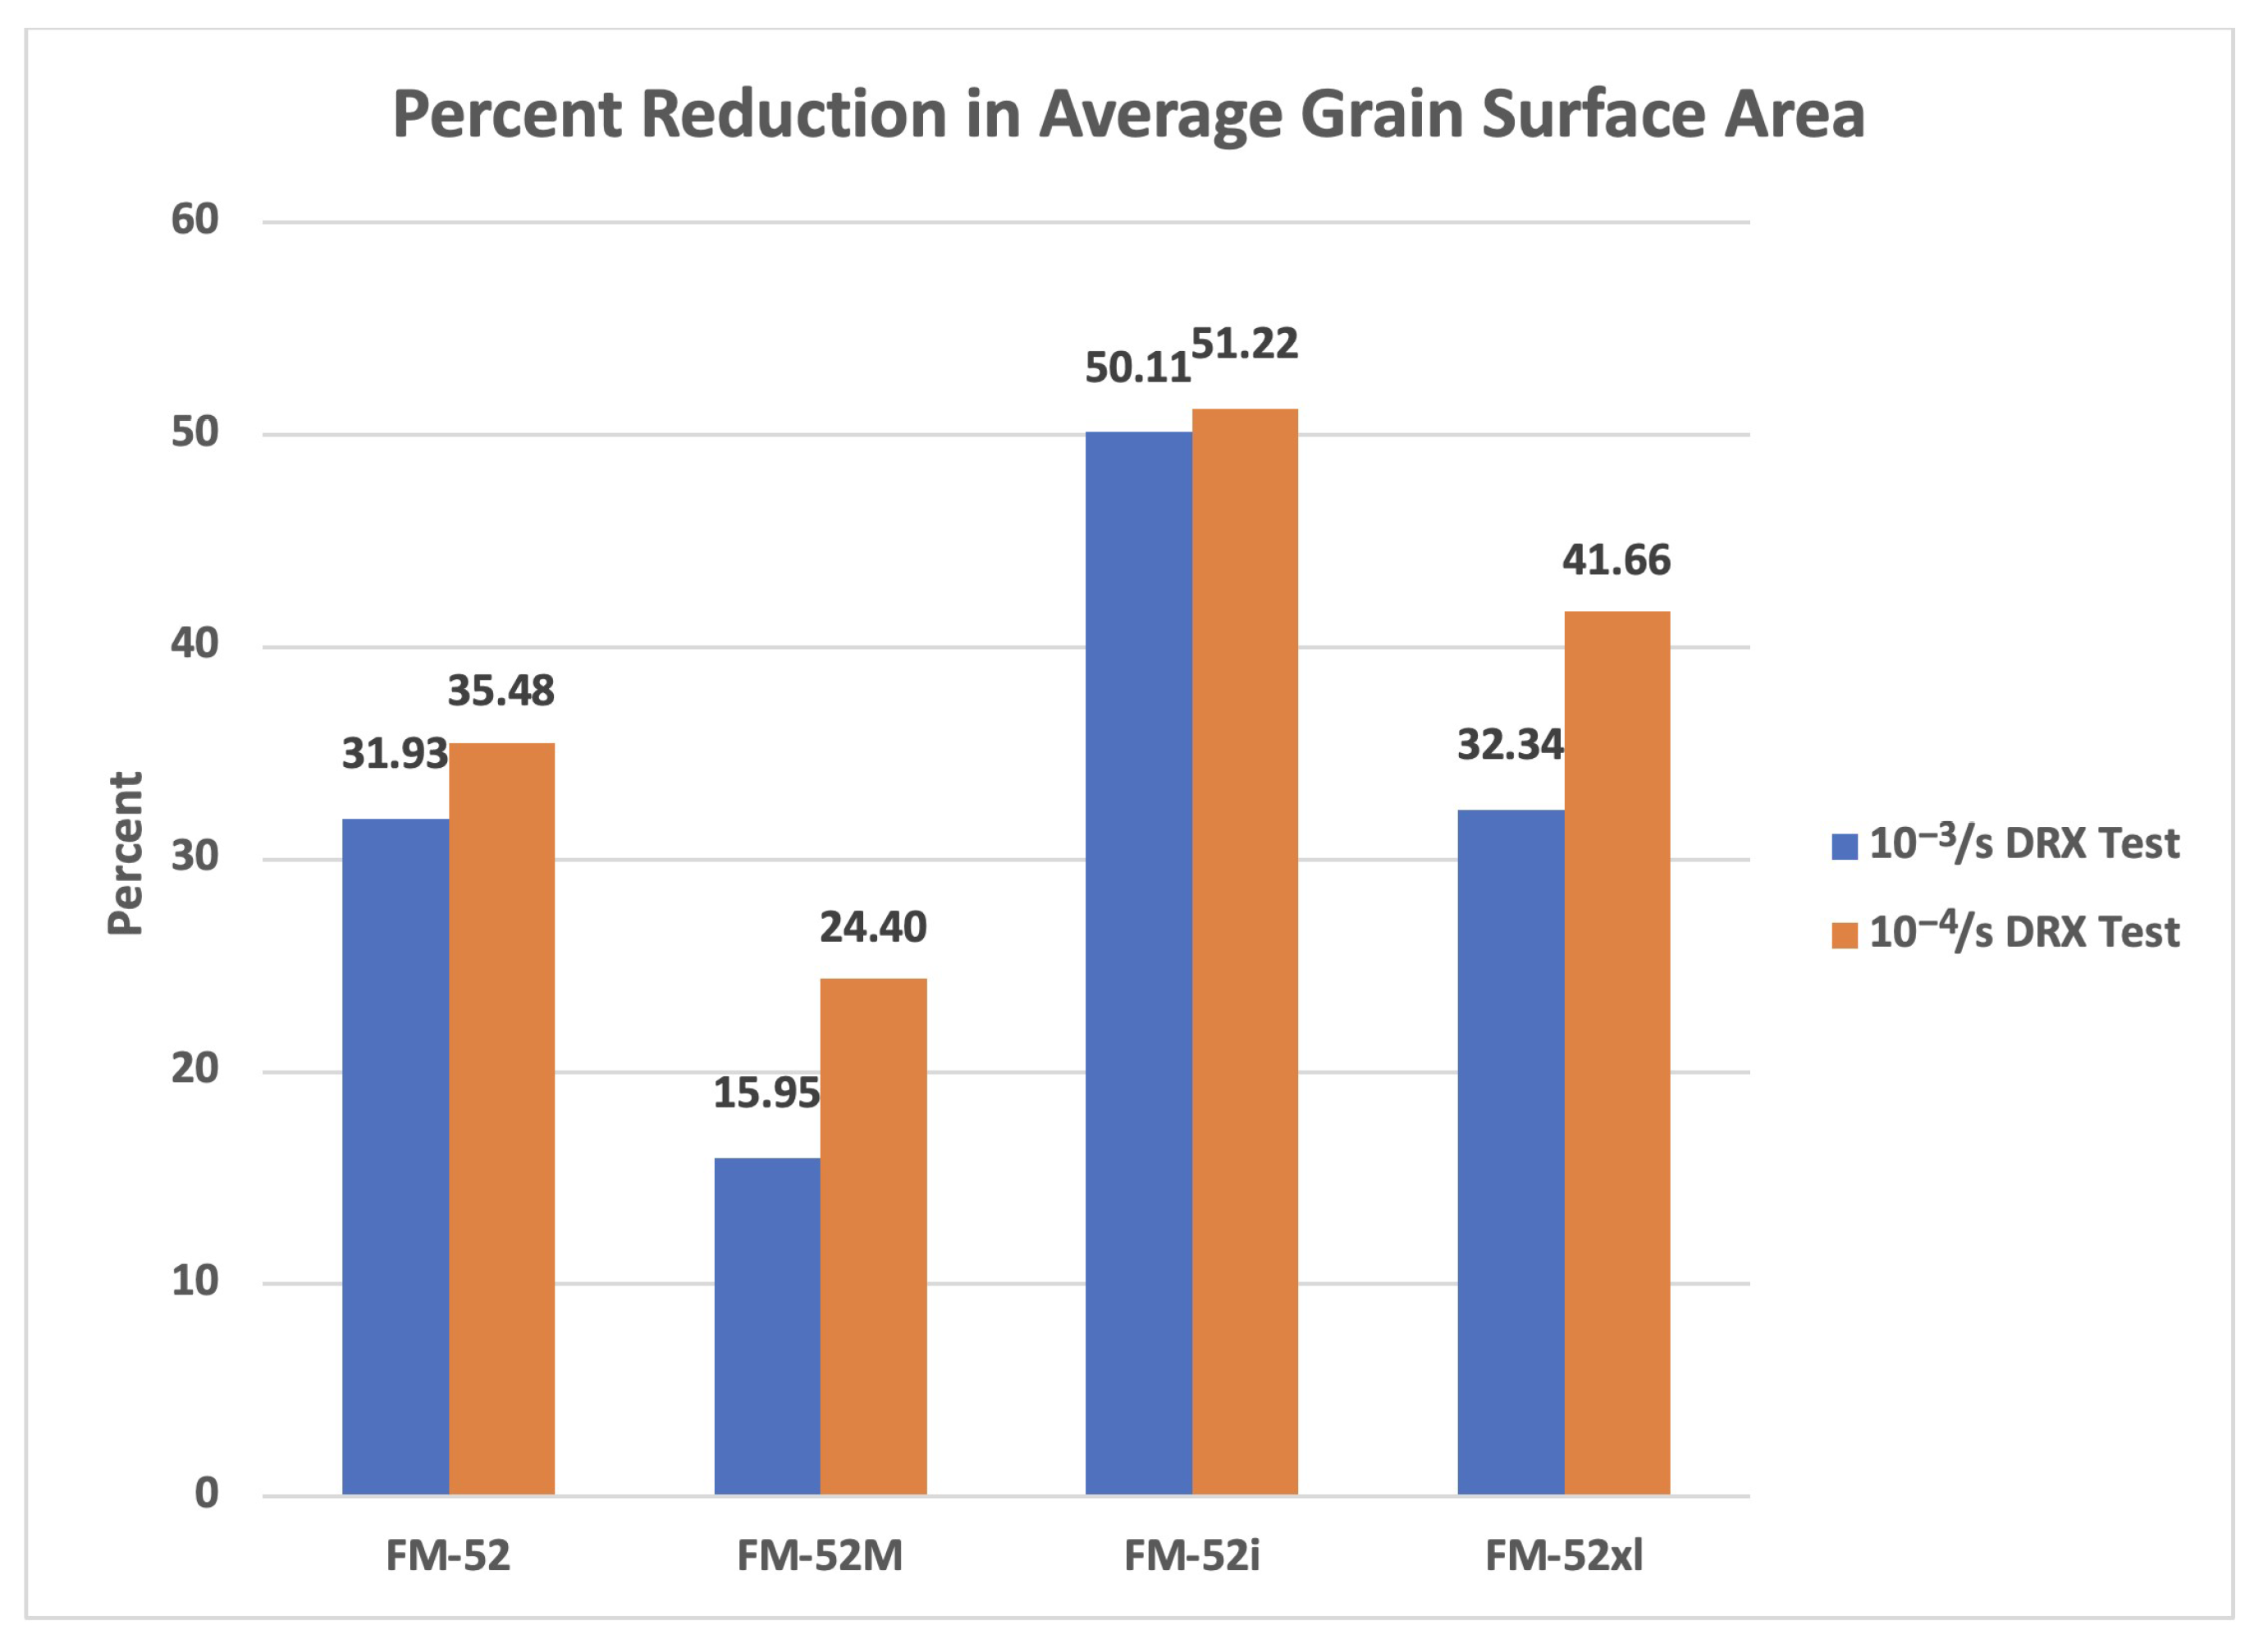
Ductility dip cracking (DDC) remains a persistent challenge in multipass welds of high-chromium nickel-based alloys used in the nuclear power generation industry. While dynamic recrystallization (DRX) has been observed to arrest DDC crack growth and has been associated with weld regions that experience less DDC, there exists no quantitative relationship between the extent of recrystallization in a microstructure and DDC susceptibility. This research examines the influence of intragranular carbides on DRX behavior and establishes an experimental relationship between DDC susceptibility and extent of recrystallization in high-chromium nickel-based weld metals, novel contributions for this alloy system. In this work, the DRX behavior of the weld metal of high-chromium nickel-based filler metals (FM-52, FM-52M, FM-52i, and FM-52xl) was investigated under controlled thermo-mechanical conditions, and its effect on DDC susceptibility was established. Weld metal specimens were subjected to uniaxial deformation at 1100 °C to a true strain of 2% at strain rates of 10−3/s and 10−4/s using a Gleeble 3800TM. Recrystallization was quantified using electron backscatter diffraction (EBSD) via grain orientation spread (GOS) analysis and dislocation–precipitate interactions were examined using transmission electron microscopy (TEM). Strain-to-fracture (STF) testing at 950 °C was employed to assess DDC susceptibility as a function of the extent of recrystallization and grain surface area. All tested weld metals exhibited increased recrystallization and grain refinement, as the strain rate decreased from 10−3/s to 10−4 s. The FM-52i weld metal specimens exhibited the highest grain refinement under high temperature deformation, followed by the FM-52xl, FM-52, and FM-52M weld metals with a percent reduction in average grain surface area of 51.22%, 41.66%, 35.48%, and 24.40%, respectively. The FM-52i weld metal specimens also exhibited the highest recrystallization response, followed by FM-52M, FM-52xl, and FM-52 weld metals at 75%, 40%, 39% and 21% recrystallized, respectively. Weld metals containing strong carbide formers experienced higher recrystallization responses than those without due to precipitate–carbide interactions. All tested weld metals experienced drastic reductions in DDC response with increasing extent of recrystallization and decreasing average grain surface areas. DRX in STF specimens was observed to facilitate uniform plastic strain accumulation, lowering overall DDC susceptibility compared to non-recrystallized specimens.
1. Introduction
1.1. High-Chromium Nickel-Based Filler Metals
Alloy 690 (A690) is a high-chromium nickel-based alloy widely used in the nuclear power generation industry for its combination of mechanical strength and corrosion resistance [1,2,3,4]. Various welding filler metals have been developed that are compositionally similar to A690, with slight variations to improve the resistance to solidification cracking, ductility dip cracking (DDC), and primary water stress corrosion cracking (PWSCC).
Welding filler metals 52 (FM-52) and 82 (FM-82) are the standard matching filler metals for Alloys 690 and 600, respectively [5]. These alloys and their filler metals are single-phase materials with the propensity to form carbides and nitrides [1,2,3,4,5]. Alloys 600 and 690 have similar compositions. The major difference is that Alloy 600 has about ~15 wt% Cr, compared to the ~30 wt% Cr in Alloy 690 [5]. Modified variations of FM-52 have been developed, including FM-68HP, FM-52M, and FM-52MSS, each of which is designed to improve ductility dip cracking (DDC) resistance and weldability issues with oxides, sluggish weld pools, and irregular wetting [5]. Modified variations of FM-82 have also been developed, including MLTS-24Cr, MLTS-27Cr, MLTS-30Cr, and FM-52i. Each FM-82 variant was developed to improve similar weldability concerns to FM-52, along with improvements to stress corrosion cracking (SCC) resistance [5]. Among these materials, the most widely employed group of filler metals for nuclear application is the FM-52 family of filler metals [5].
FM-52M retains a similar composition to FM-52 with some additions of niobium [6]. Niobium is added to preferentially form niobium carbides instead of chromium carbides, which would reduce the corrosion resistance [6]. Niobium carbides strengthen the weld metal as well and help reduce DDC susceptibility by hindering grain boundary migration and subsequent sliding [6]. FM-52i is similar to both FM-52 and FM-52M, but it has larger additions of niobium, some additions of manganese and a reduction in iron content [7]. The larger niobium additions in FM-52i further reduce DDC susceptibility when compared to FM-52M. The increase in manganese content is to capture sulfur, which is shown to increase DDC susceptibility, as well as disrupt the formation of nickel–chromium intermetallics, and the reduction in iron aims to further increase SCC resistance [7]. FM-52xl has similar chromium and iron content to FM-52M, but the only other major alloying elements are tantalum and molybdenum [8]. The addition of tantalum instead of niobium results in a smaller solidification temperature range (STR), making weld metals of this filler metal more resistant to solidification cracking than its niobium-containing counterparts, while also forming tantalum carbides that pin grain boundaries and increase DDC resistance similarly to niobium carbides [8]. The addition of molybdenum results in the formation of a eutectic Sigma phase that provides an additional grain boundary pinning effect, which further increases DDC resistance [8].
1.2. Ductility Dip Cracking
One of the primary challenges associated with multipass welds of high-chromium nickel-based alloys is DDC [9,10]. DDC is a solid-state warm-cracking phenomenon characterized by a localized reduction in ductility within a temperature range typically between 0.5 Ts and Ts, where Ts is the alloy solidus temperature. This temperature interval is known as the ductility dip temperature range (DTR). DDC is difficult to detect by non-destructive evaluation in high-chromium nickel-based welds performed in the nuclear industry. This is due to the extremely small nature of DDC cracks, which are typically on the order of 102 microns in length and can even be an order of magnitude smaller [10]. If DDC is found, weld removal and repair is costly and difficult.
DDC mechanisms include grain boundary sliding or shearing, impurity segregation, and stress concentrations caused by grain boundary precipitates [11,12,13,14,15,16,17,18,19,20]. When weld metal is reheated into the DTR, grain boundary sliding may occur along long straight migrated grain boundaries, resulting in voids nucleating along these grain boundaries. These voids may link due to thermo-mechanical cycling, forming a crack. Certain impurities can increase DDC susceptibility. Impurities like sulfur and phosphorous have been shown to segregate to grain boundaries within the DTR and increase the DDC likelihood [13]. Grain boundary precipitates may increase or decrease DDC susceptibility, depending on the particle misfit with the matrix phase, geometry, size, spacing along grain boundary, and weld restraint [16,21,22,23,24]. In low restraint scenarios, small grain boundary carbides with small spacings along the boundary were shown to hinder grain boundary sliding by functioning as mechanical locks, making it difficult for grain boundaries to migrate and straighten and subsequently slide [24]. In high restraint scenarios, small grain boundary carbides with small spacings along the boundary act as stress concentrators, increasing DDC susceptibility [25]. Based on the literature, larger particles with larger spacings along grain boundaries and low particle misfit are most ideal for mitigating DDC [16,21,22,23,24].
Earlier work found that dynamic recrystallization (DRX) forms at DDC crack tips, arresting crack growth [16,21]. The formation of DRX at DDC cracks tips is due to the high stress concentrations present at the crack tip. This phenomenon is not frequently observed [10]. The interaction between DRX and DDC has been expanded in recent work [17,18]. It was proposed that localized recrystallization does not just have a mitigating effect on DDC growth but on crack nucleation as well. The literature has not expanded on this phenomenon outside of observing that some recrystallized regions of a multipass weld of a high-chromium nickel-based filler metal did not exhibit cracking [17,18]. Since this is a potential avenue for DDC mitigation, the phenomenon should be isolated and investigated to determine its validity. Understanding how recrystallization inhibits DDC formation represents a significant and necessary advancement in the field.
1.3. Fundamentals of Dynamic Recrystallization
Dynamic recrystallization (DRX) is the process by which new defect-free grains form and replace deformed grains during high-temperature deformation [26]. Unlike static recrystallization (SRX), DRX occurs concurrently with applied deformation, although both mechanisms require elevated temperatures [26,27,28,29].
Two primary DRX mechanisms are recognized: discontinuous DRX (DDRX) and continuous DRX (CDRX). DDRX involves discrete nucleation and growth steps, typically along pre-existing grain boundaries, forming the characteristic necklace microstructure. DDRX is most common in materials with low stacking fault energy (SFE) [26,27,28,29]. Because of the low SFE, grains accumulate high dislocation densities. Once a critical dislocation density is reached, the boundaries of that grain will bulge, eventually nucleating a new grain from a bulged portion of the boundary [22]. In contrast, CDRX occurs in high-SFE materials, where sub-grain rotation and transformation of low-angle grain boundaries (LAGBs) into high-angle grain boundaries (HAGBs) produce gradual microstructural evolution without distinct nucleation [26,27,28,29]. A subset of CDRX, geometric DRX (GDRX), is observed primarily during large plastic strains such as in hot rolling of aluminum alloys [26].
High-chromium nickel-based alloys and welds of such filler metals generally exhibit low-to-moderate SFE [30,31]. Accordingly, these materials are expected to undergo DDRX as the dominant recrystallization mechanism, with potential contributions from CDRX under active deformation at elevated temperatures. If this deformation occurs within the DTR, DRX may occur, along with DDC. For the purposes of mitigation, DRX should be induced above the upper bound of the DTR prior to deformation within the DTR. There are currently no studies that have investigated the recrystallization behavior of welds in high-chromium nickel-based alloys and how composition can affect this. If recrystallization does play a role in mitigating DDC susceptibility, welds of filler metals that recrystallize most readily are favorable. There are also no studies that have investigated the interaction mechanisms between DDC and DRX in this alloy system.
Quantifying DRX in single phase alloys has been a major difficulty. Since recrystallization is typically associated with a reduction in average grain size, it may be reasonable to use grain size to quantify recrystallization. Grain size, however, is not sufficient to quantify recrystallization [22,32,33]. Nucleating grains have a variance in grain size depending on the mechanism: sub-grain rotation (CDRX) or grain boundary bulging (DDRX) [33]. Due to the dynamic nature of the phenomenon, DRX does not result in grains below a certain size threshold, but it results in a distribution of grain sizes that may overlap with the grain size distribution of the original microstructure [26]. In the case of DDRX, growth is part of the recrystallization process; so, recrystallized grains can be larger than expected due to rapid growth. Recrystallized grains grow most readily in the direction of highest plastic strain, meaning that nucleated grains with differing localized plastic strain will grow at differing rates [26]. Due to its complexity, grain size alone is not reasonable to quantify the amount of recrystallization but can partially capture this information. In the case of uniform thermo-mechanical processing, procedures that result in smaller average grain sizes when the initial grain size is similar can be assumed to be inducing more DRX. To properly quantify DRX, additional parameters are needed.
When grains dynamically recrystallize, nucleated grains are strain-free, while non-recrystallized grains will have plastic strain accumulation. This concept is used to quantify dynamic recrystallization. Electron backscatter diffraction (EBSD) can be used to develop a map of specimen grain orientations, allowing for not only grain identification and quantification but also the orientation gradient within each grain. Plastic strain accumulation results in larger orientation gradients within a grain [26].
Grain orientation spread (GOS) is a parameter that quantifies the orientation gradient within a grain. GOS is the average orientation difference between the orientation of each pixel within the grain and the grain orientation average for the grain. When plotting the area fraction of a scanned cross section against the GOS, it is expected that recrystallized grains will populate the low GOS portion of the plot. To quantify the area fraction of recrystallized grains, the total area fraction below a GOS threshold is calculated [33,34,35,36,37]. A misorientation threshold of 1° GOS is commonly adopted to identify recrystallized grains. This criterion has been used across a range of material systems, including magnesium, titanium, and nickel-based alloys, as well as austenitic stainless steels, and was established empirically [34,35,36,37]. In these studies, materials were subjected to thermo-mechanical processing and characterized using EBSD. Conditions that promoted the nucleation of new grains produced a distinct peak in the GOS distribution between 0° and 1°, corresponding to newly recrystallized low-strain grains. With increasing deformation and subsequent recrystallization, the fraction of grains within this low-GOS range increased, leading to a growth in the magnitude of this peak. The analysis of DRX in high-chromium nickel-based alloys in this work uses this 1° GOS threshold to quantify dynamic recrystallization, as is typically used in the literature [33,34,35,36,37].
1.4. Objective of Work
This study has two primary objectives: first, to experimentally quantify the effect of precipitates on the DRX behavior in welds of high-chromium filler metals FM-52, FM-52M, FM-52i, and FM-52xl under controlled thermo-mechanical conditions; and second, to establish a relationship between the extent of recrystallization and DDC susceptibility. These are major gaps in knowledge present in the broader body of DDC literature in high-chromium nickel-based filler metals.
While prior studies have observed correlations between DRX presence and reduced cracking in weld microstructures [16,17,18], a systematic investigation isolating the effect of recrystallization on DDC behavior has not been performed. By combining a methodology to generate varying extents of recrystallization with STF testing, this work seeks to quantify how recrystallization influences cracking susceptibility.
2. Materials and Methods
2.1. Test Materials and Specimen
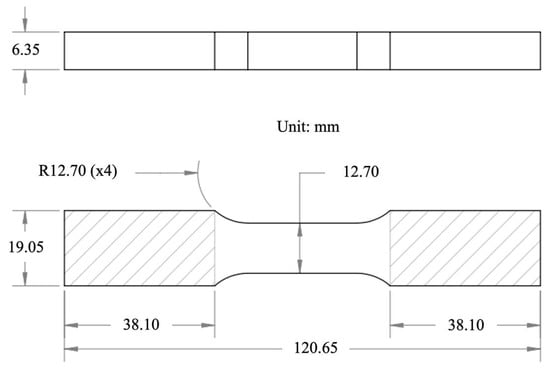
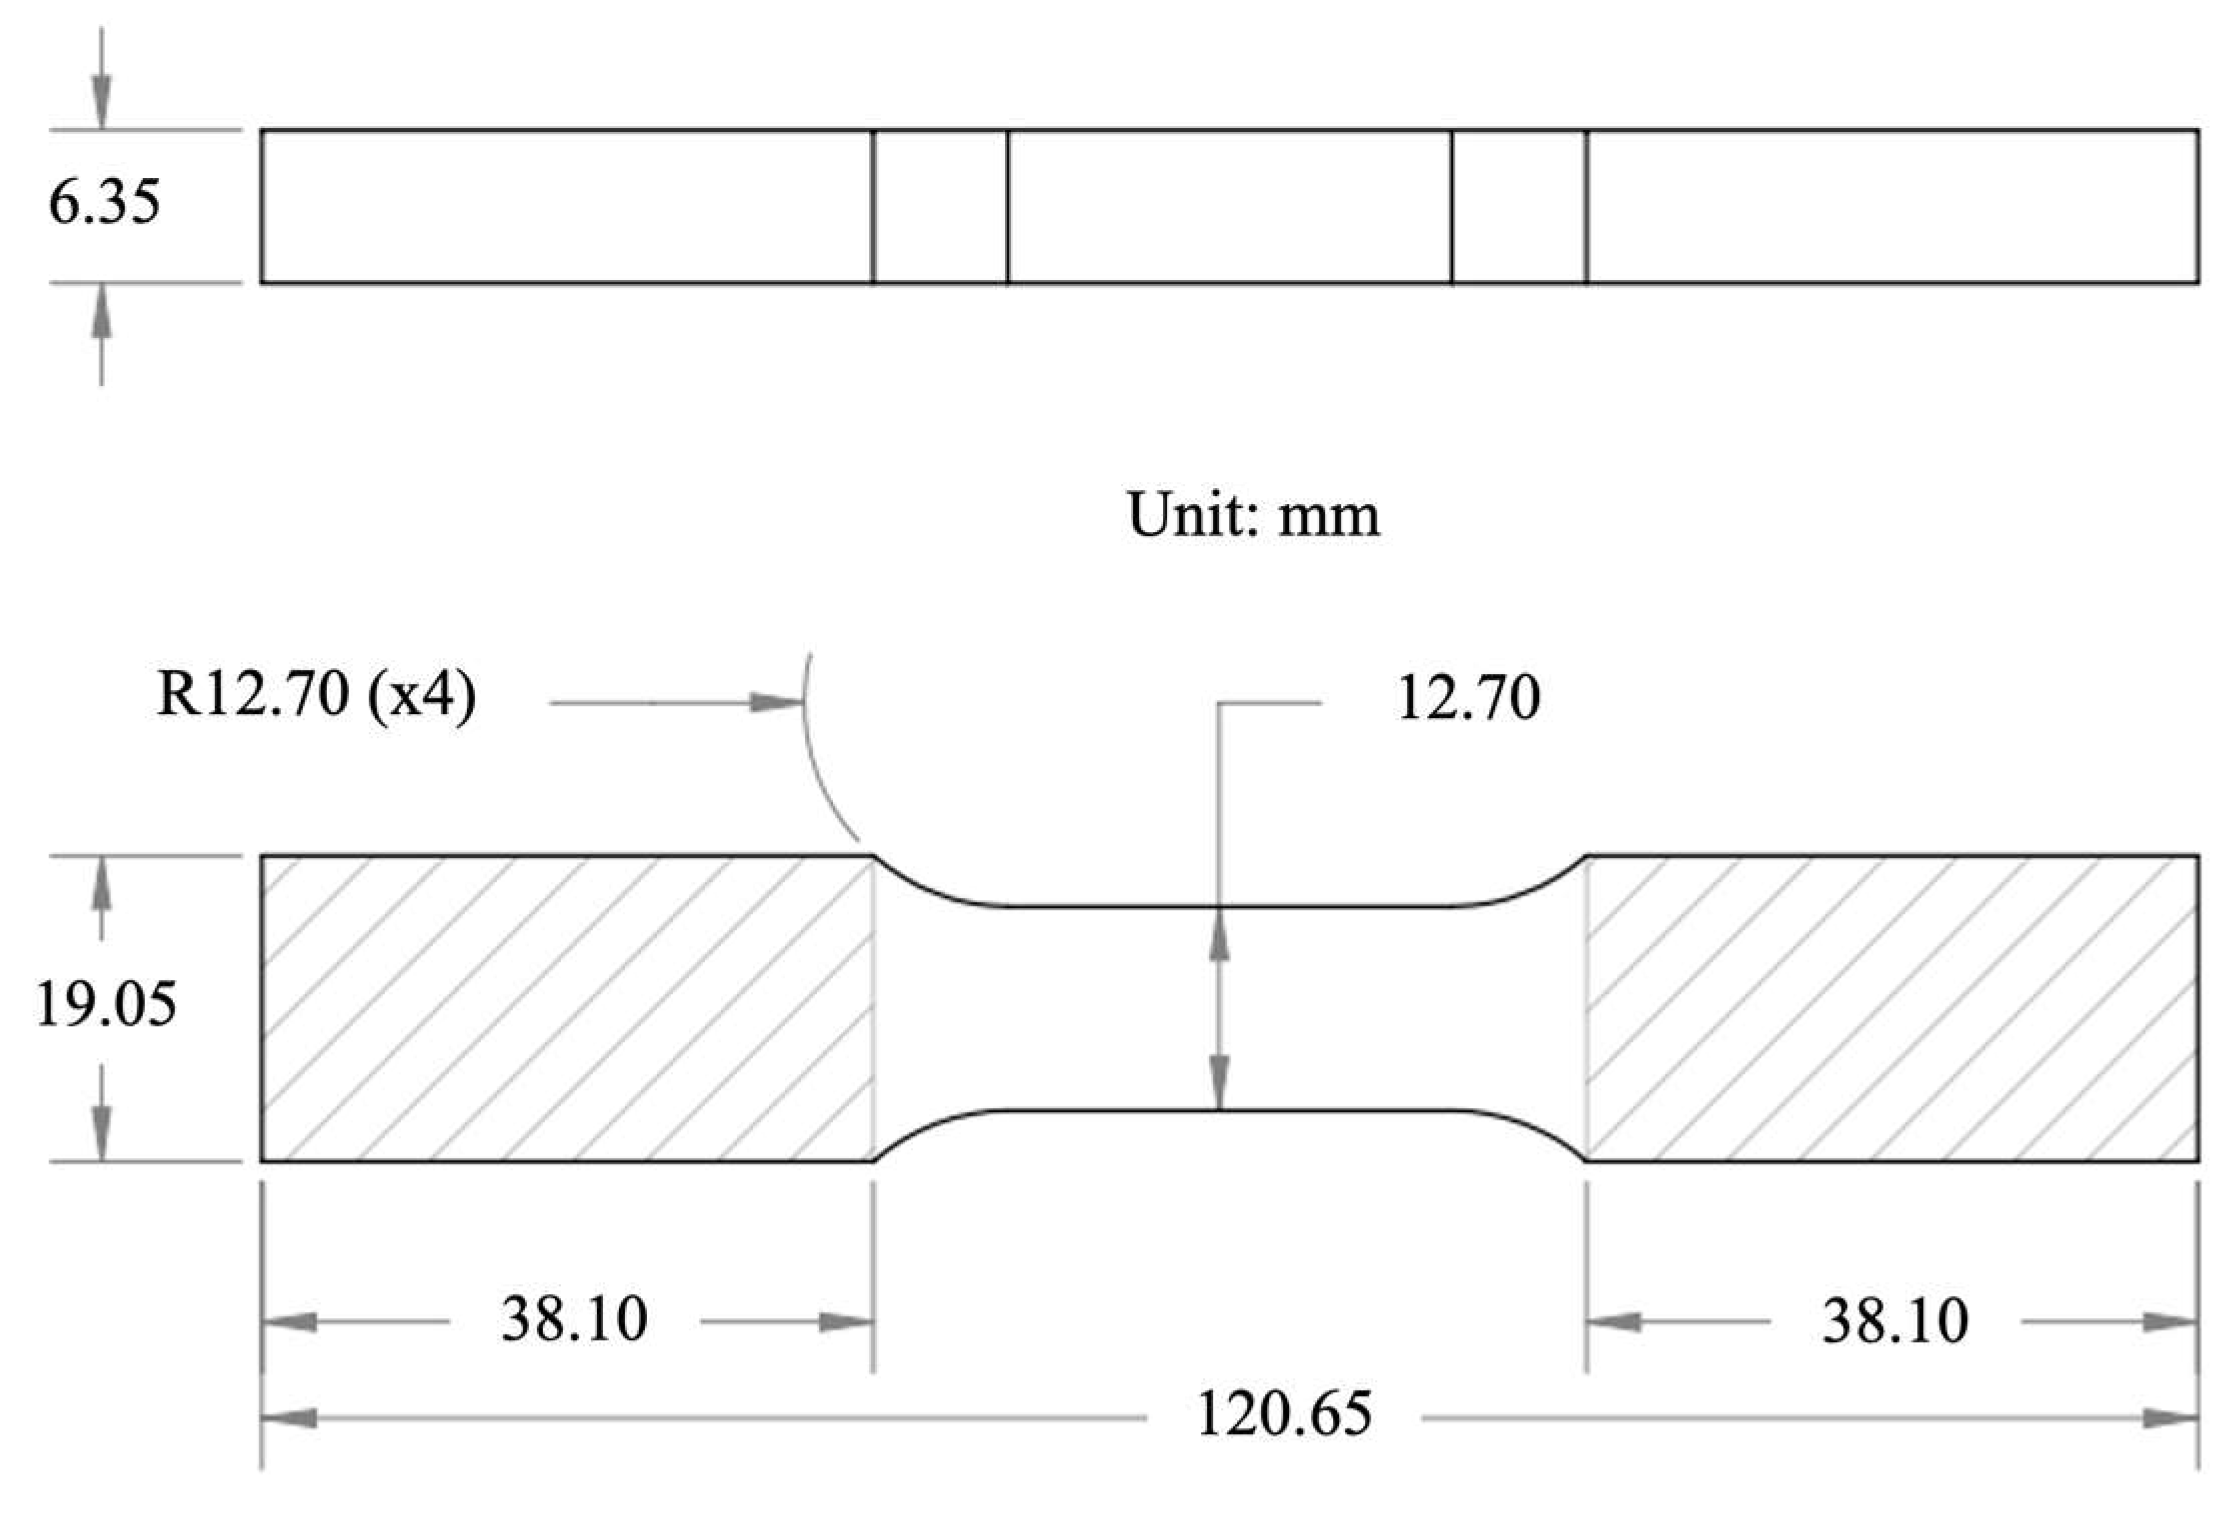
Multipass test welds were manufactured using the gas tungsten arc welding (GTAW) process with FM-52, FM-52M, FM-52i, and FM-52xl filler metals. All tested weld metal compositions are shown in Table 1. The test specimen geometry is detailed in Figure 1. The specimens were extracted from the wider upper region of the groove weld cross section with the large flat face being perpendicular to the welding direction. This allowed for the gauge section to be comprised almost entirely of weld metal.
Table 1.
Compositions of weld metals tested.
Figure 1.
Dog-bone specimen dimensions.
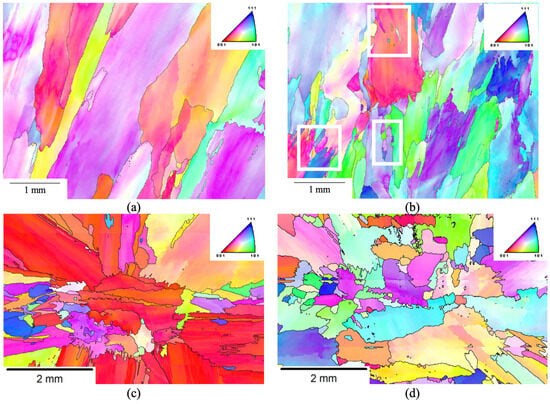
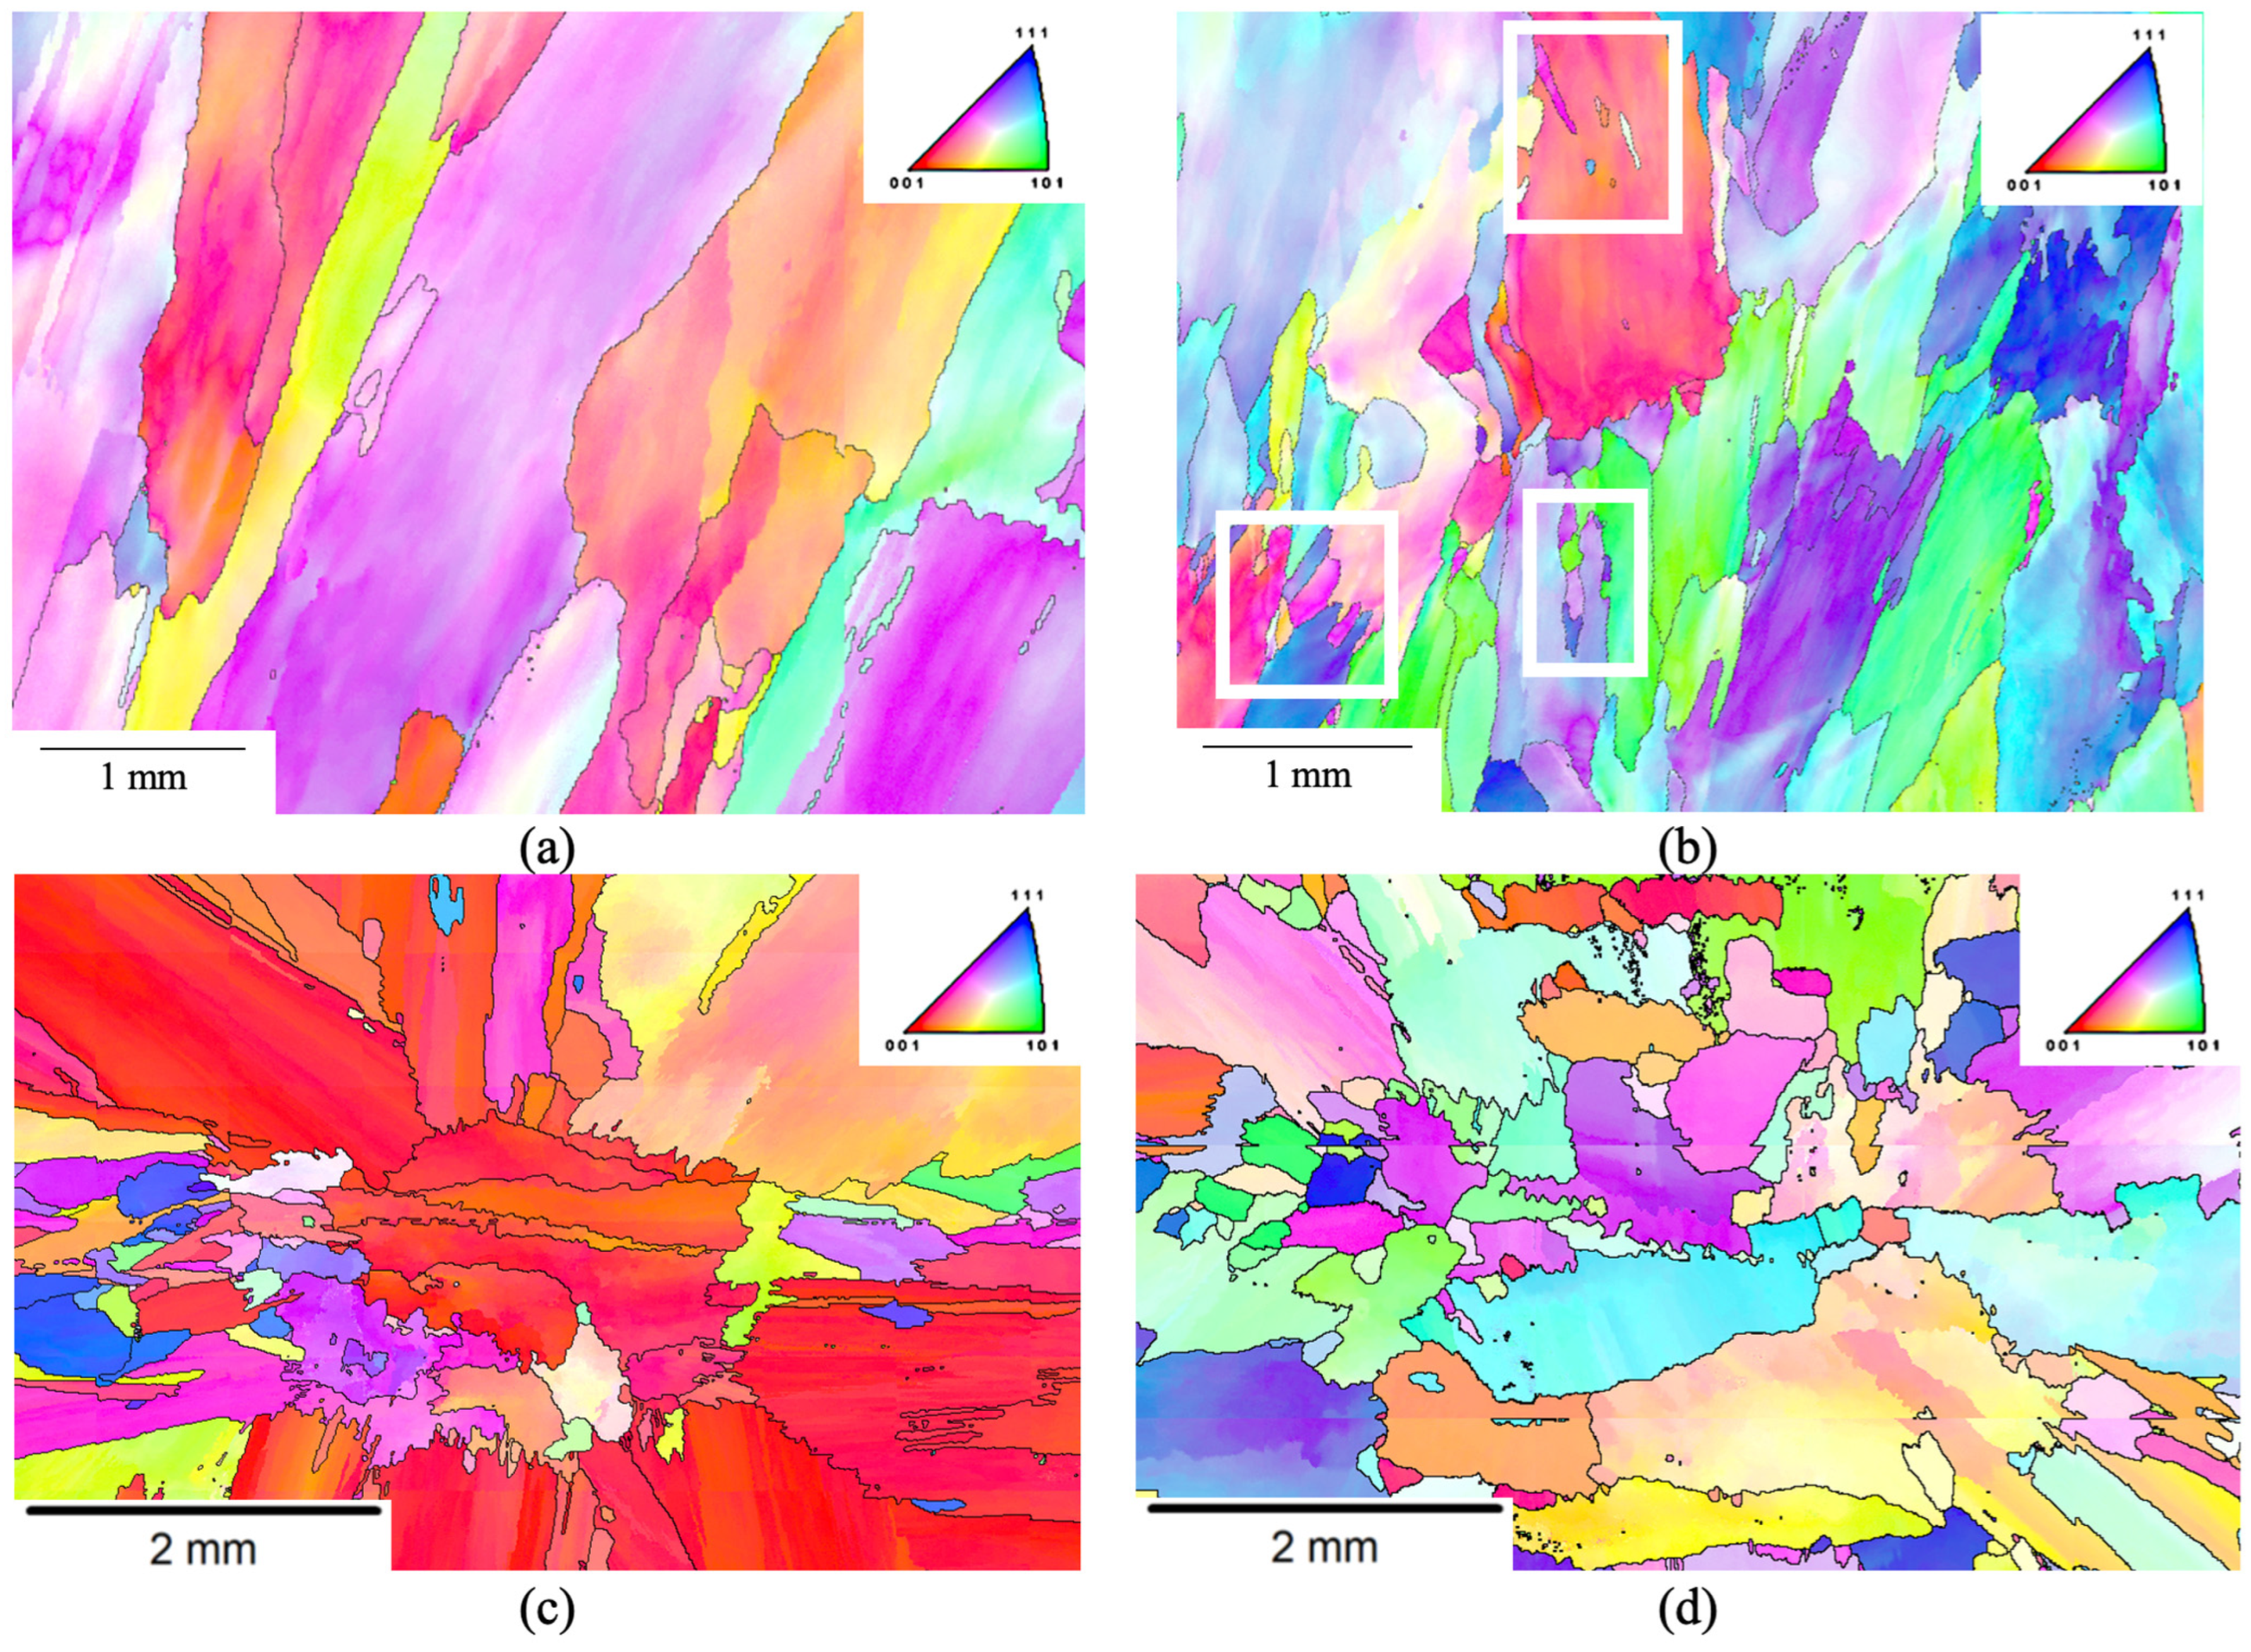
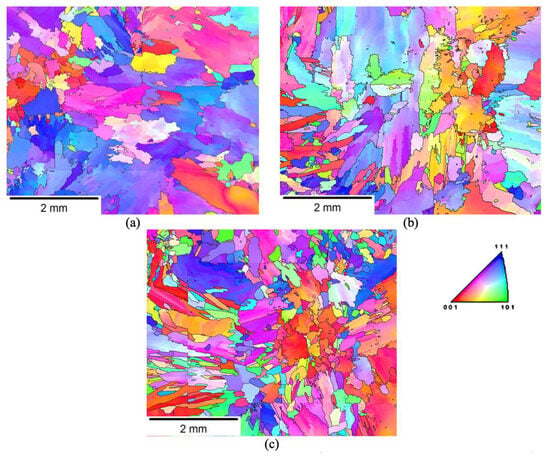
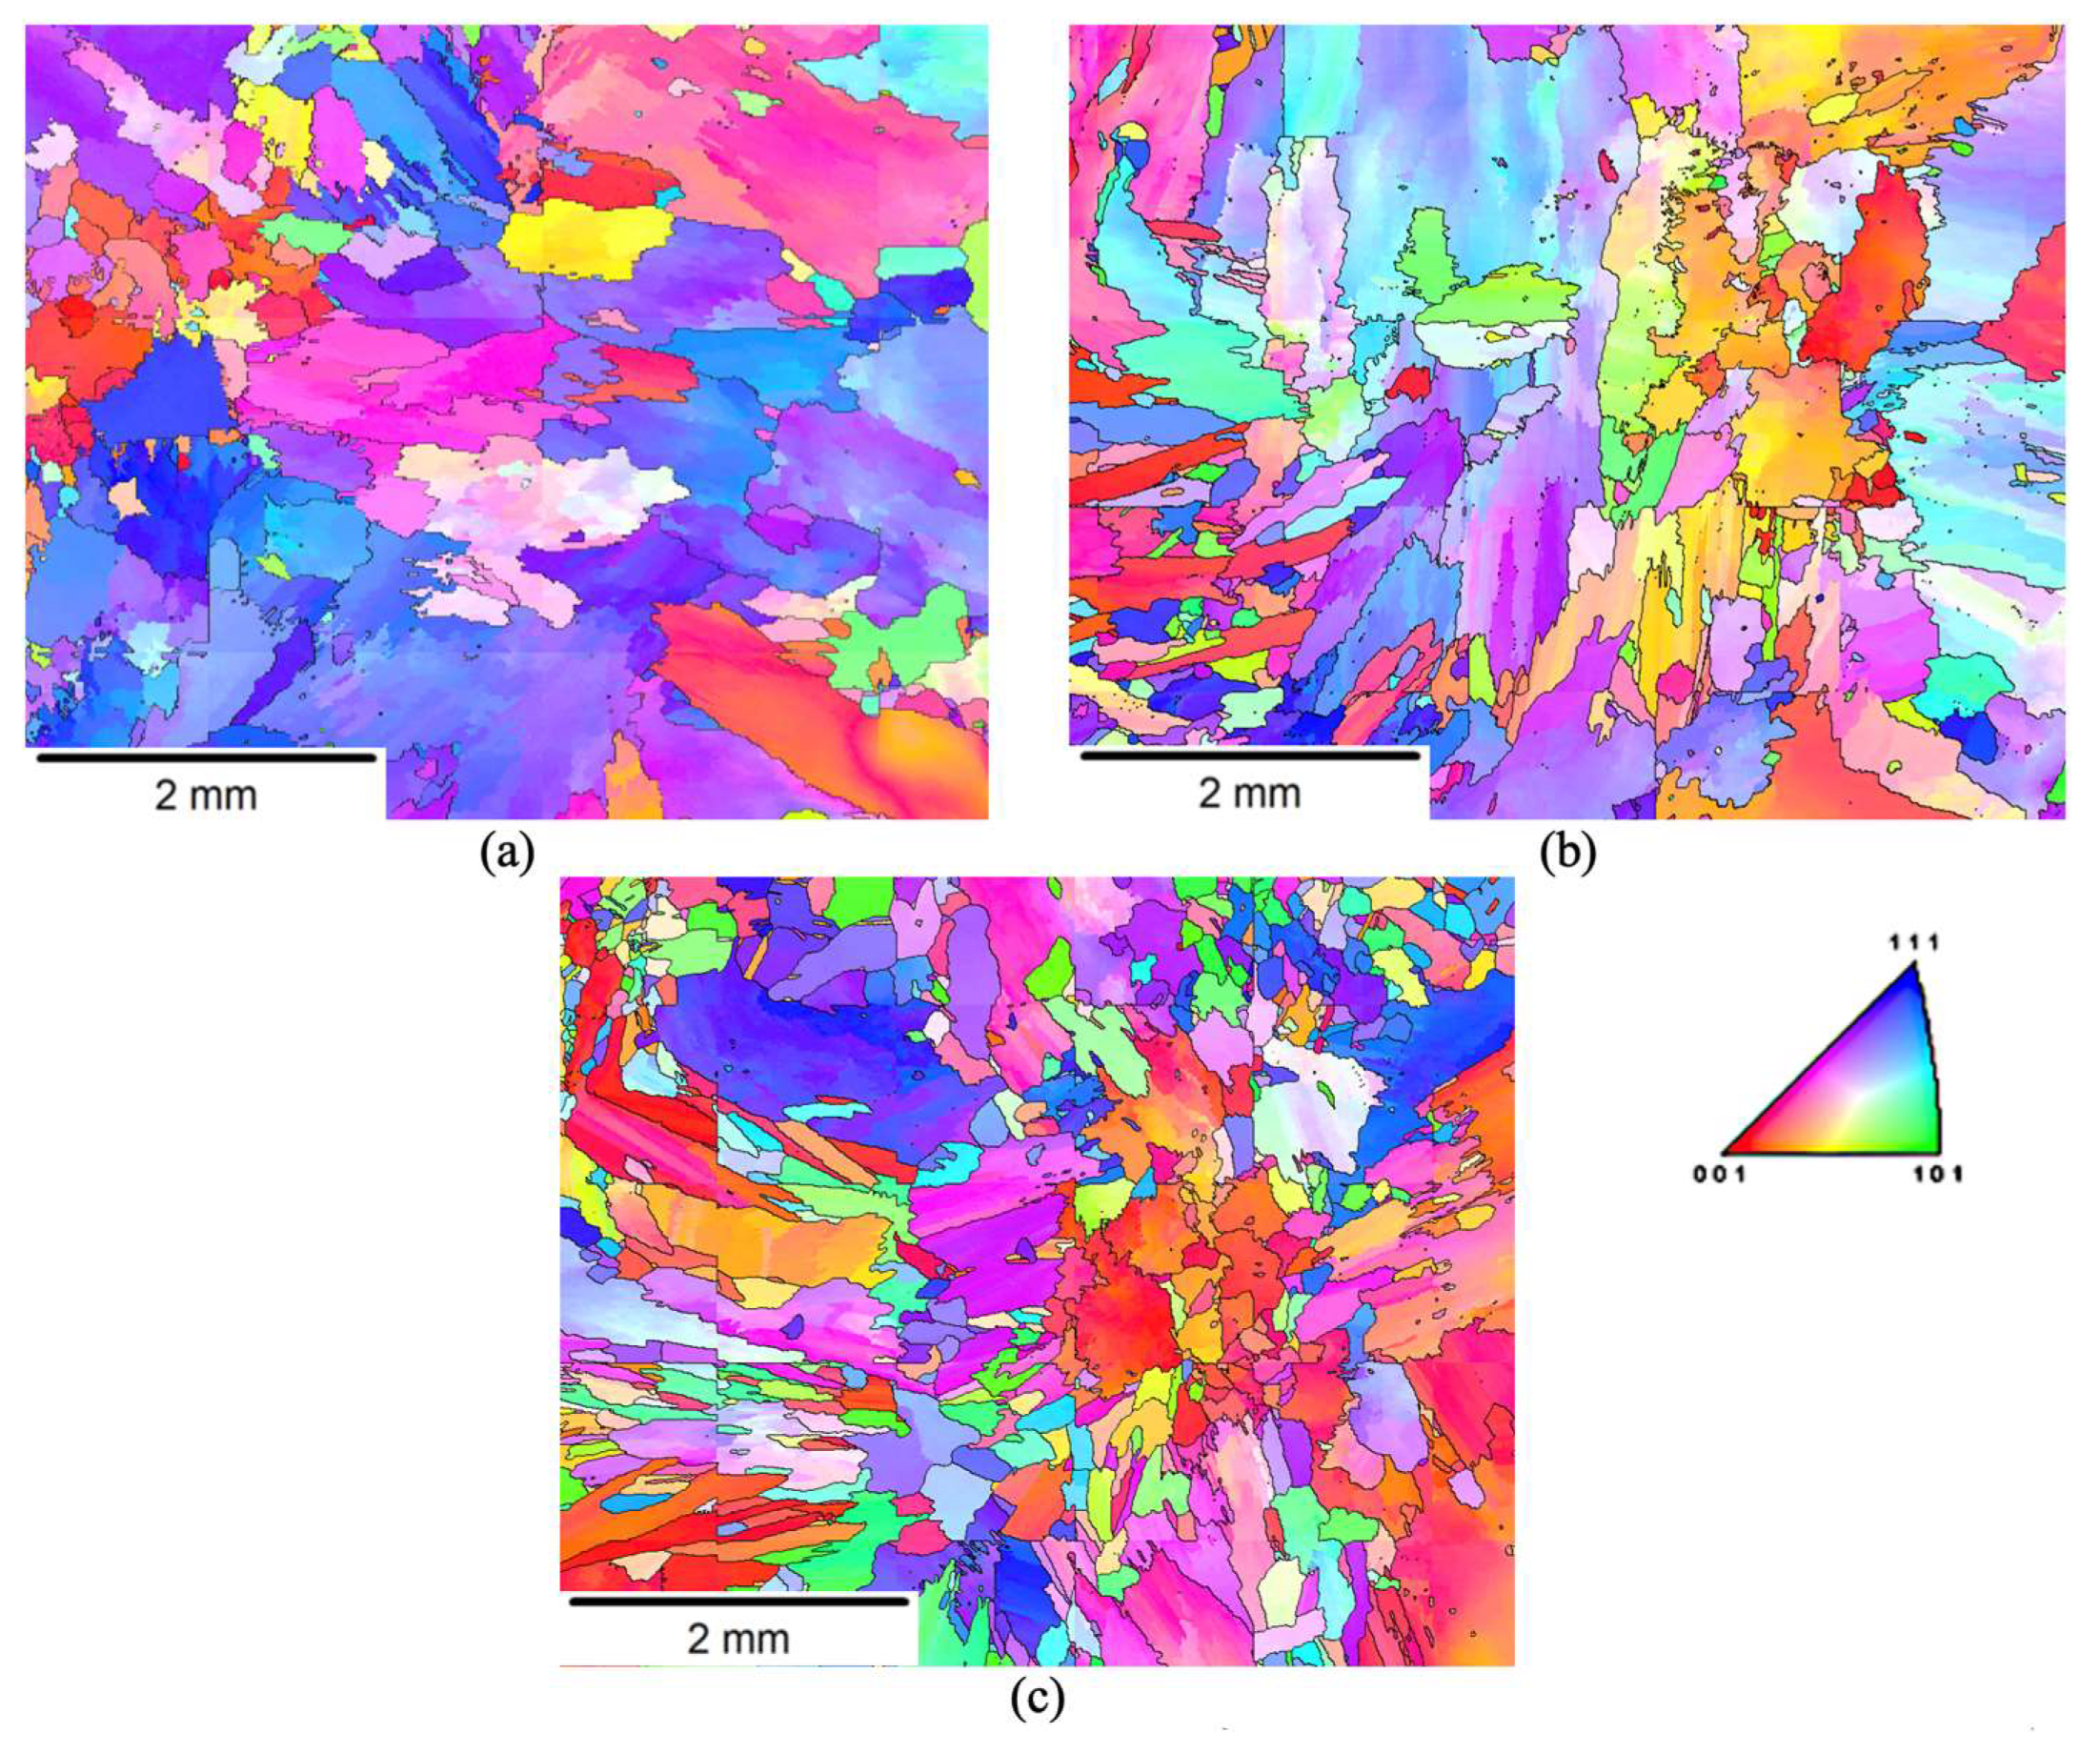
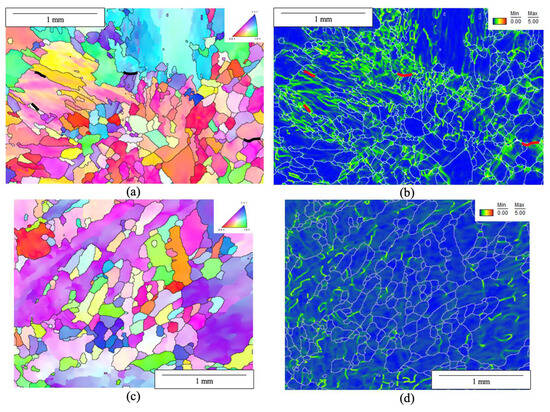
All tested specimens were spot-welded at the gauge center to generate a localized defect-free microstructure with radially oriented columnar grains for DDC analysis [38]. While as-solidified weld metal often exhibits grain orientations normal to its fusion boundary (Figure 2a), the radial orientation of the spot-weld microstructure (Figure 2c) enhances the likelihood of grains occupying DDC susceptible near-45° orientations [38]. Additionally, the use of a spot-weld eliminates recrystallization that may already be present in the microstructure (Figure 2b) for the purposes of recrystallization analysis. For all tested specimens, the spot-welded region is the only region analyzed throughout this work. The spot-welding procedure is shown in Table 2. Electromagnetic stirring was used to ensure consistent weld penetration between the outer edges and center of the spot-weld.
Figure 2.
FM-52 weld metal electron backscatter diffraction (EBSD) inverse pole figure (IPF) maps of as-solidified weld grain structure from a multipass weld: (a), multipass weld region subjected to multiple reheats resulting in recrystallization highlighted in white boxes (b), fresh spot-weld grain structure (c), spot-weld grain structure after dynamic recrystallization (DRX) test (d).
Table 2.
Spot-welding procedure.
2.2. Dynamic Recrystallization Test
DRX tests were conducted using the DSI Gleeble 3800TM thermo-mechanical simulator. Samples were heated to 1100 °C maintaining zero applied load, allowing unrestricted thermal expansion. Here, 1100 °C was selected, as this is the highest temperature at which the strain gauge could operate. High temperatures for this test are desired, as they would favor higher DRX kinetics [26]. Upon reaching the test temperature, specimens were deformed in uniaxial tension to a true strain of 2% at one of two strain rates: 10−3/s and 10−4/s. These strain rates were selected, as they are the most prevalent strain rates observed in thermo-mechanical finite element analysis (FEA) simulations of welds of high-chromium nickel-based filler metals [17]. Strain was measured using a strain gauge attached to the region where the spot-weld was made. A strain of 2% was selected to ensure that no cracking occurred during the DRX test. All DRX tests were conducted in a vacuum of ~0.3 torr. After deformation, specimens were allowed to free cool to room temperature maintaining zero applied force, permitting unrestricted contraction. For each weld metal, one specimen underwent the slower strain rate DRX test, and one specimen underwent the faster strain rate DRX test.
2.3. Strain-to-Fracture Testing
Strain-to-fracture (STF) testing was conducted with a similar methodology to the previous literature [21,33,38]. For each alloy, three specimens were tested: a specimen that underwent the DRX test at 10−3/s, a specimen that underwent the DRX test at 10−4/s, and an unstrained spot-welded specimen. All three specimens were placed in the Gleeble and heated to 950 °C at a rate of 100 °C/s, maintaining zero applied force. Specimens were held at 950 °C and pulled at a rate of 0.06 cm/s. All specimens were strained to 7% strain. Here, 950 °C was selected as the test temperature, since it is the temperature of minimum ductility for most FM-52 alloys, and a 7% strain was selected, as this is well into the cracking range of the DTR curve for most FM-52 alloys to ensure cracking [12]. The strain was measured in the same fashion as in the DRX test. Once specimens reached the desired strain, they were free cooled with zero applied force. All STF testing was conducted in a vacuum of ~0.3 torr like the DRX test.
2.4. Characterization
The spot-welded regions of the DRX tested specimens were sectioned, mechanically ground, and polished. The final polish was performed using 0.05-micron colloidal silica. To characterize recrystallization, EBSD maps were generated using the Thermo Fisher Scientific Quattro environmental scanning electron microscope (ESEM) (Thermo Fisher Scientific, Waltham, MA, USA) and EDAX Velocity EBSD Camera (AMETEK EDAX, Mahwah, NJ, USA) at 20 kV, 1.6 nA, with a 25 mm working distance, and a 70° tilt angle. All EBSD scans used a 3-micron step size. Data were collected using EDAX Apex EBSD and analyzed using EDAX OIM Analysis 9 (AMETEK EDAX, Mahwah, NJ, USA). The average grain surface area was quantified using OIM Analysis 9 for each weld metal’s specimens in the spot-welded condition and after the 10−3/s and 10−4/s DRX tests. Grain refinement was calculated using Equation (1):
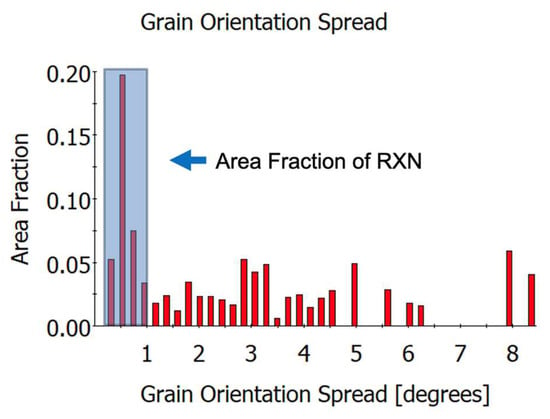
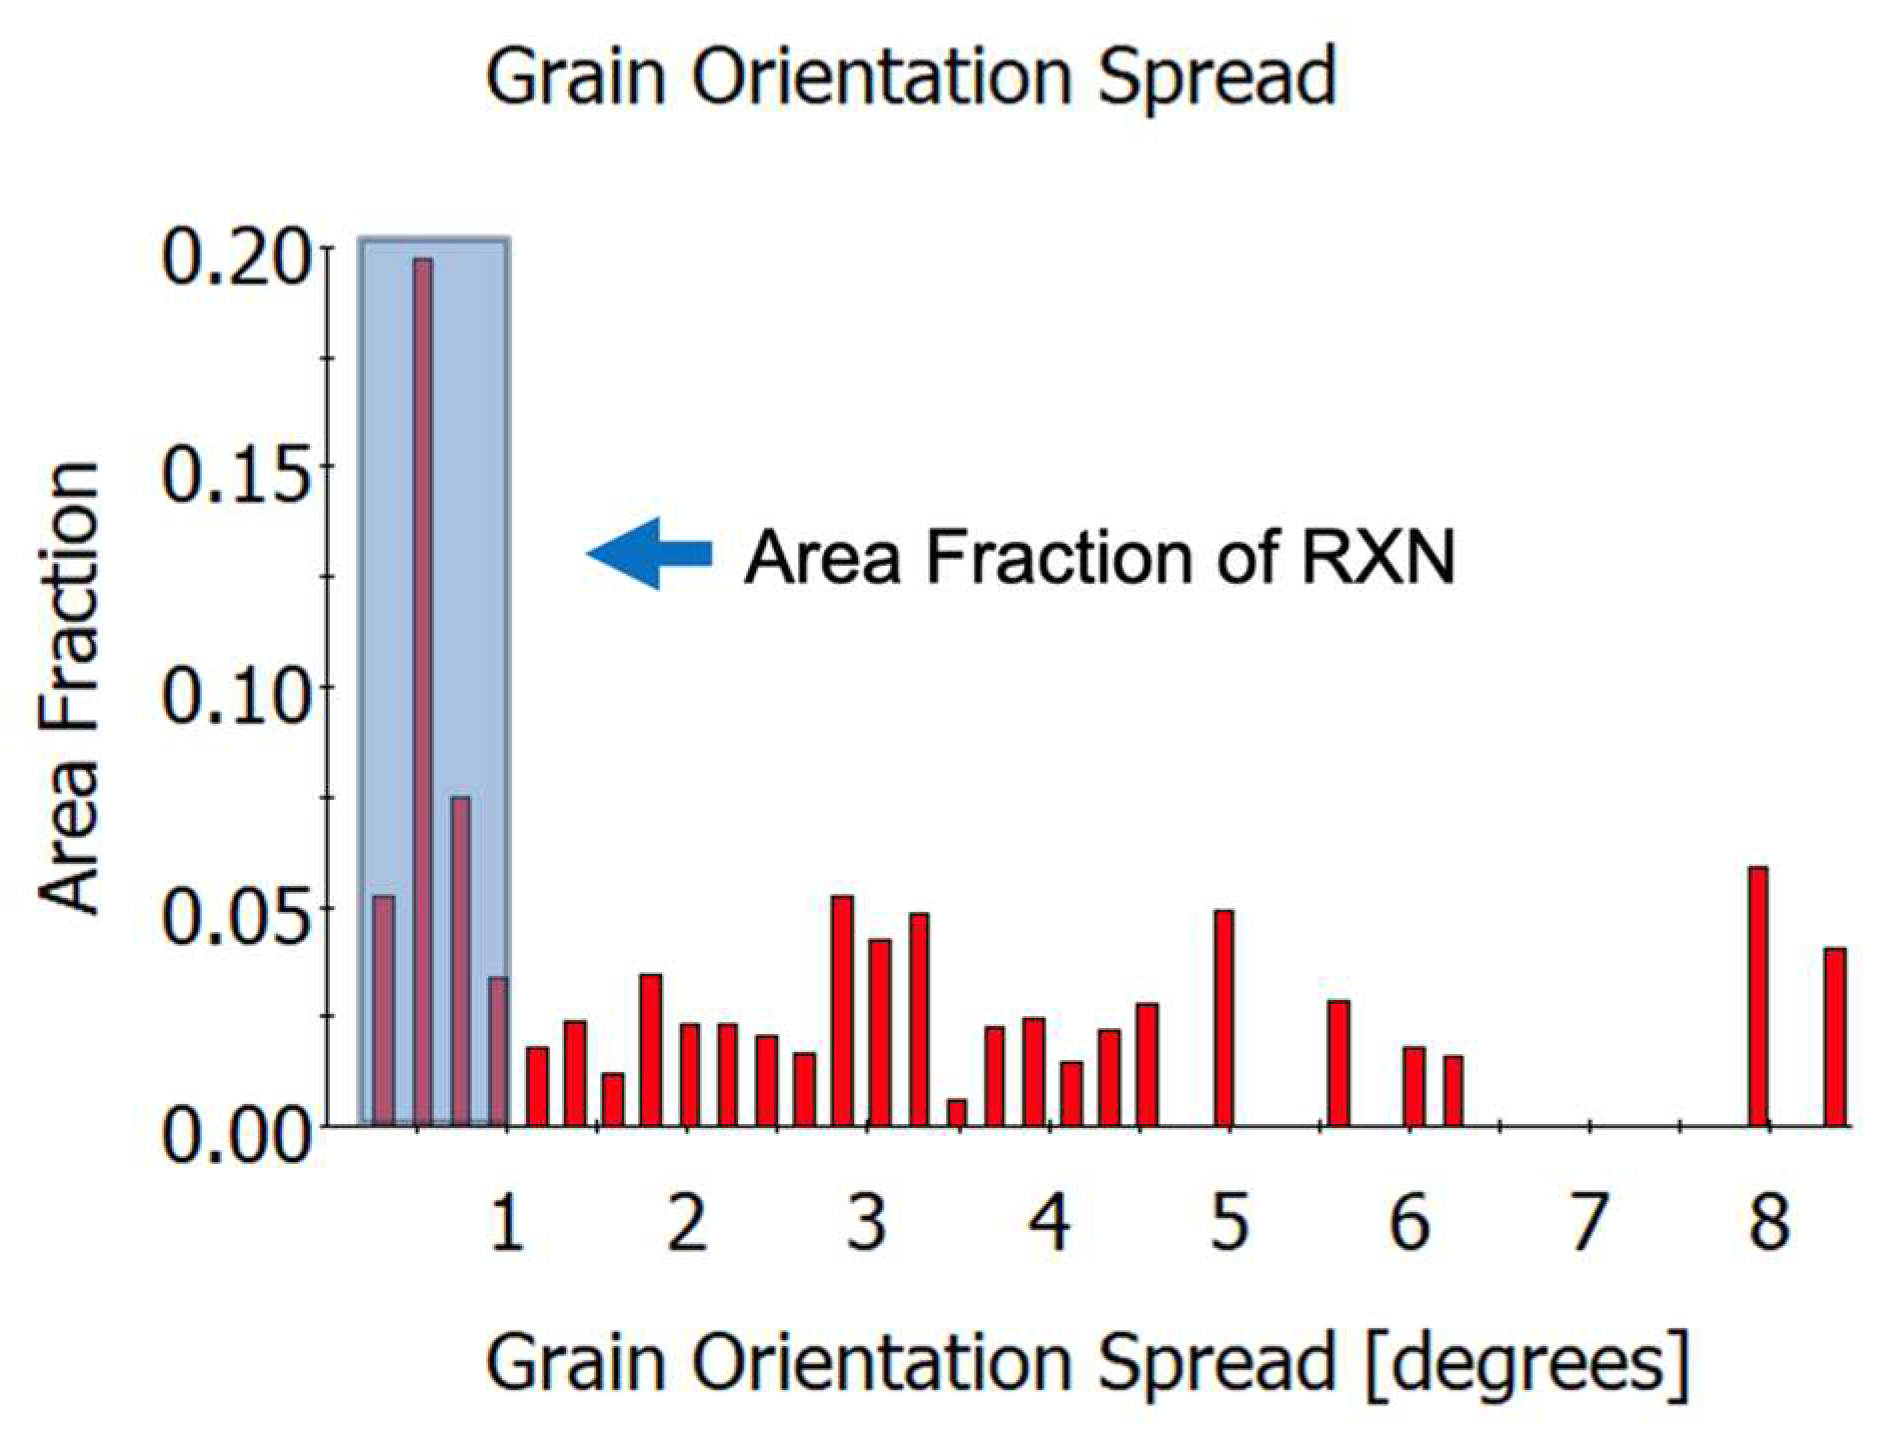
The recrystallized area fraction was determined by the plotting grain area as a function of GOS. All grains below 1° misorientation were considered recrystallized (Figure 3). The total area fraction under the peaks within the 1° GOS threshold is calculated using OIM Analysis 9 and then multiplied by 100 to determine the extent of recrystallization. The recrystallization rate sensitivity is calculated using Equation (2):
Figure 3.
Integral of peak between 0° and 1° is the area fraction of recrystallized grains.
These metrics allowed for comparisons of recrystallized fractions across different weld metals and strain-rate conditions, providing insight into the DRX behavior of each alloy.
Transmission electron microscopy (TEM) specimens were prepared from the same DRX-tested samples used for EBSD. Because the EBSD-polished surface corresponded to the region of interest, thinning was performed exclusively from the opposite (unpolished) side. Specifically, the unpolished side was mechanically ground using silicon carbide paper up to 1200 grit to reduce the overall thickness to ~100 µm. Subsequently, 3 mm discs were punched and electropolished to electron transparency using a 5 vol.% perchloric acid–95 vol.% methanol solution in a TenuPol-5 twin-jet unit at 30 V and −30 °C. Scanning transmission electron microscopy (STEM) investigations were conducted in an aberration-corrected Thermo Fisher Scientific ThemisZ operated at 200 kV. Dislocation structures and dislocation–carbide interactions were imaged on-zone using annular bright-field (ABF) conditions. Energy-dispersive X-ray spectroscopy (EDS) maps were acquired using the Super-X detector system. EDS quantification was performed in Thermo Fisher Scientific’s Velox software version 3.0, using Cliff–Lorimer analysis with the Brown–Powell ionization model and standard k-factors.
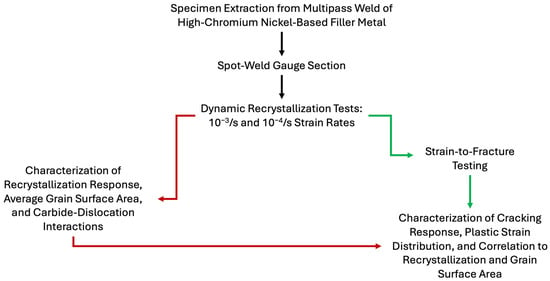
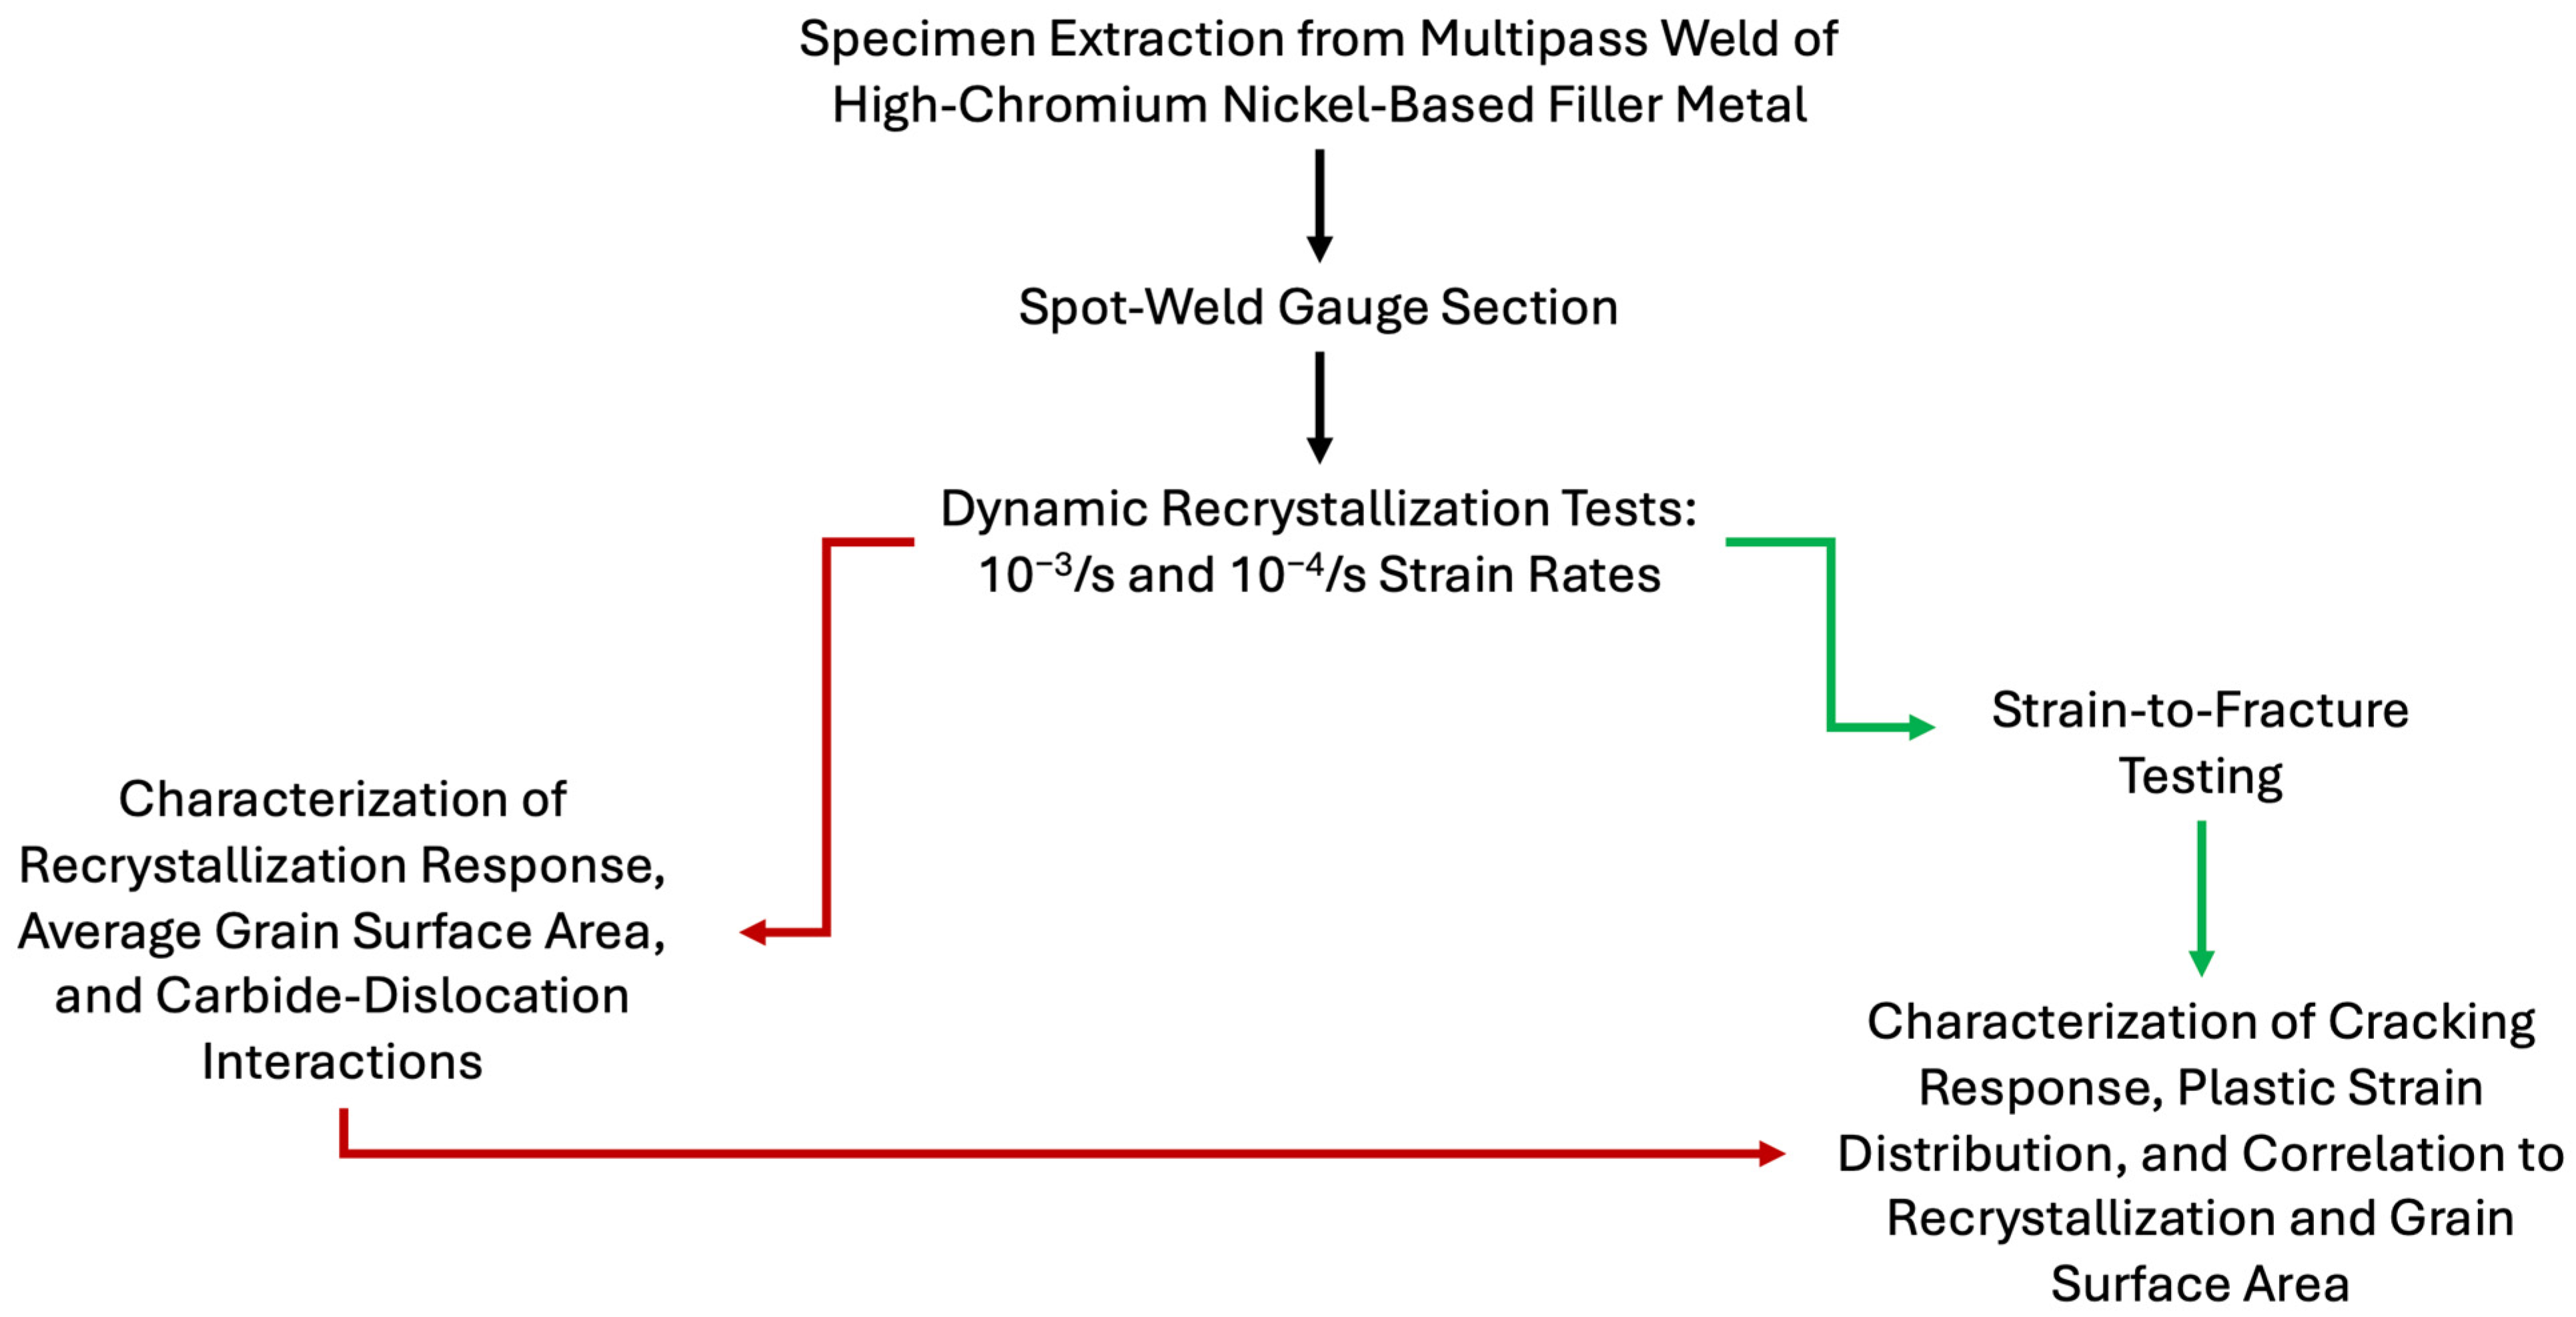
STF specimens were electrolytically etched with 10% chromic acid at 12 V for 12 s. Samples were characterized for cracks using light optical microscopy at a magnification of 50×, 100×, and 200×. EBSD and kernel average misorientation (KAM) maps were generated using the same equipment, procedure, and software as the DRX tested specimens. KAM is the average misorientation angle between pixel in an EBSD scan and its neighboring points, allowing for the analysis of plastic strain distributions. A schematic describing the experimental workflow detailed in Section 2 is shown in Figure 4.
Figure 4.
Schematic describing experimental workflow.
3. Results
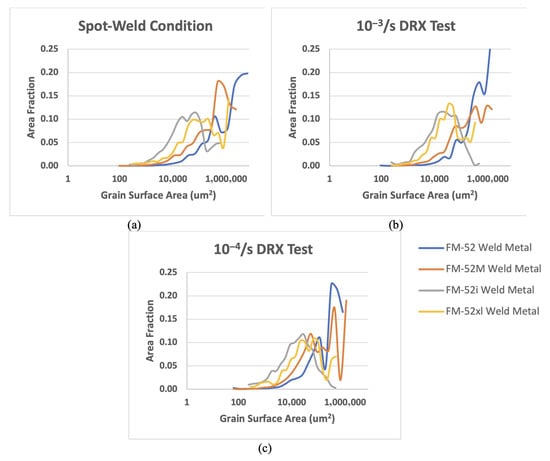
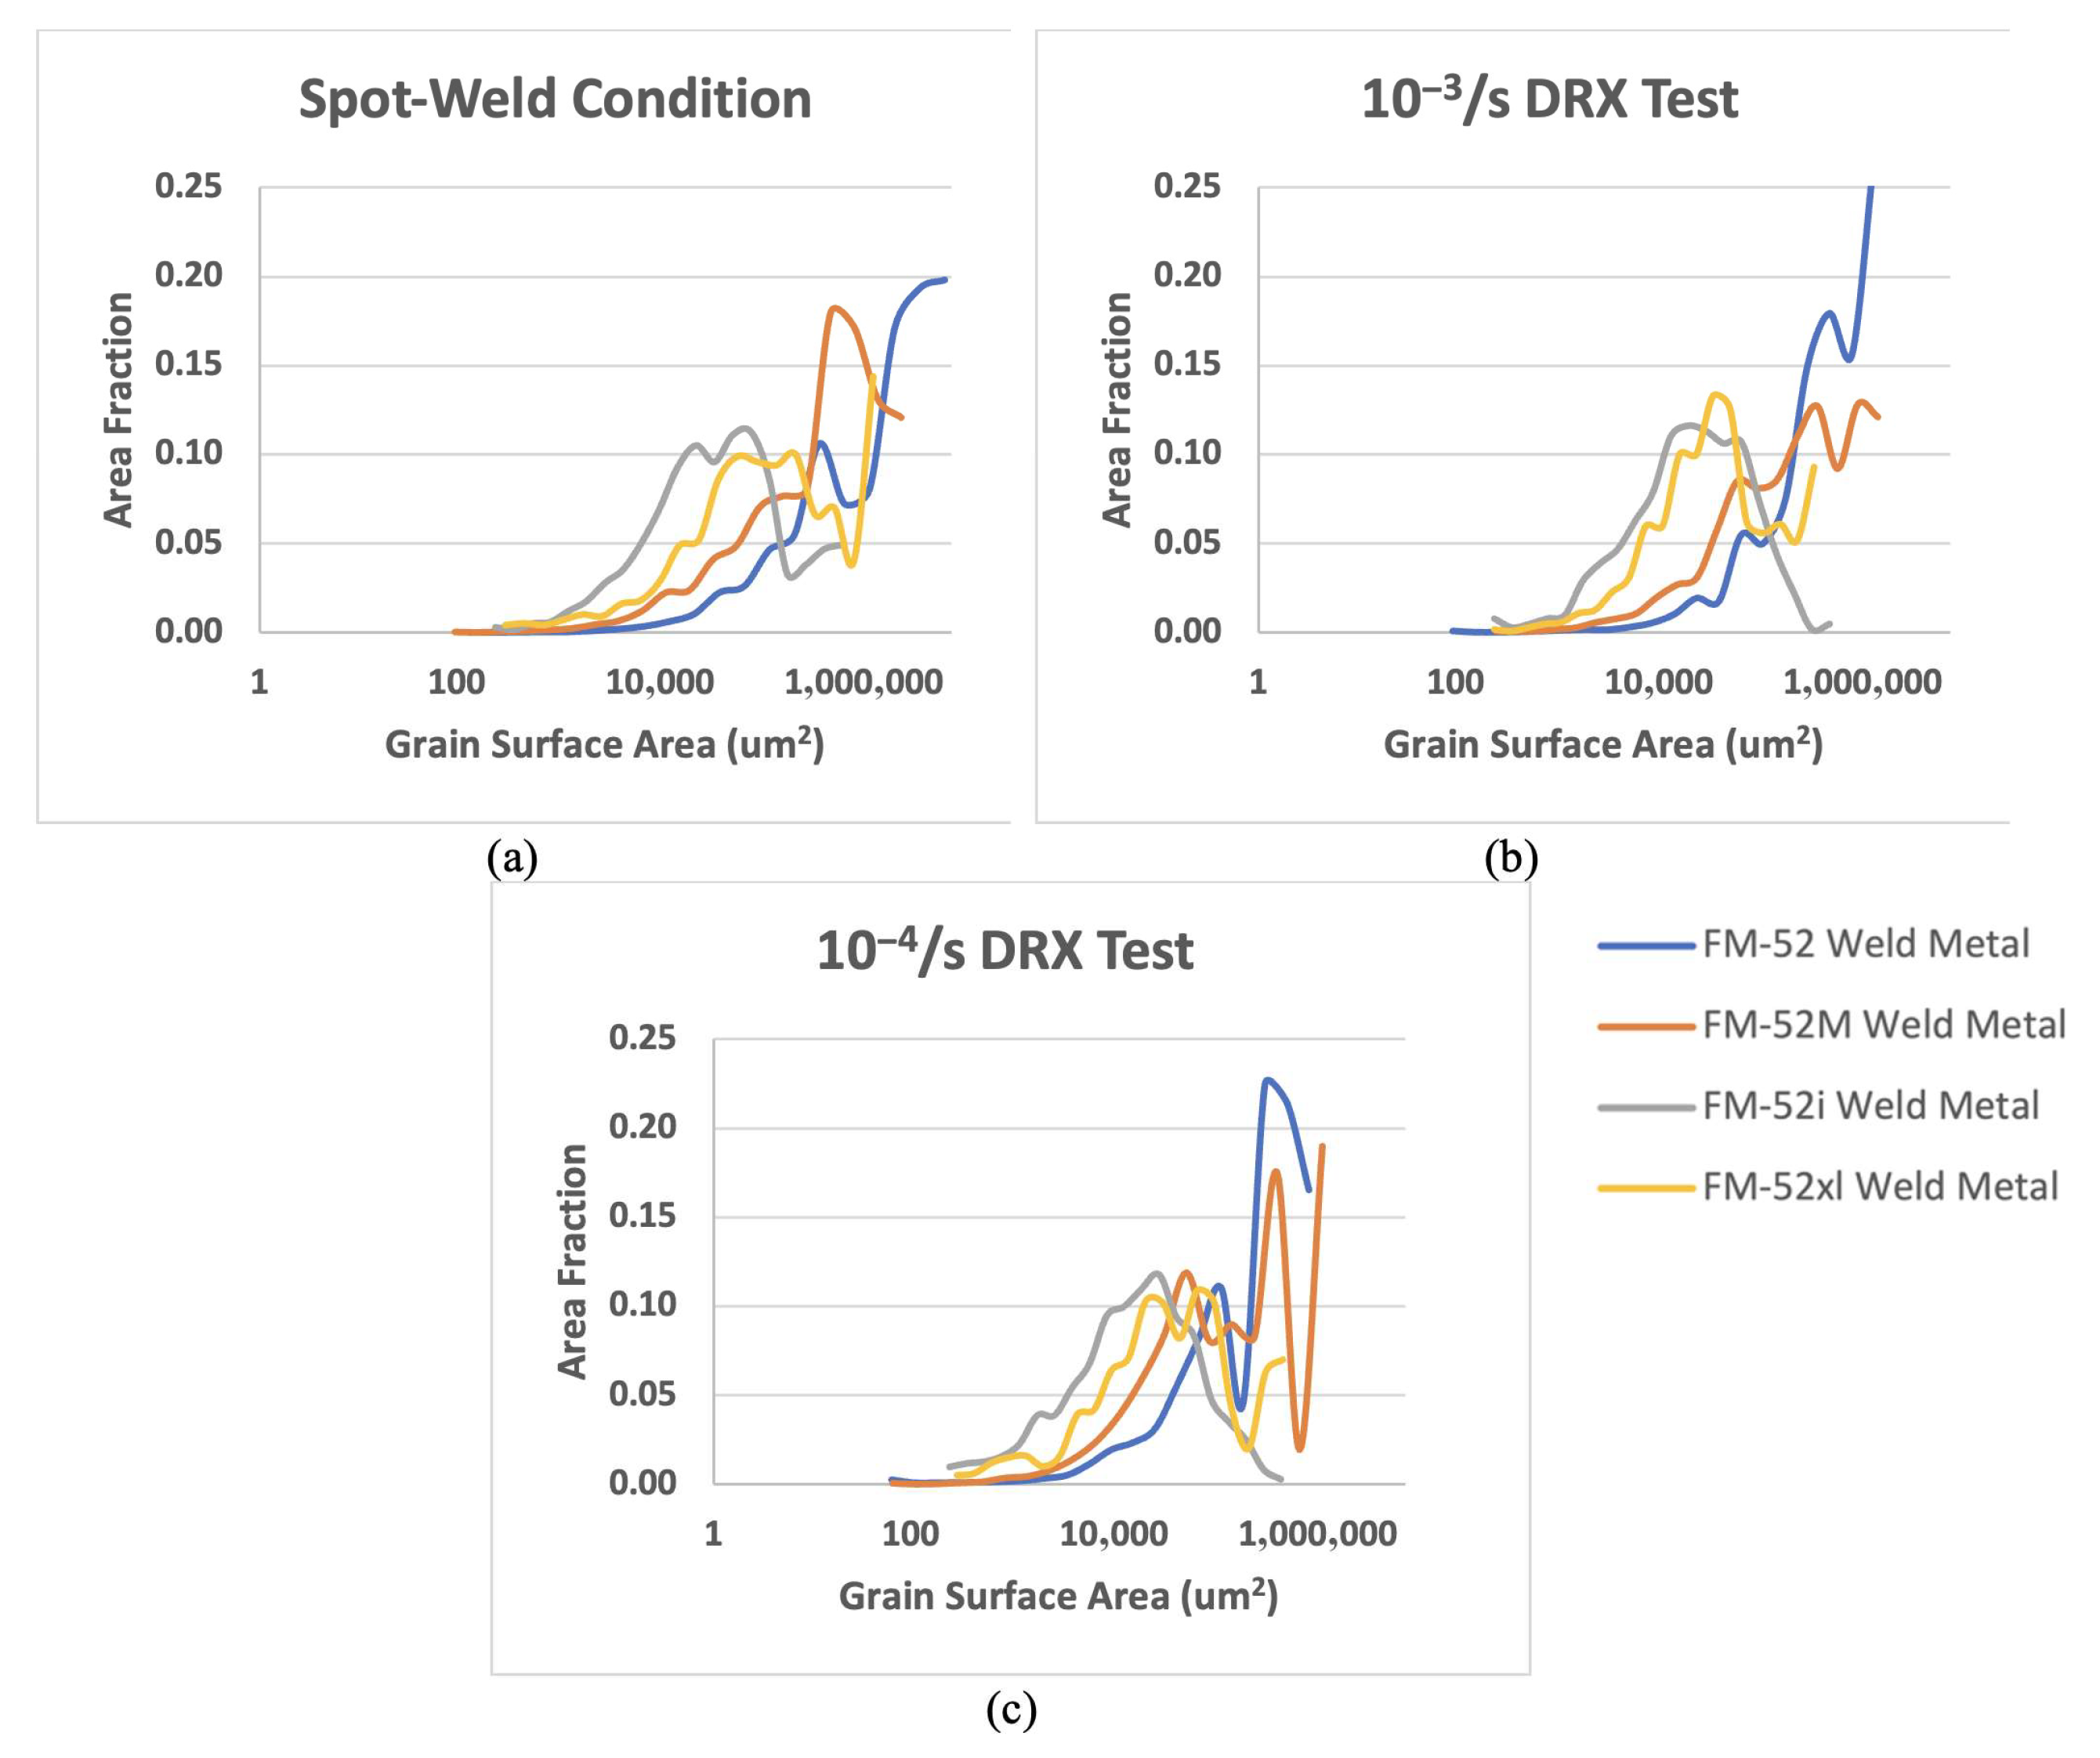
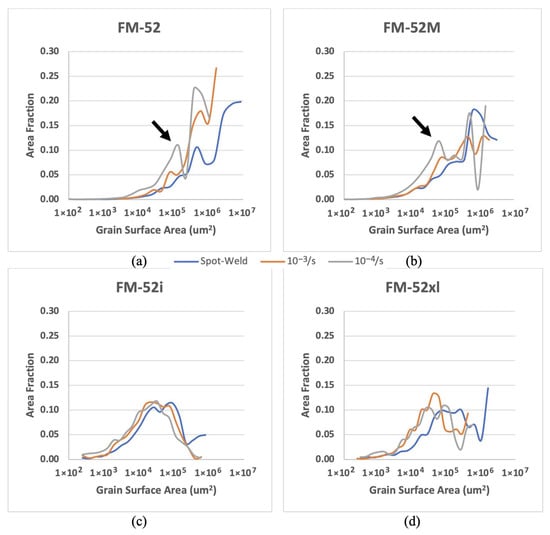
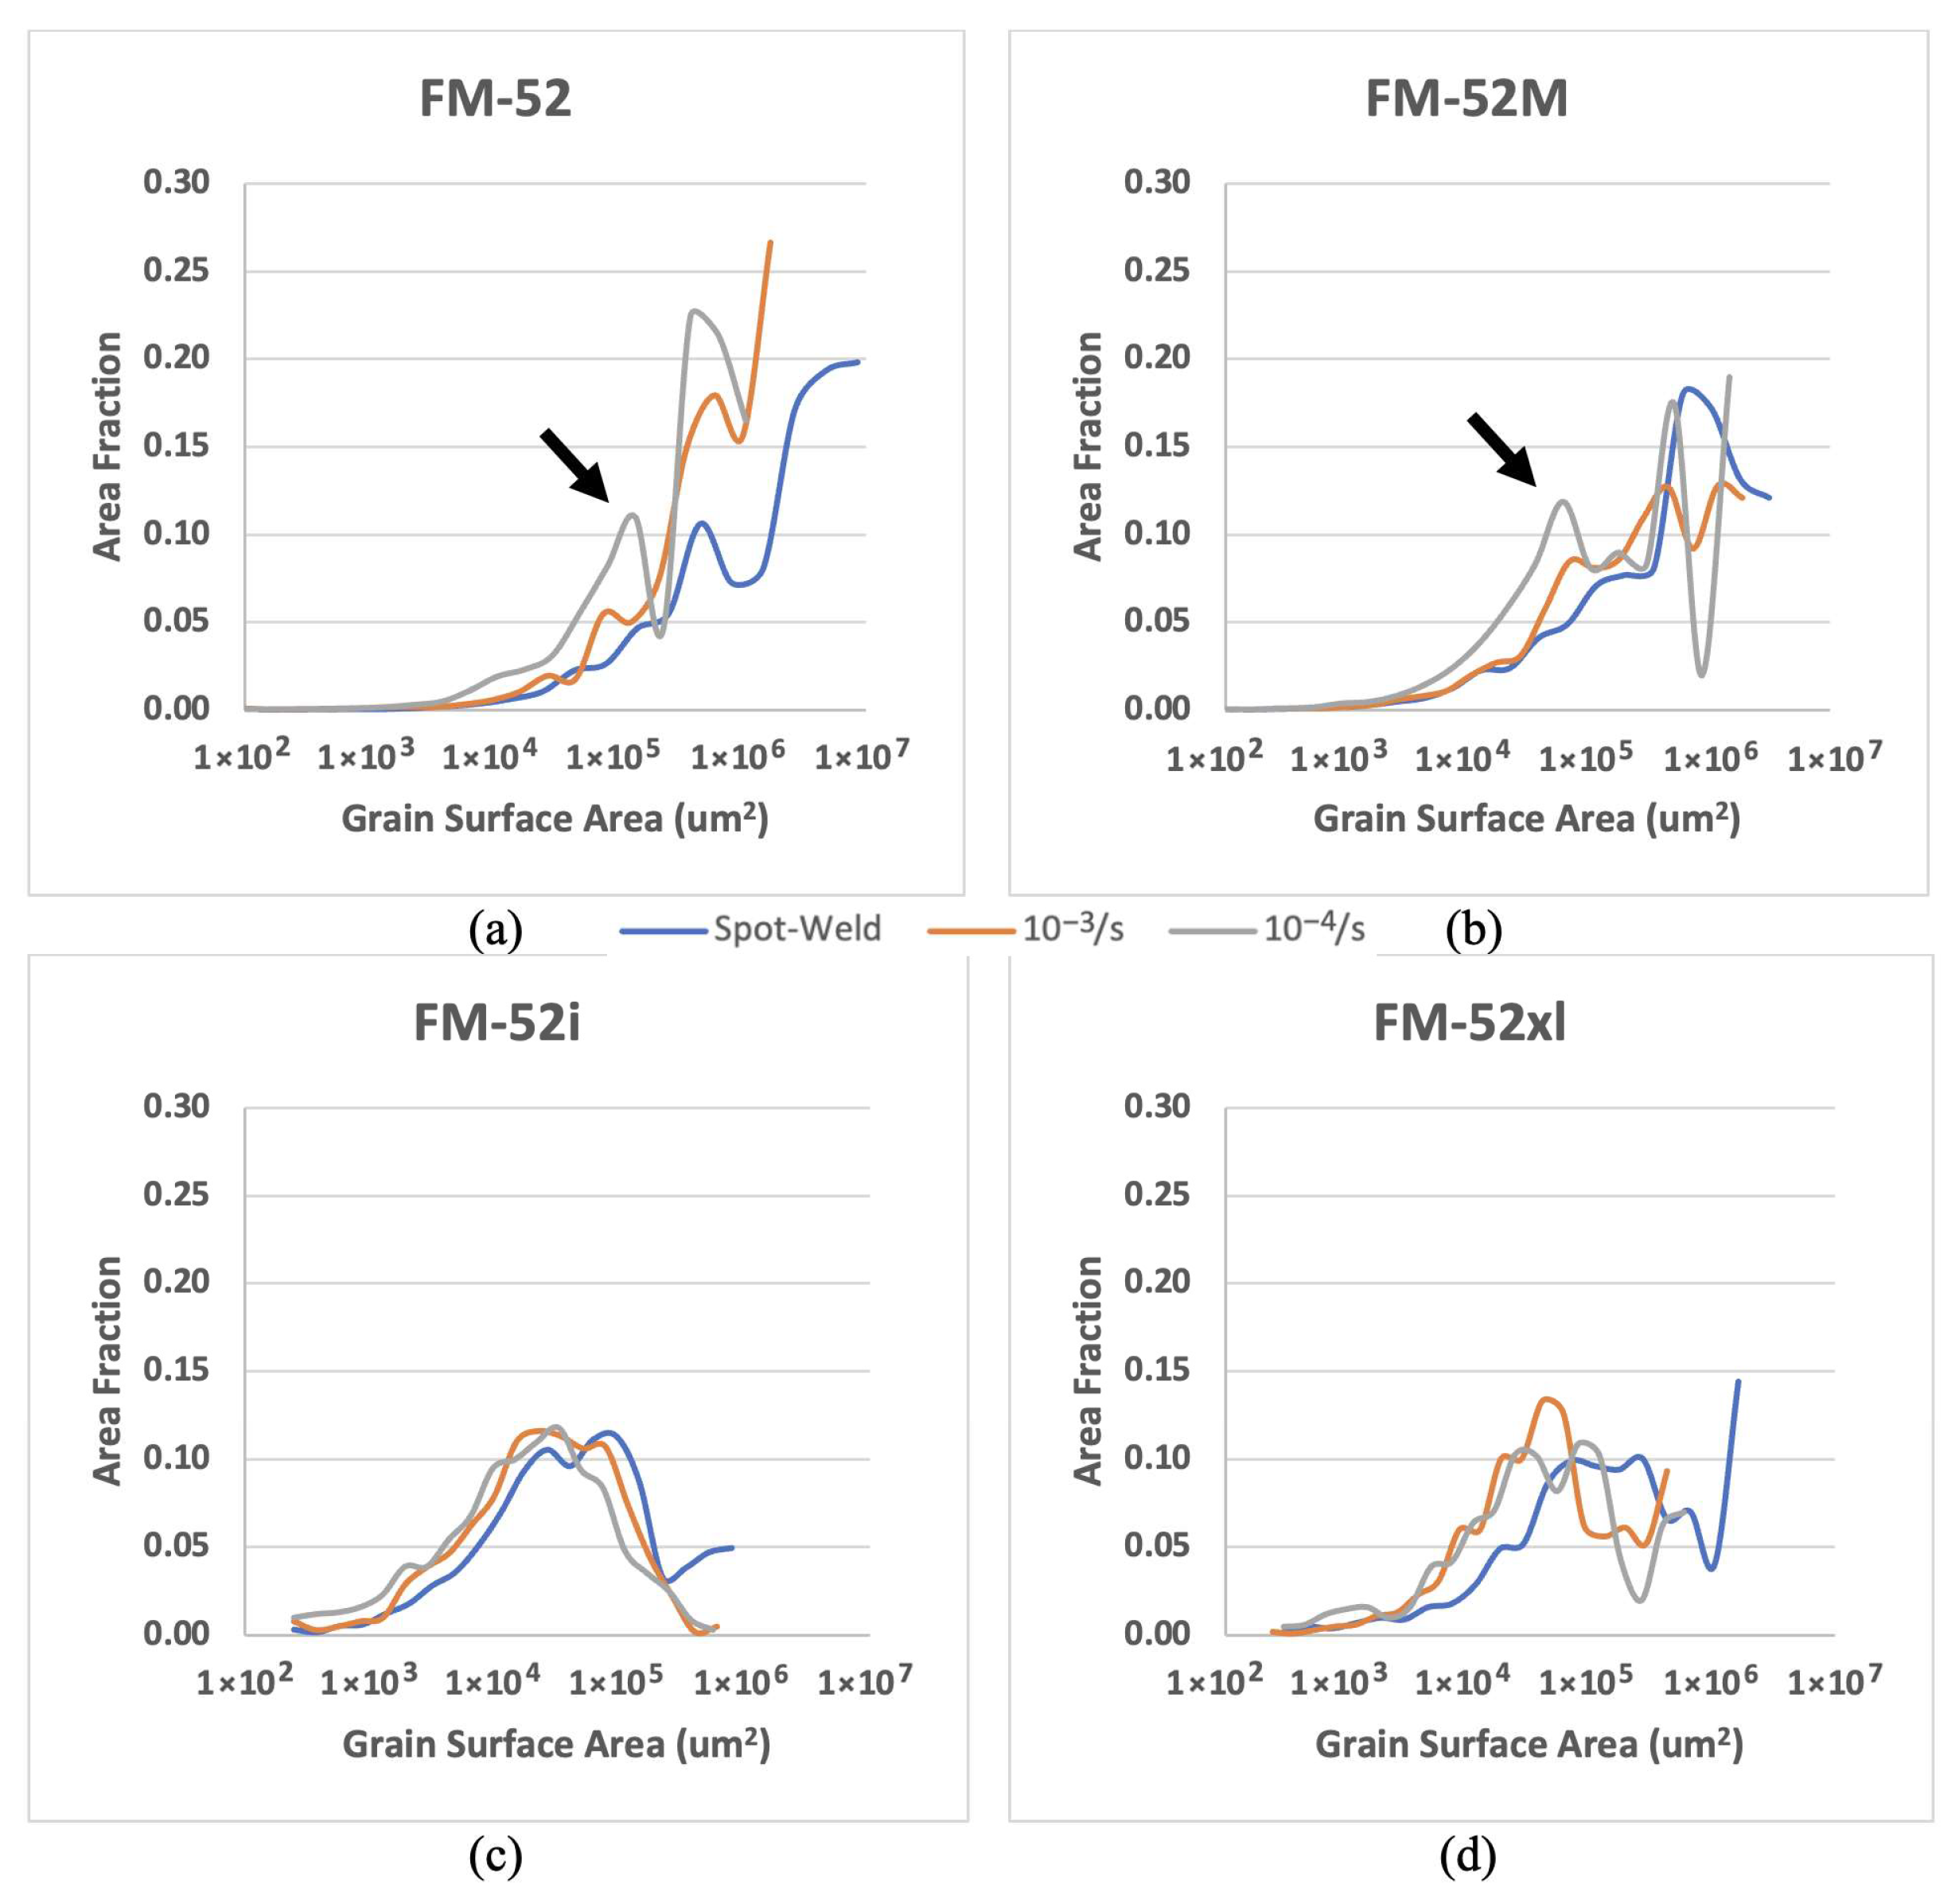
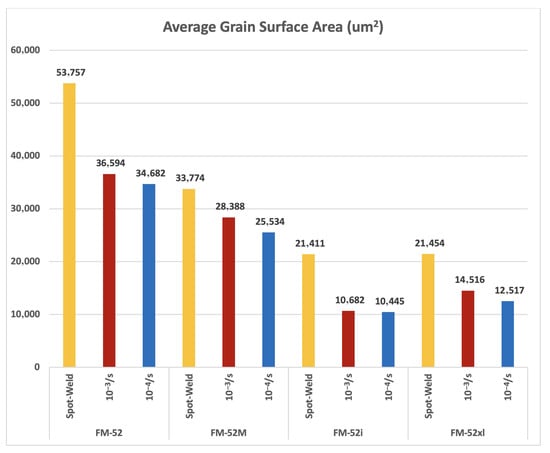
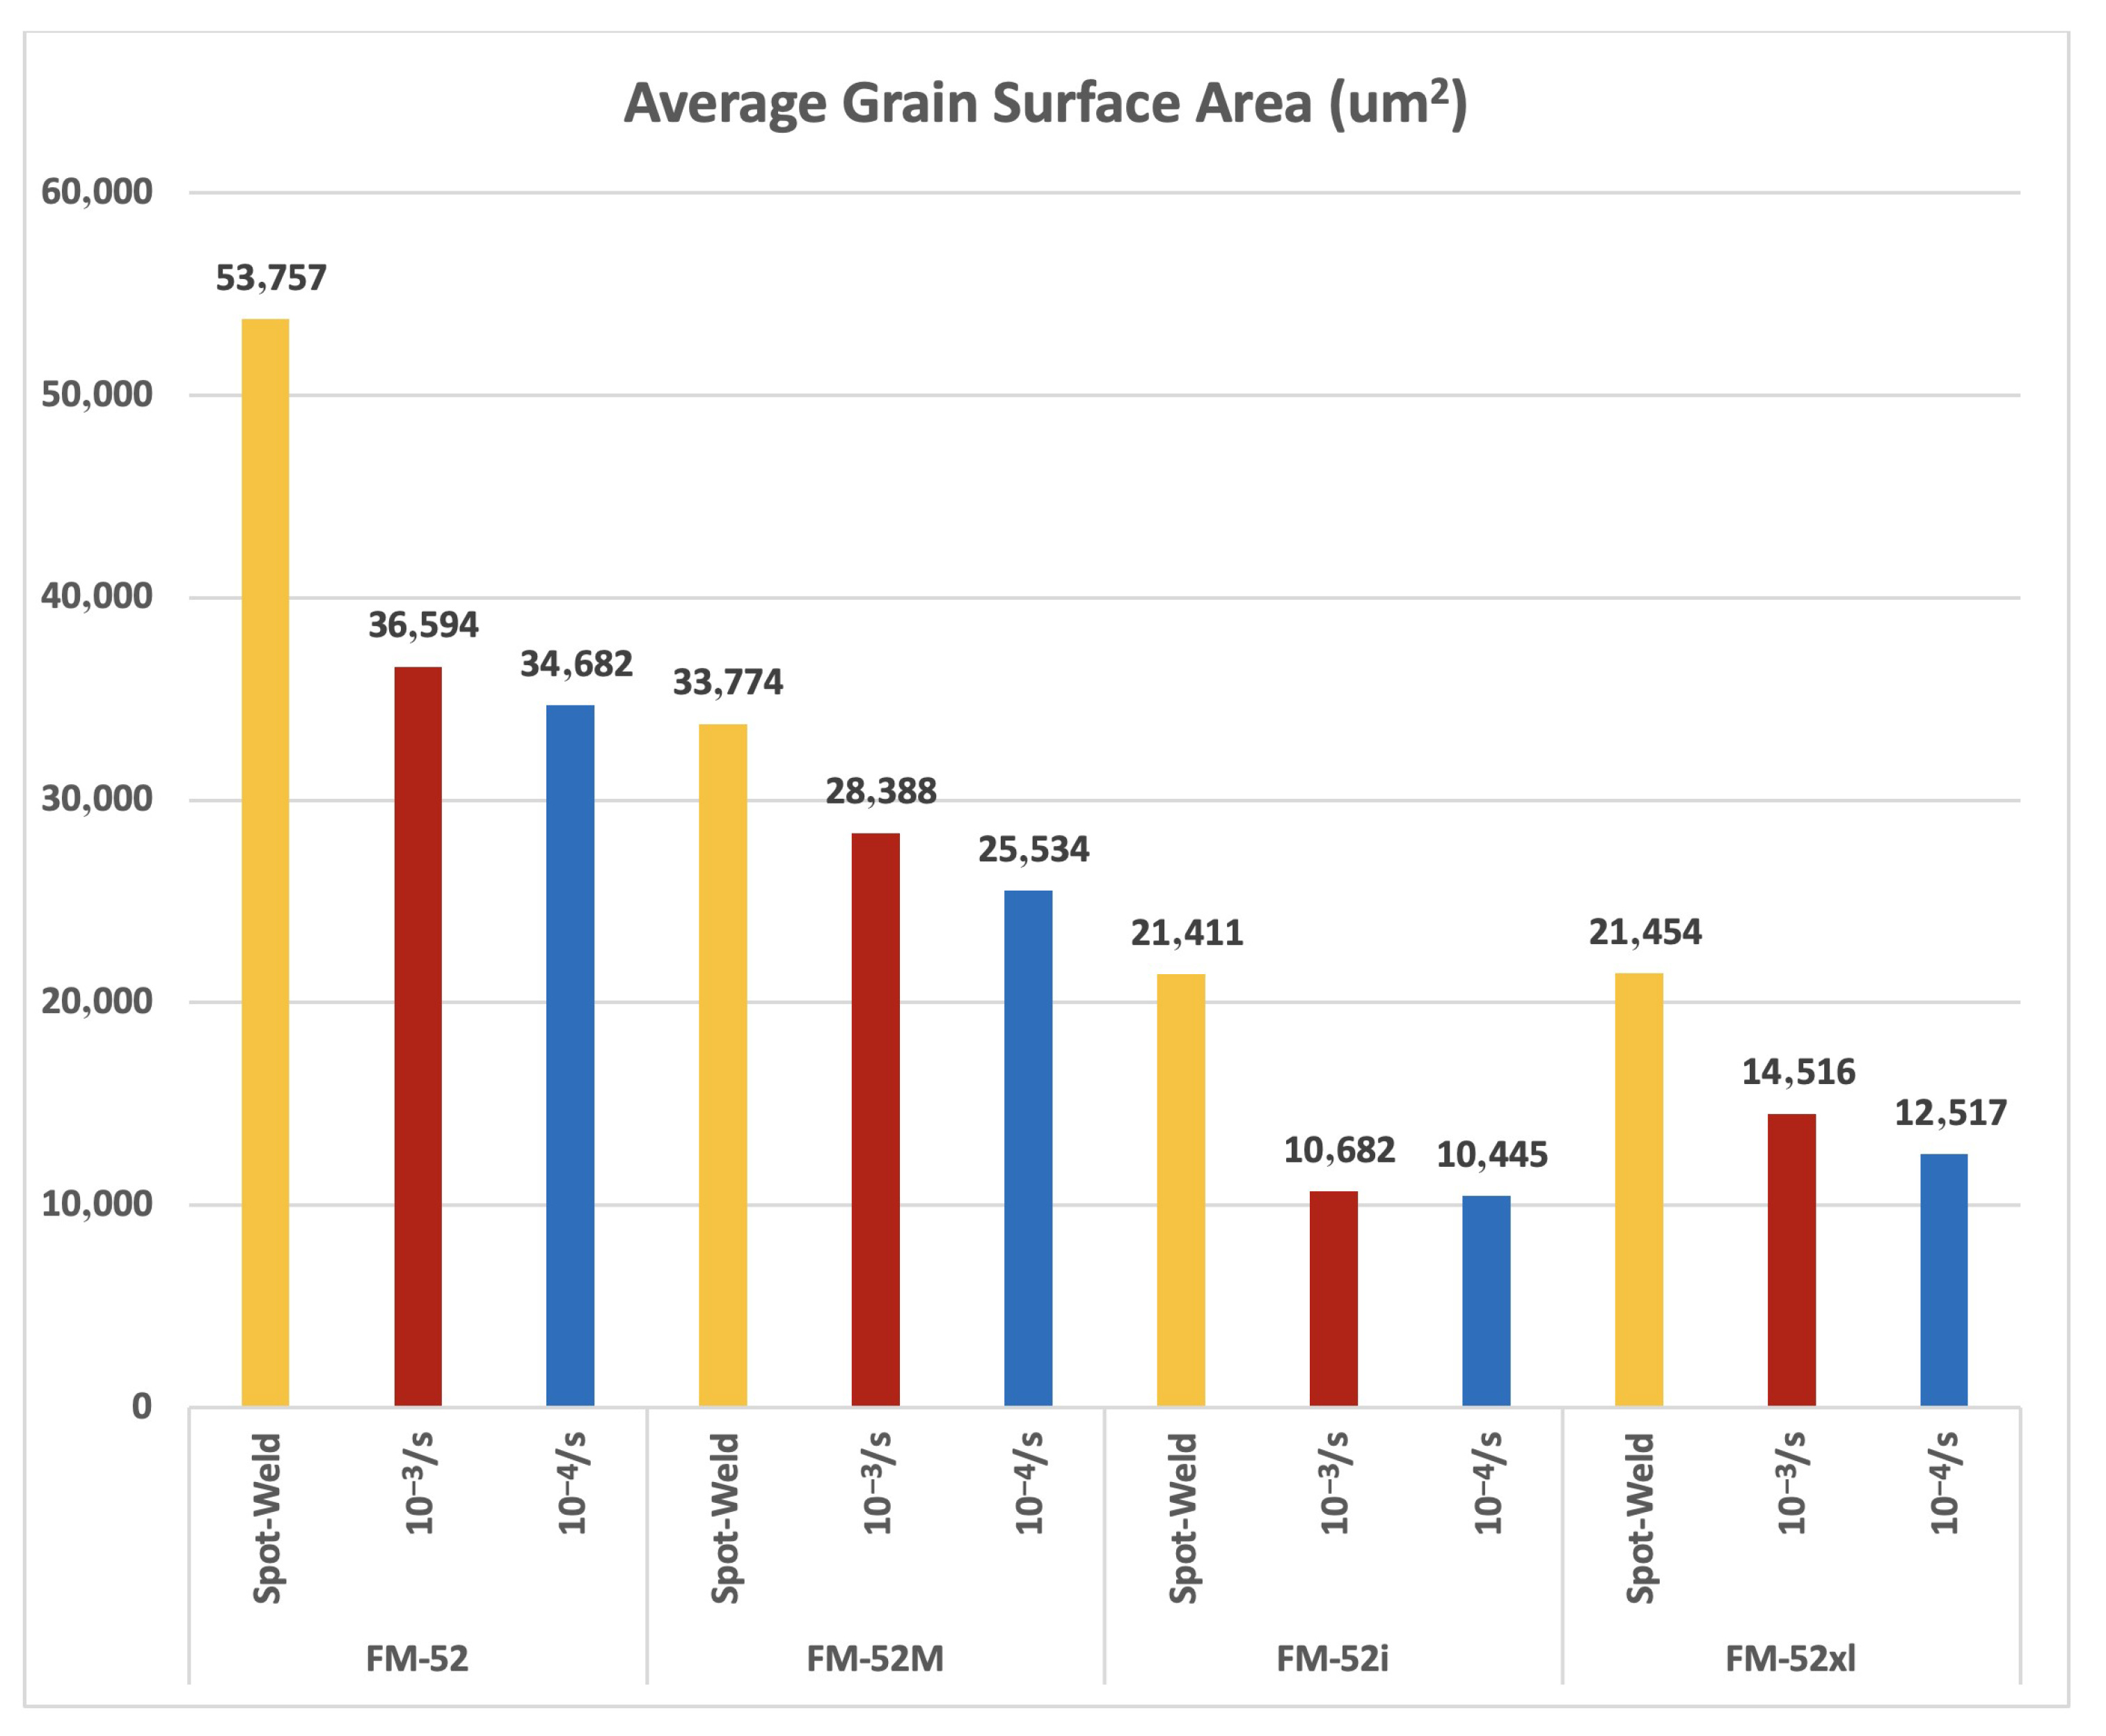
The grain surface area distribution for each weld metal and condition is shown in Figure 5 and Figure 6. Distinct low grain surface area peaks are highlighted with black arrows in Figure 6. The average grain surface area of each tested weld metal in the spot-welded condition, after the 10−3/s strain rate DRX test, and after the 10−4/s strain rate DRX test is shown in Figure 7. The initial grain surface areas for all tested weld metals are different. A reduction in average grain surface area is introduced with the DRX tests. The percent reductions in grain surface area between the initial spot-weld and the 10−3/s strain rate DRX test and the initial spot-weld and the 10−4/s strain rate DRX test are compared in Figure 8. Reducing the strain rate is shown to further induce grain refinement.
Figure 5.
Grain surface area distribution by area fraction in the tested weld metals: (a) in the spot-welded condition, (b) after the 10−3/s dynamic recrystallization (DRX) test, (c) after the 10−4/s DRX test.
Figure 6.
Grain surface area distribution by area fraction in spot-welded condition, after the 10−3/s DRX test, and after the 10−4/s DRX test for FM-52 (a), FM-52M (b), FM-52i (c), and FM-52xl (d). Black arrows point to distinct low grain surface area peaks induced by the 10−4/s DRX test.
Figure 7.
Average grain surface area in the spot-weld and DRX conditions of tested weld metals.
Figure 8.
Percent reduction in spot-weld grain surface area after DRX test.
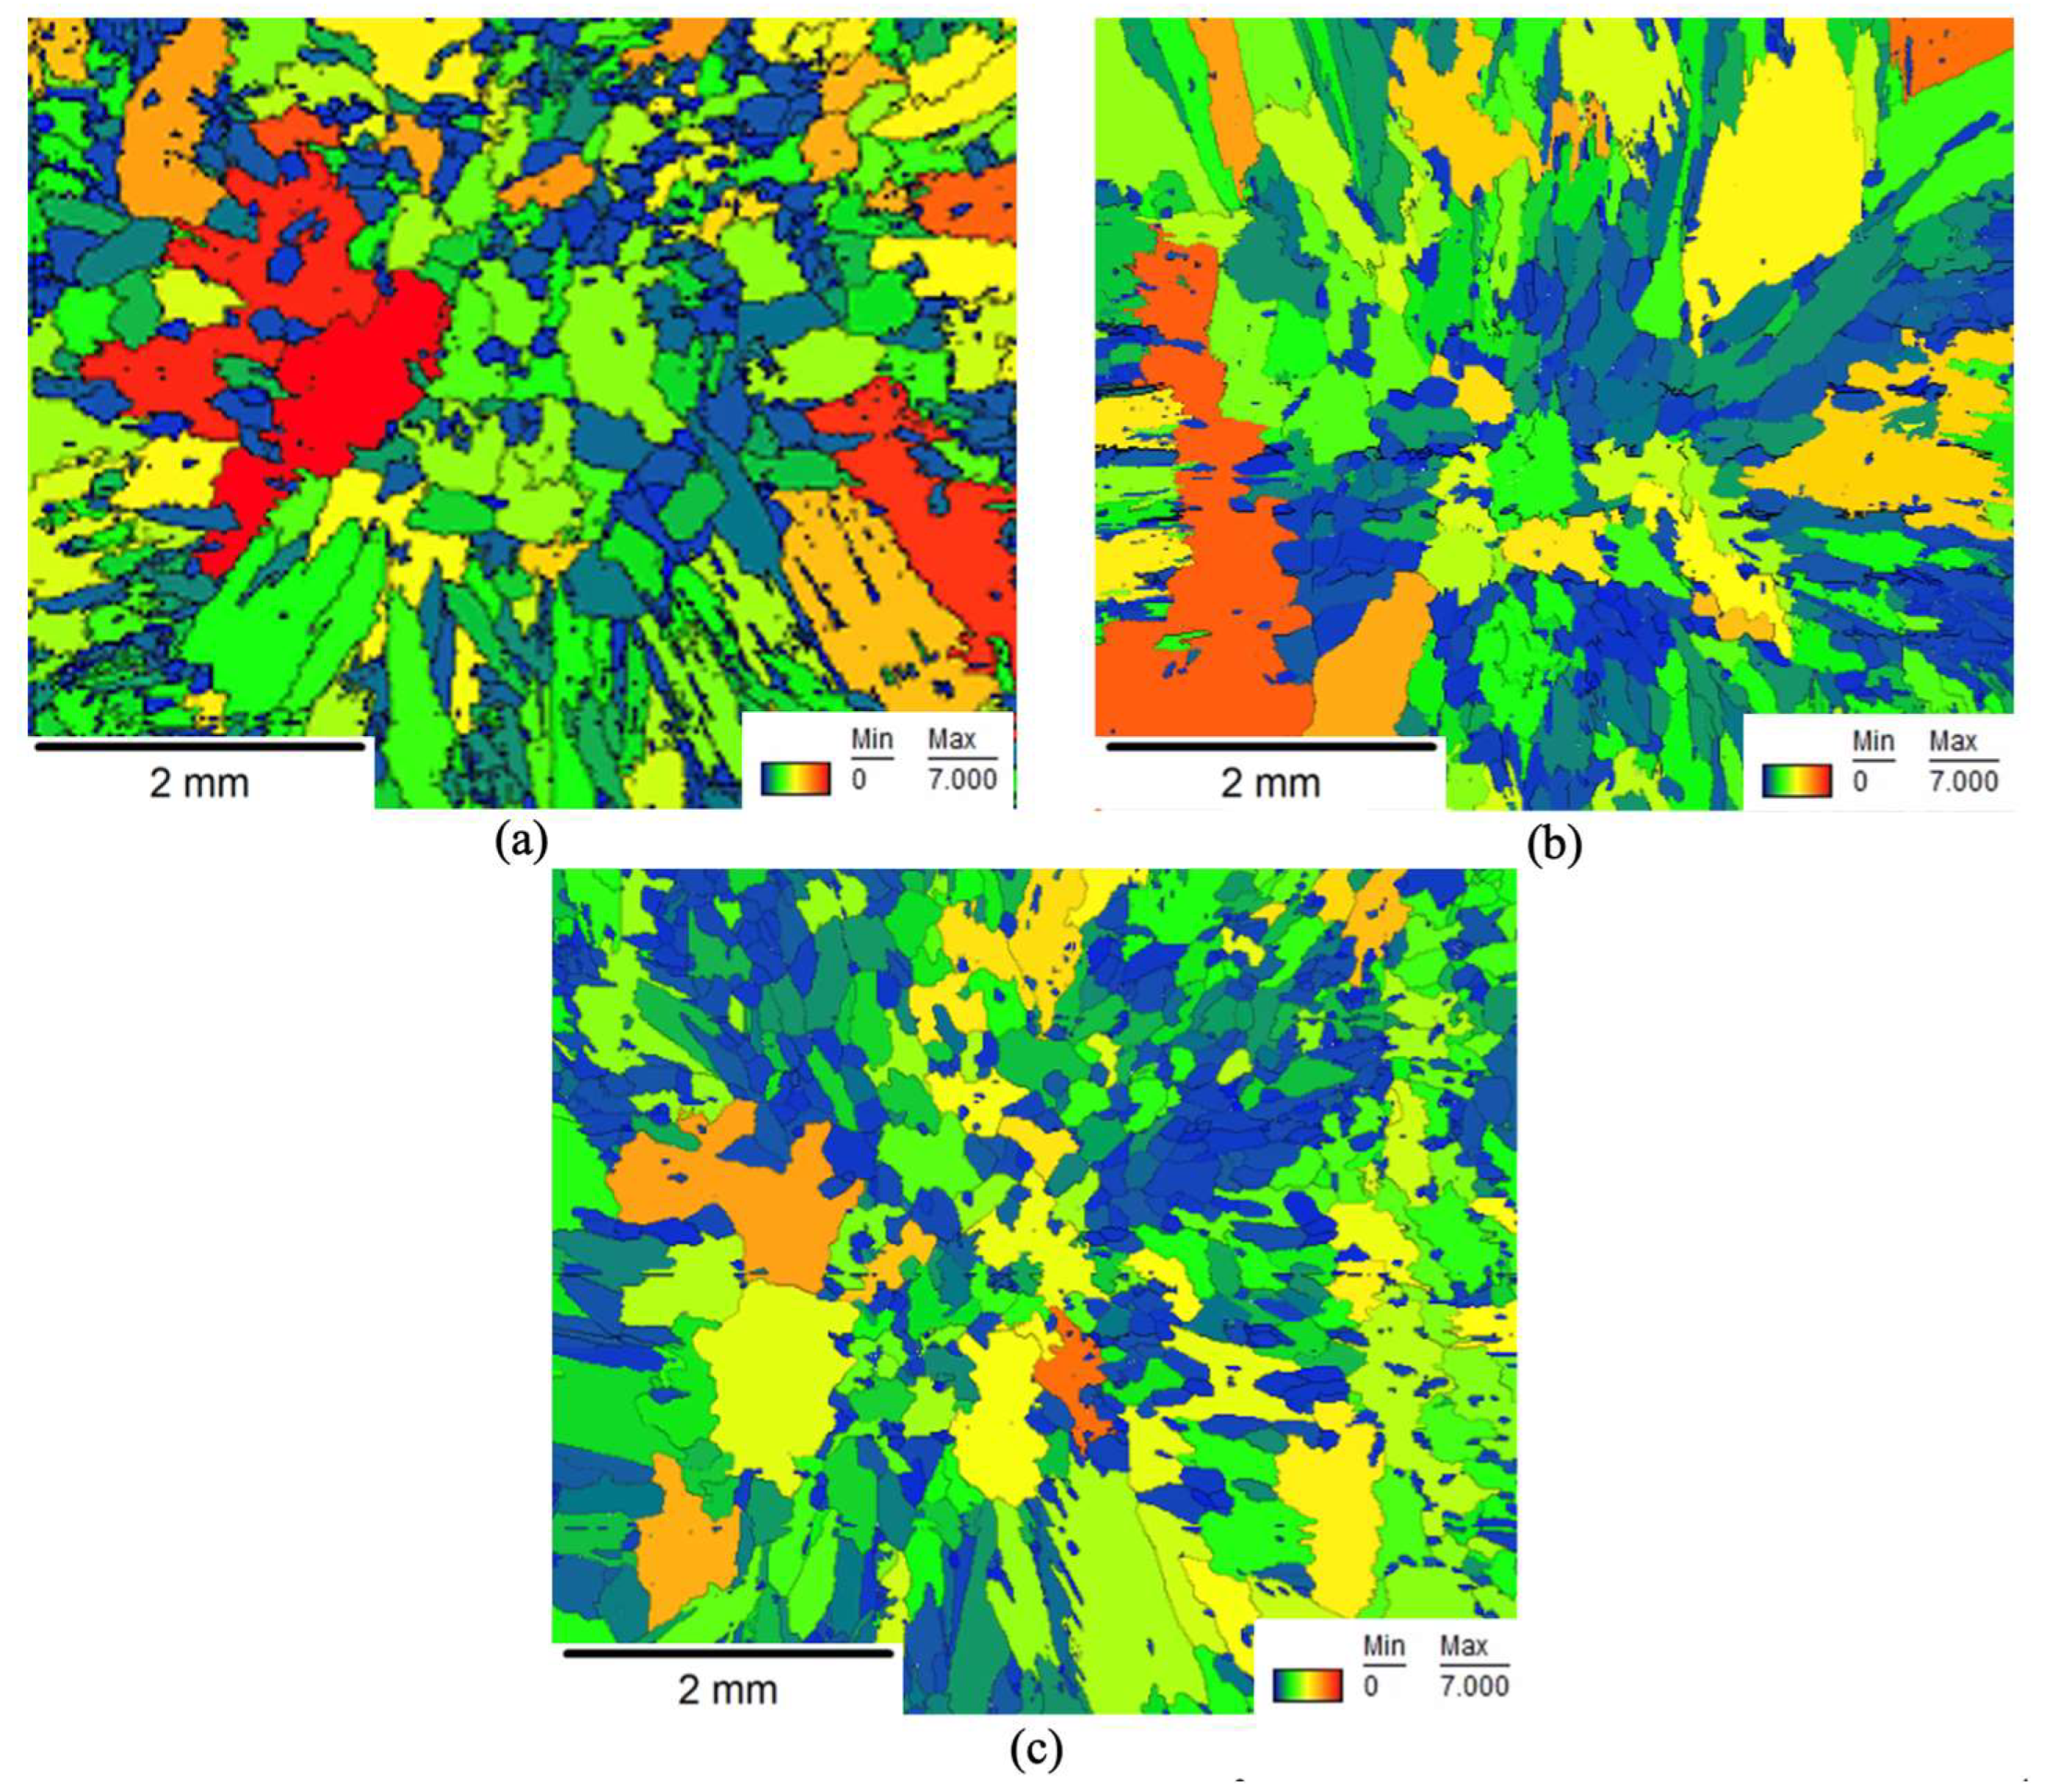
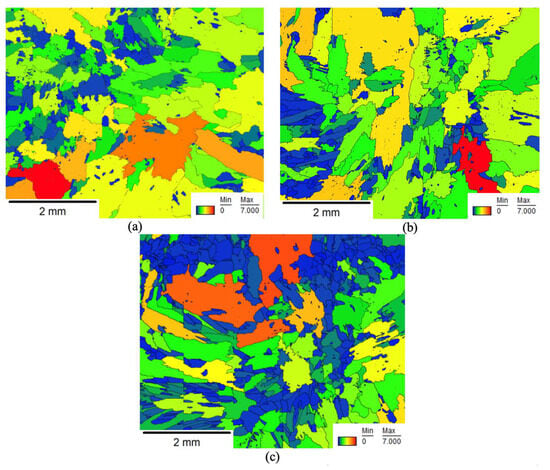
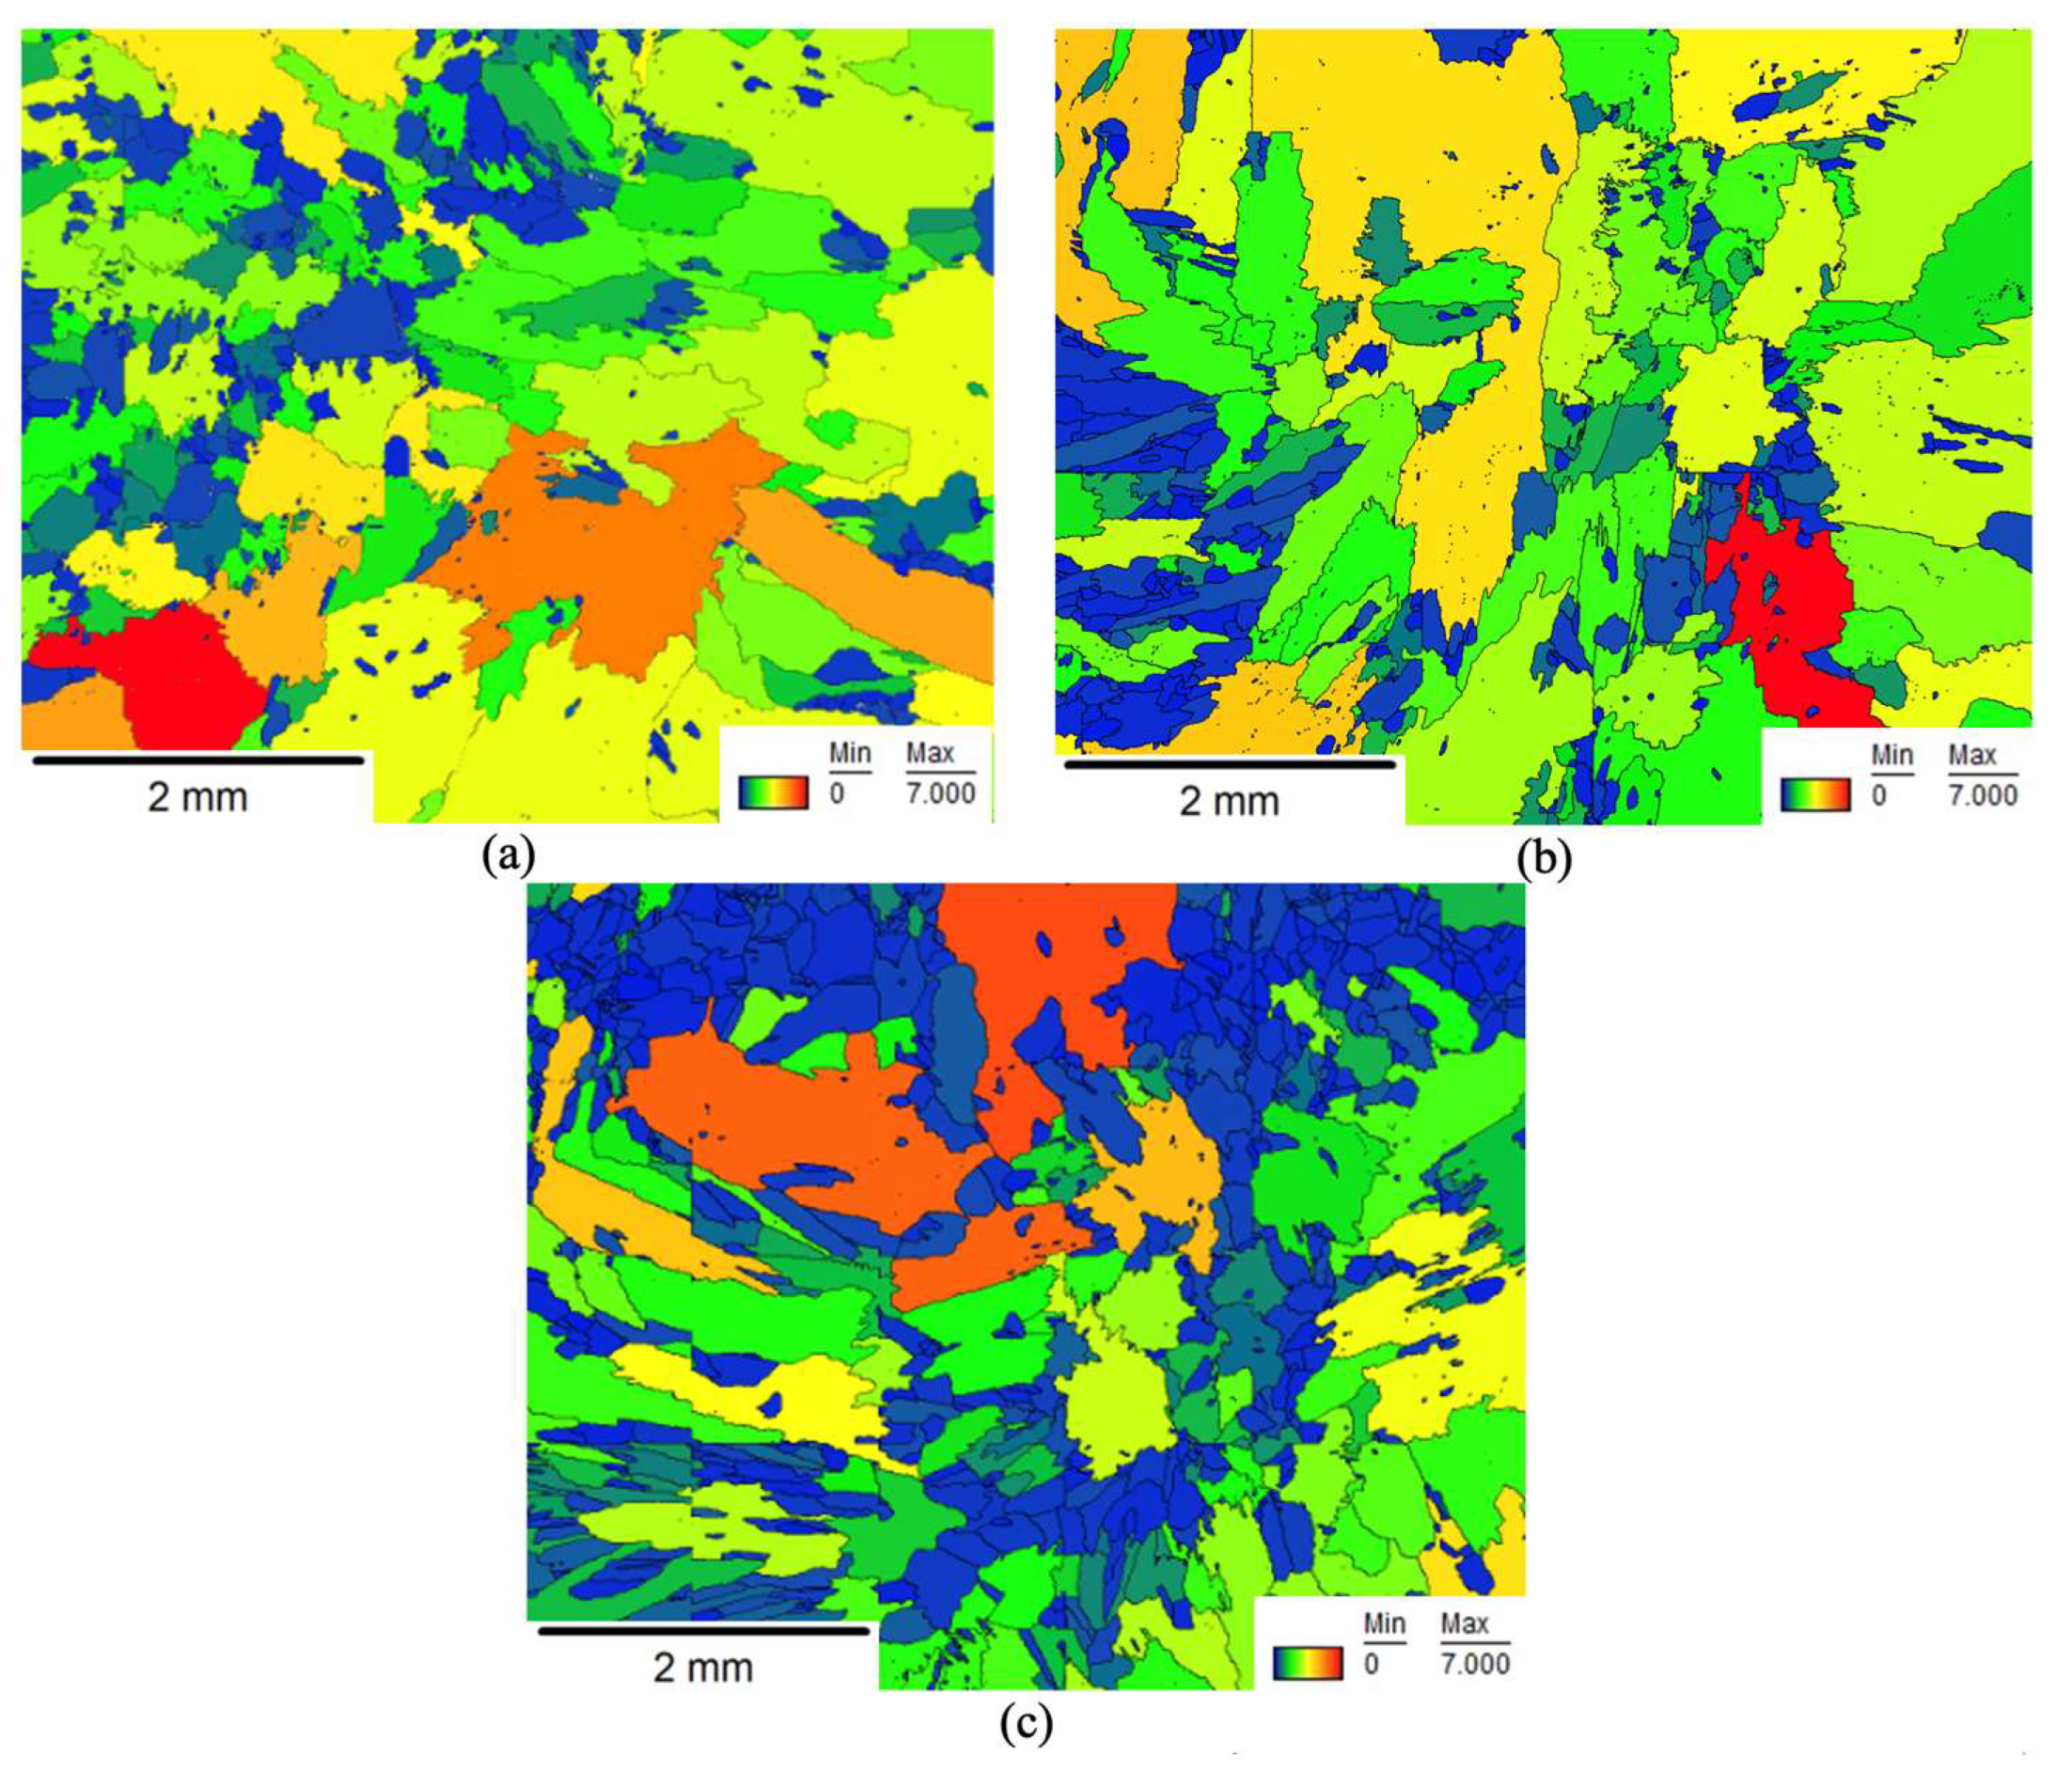
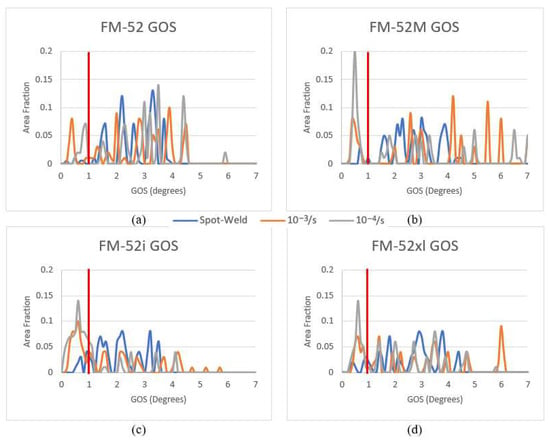
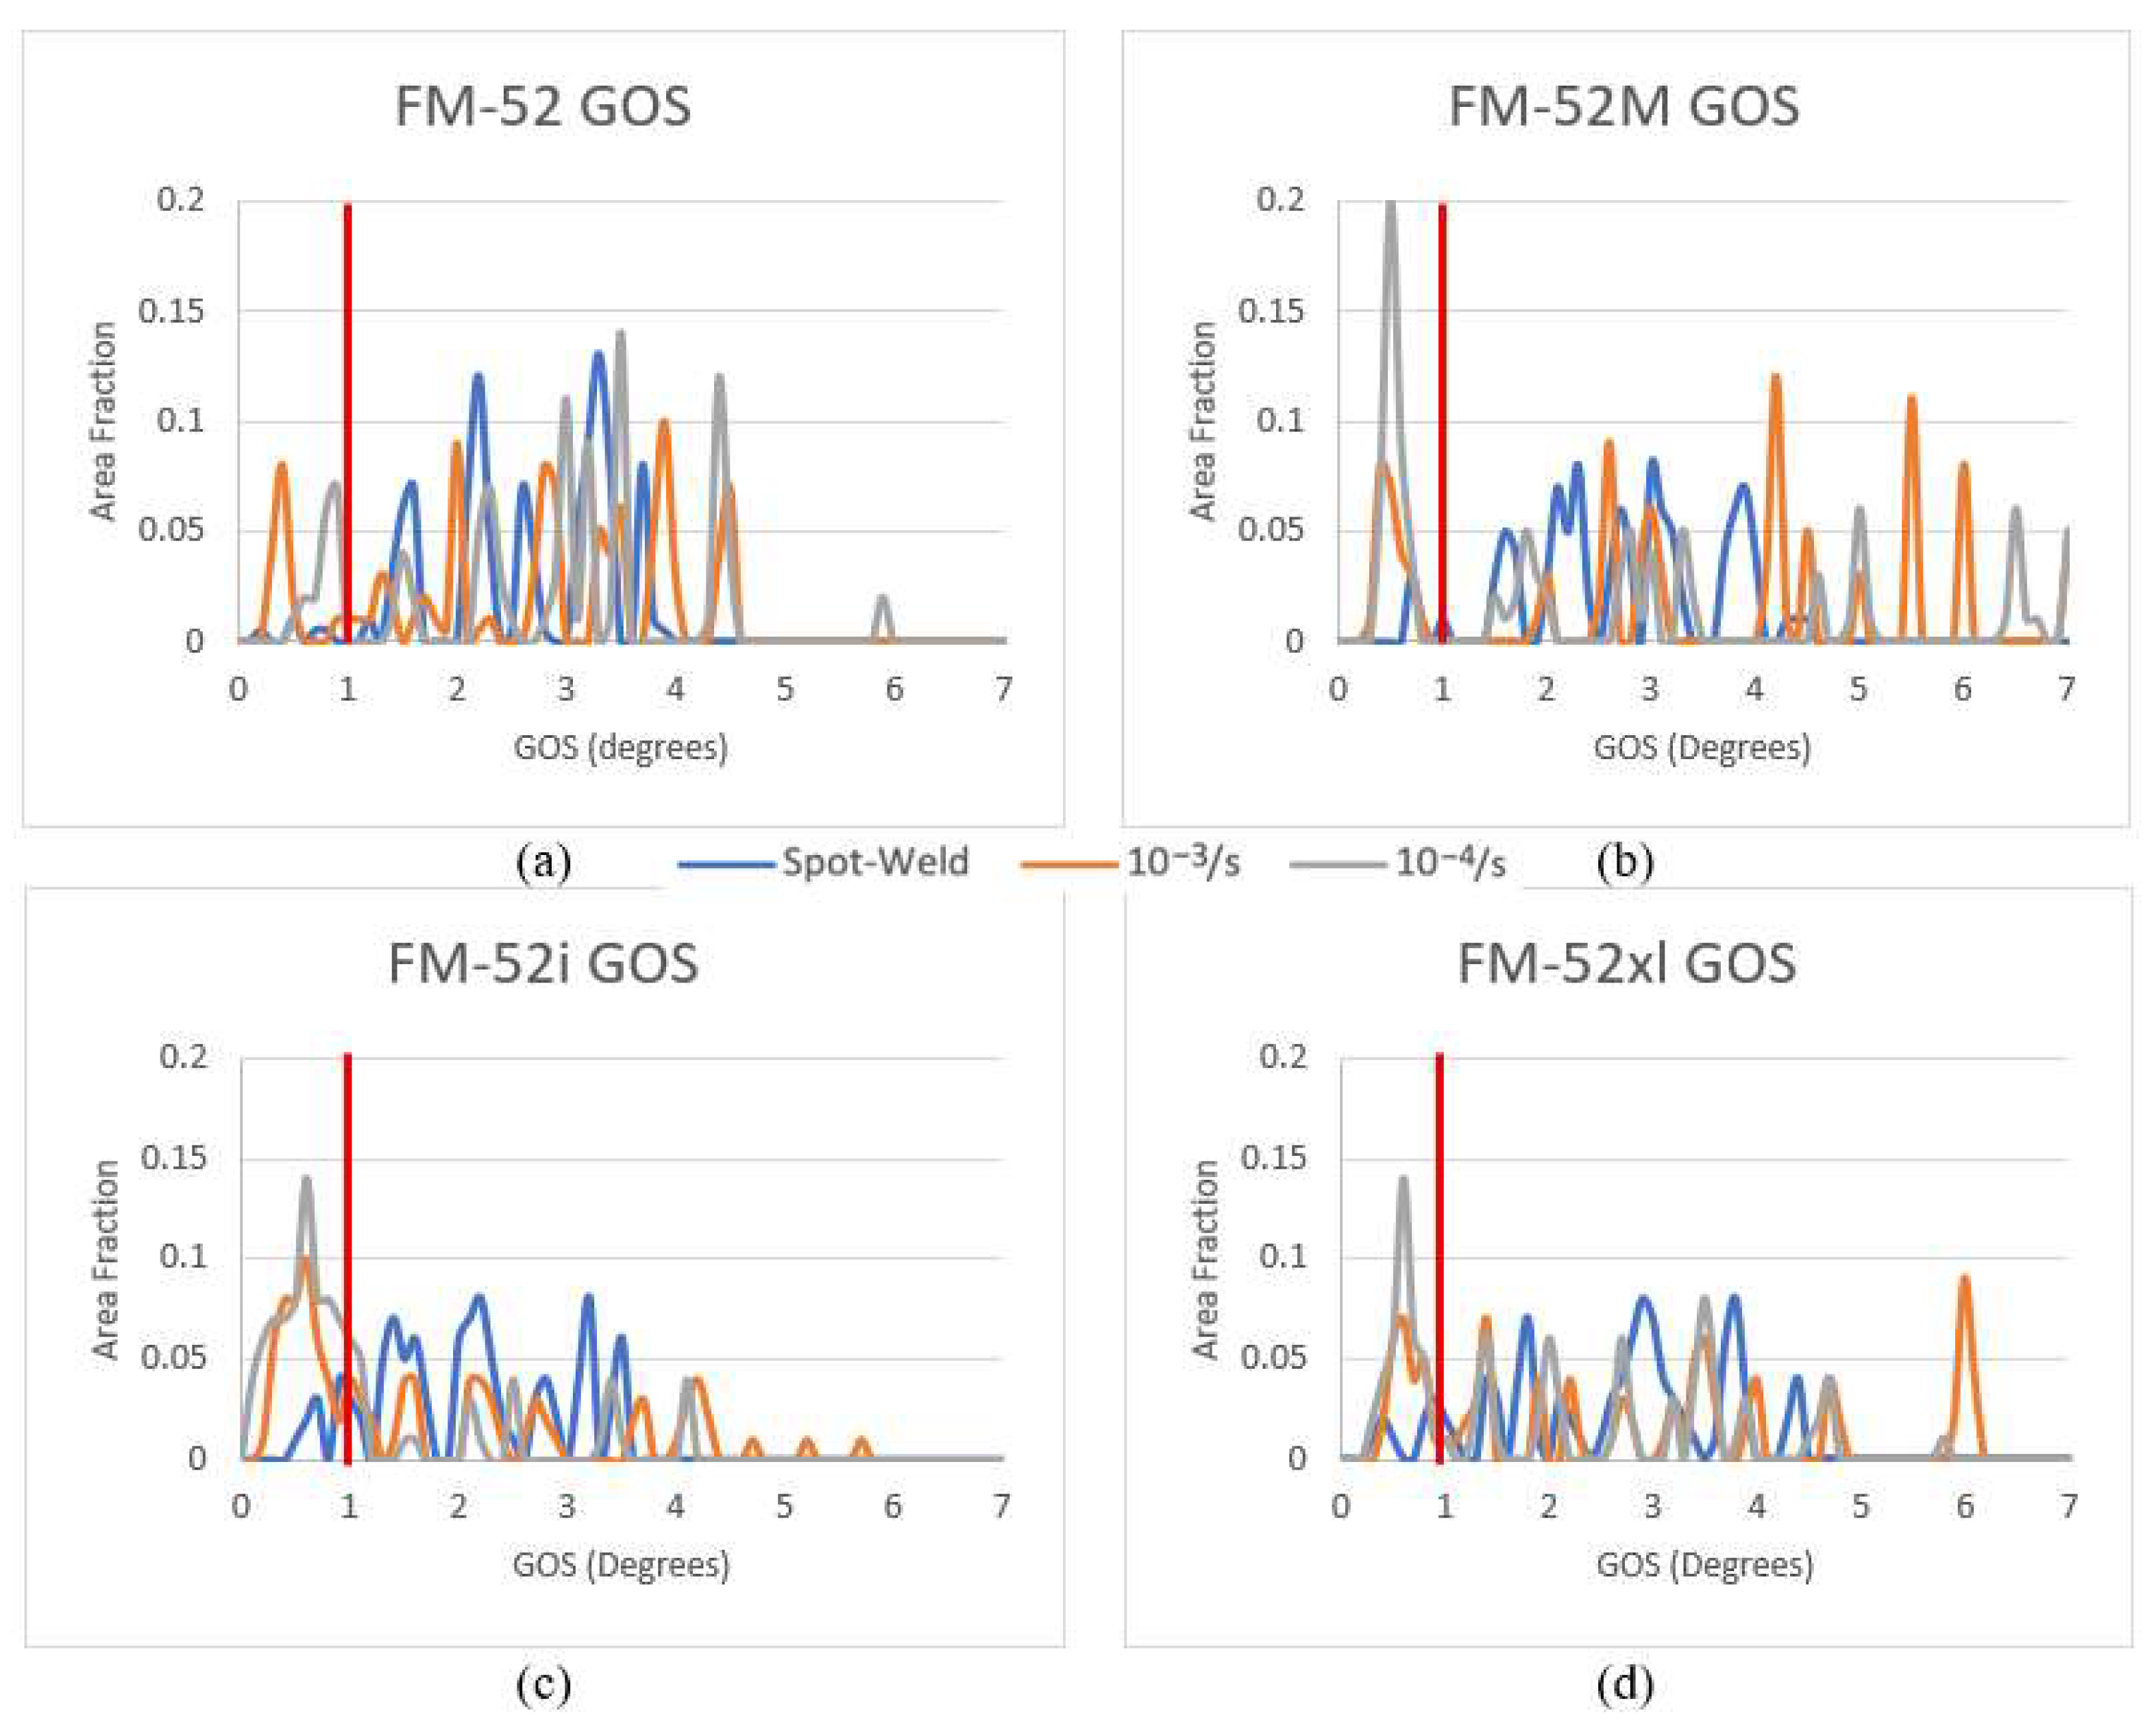
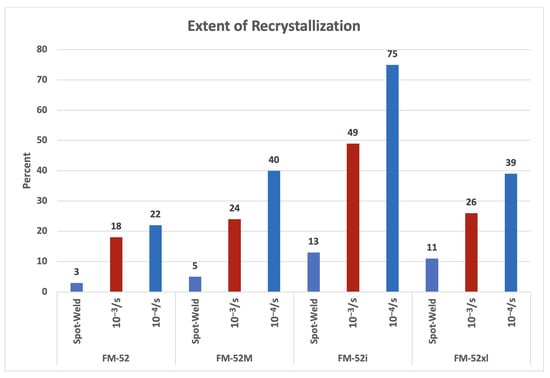
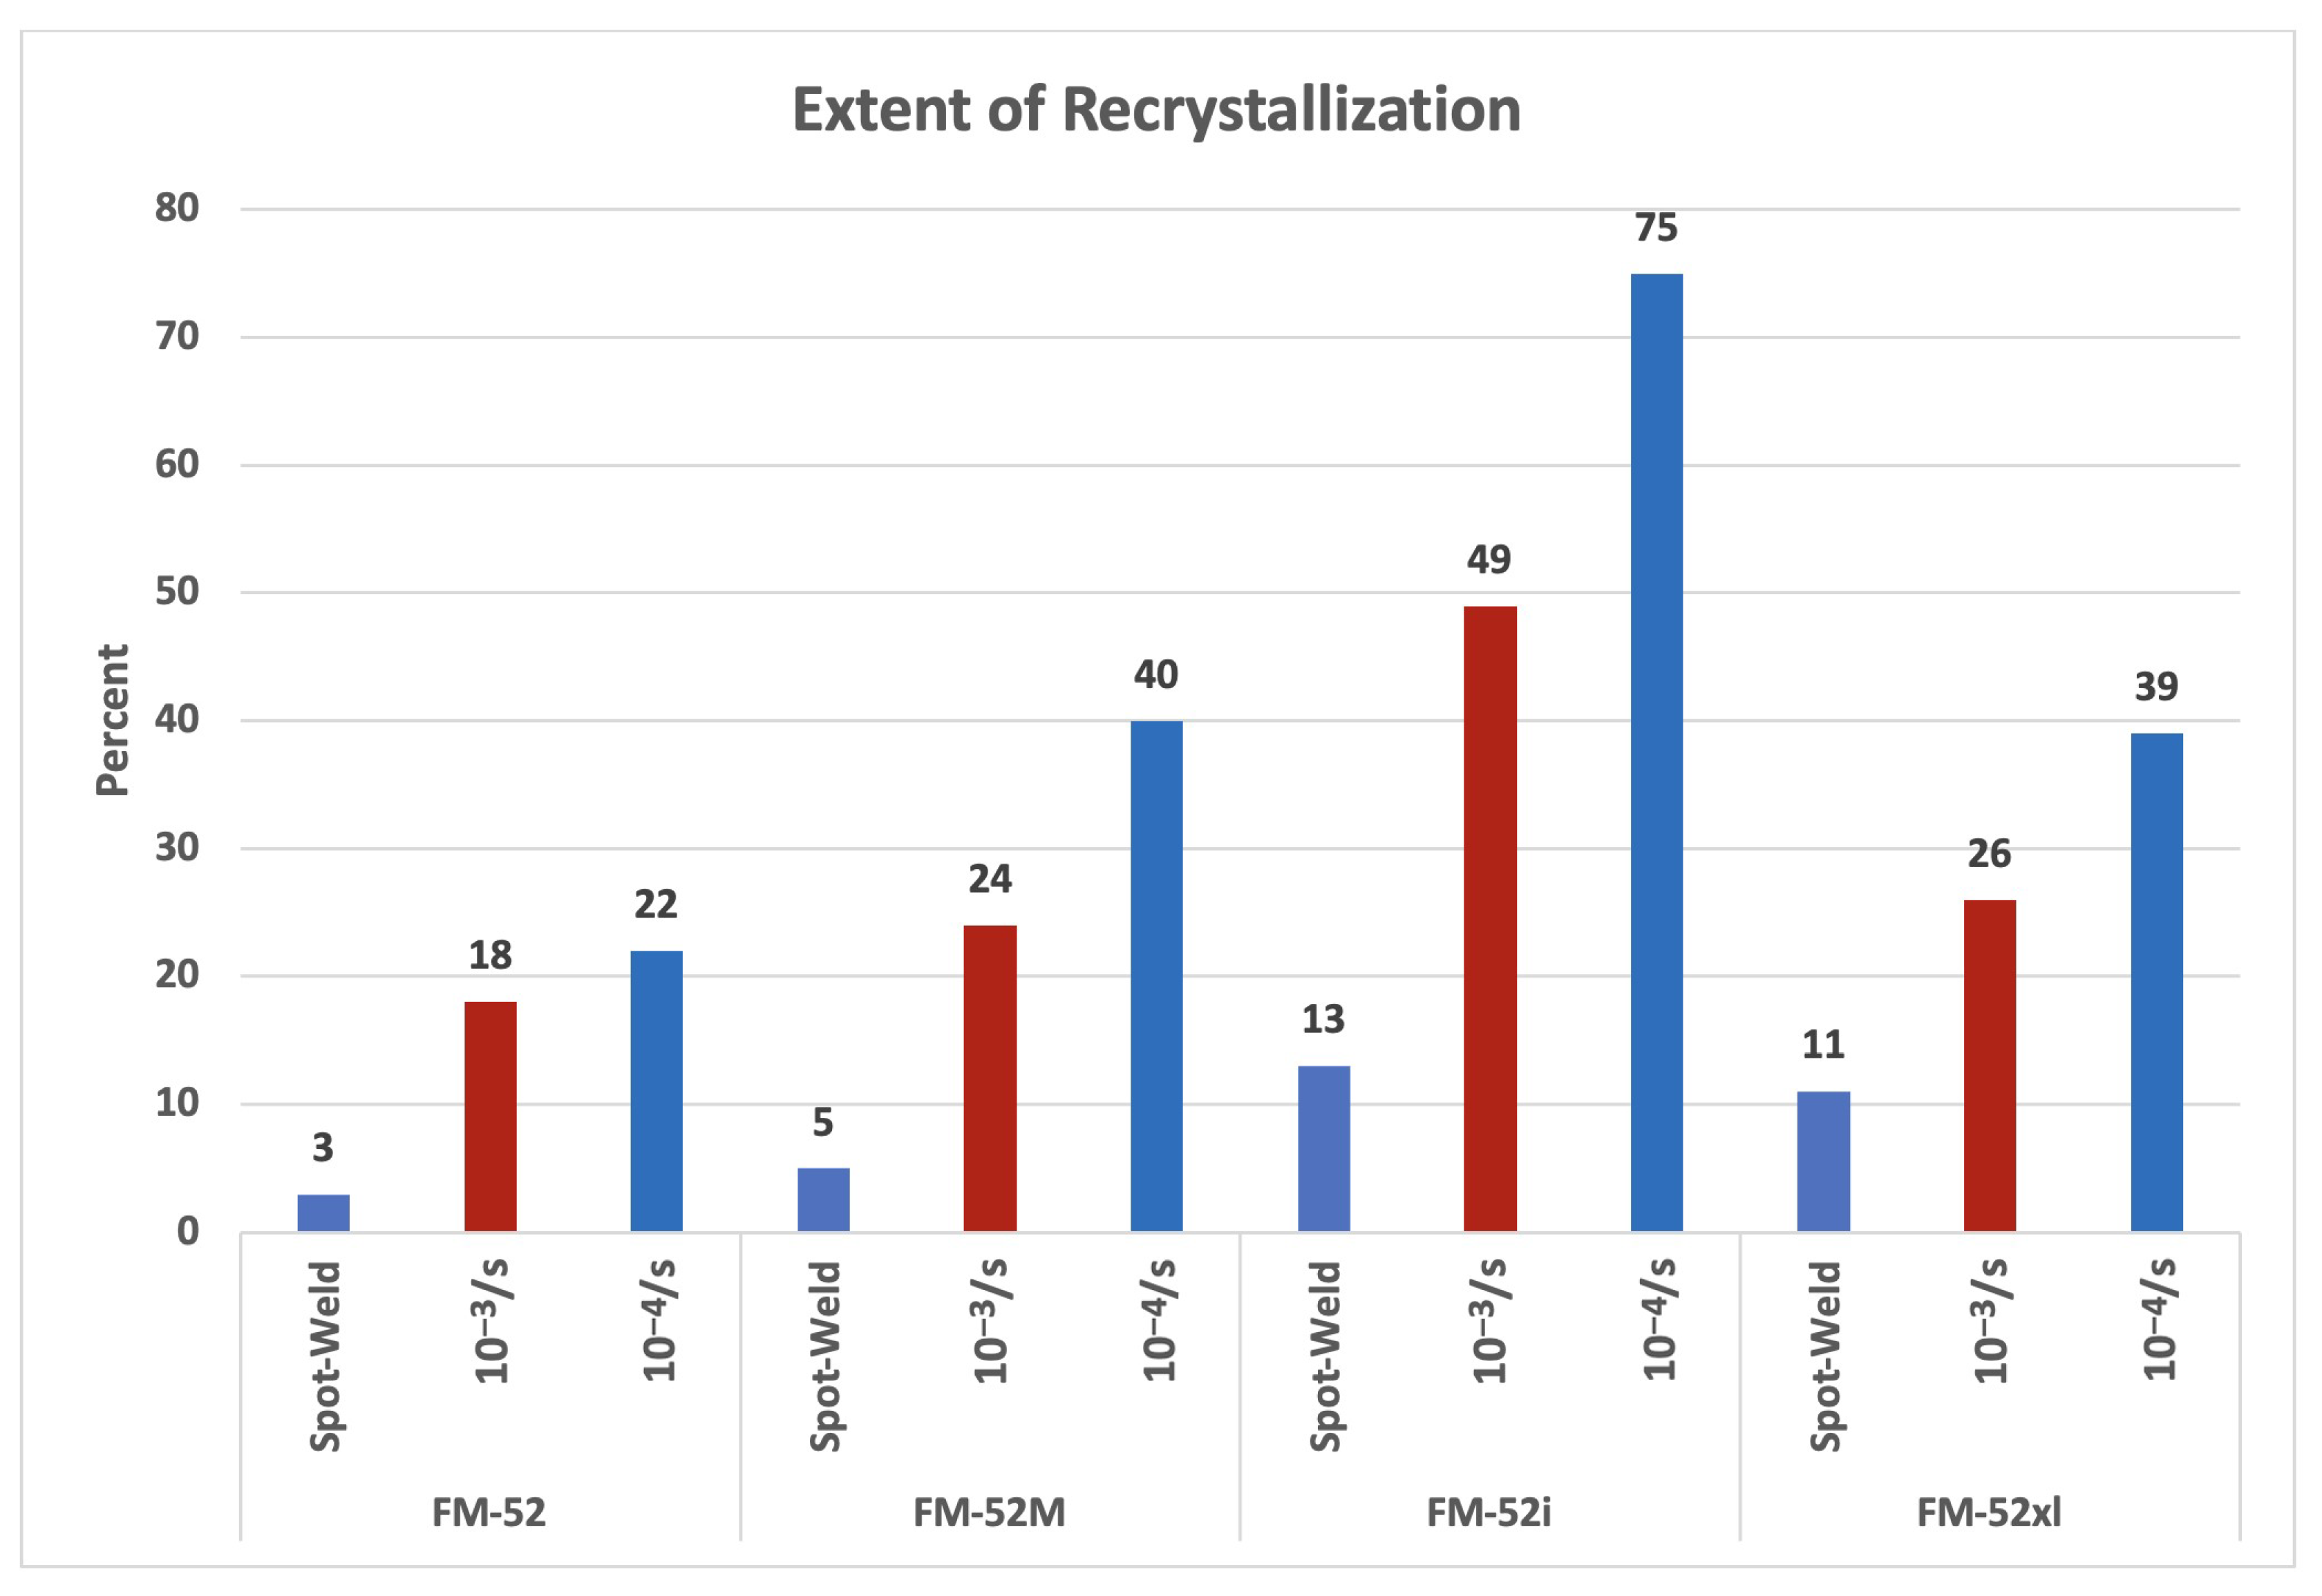
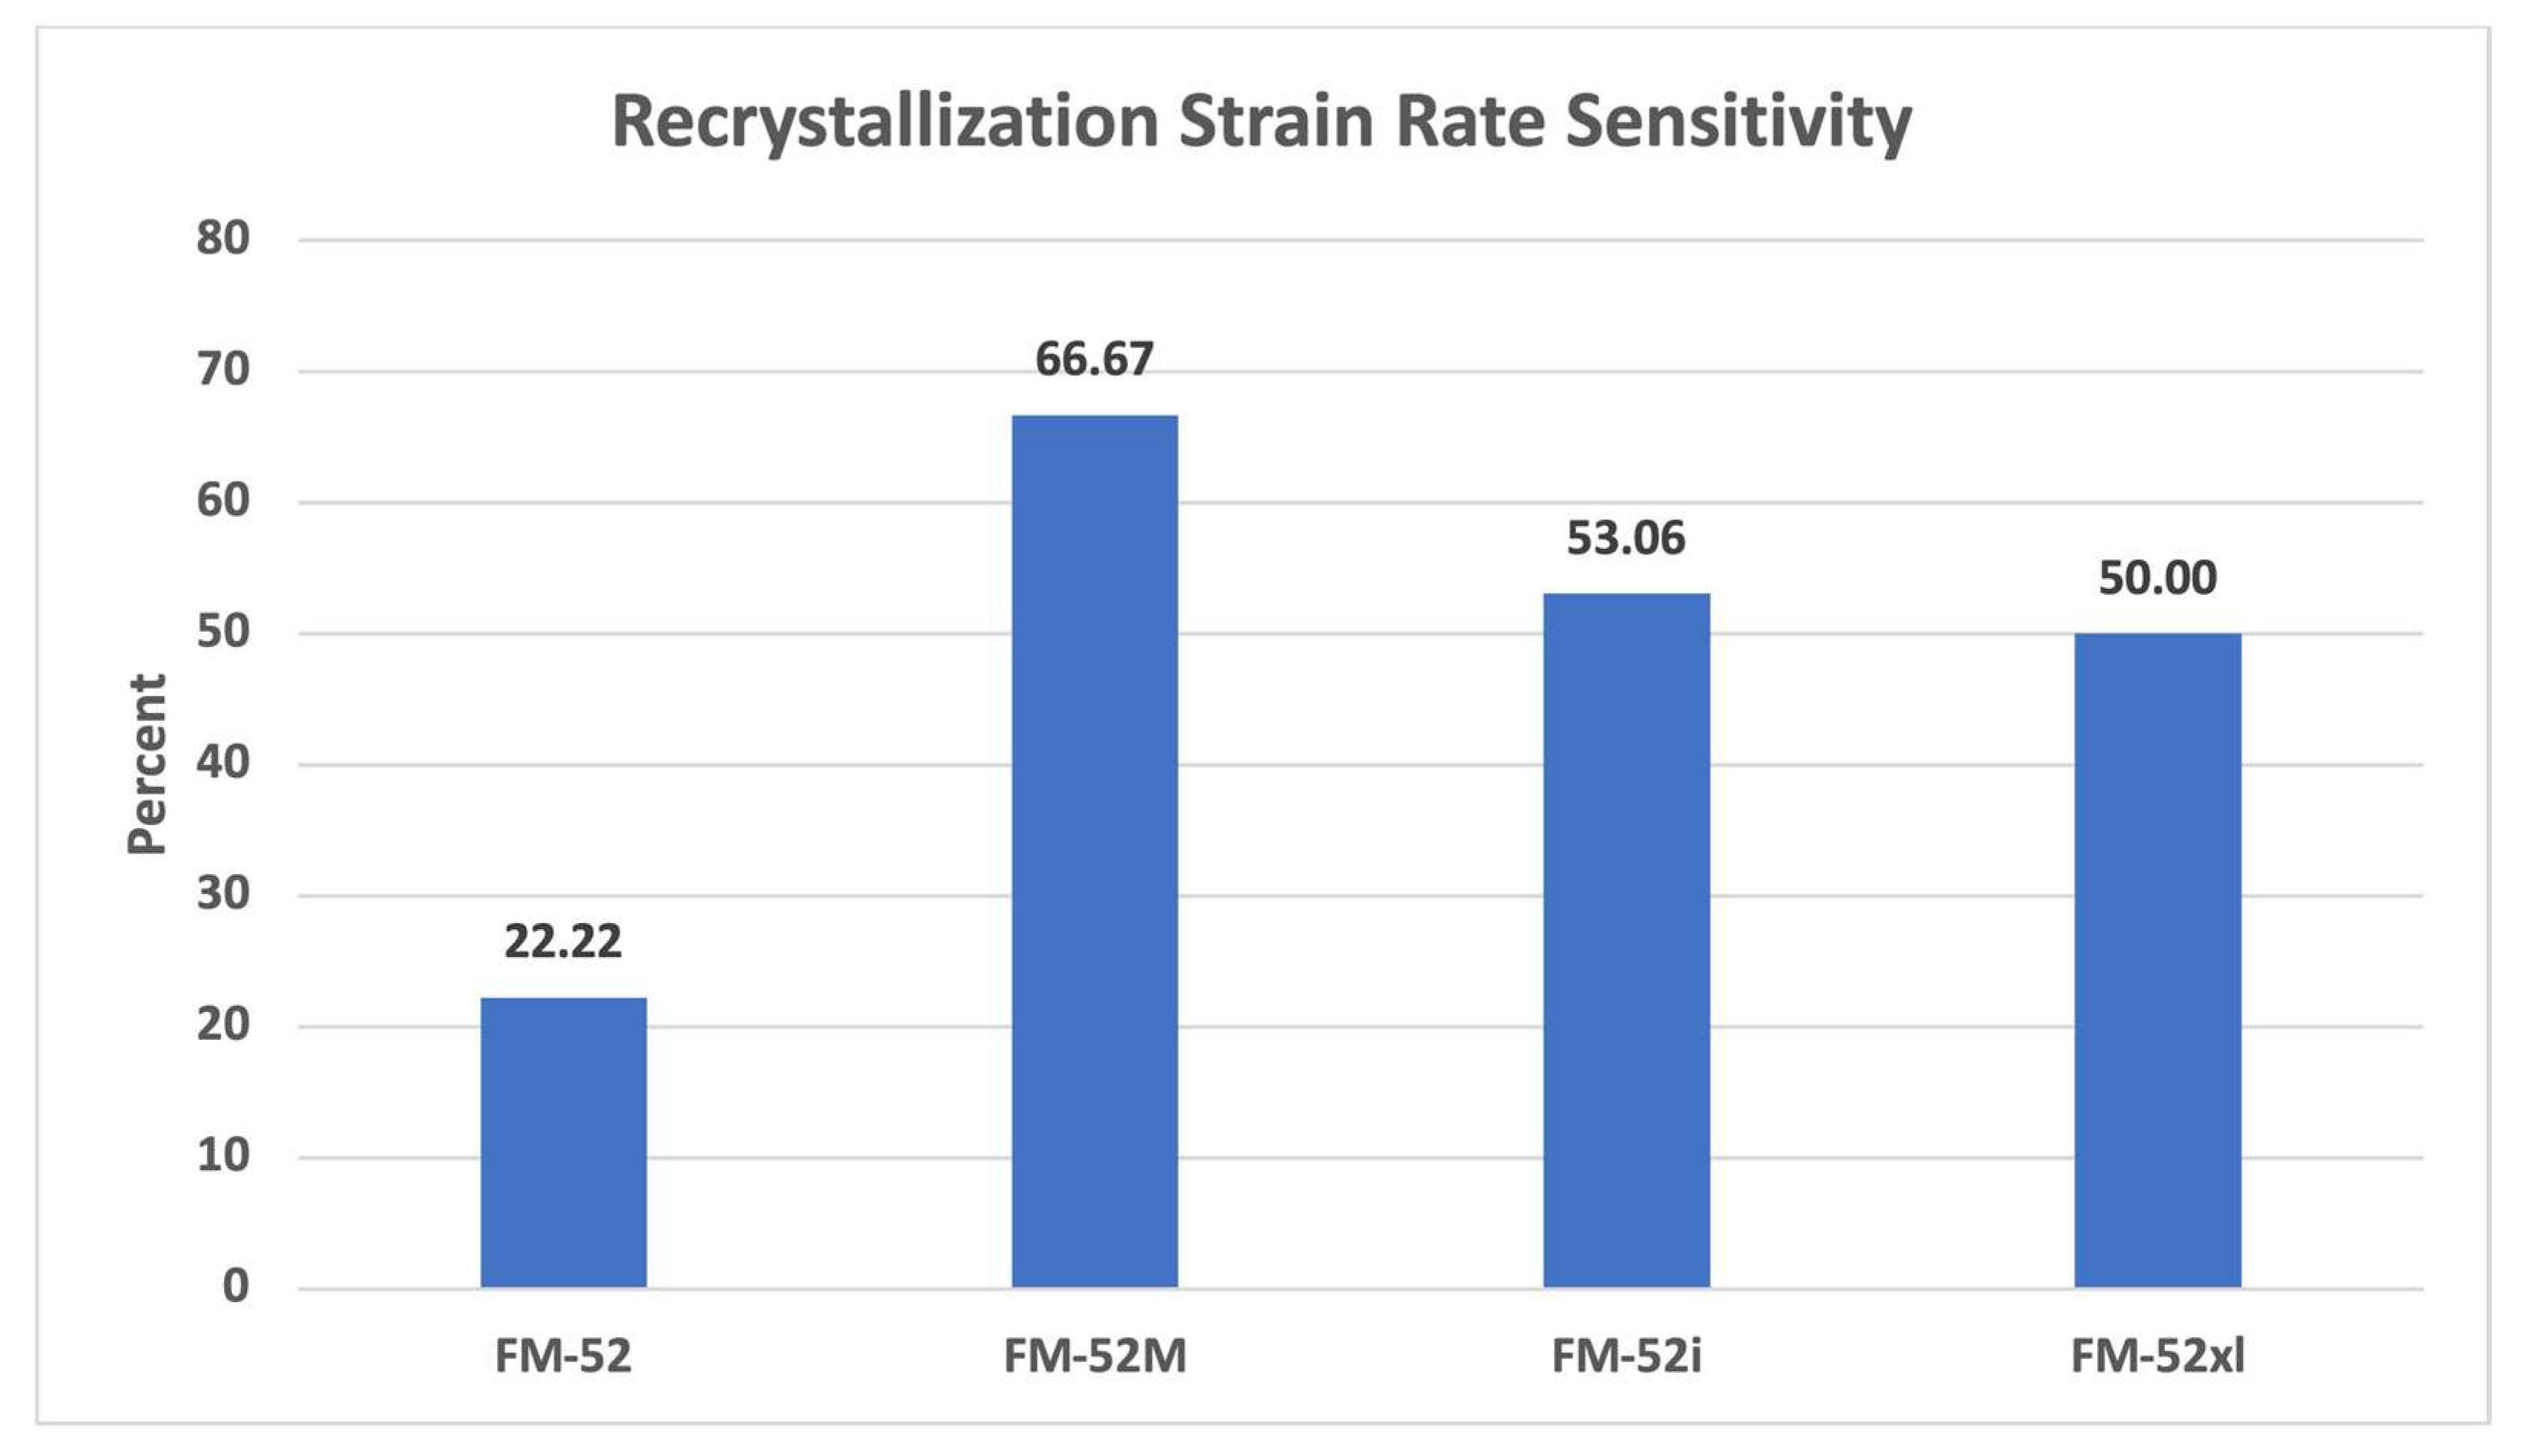
The inverse pole figure (IPF) maps generated for the spot-welded condition after the 10−3/s strain rate DRX test and after the 10−4/s strain rate DRX test for FM-52M are shown in Figure 9. The corresponding GOS maps of these conditions are shown in Figure 10. IPF and GOS maps for the FM-52, FM-52i, and FM-52xl weld metal specimens are shown in Figure A1, Figure A2, Figure A3, Figure A4, Figure A5 and Figure A6 in Appendix A. The regions depicted in Figure 9 and Figure 10 and Figure A1, Figure A2, Figure A3, Figure A4, Figure A5 and Figure A6 are contained within the spot-weld. The area fraction distributions of GOS within the spot-welded region along with the 1° GOS threshold for recrystallization in all welds are shown in Figure 11. The extent of recrystallized microstructure in the tested welds, which represents the area fraction of grains below the 1° GOS threshold, is shown in Figure 12. The recrystallization strain rate sensitivity for each tested weld metal is detailed in Figure 13.
Figure 9.
IPF maps of FM-52M fresh spot-weld (a), after 10−3/s strain rate DRX test (b), and after 10−4/s strain rate DRX test (c).
Figure 10.
GOS maps of FM-52M fresh spot-weld (a), after 10−3/s strain rate DRX test (b), and after 10−4/s strain rate DRX test (c).
Figure 11.
GOS distribution by area fraction for the tested welds: FM-52 (a), FM-52M (b), FM-52i (c), and FM-52xl (d). The red vertical lines indicate the 1° GOS threshold for recrystallization.
Figure 12.
Effect of spot-welding and DRX on the extent of recrystallization in the tested welds.
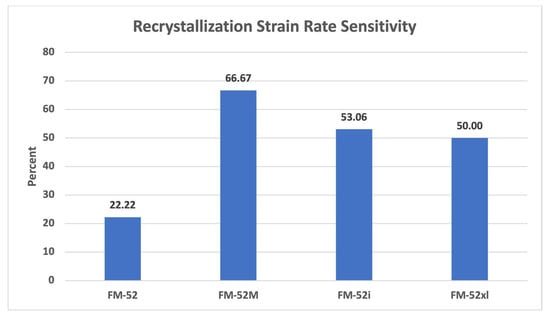
Figure 13.
Recrystallization strain rate sensitivity is the percent change in extent of recrystallization when decreasing the strain rate from 10−3/s to 10−4/s.
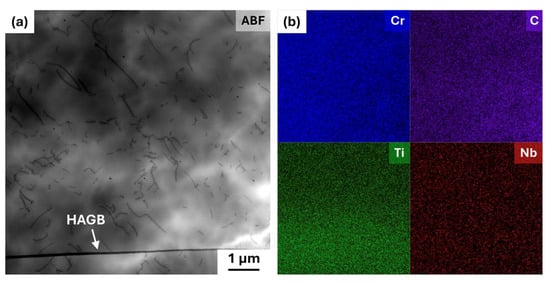
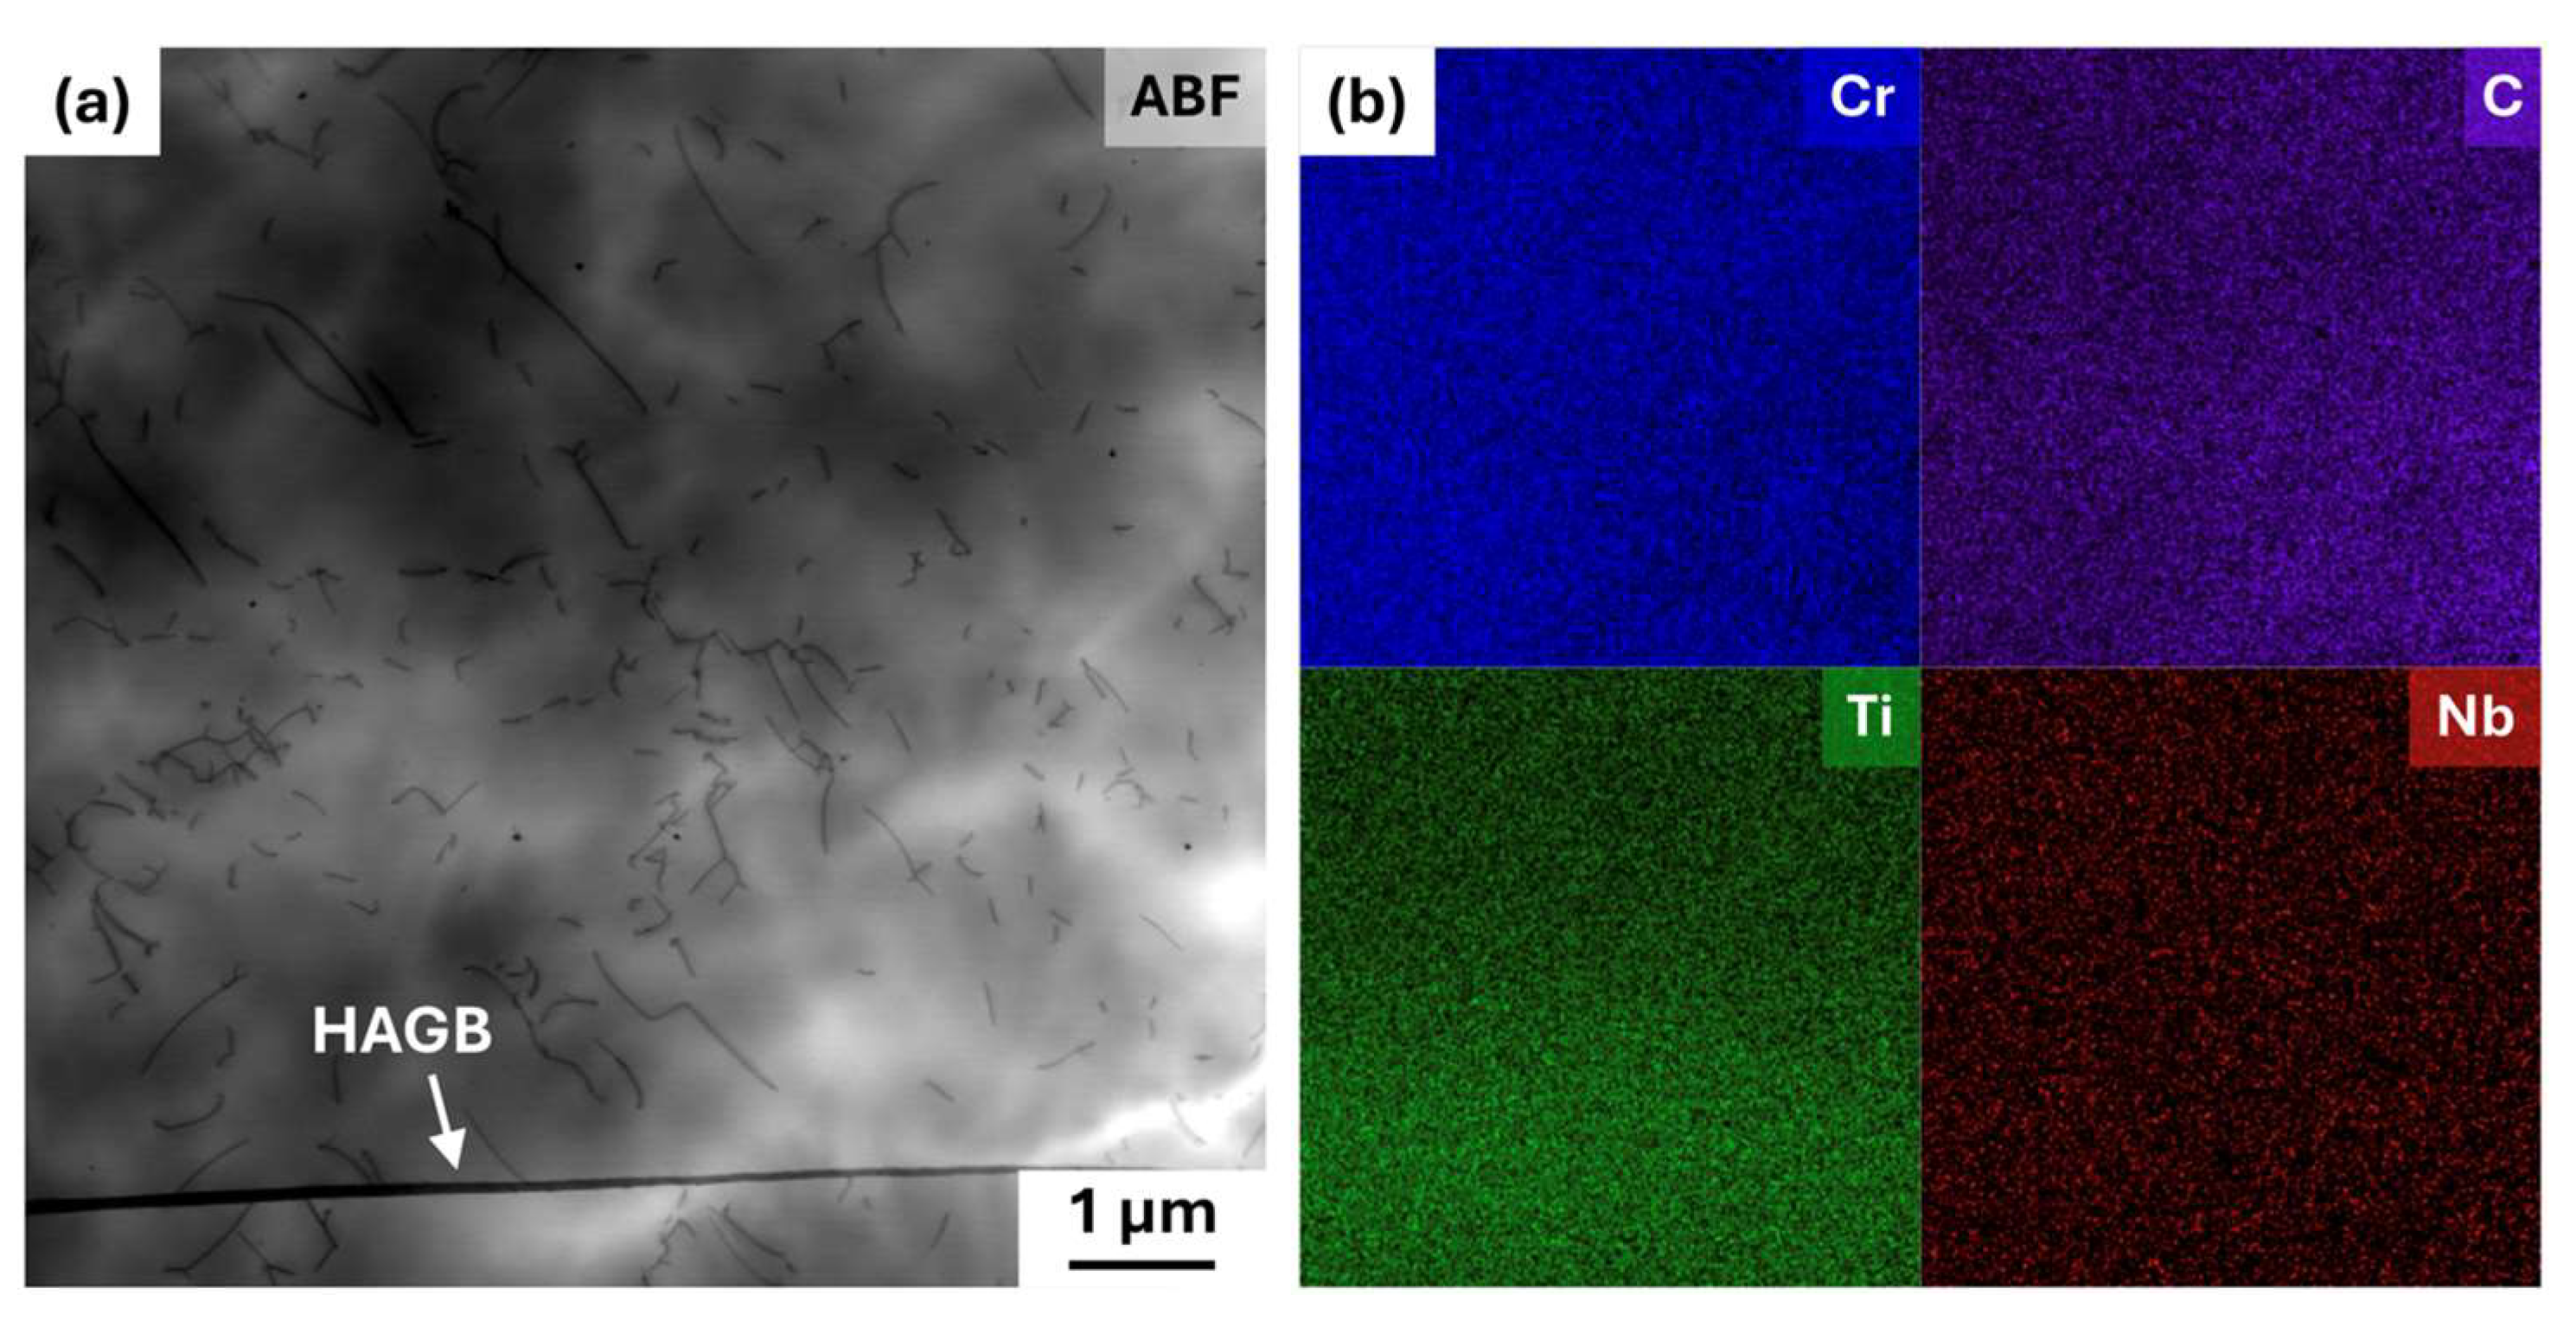
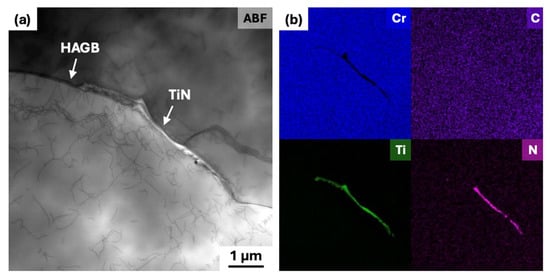
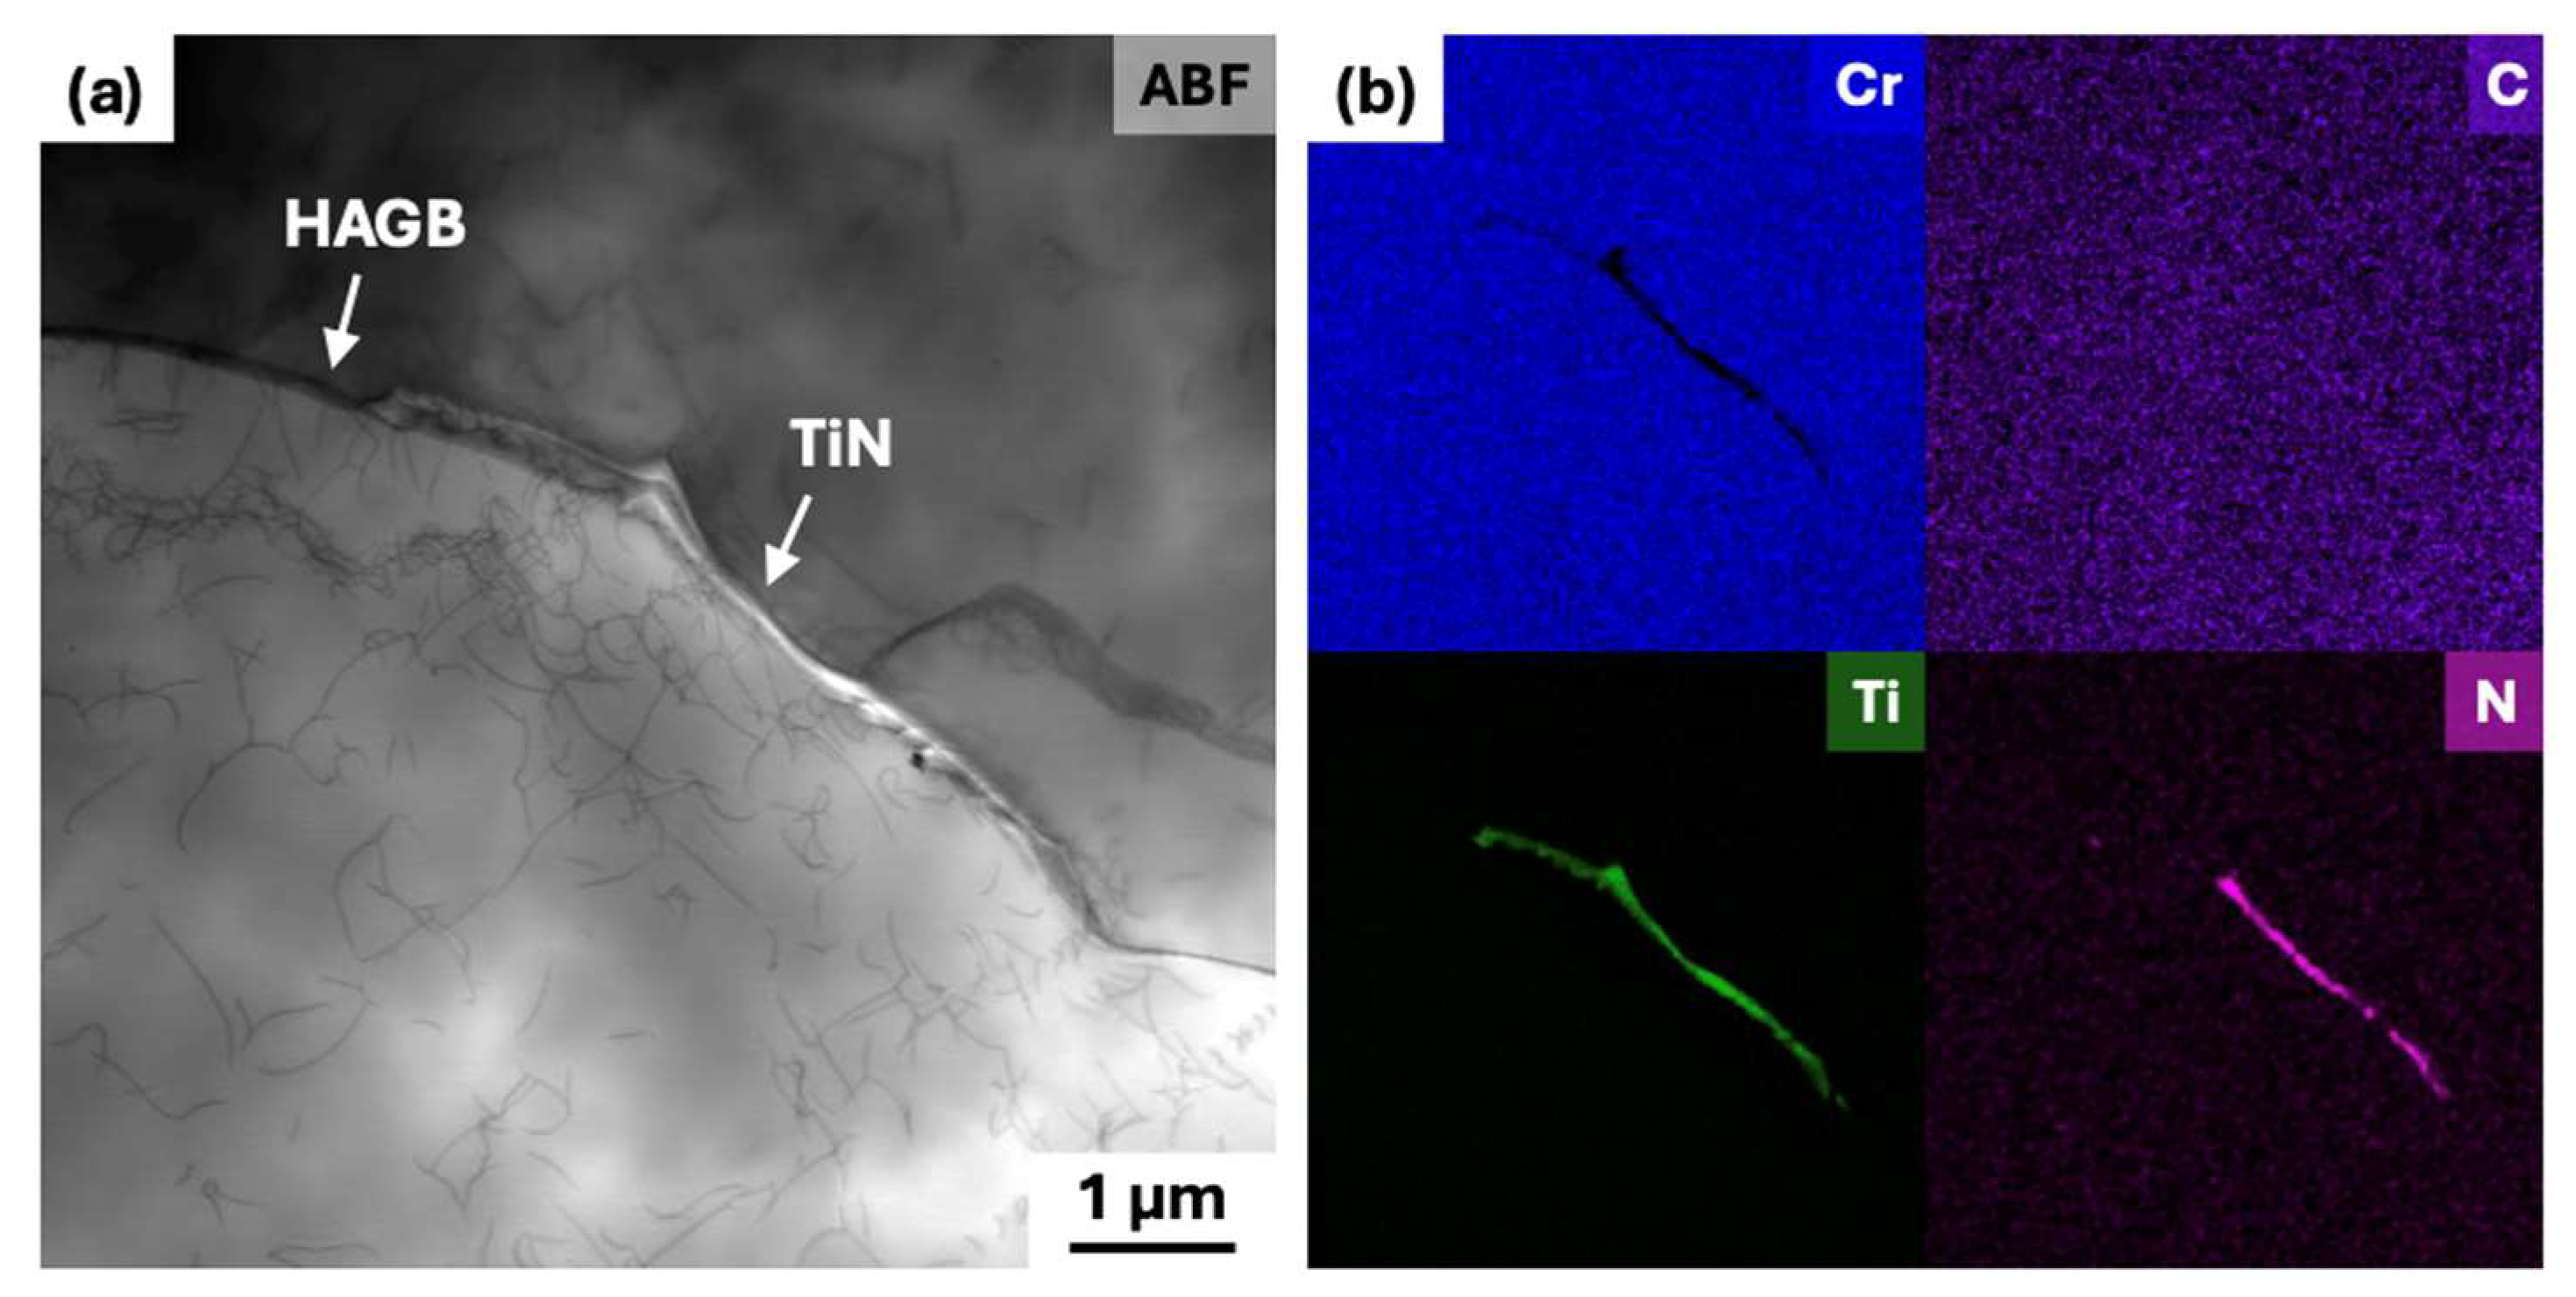
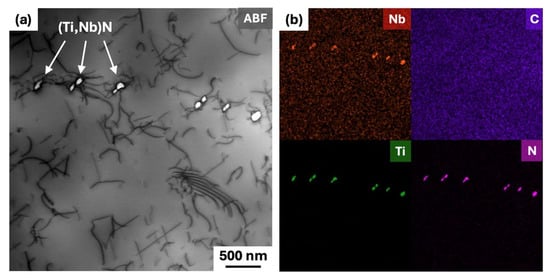
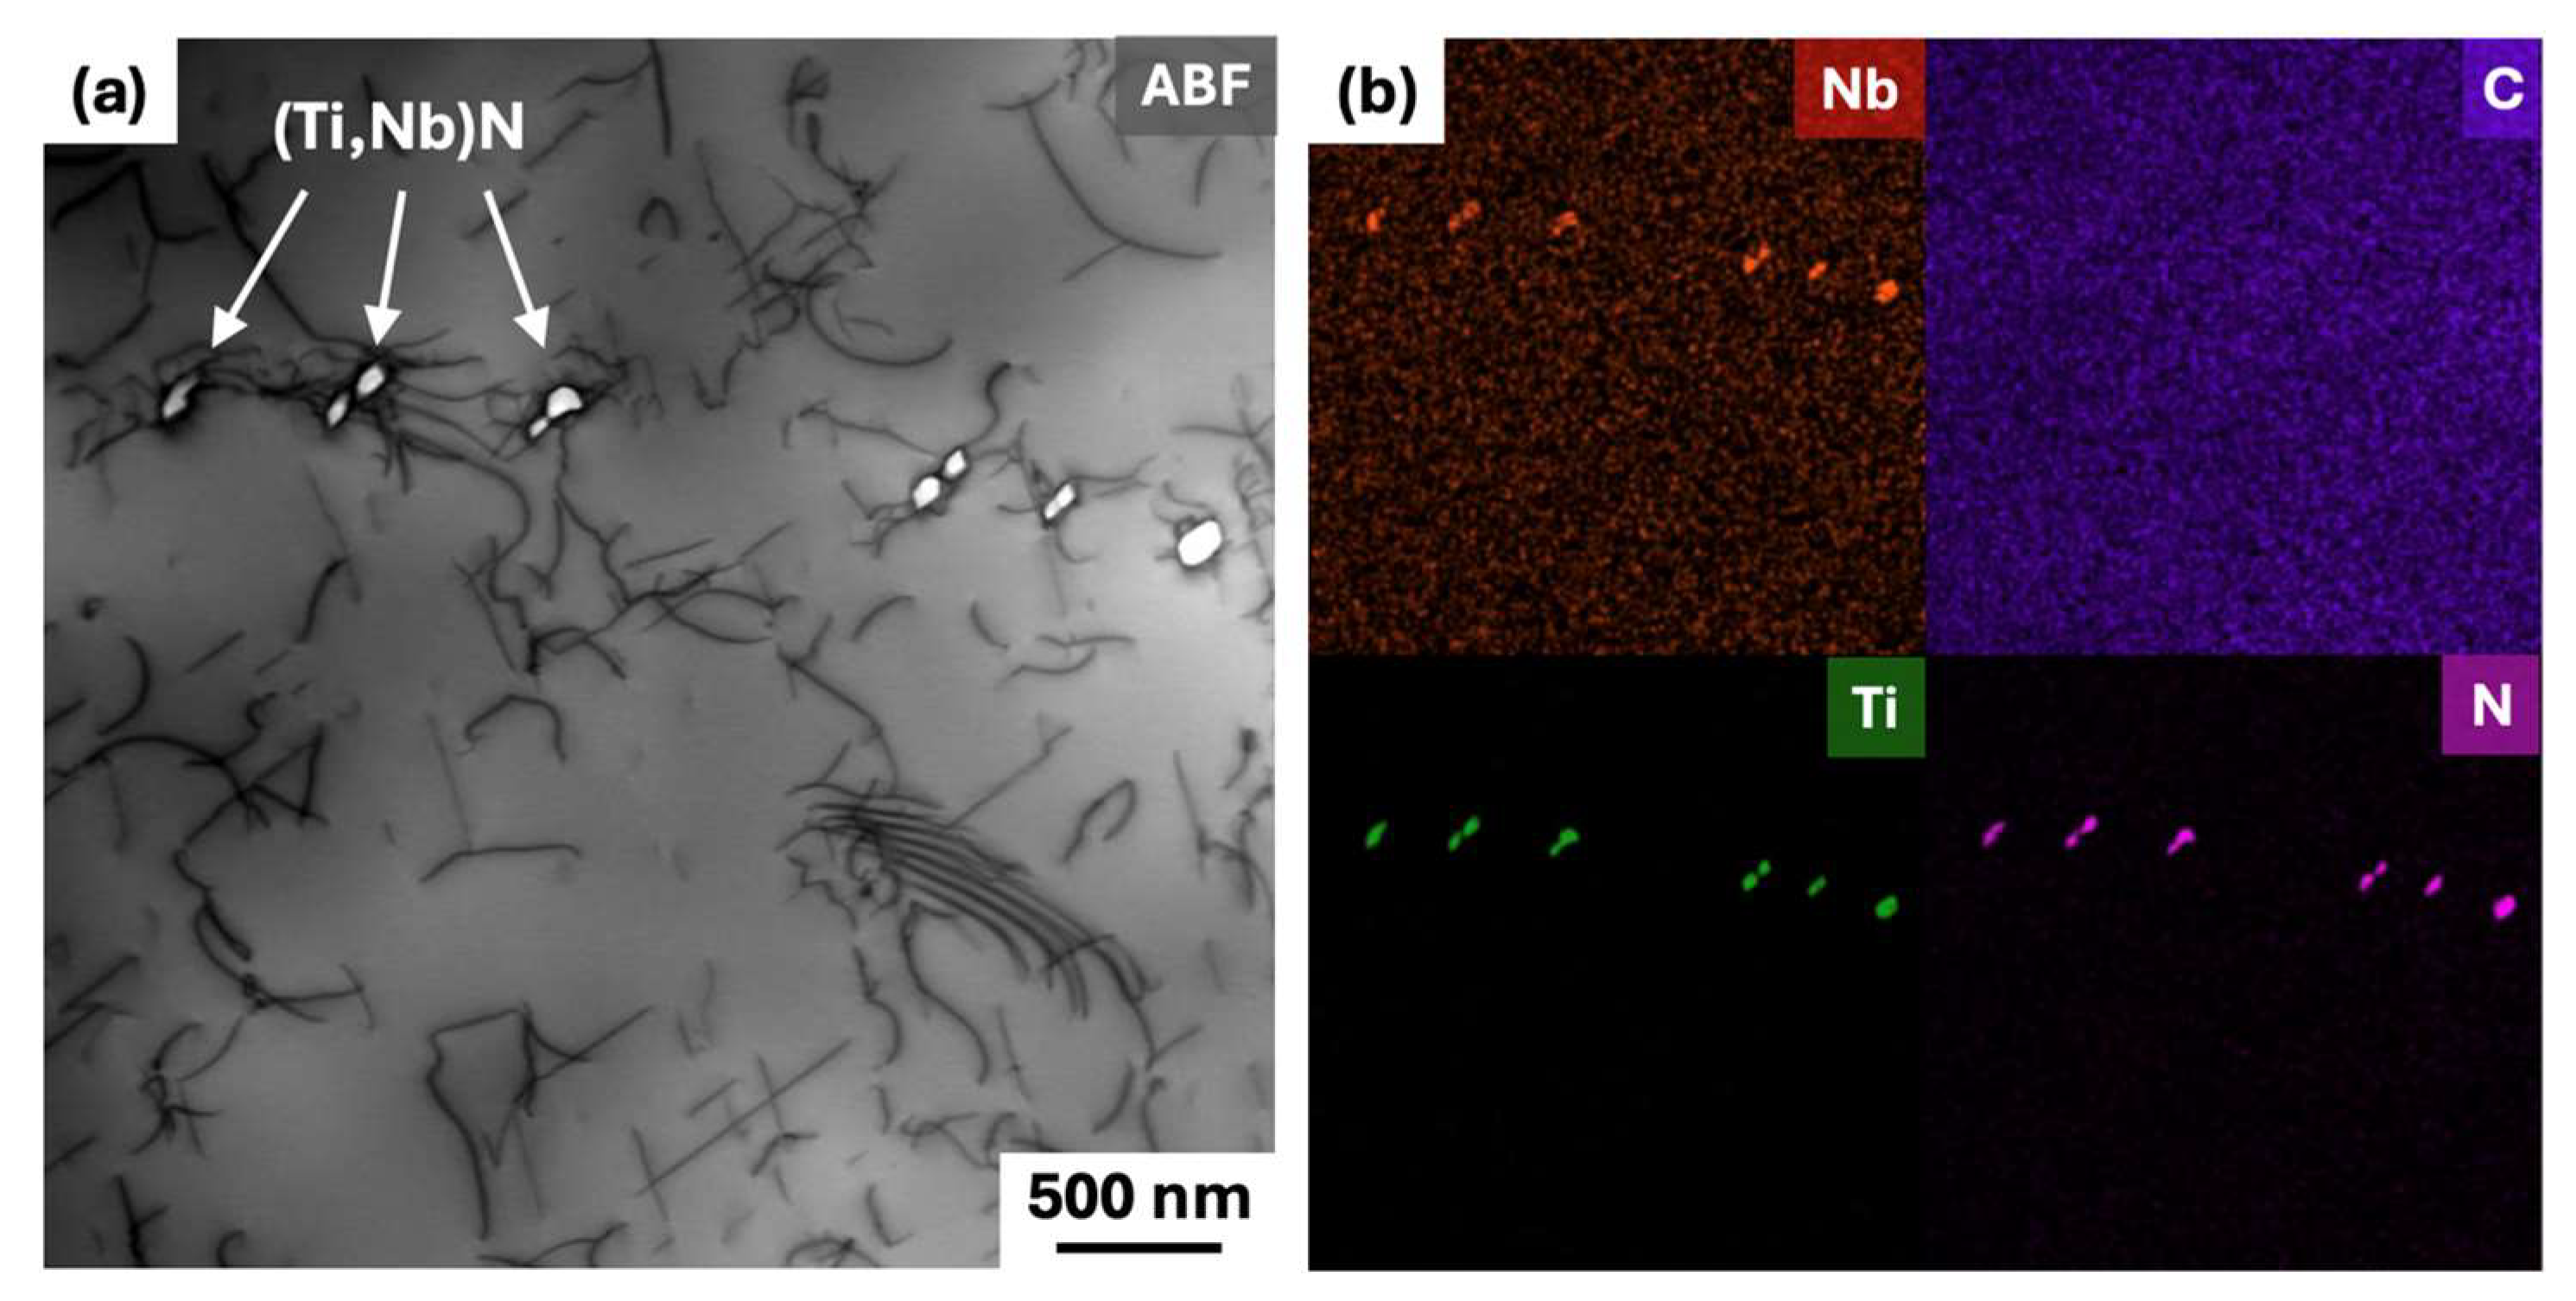
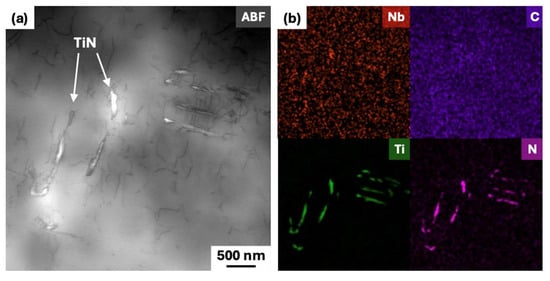
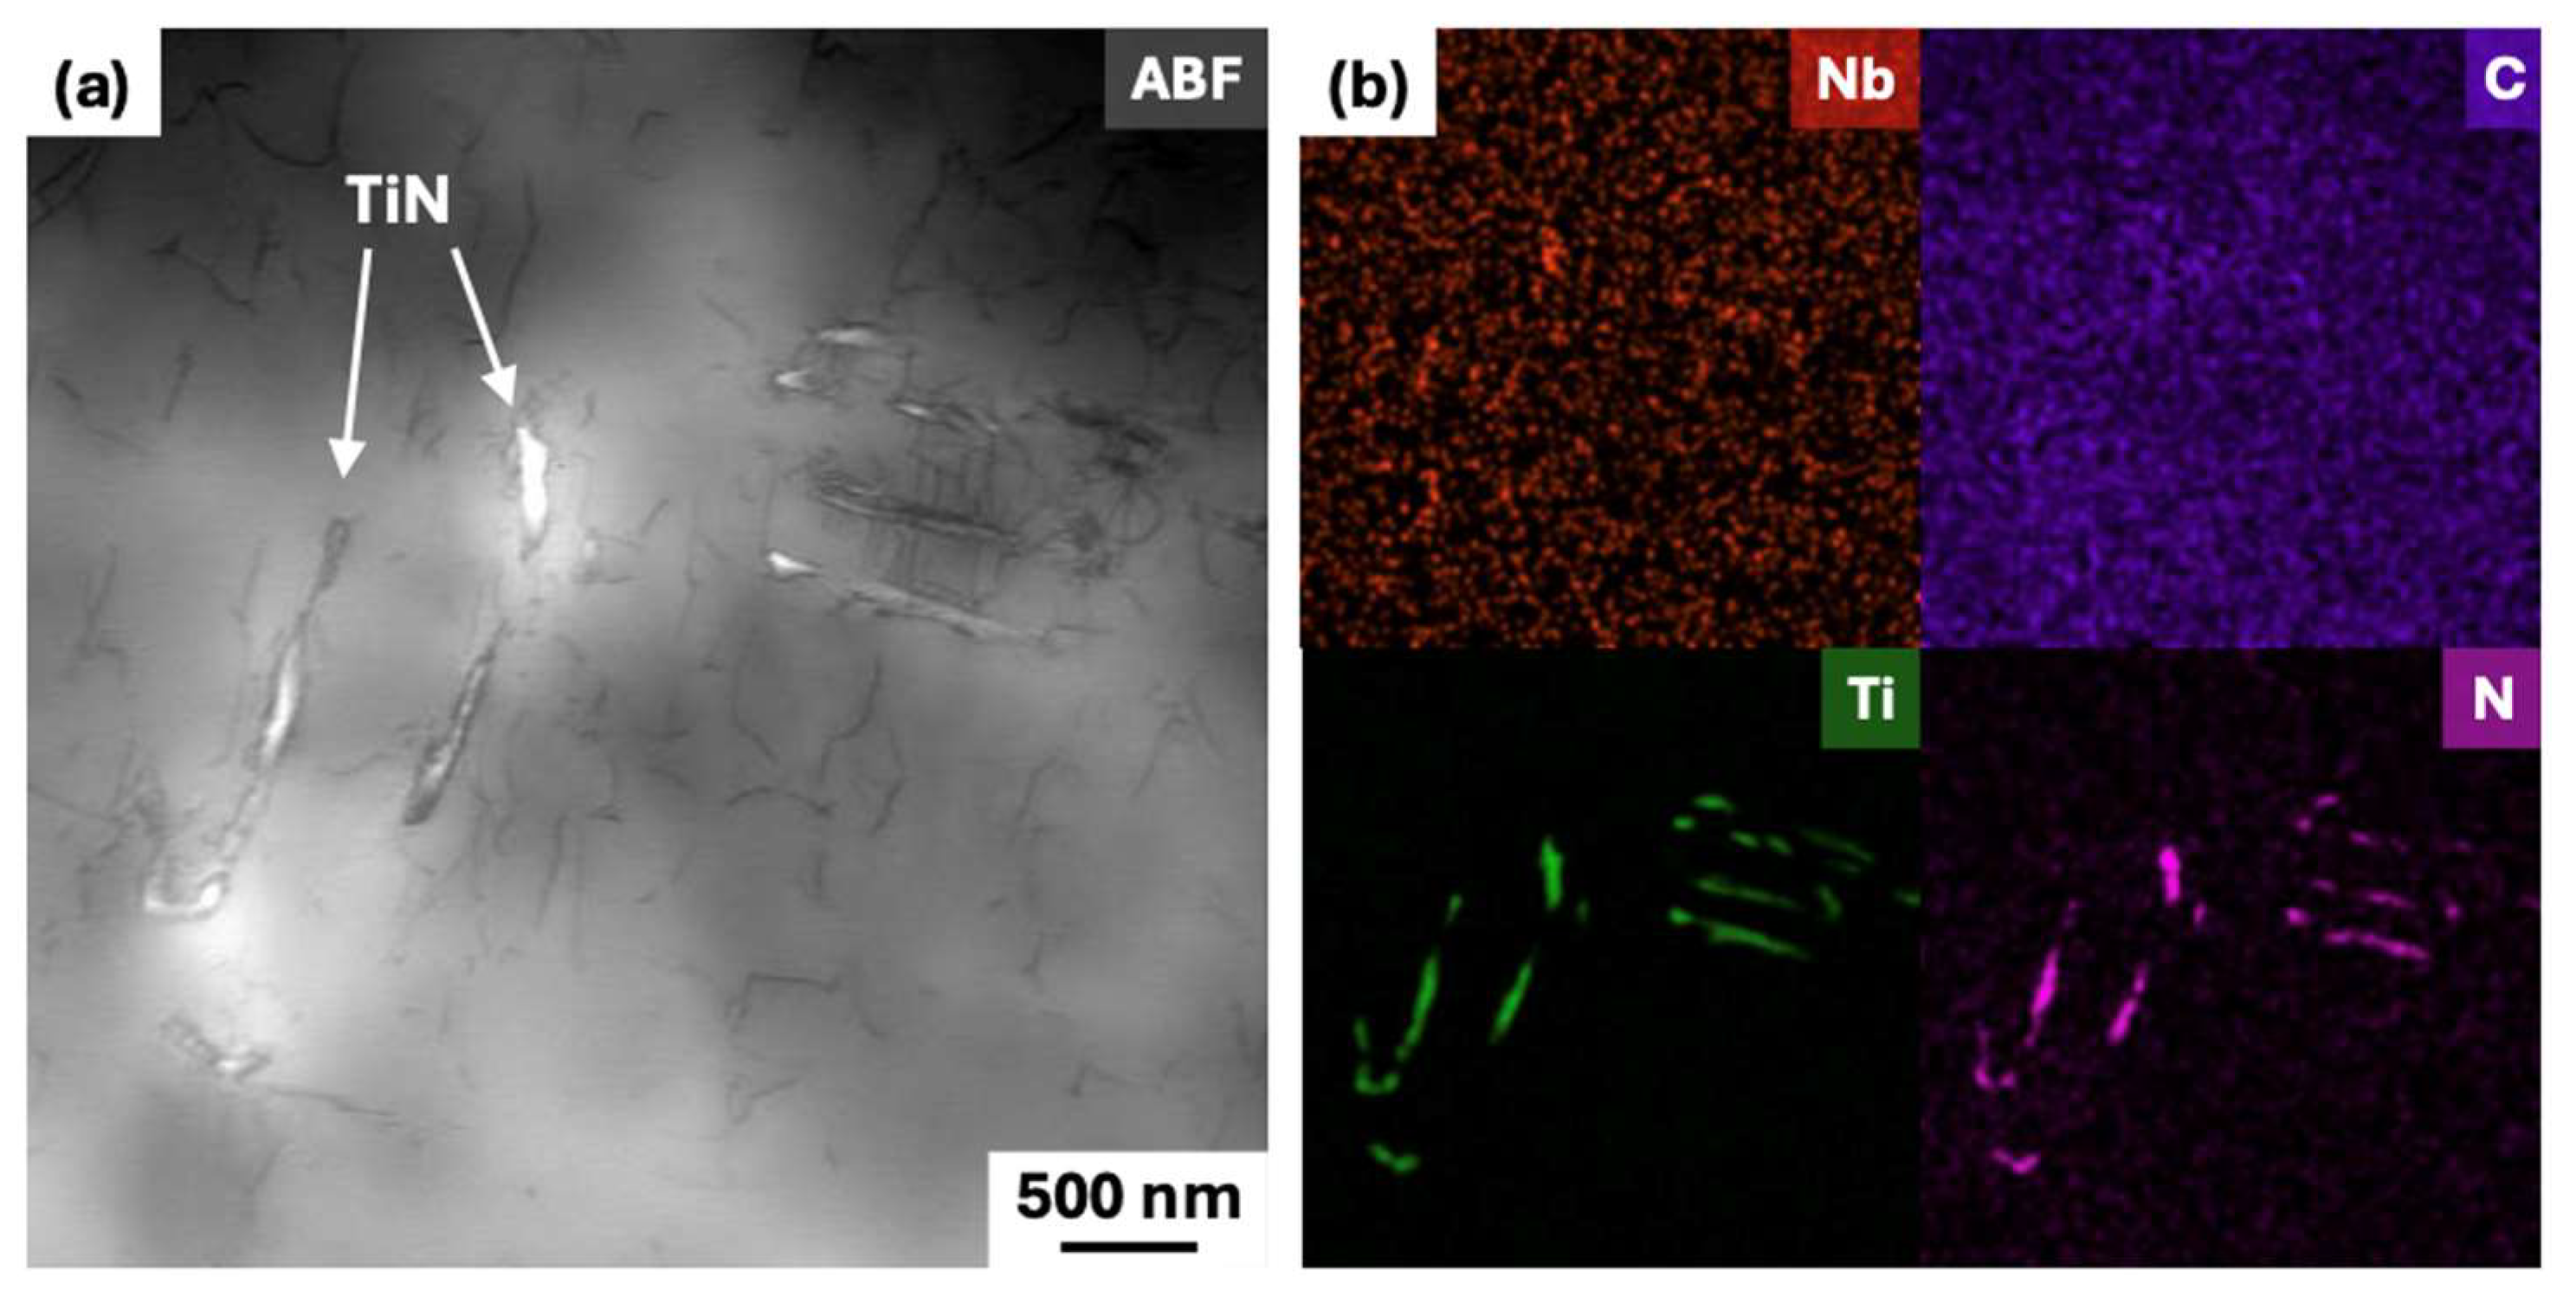
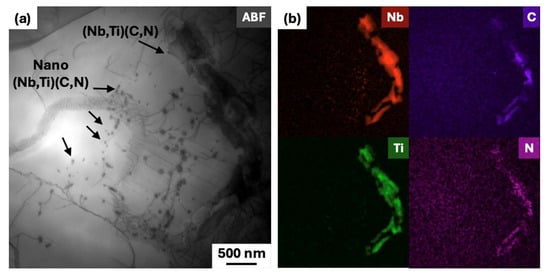
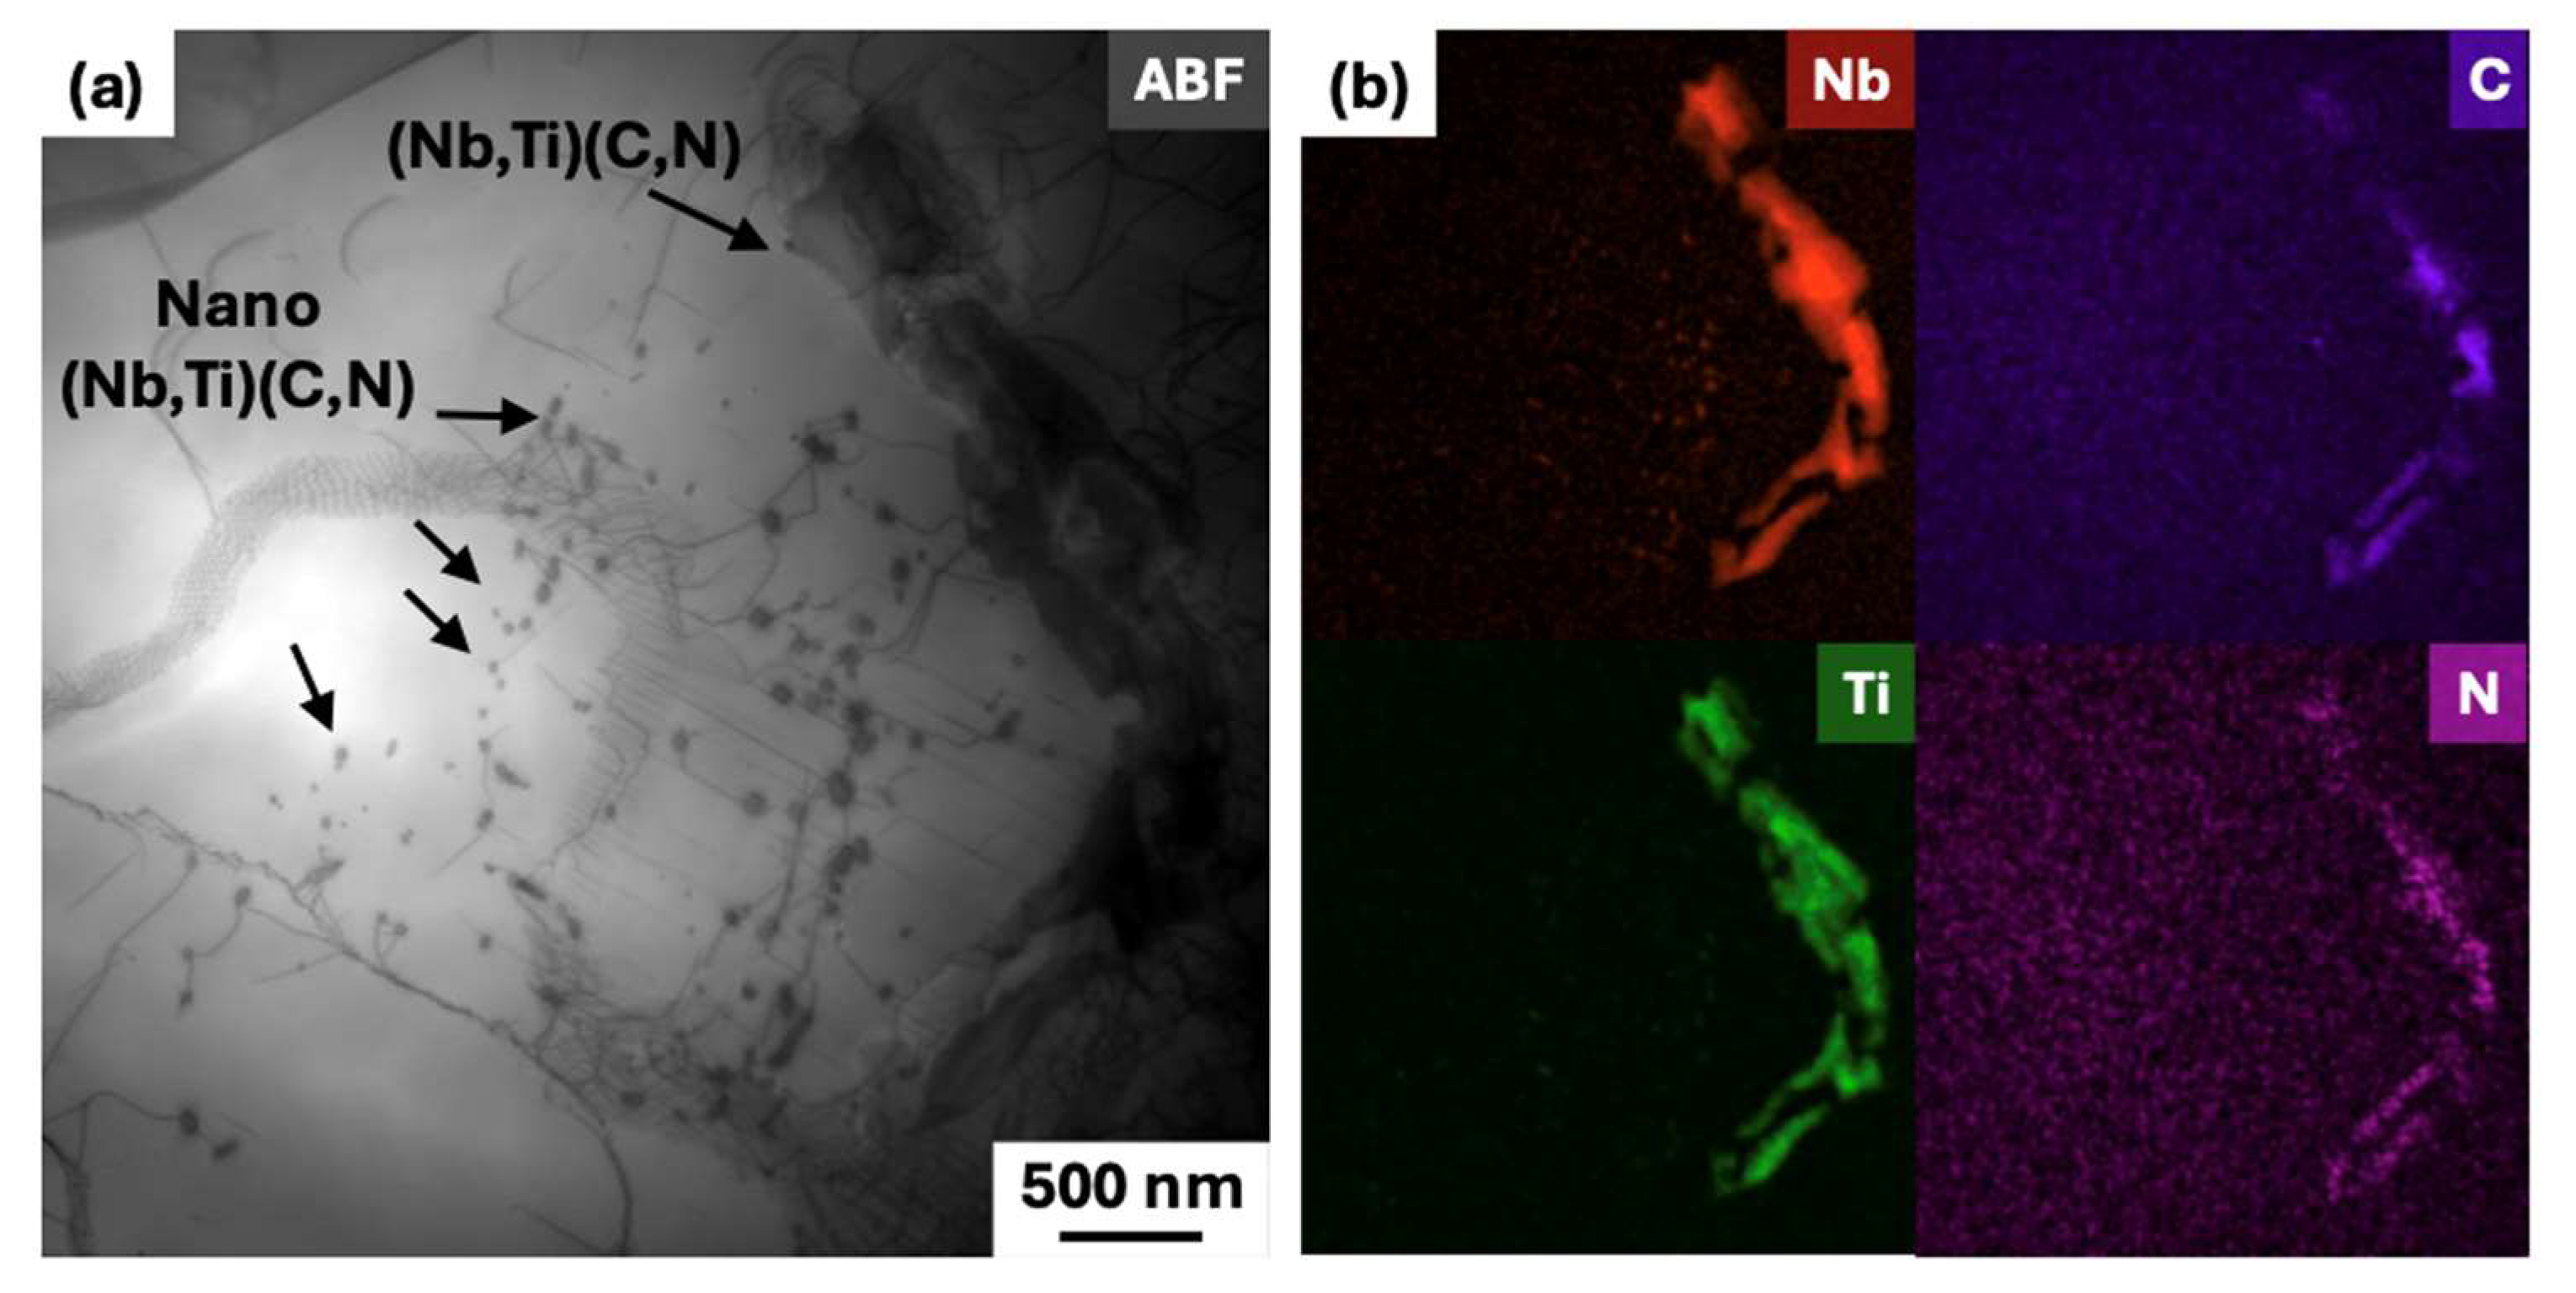
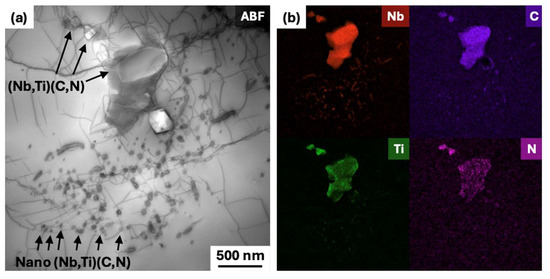
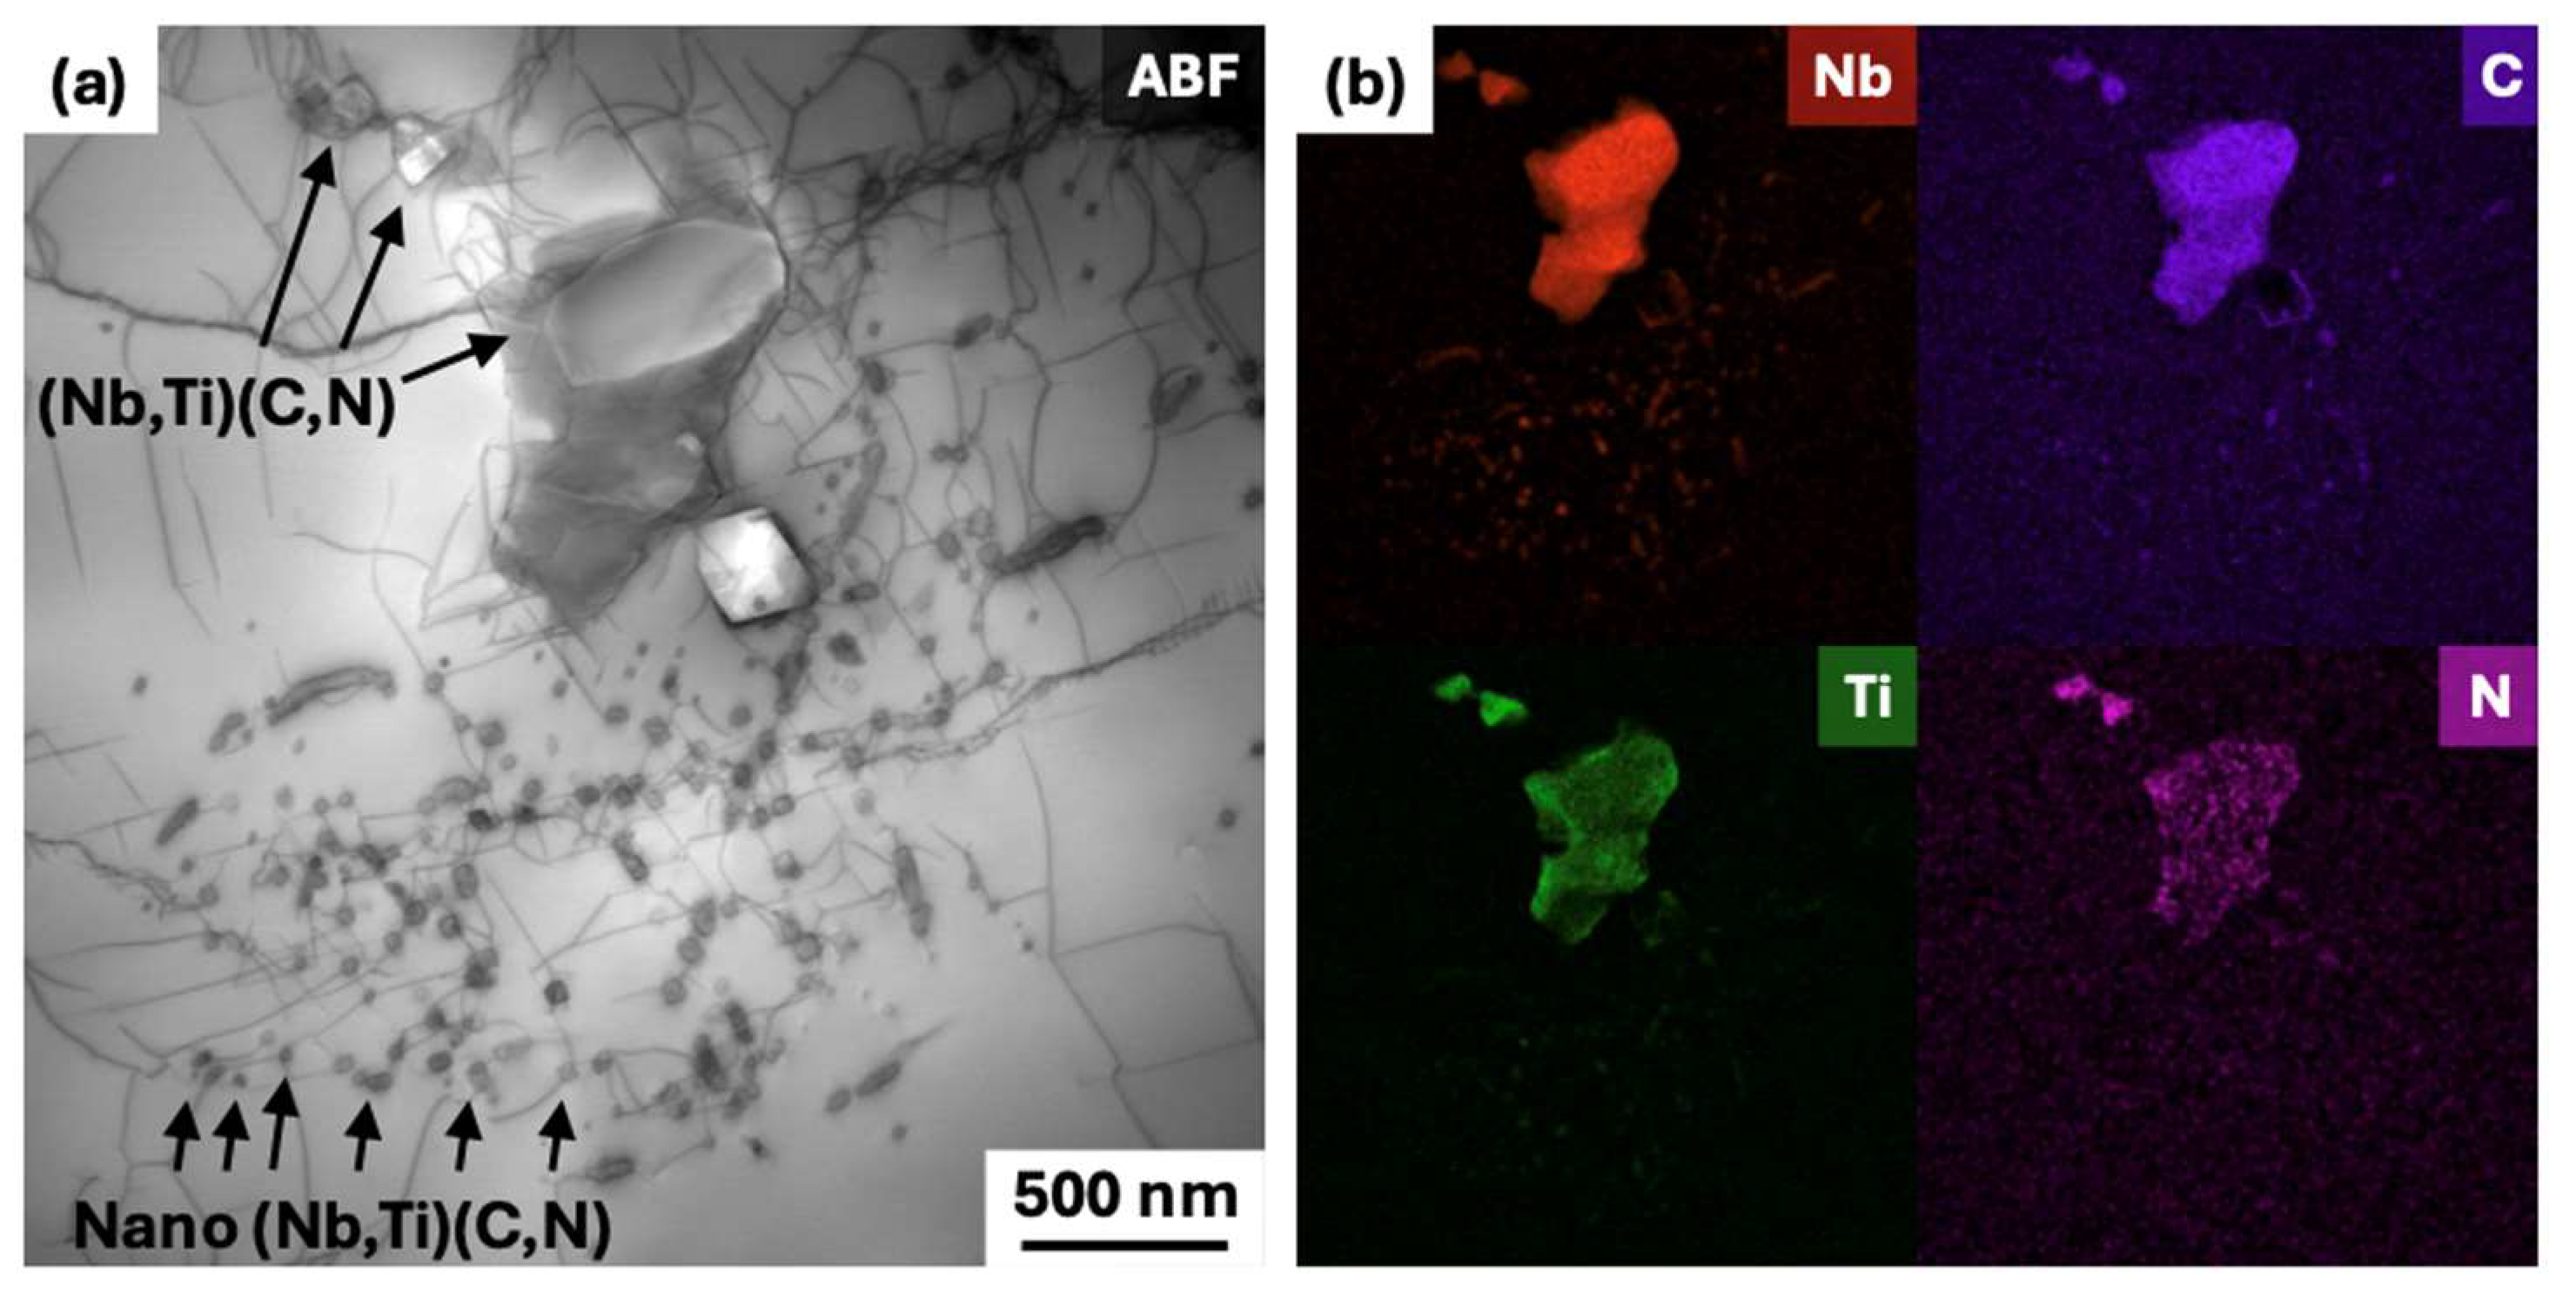
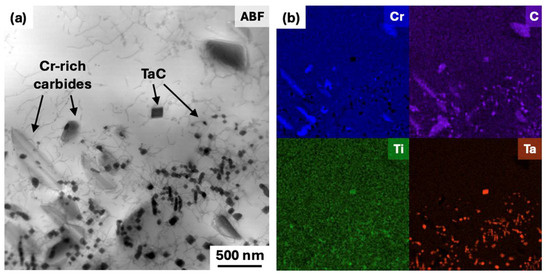
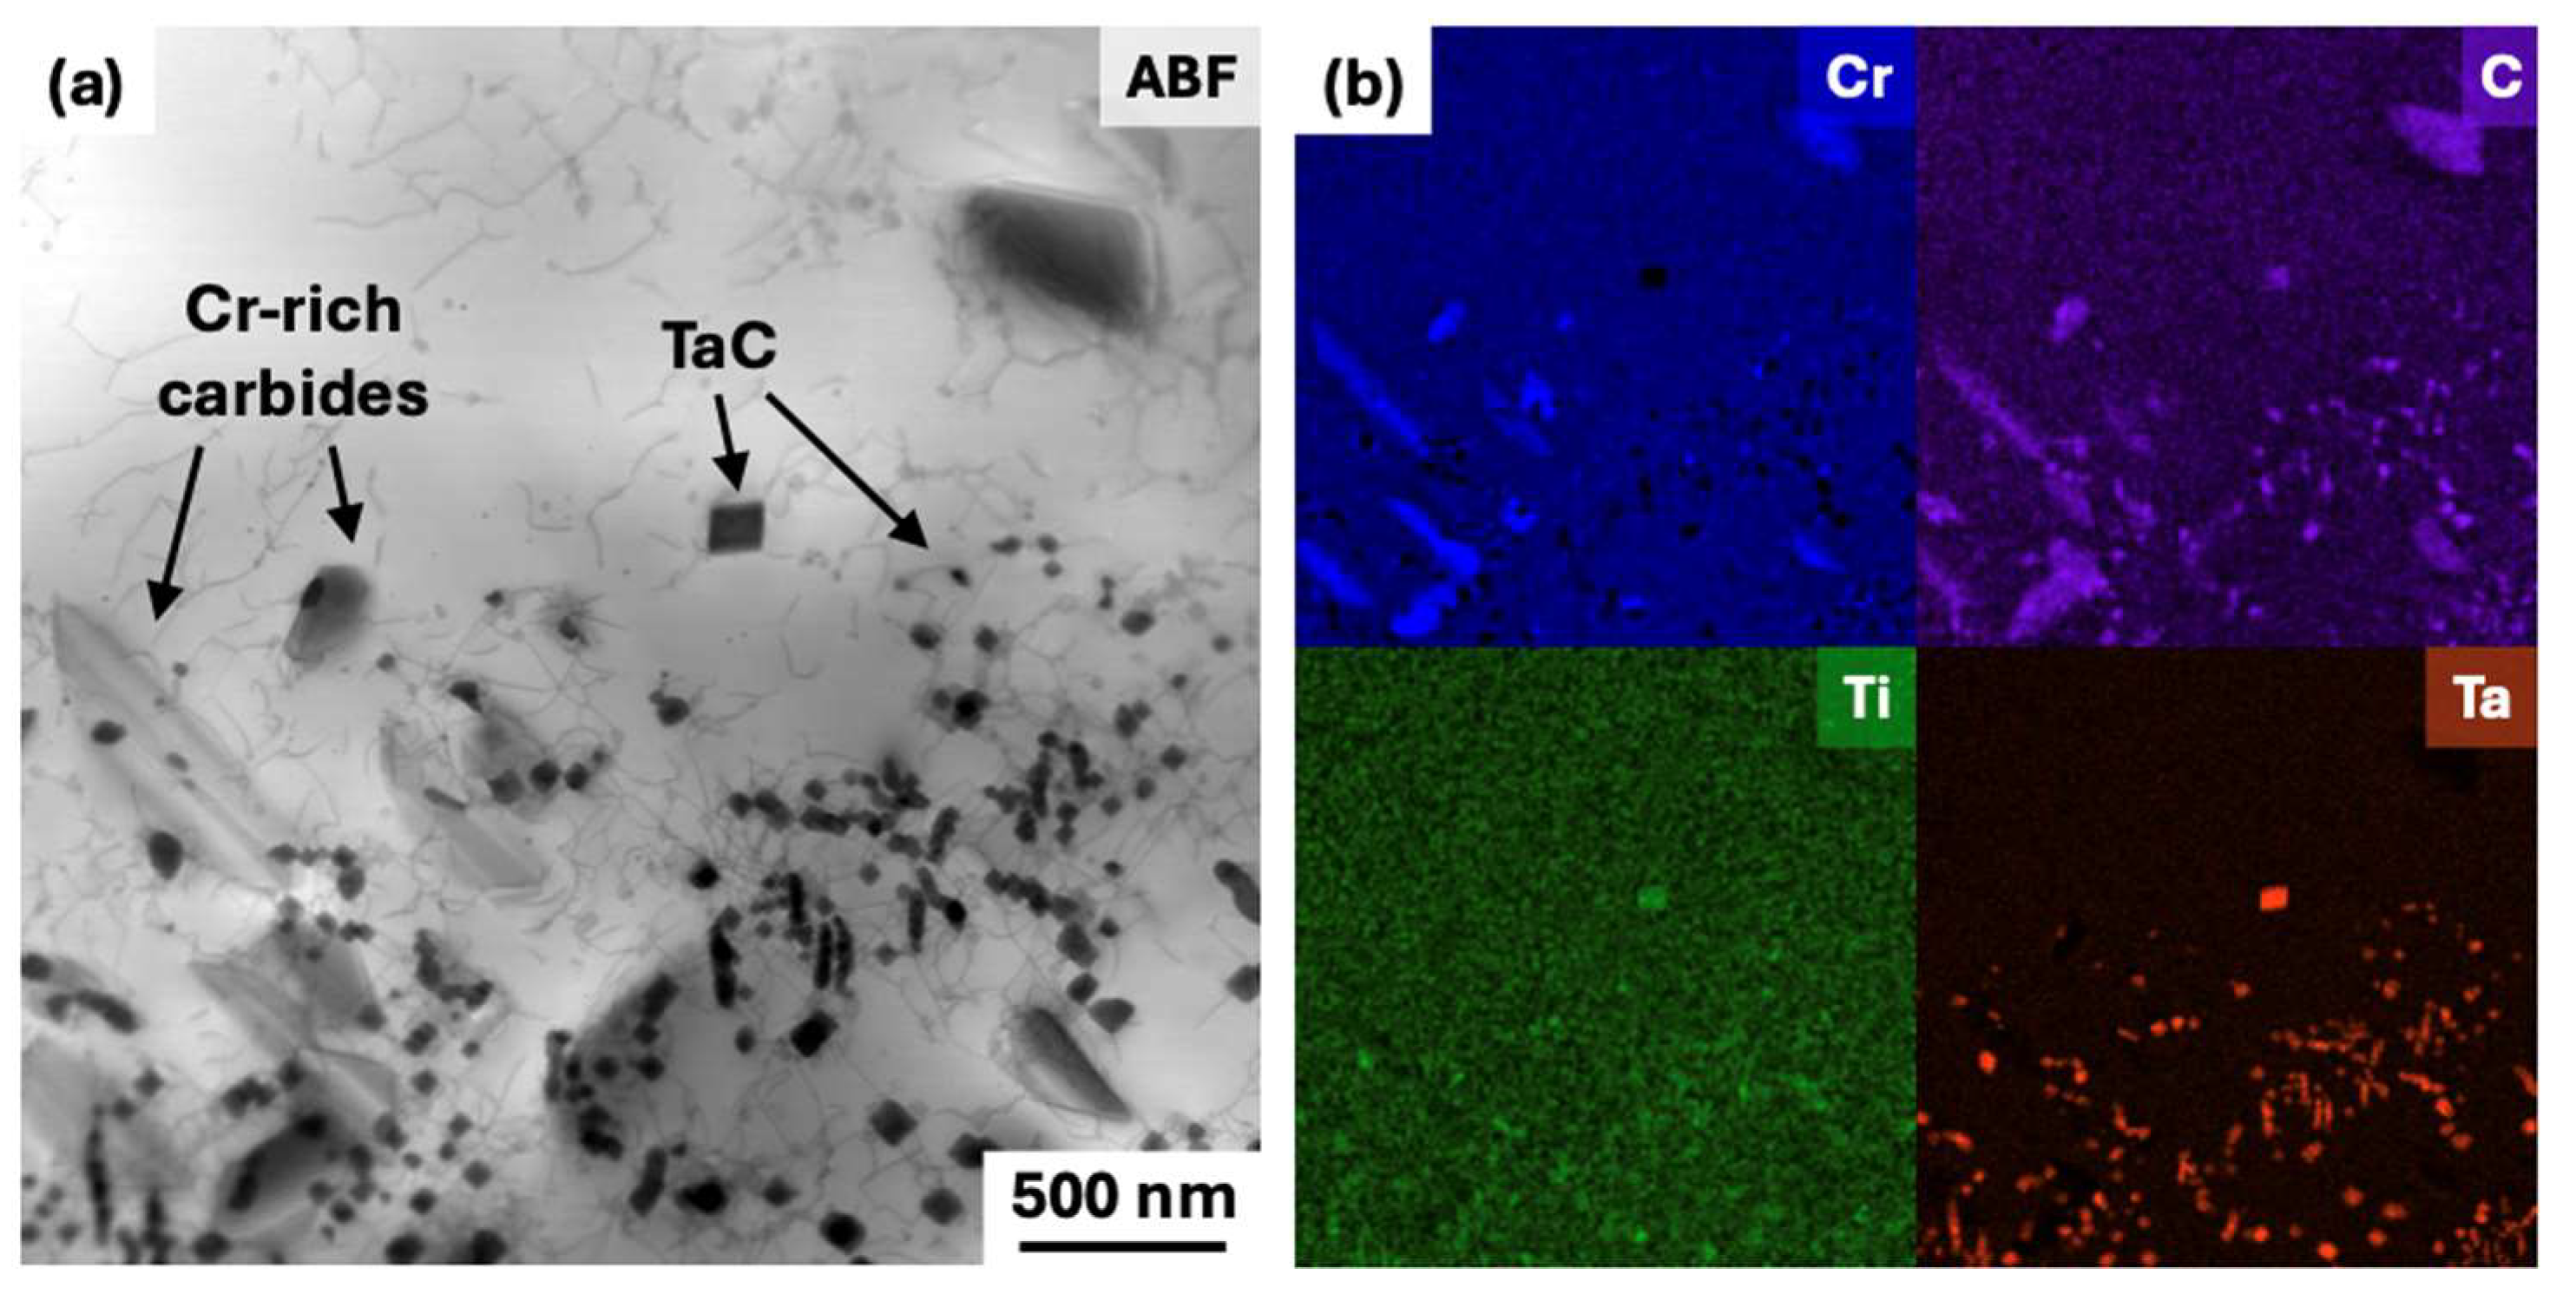
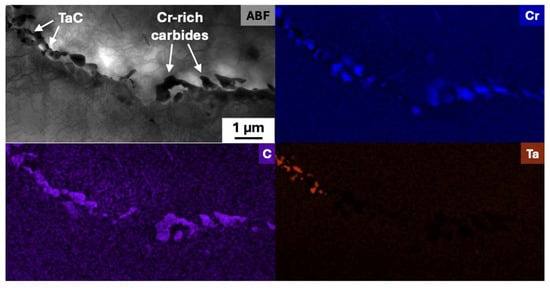
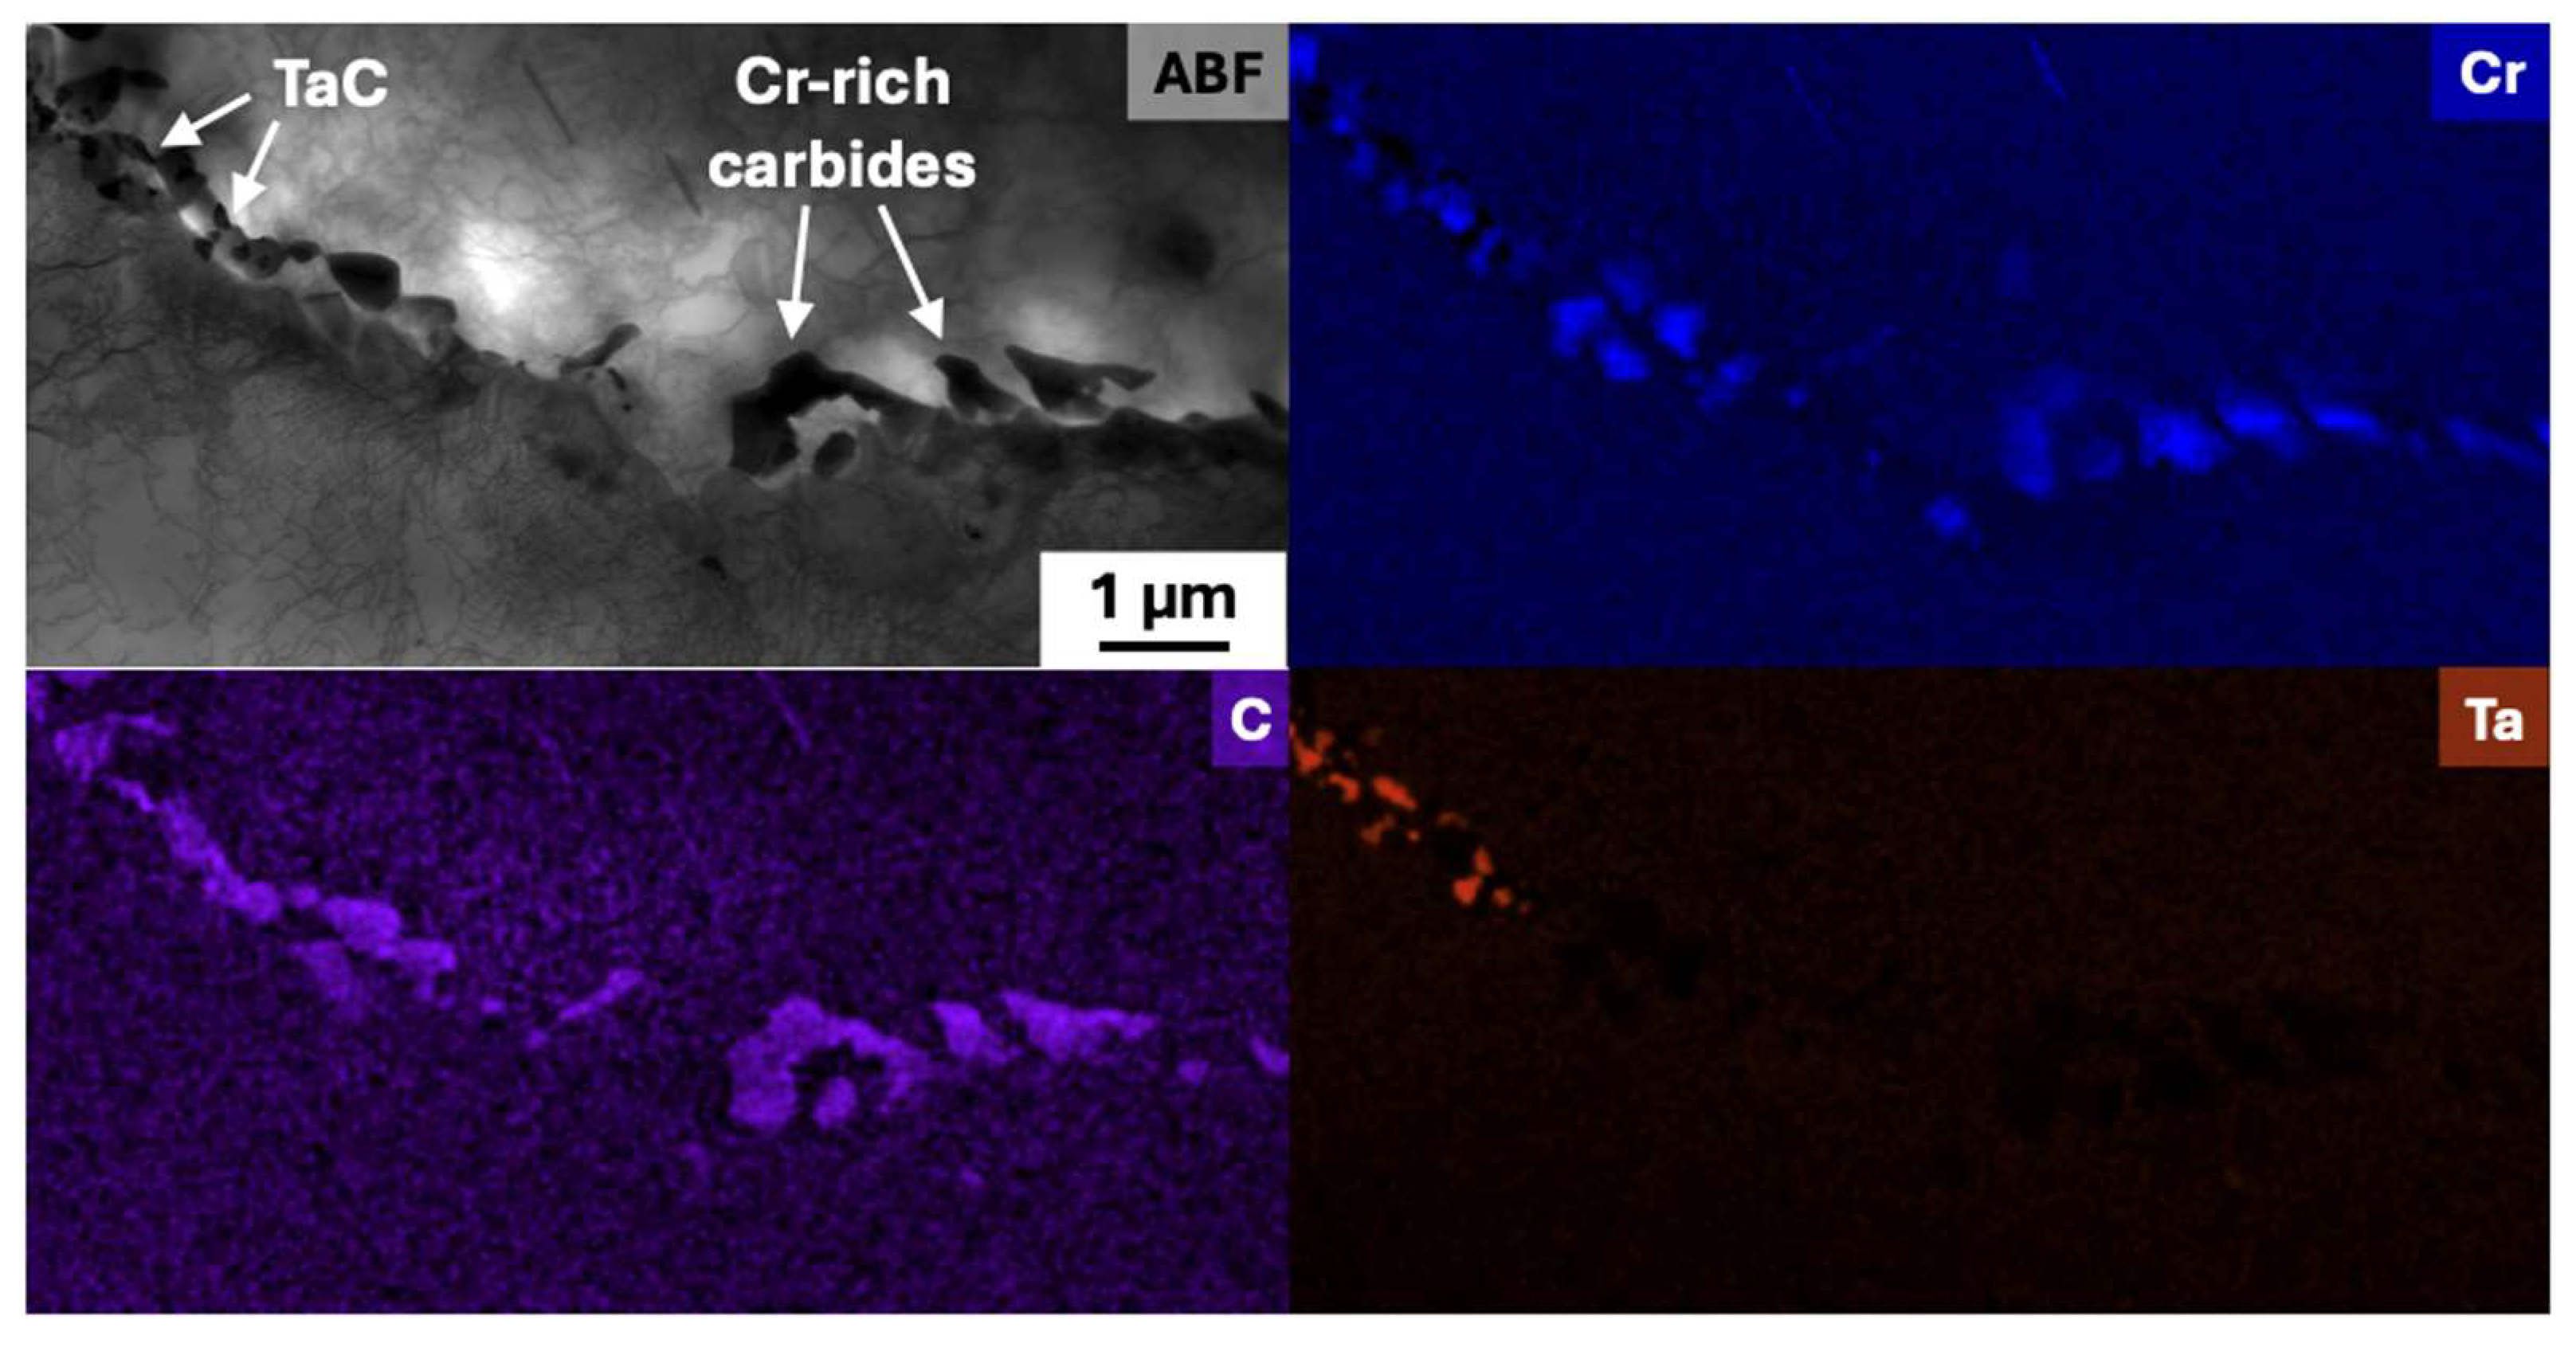
Figure 14, Figure 15, Figure 16, Figure 17, Figure 18, Figure 19, Figure 20 and Figure 21 show STEM and corresponding EDS images of dislocations and precipitates after the 10−4/s DRX test of each tested weld metal to capture the dislocation interactions with precipitates. A precipitate-free region of FM-52 weld metal is shown in Figure 14, along with a titanium nitride precipitate at a high-angle grain boundary in Figure 15. Titanium and niobium-rich carbonitrides experiencing dislocation clustering in FM-52M weld metal are shown in Figure 16 and Figure 17. Similar interactions are seen in the FM-52i weld metal, although the carbonitrides are relatively richer in niobium and carbon compared to 52M, as shown in Figure 18 and Figure 19. The FM-52xl weld metal also displays similar interactions to those seen in FM-52M, as well as FM-52i, except with tantalum carbides and chromium carbides instead of titanium and niobium-rich carbonitrides. This is shown in Figure 20 and Figure 21.
Figure 14.
(a) Annular bright-field (ABF) scanning transmission electron microscopy (STEM) imaging of FM-52 weld metal after 10−4/s DRX test displaying no carbides or nitrides present and (b) corresponding energy dispersive spectroscopy (EDS) maps of chromium, carbon, titanium and niobium.
Figure 15.
(a) ABF STEM imaging of titanium nitride present at a HAGB in FM-52 weld metal after 10−4/s DRX test and (b) corresponding EDS maps of chromium, carbon, titanium and nitrogen.
Figure 16.
(a) ABF STEM imaging of titanium and niobium-rich nitrides impinging dislocations and (b) corresponding EDS maps of niobium, carbon, titanium, and nitrogen in FM-52M weld metal after 10−4/s DRX test.
Figure 17.
(a) ABF STEM imaging of titanium nitride dislocation interactions and (b) corresponding EDS maps of niobium, carbon, titanium, and nitrogen in FM-52M weld metal after 10−4/s DRX test.
Figure 18.
(a) ABF STEM imaging of large and small titanium and niobium-rich carbonitrides impinging dislocations and (b) corresponding EDS maps of niobium, carbon, titanium, and nitrogen in FM-52i weld metal after 10−4/s DRX test.
Figure 19.
(a) ABF STEM imaging of large and small titanium and niobium-rich carbonitrides interacting with dislocations and (b) corresponding EDS maps of niobium, carbon, titanium, and nitrogen in FM-52i weld metal after 10−4/s DRX test.
Figure 20.
(a) ABF STEM imaging and (b) corresponding EDS maps of niobium, carbon, chromium, and titanium, revealing that tantalum carbides and chromium-rich carbides impinge dislocations in FM-52xl weld metal after 10−4/s DRX test.
Figure 21.
ABF STEM imaging and corresponding EDS maps of tantalum and chromium-rich carbides along a HAGB in FM-52xl weld metal after 10−4/s DRX test.
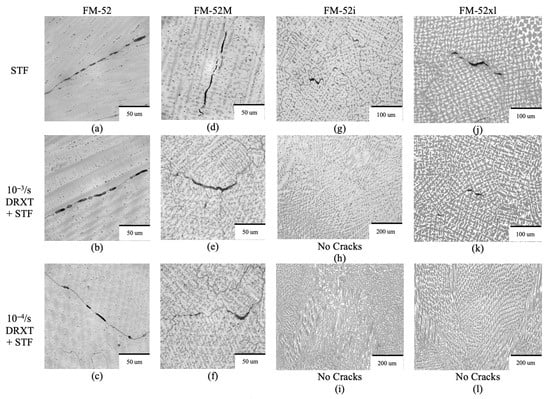
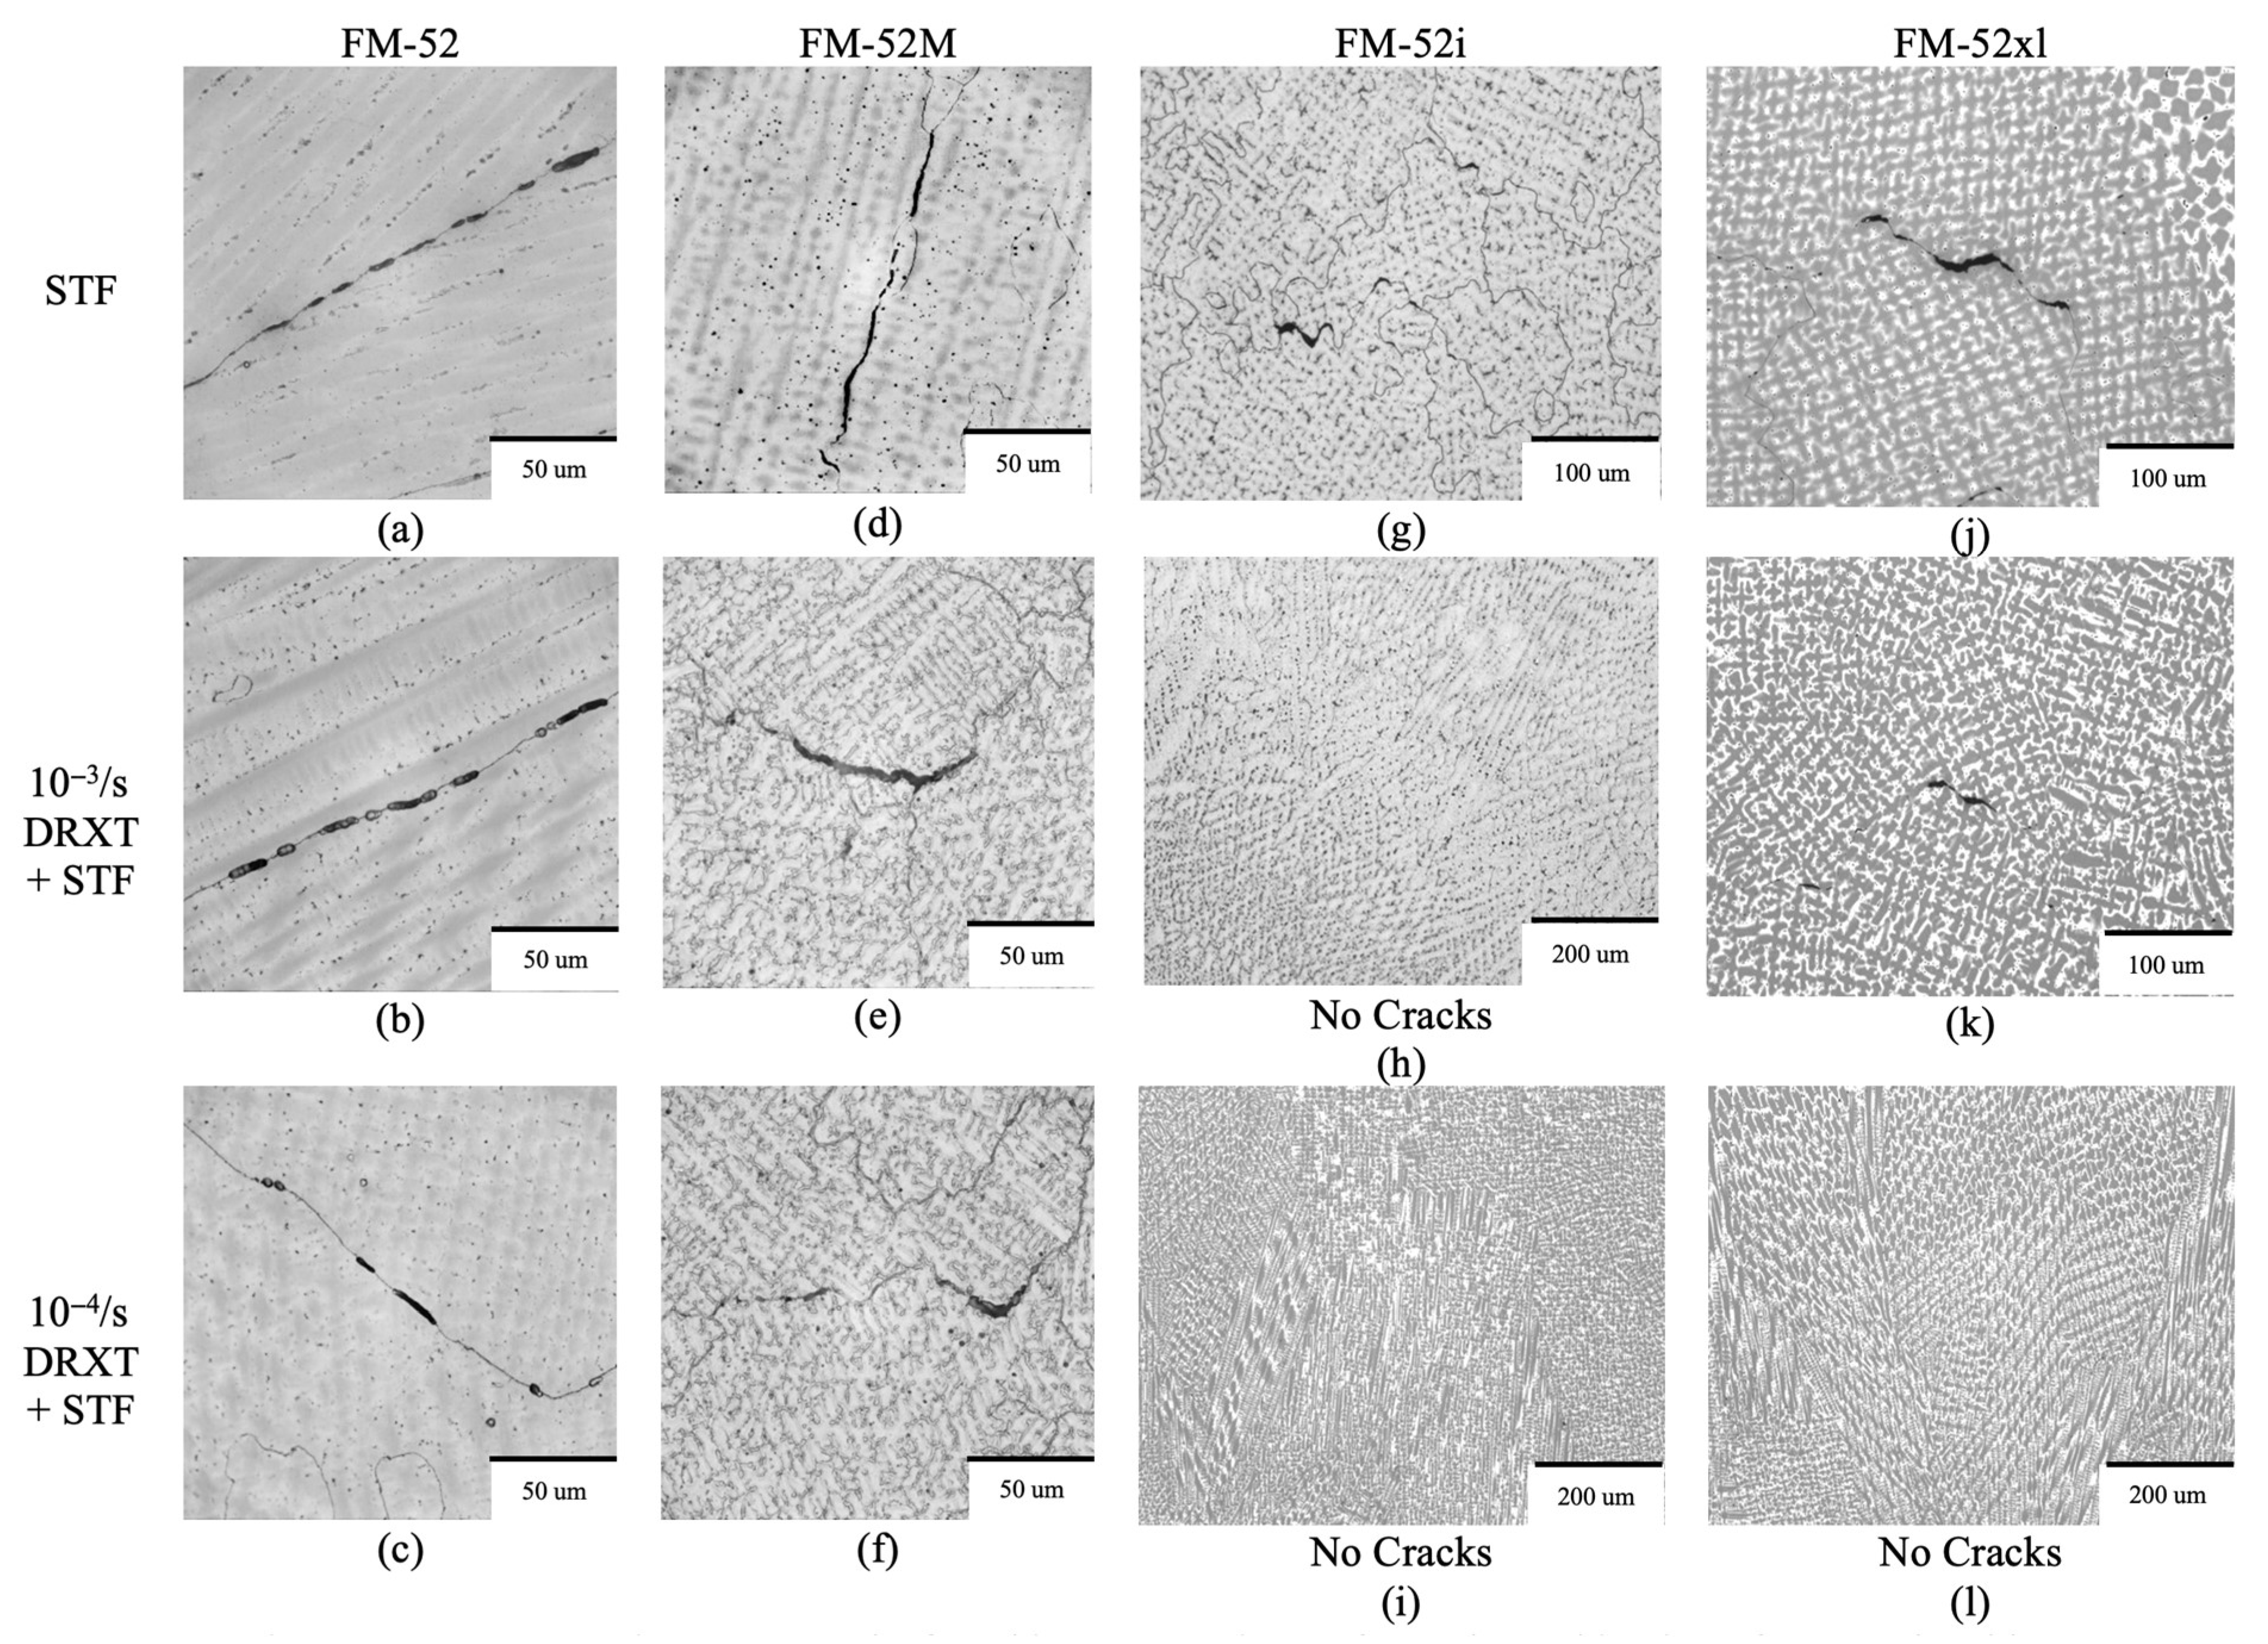
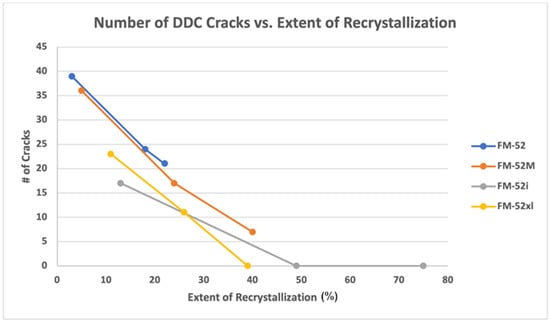
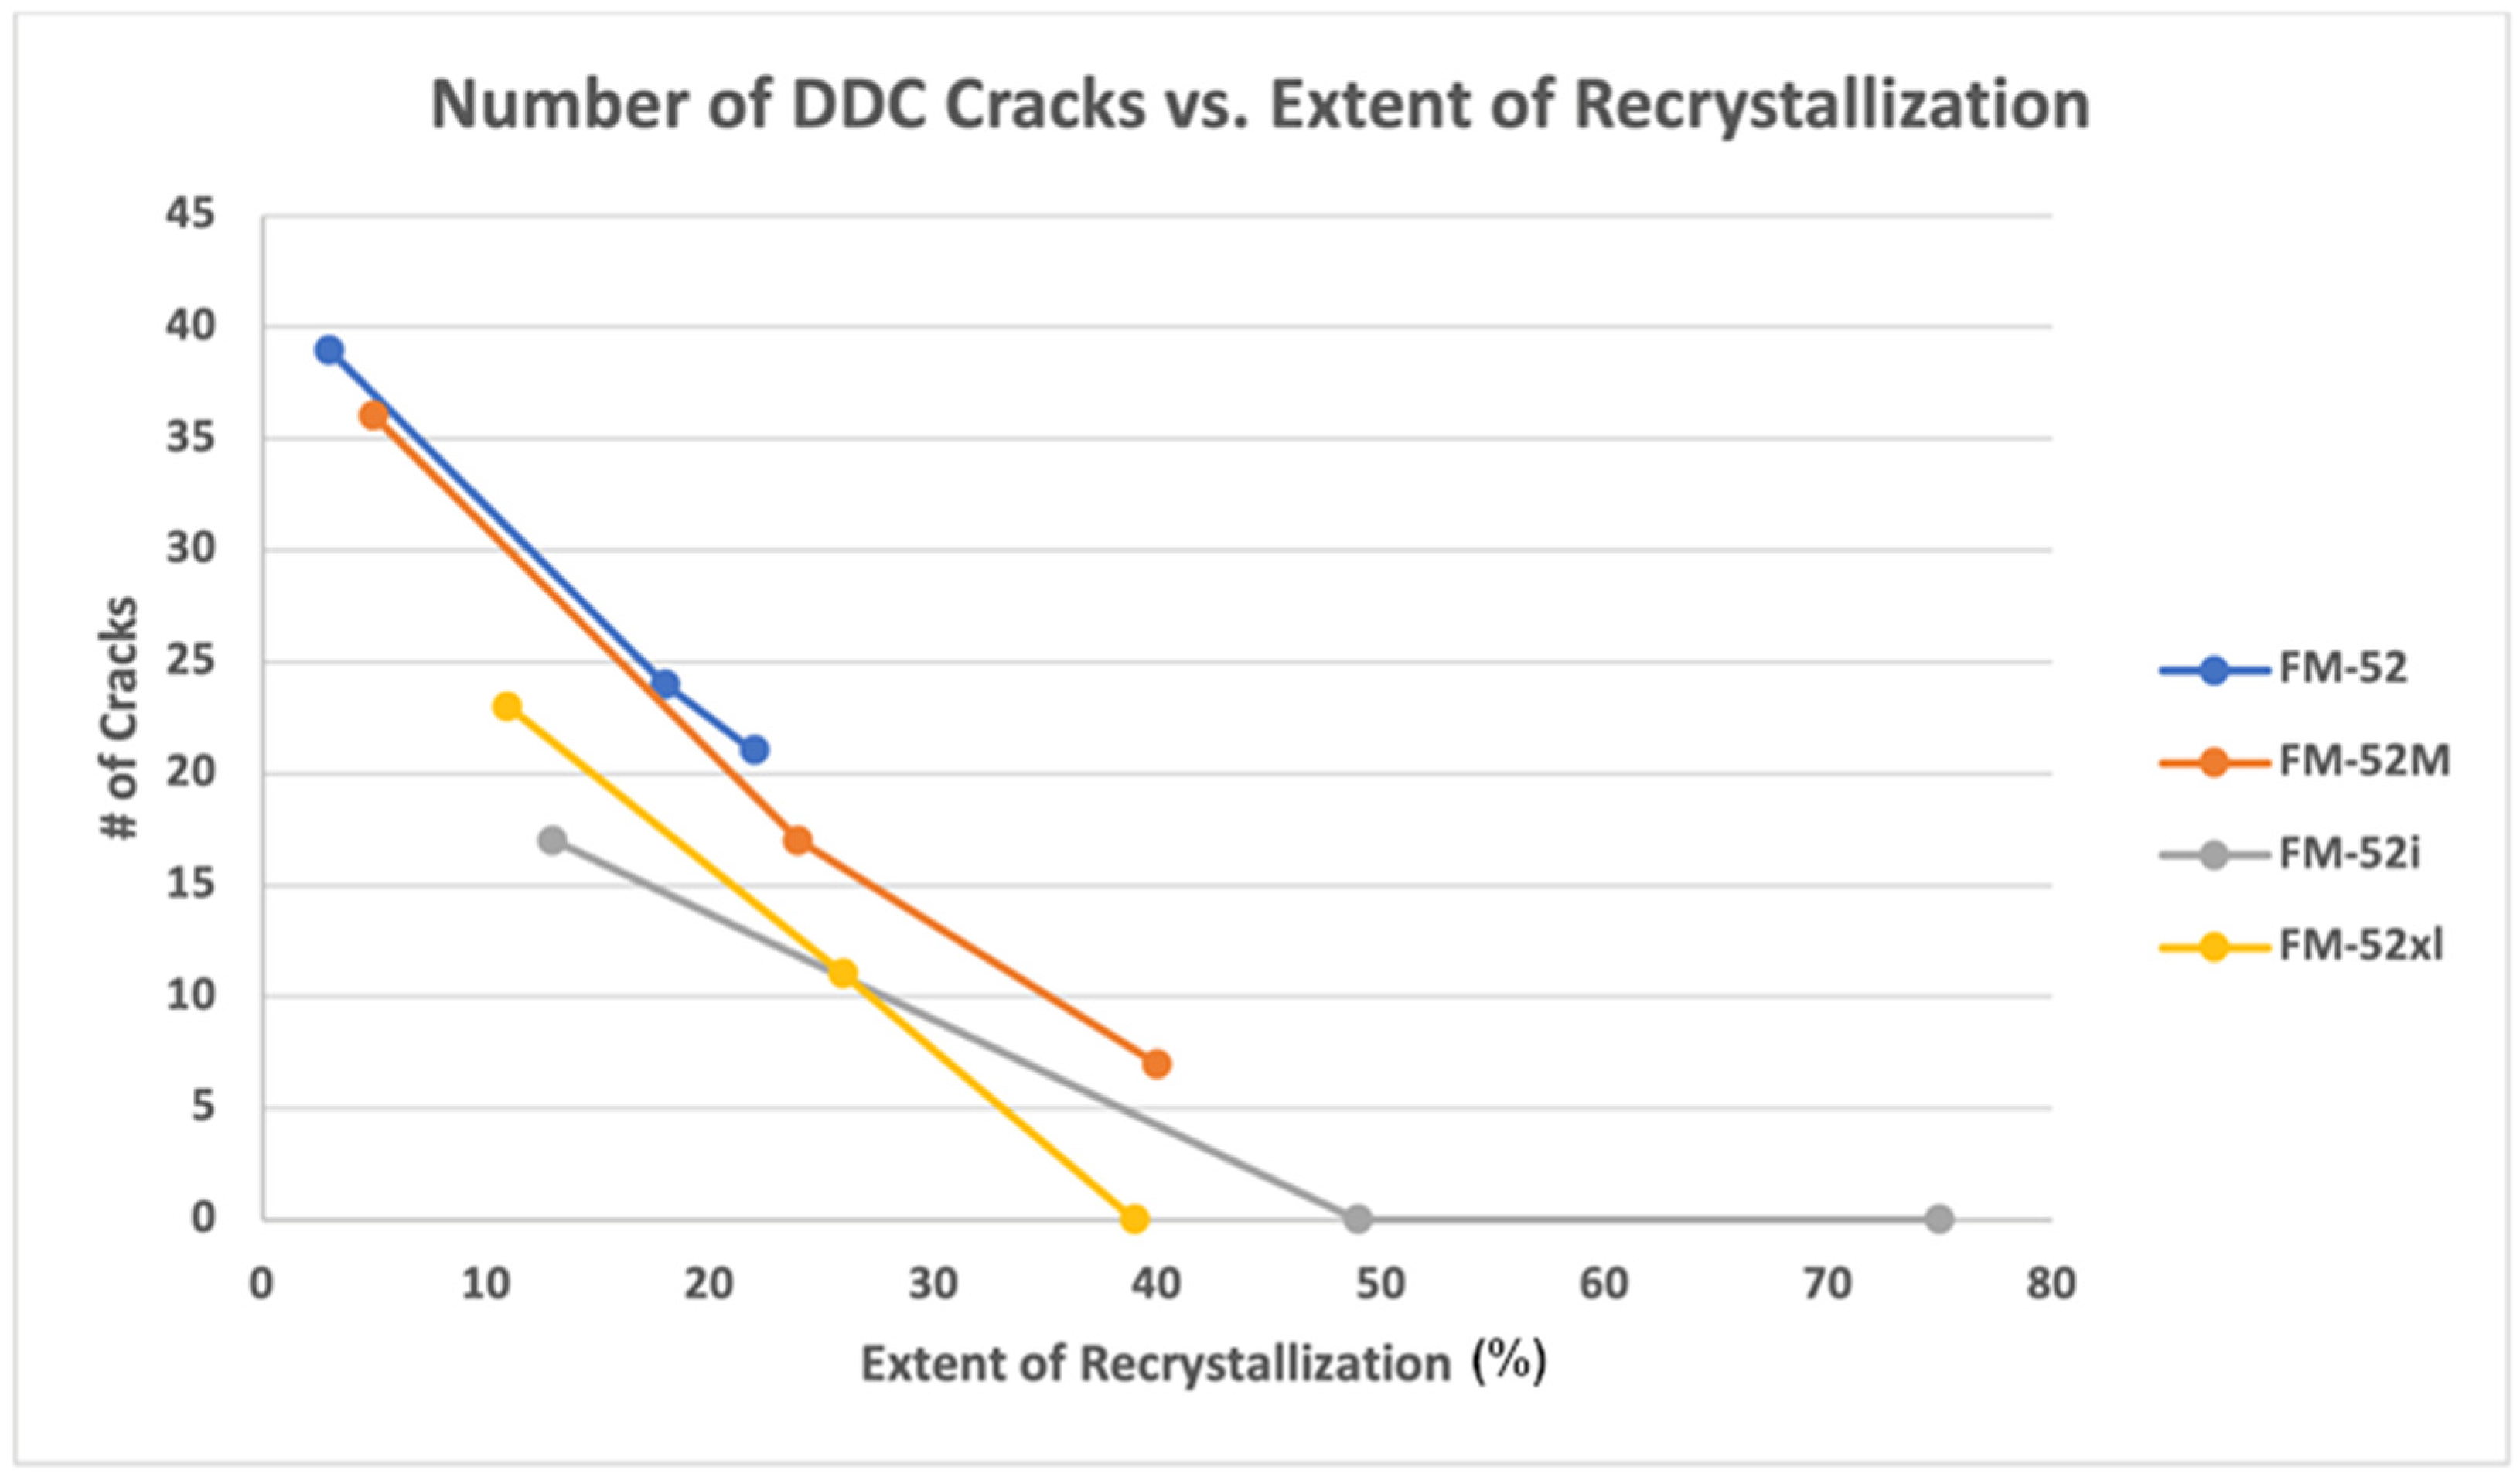
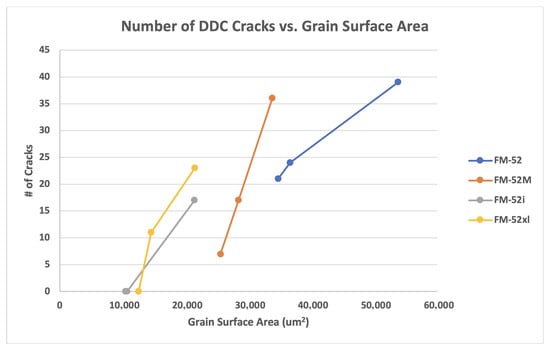
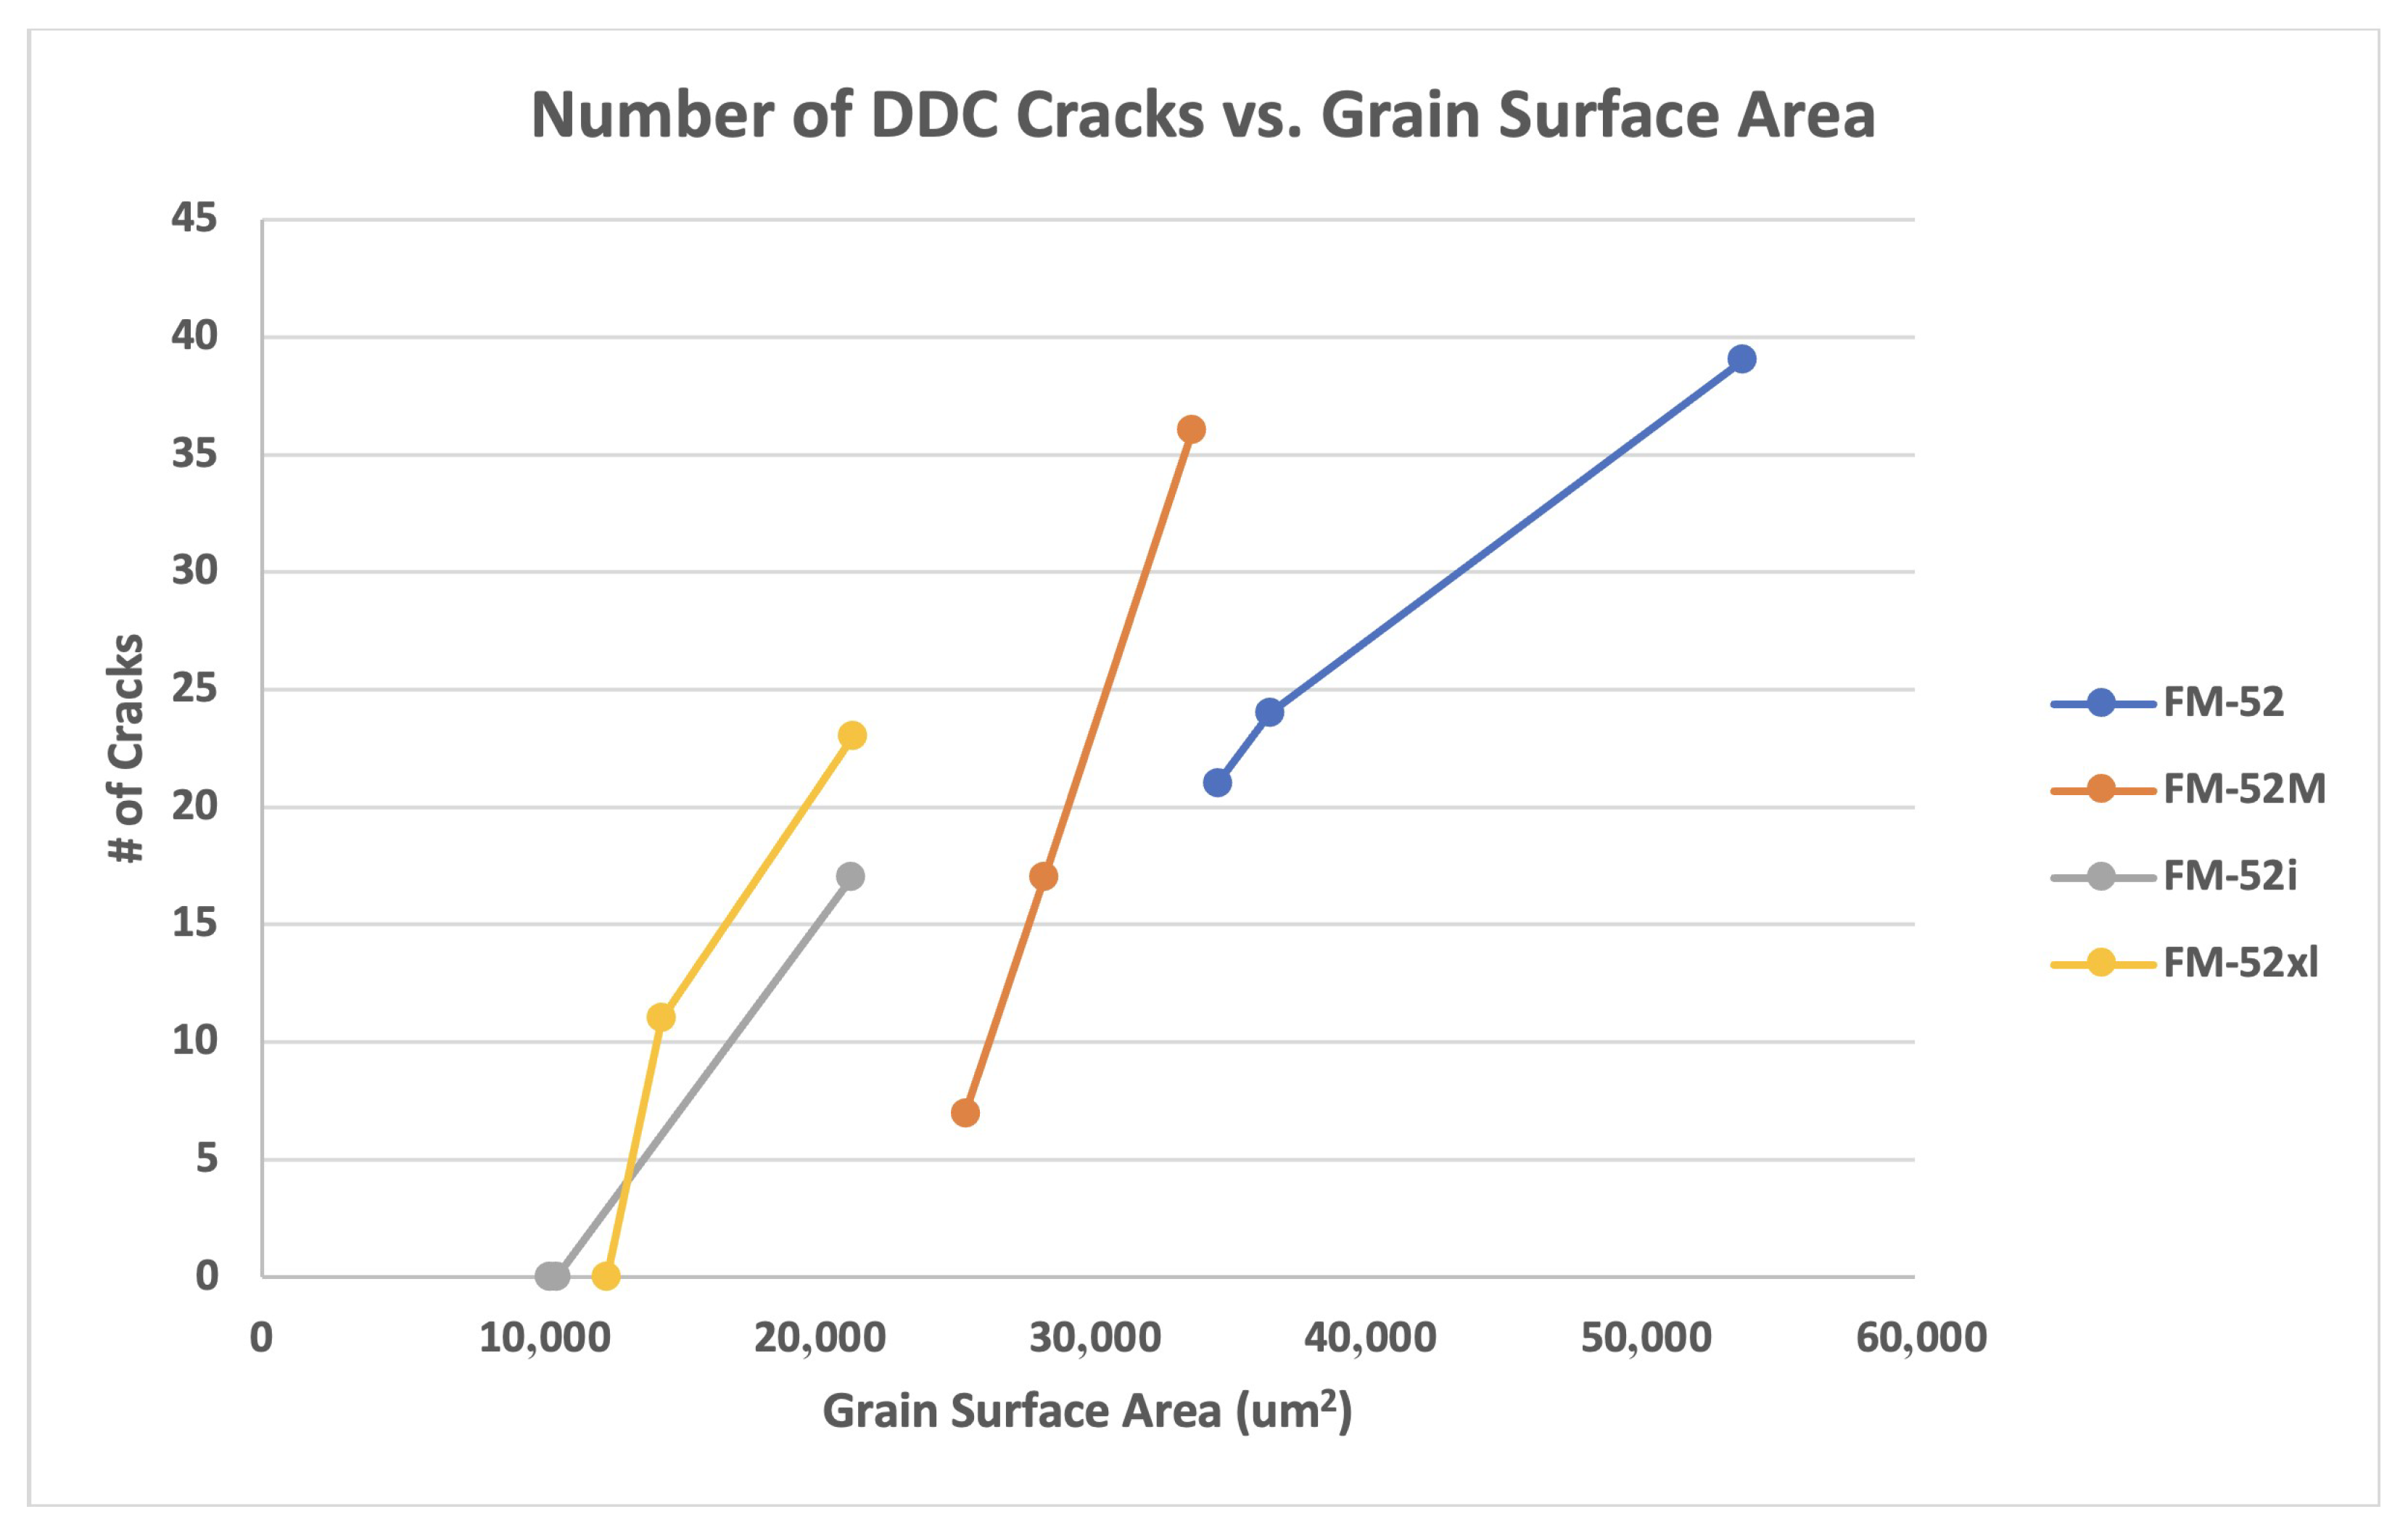
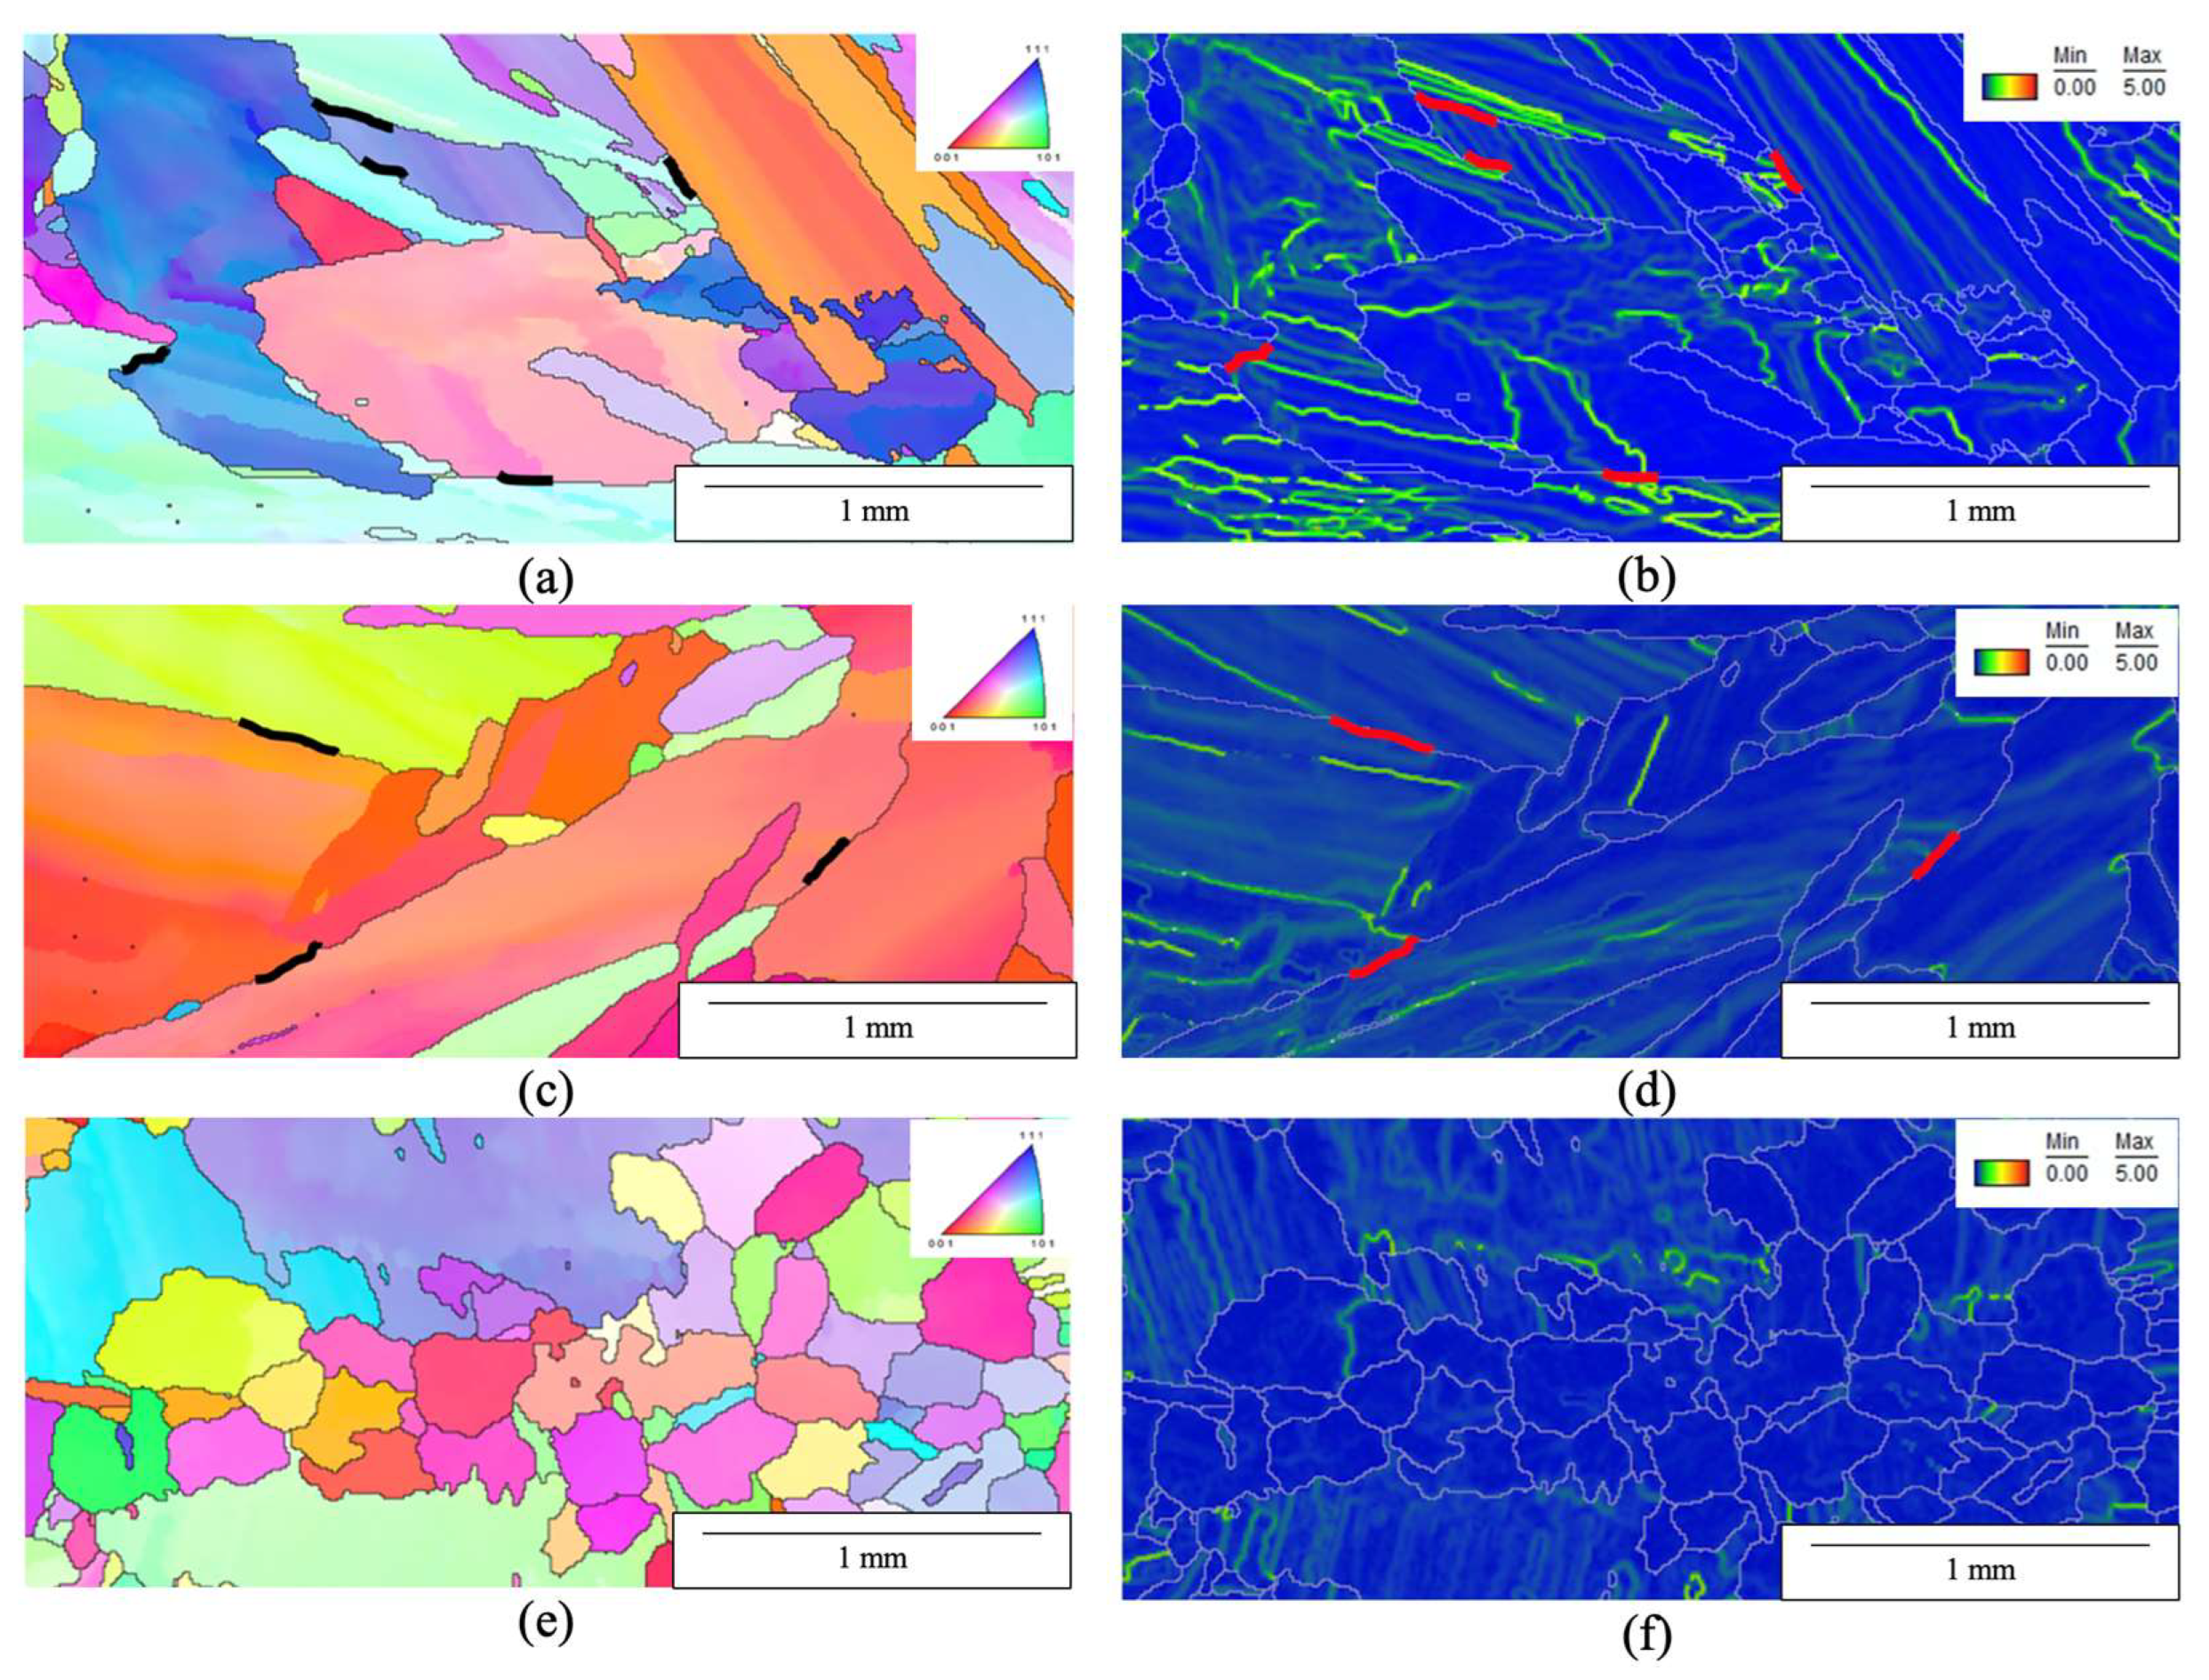
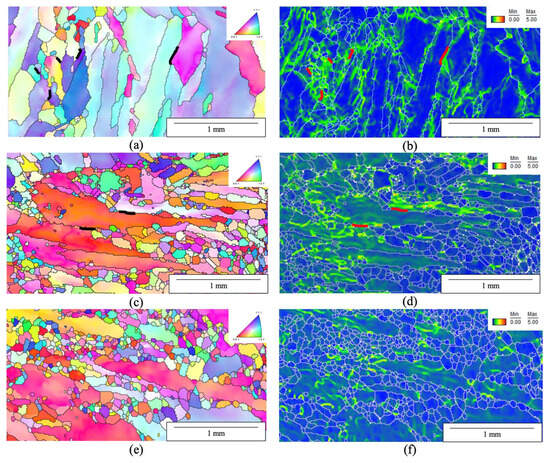
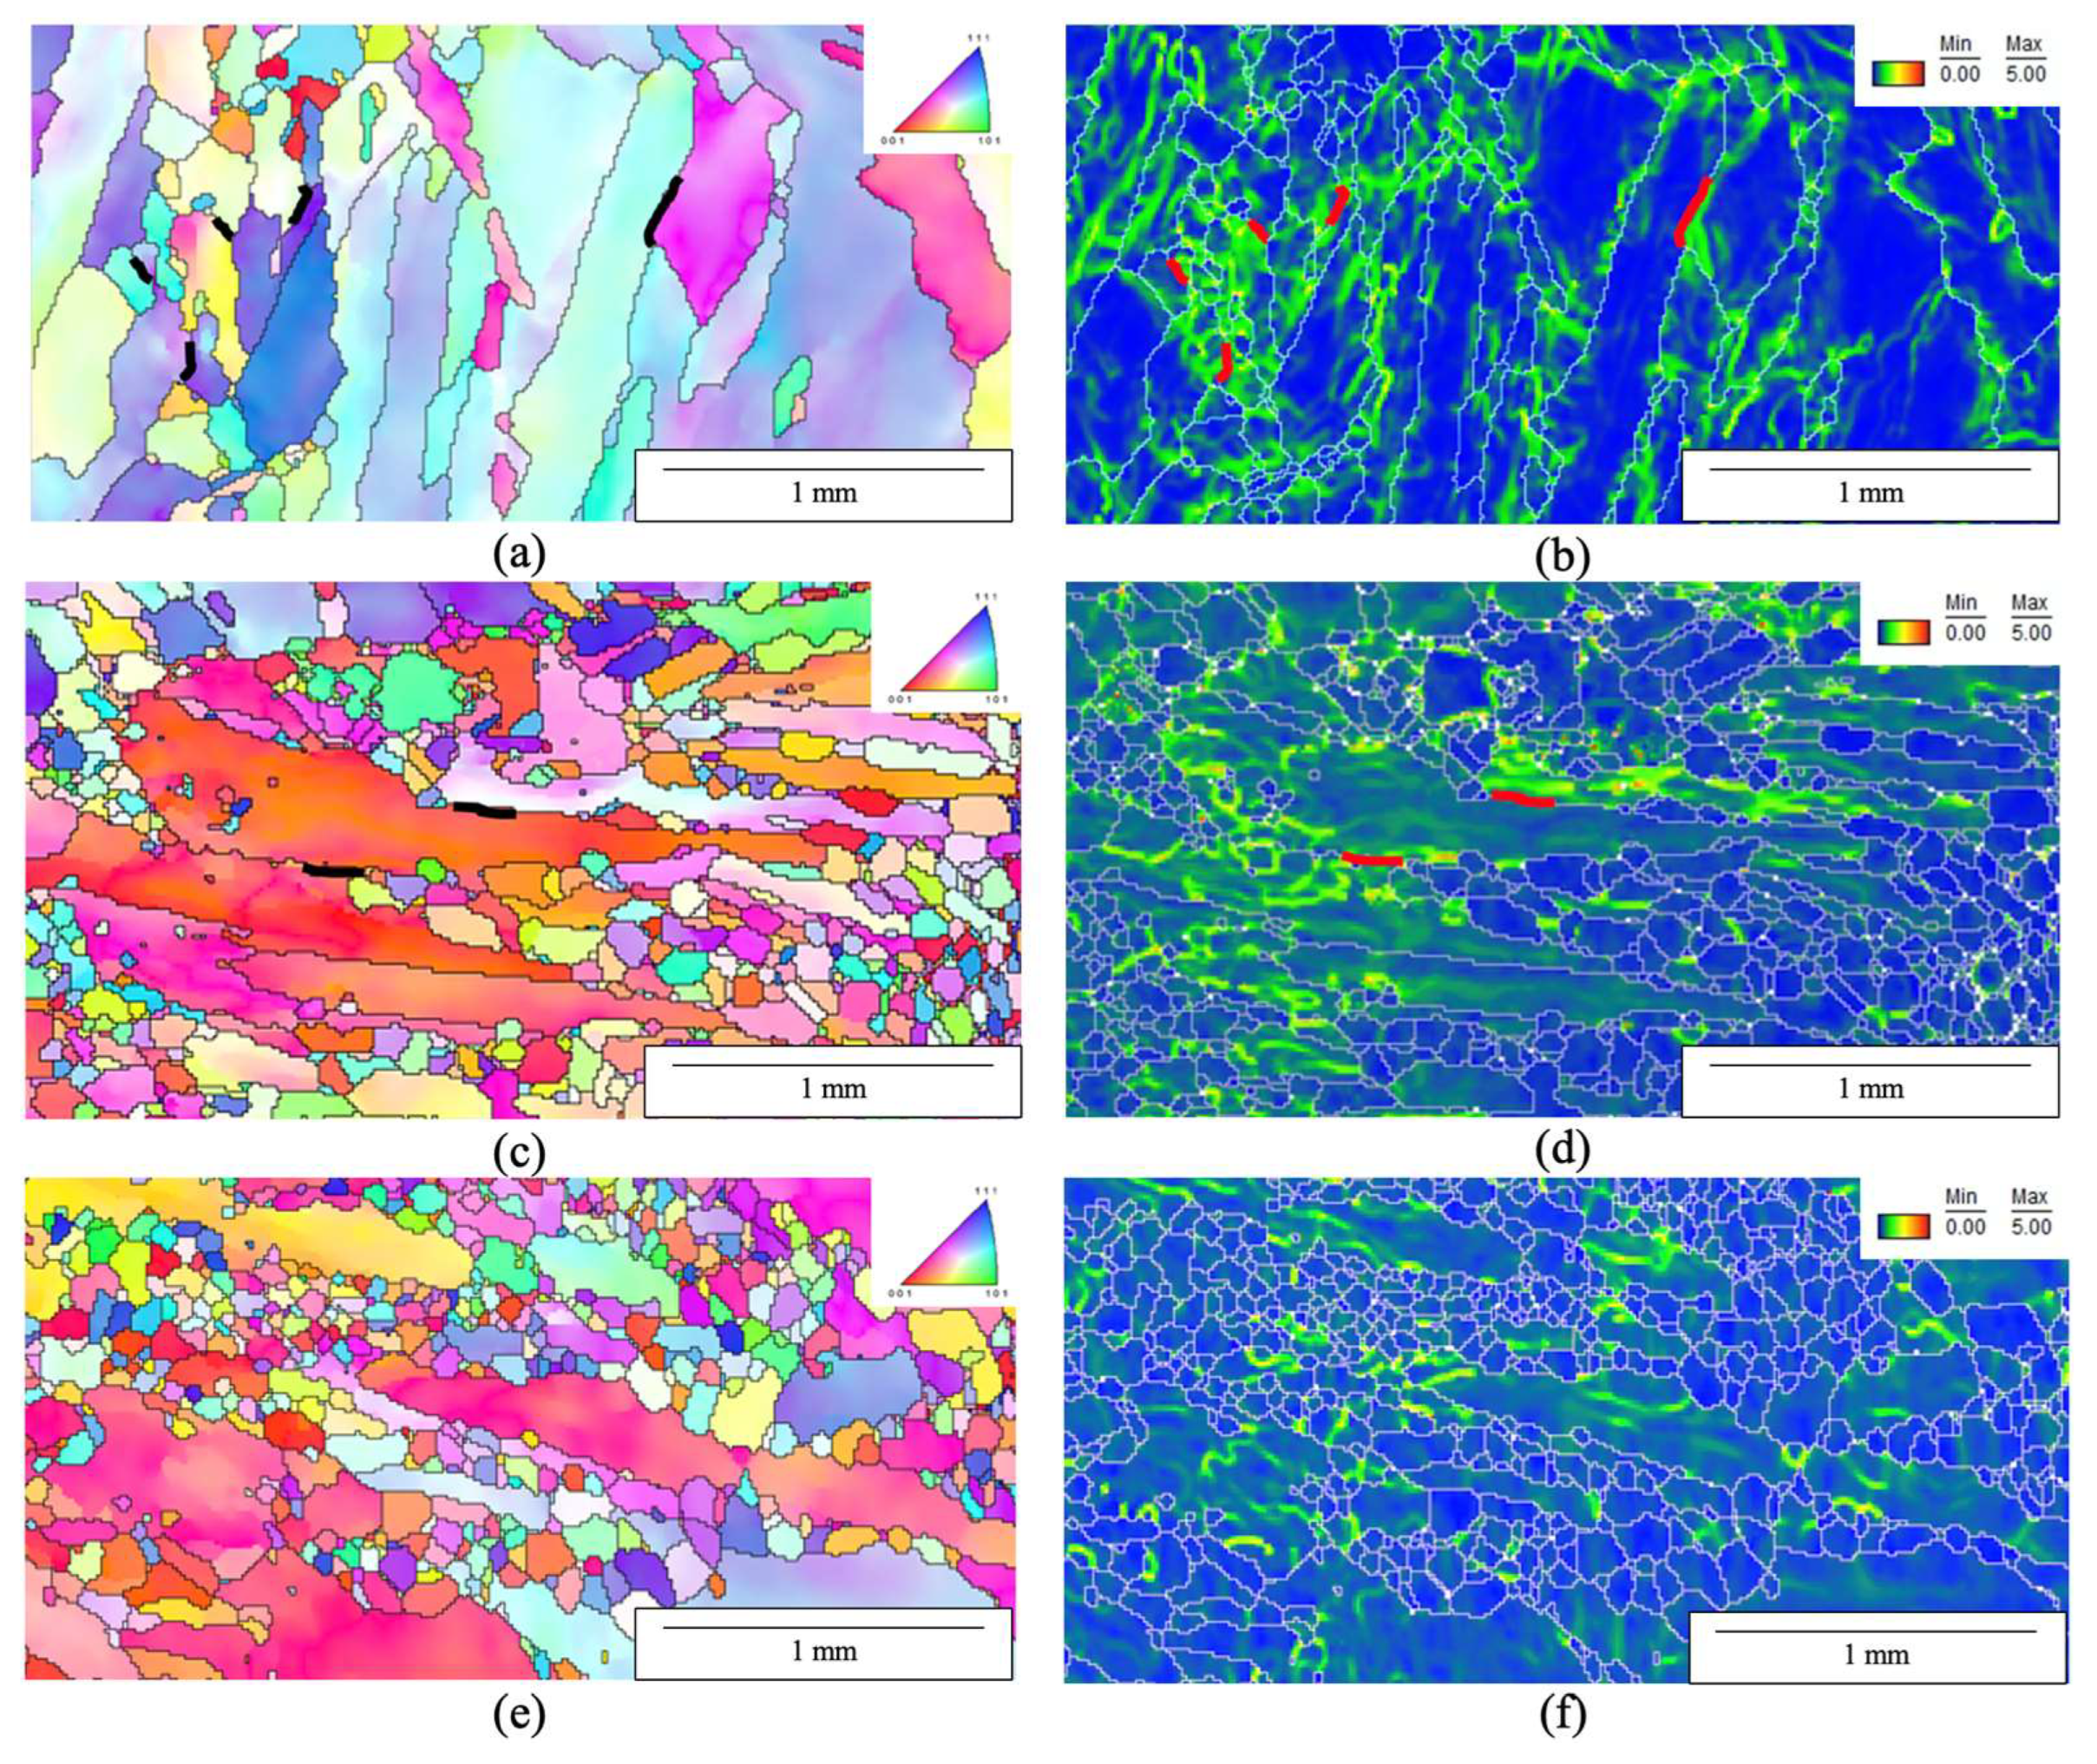
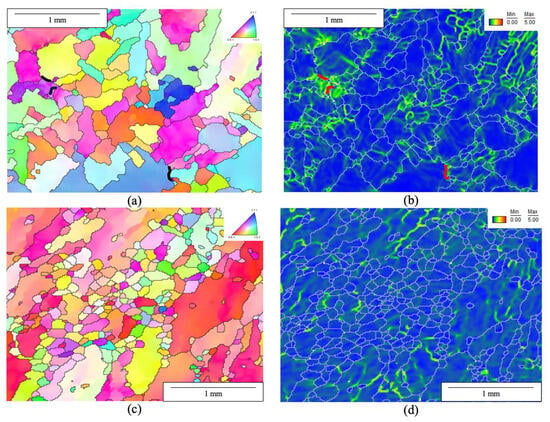
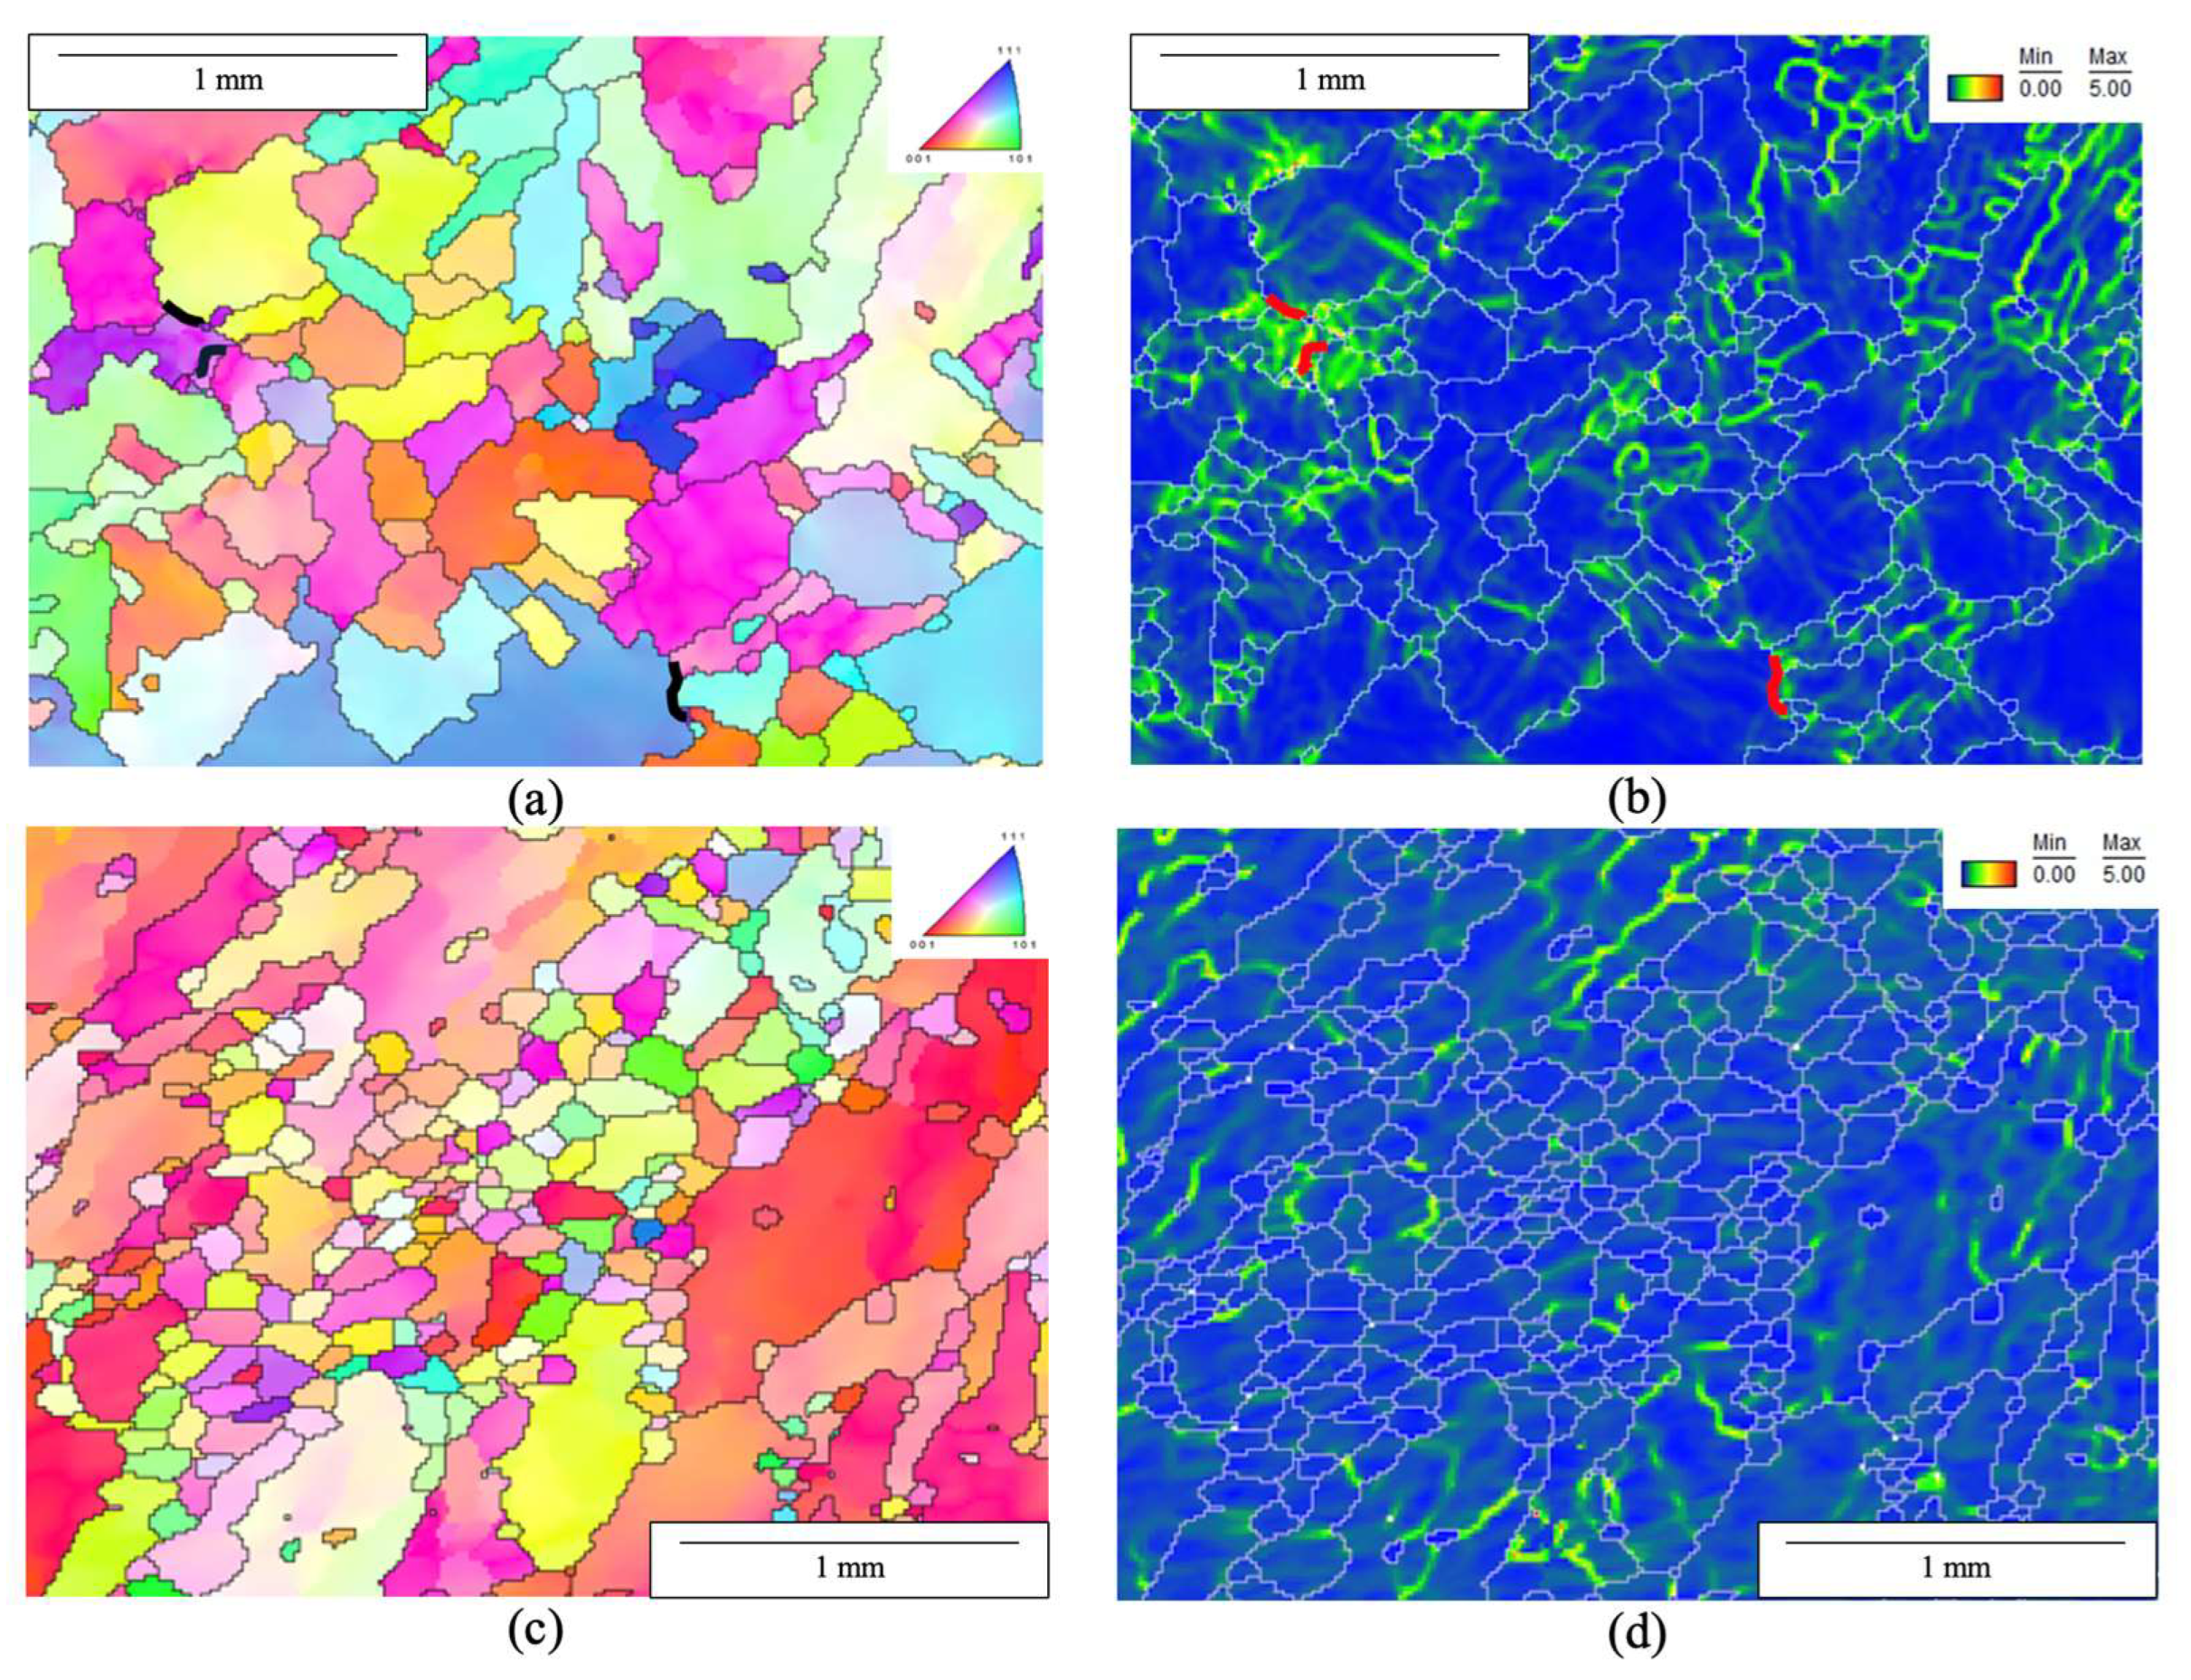
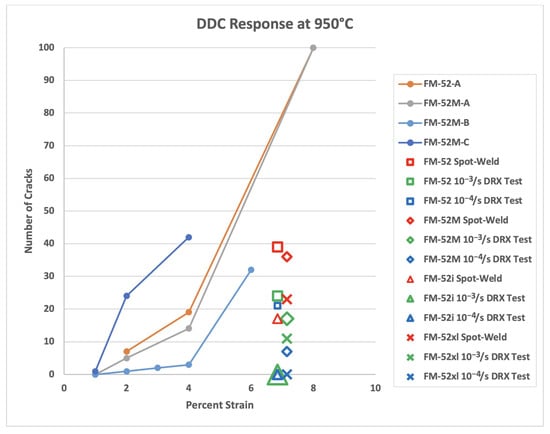
Representative STF test results for each tested weld metal, in terms of the DDC response in unstrained spot-weld specimens and in specimens subjected to 10−3/s and 10−4/s DRX tests, are summarized in Figure 22. The FM-52i weld metal did not exhibit DDC after the 10−3/s and 10−4/s DRX simulations as shown in Figure 22h,i. The FM-52xl weld metal subjected to 10−4/s DRX simulation was also DDC-free, Figure 22l. The relationship between the extent of recrystallization and the number of cracks derived from STF testing is shown in Figure 23. In STF testing, cracks were manually counted in the unetched and etched conditions while observing the spot-welded area of each sample with a light optical microscope at 1000× magnification. Figure 24 displays the relationship between the grain surface area and number of cracks. Figure 25, Figure 26, Figure 27 and Figure 28 depict the IPF and kernel average misorientation (KAM) maps of cracking regions within the spot-weld condition of STF specimen and recrystallization regions of the 10−4/s DRX test STF specimen. KAM is an EBSD technique that averages the misorientation angle between a point and its nearest neighbors, highlighting plastic strain accumulation and distribution. Thick black lines in the IPF maps and thick red lines in the KAM maps of these figures indicate DDC cracks. Figure 29 compares the DDC susceptibility in the tested welds to the published STF test results for welds of different FM-52 and FM-52M heats, in terms of the number of cracks vs. strain at 950 °C [10]. A summary of the grain surface area, extent of recrystallization, and number of cracks for each tested weld metal is presented in Table 3.
Figure 22.
Representative DDC cracks found in STF specimens for each combination of tests and weld metals. Shown are the FM-52 spot-welded (a) 10−3/s DRX test; (b) and 10−4/s DRX test; (c) STF conditions, the FM-52M spot-welded; (d) 10−3/s DRX test; (e) and 10−4/s DRX test; (f) STF conditions, the FM-52i spot-welded; (g) 10−3/s DRX test; (h) and 10−4/s DRX test; (i) STF conditions, and the FM-52xl spot-welded; (j) 10−3/s DRX test; (k) and 10−4/s DRX test; (l) STF conditions.
Figure 23.
Weld metal DDC response as a function of extent of recrystallization after strain-to-fracture (STF) at 7% strain at 950 °C.
Figure 24.
Weld metal DDC response as a function of grain surface area after STF at 7% strain at 950 °C.
Figure 25.
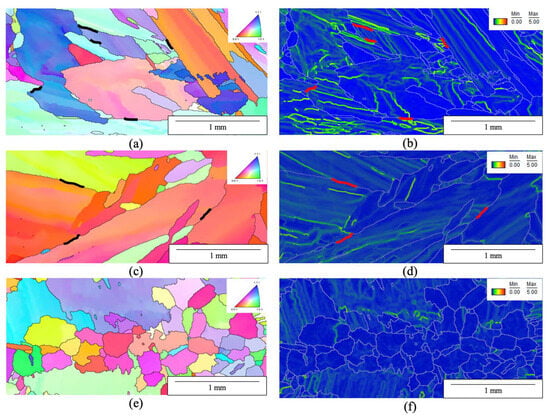
IPF and kernel average misorientation (KAM) maps of FM-52 weld metal STF specimen. Depicted are a cracking region of the spot-welded condition specimen (a,b) and a cracking region (c,d) and recrystallized region (e,f) of the 10−4/s strain rate DRX test specimen. Thick black and red lines indicate cracks.
Figure 26.
IPF and KAM maps of FM-52M weld metal STF specimen. Depicted are a cracking region of the spot-welded condition specimen (a,b) and a cracking region (c,d) and recrystallized region (e,f) of the 10−4/s strain rate DRX test specimen. Thick black and red lines indicate cracks.
Figure 27.
IPF and KAM maps of FM-52i weld metal STF specimen. Depicted are a cracking region of the spot-welded condition specimen (a,b) and a recrystallized region (c,d) of the 10−4/s strain rate DRX test specimen. Thick black and red lines indicate cracks.
Figure 28.
IPF and KAM maps of FM-52 weld metal STF specimen. Depicted are a cracking region of the spot-welded condition specimen (a,b) and recrystallized region (c,d) of the 10−4/s strain rate DRX test specimen. Thick black and red lines indicate cracks.
Figure 29.
DDC susceptibility as a function of percent strain at 950 °C. Filled-in circles represent the published results of various FM-52 and FM-52M filler metal welds (Adapted from Ref. [10]). All other data points are at 7% strain.
Table 3.
Summary of average grain surface area, extent of recrystallization, and cracking response of fresh spot-weld condition and after 10−3/s and 10−4/s strain rates DRX tests.
4. Discussion
This study addresses three interconnected objectives: characterizing and quantifying the DRX response of high-chromium nickel-based weld metals (FM-52, FM-52M, FM-52i, FM-52xl), evaluating the effect of carbide-forming alloying elements on the DRX response, and clarifying the relationship between recrystallization and DDC susceptibility. Using controlled thermo-mechanical simulations in the Gleeble 3800TM, the DRX responses were evaluated as a function of the strain rate. The effect of DRX on DDC susceptibility was evaluated through STF testing. Recrystallization, precipitates, and cracks were characterized using advanced characterization techniques.
4.1. Grain Refinement
The tested weld metals exhibited distinct initial spot-weld grain surface areas and varying grain refinement responses to dynamic recrystallization. The spot-weld in the FM-52 weld metal had the largest average grain surface area followed by the spot-welds in FM-52M, FM-52xl, and FM-52i, as shown in Figure 7 and Table 3. The variation in average grain surface area of the spot-welds was due to differences in the original grain surface area of the tested welds.
Dynamic recrystallization at 1100 °C significantly refined the spot-welds’ microstructure, as shown in Figure 5, Figure 6, Figure 7, Figure 9, Figure 10, and Figure A1, Figure A2, Figure A3, Figure A4, Figure A5 and Figure A6. FM-52i experienced the highest degree in grain surface area reduction of 51%, followed by FM-52xl, FM-52, and FM-52M, as shown in Figure 8. The slower strain rate DRX test at 10−4/s resulted in a larger degree of grain refinement than the DRX test at 10−3/s in all tested welds. Reducing the strain rate of the DRX test by one order of magnitude was more efficient for grain surface area refinement in FM-52xl and FM-52M than in FM-52 and had a minimum effect on the grain surface area of FM-52i, Figure 8. These results show that FM-52i had the strongest grain refinement response to the DRX tests among the tested weld metals.
Although the reduction in grain surface area is indicative of grain refinement, which can be a symptom of recrystallization, it is difficult to quantify the extent of recrystallization based on the grain surface area alone. Alloy 600 and 690 based materials have low-to-moderate SFEs, indicating they would favor DDRX [26,27,28,29]. DDRX has distinct nucleation and growth steps. During active deformation at high temperatures, a nucleated grain that undergoes grain growth is still a recrystallized grain, but its size may overlap with the grain surface area distribution of the original microstructure [26]. This makes it difficult to discern whether a grain was recrystallized or not based on the grain surface area. This overlapping behavior can be seen in Figure 6. As stated previously, there is an increase in the area fraction of grains below some threshold, which varies between the tested weld metals. In Figure 6c,d, there are no clear peaks that emerge from either DRX test in the FM-52i and FM-52xl weld metals. For the FM-52 and FM-52M weld metals, there is a clear peak that emerges only in the 10−4/s DRX test condition, Figure 6a,b. This is indicated by the black arrows in Figure 6a,b. These peaks indicate the potential for grain surface area thresholding to quantify recrystallization. This means that the total area fraction of grains that exist in this peak represent the area fraction of recrystallization. However, these peaks have significant overlap with the grain surface area distribution of the spot-welded condition, which would make grain surface area thresholding inaccurate in quantifying the amount of recrystallization observed after each DRX test [26].
Discerning which grains in that overlapping region are recrystallized proves difficult. It is clear, however, that the grain refinement aspect of dynamic recrystallization is more prominent after the 10−4/s DRX test than the 10−3/s DRX test. To quantify the percent of the analyzed cross sections that have recrystallized, a better method is necessary. This is where GOS analysis proves beneficial.
4.2. Recrystallization Response
All tested specimens strained at 1100 °C experienced a drastic increase in area fraction below the 1° GOS threshold for dynamic recrystallization, as shown in Figure 11. As shown in Figure 12, the slower 10−4/s DRX test increased the area fraction of grains below this threshold more than the 10−3/s DRX test. The peaks within this threshold introduced by the faster DRX test are larger than the initial spot-welded condition, while the peaks for the slower DRX test appear to be the largest, as shown in Figure 11. Figure 12 displays the extent of recrystallization for each weld metal specimen in the spot-weld and after the 10−3/s and 10−4/s DRX tests.
The spot-welded condition exhibited some recrystallization due to the spot-welding procedure, as shown in Figure 12. The presence of recrystallized grains in this condition can be due to the use of weld pool stirring, the current down-slope, or some combination of the two. Spot-welded Gleeble specimens are typically used in STF testing [39]. Previous STF work on Alloy 690 employed weld pool stirring in the spot-welding procedure as well; however, no work was done to characterize the grain surface area or recrystallization prior to testing [39]. Previous research into the effect of weld pool stirring on grain surface area in welds of FM-52M on Alloy 690 found that stirring promoted grain refinement by shifting the solidification mode from columnar to equiaxed [38,40]. This is distinctly different from recrystallization, as the fine grain structure is not a product of high plastic strain accumulation and subsequent strain-free grain nucleation but of shifting thermal gradients and solidification rates. The current down-slope can also be responsible for the presence of recrystallized grains. As shown in Table 2, the current down-slope time is 13 s. During the down-slope time, it is possible for the solidifying material to accumulate plastic strain due to the restraint of the spot-welding setup. The prolonged time at elevated temperature on cooling may have induced minor amounts of static recrystallization. The minor presence of recrystallization in the spot-welded condition was not investigated further.
When quantifying the amount of recrystallization using the GOS approach, the slower DRX test induces the most recrystallization, followed by the faster 10−3/s DRX test, and spot-welded condition, as shown in Figure 12. There is minimal recrystallization introduced by the spot-welding procedure, as shown in Figure 11 and Figure 12. The extent of recrystallization increases dramatically after the 10−3/s DRX test and increases further after the 10−4/s DRX test across all tested weld metals, as shown in Figure 12. The FM-52i weld metal experienced the most recrystallization at 75%. The FM-52M and FM-52xl weld metals were both ~40% recrystallized. The FM-52 weld metal experienced the least recrystallization of 22%. FM-52i not only had the greatest grain refinement induced by the DRX test but also experienced the greatest recrystallization response. The FM-52M weld metal experienced the least grain refinement, as shown in Figure 8, but recrystallized more than both FM-52xl and FM-52, indicating a large discrepancy between the grain surface area and GOS approaches to characterizing recrystallization.
The GOS and grain surface area approaches to analyzing recrystallization display significant differences. The average grain surface area for the FM-52i weld metal is similar for both DRX tests, as shown in Figure 7. This may incorrectly indicate that the 10−4/s DRX test induces similar amounts of recrystallization as the 10−3/s DRX test. However, using the GOS approach, the 10−4/s DRX test induces ~50% more recrystallization than the 10−3/s DRX test, as shown in Figure 12. This discrepancy is significant and has been observed in both similar and different material systems as well, like Inconel 718 and even quartz [33,41]. In the Inconel 718 study, the extent of recrystallization of forged 718 specimens was calculated using the GOS approach, as well as the grain size thresholding approach. The grain size thresholding approach sets the grain size threshold to just above the peak created in the grain surface area distribution after thermo-mechanical processing. A large discrepancy existed between the two approaches, but ultimately the GOS approach was deemed the most accurate [41]. Overall, the grain surface area approach is too simplistic and ignores the process of dislocation density evolution during recrystallization and the dislocation-free nature of recrystallized grains.
It is difficult to make comparisons between the amount of recrystallization across the tested weld metals, due to the differences in average grain surface area between their spot-welded conditions. Smaller average grain surface areas indicate larger grain boundary densities, allowing for more sites for grain nucleation in DDRX [26]. Instead of directly comparing the recrystallization response, the response to changes in the strain rate is compared, as shown in Figure 13. The FM-52 weld metal displays less than half the sensitivity to strain rate than the other tested weld metals. The FM-52M, FM-52i, and FM-52xl weld metals display higher recrystallization rate sensitivities than the FM-52 weld metal. Interestingly, these three weld metals contain strong carbide formers, which may play a role in their recrystallization behavior. The FM-52M and FM-52i weld metals contain niobium, and the FM-52xl weld metal contains tantalum [6,7,8]. This discrepancy in recrystallization sensitivity prompted additional analysis.
4.3. Precipitate Stimulated Recrystallization
The FM-52 weld metal that underwent the 10−4/s DRX test displays a near precipitate-free microstructure, as shown in Figure 14 and Figure 15. No intragranular precipitates were present in the analyzed specimen. In Figure 14, dislocation motion appears to be unhindered, with no dislocation clustering. Few titanium nitrides were present along HAGBs, as shown in Figure 15. Interestingly, dislocation networks aggregate around this nitride, indicating the impingement of dislocation motion [42]. While there is minimal precipitate presence observed in the FM-52 specimen, the precipitates that are present seem to be impinging on the dislocation motion.
The FM-52M and FM-52i specimens contain titanium and niobium—strong nitride and carbide formers, respectively—which produce precipitates that significantly impinge dislocation motion, as shown in Table 1 [7,23]. Titanium and niobium-rich nitrides are present in the FM-52M specimen, as shown in Figure 16 and Figure 17. The precipitates were both intragranular and intergranular. The dislocation clustering observed around titanium nitrides in the FM-52 specimen is also seen in the FM-52M specimen, as shown in Figure 16 and Figure 17. The extent of this clustering is larger in FM-52M due to the prominence of intragranular precipitates. The FM-52i specimen contains 0.10 wt% more titanium and 1.47 wt% more niobium than the FM-52M specimen. Therefore, the FM-52i specimen is expected to display a significant increase in precipitates. This is exactly what is observed in Figure 18 and Figure 19, where titanium and niobium-rich carbonitrides are profuse, spanning nanometers to microns in scale. Due to the higher presence of intragranular precipitates, the dislocation interaction is also higher. FM-52i precipitates are associated with extensive dislocation networks. The dislocation impingement is markedly more pronounced in both FM-52M and FM-52i than FM-52.
The FM-52xl specimen exhibits similar precipitate–dislocation interactions to FM-52i. The FM-52xl weld metal contains 0.005 wt% niobium and 0.002 wt% titanium, as shown in Table 1, which is insignificant compared to FM-52i. However, the FM-52xl specimen contains ~4 wt% tantalum, a strong carbide former [8]. Tantalum carbides were observed intergranularly and intragranularly, as shown in Figure 20 and Figure 21. Interestingly, chromium-rich carbides were only found in the FM-52xl specimen and not in the other characterized specimens. This may be due to the higher carbon content in FM-52xl than FM-52 and FM-52M, as shown in Table 1. While FM-52i contains more carbon than FM-52xl, its niobium and titanium additions capture carbon due to their high affinity [7]. In FM-52xl, tantalum is the sole strong carbide former present, reducing competition for carbon, allowing for the formation of chromium carbides. FM-52xl displays similar precipitate prominence when compared to FM-52i, Figure 18, Figure 19, Figure 20 and Figure 21. The dislocation clustering observed around tantalum carbides and chromium-rich carbides in FM-52xl mirrors the precipitate–dislocation interaction previously identified in FM-52i.
The observed phenomenon of dislocation clustering around precipitates is not unprecedented. This phenomenon is responsible for precipitation strengthening in other nickel-based alloys like Inconel 718 [43]. In 718, γ″ precipitates act as significant barriers to dislocation motion. By impeding this motion, more energy is required for plastic deformation. The dislocation clustering observed in the tested weld metals aligns with the precipitate–dislocation interaction observed in the literature [43].
While the dislocation impingement observed in 718 is primarily a strengthening mechanism, it serves a different function in the tested weld metals. The tested weld metals are expected to undergo DDRX, which requires reaching a critical dislocation density to initiate grain boundary bulging and subsequent grain nucleation [26,30,31]. If precipitates are hindering dislocation motion, they would therefore also be hindering any recovery that may occur at elevated temperatures, allowing for the critical dislocation density to be reached more readily than otherwise [42,44,45]. A similar phenomenon is seen in austenitic steels and similar nickel-based alloys as well [46,47,48,49]. Some of these studies tested the recrystallization response of alloys with and without strong carbide formers. Dislocation clustering was observed around intragranular precipitates, and recrystallization responses were subsequently higher for the tested precipitate-containing specimens [46,47,48,49]. This increase in recrystallization response is evident in the FM-52M, FM-52i, and FM-52xl specimens but is absent in FM-52, as the latter lacks the intragranular precipitates found in the other weld metals. This potentially explains the higher recrystallization rate sensitivity observed in the FM-52M, FM-52i, and FM-52xl weld metals, as shown in Figure 13.
4.4. Effect of Dynamic Recrystallization on Ductility Dip Cracking Susceptibility
All tested weld metals in the spot-welded condition experienced cracking. All 10−3/s DRX test specimens cracked during STF testing, except for FM-52i. At the slower strain rate of 10−4/s, FM-52i and FM-52xl remained crack-free after STF testing, whereas cracking was still observed in the FM-52 and FM-52M specimens. Induced recrystallization was able to eliminate cracking in the FM-52i and FM-52xl test specimens. Of the tested weld metals, FM-52i experienced the least cracking, followed by FM-52xl, FM-52M, and FM-52.
4.4.1. Effect of Recrystallization
Across all tested weld metals, a near-linear inverse correlation was observed between the number of DDC cracks and the extent of recrystallization, as shown in Figure 23 and Figure 24 and Table 3. As the extent of recrystallization increases, the number of cracks decrease. Of the tested weld metals, FM-52 performed the worst. Previous studies have observed that FM-52 is always outperformed by niobium-containing variants like FM-52M and FM-52MSS [5]. The FM-52M weld metal has additions of niobium to form niobium carbides, which pin grain boundaries, hindering grain boundary migration and, therefore, subsequent grain boundary sliding [6]. This results in higher DDC resistance, as detailed in Figure 23. Interestingly, the higher DDC resistance of FM-52M remains consistent across the entire range of extent of recrystallization, where FM-52 and FM-52M’s curves overlap. This overlap is between 5% and 18% recrystallization, as shown in Table 3. For both weld metals, there is a significant reduction in DDC susceptibility with the increasing extent of recrystallization. FM-52i contains higher niobium additions than FM-52M, leading to more prominent niobium carbide formation, as shown in Table 1 and Figure 18 and Figure 19. Therefore, FM-52i exhibited a further reduction in cracking frequency compared to FM-52M. For the range of extent of recrystallization where their curves overlap (13% to 24%), FM-52i specimens experienced a drastic reduction in the number of cracks compared to FM-52M. FM-52xl utilizes tantalum to form tantalum carbides, which mitigate DDC similarly to niobium carbides in FM-52M and FM-52i [8]. Between 13% and 24% recrystallization, the tested FM-52i composition exhibits higher DDC resistance than the tested FM-52xl composition, as shown in Figure 23 and Table 3. Past 24%, FM-52xl exhibits higher DDC resistance. This can be misleading, however. Although both FM-52xl and FM-52i reach a recrystallization threshold that eliminates cracking, the high recrystallization propensity of FM-52i results in large gaps between data points, Figure 23. The point where FM-52i experiences no cracking may be prior to the 49% recrystallization point shown in Figure 23 and detailed in Table 3. Further STF testing between 13% and 49% would allow for the determination of the exact point where this occurs. In Figure 23, the slopes between FM-52, FM-52M, and FM-52xl are very similar. If FM-52i was to follow a similar slope, it is expected to outperform FM-52xl across the range of extent of recrystallization where their curves overlap.
The plastic strain distribution of recrystallized STF specimens is more uniform than in spot-welded STF specimens. KAM maps were employed to contrast the plastic strain distributions of the spot-welded specimens against the recrystallized specimens from the 10−4/s DRX test. In the spot-welded condition, plastic strain preferentially accumulates along straightened migrated grain boundaries, an indicator of grain boundary sliding. These high plastic strain grain boundaries are where DDC cracks are observed, as indicated by the red lines in Figure 25b, Figure 26b, Figure 27b and Figure 28b. This was observed in all the tested weld metals. In contrast, the recrystallized specimens exhibit a significantly more uniform plastic strain distribution, as shown in Figure 25f and Figure 26f, Figure 27d, and Figure 28d. For FM-52 and FM-52M, the 10−4/s DRX specimens displayed markedly less cracking than their spot-welded counterparts, with plastic strain distributed evenly even within the cracking and highly recrystallized regions of the recrystallized specimens, as shown in Figure 25d,f and Figure 26d,f. The FM-52i and FM-52xl 10−4/s DRX specimens displayed no cracking, indicating that the uniform plastic strain distribution is favorable for mitigating DDC formation, as shown in Figure 27d and Figure 28d. This transition to a more homogeneous strain distribution is attributed to the recovery of ductility and the increased grain boundary surface area inherent to DRX [26]. By introducing grain refinement and strain-free ductile grains, the microstructure allows the plastic strain to distribute evenly throughout the microstructure, shifting accumulation away from DDC-susceptible straight migrated grain boundaries, enhancing DDC resistance.
4.4.2. Effect of Grain Surface Area
Considering the effect of the grain surface area on DDC susceptibility, there is a near linear relationship between the number of cracks observed and the grain surface area, as shown in Figure 24. As grain surface area increases, so does the number of cracks in all the tested weld metals. The same DDC susceptibility ranking observed in Figure 23 is also observed in Figure 24. Grain refinement associated with DRX increases DDC resistance, due to the reduction in DDC-susceptible long straightened migrated grain boundaries [13,16,17]. The resulting shorter grain boundaries are less likely to straighten and will maintain tortuosity due to the frequency of triple points [16]. Tortuosity hinders the grain boundary sliding necessary for DDC void nucleation and subsequent cracking. In addition to increased grain boundary tortuosity, there is an increase in the grain boundary surface area, associated with grain refinement. DRX not only causes grain refinement but also forms ductile strain-free grains. The increase in grain boundary density and introduction of strain free grains increases the microstructure’s ability to accommodate plastic strain, shifting it away from DDC-susceptible grain boundaries [13,16,17,26].
4.4.3. Recrystallized Specimen Ductility Dip Cracking Susceptibility Compared to the Literature
A significant decrease in DDC susceptibility is observed in DRX-conditioned specimens when compared to the published STF results of FM-52 and FM-52M welds, as shown in Figure 29. Despite being subjected to 7% strain, the FM-52i and FM-52xl 10−4/s DRX specimens demonstrated no cracking, allowing them to outperform the published STF results of FM-52 and FM-52M filler metal welds tested at lower strains [10]. FM-52 and FM-52M specimens in the same condition experienced less cracking at 7% strain than the published results of FM-52 and FM-52M filler metal welds at 6% strain. The DRX test specimens display large reductions in the number of observed DDC cracks, allowing them to outperform the STF results of other heats of FM-52 and FM-52M at higher strain values.
5. Conclusions
This research examines the influence of intragranular carbides on DRX behavior and establishes an experimental relationship between DDC susceptibility and the extent of recrystallization in high-chromium nickel-based weld metals. The obtained results represent a novel contribution to the field, as they have not been previously addressed in the literature for this alloy system. The following conclusions can be drawn from this work:
- It was experimentally determined that increasing the extent of recrystallization and decreasing the average grain surface area drastically decrease the DDC response to STF testing of FM-52, FM-52M, FM-52i, and FM-52xl weld metals.
- Larger extents of DRX and smaller average grain surface areas facilitate more uniform plastic strain distributions in specimens of the tested weld metals, which result in lower DDC responses during STF testing. This is a novel behavioral observation for STF testing of high-chromium nickel-based alloys.
- Weld metal specimens with compositions containing strong carbide formers experienced larger recrystallization responses than those without, due to the presence of intragranular precipitates hindering dislocation motion. The weld metals containing strong carbide formers are the FM-52i, FM-52M, and FM-52xl weld metals, which exhibit 75%, 40%, and 39% recrystallization, respectively. The FM-52 weld metal that does not contain strong carbide formers only displayed 22% recrystallization.
- Of the tested weld metals, FM-52i was observed to be the most resistant to DDC, followed by FM-52xl, FM-52M, and FM-52. The FM-52i weld metal also exhibited the most significant grain refinement response to high-temperature deformation, followed by FM-52xl, FM-52, and FM-52M, with average grain surface area reductions of 51.22%, 41.66%, 35.48%, and 24.40%, respectively.
- The GOS approach was found to be a more robust and accurate metric for quantifying DRX than the grain surface area thresholding in the tested specimens. This is consistent with what is observed in the previous literature on Inconel 718.
Author Contributions
A.S.: Conceptualization, Methodology, Formal Analysis, Investigation, Writing—Original Draft, Writing—Review and Editing, Visualization; A.B.: Formal Analysis, Writing—Original Draft, Writing—Review and Editing, Visualization; M.J.M.: Conceptualization, Validation, Resources, Writing—Review and Editing, Supervision, Project Administration, Funding Acquisition; B.T.A.: Conceptualization, Validation, Resources, Writing—Review and Editing, Supervision, Project Administration, Funding Acquisition. All authors have read and agreed to the published version of the manuscript.
Funding
This research was funded by the United State Nuclear Regulatory Commission (31310023M0001), Framatome (GR137233), and the Naval Nuclear Laboratory (GR137233).
Data Availability Statement
The original contributions presented in this study are included in the article. Further inquiries can be directed to the corresponding author.
Acknowledgments
The research presented in this article was sponsored by the US Nuclear Regulatory Commission and by the NSF Manufacturing & Materials Joining Innovation Center (Ma2JIC). Within Ma2JIC, this research was supported by the Naval Nuclear Laboratory (NNL), Framatome, and the Electric Power Research Institute (EPRI). The metallurgical characterization was performed at the OSU Center for Electron Microscopy and Analysis (CEMAS).
Conflicts of Interest
The authors declare no conflicts of interest. The funders had no role in the design of the study; in the collection, analyses, or interpretation of data; in the writing of the manuscript; or in the decision to publish the results.
Appendix A
Figure A1.
IPF maps of FM-52 fresh spot-weld (a), after 10−3/s strain rate DRX test (b), and after 10−4/s strain rate DRX test (c).
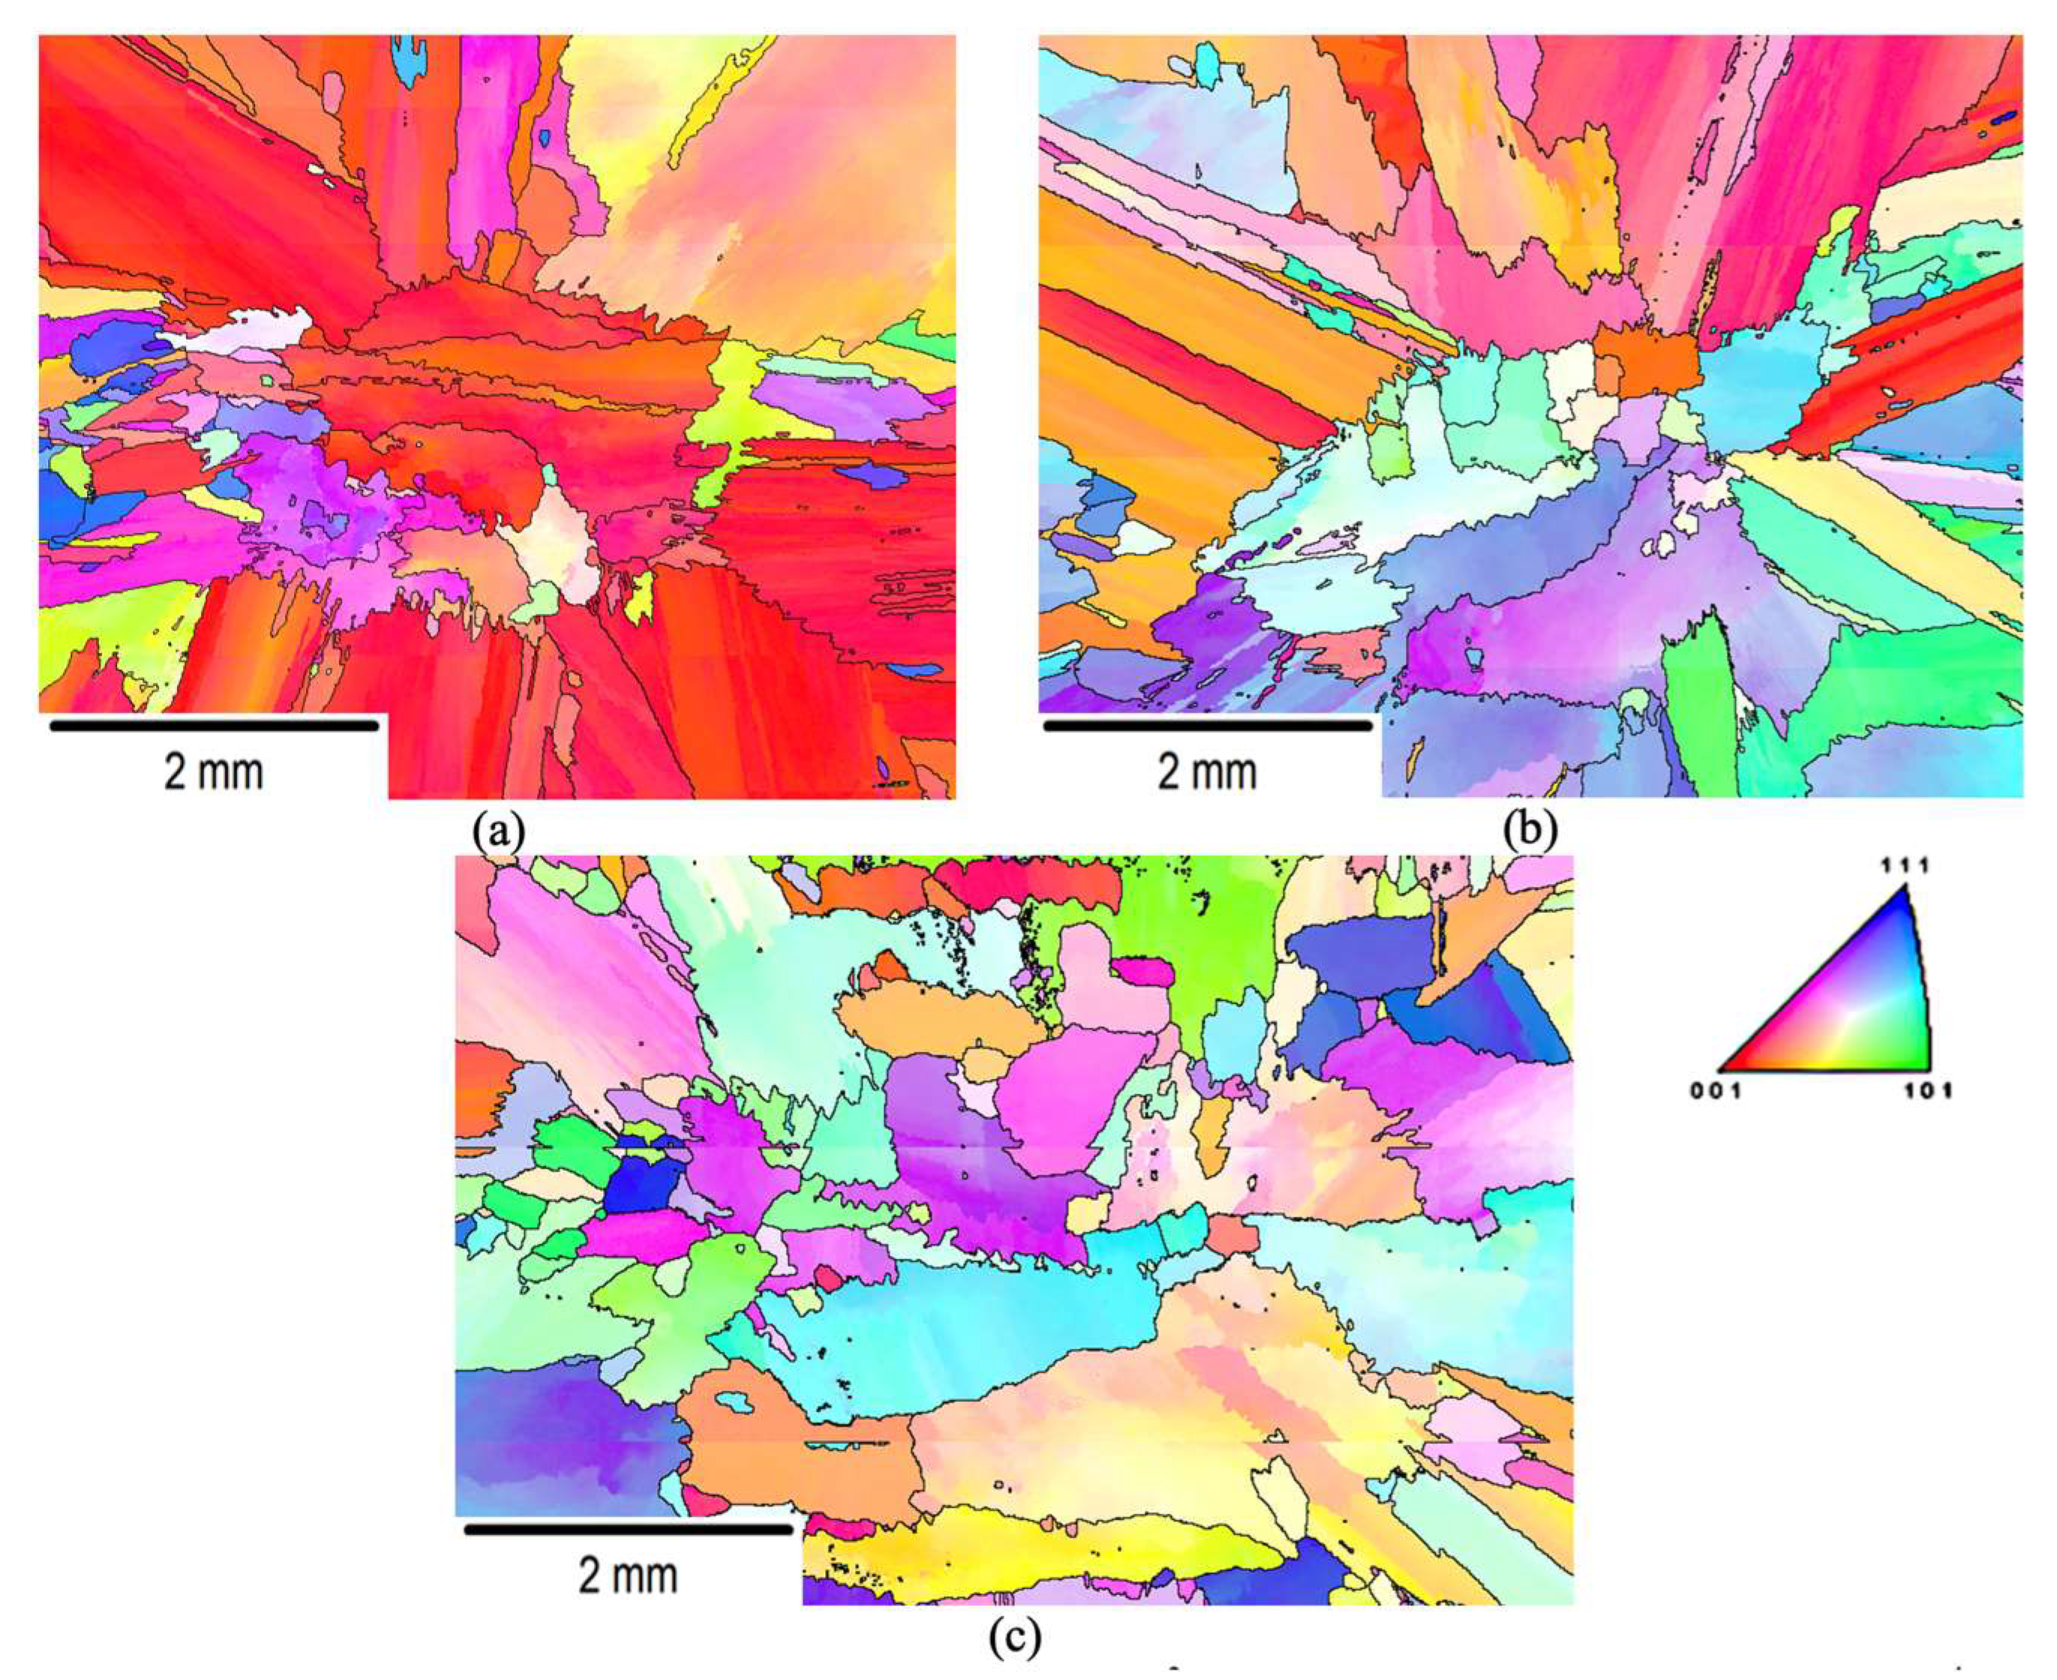
Figure A2.
IPF maps of FM-52i fresh spot-weld (a), after 10−3/s strain rate DRX test (b), and after 10−4/s strain rate DRX test (c).
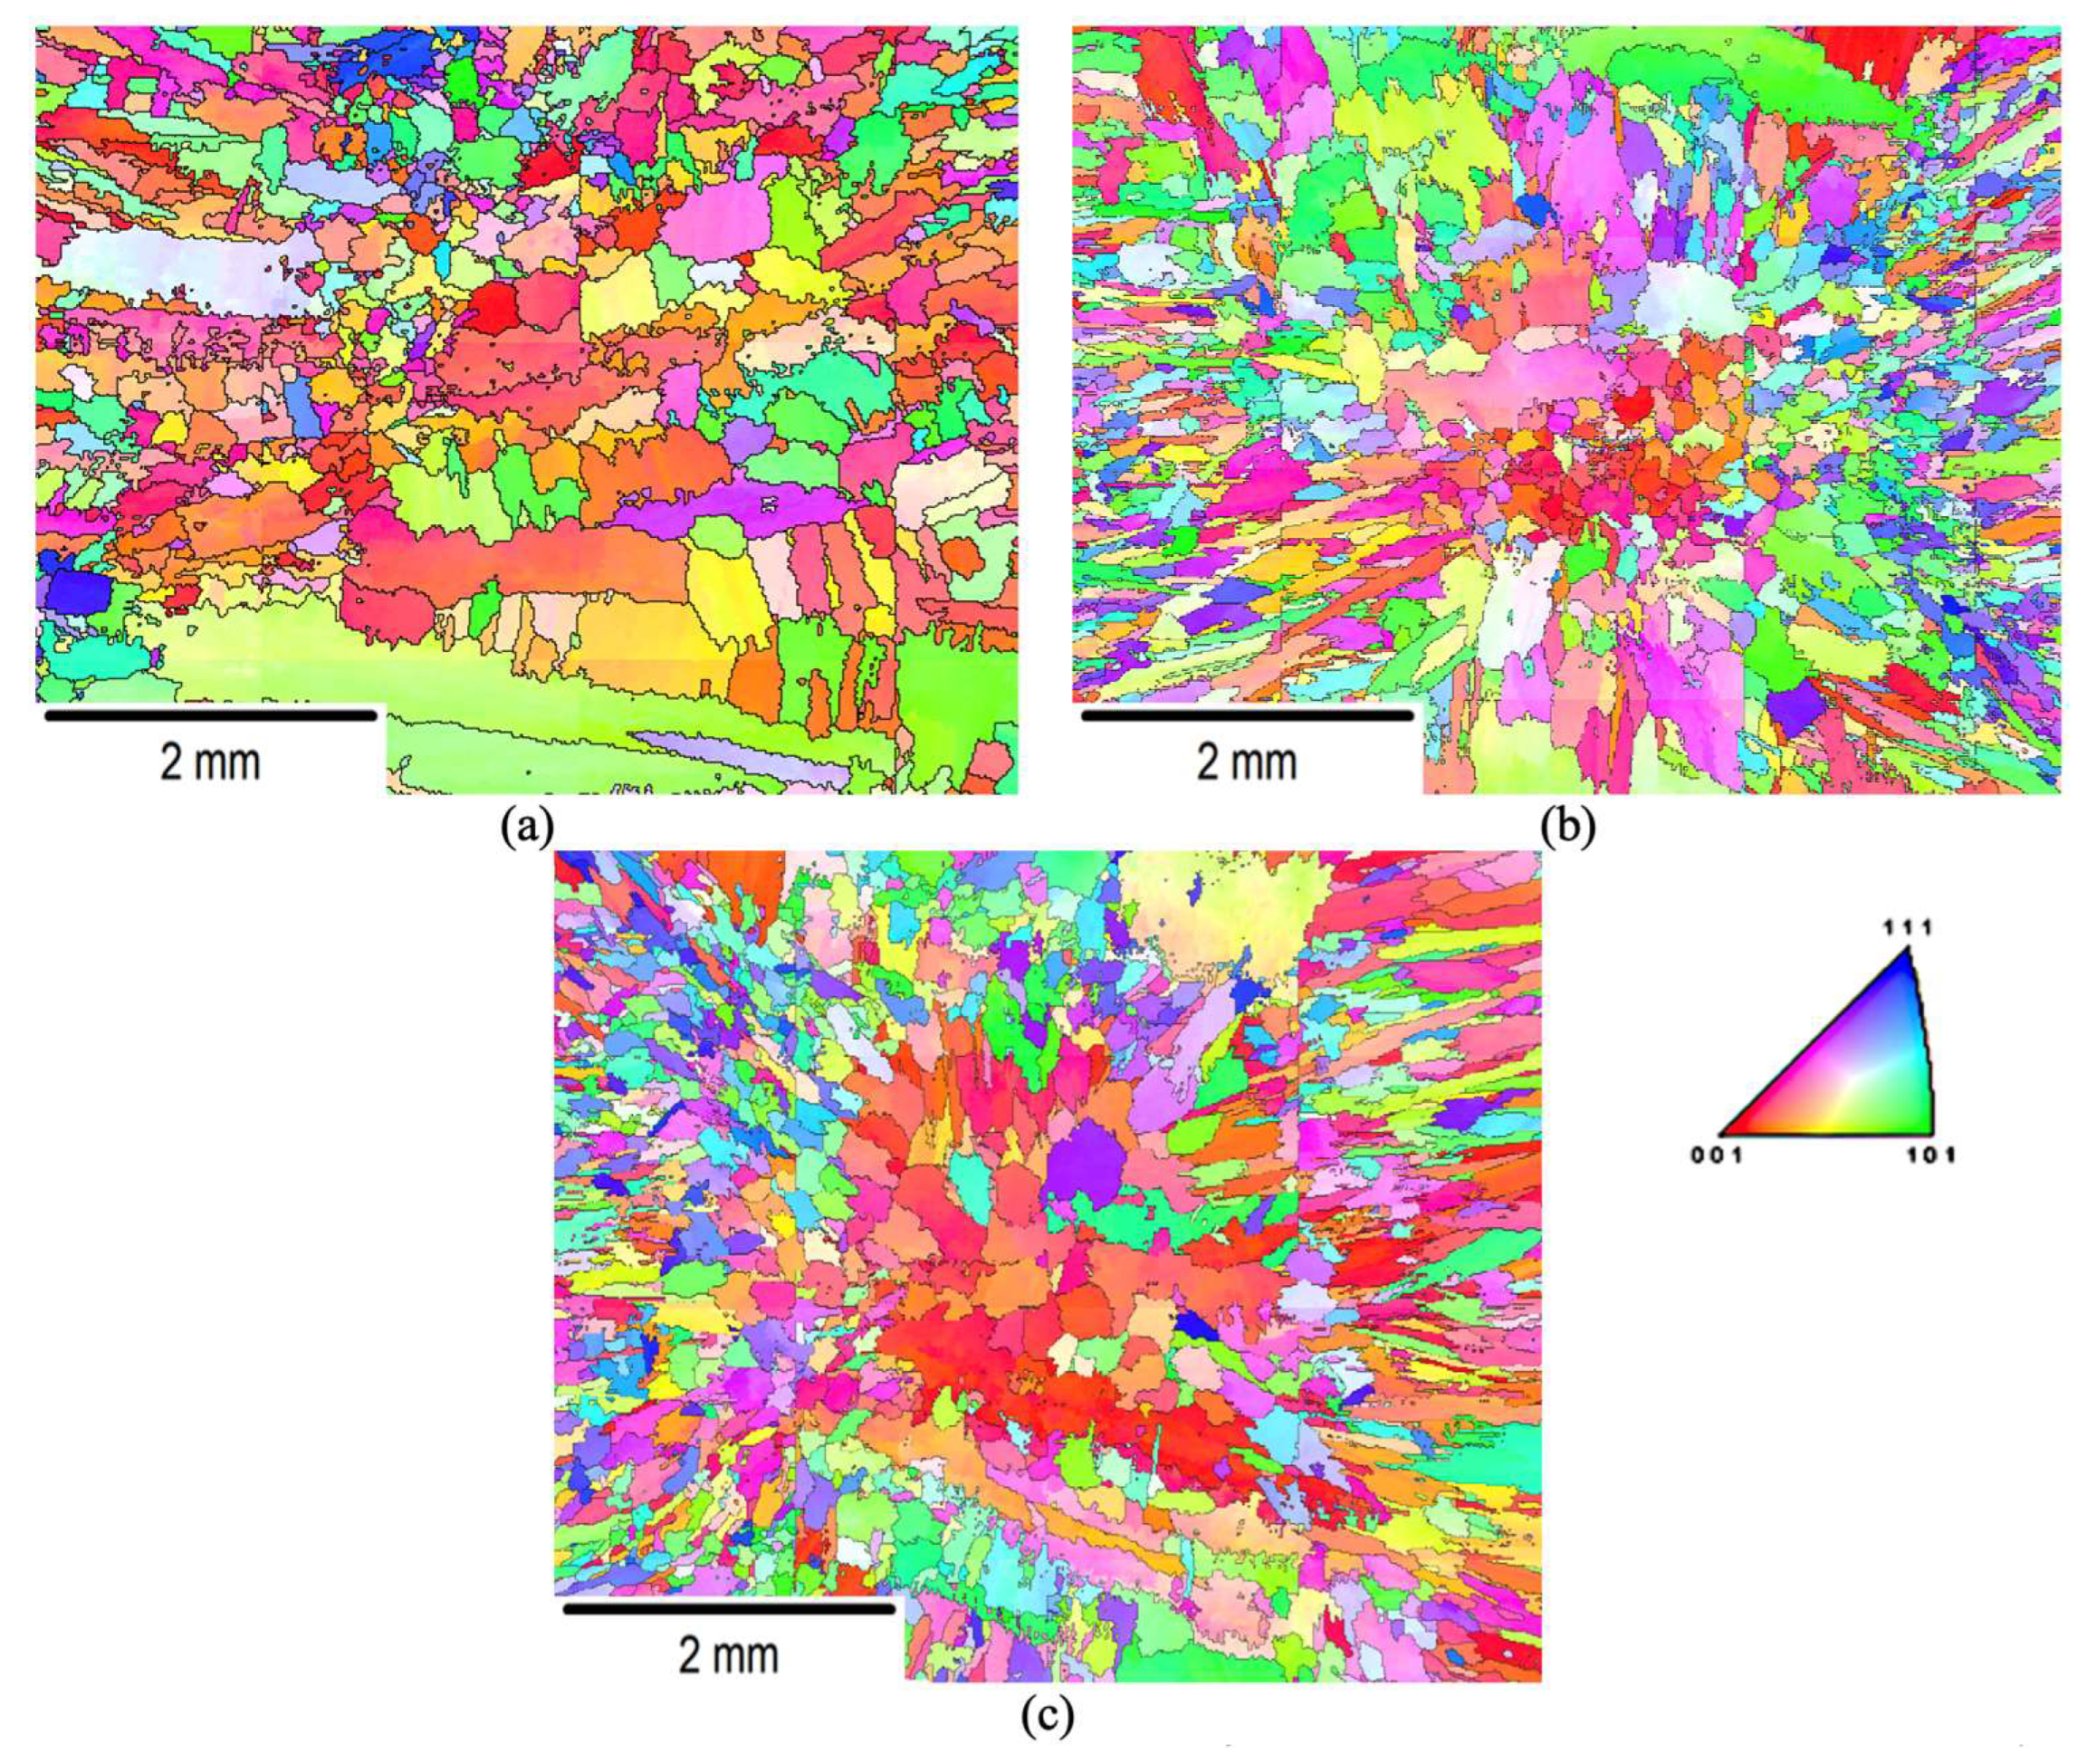
Figure A3.
IPF maps of FM-52xl fresh spot-weld (a), after 10−3/s strain rate DRX test (b), and after 10−4/s strain rate DRX test (c).
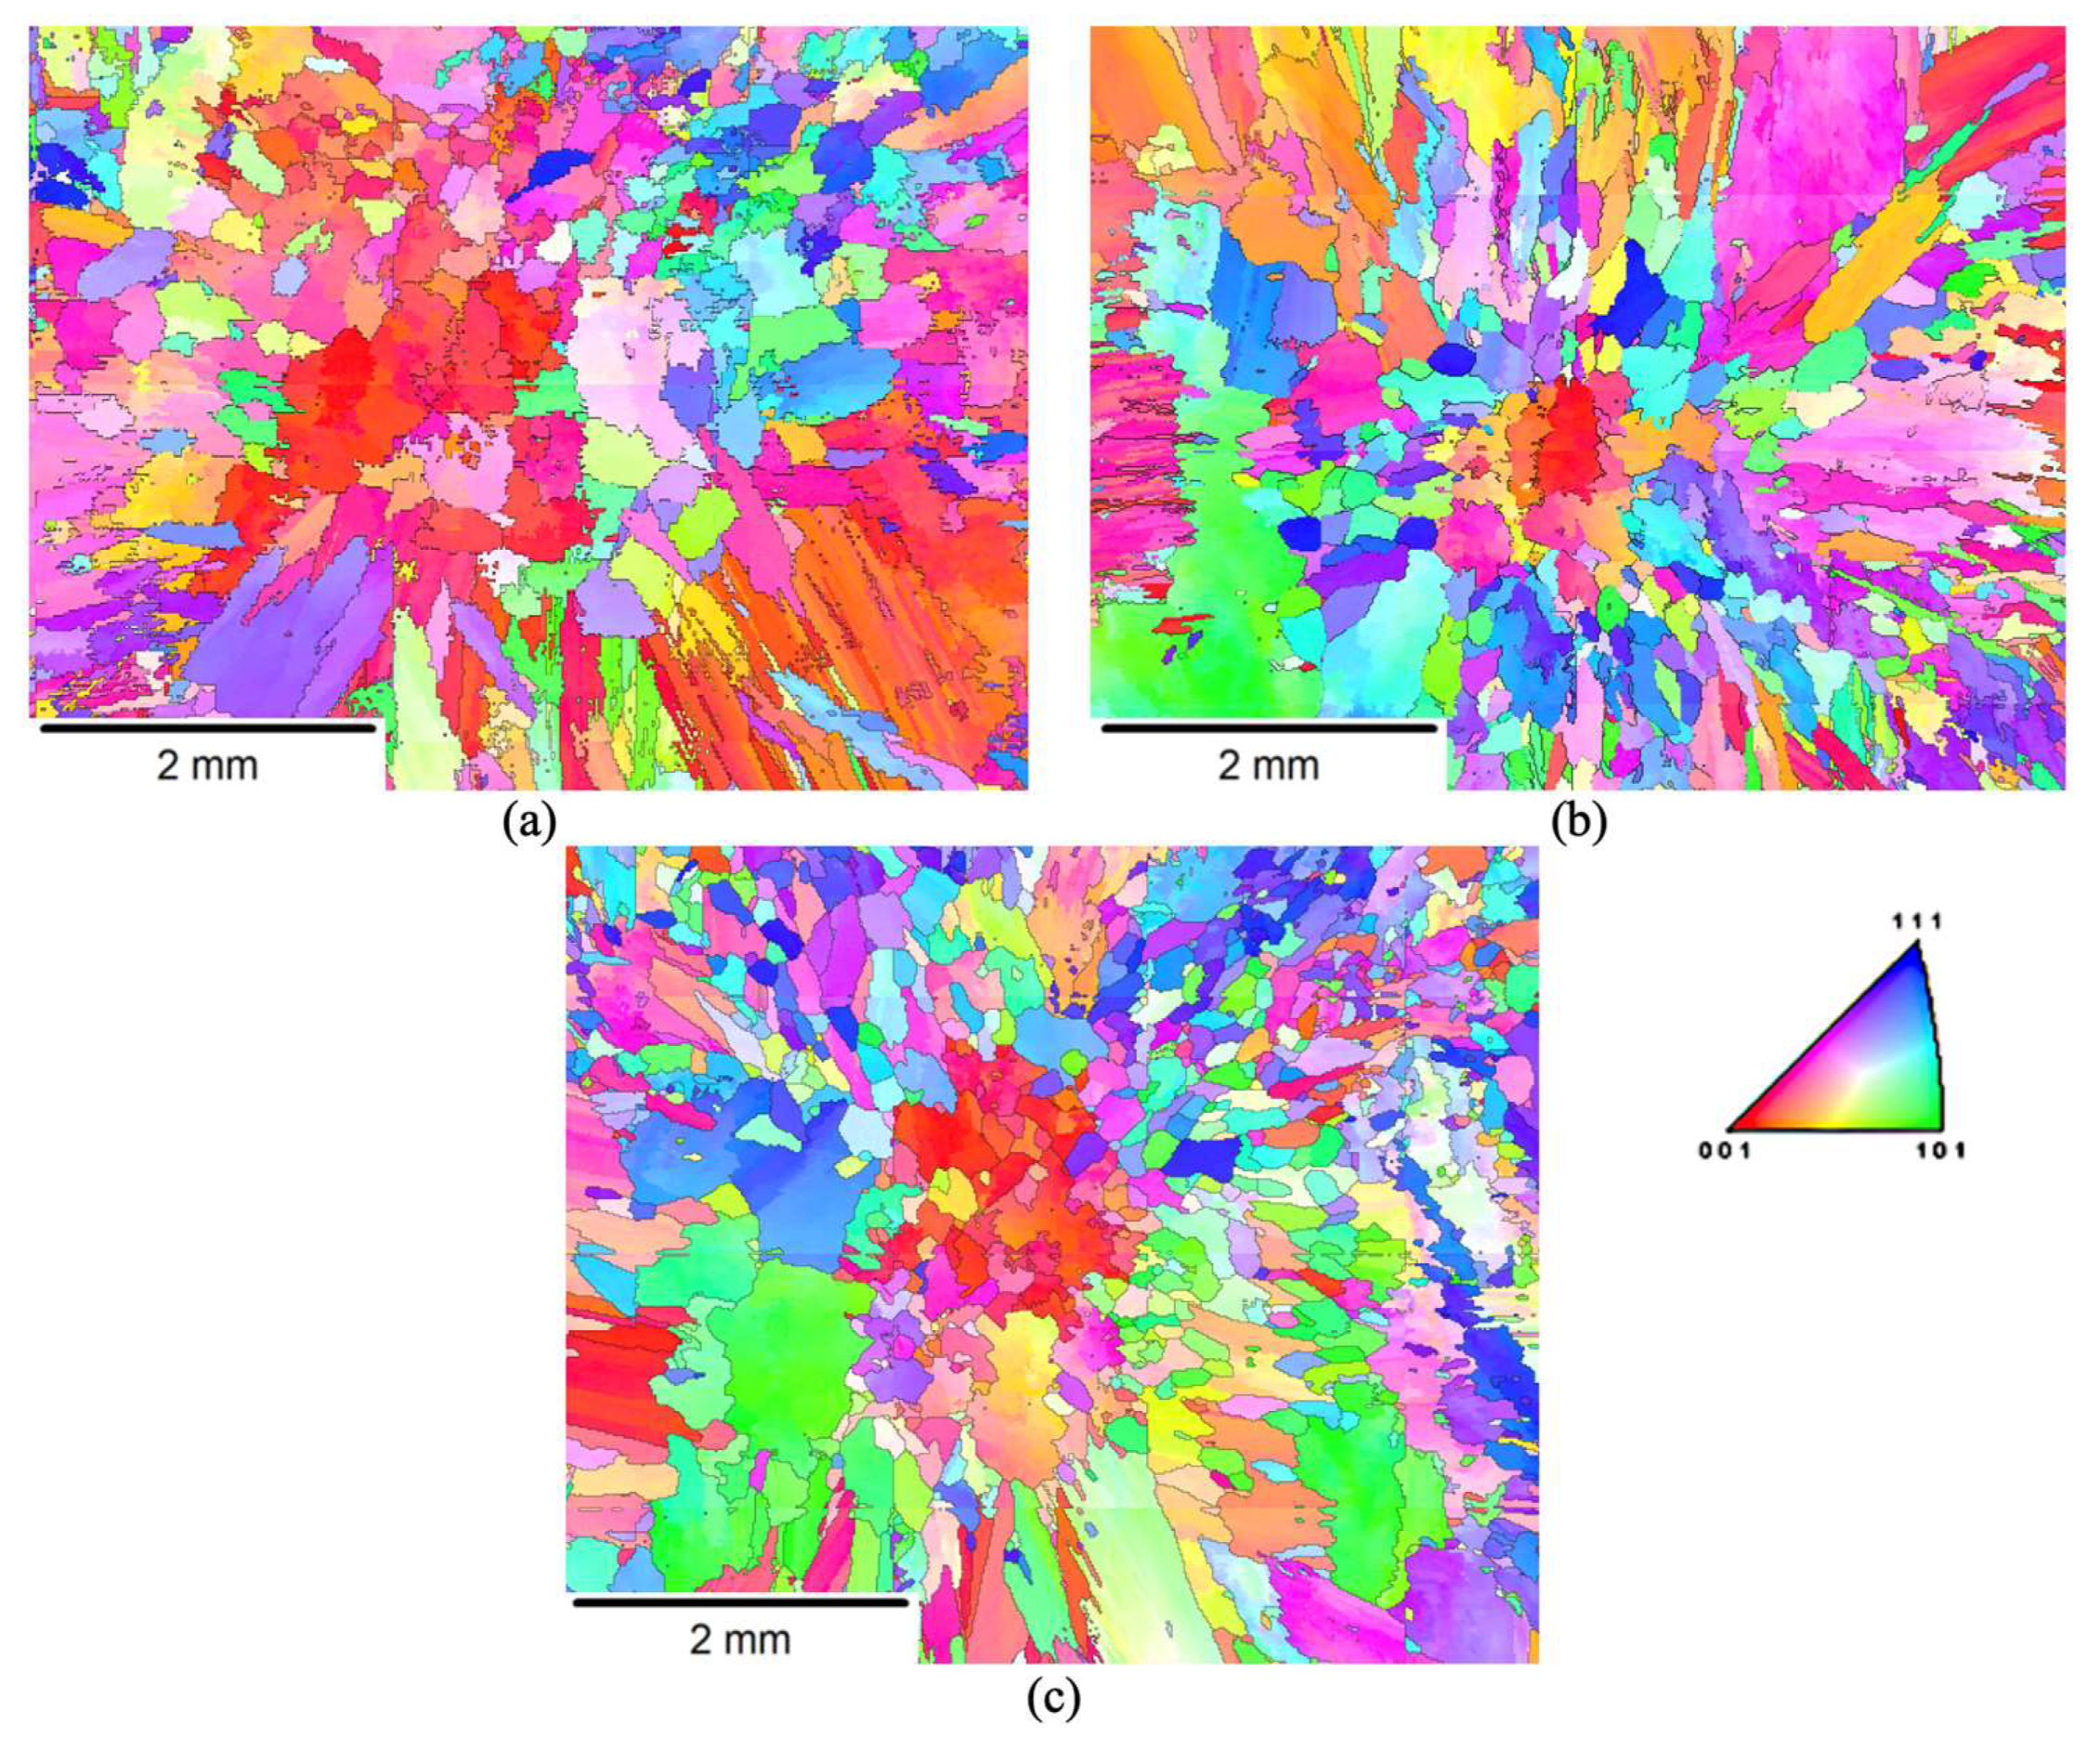
Figure A4.
Grain orientation spread (GOS) maps of FM-52 fresh spot-weld (a), after 10−3/s strain rate DRX test (b), and after 10−4/s strain rate DRX test (c).
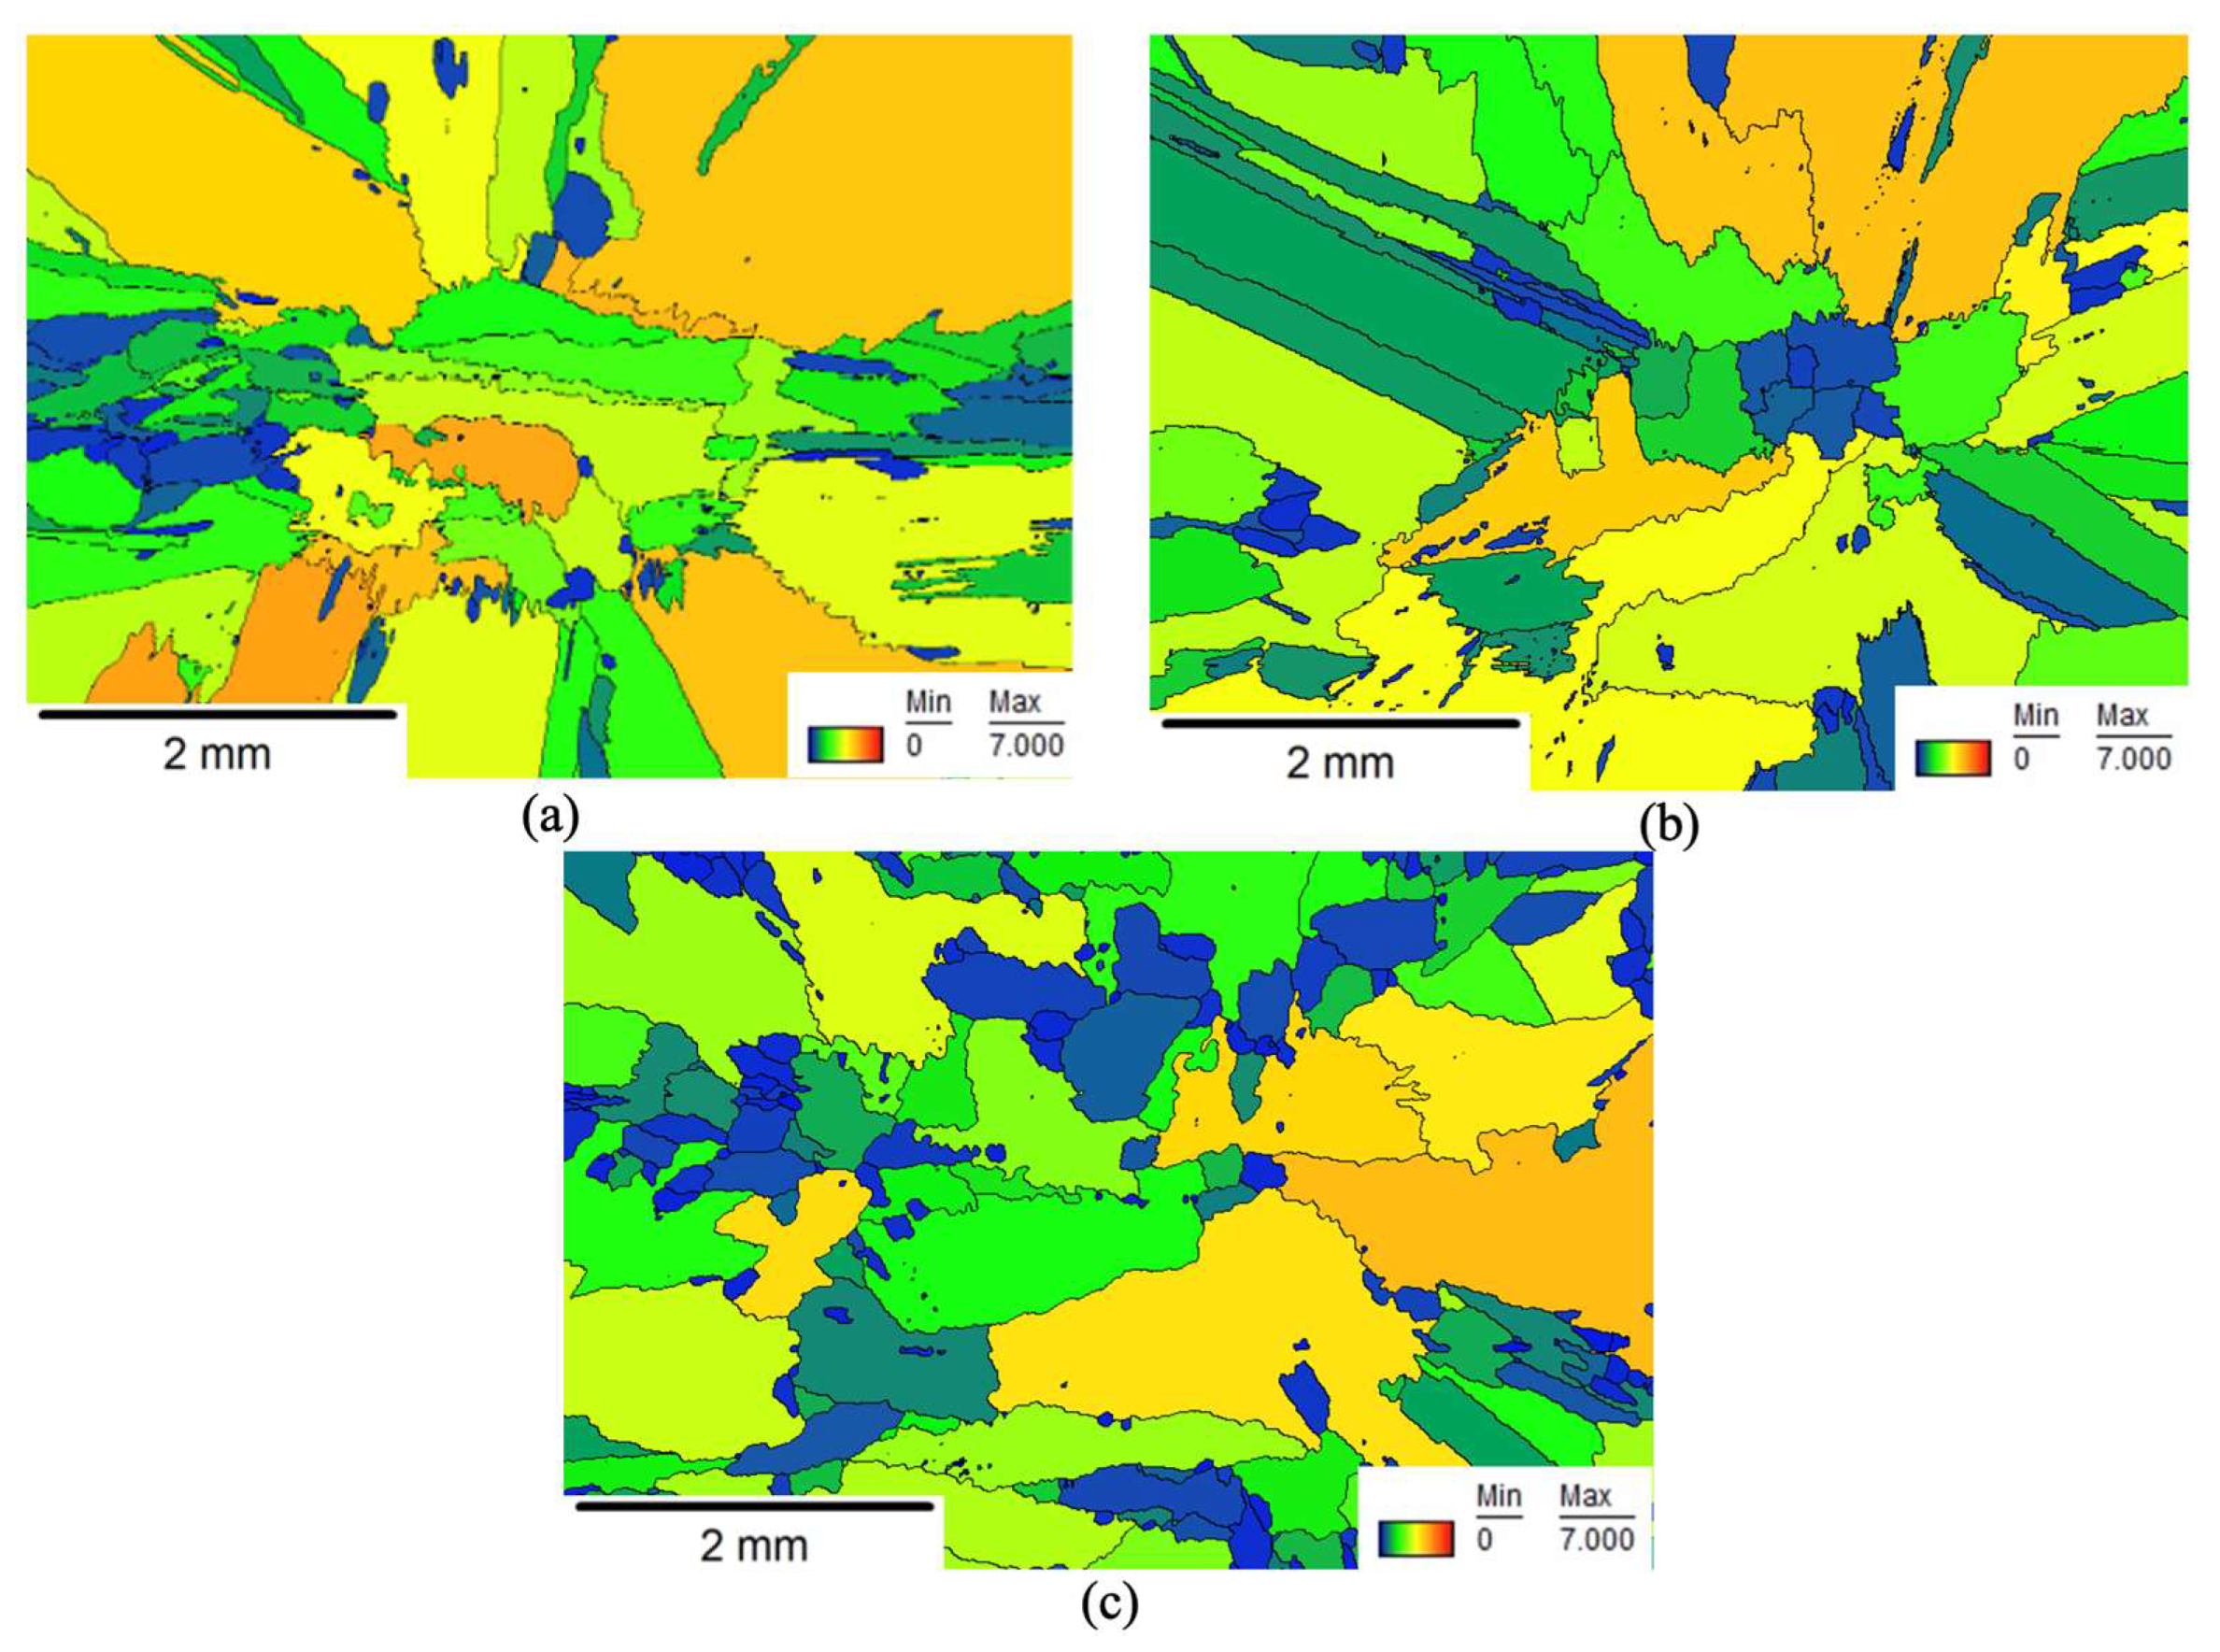
Figure A5.
GOS maps of FM-52i fresh spot-weld (a), after 10−3/s strain rate DRX test (b), and after 10−4/s strain rate DRX test (c).
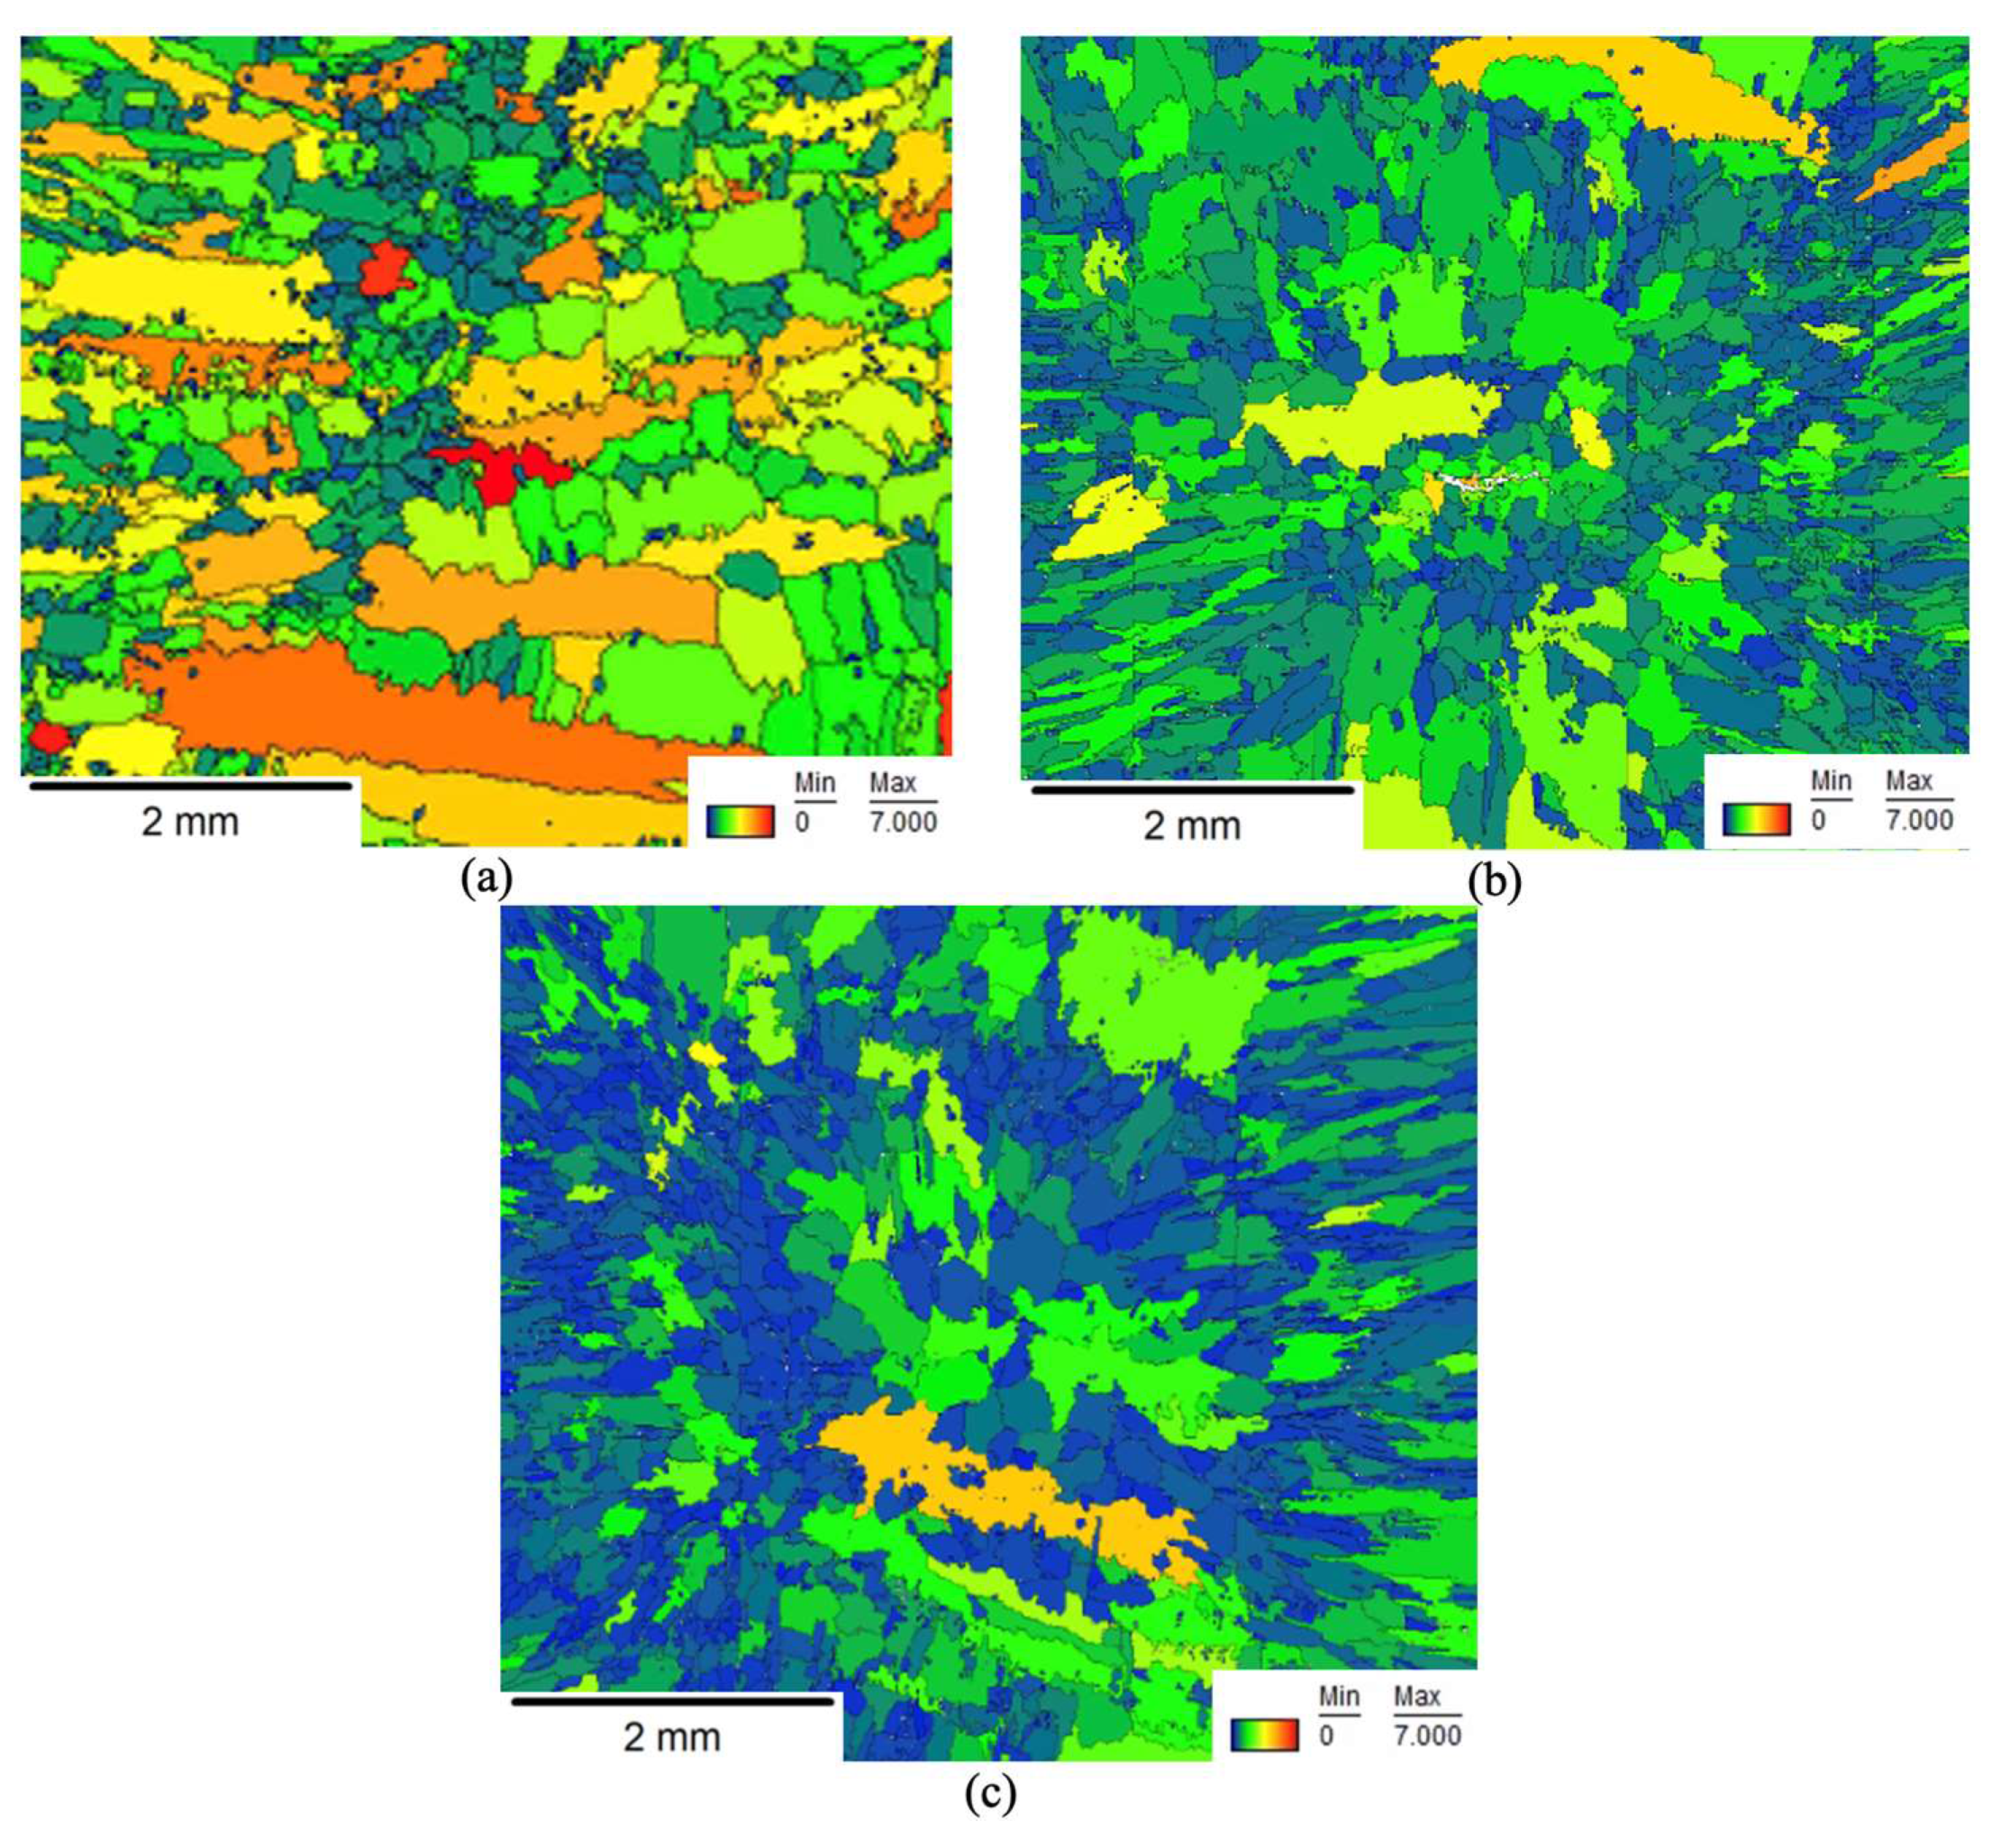
Figure A6.
GOS maps of FM-52xl fresh spot-weld (a), after 10−3/s strain rate DRX test (b), and after 10−4/s strain rate DRX test (c).
References
- Luther, S.J.; Heczko, M.; Mazánová, V.; Mills, M.J.; Alexandrov, B.T. Thermal faceting on the ductility-dip cracking fracture surfaces of nickel-based alloys—Occurrence, characterization, and implications for the cracking mechanism. Mater. Sci. Eng. A 2024, 890, 145994. [Google Scholar] [CrossRef] [Scilit]
- Cao, R.; Liu, G.; Chen, J.; Che, H.; Liu, G. Formation mechanism and research progress of ductility-dip cracking in welding of nickel-based materials. Weld. Join. 2018, 7–13. [Google Scholar]
- Alexandrov, B.T.; Hope, A.T.; Sowards, J.W.; Lippold, J.C.; McCracken, S. Weldability studies of high-Cr, Ni-Base filler metals for power generation applications. Weld World 2011, 55, 65–76. [Google Scholar] [CrossRef] [Scilit]
- McVicker, N.P. Structural Weld Overlays for Mitigation of Primary Water Stress Corrosion in Nuclear Power Plants. Master’s Thesis, The Ohio State University, Columbus, OH, USA, 2015. [Google Scholar]
- Young, G.A.; Etien, R.A.; Hackett, M.J.; Tucker, J.D.; Capobianco, T.E. Physical Metallurgy, Weldability, and in-service performance of nickel-chromium filler metals used in nuclear power systems. In 15th International Conference on Environmental Degradation of Materials in Nuclear Power Systems-Water Reactors; Springer: Cham, Switzerland, 2012; pp. 2431–2441. [Google Scholar] [CrossRef] [Scilit]
- Xie, Y.; Wu, Y.; Burns, J.; Zhang, J. Characterization of stress corrosion cracks in Ni-based weld alloys 52, 52M and 152 grown in high-temperature water. Mater. Charact. 2016, 112, 87–97. [Google Scholar] [CrossRef] [Scilit]
- Young, G.A.; Capobianco, R.A.; Etien, R.A., III; Mullen, J.V.; Leveillee, S.; Sander, P.C. Development of a Highly Weldable and Corrosion Resistant Nickel-Chromium Filler Metal. In Proceedings of the 13th International Symposium on Environmental Degradation of Materials in Nuclear Power Systems—Water Reactors, Whistler, BC, Canada, 19–23 April 2007. [Google Scholar]
- Fink, C.; Hope, A.T.; McCracken, S.L.; Lippold, J.C. The development of a high-chromium, nickel-base consumable-filler metal 52XL for nuclear applications. Weld. World 2022, 66, 123–135. [Google Scholar] [CrossRef] [Scilit]
- Böllinghaus, T. (Ed.) Hot Cracking Phenomena in Welds, 1st ed.; Springer: Berlin/Heidelberg, Germany, 2005. [Google Scholar]
- DuPont, J.N.; Lippold, J.C.; Kiser, S.D. Welding Metallurgy and Weldability of Nickel Base Alloys; John Wiley & Sons, Inc.: Hoboken, NJ, USA, 2009. [Google Scholar] [CrossRef] [Scilit]
- Kreuter, V.; Lippold, J.C. Ductility-Dip Cracking Susceptibility of Commercially Pure Ni and Ni-Base Alloys Utilizing the Strain-to-Fracture Test. In Cracking Phenomena in Welds IV; Böllinghaus, T., Lippold, J.C., Cross, C.E., Eds.; Springer International Publishing: Cham, Switzerland, 2016; pp. 145–159. [Google Scholar] [CrossRef] [Scilit]
- Caron, J.L.; Sowards, J.W. Weldability of Nickel-Base Alloys. Comprehensive Materials Processing; Elsevier: Oxford, UK, 2014; pp. 151–179. [Google Scholar] [CrossRef] [Scilit]
- Young, G.; Capobianco, T.E.; Penik, M.; Morris, B.; McGee, J. The Mechanism of Ductility Dip Cracking in Nickel-Chromium Alloys. Weld. J. 2008, 87, 31s–43s. [Google Scholar]
- Fink, C.; Keil, D.; Zinke, M. Evaluation of hot cracking susceptibility of nickel-based alloys by the PVR test. Weld. World 2012, 56, 37–43. [Google Scholar] [CrossRef] [Scilit]
- Fink, C.; Zinke, M.; Jüttner, S. An Investigation of Ductility-Dip Cracking in the Base Metal Heat-Affected Zone of Wrought Nickel Base Alloys—Part II: Correlation of PVR and STF Results; Doc II-1892-14; Springer: Berlin/Heidelberg, Germany, 2014; pp. 1–14. [Google Scholar]
- Ramirez, A.J.; Lippold, J.C. High temperature behavior of Ni-base weld metal. Mater. Sci. Eng. A 2004, 380, 245–258. [Google Scholar] [CrossRef] [Scilit]
- Luther, S.J.; Alexandrov, B.T. Quantification of the Susceptibility to Ductility-Dip Cracking in FCC Alloys; Ohio State University: Columbus, OH, USA, 2022. [Google Scholar]
- Singh, A.; Alexandrov, B.T.; Mills, M.J.; Luther, S.J.; McCracken, S.L.; Tatman, J.K. Quantification of dynamic recrystallization and its relation to imposed mechanical energy and ductility dip cracking in high-chromium nickel alloy groove welds. Adv. Mater. Technol. Power Plants 2024, 84871, 984–993. [Google Scholar] [CrossRef] [Scilit]
- Kadoi, K.; Hiraoka, M.; Shinozaki, K.; Obana, T. Ductility-dip cracking susceptibility in dissimilar weld metals of alloy 690 filler metal and low alloy steel. Mater. Sci. Eng. A 2019, 756, 92–97. [Google Scholar] [CrossRef] [Scilit]
- Lim, Y.S.; Kim, J.S.; Kim, H.P.; Cho, H.D. The effect of grain boundary misorientation on the intergranular M23C6 carbide precipitation in thermally treated alloy 690. J. Nucl. Mater. 2004, 335, 108–114. [Google Scholar] [CrossRef] [Scilit]
- Collins, M.G.; Ramirez, A.J.; Lippold, J.C. An Investigation of Ductility Dip Cracking in Nickel-Based Weld Metals—Part I. Weld. J. 2003, 82, 288s–295s. [Google Scholar]
- Li, Y.; Wang, J.; Han, E.-H.; Wu, W.; Hänninen, H. Multi-scale study of ductility-dip cracking in nickel-based alloy dissimilar metal weld. J. Mater. Sci. Technol. 2019, 35, 545–559. [Google Scholar] [CrossRef] [Scilit]
- Bruemmer, S.M.; Toloczko, M.B.; Olszta, M.J.; Seffens, R.; Efsing, P. Characterization of Defects in Alloy 152, 52 and 52M Welds; Nuclear Regulatory Commission: Rockville, MD, USA, 2009. [Google Scholar]
- Nissley, N.E.; Lippold, J.C. Ductility-dip cracking susceptibility of nickel-based weld metals: Part 2—Microstructural characterization. Weld. J. 2009, 88, 131–140. [Google Scholar]
- Kreuter, V.C. Optimization and Application of the Strain-to-Fracture Test for Studying Ductility-Dip Cracking in Ni-Base Alloys. Master’s Thesis, The Ohio State University, Columbus, OH, USA, 2015. Available online: http://rave.ohiolink.edu/etdc/view?acc_num=osu1437749997 (accessed on 22 February 2026).
- Huang, K.; Logé, R.E. A review of dynamic recrystallization phenomena in metallic materials. Mater. Des. 2016, 111, 548–574. [Google Scholar] [CrossRef] [Scilit]
- Zhong, X.; Huang, L.; Liu, F. Discontinuous dynamic recrystallization mechanism and twinning evolution during hot deformation of Incoloy 825. J. Mater. Eng. Perform. 2020, 29, 6155–6169. [Google Scholar] [CrossRef] [Scilit]
- Sakai, T.; Belyakov, A.; Kaibyshev, R.; Miura, H.; Jonas, J. Dynamic and post-dynamic recrystallization under hot, cold and severe plastic deformation conditions. Prog. Mater. Sci. 2014, 60, 130–207. [Google Scholar] [CrossRef] [Scilit]
- Ebrahimi, R.; Solhjoo, S. Characteristic Points of Stress-Strain Curve at High Temperature. Int. J. ISSI 2007, 4, 24–27. [Google Scholar]
- Dou, Y.; Luo, H.; Jiang, Y.; Tang, X. Effects of alloying elements on the stacking fault energies of ni58cr32fe10 alloys: A first-principle study. Metals 2019, 9, 1163. [Google Scholar] [CrossRef] [Scilit]
- Breidi, A.; Allen, J.D.T.; Mottura, A. First-principles calculations of intrinsic stacking fault energies and elastic properties in binary nickel alloys. Materialia 2024, 35, 102080. [Google Scholar] [CrossRef] [Scilit]
- Doherty, R.D.; Hughes, D.A.; Humphreys, F.J.; Jonas, J.J.; Juul Jensen, D.; Kassner, M.E.; King, W.E.; McNelley, T.R.; McQueen, H.J.; Rollett, A.D. Current issues in recrystallization: A review. Mater. Sci. Eng. A 1997, 238, 219–274. [Google Scholar] [CrossRef] [Scilit]
- Cross, A.J.; Prior, D.J.; Stipp, M.; Kidder, S. The recrystallized grain size piezometer for quartz: An EBSD-based calibration. Geophys. Res. Lett. 2017, 44, 6667–6674. [Google Scholar] [CrossRef] [Scilit]
- Llanos, L.; Pereda, B.; Jorge-Badiola, D.; Rodriguez-Ibabe, J.M.; López, B. Study of recrystallization in high manganese steels by means of the EBSD technique. Mater. Sci. Forum 2013, 753, 443–448. [Google Scholar] [CrossRef] [Scilit]
- Jia, C.-L.; Jia, C.; Ma, Y.; Chen, X. EBSD and X-ray diffraction study on the recrystallization of cold rolled Ni3Al-based intermetallic alloy. J. Alloys Compd. 2014, 614, 226–233. [Google Scholar] [CrossRef] [Scilit]
- Utigard, T.; Zhou, Y.; Chen, X. Microstructure evolution during hot deformation of REX734 austenitic stainless steel. Metall. Mater. Trans. A 2019, 50, 3045–3054. [Google Scholar] [CrossRef] [Scilit]
- Gomez, R.A.; Veghte, D.P.; Rowenhorst, D.J.; Williams, B.W.; Murphy-Leonard, A.D. The influence of alloying on recrystallization behavior and texture development of Mg-(Ca, Zn) alloys. J. Magnes. Alloys 2025, 15, 101945. [Google Scholar] [CrossRef] [Scilit]
- Nissley, N.E.; Collins, M.G.; Guaytima, G.; Lippold, J.C. Development of the strain-to-fracture test for evaluating ductility-dip cracking in austenitic stainless steels and Ni-base alloys. Weld. World 2002, 46, 32–40. [Google Scholar] [CrossRef] [Scilit]
- Lim, Y.C.; Yu, X.; Cho, J.H.; Sosa, J.; Farson, D.F.; Babu, S.S.; McCracken, S.; Flesner, B. Effect of magnetic stirring on grain structure refinement: Part 2—Nickel alloy weld overlays. Sci. Technol. Weld. Join. 2010, 15, 400–406. [Google Scholar] [CrossRef] [Scilit]
- McCracken, S.L.; Yu, X.; Lim, Y.C.; Farson, D.F.; Babu, S.S. Grain structure refinement in nickel alloy welds by magnetic ARC stirring. In Proceedings of the ASME 2011 Pressure Vessels and Piping Conference (PVP2011-57681), Baltimore, MD, USA, 17–21 July 2011; American Society of Mechanical Engineers: New York, NY, USA, 2011; Volume 6, Parts A and B, pp. 1565–1577. [Google Scholar] [CrossRef] [Scilit]
- Zouari, M.; Logé, R.E.; Beltran, O.; Rousselle, S.; Bozzolo, N. Multipass forging of Inconel 718 in the delta-supersolvus domain: Assessing and modeling microstructure evolution. MATEC Web Conf. 2014, 14, 12001. [Google Scholar] [CrossRef] [Scilit]
- Kang, K.B.; Kwon, O.; Lee, W.B.; Park, C.G. Effect of precipitation on the recrystallization behavior of a Nb containing steel. Scr. Mater. 1997, 36, 1303–1308. [Google Scholar] [CrossRef] [Scilit]
- Ling, L.S.; Yin, Z.; Hu, Z.; Liang, J.H.; Wang, Z.Y.; Wang, J.; Sun, B.D. Effects of the γ″-Ni3Nb phase on mechanical properties of Inconel 718 superalloys with different heat treatments. Materials 2019, 13, 151. [Google Scholar] [CrossRef] [Scilit]
- Na, E.H.; Choi, J.Y.; Sung, B.S.; Lee, H.C. Effect of the Coupling of Recovery and Precipitation on the Recrystallization Behavior of Ti-Stabilized Extra Low Carbon Steels. Mater. Sci. Forum 2004, 467–470, 299–304. [Google Scholar] [CrossRef] [Scilit]
- Wang, Y.; He, W.; Liu, N.; Chapuis, A.; Luan, B.; Liu, Q. Effect of pre-annealing deformation on the recrystallized texture and grain boundary misorientation in commercial pure titanium. Mater. Charact. 2018, 142, 118–128. [Google Scholar] [CrossRef] [Scilit]
- Gallagher, M.L. An Investigation of the Elevated Temperature Cracking Susceptibility of Alloy C-22 Weld-Metal. Doctoral Dissertation, The Ohio State University, Columbus, OH, USA, 2008. Available online: http://rave.ohiolink.edu/etdc/view?acc_num=osu1198824264 (accessed on 11 January 2026).
- Yang, C.; Baker, I. Effect of solute on microstructural evolution during directional recrystallization. J. Alloys Compd. 2020, 815, 152358. [Google Scholar] [CrossRef] [Scilit]
- Pereloma, E.; Mannan, P.; Casillas-Garcia, G.; Saleh, A. Particle stimulated nucleation during dynamic and metadynamic recrystallisation of Ni-30%Fe-Nb-C alloy. Mater. Charact. 2017, 125, 94–98. [Google Scholar] [CrossRef] [Scilit]
- Rawat, P.; Prakash, U.; Satya Prasad, V.V. Dynamic recrystallization in Nb-containing high-Al dual-phase low-density steels. Steel Research International. Steel Res. Int. 2025, 96, 177–190. [Google Scholar] [CrossRef] [Scilit]

Disclaimer/Publisher’s Note: The statements, opinions and data contained in all publications are solely those of the individual author(s) and contributor(s) and not of MDPI and/or the editor(s). MDPI and/or the editor(s) disclaim responsibility for any injury to people or property resulting from any ideas, methods, instructions or products referred to in the content. |
© 2026 by the authors. Licensee MDPI, Basel, Switzerland. This article is an open access article distributed under the terms and conditions of the Creative Commons Attribution (CC BY) license.