Article

Phase Field Simulation Study of Competitive Growth of Polycrystalline in Directional Solidification Under Natural Convection Conditions


1
School of Materials and Engineering, Zhengzhou University, Zhengzhou 450001, China
2
Zhongyuan Critical Metals Laboratory, 100 Science Avenue, Zhengzhou 450001, China
3
National Key Laboratory of Special Rare Metal Materials, Zhengzhou University, Zhengzhou 450001, China
4
State Key Laboratory of Solidification Processing, Northwestern Polytechnical University, Xi’an 710072, China
*
Author to whom correspondence should be addressed.
Metals 2026, 16(5), 454; https://doi.org/10.3390/met16050454
Submission received: 13 March 2026 / Revised: 13 April 2026 / Accepted: 19 April 2026 / Published: 22 April 2026

Abstract

Directional solidification technology is the core process for manufacturing single-crystal blades in aero-engines, but transverse grain boundaries caused by the competitive growth of polycrystals severely degrade blade performance. To gain a deeper understanding of polycrystalline competitive growth behavior, this study investigates the competitive growth of polycrystals during directional solidification under natural convection based on the phase field and lattice Boltzmann coupling model. By adjusting the solutal expansion coefficient, grain configuration, and pulling velocity, the influence of the flow field on polycrystalline competitive growth is analyzed. The results indicate that changes in the solutal expansion coefficient affect the dendritic competition process and outcome, particularly for dendrites with larger favorably oriented (FO) angles, which are more likely to be eliminated at higher solutal expansion coefficients. Additionally, grain configurations with greater orientation differences between adjacent dendrites are more sensitive to changes in the solutal expansion coefficient, whereas configurations with smaller orientation differences are less affected. It was also found that as the pulling velocity increases, the primary dendrite arm spacing decreases and the growth direction of the dendrites deflects towards the temperature gradient direction. This leads to a reduction in vortices at the dendrite tips and grain boundaries, thereby decreasing the overall flow field intensity. During dendrite growth, solute is rejected from the solid phase, creating a concentration gradient between the dendrite tips and the liquid region. This induces convection in the liquid phase. The interaction between the flow field and the solute concentration in the liquid phase causes the flow field strength and solute concentration to exhibit periodic fluctuations.

1. Introduction

Directional solidification technology establishes an axial temperature gradient to force dendrites to grow directionally along the heat flow direction, ultimately forming a fully columnar crystal structure without transverse grain boundaries. This technology has enabled the service temperature of nickel-based superalloy blades to exceed 85% of their melting point, making it a core preparation process for single-crystal blades in aeroengines [1,2,3,4,5,6]. However, in actual industrial production, the orientation deviation of the initial grains in the spiral grain selector can lead to the competitive growth of polycrystals [7,8,9,10,11]. Experimental statistics show that when the orientation difference between adjacent grains, Δθ > 8°, the probability of transverse grain boundary formation exceeds 70%, significantly reducing the high-temperature fatigue life of the blade. Therefore, revealing the competitive elimination mechanism of multi-oriented dendrites is crucial for improving the single-crystal formation rate and the service performance of the blade.
The traditional Walton–Chalmers model [12] suggests that in order to maintain a consistent growth rate with the favorably oriented (FO) dendrites in the direction parallel to the heat flow, the tips of unfavorably oriented (UO) dendrites generally lag behind those of the FO dendrites. Eventually, the UO dendrites with lagging tips are always eliminated by the FO dendrites. Some early research results were in line with the predictions of the Walton–Chalmers model [13], but Zhou et al. [14] discovered an abnormal elimination phenomenon where UO dendrites eliminated FO dendrites through convergent bicrystal directional solidification experiments. Li et al. [15] reproduced this abnormal elimination phenomenon through phase field method simulation and revealed the mechanism of solute interaction at the dendrite tip front at the grain boundary in the abnormal elimination. Compared with convergent bicrystals, research on the competitive growth of divergent bicrystals has focused more on the selection of divergent grain boundaries. Tourret et al. [16] explored the range of bicrystal grain boundary orientations by designing various grain configurations and proposed a simple analytical model to predict the average orientation of the grain boundary. Guo et al. [17] studied the growth of secondary and tertiary arms of divergent bicrystals with different grain configurations and improved Tourret’s analytical model to predict the average grain boundary orientation of divergent grain boundaries. Based on the research of bicrystal competitive growth, scholars at home and abroad have further studied polycrystal competitive growth. Takaki et al. [18] conducted numerical simulations of dendrite competitive growth in binary polycrystalline alloy directional solidification and discovered the abnormal elimination phenomenon in polycrystal competitive growth. Li et al. [19] observed the polycrystal competitive growth phenomenon in the directional solidification process of Al-Cu alloy through synchrotron radiation imaging technology and established a “secondary dendrite arm blocking model” considering the side branch blocking effect, which can more accurately predict the results of dendrite competitive growth.
All the above studies only considered the influence of pure diffusion. However, in actual solidification processes, molten metals are often in complex flow field environments, and factors such as the intensity and direction of the flow field can cause local temperature and solute concentration changes, thereby affecting the morphology and growth rate of dendrites [20,21,22]. Therefore, the influence of flow fields on the dendrite microstructure evolution during directional solidification has also received extensive attention from researchers [23,24]. Zhang et al. [25] used the Phase Field–Lattice Boltzmann (PF-LBM) model to study the effects of temperature gradient, withdrawal speed, and isotherm inclination angle on dendrite growth and solute convection during directional solidification and found that solute plume phenomena could be observed when the withdrawal speed was low. Takaki et al. [26] studied the competitive growth of binary alloys under natural convection conditions through GPU-accelerated phase field simulation and found that the direction of natural convection would affect the results of bicrystal competitive growth. Despite these studies, a comprehensive understanding of dendrite competitive growth under natural convection is still lacking.
In recent years, domestic researchers have gradually considered the influence of flow fields when using the phase field method to simulate solidification processes. However, research on the competitive growth of polycrystals with different configurations under natural convection is relatively scarce, especially the exploration of how the flow field affects the competitive growth behavior of dendrites. Therefore, this paper simulates the competitive growth process of polycrystals under different grain configurations, withdrawal speeds, and solute expansion coefficients, examines the dendrite elimination modes under different growth conditions, and analyzes the influence of solidification process parameters and material parameters on the competitive growth of multi-oriented dendrites.

2. Phase Field–Lattice Boltzmann Coupling Model

2.1. Phase Field Model

Following our previous study [27] regarding bi-crystal competition under fluid flow conditions during directional solidification, a phase field model for simulating the Ni-Ta binary alloy is adopted in this paper, and the flow field model adopts the Lattice Boltzmann model. In the multiphase field model, ϕ1 = 1 represents the liquid phase, and ϕi = 1 (i ≠ 1) represents differently oriented grains. Each point within the calculation area satisfies the equation ∑j =1…nϕj= 1 [28]. A step function Si was defined as 1 if ϕi > 0, and 0 otherwise. The number N of phase field variables at a given grid point within the region is then calculated as N = i = 1 n S i .
The free energy function of the system in the multiphase field model is [29]:
F = v f p + f T + λ L i ϕ i 1 d v
Here, fp defines the double-well potential and thickness of the diffuse interface [29]:
f p = i > 1 ε 1 i 2 2 ϕ 1 ϕ i + i > 2 ε 2 i 2 2 ϕ 2 ϕ i + + i > n 1 ε ( n 1 ) i 2 2 ϕ n 1 ϕ i + i > 1 w 1 i ϕ 1 ϕ i + i > 2 w 2 i ϕ 2 ϕ i + + i > n 1 w ( n 1 ) i ϕ n 1 ϕ i
fT constitutes the thermodynamic driving force and is the free energy density of a certain component with an independent solute. The expression is [29]:
f T = i ϕ i f i c i
Based on the Ginzburg-Landau equation, the phase field evolution equation can be obtained as [29,30]:
ϕ i t = 2 N j i n S i S j M i j δ f p ϕ i δ f p ϕ j + R T ( 1 k ) V m ( c L e c L )
where Mij is dynamics coefficient of the phase field, k represents the equilibrium distribution coefficient, Vm is the molar volume (L/mol), R is the ideal gas constant, T is the temperature (K), and c L e is the equilibrium liquid phase concentration.
The phase field equation under isotropy is:
ϕ i t = 2 N M S L ( N 1 ) δ f p δ ϕ i j = 1 δ f p δ ϕ j + ( N 1 ) R T ( 1 k ) V m ( c L e c L ) i = 1 2 N M S L δ f p δ ϕ i δ f p δ ϕ 1 + R T ( 1 k ) V m ( c L c L e ) + M S S j = 1 ε S S 2 2 2 ϕ j + w S S ϕ j ( N 1 ) ε S S 2 2 2 ϕ i + w S S ϕ i i 1
δ f p δ ϕ i = i 1 ε S L 2 2 2 ϕ i + w S L ϕ i i = 1 ε S L 2 2 2 ϕ i + j 1 , i ε S S 2 2 2 ϕ j + w S L ϕ 1 + j 1 , i w S S ϕ j i 1
R T ( 1 k ) V m ( c L e c L ) = R T ( 1 k ) V m m e ( T m T m e c L )
where Tm represents the equilibrium temperature (K), and me is the slope of the liquidus line.
The solute field equation that incorporates the flow field and the counter-solute retention term is [31,32]:
c t + ( u c c ) = ϕ 1 D L c L + ε S L 2 w ( c L c S ) ϕ 1 ( 1 ϕ 1 ) ϕ 1 t ϕ 1 | ϕ 1 |
( u c c ) = u c x + v c y
where uc represents the liquid phase flow velocity (m/s), u and v are the components of uc in the x and y directions, DL is the liquid phase solute diffusion coefficient, w is the weighting coefficient, c = ϕ1cL + (1 − ϕ1) is the mixed concentration, cL is the liquid phase solute concentration, cS is the solid phase solute concentration. At each point within the interface area, an equivalence relation must be satisfied [28,33]:
f S ( c S ) c S = f L ( c L ) c L
where fS and fL represent the free energy densities of the solid phase and the liquid phase, respectively. Under the conditions of dilute solution approximation, cS = kcL. εSS(εSL) and ωSS(ωSL) are jointly determined by the interfacial energy σ and the interfacial energy thickness ξ [27]:
ε S L = 4 π ξ S L σ S L ; w S L = 2 σ S L ξ S L
ε S S = 4 π ξ S S σ S S ; w S S = 2 σ S S ξ S S
The wettability of the interface can be altered by adjusting the ratio of σSS to σSL. In this paper, σSS = 2.5σSL and ξSL = ξSS.
The phase field dynamics coefficient Mij is closely related to the interface migration. Under the conditions set in this paper, since the low pulling speeds (300–900 μm/s) and the corresponding low dendrite growth rate, the interface dynamics overcooling can be neglected. Thus, the phase field dynamics coefficient MSL of the solid–liquid interface can be obtained as [31]:
M S L = 8 V m σ S L D L 2 w S L π R T ( 1 k ) 2 c L e ε S L 3
And assume that the phase field dynamics coefficient of the solid–solid interface MSS = 0.1MSL.
Considering the anisotropy of the interfacial energy, εSL can be expanded as [27]:
ε S L = ε 0 ( 1 3 r 4 ) 1 + 4 r 4 1 3 r 4 ϕ 1 x 4 + ϕ 1 y 4 ( ϕ 1 x 2 + ϕ 1 y 2 ) 2
where r4 is the anisotropic coefficient, which is obtained by rotating the initial system’s x-axis and y-axis by an angle of α0 to obtain the coordinate axes x′ and y′ along the preferred orientation direction. The relationships between x′, y′ and x, y are as follows [27]:
ϕ 1 x = cos α 0 ϕ 1 x + sin α 0 ϕ 1 y
ϕ 1 y = sin α 0 ϕ 1 x + cos α 0 ϕ 1 y

2.2. Flow Field Model

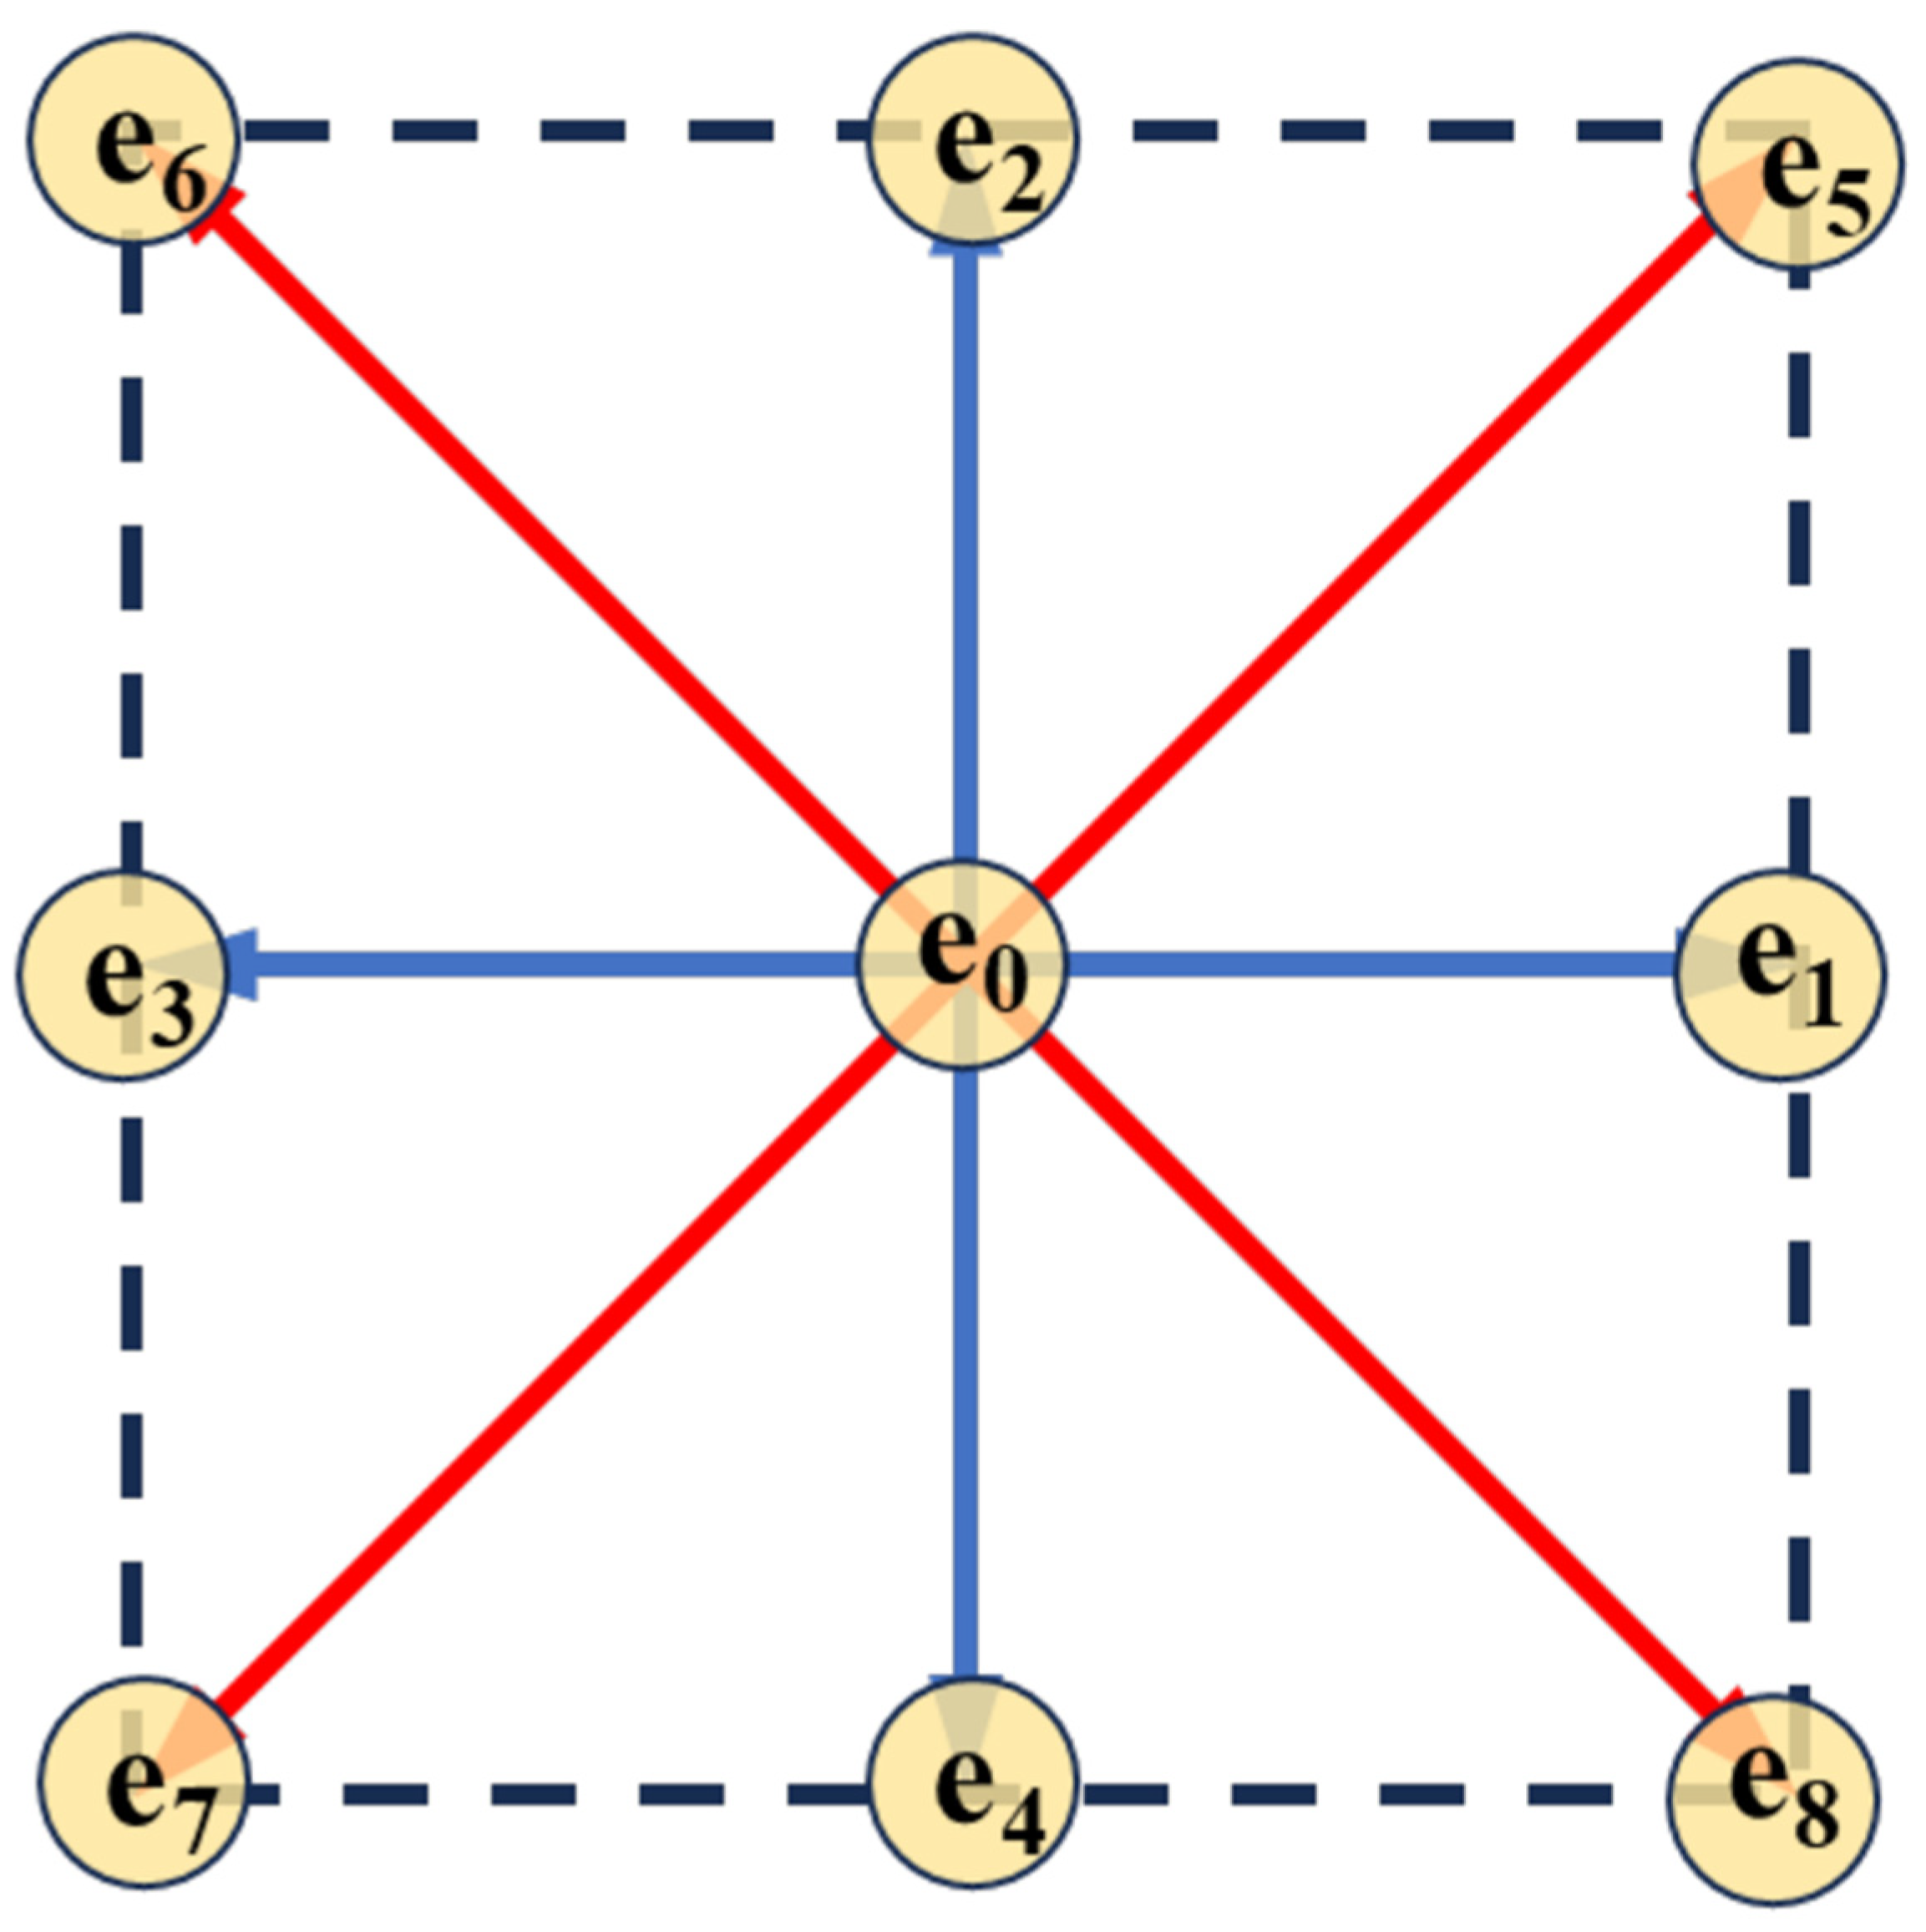
The flow field model here adopts the D2Q9 model from the Lattice Boltzmann method. As shown in Figure 1, the velocity directions of particles are discretized into one static direction and eight dynamic directions around the lattice points in the D2Q9 model. The corresponding Lattice Boltzmann equation is [27]:
L i ( x + e i Δ t , t + Δ t ) = L i ( x , t ) 1 τ [ L i ( x , t ) L i e q ( x , t ) ] + G i ( x , t ) Δ t ( i = 0 , 1 , , 8 )
where Li and L i e q represent the density distribution and equilibrium distribution function of fluid particles, and the discrete velocity ei defines the movement direction of the particles in the lattice structure, with x being the position vector. τ represents the relaxation time, which indicates the time required for the equilibrium distribution function to change from non-equilibrium to equilibrium. Among them, the equilibrium distribution function of fluid particles is [27]:
L e q ( x , t ) = ρ ω i 1 + ( e i u c ) l v + ( e i u c ) 2 2 l v 4 u c 2 2 l v 2
where ρ represents the density of the liquid phase (kg/m3), uc is the flow velocity of the liquid phase (m/s), lv is the lattice velocity, lv = Δxt, and wi is the weighting coefficient.
Gi is the discrete external force under natural convection, consisting of the dissipation resistance at the solid–liquid interface, GD, and the buoyancy force caused by the concentration difference in the liquid phase GB. The expression is [27]:
G i = 1 1 2 τ w i 3 c i u c c 2 + 9 ( c i u c ) c i c 4 ( G B + G D )
G D ( r , t ) = 2 ρ v h W 0 2 f 1 ( 1 f 1 ) 2 u c
G B ( r , t ) = ρ g β ( c c 0 ) f 1
where f1 represents the liquid phase fraction, h = 2.757 is a dimensionless constant, g = 9.8 m/s2 is the gravitational acceleration, β is the solute expansion coefficient, and C0 is the initial solute concentration. Natural convection arises from the density difference between the solute and the solvent, which can be quantified by the expansion coefficient β.
After the distribution functions in all directions are calculated, the macroscopic density and velocity of the fluid can be obtained by the following two formulas [27]:
ρ ( r , t ) = i = 0 8 L i ( r , t )
u c ( r , t ) = 1 ρ i = 0 8 e i L i ( r , t )

3. Calculation Conditions

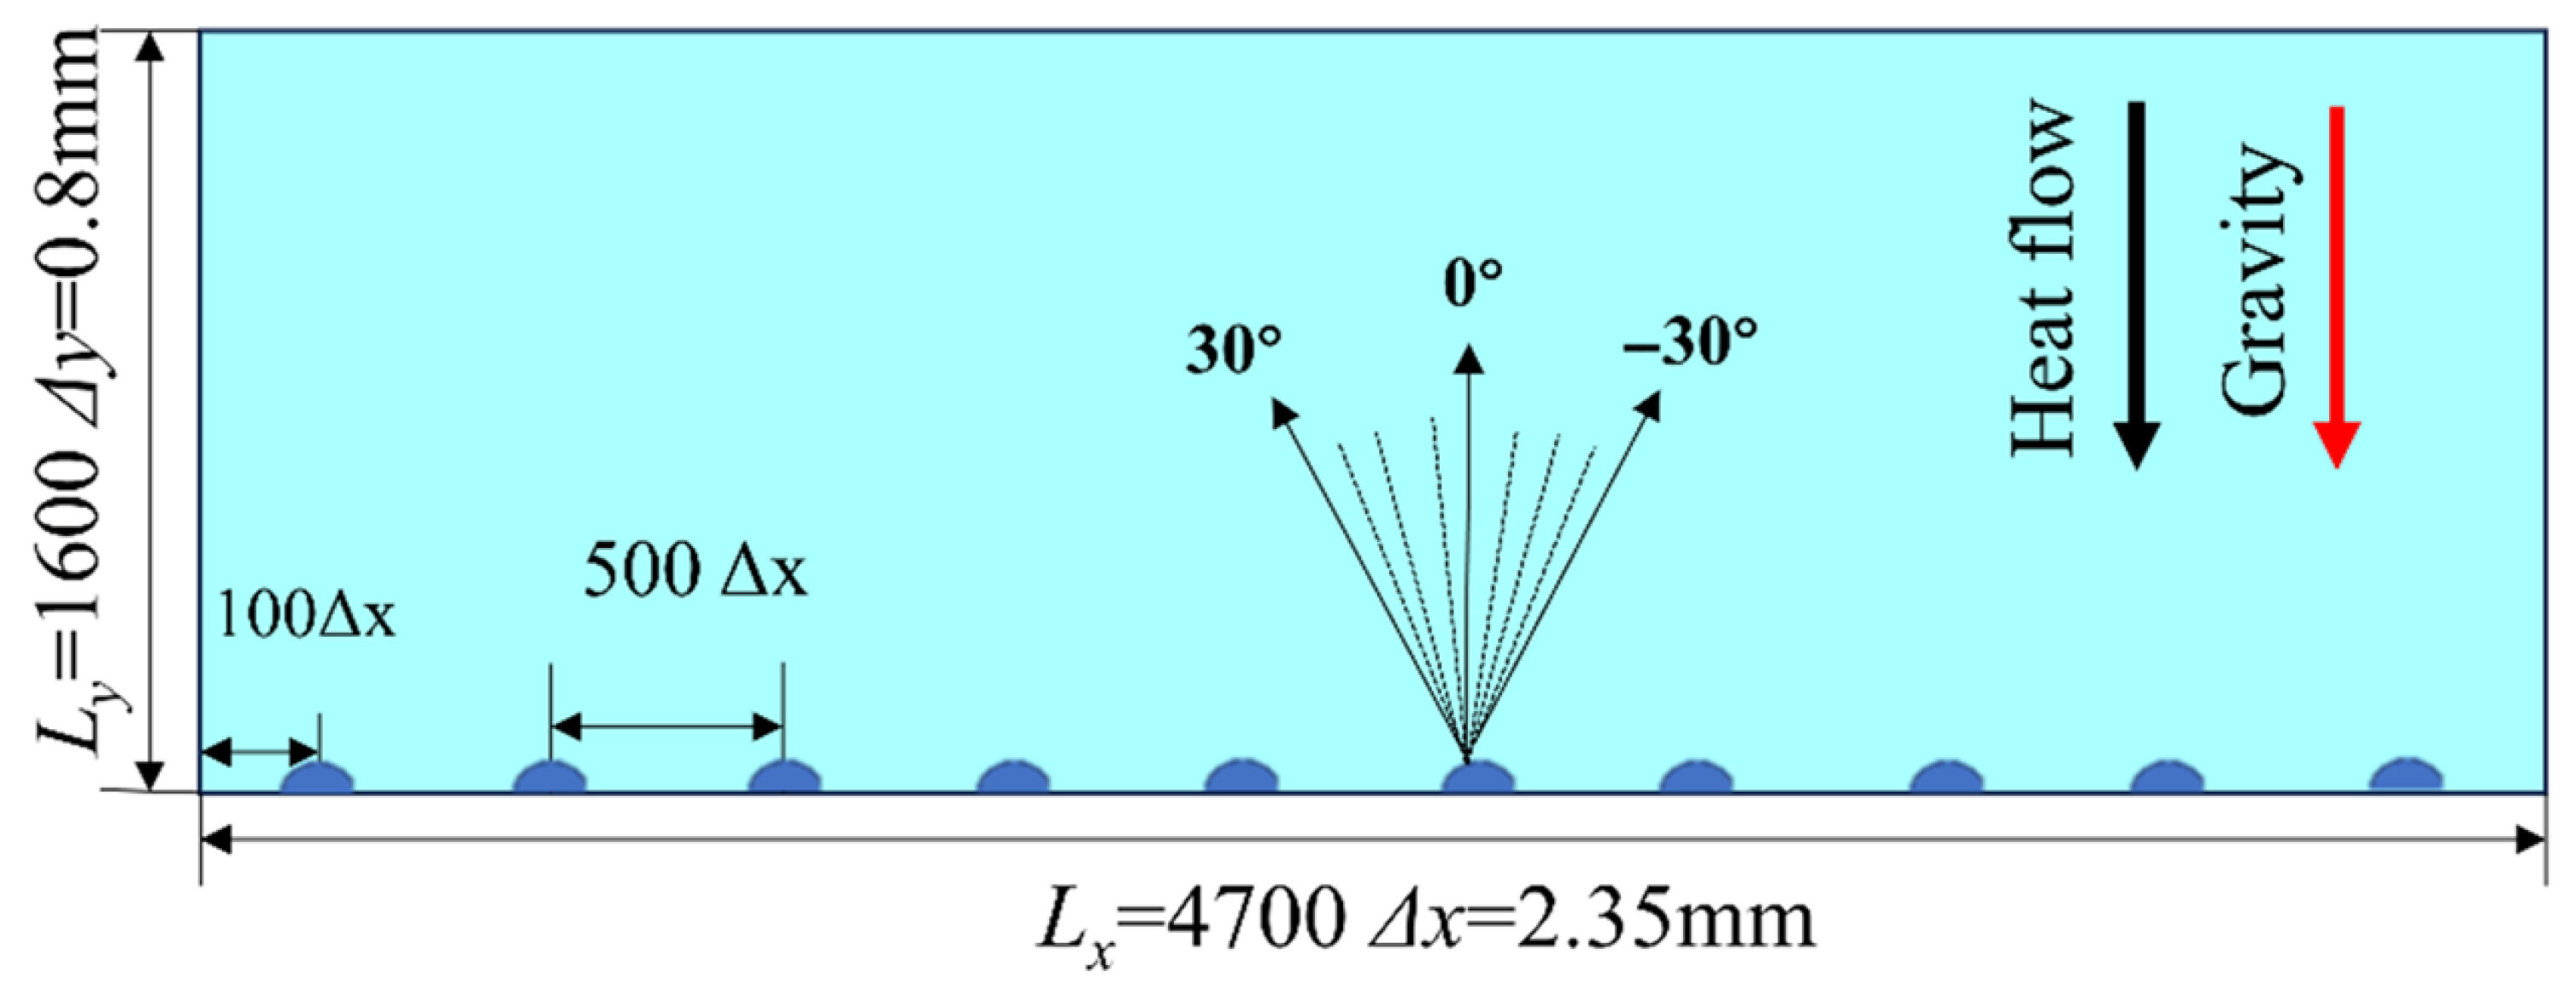
Ni-Ta binary alloy was adopted as the modeling alloy, and the material parameters are shown in Table 1. The computational domain for the simulation setup is shown in Figure 2. The computational area is divided into uniform grids with a size of Δx = Δy = 0.5 μm. The overall size is 4700∆x × 1600∆y = 2.35 mm × 0.8 mm. Ten uniformly distributed hemispherical nuclei are set at the bottom of the computational domain, with an interval of 500∆x between the nuclei. The nuclei at the left and right ends are spaced 100∆x from the boundary, and the FO angle θ0 of the dendrites ranges from 0° to 35°. No slip boundary conditions were set for all boundaries.
As shown in Table 2, there are three types of grain configurations. Among these three grain configurations, the orientation difference ∆θ between adjacent dendrites is distributed as follows: ∆θ in Case I is mostly within the range of 0° to −10°, ∆θ in Case II is mostly within the range of −10° to −20°, and ∆θ in Case III is mostly within the range of −20° to −30°. On this basis, the FO θ0 is randomly selected. The expansion coefficients β are −0.1 and −0.03. The pulling speeds are 300 μm/s, 600 μm/s, and 900 μm/s.

4. Simulation Results and Discussion

4.1. Evolution of Polycrystalline Structure Morphology

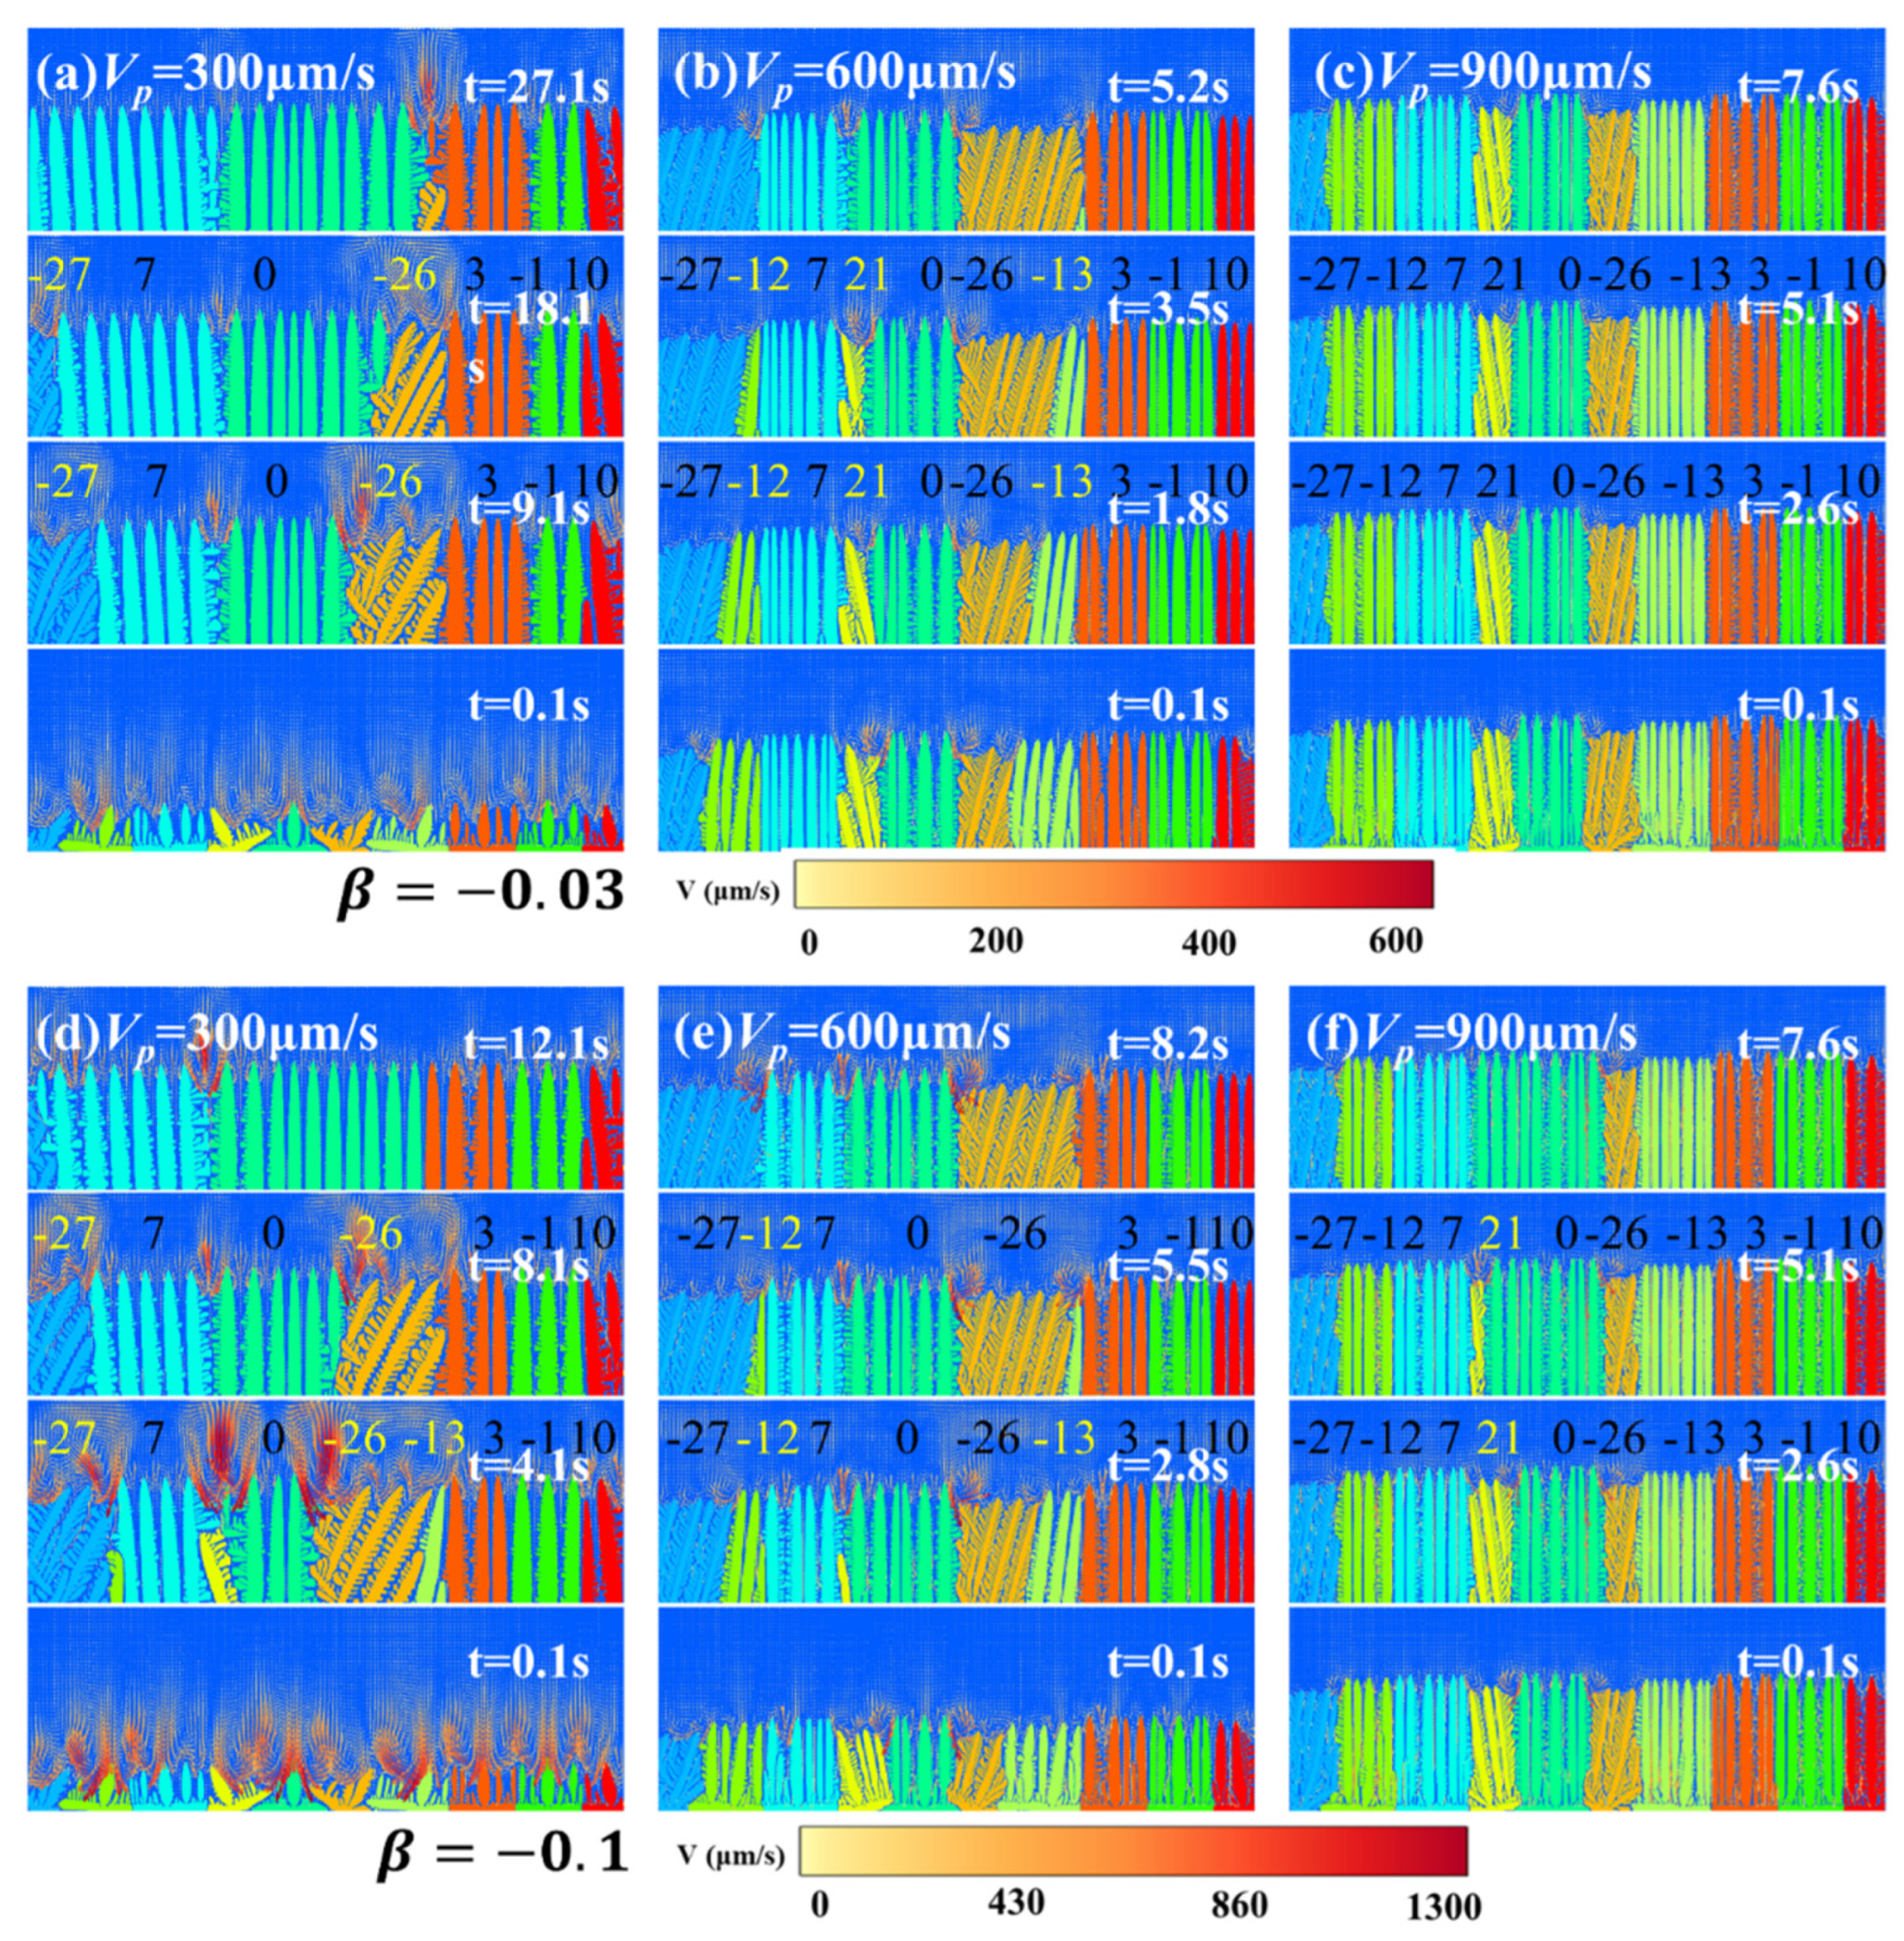
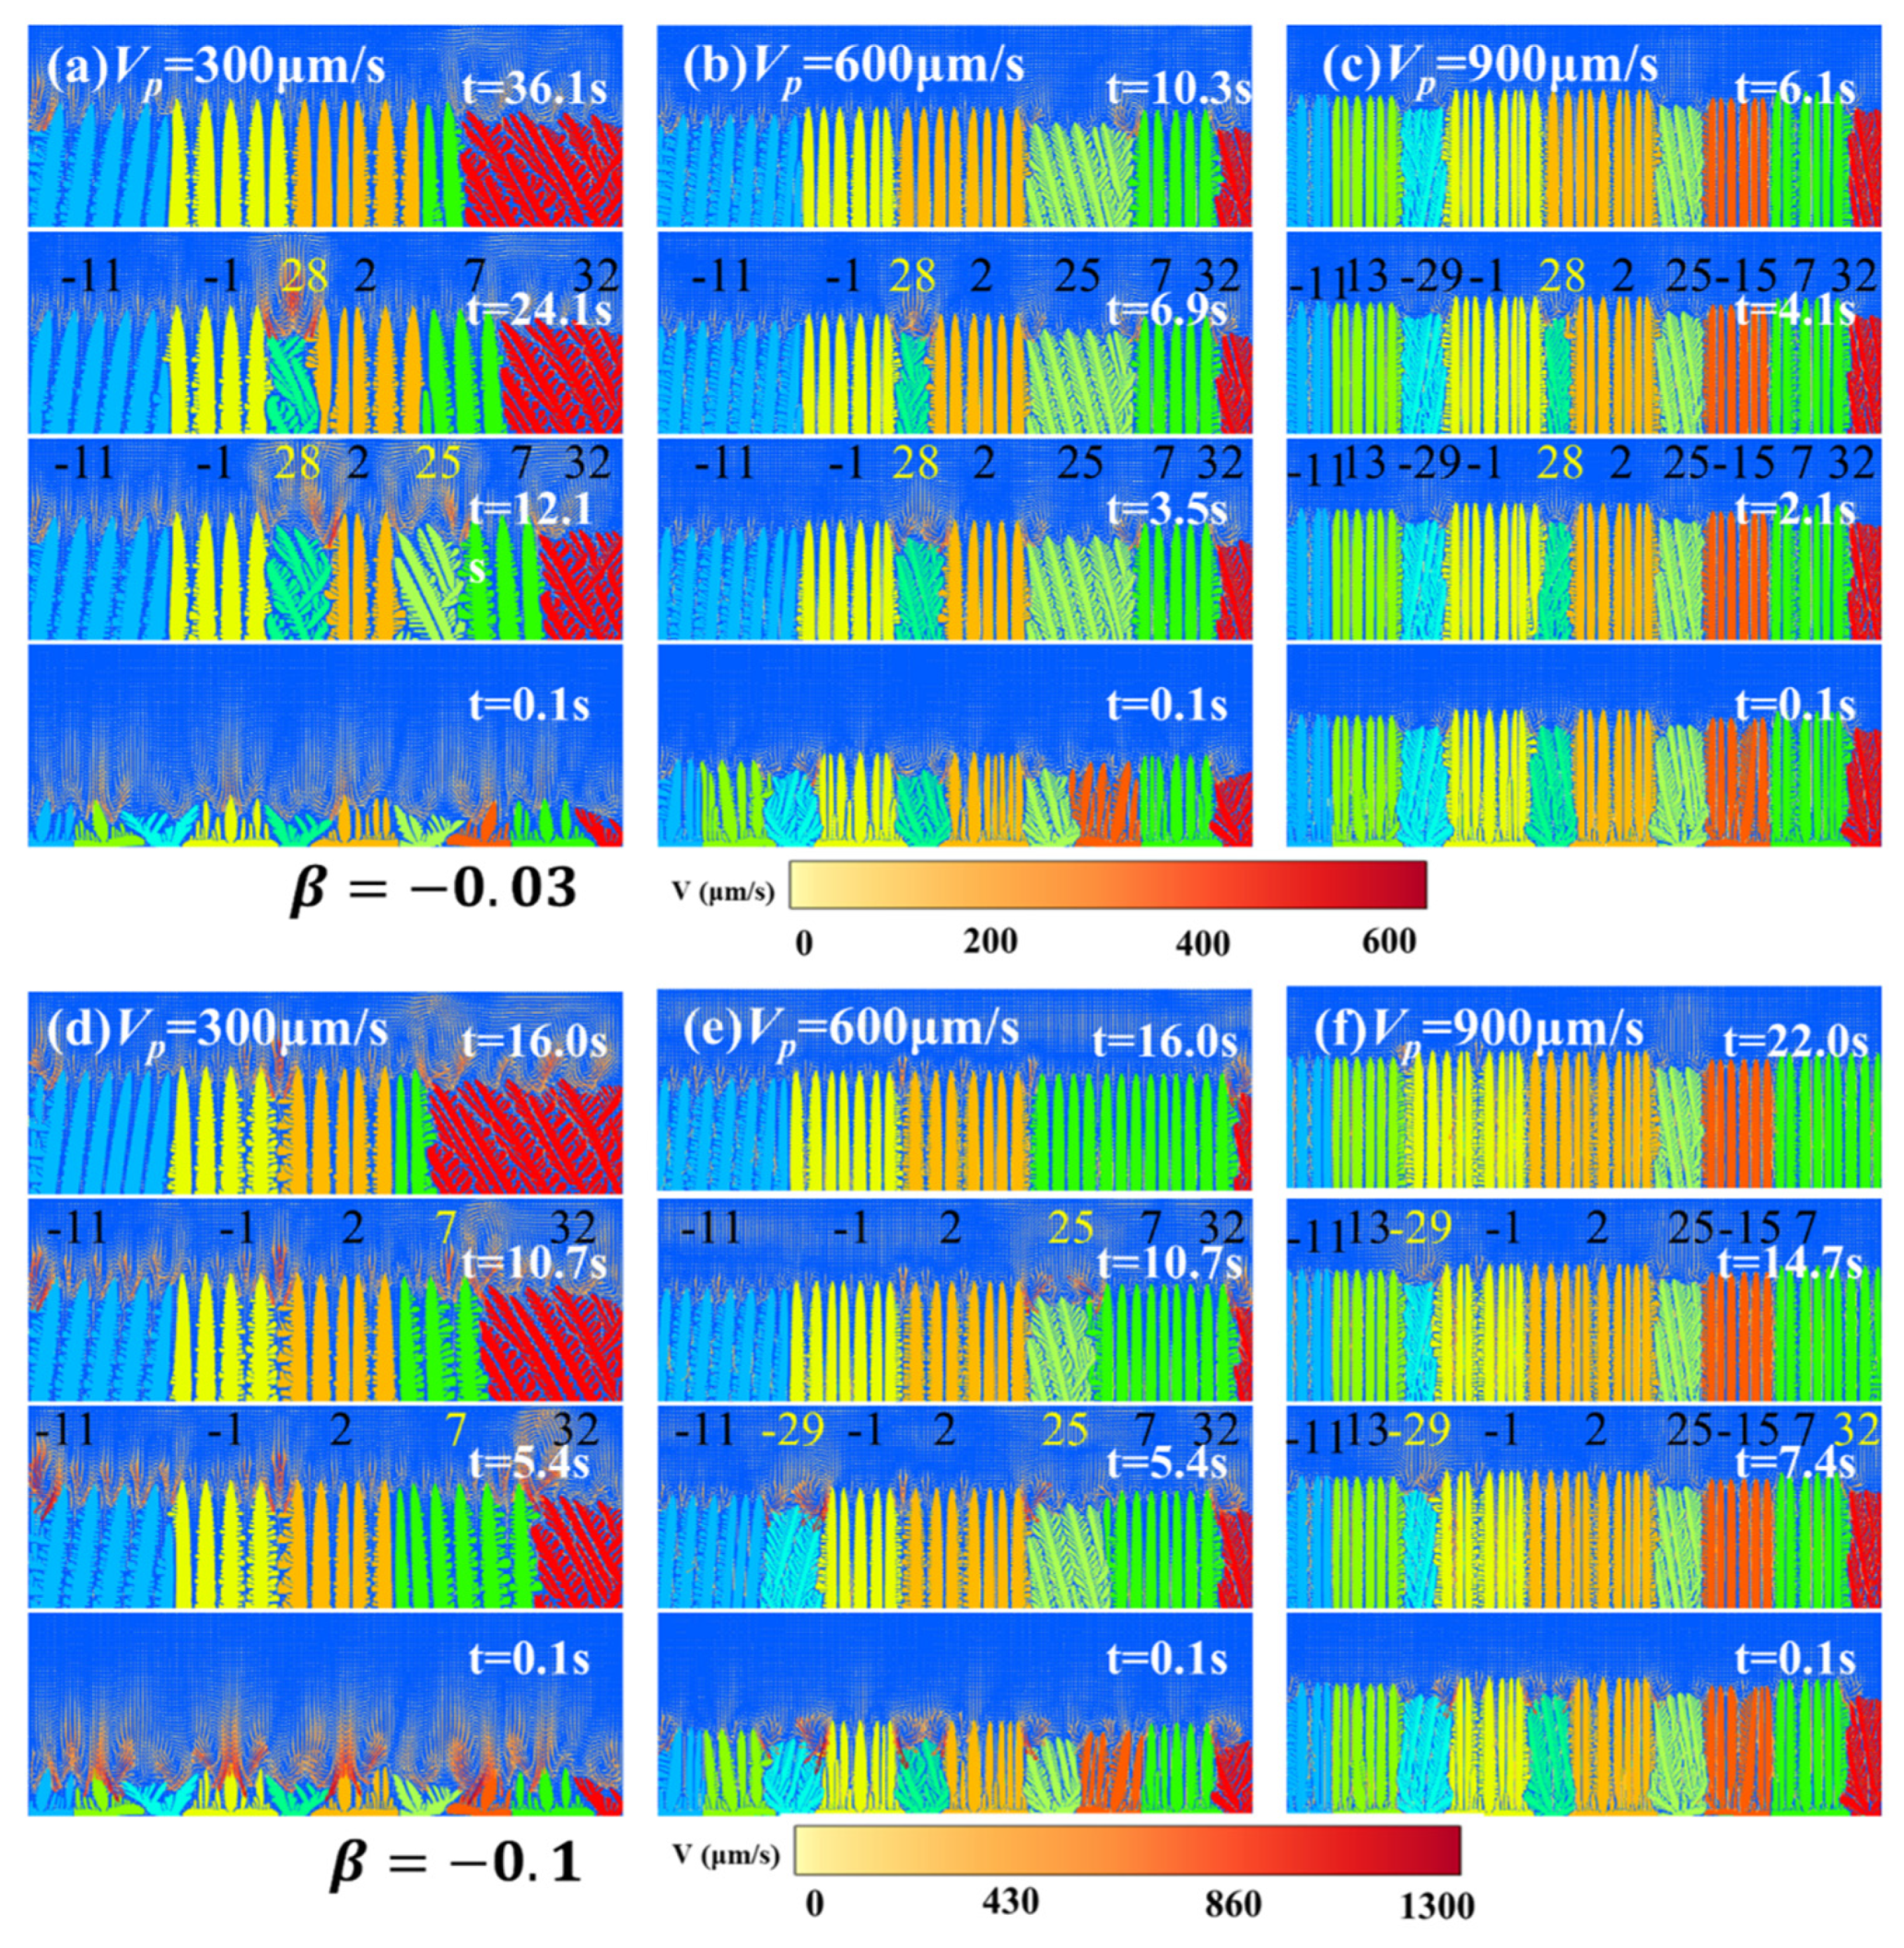
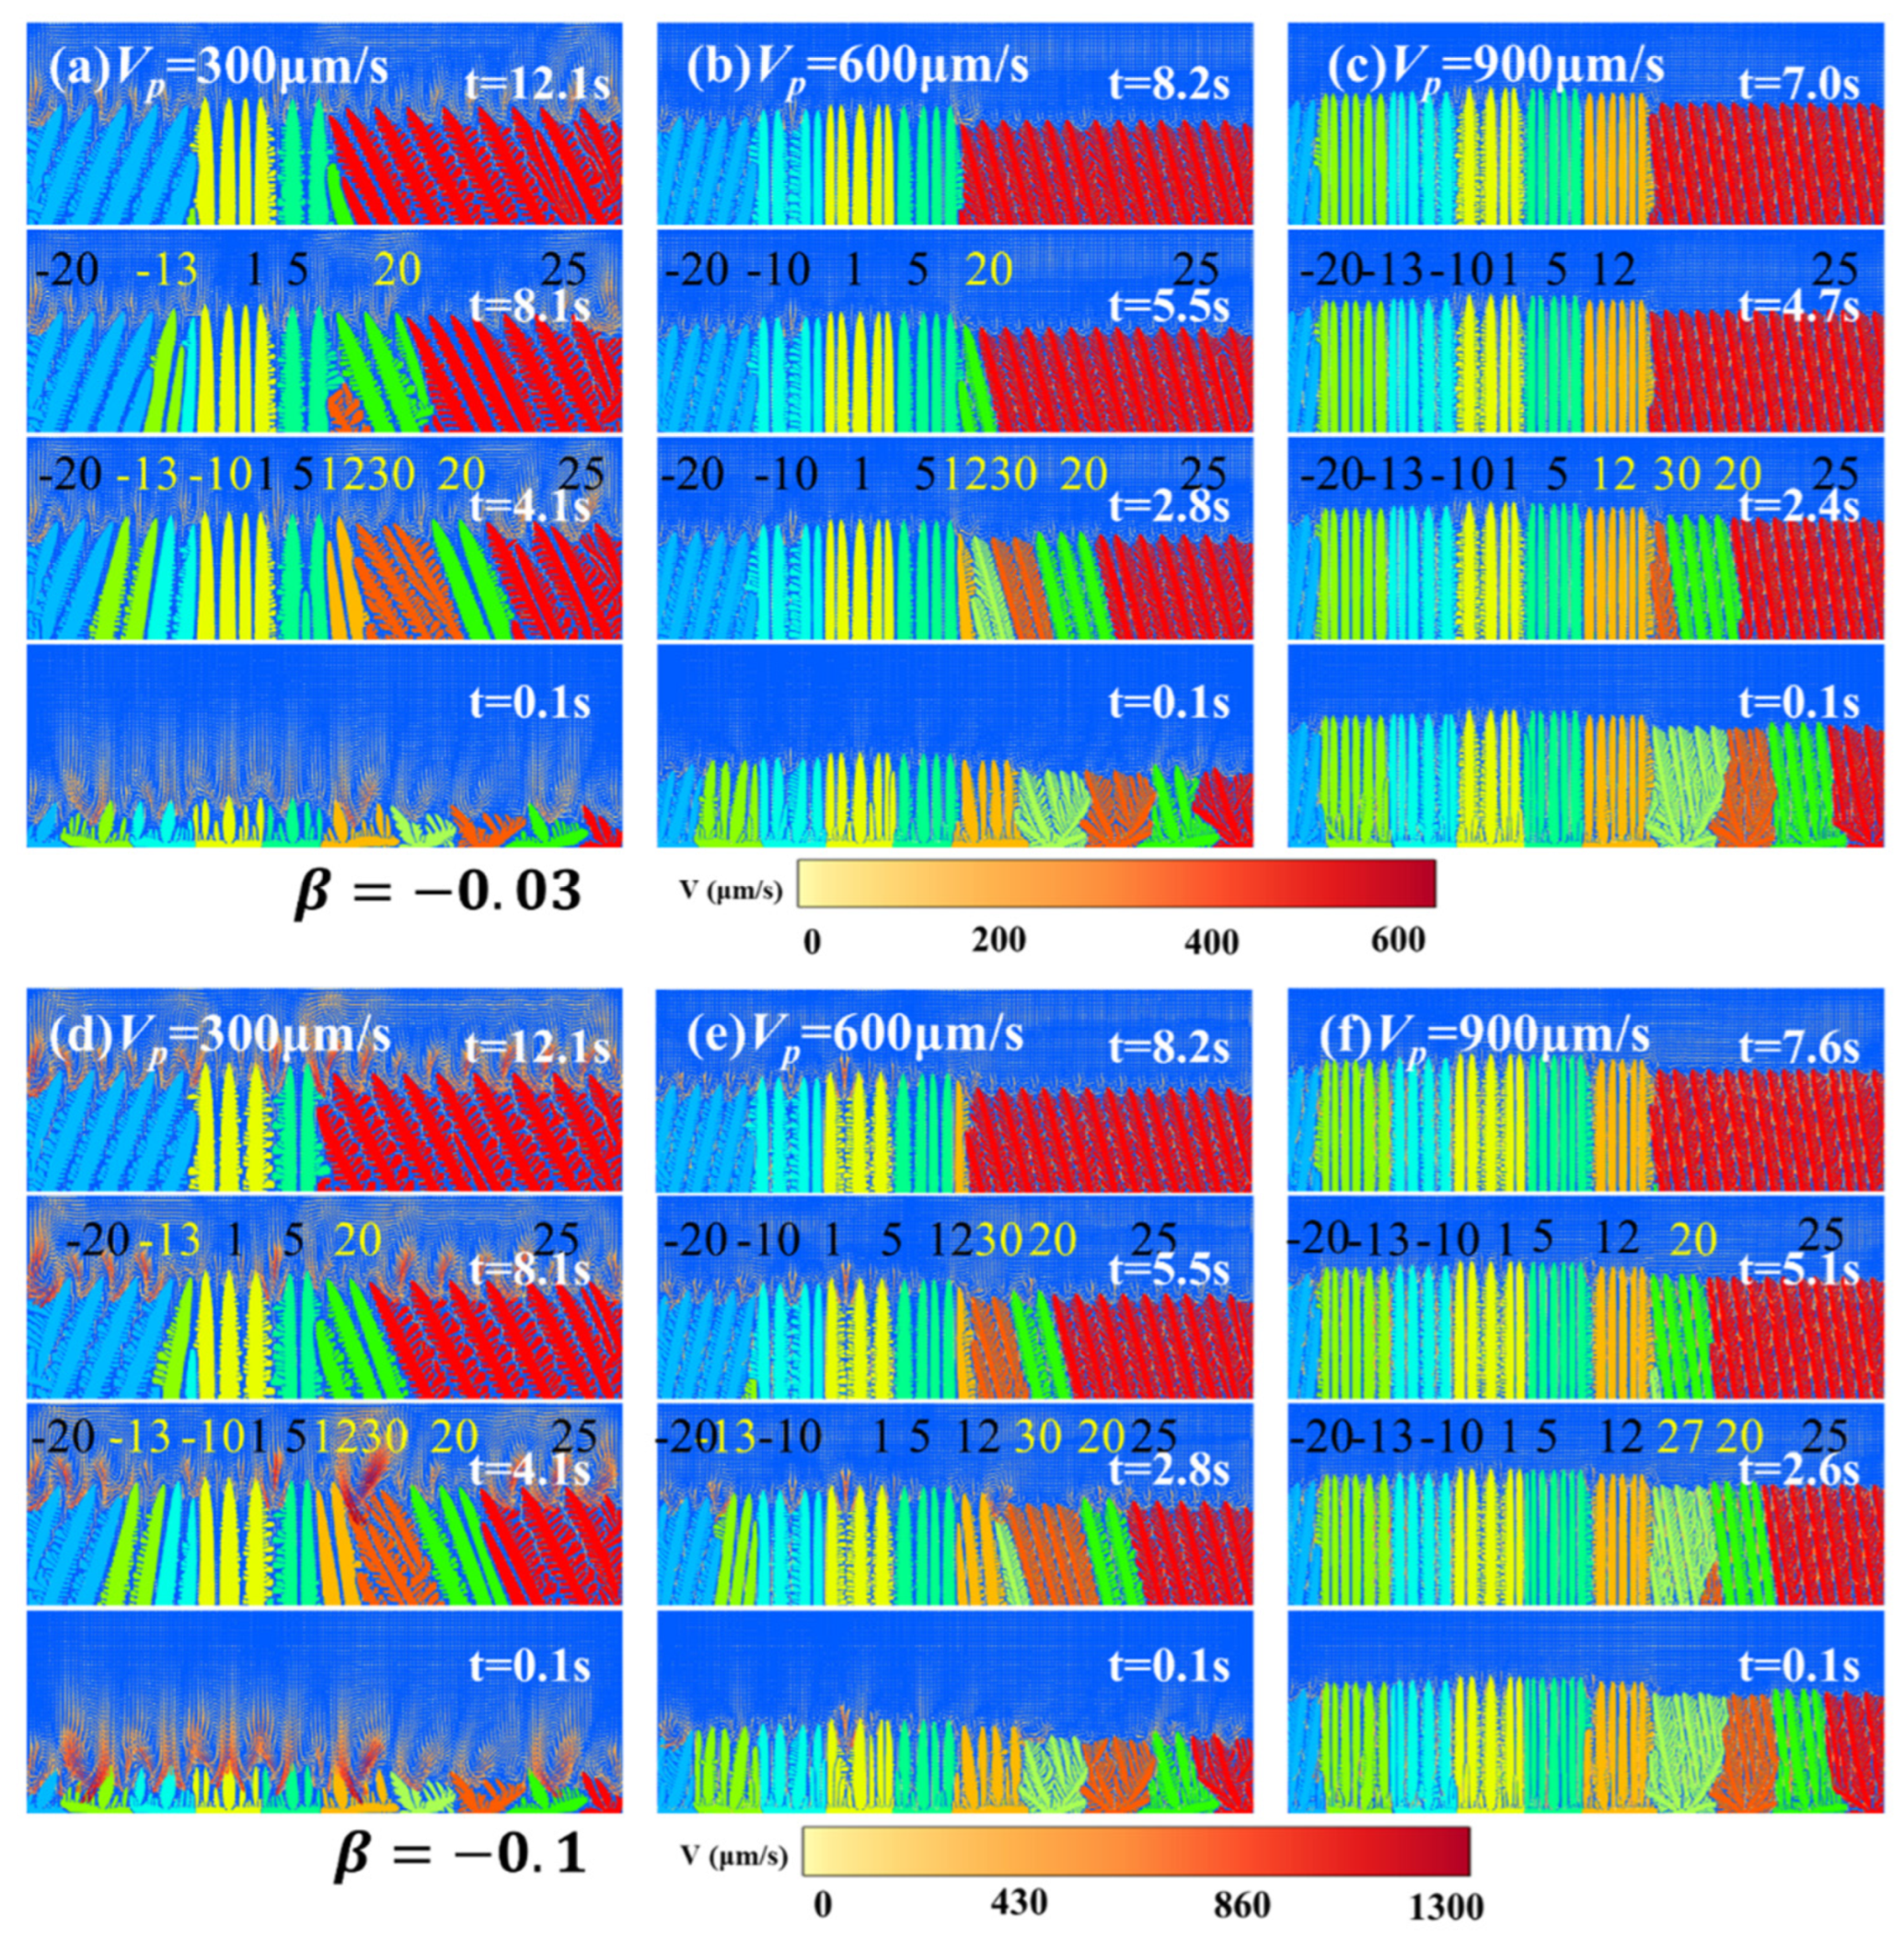
Figure 3, Figure 4 and Figure 5 show the evolution of the microstructure morphology and the distribution of the flow field during the initial formation of columnar dendrites from the initial nuclei in the directional solidification process under different solute expansion coefficients and pulling speeds for the three grain configurations. During the process from the initial stage of solidification to the end of dendrite competition growth, dendrite morphology diagrams are selected at equal time intervals. The vector lines in the figures represent the flow field, and the direction of the arrows indicates the direction of the liquid phase flow. The color represents the speed of liquid-phase flow, and the color ranges from white to red to represent the gradually increasing speed of the liquid-phase flow. The FO is marked above the dendrites, and yellow indicates that the dendrites of this orientation are eventually eliminated.
From Figure 3a–c, it can be observed that the morphology of dendrite stable growth varies under different pulling speeds. As the pulling speed increases, the spacing between the primary arms of the dendrites gradually decreases, the number of dendrites increases, and the actual growth direction of the dendrites deviates towards the direction of the temperature gradient, allowing more dendrites with different orientations to be retained.
At a pulling speed of VP = 300 μm/s, there are four FO dendrites in the steady state, while at VP = 900 μm/s, there are seven FO dendrites in the steady state, and the growth direction of dendrites with −20° < θ0 < 20° deviates to be parallel to the temperature gradient. By comparing Figure 3a–c with Figure 3d–f, it can be seen that the change in the solute expansion coefficient has a very small impact on the competitive growth results of Case I.
Figure 4 shows the microstructure evolution process of the crystal grain configuration in Case II. It can be seen that the influence of the laws of the pulling speed and the solute expansion coefficient on the dendrite competitive growth is similar to that in Case I. The difference is that when VP = 900 μm/s and β = −0.1, dendrites with θ0 = 21° are eliminated, while they are not eliminated when β = −0.03. Moreover, when VP = 600 μm/s and β = −0.1, dendrites with θ0 = 21° are eliminated before those with θ0 = −12°, while when β = −0.03, dendrites with θ0 = −12° are eliminated before those with θ0 = 21°. This indicates that in the crystal grain configuration of Case II, the change in the solute expansion coefficient will affect the process and result of the multi-oriented dendrite competitive growth, and this influence is more significant when the pulling speed is larger, which is similar to the results of previous simulations by Takaki et al. [34].
As shown in Figure 5a,d, when the pulling speed VP = 300 μm/s, by comparing the morphology evolution process of dendrite structures under two solute expansion coefficients, it can be seen that the results of dendrite competition in both cases are consistent. In the end, five orientations of dendrites are retained, but the competition growth process and the number of dendrites are different. This indicates that the solute expansion coefficient affects the multi-crystal competition growth process by influencing the flow field intensity. In Figure 5d, the dendrites with θ0 = 28° are eliminated earlier than those with θ0 = 25°, and the dendrites with θ0 = 28° are eliminated in the early stage of competition growth; in Figure 5a, the dendrites with θ0 = 25° are eliminated earlier than those with θ0 = 28°, and the dendrites with θ0 = 28° are eliminated in the later stage of growth. Comparing Figure 5b,e, at the pulling speed VP = 600 μm/s, the dendrites with θ0 = 25° are finally retained when β = −0.03, and eliminated when β = −0.1; the dendrites with θ0 = 28° are similar to the case of VP = 300 μm/s. Comparing Figure 5c,f, at the pulling speed VP = 900 μm/s, the dendrites with θ0 = −29° and θ0 = 32° are eliminated by adjacent dendrites when β = −0.1, and retained when β = −0.03. By comparing the dendrite competition growth processes under different pulling speeds and two solute expansion coefficients, it is found that at β = −0.03, it is found that the dendrites with θ0 = 28°, θ0 = 25°, and θ0 = −29° are eliminated earlier than those with β = −0.1, and the growth process is significantly different from that of the dendrites with β = −0.03. And this phenomenon occurs in dendrites with larger θ0, indicating that in the multi-crystal competition growth process, dendrites with larger FO angles are more sensitive to the change in the expansion coefficient.

4.2. Quantitative Analysis of Competitive Growth

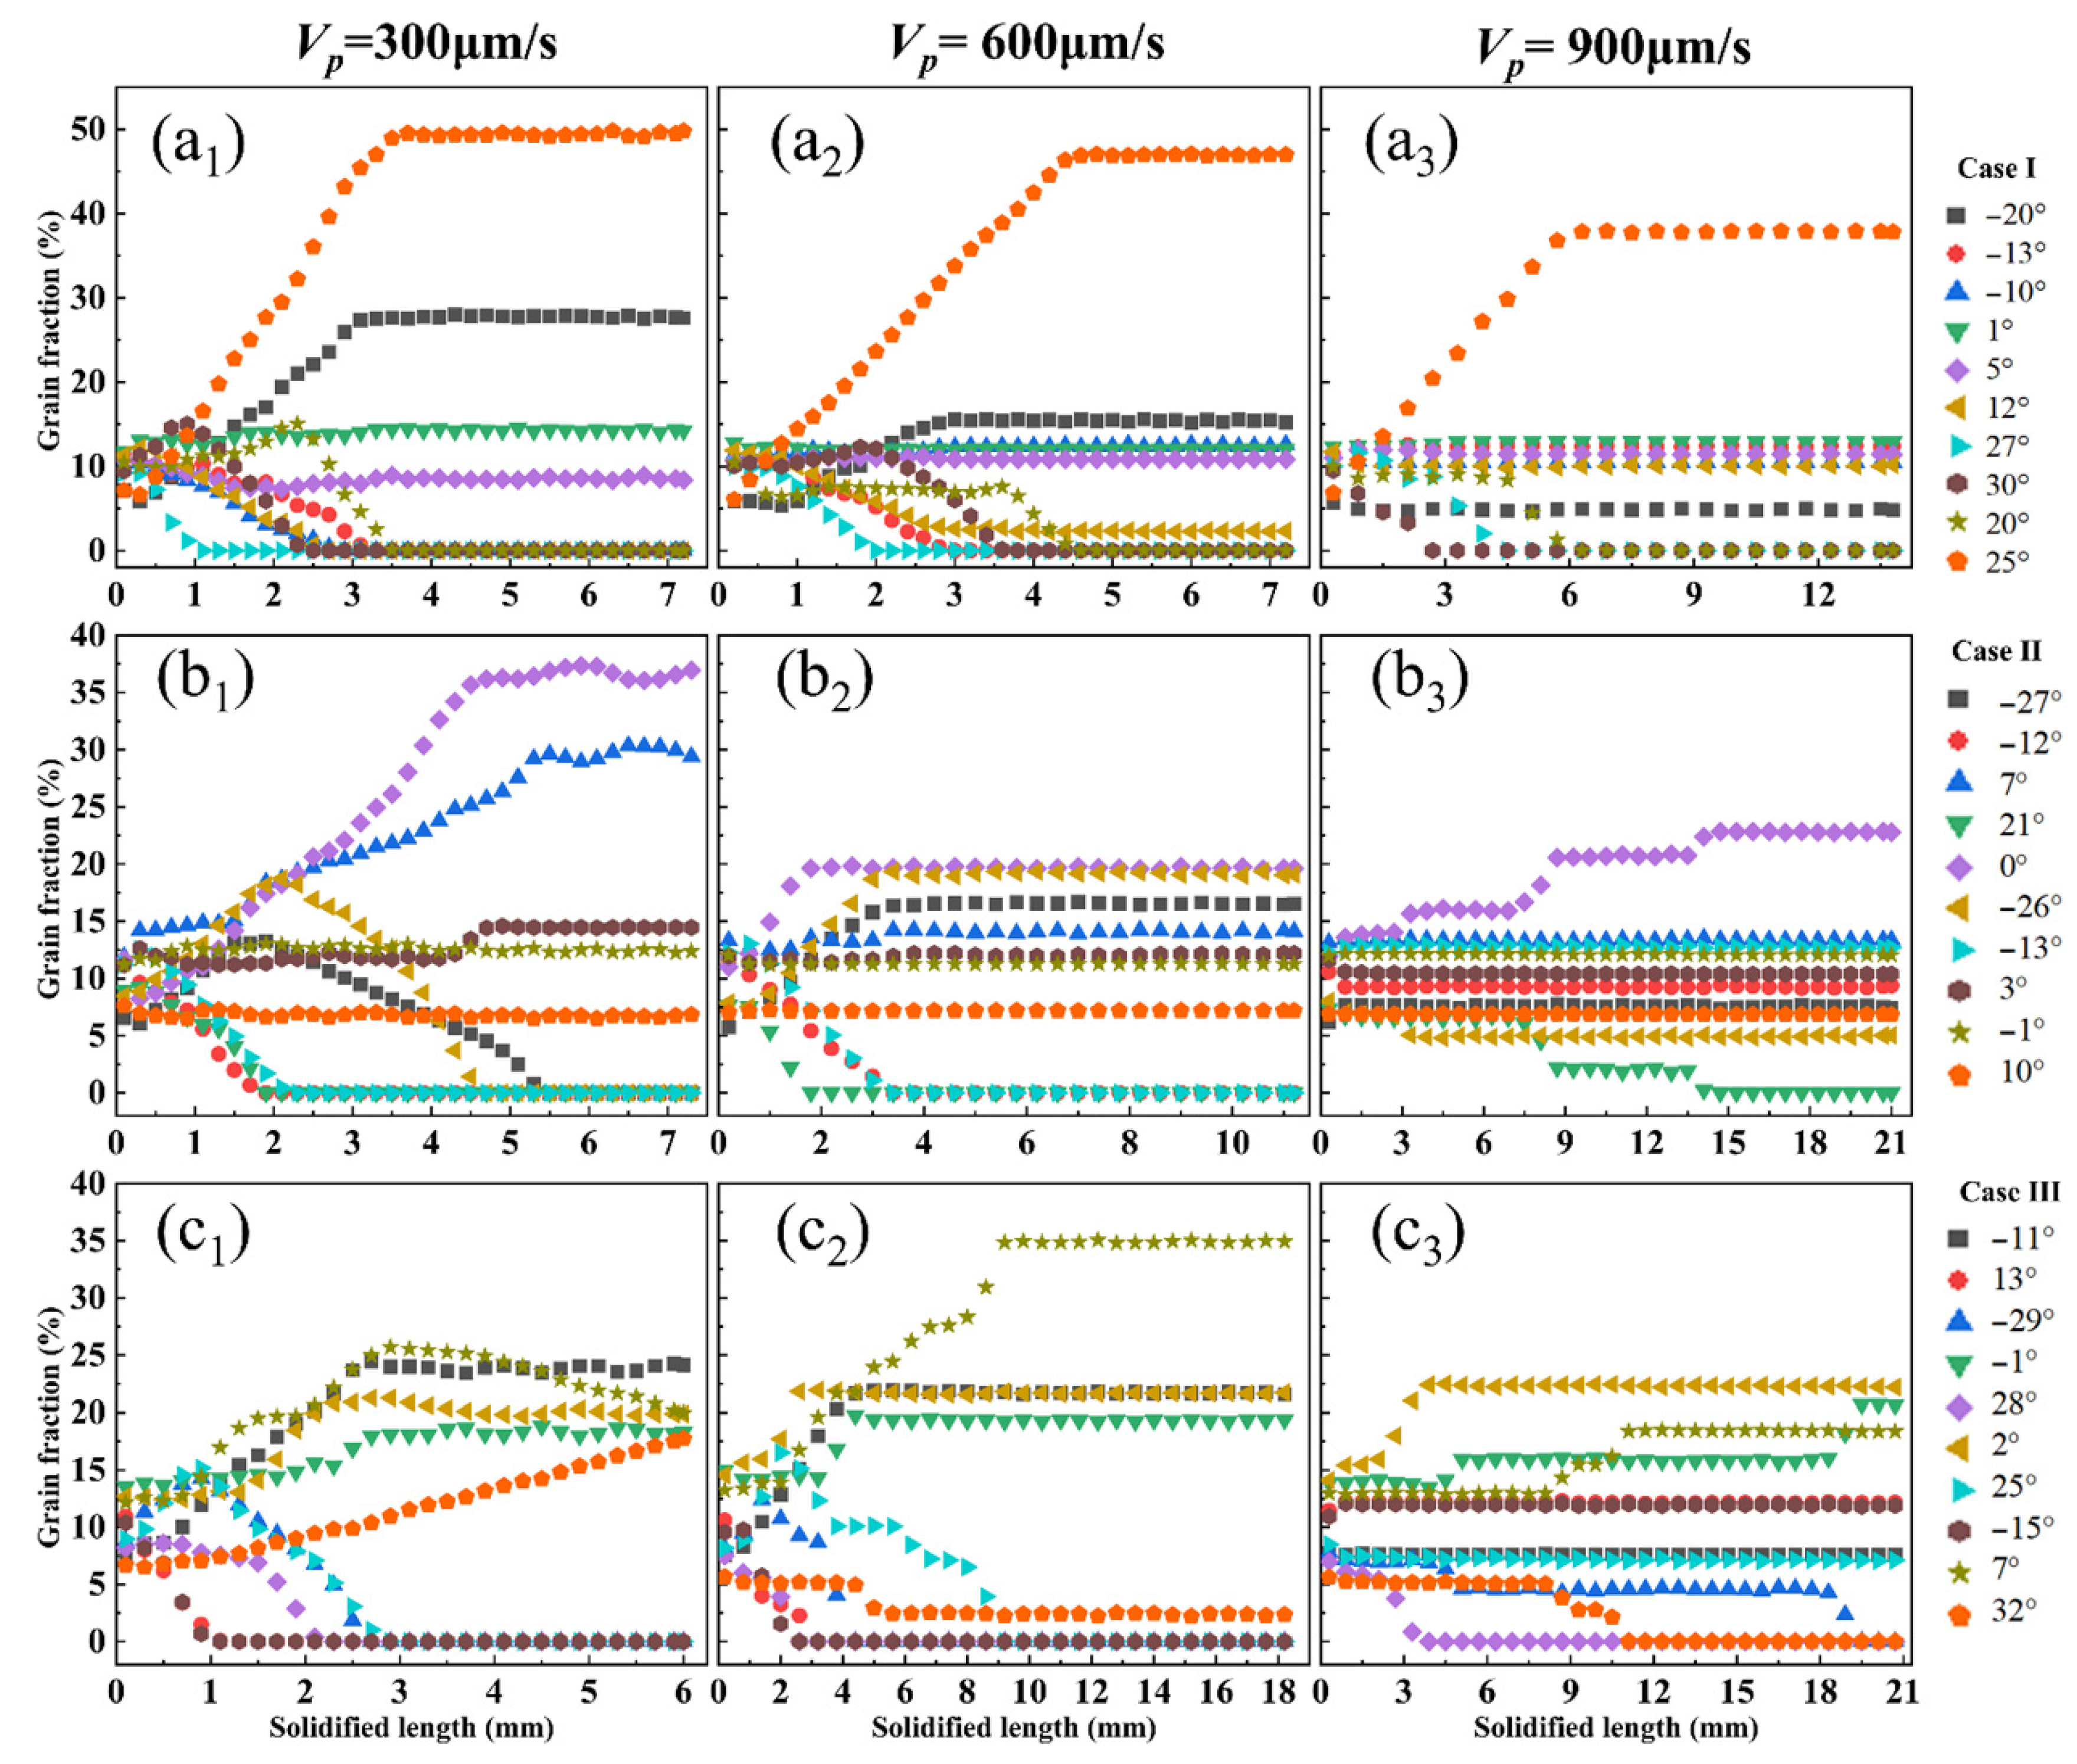
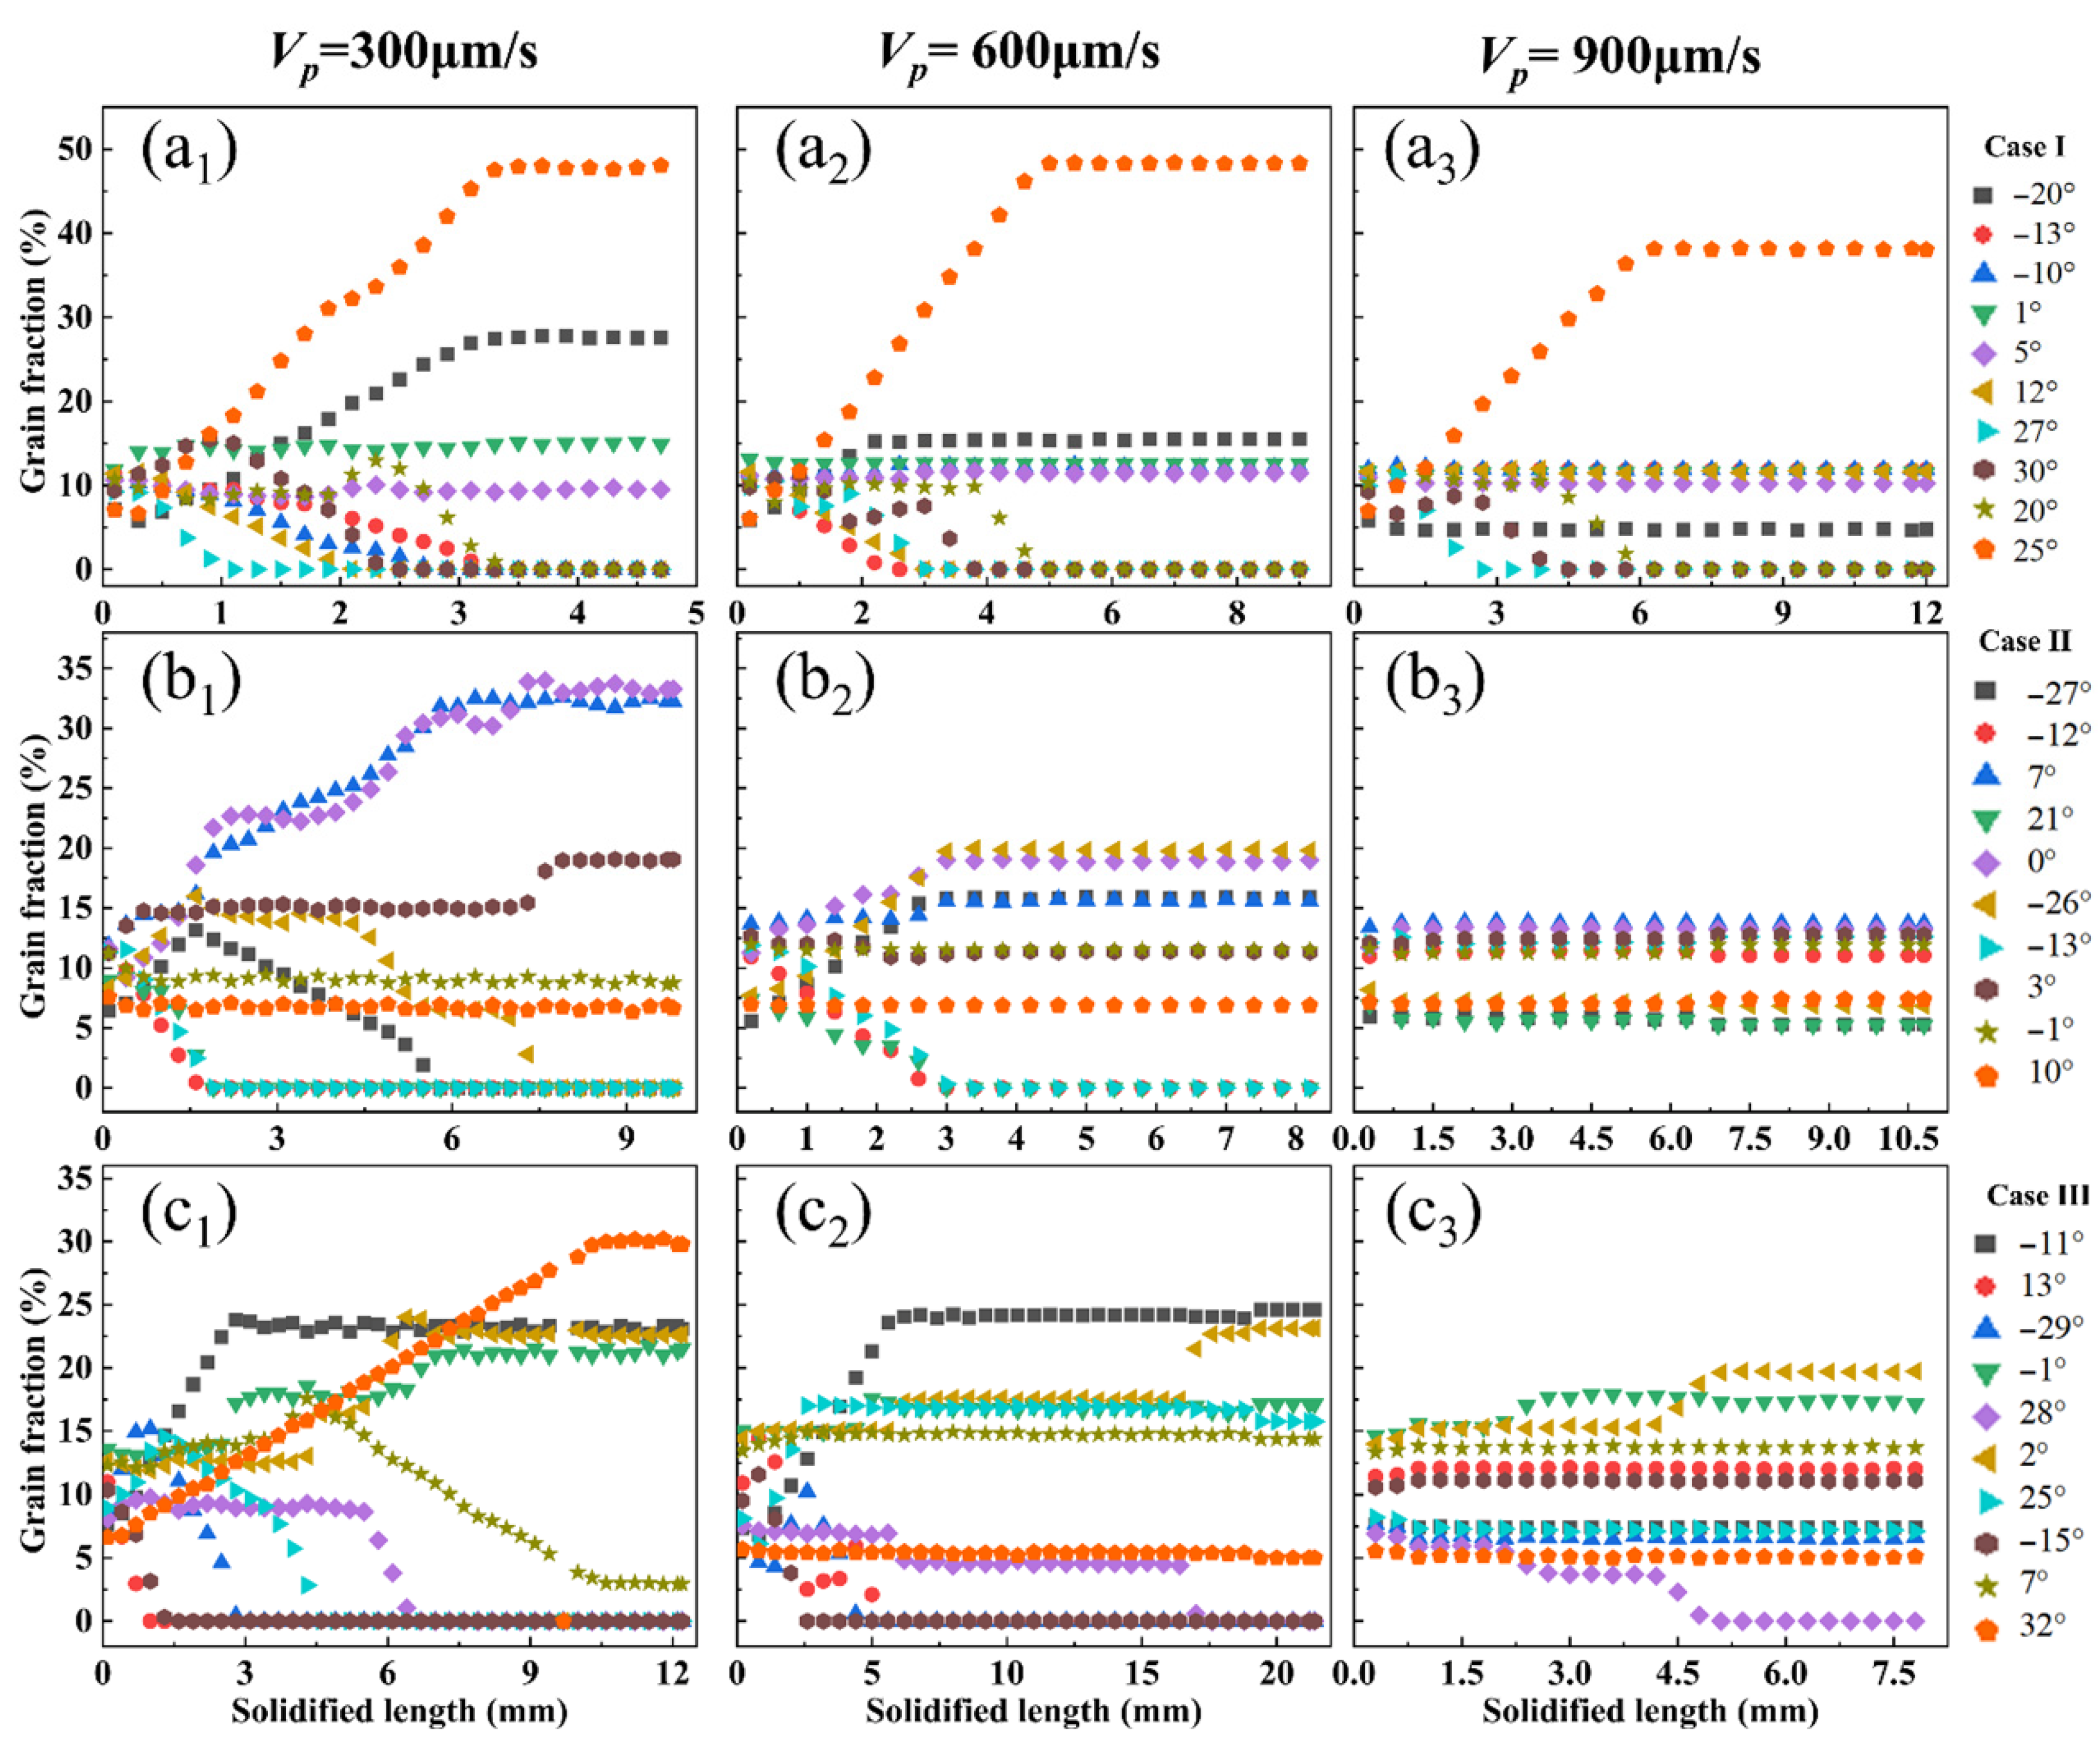
To conduct quantitative analysis of the elimination process of grains, one can measure the space occupied by them by calculating the area of different orientations of dendrites in the current snapshot at different times. The specific calculation method is to conduct a count every 20,000 steps, and express the volume fraction of a dendrite of a certain orientation in the current snapshot as the area of that dendrite divided by the total area of all dendrites. F r a i = S i / j n S j (j = 1…10). The statistical results are shown in Figure 6 and Figure 7.
From Figure 6, it can be seen that the volume fraction of dendrites varies under different pulling speeds. For the three grain configurations, as the pulling speed increases, the volume fractions of dendrites in each orientation gradually become the same. This is because during the growth process, the actual growth direction of dendrites will change towards the direction of heat flow. As the pulling speed increases, the orientation difference between dendrites decreases, making it easier for dendrites of different orientations to coexist. In Figure 6(a1–a3), under three different pulling speeds, the dendrite volume fraction curves show a high degree of similarity, indicating that the change in pulling speed has little effect on the dendrite competition relationship in Case I. For Figure 6(b1–b3), when the pulling speeds are VP = 300 μm/s and VP = 600 μm/s, the dendrite volume fraction curves remain similar, but a significant change occurs at VP = 900 μm/s. In Figure 6(c1–c3), the dendrite volume fraction curves under different pulling speeds show significant differences. This difference may be due to the large orientation difference in adjacent dendrites in Case III, and the change in pulling speed causes a greater deviation in dendrite orientation, thereby having a more significant impact on the multi-crystal competitive growth.
By comparing Figure 6 and Figure 7, it can be observed that in Case I, for the three different pulling speeds, the change in the expansion coefficient has a relatively small impact on the magnitude and trend of the dendrite volume fraction. However, in Case II, although different expansion coefficients have little effect on the final result of dendrite competitive growth, they have a significant impact on the dendrite growth process. At VP = 300 μm/s and VP = 900 μm/s, the changes in some dendrite volume fractions show significantly different processes, and this phenomenon is more prominent in Case III. By comparing the solidification lengths when dendrite growth reaches a steady state under different grain configurations and solute expansion coefficients, it is found that in Case I, as the pulling speed increases, the solidification length of dendrites also shows an increasing trend, while the change in the expansion coefficient has a relatively smaller impact on the solidification length. In contrast, in Case II, when the expansion coefficient β = −0.03, the solidification length is the largest when the pulling speed is VP = 300 μm/s, and the smallest when VP = 600 μm/s; when the expansion coefficient β = −0.1, as the pulling speed increases, the solidification length of dendrites gradually increases. Moreover, an increase in the expansion coefficient causes the solidification length of VP = 300 μm/s to decrease, while the solidification lengths of VP = 600 μm/s and VP = 900 μm/s increase. This phenomenon differs significantly from the results in Case I and does not show a clear regularity. These results indicate that the grain configuration has a significant impact on the solidification length when dendrite growth reaches a steady state, and excessive orientation differences make it difficult to summarize the growth rules of dendrites.

4.3. Influencing Factors of Flow Field Intensity

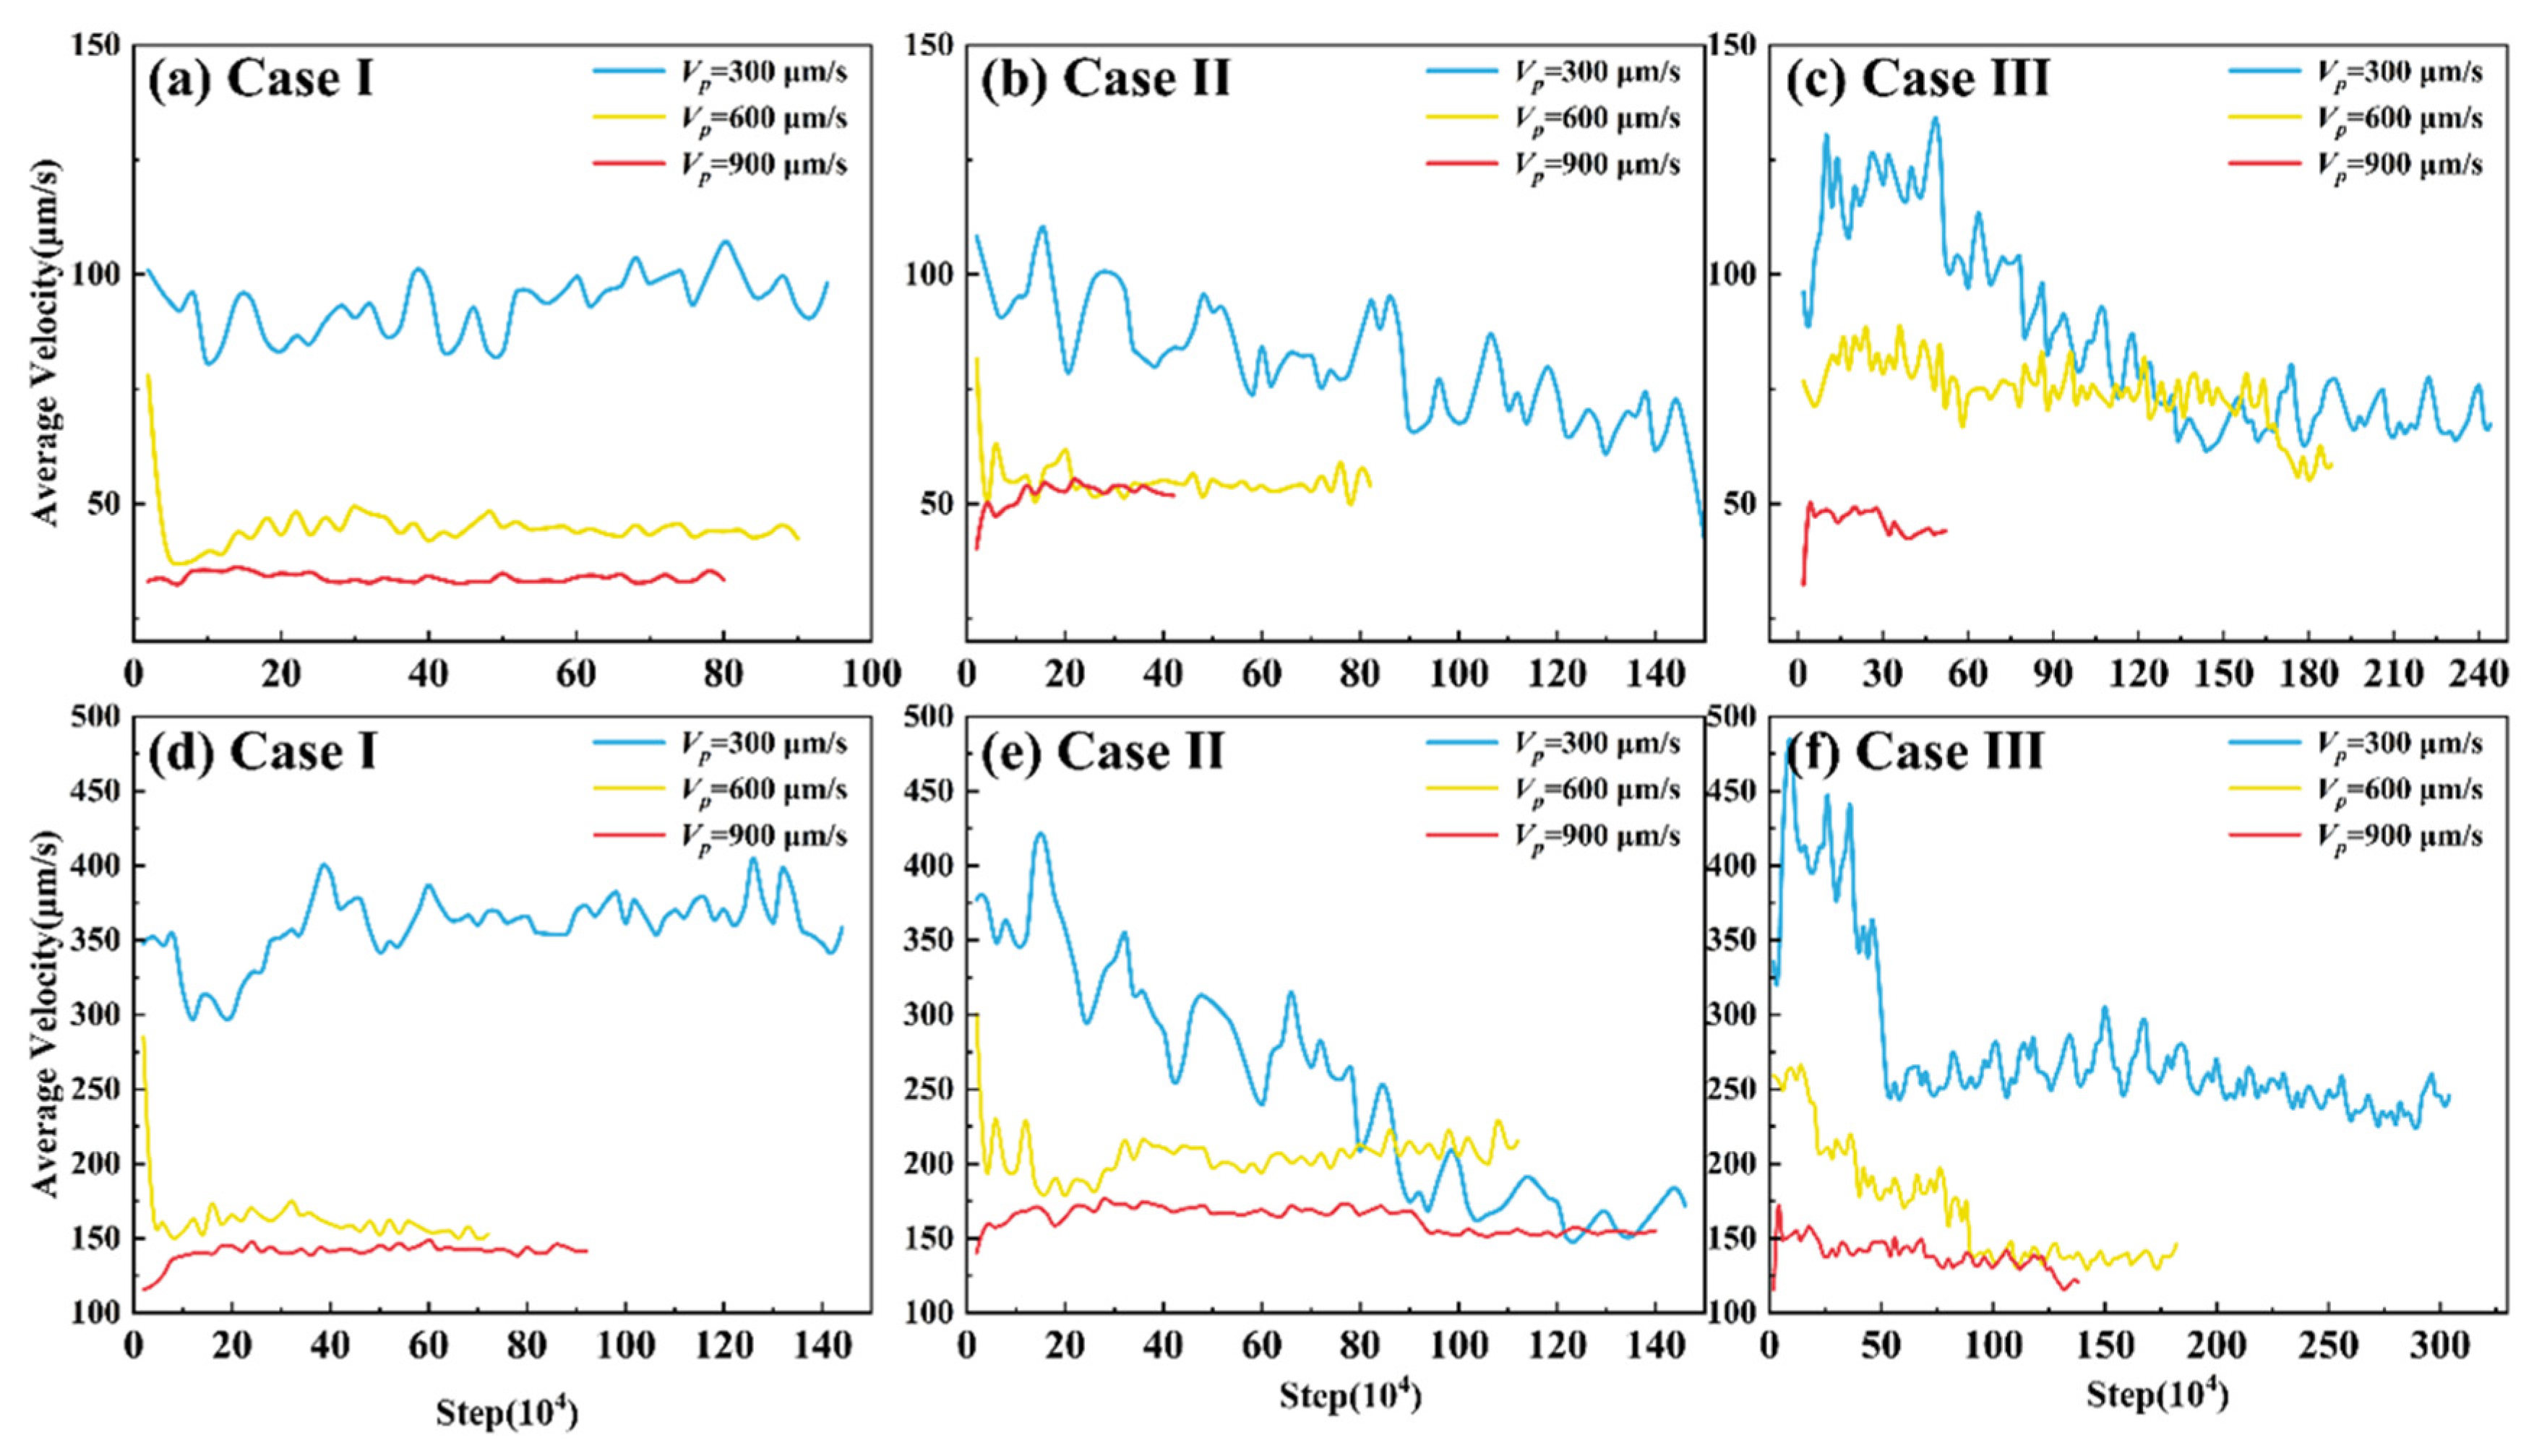
Figure 8 shows the statistical diagram of flow field intensity during the growth of dendrites under different grain configurations and pulling speeds. Since the solute distribution is uniform in the liquid phase area away from the solid–liquid interface during the solidification process, the flow field intensity is small and can be neglected for the disturbance to dendrite growth. Therefore, the flow field intensity statistically calculated is the average velocity within 150Δy of the liquid phase area in front of the solid–liquid interface during the initial stage of solidification until the dendrite growth reaches a steady state.
As can be seen from Figure 4, under the same grain configuration and solute expansion coefficient, the flow field intensity significantly decreases with the increase in pulling speed. Combining the flow field vector lines in Figure 8a–c, it can be found that vortices often form at the dendrite tips and grain boundaries. The larger the distance between primary dendrites, the greater the vortex intensity. And the greater the orientation difference between the two dendrites at the grain boundary, the greater the vortex intensity. Moreover, the vortex intensity at the grain boundary is significantly greater than that at the dendrite tip. With the increase in pulling speed, the distance between primary dendrites decreases, resulting in a reduction in the intensity of the vortex at the dendrite tip. Therefore, in high pulling speed conditions, the flow field intensity is smaller. From Figure 8b, it can be seen that at VP = 300 μm/s and VP = 600 μm/s, the flow field intensity is relatively large in the initial stage of dendrite growth. With the competition growth between dendrites, the flow field intensity gradually decreases. This is because in the initial stage of growth, the dendrites have not been eliminated, and there are more grain boundaries, so the vortex is more intense, thereby resulting in a larger flow field intensity. As the dendrites gradually grow and eliminate some dendrites, the number of grain boundaries decreases, and the vortex intensity also decreases, resulting in a decrease in flow field intensity. At VP = 900 μm/s, due to the short time for dendrite growth to reach a steady state and the deviation of the actual growth direction of the dendrites, the orientation difference between the two dendrites at the grain boundary is small, resulting in fewer and lower-intensity vortices formed, and thus a lower flow field intensity, which can quickly reach stability.

4.4. Influence of Flow Field on Solute Field

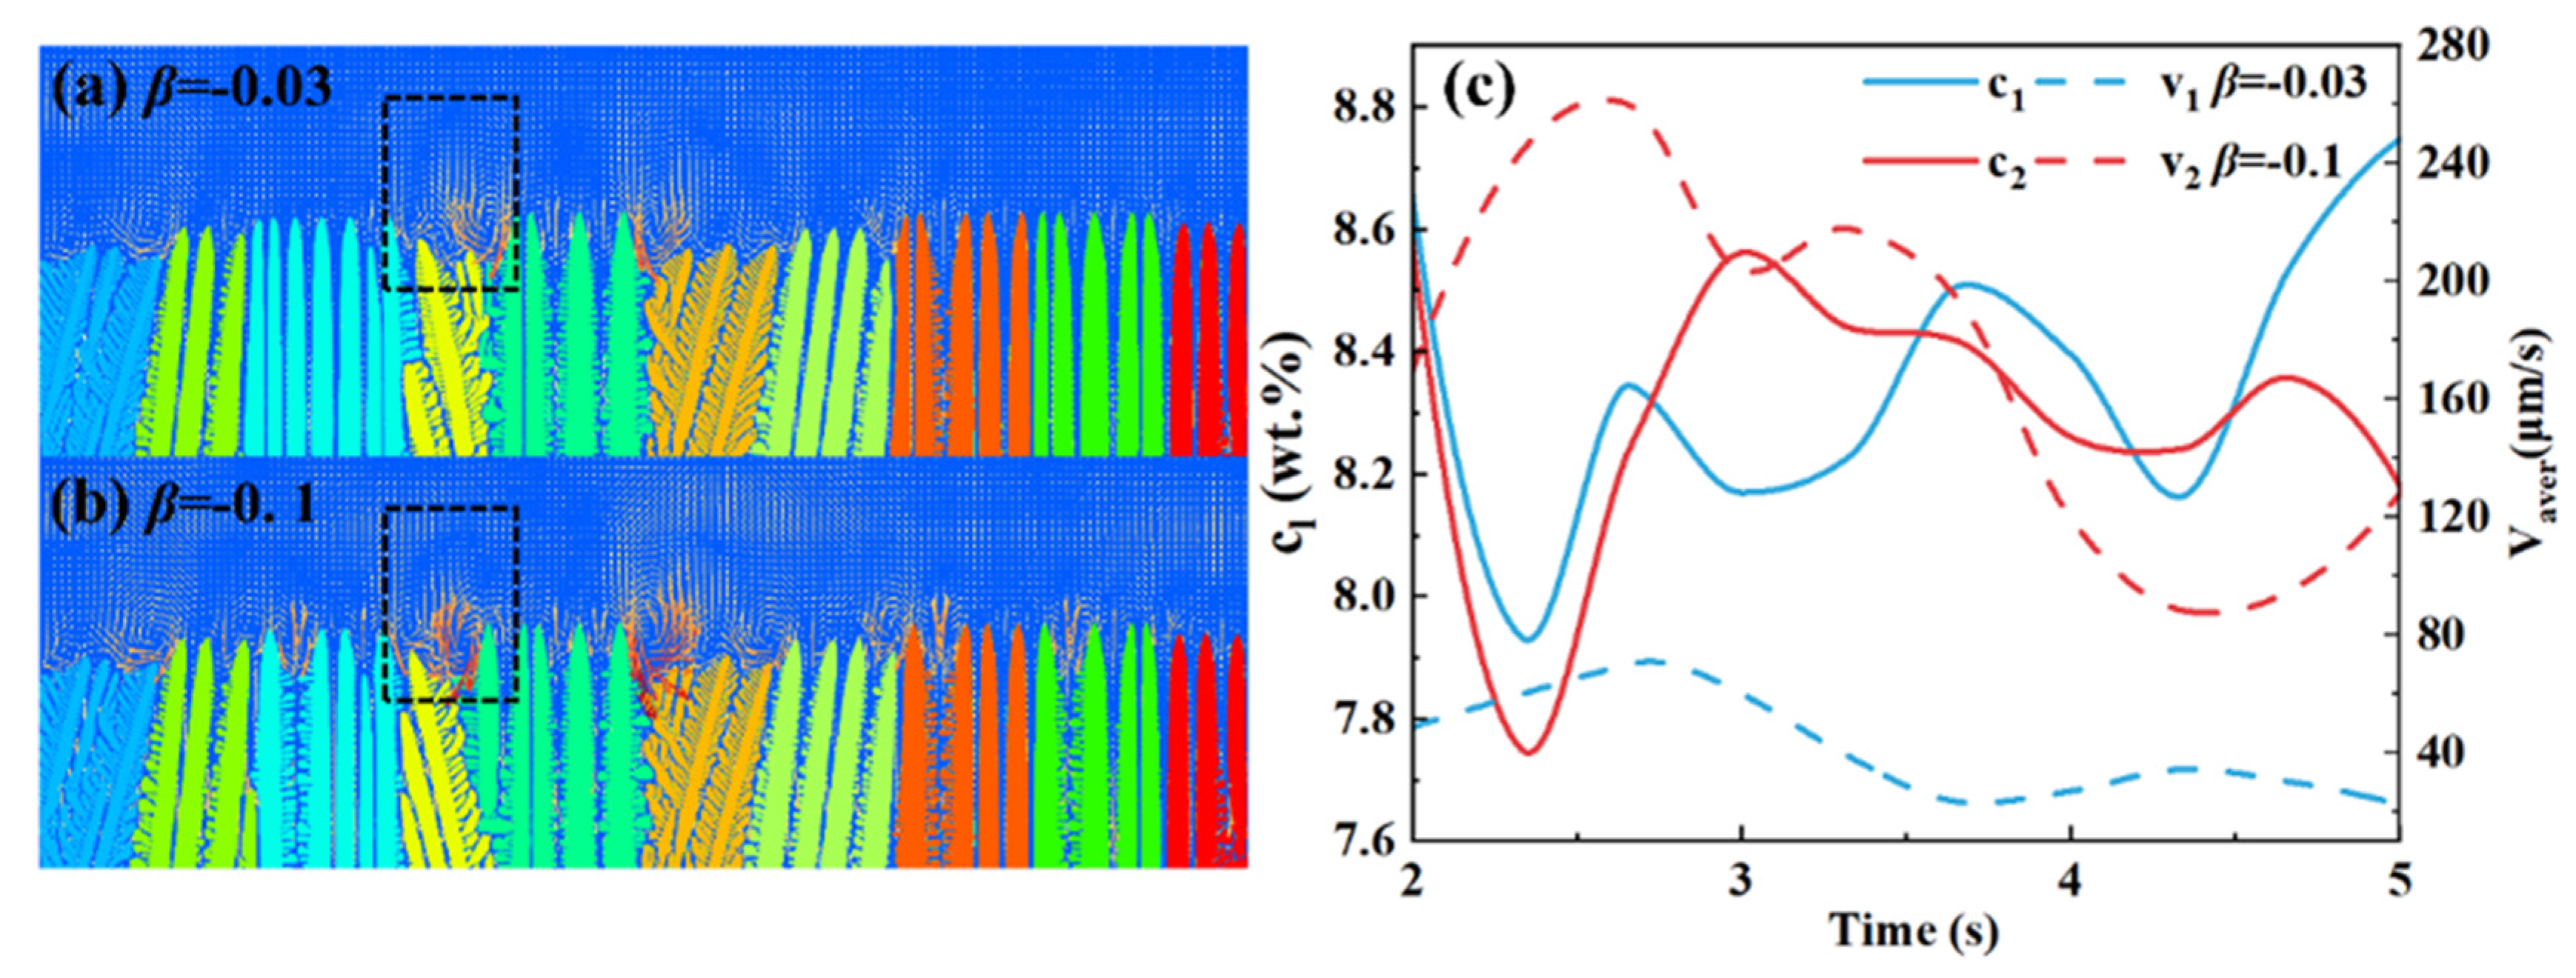
To analyze how the flow field affects the multi-crystal competitive growth, the flow field intensity and liquid phase solute concentration above the θ0 = 21° dendrite in Case II, VP = 600 μm/s, from 2 s to 5 s were statistically analyzed. The interaction between the flow field and the concentration field was studied to clarify how the liquid phase relative to the flow affects dendrite growth in multi-crystal competitive growth.
The flow field intensity shown in Figure 9 is calculated as the average value within the statistical region. The black dotted lines in Figure 9a,b represent the statistical areas. Figure 9c shows the statistical results. As shown in Figure 9c, when the solute expansion coefficient β = −0.03, the average concentration of the liquid phase solute and the average flow field intensity in this area show a negative correlation. When the flow field increases, the concentration decreases, and vice versa; the statistical results for β = −0.1 are similar, indicating that the interaction between the flow field and the liquid phase solute affects dendrite growth. During the dendrite growth process, the solute precipitates from the solid phase, resulting in a concentration gradient at the dendrite tip and the liquid phase region, generating liquid relative flow. The fluid accelerates the interaction of solute at the dendrite tip, causing a decrease in solute concentration and a decrease in flow field intensity. At this time, the dendrite growth speed is affected by the solute field. As the dendrite grows and the flow field intensity decreases, the influence of convection on the solute concentration weakens and gradually increases. The concentration gradient at the dendrite tip increases, and the concentration gradient in the liquid phase region also increases, causing the flow field intensity to gradually increase. Due to this mutual influence between the flow field and the liquid phase solute, periodic fluctuations occur in the flow field intensity and solute concentration. Specifically, both solute concentration curves demonstrate clear, repeatable cyclic fluctuations characterized by successive troughs and peaks. The average velocity curves further corroborate this periodicity, with their oscillatory behavior tightly coupled to the concentration fluctuations.
In the present study, we have focused on problem-specific quantitative metrics that directly reflect the competitive grain growth behaviour under natural convection. Furthermore, some classical dimensionless numbers will be attempted in our future research, even though this task is a challenging one.

5. Conclusions

This study simulated the microstructure evolution process of multi-oriented dendrite competition growth under different grain configurations, pulling speeds, and solute expansion coefficients. It investigated the competition growth behavior of multi-oriented dendrites under different conditions, analyzed the influence of the flow field on the growth of multi-oriented dendrites, and clarified the underlying reasons. The main conclusions are as follows:
(1)
During the competition growth of multi-oriented dendrites, the competition process and results are affected by the solute expansion coefficient. Under the specific orientation distributions examined in this study, dendrites with a larger FO angle θ0 are more likely to be eliminated under a larger solute expansion coefficient, and the elimination speed is faster. Moreover, the grain configuration with a larger orientation difference between adjacent dendrites is more susceptible to the influence of the solute expansion coefficient change, while the opposite is less affected.
(2)
As the dendrite competition growth and pulling speed increase, the flow field intensity gradually decreases. At the dendrite tip and crystal boundary, vortices form, increasing the flow field intensity. As the dendrite competition grows, some dendrites are eliminated, the crystal boundaries decrease, and the flow field intensity decreases. With an increase in the pulling speed, the arm spacing of the dendrite decreases, and the dendrite tip finds it difficult to form vortices, resulting in a decrease in the flow field intensity.
(3)
During dendrite growth, solute precipitates from the solid phase, causing a concentration gradient between the dendrite tip and the liquid phase region, which then triggers liquid relative flow. Liquid relative flow accelerates the interaction of solute, gradually reducing the concentration gradient and causing the flow field intensity to decrease. The interaction between the flow field and the liquid phase solute causes periodic fluctuations in the flow field intensity and solute concentration.

Author Contributions

Conceptualization, C.G.; Methodology, Q.Y., H.Z. (Huaxiang Zha), C.G. and Y.F.; Software, X.D.; Formal analysis, Q.Y., H.Z. (Huaxiang Zha), J.L., H.Z. (Hongliang Zhao) and S.Z.; Writing—original draft, Q.Y. and H.Z. (Huaxiang Zha); Writing—review & editing, Q.Y., H.Z. (Huaxiang Zha) and C.G.; Supervision, J.L., H.Z. (Hongliang Zhao), S.Z., X.D. and Y.F.; Project administration, C.G.; Funding acquisition, C.G. All authors have read and agreed to the published version of the manuscript.

Funding

This work was financially supported by the National Natural Science Foundation of China (52301065, 52471017) and Open Project of State Key Laboratory of Solidification Processing (SKLSP202405).

Data Availability Statement

The original contributions presented in this study are included in the article. Further inquiries can be directed to the corresponding author.

Conflicts of Interest

The authors declare no conflict of interest.

References

  1. Selvaraj, S.K.; Sundaramali, G.; Jithin Dev, S.; Srii Swathish, R.; Karthikeyan, R.; Vijay Vishaal, K.E.; Paramasivam, V. Recent Advancements in the Field of Ni-Based Superalloys. Adv. Mater. Sci. Eng. 2021, 2021, 9723450. [Google Scholar] [CrossRef]
  2. Gudivada, G.; Pandey, A.K. Recent developments in nickel-based superalloys for gas turbine applications: Review. J. Alloys Compd. 2023, 963, 171128. [Google Scholar] [CrossRef]
  3. Liu, X.; Long, A.; Zhang, H.; Ma, D.; Song, M.; Wu, M.; Guo, J. Study on the γ/γ′ Eutectic Inhomogeneity of a Novel 3rd Generation Nickel-Based Single-Crystal Superalloy Casting. Materials 2025, 18, 4872. [Google Scholar] [CrossRef] [PubMed]
  4. Zhang, Y.; Wen, G.; Li, L.; Lei, Z.; Qi, X.; Huang, B.; Su, Y.; Zhang, Z.; Nie, X.; Zhang, Z. The Generation, Measurement, Prediction, and Prevention of Residual Stress in Nickel-Based Superalloys: A Review. Machines 2024, 12, 715. [Google Scholar] [CrossRef]
  5. Yu, F.; Luo, X.; Li, J.C. Molecular dynamics study on defect evolution during the plastic deformation of nickel-based superalloy GH4169 single crystal under different rolling temperatures. RSC Adv. 2023, 13, 16880–16888. [Google Scholar] [CrossRef]
  6. Mostafaei, A.; Ghiaasiaan, R.; Ho, I.-T.; Strayer, S.; Chang, K.-C.; Shamsaei, N.; Shao, S.; Paul, S.; Yeh, A.-C.; Tin, S.; et al. Additive manufacturing of nickel-based superalloys: A state-of-the-art review on process-structure-defect-property relationship. Prog. Mater. Sci. 2023, 136, 101108. [Google Scholar] [CrossRef]
  7. Kindrachuk, V.M.; Kamachali, R.D. Mean-field modeling and Phase-field simulation of Grain Growth under Directional driving forces. Materialia 2024, 33, 101989. [Google Scholar] [CrossRef]
  8. Chen, S.; Zhang, F.; Sha, Y.; Chen, X.; Zuo, L. Numerical and Experimental Investigation of Orientation Deviation in Shear Band in Grain-Oriented Silicon Steel. Materials 2025, 18, 2229. [Google Scholar] [CrossRef]
  9. Wang, J.; Liang, J.; Zhang, D.; Peng, Y.; Wen, Z. The effect of small orientation deviation from [001] to [011] on high-temperature creep properties of nickel-based single crystal. Int. J. Plast. 2023, 166, 103648. [Google Scholar] [CrossRef]
  10. Lu, H.; Wang, J.; Lian, Y.; Wen, Z.; Liu, T.; Yue, Z. Effect of orientation deviation on random vibration fatigue behavior of nickel based single crystal superalloy. Int. J. Fatigue 2023, 177, 107930. [Google Scholar] [CrossRef]
  11. Dai, H.J.; DSouza, N.; Dong, H.B. Grain Selection in Spiral Selectors During Investment Casting of Single-Crystal Turbine Blades: Part I. Experimental Investigation. Metall. Mater. Trans. A 2011, 42, 3430–3438. [Google Scholar] [CrossRef]
  12. Rappaz, M.; Gandin, C.A.; Desbiolles, J.L.; Thévoz, P. Prediction of grain structures in various solidification processes. Metall. Mater. Trans. A 1996, 27, 695–705. [Google Scholar] [CrossRef]
  13. D’souza, N.; Ardakani, M.G.; Wagner, A.; Shollock, B.A.; Mclean, M. Morphological aspects of competitive grain growth during directional solidification of a nickel-base superalloy, CMSX4. J. Mater. Sci. 2002, 37, 481–487. [Google Scholar] [CrossRef]
  14. Zhou, Y.Z.; Volek, A.; Green, N.R. Mechanism of competitive grain growth in directional solidification of a nickel-base superalloy. Acta Mater. 2008, 56, 2631–2637. [Google Scholar] [CrossRef]
  15. Li, J.; Wang, Z.; Wang, Y.; Wang, J. Phase-field study of competitive dendritic growth of converging grains during directional solidification. Acta Mater. 2012, 60, 1478–1493. [Google Scholar] [CrossRef]
  16. Tourret, D.; Song, Y.; Clarke, A.J.; Karma, A. Grain growth competition during thin-sample directional solidification of dendritic microstructures: A phase-field study. Acta Mater. 2017, 122, 220–235. [Google Scholar] [CrossRef]
  17. Guo, C.; Li, J.; Yu, H.; Wang, Z.; Lin, X.; Wang, J. Branching-induced grain boundary evolution during directional solidification of columnar dendritic grains. Acta Mater. 2017, 136, 148–163. [Google Scholar] [CrossRef]
  18. Takaki, T.; Ohno, M.; Shibuta, Y.; Sakane, S.; Shimokawabe, T.; Aoki, T. Two-dimensional phase-field study of competitive grain growth during directional solidification of polycrystalline binary alloy. J. Cryst. Growth 2016, 442, 14–24. [Google Scholar] [CrossRef]
  19. Li, F.; Zhou, L.; Xie, Y.; Zhang, J.; Dodgf, M.; Yin, F.; Sun, B. In situ observation of multi-grain competitive growth in Al-20wt.%Cu and establishment of converging-case dendrite elimination model. Trans. Nonferrous Met. Soc. China 2024, 34, 2095–2107. [Google Scholar] [CrossRef]
  20. Zhu, C.; Zhu, M.; Liu, J.; Feng, L. Research on the calculation method of convection effects on three-dimensional dendritic growth based on LBM. J. Mech. Sci. Technol. 2017, 31, 4781–4787. [Google Scholar] [CrossRef]
  21. Lee, W.; Jeong, Y.; Lee, J.; Lee, H.; Kang, S.; Kim, Y.; Yoon, J. Numerical simulation for dendrite growth in directional solidification using LBM-CA (cellular automata) coupled method. J. Mater. Sci. Technol. 2020, 49, 15–24. [Google Scholar] [CrossRef]
  22. Rojas, R.; Takaki, T.; Ohno, M. A phase-field-lattice Boltzmann method for modeling motion and growth of a dendrite for binary alloy solidification in the presence of melt convection. J. Comput. Phys. 2015, 298, 29–40. [Google Scholar] [CrossRef]
  23. Guo, Y.; Luo, S.; Wang, W.; Zhu, M. A GPU-accelerated 3D PF-LBM modelling of multi-dendritic growth in an undercooled melt of Fe-C binary alloy. J. Mater. Res. Technol. 2022, 17, 2059–2072. [Google Scholar] [CrossRef]
  24. Zhang, D.; Yang, X.; Chen, Z.; Zhou, S. Influence of Anisotropy on Dendrite Growth Under Forced Convection. Foundry Technol. 2016, 37, 1676–1679. [Google Scholar]
  25. Zhang, Y.; Zhou, J.; Yin, Y.; Ji, X.; Shen, X.; Guo, Z. Study on the solutal convection during dendrite growth of superalloy under directional solidification condition. J. Mater. Res. Technol. 2023, 23, 3916–3927. [Google Scholar] [CrossRef]
  26. Takaki, T.; Sakane, S.; Ohno, M.; Shibuta, Y. Competitive growth during directional solidification of a binary alloy with natural convection: Two-dimensional phase-field study. Model. Simul. Mater. Sci. Eng. 2019, 27, 054001. [Google Scholar] [CrossRef]
  27. Guo, C.; Zha, H.; Wang, J.; Zhao, H.; Zhang, S.; Fan, Y.; Dong, X. Coupled PF and LB simulation study of morphology evolution in columnar dendrite growth induced by natural convection. Results Phys. 2025, 77, 108452. [Google Scholar] [CrossRef]
  28. Steinbach, I.; Pezzolla, F.; Nestler, B.; Seeßelberg, M.; Prieler, R.; Schmitz, G.; Rezende, J. A phase field concept for multiphase systems. Phys. D Nonlinear Phenom. 1996, 94, 135–147. [Google Scholar] [CrossRef]
  29. Kim, S.G.; Kim, W.T.; Suzuki, T.; Ode, M. Phase-field modeling of eutectic solidification. J. Cryst. Growth 2004, 261, 135–158. [Google Scholar] [CrossRef]
  30. Steinbach, I.; Pezzolla, F. A generalized field method for multiphase transformations using interface fields. Phys. D Nonlinear Phenom. 1999, 134, 385–393. [Google Scholar] [CrossRef]
  31. Kim, S.G. A phase-field model with antitrapping current for multicomponent alloys with arbitrary thermodynamic properties. Acta Mater. 2007, 55, 4391–4399. [Google Scholar] [CrossRef]
  32. Steinbach, I. Effect of interface anisotropy on spacing selection in constrained dendrite growth. Acta Mater. 2008, 56, 4965–4971. [Google Scholar] [CrossRef]
  33. Kim, S.G.; Kim, W.T.; Suzuki, T. Phase-field model for binary alloys. Phys. Rev. E 1999, 60, 7186–7197. [Google Scholar] [CrossRef]
  34. Takaki, T.; Rojas, R.; Sakane, S.; Ohno, M.; Shibuta, Y.; Shimokawabe, T.; Aoki, T. Phase-field-lattice Boltzmann studies for dendritic growth with natural convection. J. Cryst. Growth 2017, 474, 146–153. [Google Scholar] [CrossRef]
Figure 1. D2Q9 model.
Metals 16 00454 g001
Figure 2. Schematic diagram of nucleation sites and initial conditions for polycrystalline growth.
Metals 16 00454 g002
Figure 3. Evolution process under different expansion coefficients and pulling speeds for Case I: (ac) β = −0.03; (df) β = −0.1.
Metals 16 00454 g003
Figure 4. Evolution process under different expansion coefficients and pulling speeds for Case II: (ac) β = −0.03; (df) β = −0.1.
Metals 16 00454 g004
Figure 5. Evolution process with under different expansion coefficients and pulling speeds for Case III: (ac) β = −0.03; (df) β = −0.1.
Metals 16 00454 g005
Figure 6. Evolution of grain fractions of dendrites with different orientations for β = −0.03: (a1a3) Case I; (b1b3) Case II; (c1c3) Case III.
Metals 16 00454 g006
Figure 7. Evolution of grain fractions of dendrites with different orientations for β = −0.1: (a1a3) Case I; (b1b3) Case II; (c1c3) Case III.
Metals 16 00454 g007
Figure 8. Flow field intensity under different initial setting conditions: (ac) β = −0.03; (df) β = −0.1.
Metals 16 00454 g008
Figure 9. Evolution of flow and solute fields with grain configuration of Case II and VP = 600 μm/s: (a,b) computational domain; (c) flow field intensity and liquid solute concentration.
Metals 16 00454 g009
Table 1. Material parameters used in simulations.
ParameterSymbolValue
Liquidus line slopeme474 k/wt
Equilibrium distribution coefficientk0.5
Solid diffusion coefficientDS3 × 10−12 m2/s
Liquid diffusion coefficientDL3 × 10−9 m2/s
Initial concentrationc06.5 wt.%
Initial temperatureT01689 K
Nelting point temperature of nickelT1728 K
Liquid phase kinematic viscosityv8.2 × 10−7 m2/s
Liquid phase viscosityµ6.2 × 10⁻³ m2/s
Liquid densityp7620 kg/m3
Acceleration of gravityg9.8 m2/s
Table 2. Simulation conditions and configurations for polycrystalline competitive growth.
Seed No.Case ICase IICase III
Seed 1−20°−27°−11°
Seed 2−13°−12°13°
Seed 3−10°−29°
Seed 421°−1°
Seed 528°
Seed 612°−26°
Seed 727°−13°25°
Seed 830°−15°
Seed 920°−1°
Seed 1025°10°32°
Disclaimer/Publisher’s Note: The statements, opinions and data contained in all publications are solely those of the individual author(s) and contributor(s) and not of MDPI and/or the editor(s). MDPI and/or the editor(s) disclaim responsibility for any injury to people or property resulting from any ideas, methods, instructions or products referred to in the content.