


Abstract
The revelation of the distribution of twin boundaries on three-dimensional (3D) grains is of critical importance for the comprehension of their influence on material properties. However, this remains a significant challenge in the field of 3D material characterization. In this study, the distribution of twin boundaries on the surfaces of 3D grains in solution-annealed 316L stainless steel was systematically and quantitatively characterized using 3D electron backscatter diffraction. The results show that the average size of twin boundaries is significantly larger than that of random boundaries (approximately 52% larger). Although the size distributions of grains, random boundaries, and twin boundaries, as well as the distributions of the total number of grain boundaries and the number of twin boundaries per grain, all conform to a lognormal distribution, the area fraction of twin boundaries on grain surfaces exhibits a typical Lorentz distribution, while their number fraction shows no clear pattern. On average, each grain possesses 9.6 boundaries, of which 1.7 are twin boundaries, and the average area coverage of twin boundaries on grain surfaces reaches 38.4%. The findings offer a 3D statistical foundation for optimizing grain boundary engineering strategies in austenitic alloys.
1. Introduction
The study of twin boundaries (TBs) dates back to the early twentieth century [1]. Their distinctive morphological characteristics and interfacial structures have remained significant topics in crystallography and materials science [2]. In metals with medium-to-low stacking fault energy, such as austenitic stainless steels, annealing twins are widely present, providing a theoretical foundation for grain boundary (GB) engineering utilizing twin boundaries [3,4,5]. For instance, in the case of 316L stainless steel, the proportion of twin boundaries in conventional solution-annealed materials typically exceeds 30%. By employing grain boundary engineering techniques, it is possible to increase this proportion to over 65%, thereby significantly enhancing the material’s resistance to intergranular corrosion and stress corrosion cracking [6,7,8,9].
Despite more than a century of related research, certain knowledge gaps persist. For instance, the distribution pattern of twin boundaries on grain surfaces remains unclear. Conventional characterization techniques employing two-dimensional cross-sections, such as metallography and Electron Back-Scattered Diffraction (EBSD), are inadequate in capturing the spatial coverage of twin boundaries on grain surfaces and their topological relationship with random boundary networks [10,11,12,13]. In recent years, the rapid development of three-dimensional (3D) orientation imaging techniques [14,15,16], represented by 3D-EBSD, has made it possible to resolve the topological structure of 3D grain boundary networks [17,18,19]. This advancement has given rise to novel approaches for the comprehension of the spatial distribution of twin boundaries and their influence on material properties [20]. In light of the aforementioned background, the objective of this work is to elucidate the distribution patterns of twin boundaries on three-dimensional grains, thereby providing significant microstructural insights for the optimization of grain boundary engineering strategies and the development of high-performance austenitic stainless steels.
2. Materials and Methods
The material used in this study was a solution-annealed 316L stainless steel with the following chemical composition (wt. %) measured following ASTM A751 [21]: Cr 16.26, Ni 10.10, Mo 2.08, C 0.028, Si 0.47, Mn 1.03, P 0.044, S 0.005, and balance Fe. The composition conforms to the standard specification for 316L stainless steel (ASTM A240 [22]). The sample processing involved hot-rolling at 1000 °C with a 50% reduction in thickness followed by water quenching and subsequent solution treatment at 1000 °C for 0.5 h followed by water quenching. A rectangular specimen with dimensions of 10 mm × 15 mm × 20 mm was sectioned by wire-electrical discharge machining, and its surfaces were ground using water-fed abrasive papers.
Three-dimensional electron backscatter diffraction (3D-EBSD) data were acquired using the serial-sectioning technique. The workflow consisted of sequential mechanical polishing, measurement of thickness removal, fiducial marking of the region of interest, and EBSD mapping. This cycle was repeated 101 times to obtain a stack of parallel 2D-EBSD sections. Precise mechanical polishing was critical for successful 3D reconstruction. Each polishing step was performed under a constant load and rotation speed (100 r/min) for a fixed duration (20 min) to achieve a targeted material removal per layer. A Buehler 40-7920 polishing cloth with a 0.05 μm alumina suspension was used to produce a strain-free, mirror-like surface suitable for EBSD analysis. The combination of Buehler 40-7920 polishing cloth and 0.05 μm alumina suspension is a standard metallographic preparation protocol for obtaining deformation-free surfaces on stainless steels for EBSD analysis. This combination was selected based on established literature and our extensive prior experience with EBSD sample preparation [17,23]. The fixed polishing time (20 min) and pressure were determined through iterative testing to achieve consistent material removal (~2.5 μm per cycle) while maintaining surface quality.
EBSD maps were acquired with a step size of 2.5 μm, yielding pattern indexing percentages between 80% and 95%. The intended step size along the Z-direction (section thickness) was 2.5 μm. The actual thicknesses for the 101 sections varied from 1 to 5 μm, with 64% of the thicknesses falling within the 2–3 μm range, resulting in an average thickness of 2.55 μm. The step size was selected as a compromise between resolution and acquisition time/volume. With an average grain diameter of 41.4 μm, the step size corresponds to approximately 1/16 of the average grain diameter, which is well within the recommended range (1/10 to 1/20) for reliable grain boundary characterization.
The collected 2D-EBSD data were reconstructed into a 3D volume using Dream3D software6.5.133 [15,24]. The reconstruction pipeline included data alignment, noise reduction, grain segmentation, grain boundary extraction, twin boundary identification, and surface smoothing. Detailed parameters used in the reconstruction pipeline, including alignment algorithm, grain segmentation thresholds, and surface smoothing settings, have been previously documented in the Supplementary Data of our earlier publication [23]. ParaView software 5.4.1 was employed for 3D visualization and rendering of the microstructure, with grains and boundaries colored accordingly. Quantitative analysis of 3D microstructural features, such as grain size, grain boundary area, and the number of total boundaries as well as twin boundaries per grain, was performed using customized Matlab R2017b routines in conjunction with outputs from Dream3D [17]. Twin boundaries were identified according to the Brandon criterion [25].
3. Results and Discussion
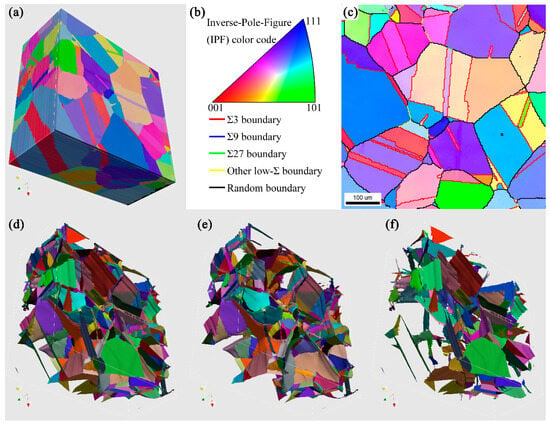
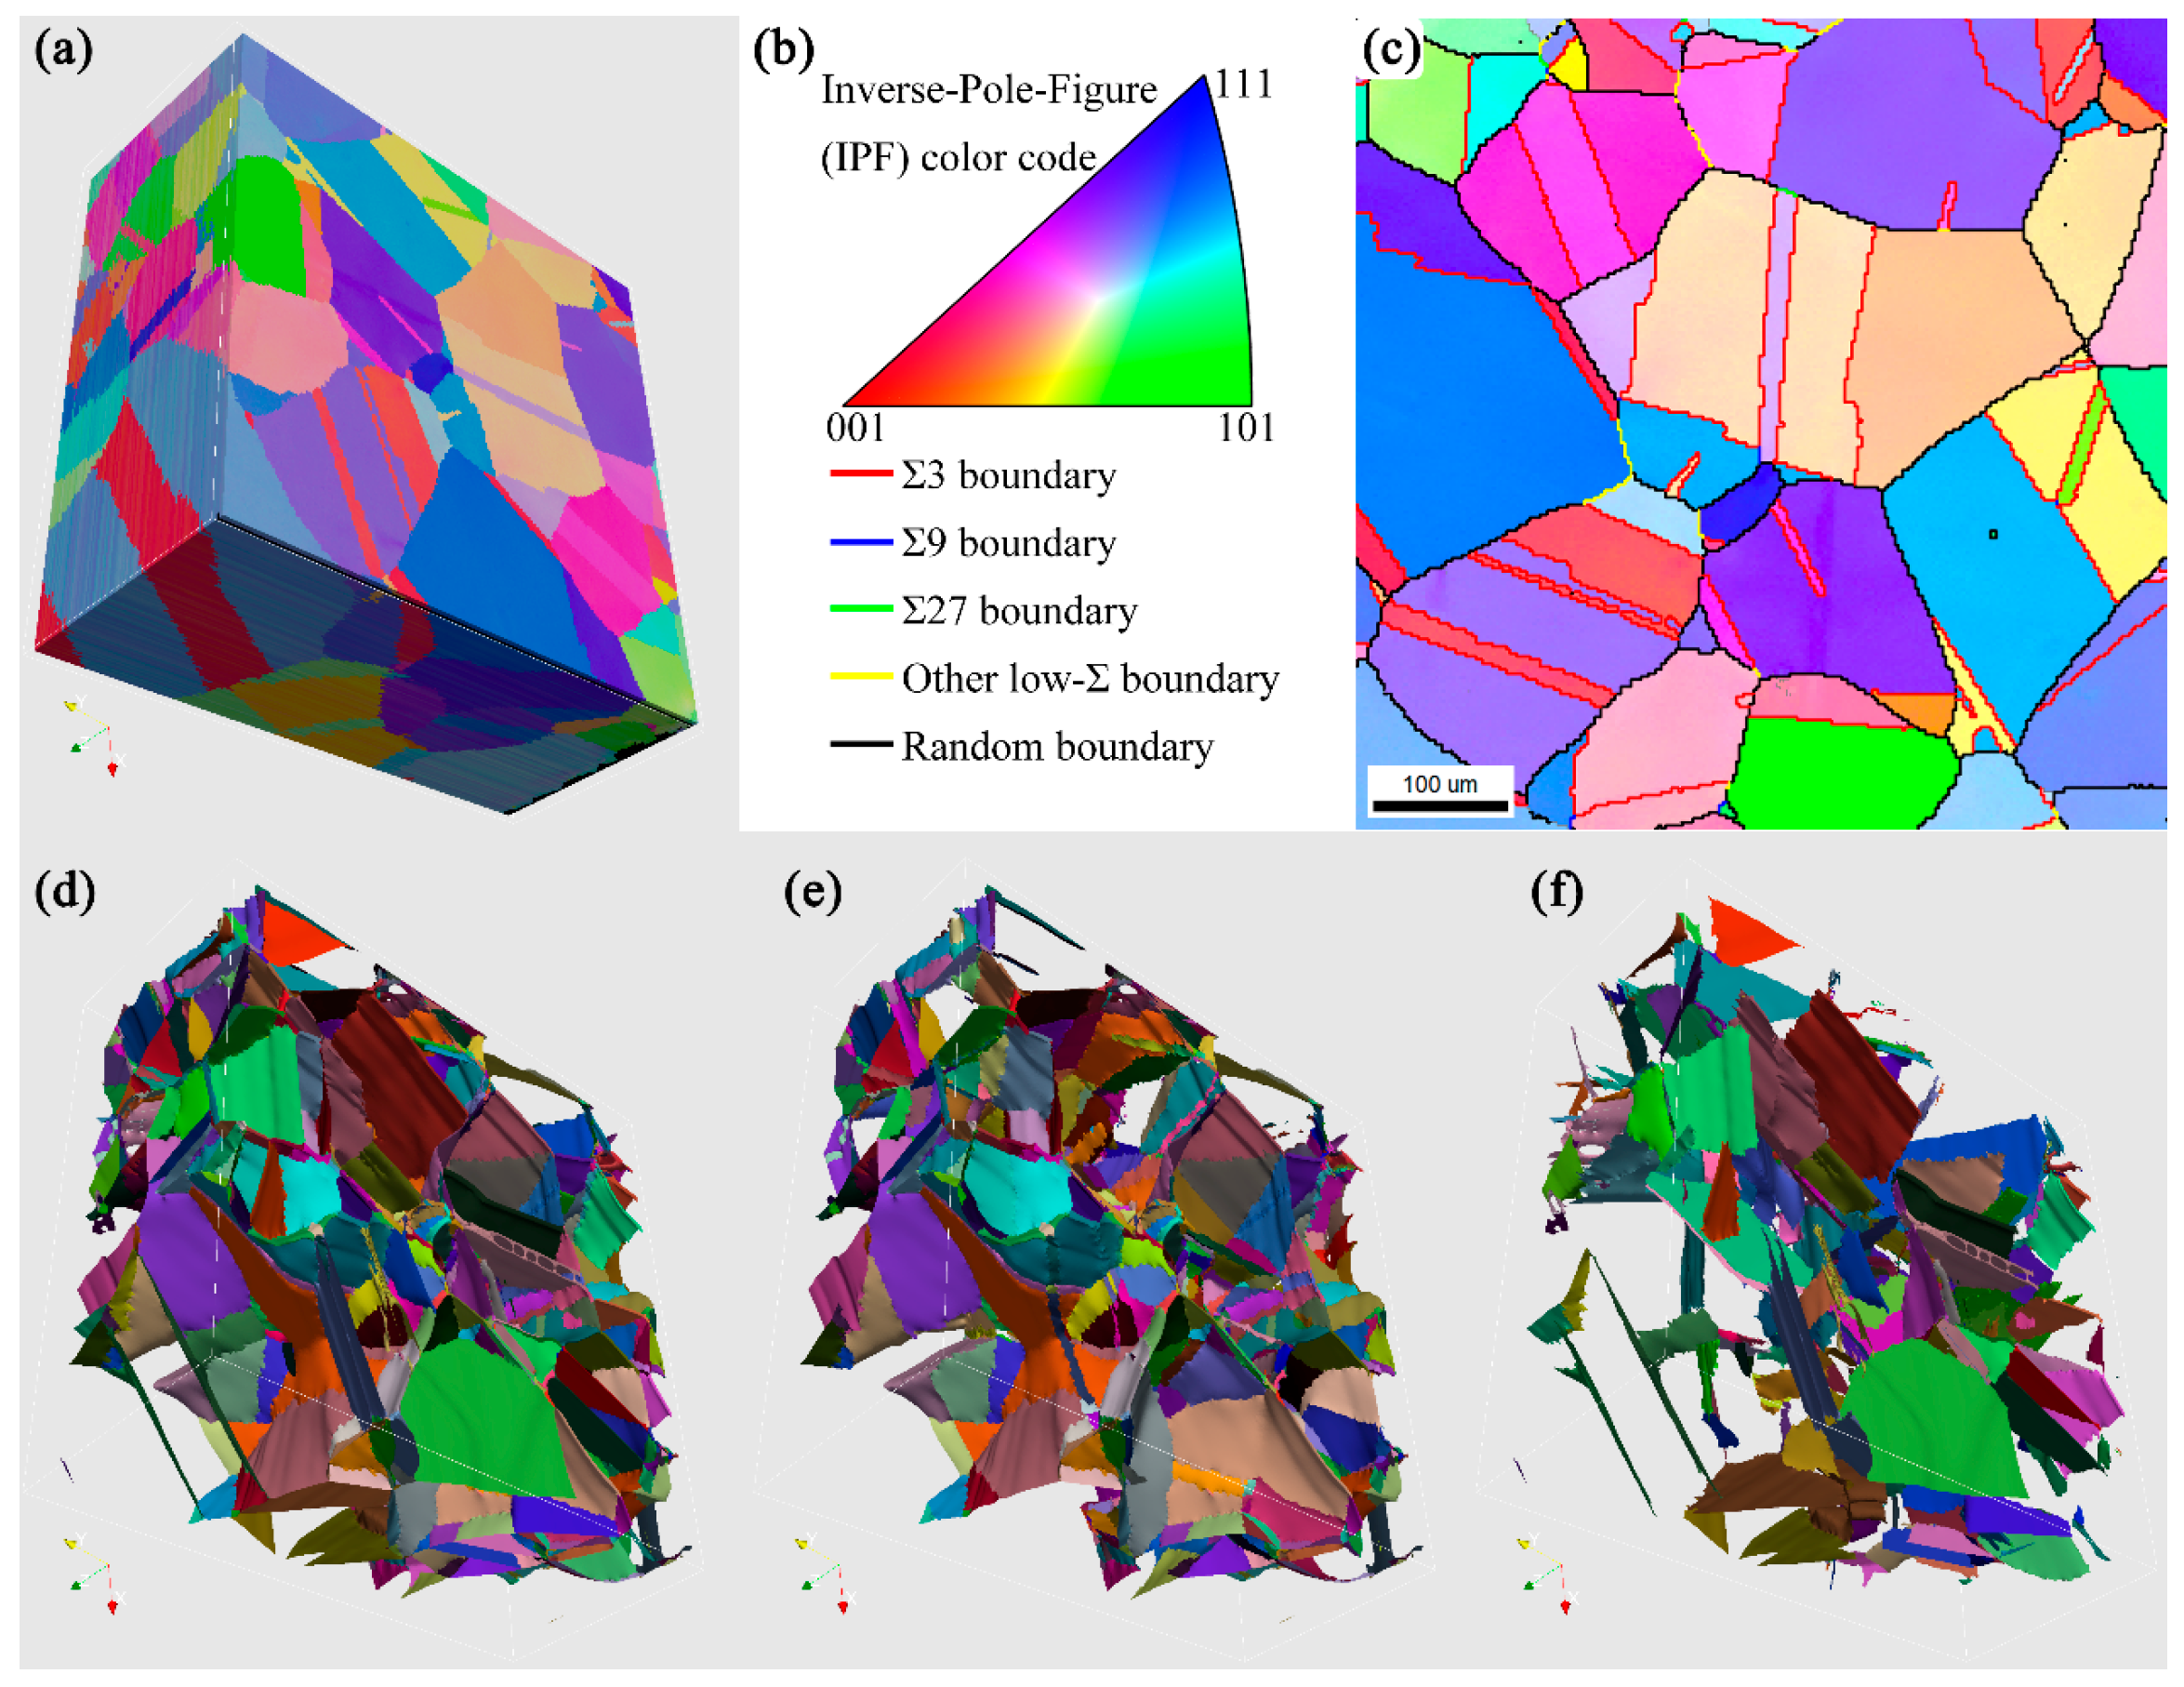
This study employed 3D-EBSD to characterize and quantitatively analyze the microstructure of a solution-treated 316L stainless steel. Figure 1a presents the reconstructed 3D microstructure based on 101 layers of serial-section EBSD data. The coloring scheme is consistent with conventional 2D EBSD orientation mapping, using the Inverse Pole Figure (IPF) color code to represent grain orientations. Figure 1c shows a representative 2D EBSD map from one layer, where grain boundaries are colored according to their Σ values of coincidence site lattice (CSL) mode, with the CSL mode widely used to characterize special grain boundaries [26]. Figure 1d–f display the 3D grain boundary network, the random boundary network, and the twin boundary network, respectively. In this study, due to the limitations of current analytical tools in accurately identifying and quantifying all CSL boundary types from 3D-EBSD data, random boundaries encompass random high-angle grain boundaries and CSL boundaries with Σ > 3. In contrast, twin boundaries refer specifically to Σ3 boundaries. The 3D grain boundary network structure is significantly more complex than its 2D cross-sectional representation, making its characterization and analysis a persistent focus and challenge in 3D materials science [27,28]. This study focuses on the distribution and characteristics of twin boundaries on these 3D grains.
Figure 1.
(a) Reconstructed 3D-EBSD microstructure and (c) a representative 2D EBSD map, both colored according to the inverse pole figure (IPF) relative to the sample normal direction (Z-axis). (b) IPF color codes for grain orientation and grain boundary. Reconstructed 3D networks of (d) all grain boundaries, (e) random boundaries, and (f) twin boundaries, colored according to their misorientation angles.
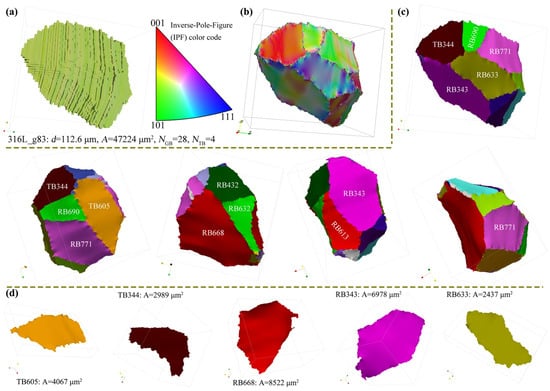
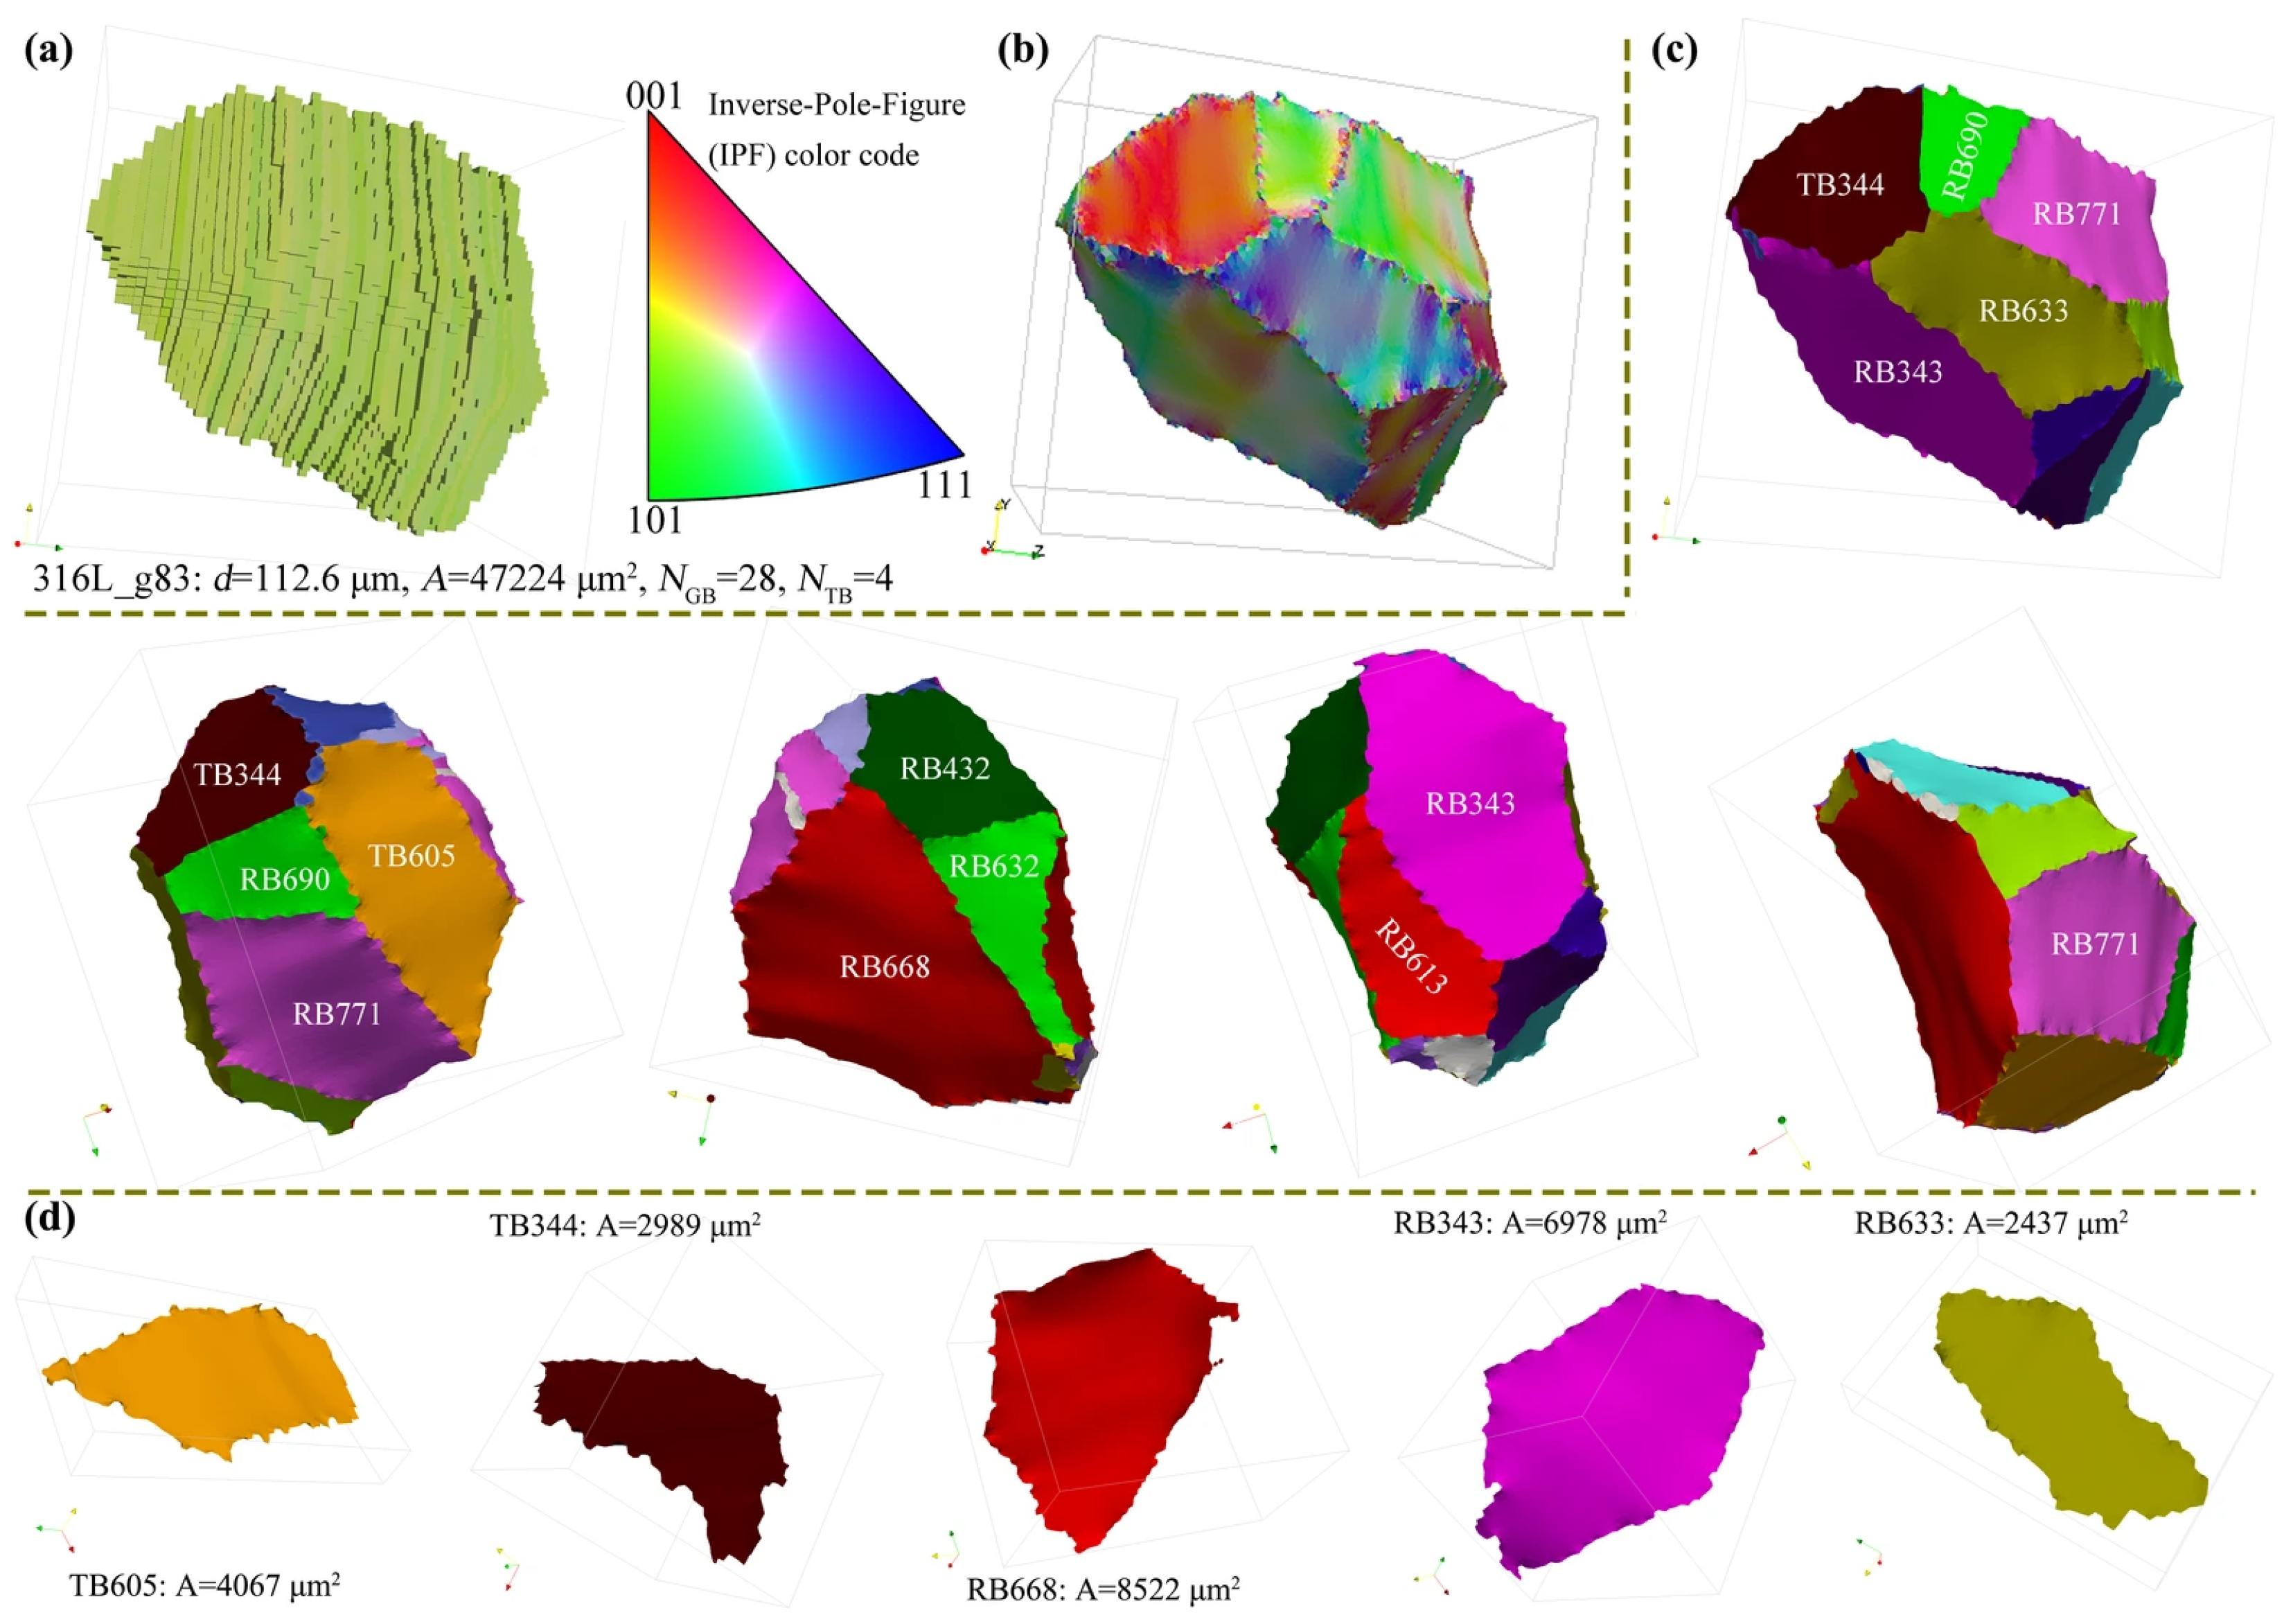
To reveal the morphological features of 3D grains and boundaries, a typical grain labeled g83 from the 3D-EBSD of Figure 1a was analyzed. Figure 2a shows the voxel-based raw morphology of this grain, colored according to the IPF-Z scheme. Figure 2b shows the morphology after surface smoothing (constituted by a triangular mesh based on a Laplacian smoothing algorithm [24,29]), colored according to the surface normal direction via the IPF scheme to reflect the geometric orientation and curvature distribution of the boundaries. Figure 2c distinguishes individual boundaries using different colors and presents the morphology from multiple projections. Figure 2d further extracts five typical boundaries from this grain, including two twin boundaries (prefixed TB) and three random boundaries (prefixed RB). Through 3D quantitative analysis, grain g83 was determined to have an equivalent spherical diameter of 112.6 μm, a surface area of 47,224 μm2, and a total of 28 grain faces (i.e., bordering 28 neighboring grains), including 4 twin boundaries. The areas of the five selected boundaries are indicated in Figure 2d.
Figure 2.
Visualization of a typical 3D grain: (a) voxel-based raw microstructure colored according to the IPF code; (b) grain after surface smoothing, colored by the surface normal direction using the IPF code; (c) multi-view projections of the grain with differentially colored boundaries; (d) representative 3D morphologies of selected boundaries from the grain.
Statistical analysis of the 3D-EBSD dataset (volume: 600 × 600 × 267.6 μm3) revealed it contains 440 grains with an average grain diameter of 41.4 μm; 1832 random boundaries with an average diameter of 33.0 μm; and 375 twin boundaries with an average diameter of 50.0 μm. The average size of twin boundaries is approximately 52% larger than that of random boundaries, which is closely related to their respective formation mechanisms. The formation of random boundaries originates from encounter of recrystallized grains with arbitrary misorientation. Conversely, twin boundaries (primarily coherent) are formed via a “stacking fault nucleation and growth” mechanism during recrystallization [30,31]. It has been established that formation of twin boundaries is capable of altering the misorientation of the recrystallization front boundaries, increasing front mobility and thus promoting the recrystallization process [10,32]. This is due to the significantly lower interfacial energy of twin boundaries in comparison to random high-angle boundaries (approximately 10%) [33]. This mechanism endows twin boundaries with a higher growth rate, facilitating the formation of larger interfaces. Furthermore, as a face-centered cubic material with low stacking fault energy, 316L stainless steel is prone to multiple twinning during recrystallization [34,35]. This involves the repeated formation of twins from a single nucleus at different locations along the recrystallization front. These twins may merge due to identical orientation, further promoting the formation of large twin boundaries.
The total number of random and twin boundaries in the 3D-EBSD microstructure shown in Figure 1a is 2207. The average boundary size () is 35.9 μm, which is similar to the average grain size (). Their ratio () is 0.867. For microstructures with equiaxed grains, grains are often simplified as regular hexagons in 2D studies, yielding a theoretical ratio of 0.550. In 3D, grains can be approximated as tetrakaidecahedra (composed of 6 squares and 8 regular hexagons) [36], resulting in a theoretical ratio of 0.547. The measured value is significantly higher than these theoretical predictions, indicating that the actual grain morphology deviates from an equiaxed shape, leading to an increased specific surface area. This deviation is primarily attributed to the prevalence of twin boundaries, particularly their significantly larger size compared to random boundaries [17].
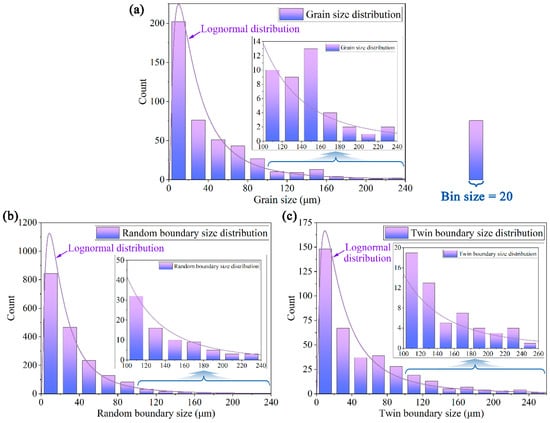
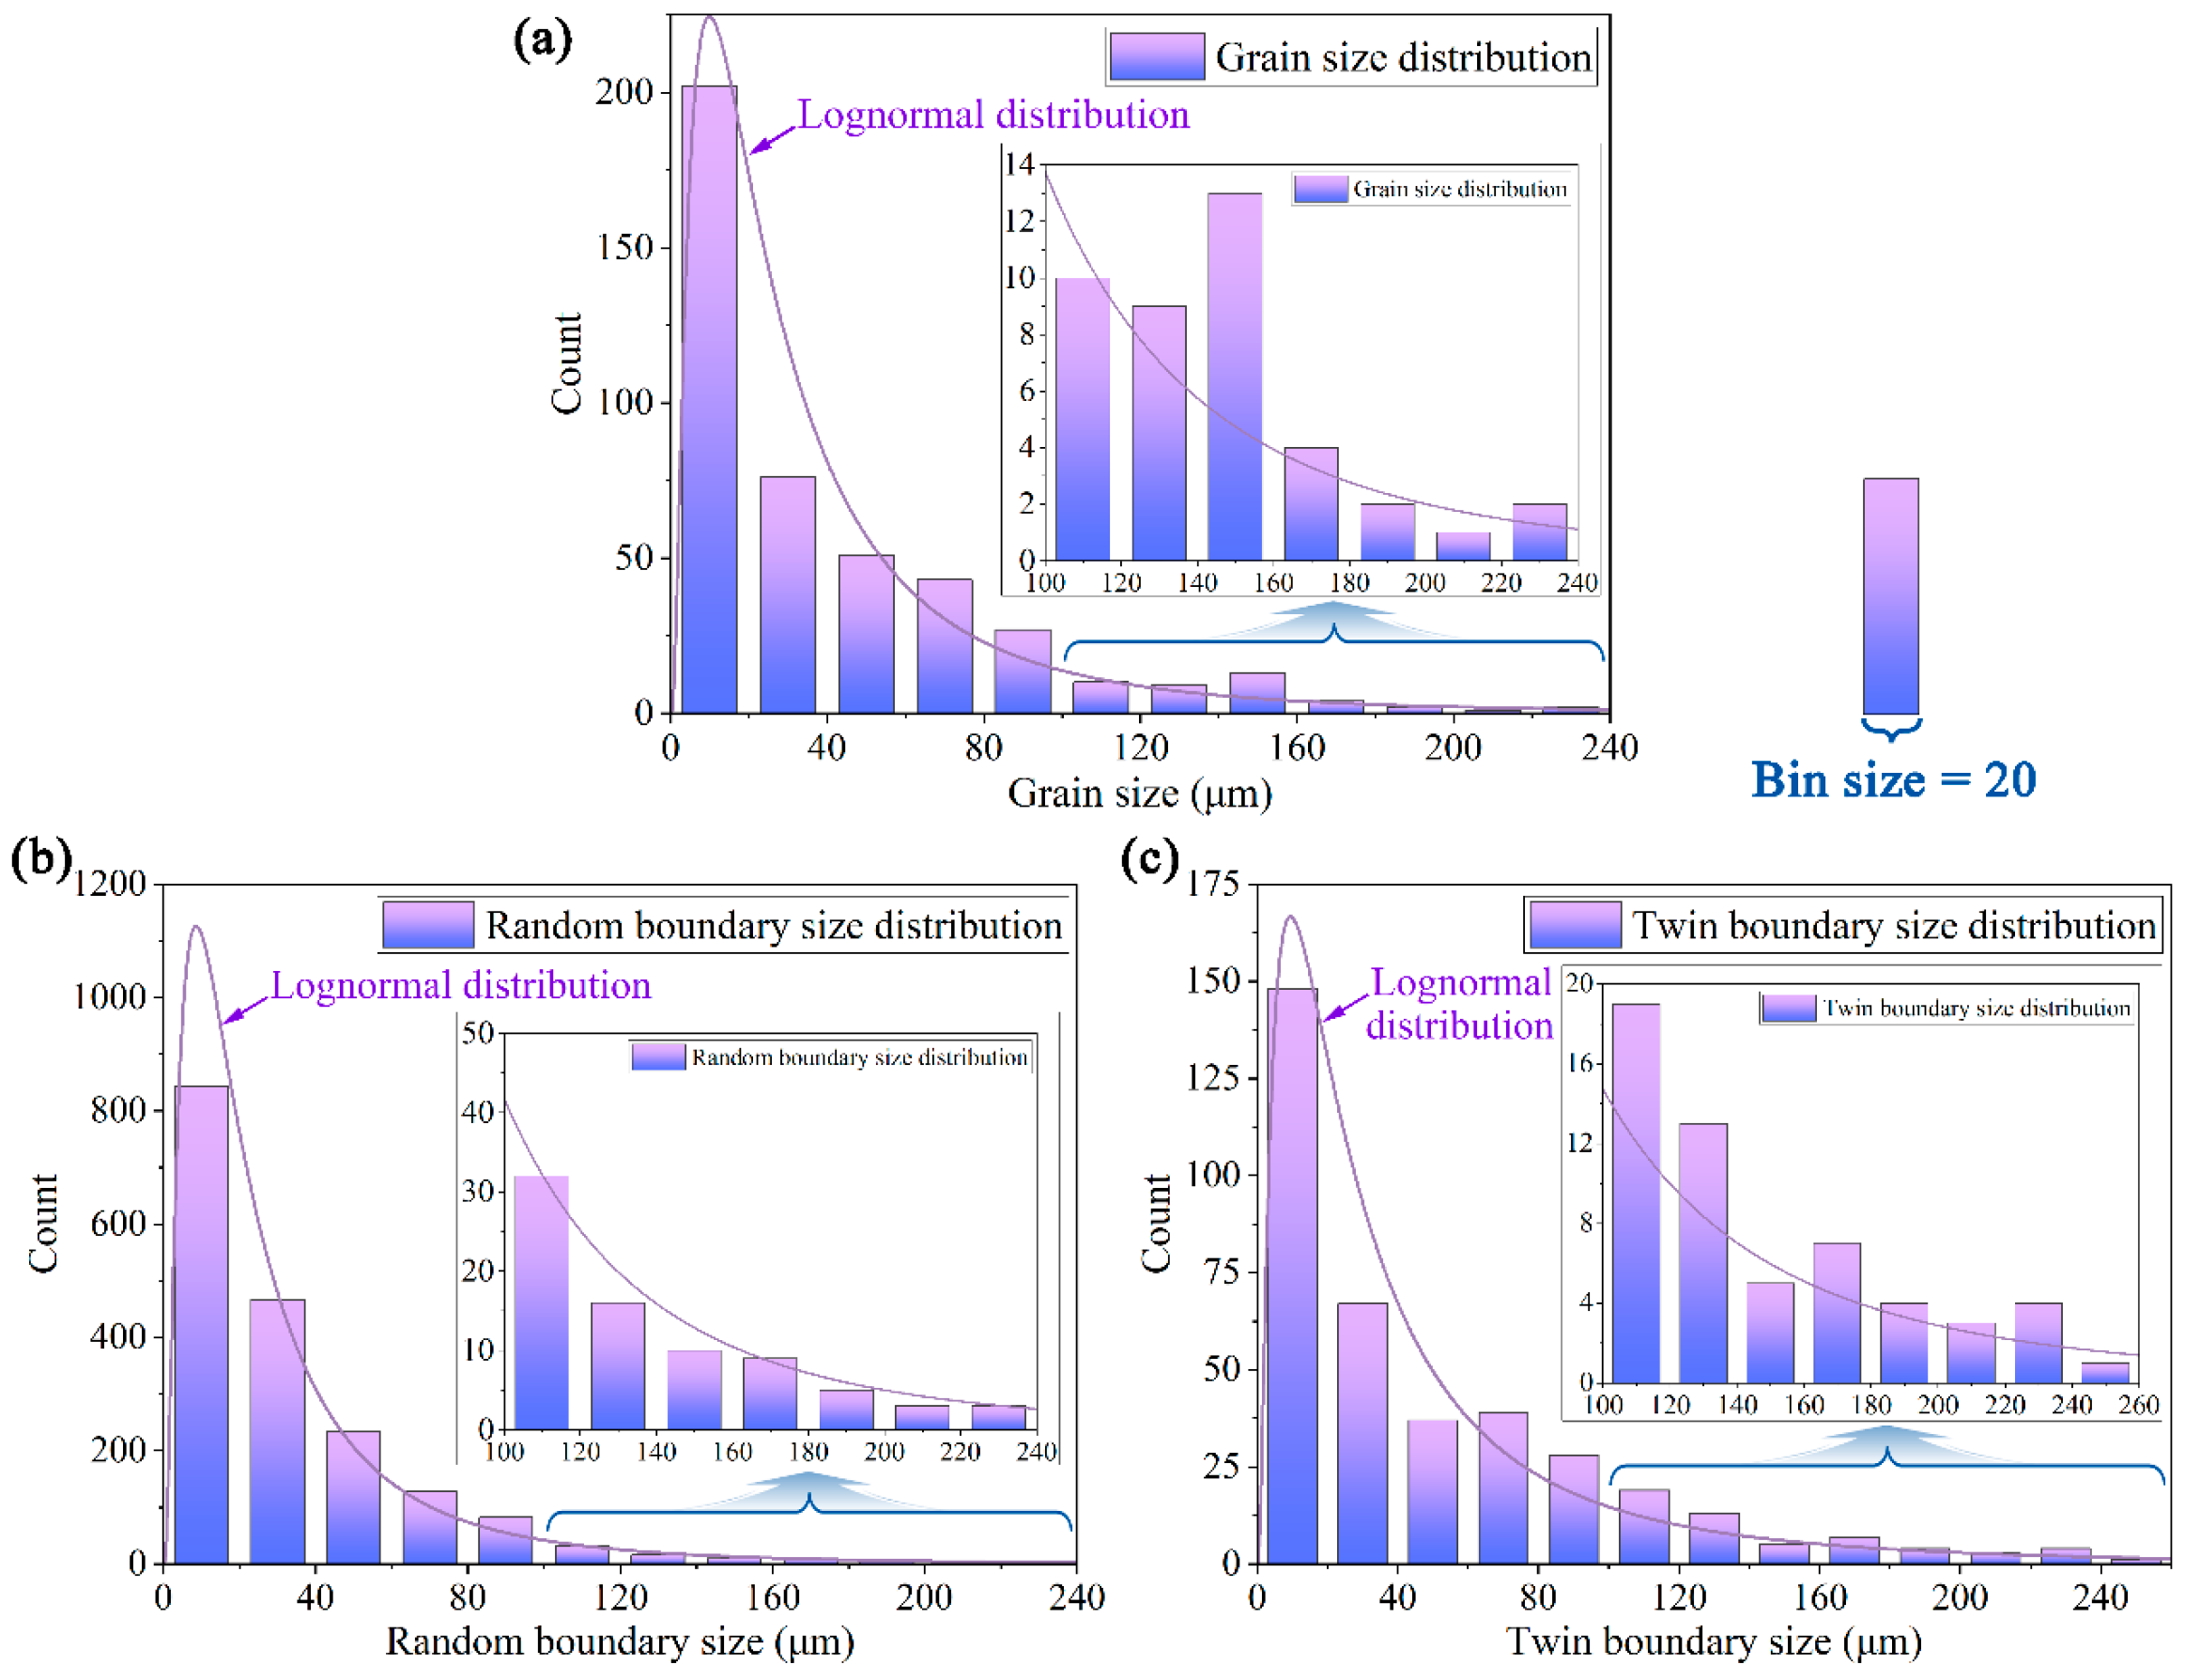
For the 440 grains, 1832 random boundaries, and 375 twin boundaries in the 3D-EBSD microstructure shown in Figure 1a, Figure 3 compares their size distributions. All three curves represent the best-fitted log-normal distribution [37]. Figure 3a shows the number distribution of grain sizes. Most grains (over 200) are concentrated in the small-size range of 0–20 μm, and the number of grains decreases rapidly with increasing size, although three grains exceed 200 μm in size. Figure 3b,c display the size distributions of random boundaries and twin boundaries, respectively. Similar to the grain distribution, both random and twin boundaries are highly concentrated in the small-size range. A large number of random boundaries (>800) and twin boundaries (>140) have sizes within 0–20 μm. However, there are also some random boundaries (6) and twin boundaries (8) with sizes exceeding 200 μm. Comparatively, a higher proportion of large-sized twin boundaries is observed [17]. According to grain boundary engineering research, these large twin boundaries play an important role in disrupting the connectivity of the random boundary network and improving the material’s resistance to intergranular corrosion [38].
Figure 3.
Histograms showing the size distributions of (a) grains (equivalent spherical diameter), (b) random boundaries, and (c) twin boundaries (equivalent circle diameter). All distributions are well described by log-normal functions, with goodness-of-fit (R2) values of 0.991 (a), 0.999 (b), and 0.992 (c), respectively.
An EBSD step size of 2.5 μm and an average section thickness of 2.55 μm were employed in this study, which raises the possibility that some thin twin lamellae may remain undetected, particularly given that annealing twins in low-stacking-fault-energy alloys such as 316L stainless steel can occasionally exhibit sub-micron thicknesses. Resolution limitations are an inherent challenge in 3D characterization techniques. For instance, while FIB-based 3D-EBSD offers superior spatial resolution [39,40], it is constrained by a severely limited observation volume. In contrast, the mechanical polishing serial-sectioning approach adopted here enables the acquisition of 3D-EBSD data over a substantially larger volume, albeit at a more moderate resolution [37]. To mitigate potential resolution-induced biases, we deliberately selected a material with a relatively large average grain size (approximately 41.4 μm). The resolution (2.5 μm) corresponds to approximately 1/16 of the average grain diameter, which is considered acceptable for reliable microstructural statistical analysis. This resolution-to-grain size ratio ensures that the vast majority of twin boundaries, which, as the present results demonstrate, tend to be larger than random boundaries, are adequately captured. However, thin parallel-sided twin lamellae represent a special morphological case, as reported in the literature [17], and such features may be influenced by resolution limitations. The minimum reliably detectable twin thickness is approximately twice the step size or section thickness (~5 μm). Twins thinner than this threshold may be partially or completely missed. Although an accurate estimate of the number of twins with thicknesses below 5 μm is not feasible from the current dataset, several considerations suggest that their population is limited. First, the material underwent full high-temperature annealing, a process during which extremely thin twin lamellae are unlikely to be retained [10]; moreover, such features have not been a focus of concern in related 2D EBSD studies [3,4,5], implying their low abundance does not compromise the overall statistical trends. Second, as shown in Figure 3, the size distributions of grains, random boundaries, and twin boundaries all exhibit smooth, well-fitted log-normal curves, indicating no evidence of a significant population of undetected features. Therefore, the adopted resolution is deemed sufficient for the statistical objectives of this investigation.
The characterized volume of 600 × 600 × 267.6 μm3, while larger than those typically reported in comparable 3D studies [39,40], remains limited. Notably, the largest grain intersects the volume boundary and is thus incompletely captured, suggesting that statistical parameters such as average grain size may be slightly underestimated. Nevertheless, within this limitation, the dataset comprising 440 grains provides a robust foundation for identifying the key distribution patterns reported herein.
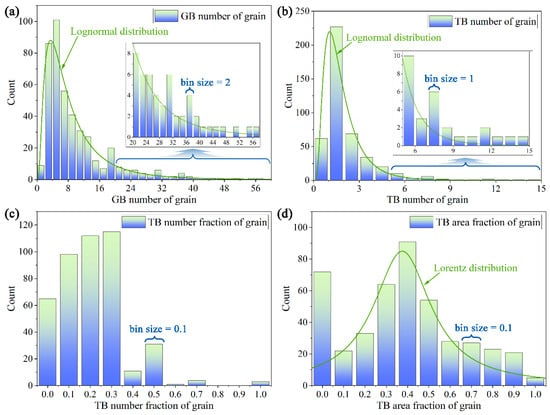
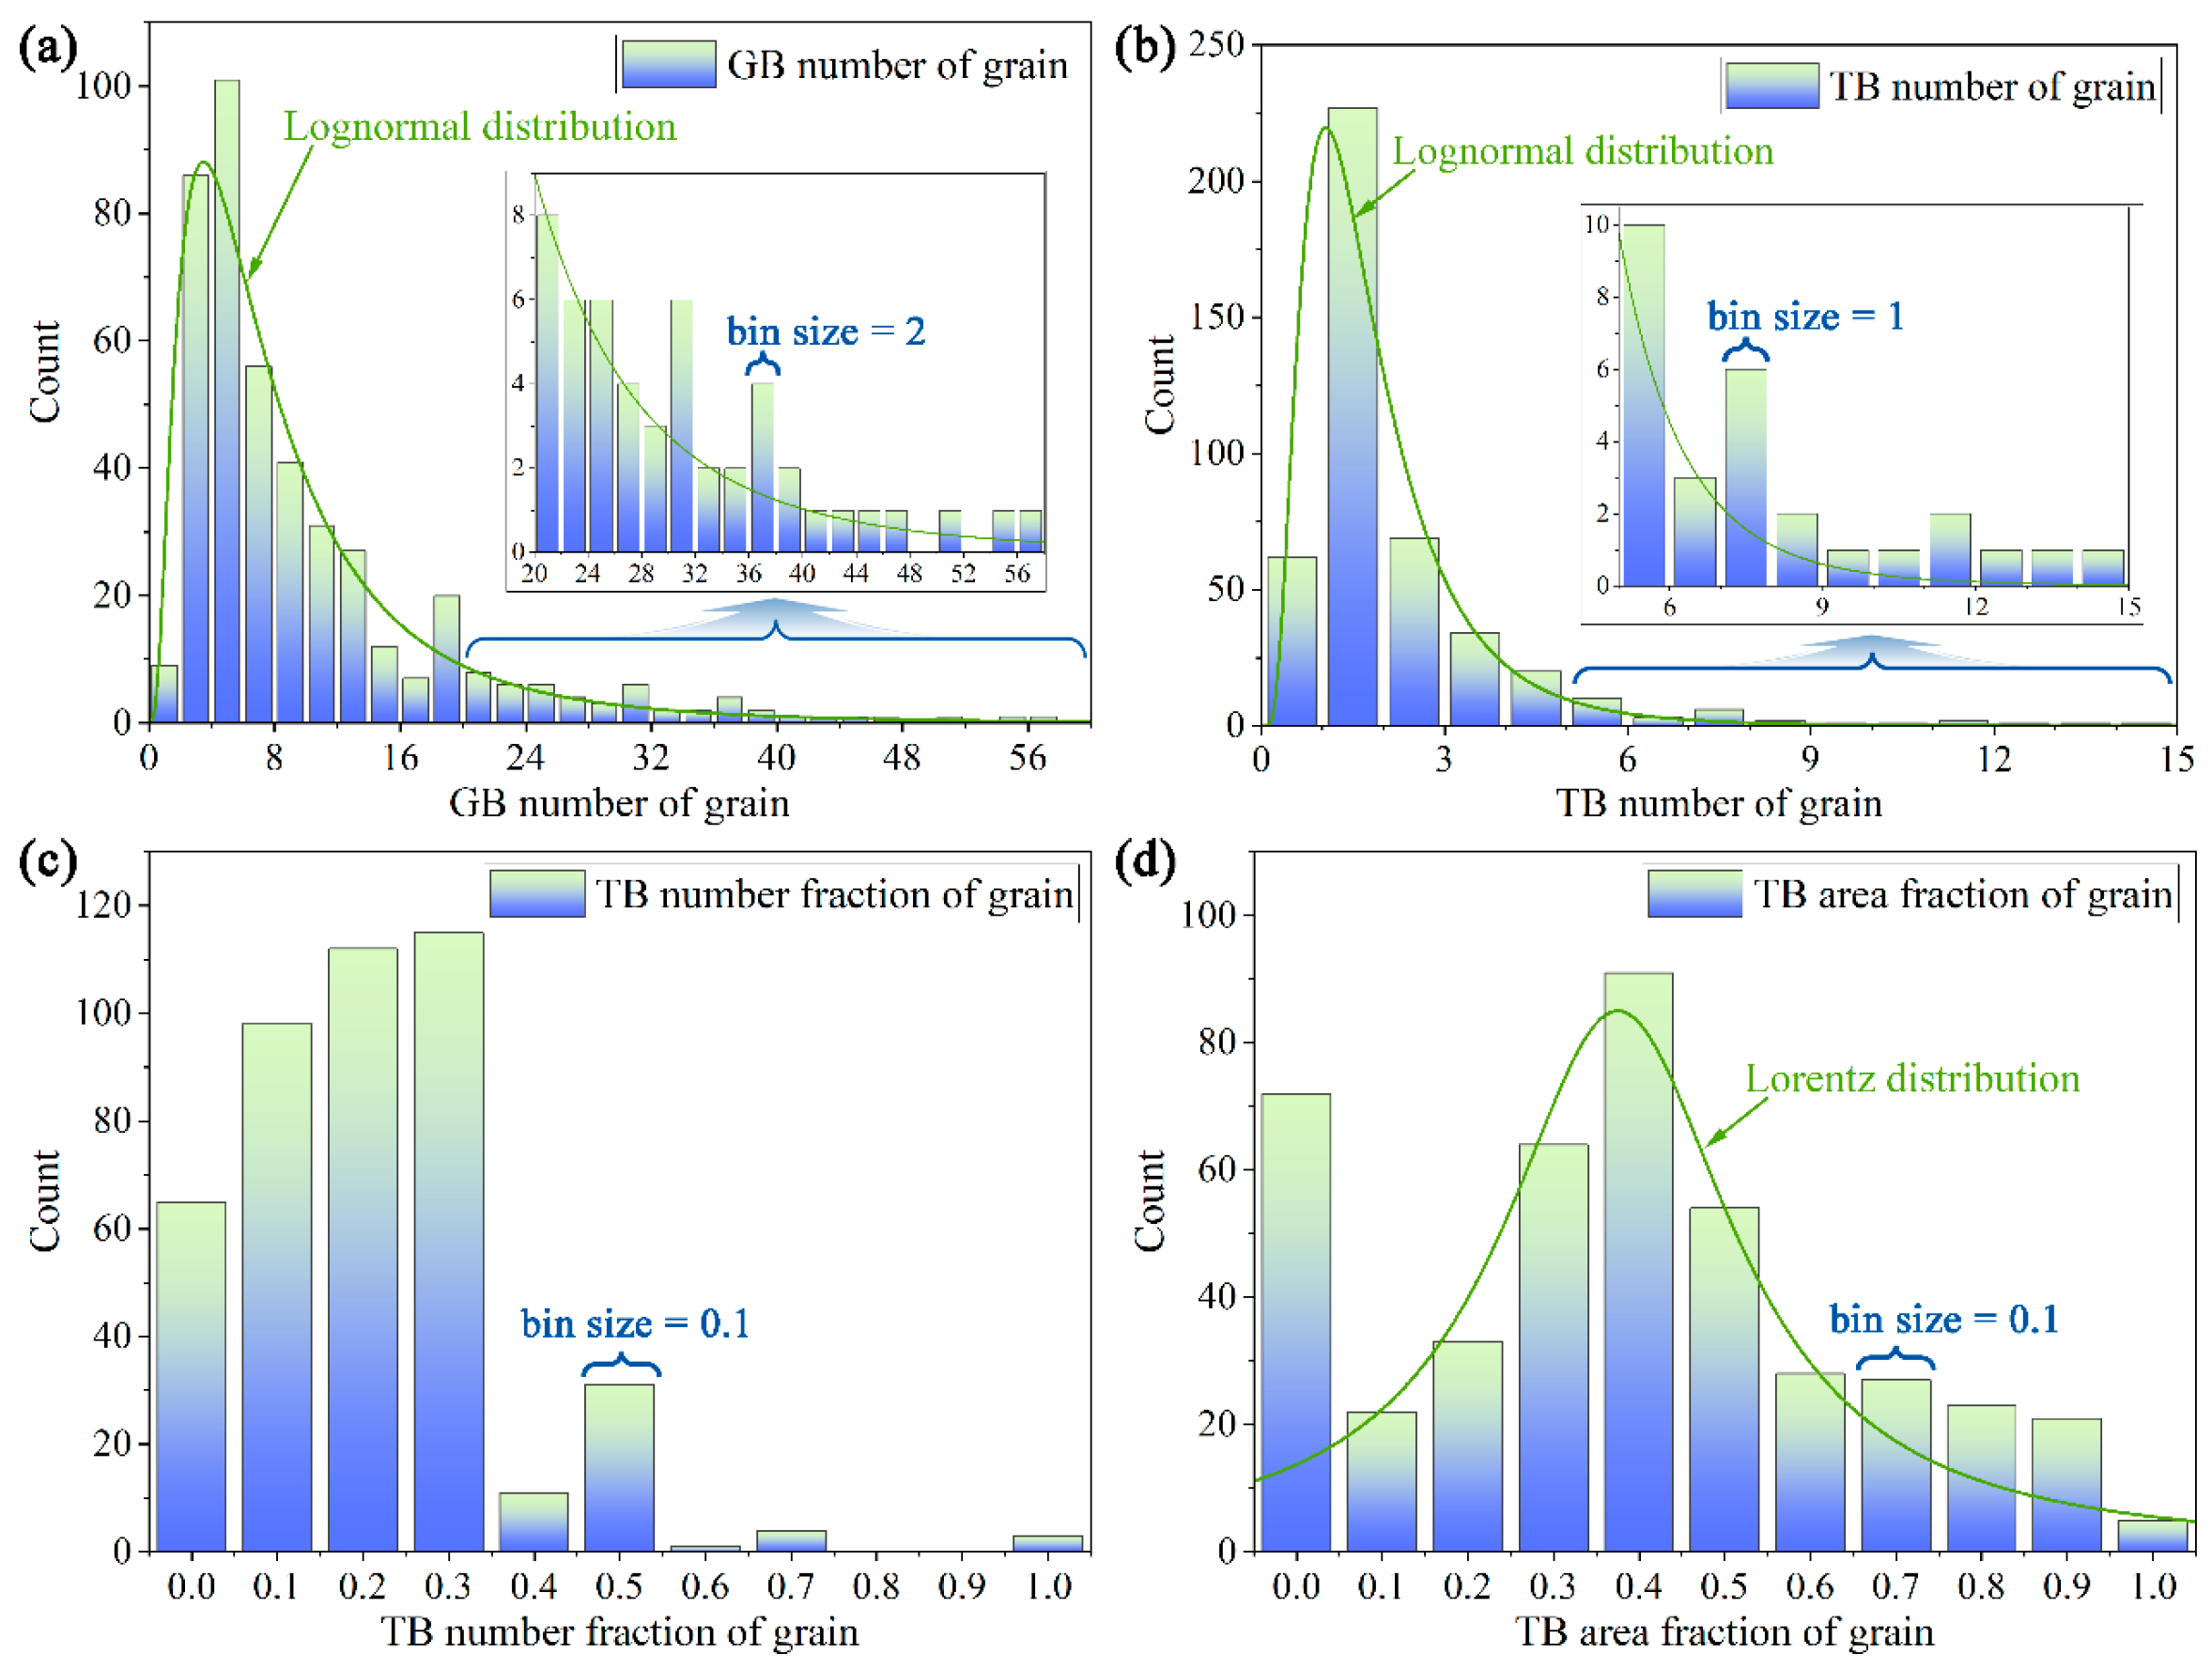
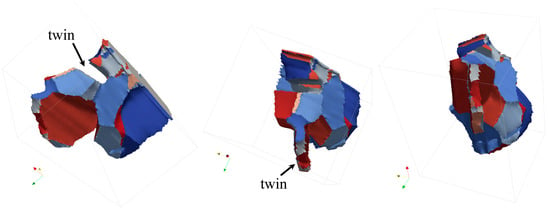
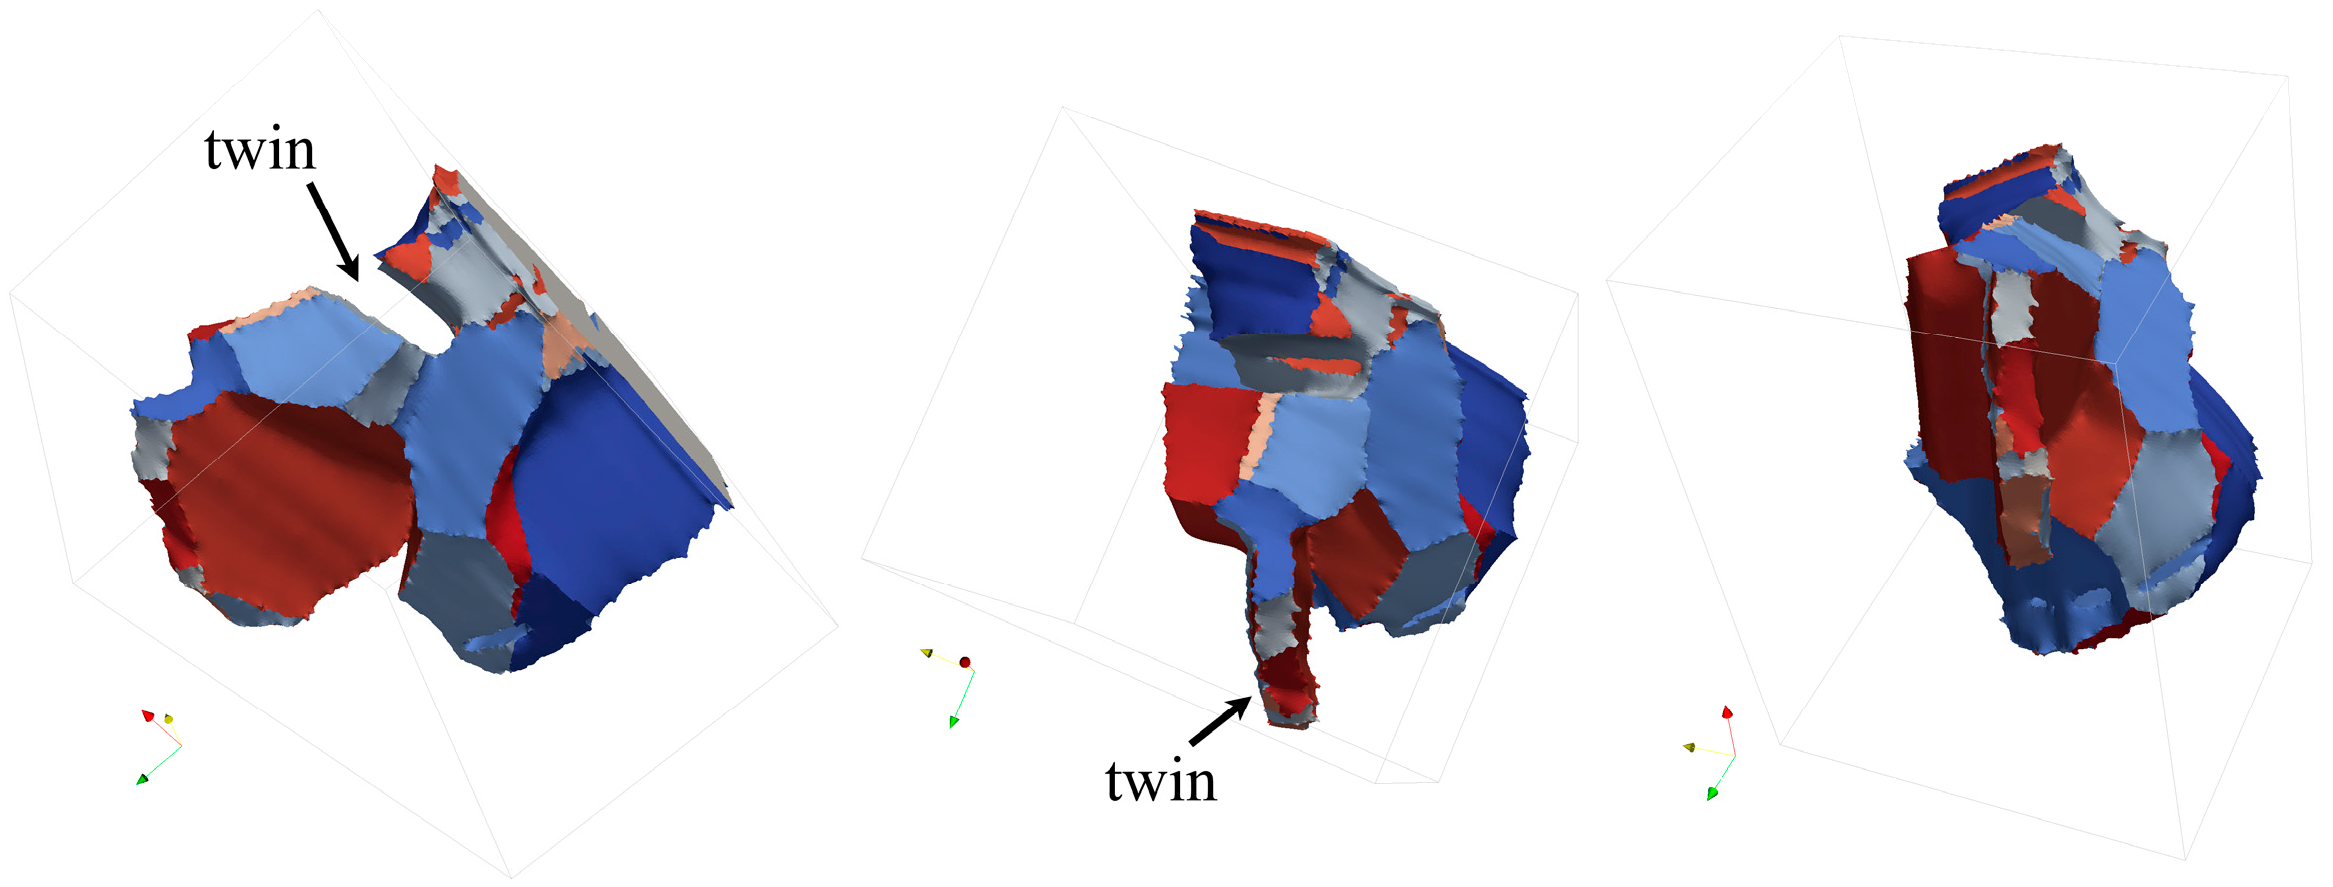
The interfacial composition of all 440 grains was further analyzed. Following a similar analysis as for grain g83 in Figure 2, the number of boundaries and the number of twin boundaries on each grain were counted, allowing for the calculation of the number fraction and area fraction of twin boundaries relative to the total boundaries for every grain. The results are shown in Figure 4. The distribution of the total number of boundaries per grain follows a typical log-normal distribution. The vast majority of grains have 14 or fewer faces, with an average of 9.6, although a small number of “special grains” possess an exceptionally high number of faces (exceeding 50) [17]. To provide a concrete illustration of such special grains, Figure 5 presents a 3D rendering of grain g94, the second-largest grain in the dataset. This grain has an equivalent spherical diameter of 224.2 μm and a surface area of 3.06 × 105 μm2 and is bordered by 54 neighboring grains, among which 9 are twin boundaries. The number fraction and area fraction of twin boundaries on this grain are 16.7% and 32.8%, respectively. As visualized in Figure 5, grain g94 exhibits a pronounced plate-shaped protrusion and a plate-shaped concave region, both morphologically indicative of twin formation through multiple-twinning processes during recrystallization [34,41]. These features suggest that the generation of twins has substantially increased the topological complexity of the grain, contributing to its exceptionally high number of faces [17].
Figure 4.
Distribution histograms of: (a) the number of grain boundaries (GBs) per grain, (b) the number of twin boundaries (TBs) per grain, (c) the number fraction of TBs among all boundaries per grain, and (d) the area fraction occupied by TBs on grain surface. The distributions of the number of GBs per grain and the number of TBs per grain conform to lognormal functions, with R2 values of 0.972 and 0.992, respectively. The area fraction of TBs on grain surfaces follows a Lorentz distribution (R2 = 0.630). In contrast, the number fraction of TBs exhibits no clear statistical pattern.
Figure 5.
A 3D visualization of a complex grain with 54 faces including 9 twin boundaries, shown in multi-view projections with differentially colored boundaries.
The distribution of the number of twin boundaries per grain is similar to that of the total boundary number, both following log-normal distributions (R2 = 0.972 and 0.992, respectively), as shown in Figure 4a,b. Most grains contain 5 or fewer twin boundaries, with an average of 1.7 twin boundaries per grain, while a few grains possess more than 10. Notably, the distribution of the number fraction of twin boundaries per grain shows no clear pattern. Most grains have a twin boundary fraction below 0.35, with an average of 0.21, although cases where the fraction equals 1 (corresponding to isolated twins reported in the literature [17,30]) are also observed. Such isolated twins are rarely found in 3D microstructures and are typically very small. Concurrently, 62 grains contain no twin boundaries, accounting for 14% of the total. This indicates that twinning is prevalent in the face-centered cubic 316L stainless steel with low-stacking-fault-energy. Furthermore, the distribution of the area fraction of twin boundaries per grain exhibits a well-defined pattern. If grains without twin boundaries are excluded, the distribution closely conforms to a Lorentz distribution. For most grains, the twin boundary area fraction lies between 0.25 and 0.55, peaking at around 0.4, with an average value of 0.384. This distribution characteristic indicates that, on average, nearly half of the surface area of grains in the 316L stainless steel is covered by twin boundaries. Moreover, a considerable number of grains exhibit even higher coverage, with the distribution showing a feature of “sharp peak and heavy tails”.
The Lorentz distribution fitted to the twin boundary area fractions (Figure 4d) exhibits a sharp peak around 0.4 and a heavy tail extending toward higher values. Notably, the histogram bin corresponding to area fractions of 0.95–1.0 includes both grains with twin boundary fractions slightly below 1.0 and those with fractions exactly equal to 1.0, the latter corresponding to isolated twins, rare grains entirely bounded by a single twin boundary [17,30]. These isolated twins are typically very small and contribute to the heavy tail of the Lorentz distribution. Conversely, the sharp peak reflects the majority of grains with moderate twin coverage (0.25–0.55), which is consistent with the calculated average value of 0.384. Thus, the observed Lorentz distribution captures the coexistence of a dominant population with typical twin coverage and a minority of extreme cases (both high-face-count grains and isolated twins) that extend the distribution tail.
The Lorentz distribution observed for the twin boundary area fraction reflects the underlying physics of twin formation and grain growth. Unlike random boundaries, which form stochastically during grain impingement and typically yield log-normal distributions, twin boundaries arise through specific mechanisms: (i) stacking fault nucleation at migrating boundaries [30,31], (ii) multiple twinning events from a single nucleus [28,34,35], and (iii) coalescence of twins with identical orientations [17]. These mechanisms are not purely random but involve correlated events that can produce extreme values: grains with exceptionally high twin coverage (the “heavy tail”) alongside a dominant population with moderate coverage (the “sharp peak”). The Lorentz distribution, characterized by its heavier tails compared to the Gaussian or log-normal distributions, mathematically captures this coexistence of typical behavior and extreme events. This interpretation is consistent with the observations that the heavy tail comprises grains such as the “special grain” g94 (Figure 5) and isolated twins, both products of the correlated twin formation processes described above.
Previous studies [6,7,8,9] have demonstrated that grain boundary engineering can significantly enhance the resistance of 316L stainless steel to intergranular corrosion and intergranular stress corrosion cracking, an improvement primarily attributed to the capacity of twin boundaries to disrupt the connectivity of the random grain boundary network [3,9,36]. Consequently, the distribution of twin boundaries within the three-dimensional grain boundary network constitutes a central concern in grain boundary engineering research [28,42]. While the preceding analysis has focused on the distribution of twin boundaries on individual grains, their arrangement at triple junctions was also analyzed within the same 3D-EBSD microstructure. In the grain boundary network illustrated in Figure 1d, a total of 3144 triple junctions were identified. Among these, triple junctions containing a single twin boundary (Σ3-RB-RB) account for 41.9%, while those containing two twin boundaries (Σ3-Σ3-Σ9) constitute only 5.8%. On average, each triple junction contains 0.53 twin boundaries. It should be noted that the experimental material examined here is conventional 316L stainless steel that has not undergone grain boundary engineering treatment. The present paper focuses specifically on the distribution of twin boundaries on grain surfaces; detailed analyses of twin boundary distributions at triple and quadruple junctions, as well as the optimization effects of grain boundary engineering, have been reported elsewhere [17,28].
4. Conclusions
Based on 3D-EBSD technology, this study systematically characterized and analyzed the distribution patterns of twin boundaries on the surfaces of 3D grains in 316L stainless steel. The results show that the average size of grain boundaries (35.9 μm) is close to the average grain size (41.4 μm), while the average size of twin boundaries is significantly larger than that of random boundaries (approximately 52% larger). Statistical analysis reveals that, on average, each grain has 9.6 boundaries, including 1.7 twin boundaries, corresponding to an average twin boundary area coverage of 38.4% on grain surfaces. The size distributions of grains, random boundaries, and twin boundaries, as well as the distributions of the total number of grain boundaries and the number of twin boundaries per grain, all conform to a log-normal distribution. Notably, while the number fraction of twin boundaries per grain exhibits no clear statistical pattern, their area fraction follows a typical Lorentz distribution. This is attributed to the triple formation mechanisms of twin boundaries—nucleation-growth, multiple twinning, and twins merging—which promote the formation of some exceptionally large twin boundaries.
Author Contributions
Conceptualization, T.L. and S.X.; methodology, T.L.; software, T.L.; validation, S.X.; formal analysis, S.X.; investigation, G.W.; resources, S.X.; data curation, T.L.; writing—original draft preparation, T.L.; writing—review and editing, S.X.; visualization, G.W.; supervision, S.X.; project administration, S.X.; funding acquisition, T.L. All authors have read and agreed to the published version of the manuscript.
Funding
This work was sponsored by the National Natural Science Foundation of China (12575285).
Data Availability Statement
The original contributions presented in this study are included in the article. Further inquiries can be directed to the corresponding author.
Conflicts of Interest
The authors declare that they have no known competing financial interests or personal relationships that could have appeared to influence the work reported in this paper.
References
- Carpenter, H.C.H.; Tamura, S. The formation of twinned metallic crystals. Proc. R. Soc. Lond. 1926, 113, 161–182. [Google Scholar] [CrossRef] [Scilit]
- Tang, C.; Yang, J.; Zhang, F.; Aroh, J.W.; Porterfield, E.S.; Prorok, B.C.; Lou, X. Twin-related grain boundary engineering of additively manufactured 316L stainless steel. Acta Mater. 2025, 301, 121503. [Google Scholar] [CrossRef] [Scilit]
- Michiuchi, M.; Kokawa, H.; Wang, Z.J.; Sato, Y.S.; Sakai, K. Twin-induced grain boundary engineering for 316 austenitic stainless steel. Acta Mater. 2006, 54, 5179–5184. [Google Scholar] [CrossRef] [Scilit]
- Lee, K.-P.; Tran, D.-P.; Chen, B.-Y.; Lin, Y.-Q.; Huang, J.-Y.; Chen, P.-C.; Chen, C. Twin boundary and grain boundary engineering to enhance mechanical strength of nanotwinned Cu. Mat. Sci. Eng. A 2025, 923, 147719. [Google Scholar] [CrossRef] [Scilit]
- Li, X.; Guan, X.; Jia, Z.; Chen, P.; Fan, C.; Shi, F. Twin-Related Grain Boundary Engineering and Its Influence on Mechanical Properties of Face-Centered Cubic Metals: A Review. Metals 2023, 13, 155. [Google Scholar] [CrossRef] [Scilit]
- Jia, Z.-P.; Guan, X.-J.; Wang, D.-Q.-Q.; Shi, F.; Li, X.-W. A novel surface grain boundary engineering approach to improving corrosion resistance of a high-N and Ni-free austenitic stainless steel. Corros. Sci. 2024, 233, 112110. [Google Scholar] [CrossRef] [Scilit]
- Wang, C.; Yin, J.; He, J.; Zhu, X.; Wu, Z.; Luo, K.; Luo, F. Effect of grain boundary engineering on electrochemical and intergranular corrosion of 316L stainless steel. Corros. Sci. 2025, 254, 113050. [Google Scholar] [CrossRef] [Scilit]
- Liu, T.; Xia, S.; Shoji, T. Intergranular stress corrosion cracking in simulated BWR water of 316L stainless steels manufactured with different procedures. Corros. Sci. 2021, 183, 109344. [Google Scholar] [CrossRef] [Scilit]
- Kobayashi, S.; Kobayashi, R.; Watanabe, T. Control of grain boundary connectivity based on fractal analysis for improvement of intergranular corrosion resistance in SUS316L austenitic stainless steel. Acta Mater. 2016, 102, 397–405. [Google Scholar] [CrossRef] [Scilit]
- Randle, V.; Coleman, M. A study of low-strain and medium-strain grain boundary engineering. Acta Mater. 2009, 57, 3410–3421. [Google Scholar] [CrossRef] [Scilit]
- Wang, Z.; Gao, F.; Tang, S.; Zhou, P.; Zhang, W.; Liu, Z. Effect of twin-related boundaries distribution on carbide precipitation and intergranular corrosion behavior in nuclear-grade higher carbon austenitic stainless steel. Corros. Sci. 2022, 209, 110791. [Google Scholar] [CrossRef] [Scilit]
- Zhu, W.; Wu, G.; Godfrey, A.; Schmidt, S.; He, Q.; Feng, Z.; Huang, T.; Zhang, L.; Huang, X. Five-parameter grain boundary character distribution of gold nanoparticles based on three dimensional orientation mapping in the TEM. Scripta Mater. 2022, 214, 114677. [Google Scholar] [CrossRef] [Scilit]
- Rohrer, G.S.; Randle, V.; Kim, C.-S.; Hu, Y. Changes in the five-parameter grain boundary character distribution in α-brass brought about by iterative thermomechanical processing. Acta Mater. 2006, 54, 4489–4502. [Google Scholar] [CrossRef] [Scilit]
- Polonsky, A.T.; Lang, C.A.; Kvilekval, K.G.; Latypov, M.I.; Echlin, M.P.; Manjunath, B.S.; Pollock, T.M. Three-dimensional Analysis and Reconstruction of Additively Manufactured Materials in the Cloud-Based BisQue Infrastructure. Integr. Mater. Manuf. I 2019, 8, 37–51. [Google Scholar] [CrossRef] [Scilit]
- Gupta, A.; Kim, M.-S.; Raj, R.; Kim, D.-I.; Choi, S.-H. Self-annealing and particle stimulated nucleation behavior of cryogenically rolled ETP-copper using 3D-EBSD. Mater. Charact. 2026, 231, 115913. [Google Scholar] [CrossRef] [Scilit]
- Sun, Z.; Tsai, S.-P.; Konijnenberg, P.; Wang, J.-Y.; Zaefferer, S. A large-volume 3D EBSD study on additively manufactured 316L stainless steel. Scripta Mater. 2024, 238, 115723. [Google Scholar] [CrossRef] [Scilit]
- Liu, T.; Xia, S.; Zhou, B.; Bai, Q.; Rohrer, G.S. Three-dimensional study of twin boundaries in conventional and grain boundary-engineered 316L stainless steels. J. Mater. Res. 2018, 33, 1742–1754. [Google Scholar] [CrossRef] [Scilit]
- Das, S.M.; Harrison, P.; Kiranbabu, S.; Zhou, X.; Ludwig, W.; Rauch, E.F.; Herbig, M.; Liebscher, C.H. Correlating Grain Boundary Character and Composition in 3-Dimensions Using 4D-Scanning Precession Electron Diffraction and Atom Probe Tomography. Small Methods 2025, 9, 2401650. [Google Scholar] [CrossRef] [Scilit]
- Faryna, M.; Glowinski, K. Five dimensional grain boundary distribution for yttria stabilized zirconia based on experimentally determined macroscopic boundary parameters. Acta Mater. 2022, 226, 117606. [Google Scholar] [CrossRef] [Scilit]
- Zeng, X.; Liu, C.; Zhao, C.; Dong, J.; Roters, F.; Guan, D. Three-dimensional study of grain scale tensile twinning activity in magnesium: A combination of microstructure characterization and mechanical modeling. Acta Mater. 2023, 255, 119043. [Google Scholar] [CrossRef]
- ASTM A751-25; Standard Test Methods and Practices for Chemical Analysis of Steel Products. ASTM International: West Conshohocken, PA, USA, 2025.
- ASTM A240/A240M-12; Standard Specification for Chromium and Chromium-Nickel Stainless Steel, Plate, Sheet, and Strip for Pressure Vessels and for General Applications. ASTM International: West Conshohocken, PA, USA, 2012.
- Liu, T.; Xia, S.; Zhou, B.; Bai, Q.; Rohrer, G.S. Three-dimensional geometrical and topological characteristics of grains in conventional and grain boundary engineered 316L stainless steel. Micron 2018, 109, 58–70. [Google Scholar] [CrossRef] [Scilit]
- Groeber, M.; Jackson, M. DREAM.3D: A Digital Representation Environment for the Analysis of Microstructure in 3D. Integr. Mater. Manuf. Innov. 2014, 3, 56–72. [Google Scholar] [CrossRef] [Scilit]
- Brandon, D.G. The structure of high-angle grain boundaries. Acta Metall. 1966, 14, 1479–1484. [Google Scholar] [CrossRef] [Scilit]
- Randle, V.; Owen, G. Mechanisms of grain boundary engineering. Acta Mater. 2006, 54, 1777–1783. [Google Scholar] [CrossRef] [Scilit]
- Wang, C.; Duan, H.; Chen, C.; Wu, P.; Qi, D.; Ye, H.; Jin, H.-J.; Xin, H.L.; Du, K. Three-Dimensional Atomic Structure of Grain Boundaries Resolved by Atomic-Resolution Electron Tomography. Matter 2020, 3, 1999–2011. [Google Scholar] [CrossRef] [Scilit]
- Liu, T.; Xia, S.; Zhou, B.; Bai, Q.; Rohrer, G.S. Three-dimensional characteristics of the grain boundary networks of conventional and grain boundary engineered 316L stainless steel. Mater. Charact. 2017, 133, 60–69. [Google Scholar] [CrossRef] [Scilit]
- Li, H.; Xia, S.; Bai, Q.; Liu, T.; Zhang, Y. An alignment algorithm using coherent twin boundaries as internal reference in 3D-EBSD. J. Microsc. 2025, 297, 43–56. [Google Scholar] [CrossRef] [Scilit] [PubMed]
- Mahajan, S.; Pande, C.S.; Imam, M.A.; Rath, B.B. Formation of annealing twins in f.c.c. crystals. Acta Mater. 1997, 45, 2633–2638. [Google Scholar] [CrossRef] [Scilit]
- Gleiter, H. The formation of annealing twins. Acta Metall. 1969, 17, 1421–1428. [Google Scholar] [CrossRef] [Scilit]
- Winning, M.; Gottstein, G.; Shvindlerman, L.S. On the mechanisms of grain boundary migration. Acta Mater. 2002, 50, 353–363. [Google Scholar] [CrossRef] [Scilit]
- Bulatov, V.V.; Reed, B.W.; Kumar, M. Grain boundary energy function for fcc metals. Acta Mater. 2014, 65, 161–175. [Google Scholar] [CrossRef] [Scilit]
- Cayron, C. Quantification of multiple twinning in face centred cubic materials. Acta Mater. 2011, 59, 252–262. [Google Scholar] [CrossRef] [Scilit]
- Cao, L.C.; Li, C.C.; Shen, F.L.; Ma, T.J.; Pan, L.T.; Xin, W.H.; Lyu, Z.; Fang, X.Y.; Li, L.J. In-situ grain refinement induced by multiple twinning in 316L austenitic stainless steel fabricated by laser powder-bed fusion. J. Mater. Sci. 2025, 60, 22270–22288. [Google Scholar] [CrossRef] [Scilit]
- Frary, M.; Schuh, C.A. Connectivity and percolation behaviour of grain boundary networks in three dimensions. Philos. Mag. 2005, 85, 1123–1143. [Google Scholar] [CrossRef] [Scilit]
- Ullah, A.; Liu, G.Q.; Luan, J.H.; Li, W.W.; Rahman, M.U.; Ali, M. Three-dimensional visualization and quantitative characterization of grains in polycrystalline iron. Mater. Charact. 2014, 91, 65–75. [Google Scholar] [CrossRef] [Scilit]
- Liu, T.; Xia, S.; Bai, Q.; Zhou, B.; Zhang, L.; Lu, Y.; Shoji, T. Three-dimensional study of grain boundary engineering effects on intergranular stress corrosion cracking of 316 stainless steel in high temperature water. J. Nucl. Mater. 2018, 498, 290–299. [Google Scholar] [CrossRef] [Scilit]
- Birch, R.; Li, S.; Sharang, S.; Poole, W.J.; Britton, B. Large volume ‘chunk’ lift out for 3D tomographic analysis using analytical plasma focussed ion beam—Scanning electron microscopy. Micron 2026, 203, 103986. [Google Scholar] [CrossRef] [Scilit] [PubMed]
- Zaefferer, S.; Wright, S.; Raabe, D. 3D-Orientation Microscopy in a FIB SEM: A New Dimension of Microstructure Characterization. Microsc. Microanal. 2007, 13, 1508–1509. [Google Scholar] [CrossRef] [Scilit]
- Gertsman, V.Y.; Henager, C.H. Grain boundary junctions in microstructure generated by multiple twinning. Interf. Sci. 2003, 11, 403–415. [Google Scholar] [CrossRef] [Scilit]
- Xia, S.; Ma, Y.; Bai, Q. Effects of the Primary Carbide Distribution on the Evolution of the Grain Boundary Character Distribution in a Nickel-Based Alloy. Metals 2024, 14, 960. [Google Scholar] [CrossRef] [Scilit]
Disclaimer/Publisher’s Note: The statements, opinions and data contained in all publications are solely those of the individual author(s) and contributor(s) and not of MDPI and/or the editor(s). MDPI and/or the editor(s) disclaim responsibility for any injury to people or property resulting from any ideas, methods, instructions or products referred to in the content. |
© 2026 by the authors. Licensee MDPI, Basel, Switzerland. This article is an open access article distributed under the terms and conditions of the Creative Commons Attribution (CC BY) license.