


Abstract
Extracting reliable corrosion kinetic parameters from polarization curves is particularly challenging for X70 steel under the synergistic effect of microbiologically influenced corrosion (MIC) and alternating current (AC) interference, as both factors significantly distort the electrochemical response. To address this, a novel fitting strategy was developed. In this approach, the overall polarization curve is reconstructed by combining separately modeled anodic and cathodic branches. To preserve the shape of the polarization curve, a slope-consistency constraint was enforced through dynamic penalty factors that balance fitting accuracy with shape preservation during optimization, which was performed using an intelligent algorithm. The results demonstrate the robustness of the proposed strategy, demonstrating low sensitivity to initial guesses and algorithmic parameters. Evaluation confirms that accuracy is maintained even when the data density is reduced by half. Among the parameters extracted, the Tafel slopes and corrosion current density show higher reliability than others. This work provides a robust and effective tool for the kinetic analysis of complex corrosion systems involving MIC and AC.
1. Introduction
MIC can cause severe degradation of metallic infrastructure [1,2,3], accounting for approximately 20% of global corrosion losses annually, with particularly high failure rates in critical sectors such as oil wells and buried pipelines [4]. MIC arises from microbial metabolism and is subsequently exacerbated by field environments where microorganisms synergistically interact with other factors, leading to accelerated and unpredictable material failure [5,6,7]. For buried pipelines, the corrosion scenario is further complicated by the superimposed threat of AC interference, which introduces additional electrochemical disturbances and significantly intensifies metal dissolution [8,9]. The combination of MIC and AC therefore results in an exceptionally complex corrosion system that challenges both monitoring and mechanistic interpretation.
Electrochemical polarization measurements are essential for investigating corrosion processes, providing key kinetic parameters, including corrosion potential, corrosion current density, and Tafel slopes. The accurate extraction of these kinetic parameters is therefore crucial for understanding the corrosion mechanisms. The traditional Tafel extrapolation method is widely used due to its simplicity [10,11]. However, it relies heavily on the researcher’s subjective selection of linear Tafel regions [12,13], introducing considerable variability into the analysis results.
Recent methodological advances have addressed these limitations through more rigorous mathematical frameworks. Lukacs and Kristóf [14,15,16] developed linearized transformations and quadratic approximations of the Butler–Volmer equation, enabling accurate parameter estimation from intermediate polarization ranges without requiring extensive Tafel regions. These methods reduce the need for high polarization potentials that may alter electrode surfaces and show strong consistency with conventional semilogarithmic fitting. Meanwhile, Shen et al. [17] proposed an extended Butler–Volmer fitting approach incorporating mass transport corrections, demonstrating its reliability in systems where conventional Tafel analysis fails due to high exchange current densities relative to limiting current. These studies highlight the importance of robust fitting frameworks, yet their application to highly dynamic systems such as those involving MIC and AC interference remains unexplored.
To minimize subjectivity, fitting the entire polarization curve to the Butler–Volmer equation has been proposed as a more objective alternative [18,19]. However, under MIC and AC conditions, this approach faces exacerbated challenges. The continuously evolving biofilm and corrosion product layers modify the electrode surface state, preventing it from reaching a uniform and steady state assumed in classic electrochemical theory. Meanwhile, AC interference distorts the potential–current response, resulting in severely distorted polarization curves that lack clear Tafel regions [20]. These deviations hinder accurate parameter determination. Moreover, even for well-defined curves, fitting multiple interdependent parameters in the Butler–Volmer equation presents a complex, non-convex optimization problem. The strong interdependence among fitting variables makes results highly sensitive to initial guesses, often leading to convergence at local minima and physically implausible solutions [21]. Most importantly, the standard Butler–Volmer equation describes only the net current, making it inherently difficult to decouple and reliably extract individual anodic and cathodic process kinetics from the total curve—a fundamental limitation for mechanistic analysis in complex systems like AC-MIC.
Therefore, improving polarization curve analysis for such complex systems requires new fitting strategies that (1) ensure both local accuracy and global shape consistency, (2) reduce sensitivity to initial guesses and avoid local minima, and (3) effectively decouple the contributions of individual electrode processes to enable mechanistic insight. To date, dedicated studies addressing these integrated challenges remain scarce.
In this work, a novel fitting strategy was developed for the polarization curve of X70 steel under MIC and AC interference. In the proposed strategy, anodic and cathodic polarization curves were calculated and combined to generate the synthesized polarization curve, revealing more information about each electrode process. Moreover, a slope-consistency criterion is introduced to preserve curve shape, guided by dynamic penalty factors that balance fitting objectives during optimization. The fitting strategy is solved efficiently using the intelligent optimization algorithm to ensure robust convergence. The reliability of extracted parameters, the sensitivity to algorithm settings and data processing, and the selection of the potential window were evaluated to analyze the effectiveness of the fitting results. This approach offers a physically transparent and computationally robust tool for analyzing complex corrosion systems, aiming to make polarization curve interpretation more accessible.
2. Experiments and Methods
2.1. Experiments
X70 pipeline steel was used as the working electrode, with the chemical composition (wt%) as follows: C 0.045, Si 0.26, Mn 1.48, Nb 0.033, Ni 0.16, Cr 0.17, Cu 0.21, S 0.001, P 0.0017, and Fe balance, as provided by the manufacturer. The specimen was machined into a 10 mm × 10 mm × 2 mm coupon, with the 10 mm × 10 mm surface designated as the working area. The specimen was sequentially immersed and cleaned with anhydrous ethanol to remove oil, followed by tin-welding a copper wire to its back. It was then encapsulated in epoxy resin, ensuring that no bubbles formed near the working surface. The exposed working surface was ground sequentially with 180#, 240#, 400#, 600#, 800#, 1200#, and 1500# grit SiC sandpaper until a uniform, scratch-free surface was achieved. Finally, the specimen was rinsed with deionized water, wiped with ethanol, ultrasonically cleaned, dehydrated with anhydrous ethnol, and dried with cold air for storage.
The experimental solution was prepared by inoculating 9 mL of an enriched SRB culture (Paradesulfovibrio bizertensis) into 900 mL of a seawater-based Postgate’s C (PGC) medium. The medium was adjusted to pH 7.0, and prior to inoculation, it had been previously deoxygenated by nitrogen purging for 30 min and sterilized in an autoclave at 121 °C for 20 min. The chemical composition of the PGC medium is listed in Table 1 [22].
Table 1.
Chemical composition of the PGC medium.
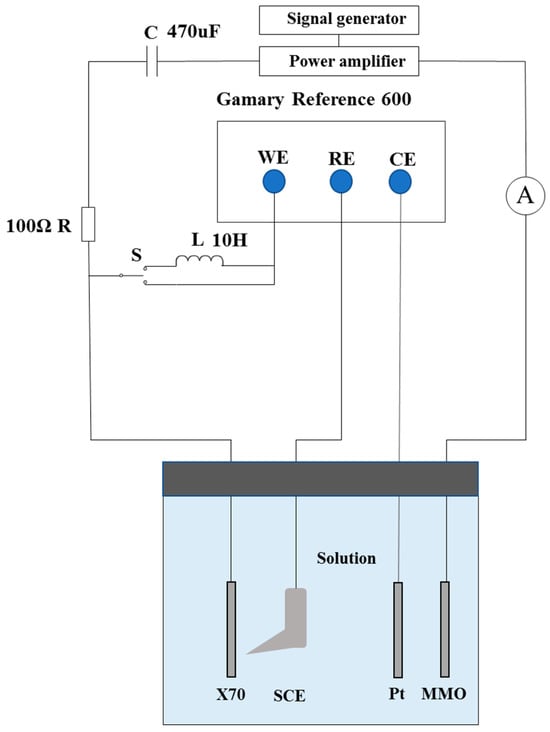
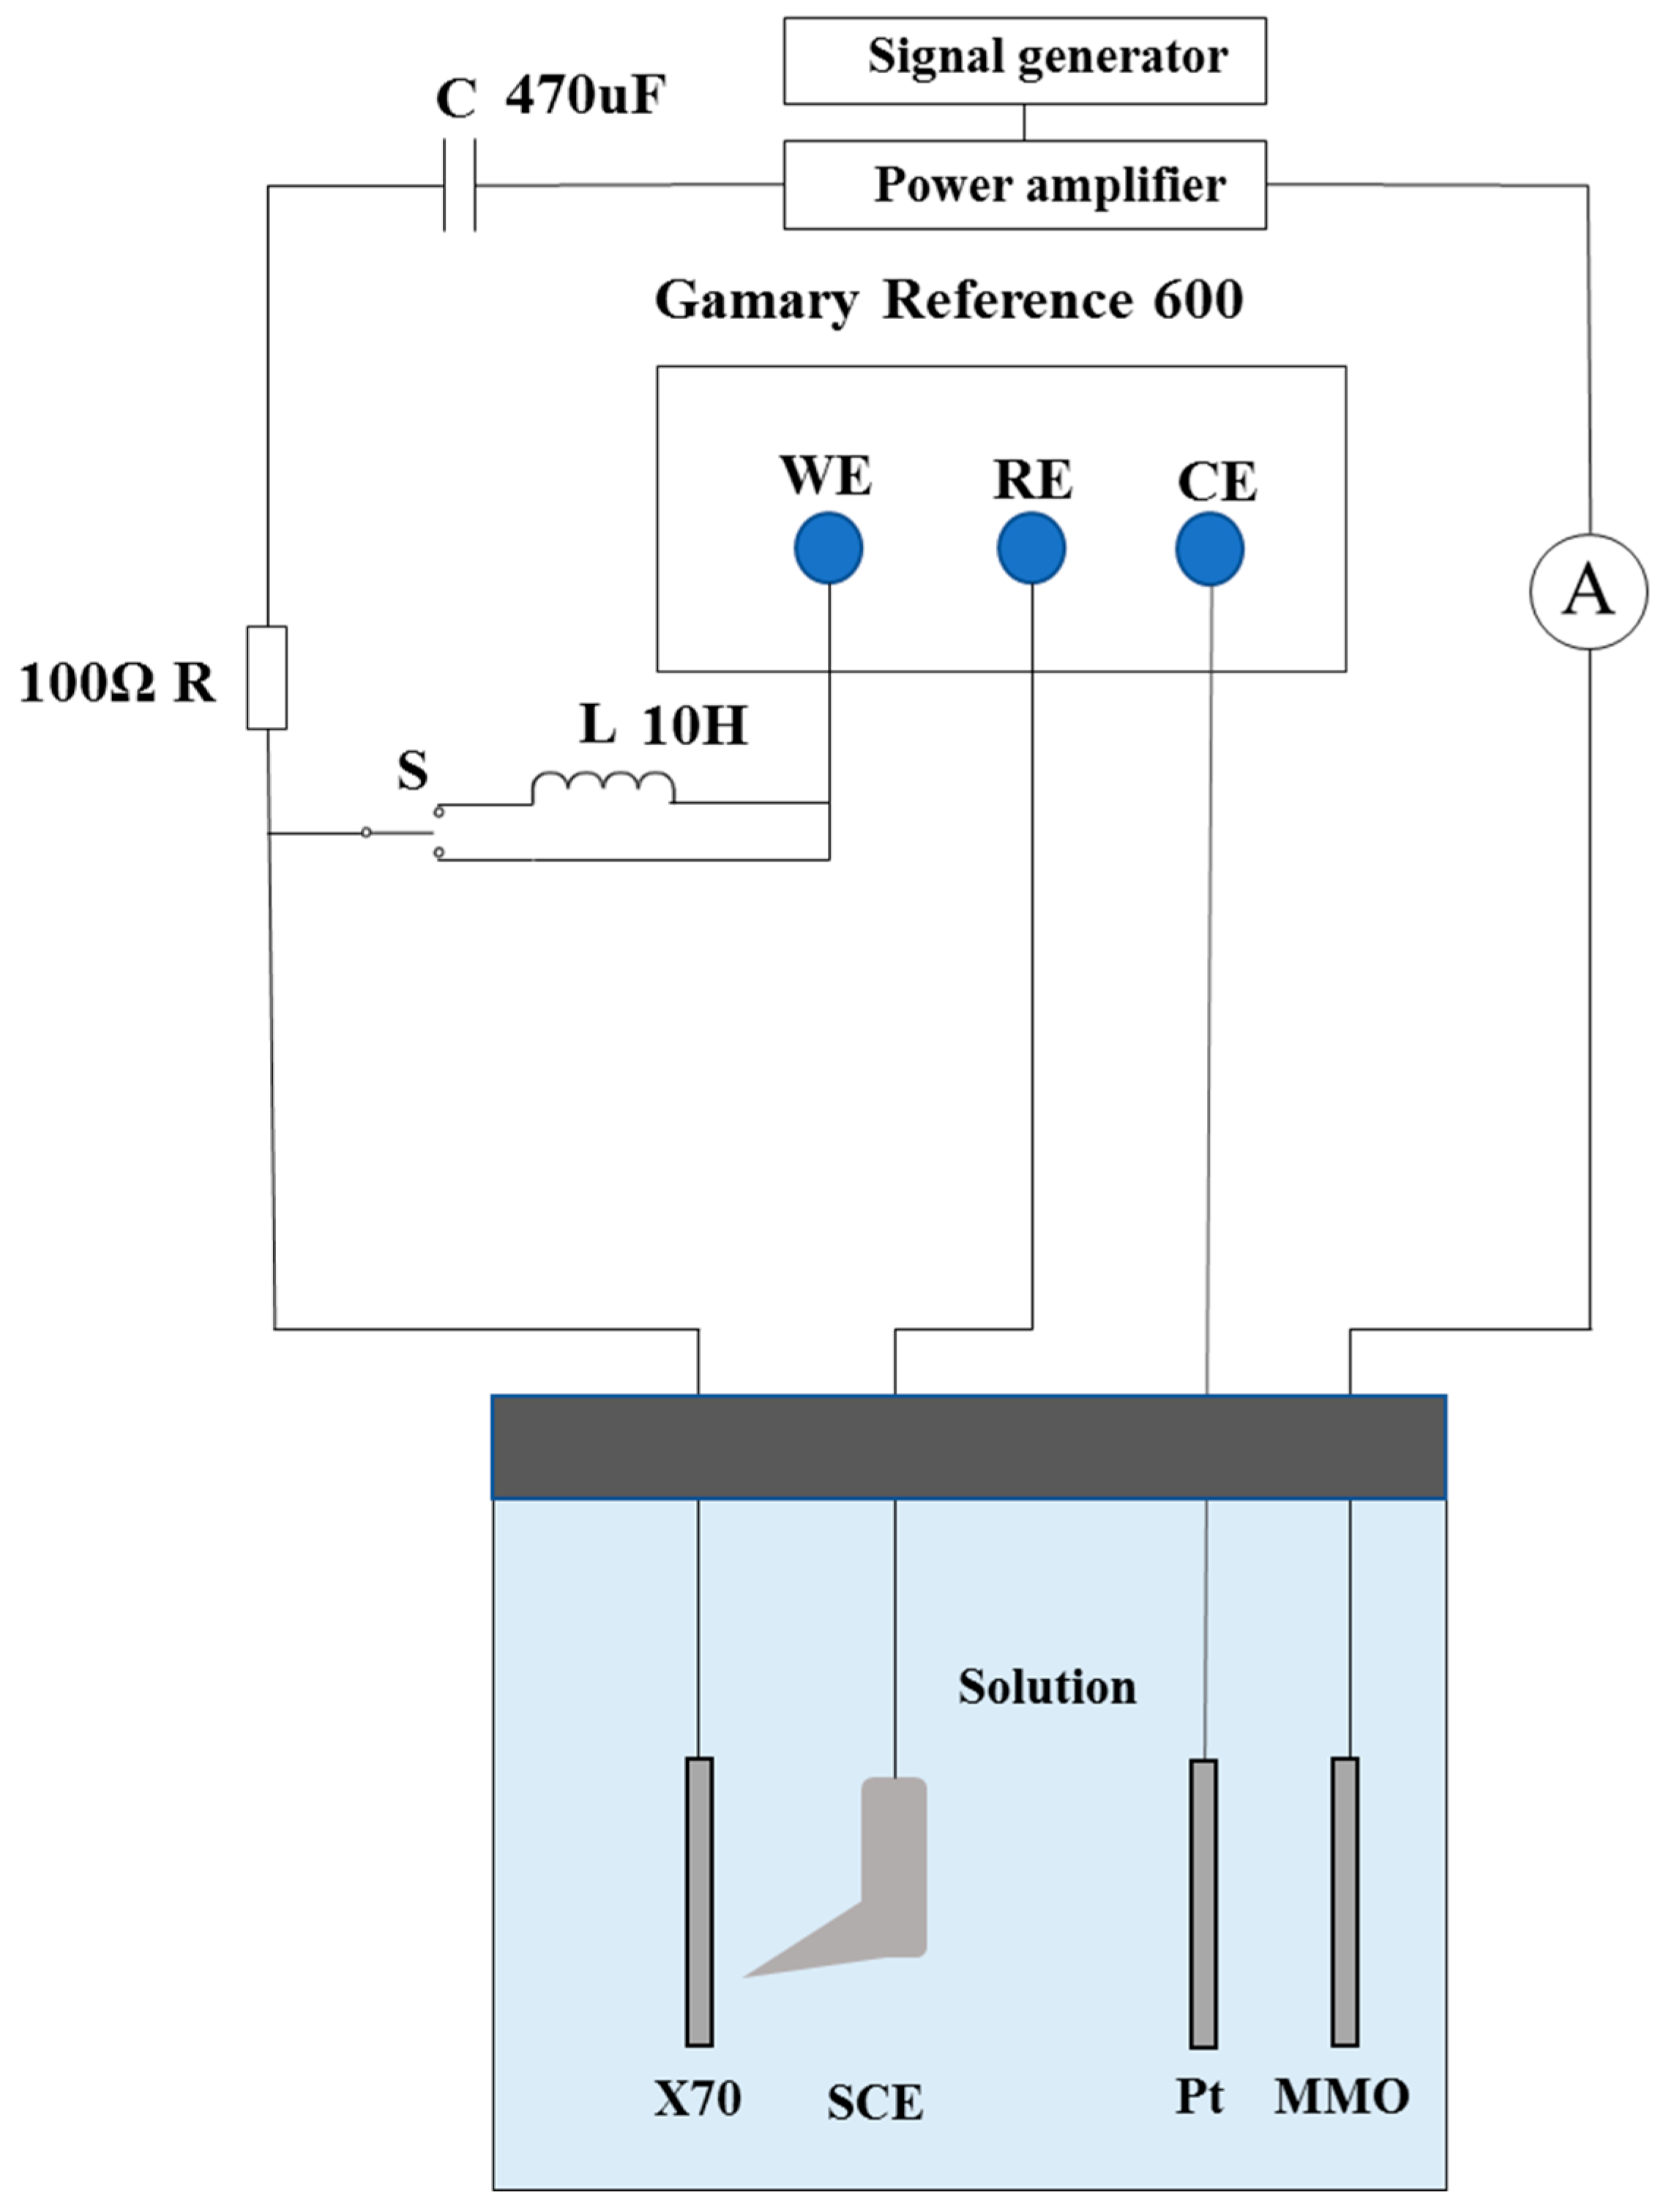
Figure 1 illustrates the electrochemical experimental setup for the polarization test of X70 steel under the combined influence of AC interference and SRB in a simulated marine environment. A 50Hz, 30A/m2 AC signal, generated by a constant-voltage AC source consisting of a signal generator (FY2300, Feel Technology, Dongguan, China) and a power amplifier (FPA301, Feel Technology, China), was applied between the working electrode and a mixed metal oxide (MMO) electrodes. A 100 Ω resistor was connected in series within the AC circuit to prevent short-circuiting, and a blocking capacitor (50 V, 470 µF) was included to decouple the DC polarization process from the AC interference. Furthermore, a blocking inductor (10 H) was connected in series in the polarization measurement circuit during polarization curve tests to prevent AC interference. All electrochemical measurements were performed using a Gamry Reference 600 potentiostat (Gamry Instruments, Warminster, PA, USA) with a standard three-electrode configuration: the X70 steel specimen as the working electrode (WE), a saturated calomel electrode (SCE) connected via a Luggin capillary as the reference electrode (RE), and a platinum sheet as the counter electrode (CE). Before the experiments, all electrodes, the salt bridge, and holders were sterilized under UV radiation for 30 min in a super-clean bench.
Figure 1.
The electrochemical experimental setup.
Polarization measurements can disturb MIC processes [23]. During high-amplitude polarization, biofilms are abruptly exposed to strong polarization conditions, preventing them from gradually adapting as they would when starting from the open-circuit potential (OCP). This alters the interfacial state, leading to distorted polarization curve shapes, significant shifts in corrosion potential, and large deviations in corrosion current density. To mitigate the impact of polarization on MIC processes, the weak polarization measurement was employed, in which the potential range of ±70 mV versus the OCP at a scan rate of 0.1666 mV/s [24]. Each polarization test was conducted in triplicate under identical conditions.
2.2. Methods
2.2.1. Theoretical Framework
To extract comprehensive kinetic parameters from the experimental data, the SYMADEC method, proposed by Flitt and Schweinsberg [25], was employed to fit the polarization curve. In SYMADEC, the Butler–Volmer equation is not directly applied to calculate the total curve. Instead, separate anodic and cathodic partial curves were calculated and combined to synthesize the total polarization curve, which provides more insight into each electrode process. Moreover, under combined MIC and AC conditions, the biofilm and corrosion product layers may lead to highly asymmetric and diffusion-influenced anodic and cathodic processes. The SYMADEC method independently models the cathodic and anodic branches while accounting for diffusion and resistance effects; therefore, it is particularly capable of capturing such asymmetry and non-ideality. Its mathematical basis is outlined below.
The cathodic reactions in MIC are hydrogen evolution. Under high activation overpotential, the cathodic overpotential, ηact,c, for a single reaction follows the Tafel equation:
where βc = −2.303RT/(αcnF) is the cathodic Tafel slope; α is transfer coefficient; n is the number of electrons involved in the reaction; F is the Faraday’s constant; R is the ideal gas constant; ic is the cathodic current density, i0,c is the cathodic exchange current density, and ηact,c = E − Ee,c; Ee,c is equilibrium potential of cathodic reaction.
Under the completed concentration polarization, the concentration overpotential, ηconc,c, is expressed as:
where iL is the limiting diffusion current density.
The total cathodic potential ηtotal,c is the sum of ηact,c and ηconc,c, which gives:
After derivation, the expression of the cathodic current density can be approximated by
The anodic current density is expressed as
where βa is the anodic Tafel slope, and i0,a is the anodic exchange current density; ηact,a = E − Ee,a is the anodic overpotential; Ee,a is equilibrium potential of anodic reaction.
During polarization measurements, a non-passive corrosion product layer may form on the working electrode surface. The resistance RΩ of this layer introduces an ohmic potential drop, which distorts the measured polarization curve. This distortion arises because the polarization current i includes an iRΩ drop and potential E is thus higher than the true interfacial potential Etrue:
Etrue = E − iRΩ
The SYMADEC method constructs a theoretical polarization curve by calculating and combining the independent anodic and cathodic polarization curves defined by Equations (4) and (5), and then adjusting the parameters governing these equations systematically until the synthesized curve aligns with the experimental data. The alignment between the measured and synthesized polarization curves can be quantified by the sum of squared errors (SSE). SSE minimization is commonly used to determine kinetic parameters by fitting Tafel polarization curve [26].
However, SSE minimization alone may not yield high-quality fits for curves containing steep slopes and plateaus, where small potential deviations cause large current density errors and distort the overall fit. To address this, we define a composite objective function (Equation (7)). The first term is the SSE, while the other two terms enforce slope-consistency between the experimental and fitted curves for both anodic and cathodic branches. This combined approach reduces point-wise errors while preserving the overall shape of the polarization curve.
Prioritizing slope-consistency ensures that the fitted curve maintains a shape consistent with the experimental curve. Subsequently, current magnitude consistency is employed to bring the fitted curve as close as possible to the experimental data. This approach prevents the fitted curve from deviating significantly in shape from the experimental curve at the early stage of the fitting process, which could otherwise lead to convergence to a local optimum. In the experiments, the weak polarization method was employed to measure the polarization curves under the combined effect of MIC and AC. The obtained polarization curves exhibited monotonic behavior, making them suitable for the slope-consistency principle proposed in this paper. Under strong polarization conditions, the measured polarization curves are often distorted. However, according to the principles of the SYMADEC method, reasonable results can still be obtained provided that the parameters affecting the polarization curve are properly accounted for. The slope-consistency principle can still be applied to the fitting of distorted polarization curves, but it requires the use of a differential slope-consistency approach, which enforces agreement of higher-order derivatives to handle such complex curve shapes. This will be explored in our future work.
where Eexp and Etheory represent the experimental and fitted polarization potentials; kaexp, katheory and kcexp, kctheory are the anodic and cathodic branch slopes for the experimental and fitted data, respectively. εa and εc are the penalty factors. n is the number of data points.
The optimization variables are defined as follows:
where x1 is the cathodic Tafel slope (βc), x2 is the cathodic exchange current density (i0,c), x3 is the cathodic limiting diffusion current density (iL), x4 is the anodic Tafel slope (βa), x5 is the anodic exchange current density (i0,a), x6 is the cathodic resistance (Rc), x7 is the anodic resistance (Ra), and x8 is the solution pH, which is used to calculate the equilibrium potential of electrode reaction. Direct pH measurement in the sealed environment is challenging, as maintaining such an environment is necessary in MIC electrochemical tests to ensure controlled conditions and prevent contamination. Hence, pH was included as a fitting parameter. To prevent large fluctuations from affecting the fit, its allowable range was narrowly constrained based on preliminary experimental data. The bounds for these variables are given in Table 2.
X = [x1,x2,x3,x4,x5,x6,x7,x8]
Table 2.
Bounds of the optimization variables.
2.2.2. Fitting Strategy
Fitting the MIC weak polarization curve is therefore treated as an eight-parameter nonlinear optimization problem, where the parameters correspond to key electrochemical kinetic and system variables. These parameters define the theoretical polarization curve based on the SYMADEC model, which is generated by combining separate anodic and cathodic electrode processes. The composite objective function combines SSE with slope-consistency penalties to ensure both local fitting accuracy and global curve shape preservation.
Traditional gradient-based Newton methods are often unsuitable for this high-dimensional, non-convex problem due to their high sensitivity to initial guesses and propensity to converge to local minima [27]. To address these limitations, we used the Particle Swarm Optimization (PSO) algorithm, a population-based stochastic optimization technique inspired by the social behavior of bird flocking or fish schooling, as the fitting method. PSO is known for its simplicity, efficiency, and ease of implementation [28]. It requires only a few parameters to tune and has been successfully applied to a wide range of optimization problems. In PSO, a set of candidate solutions, referred to as particles, moves through the search space of the optimization problem. Each particle has a position and a velocity, representing a potential solution and its search direction, respectively. During the search process, each particle adjusts its movement based on personal best (pBest) and global best (gBest). At each iteration, the velocity and position of each particle are updated as follows:
vi(t + 1) = w·vi(t) + c1r1 (pBesti − xi(t)) + c2r2 (gBest − xi(t))
xi(t + 1) = xi(t) + vi(t + 1)
Here, vi and xi represent the velocity and position of particle; w is the inertia weight varying from w1 to w2; c1 and c2 are acceleration coefficients, and r1, r2 are random numbers uniformly distributed in [0, 1].
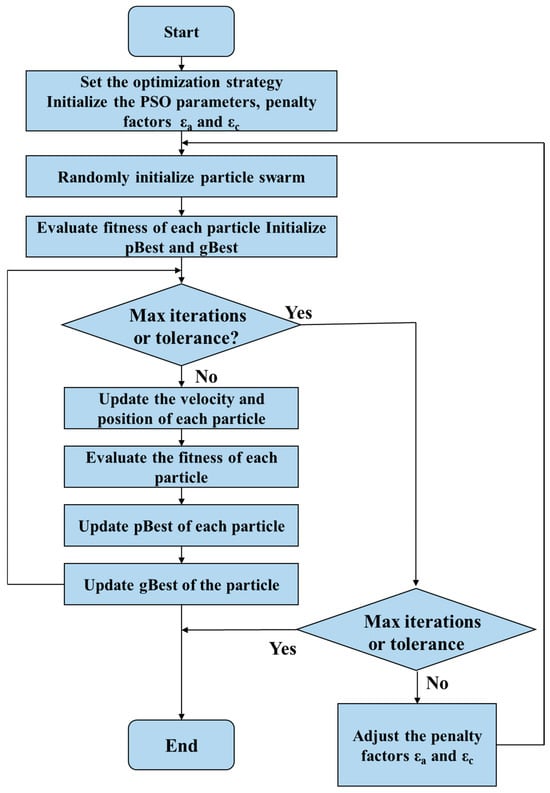
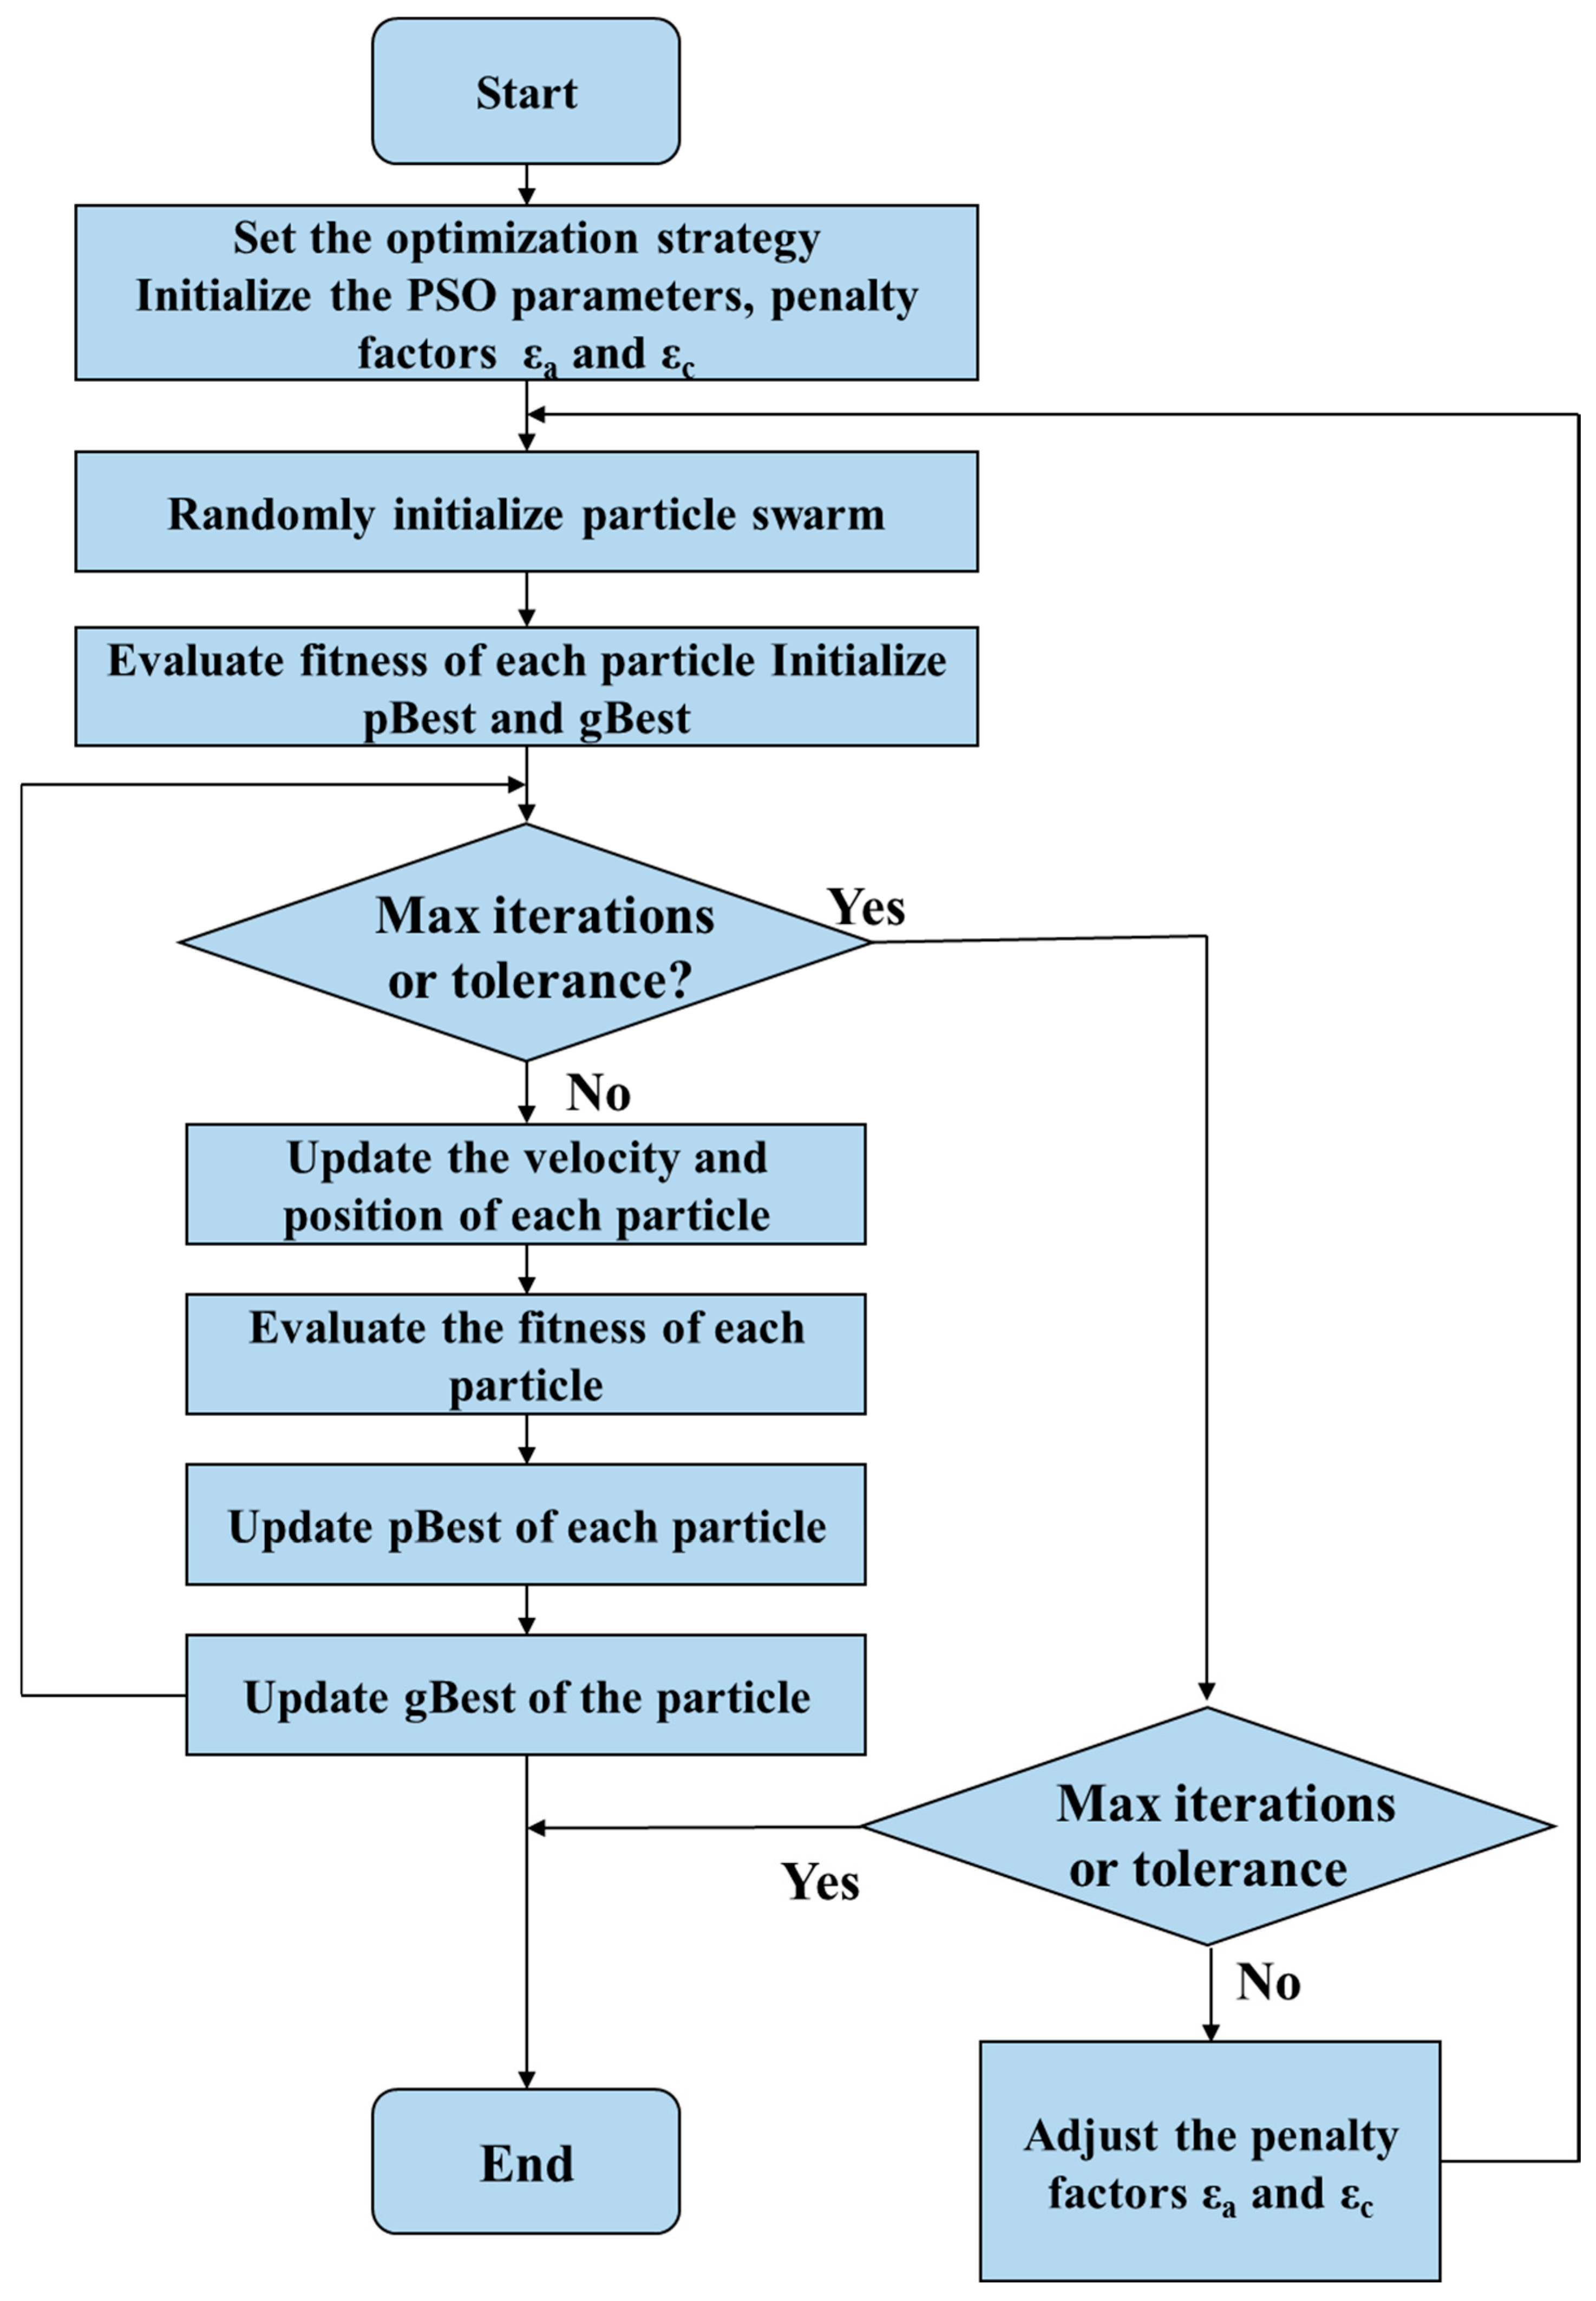
The proposed PSO-based optimization framework is illustrated in Figure 2, and the key parameters of the PSO algorithm are listed in Table 3. A phased penalty-reduction strategy was designed to guide the search effectively, and parameters used in the strategy are listed in Table 4. In the initial stages, larger penalty factors are applied to strongly enforce slope consistency between the experimental and fitted curves, prioritizing the preservation of the overall electrochemical shape. As the optimization progresses, these penalties are systematically reduced, gradually shifting the focus towards minimizing SSE to refine the precision of parameter values. This staged approach helps mitigate the risk of overfitting, a concern raised regarding multi-parameter models, by systematically constraining the search toward physically plausible solutions. The proposed optimization framework was implemented in C# on a computer (Dell, Round Rock, TX, USA) equipped with an Intel Core i7-13650HX processor and 16 GB of RAM.
Figure 2.
The proposed optimization framework based on PSO.
Table 3.
Key parameters of the PSO algorithm.
Table 4.
Parameters used in the phased penalty-reduction strategy.
3. Results and Discussion
3.1. Fitted Results
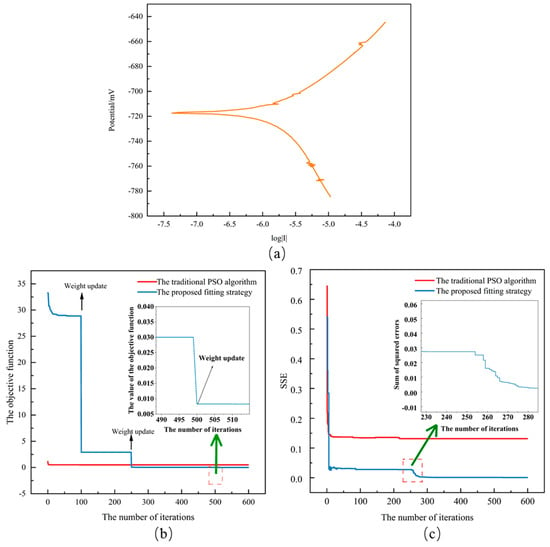
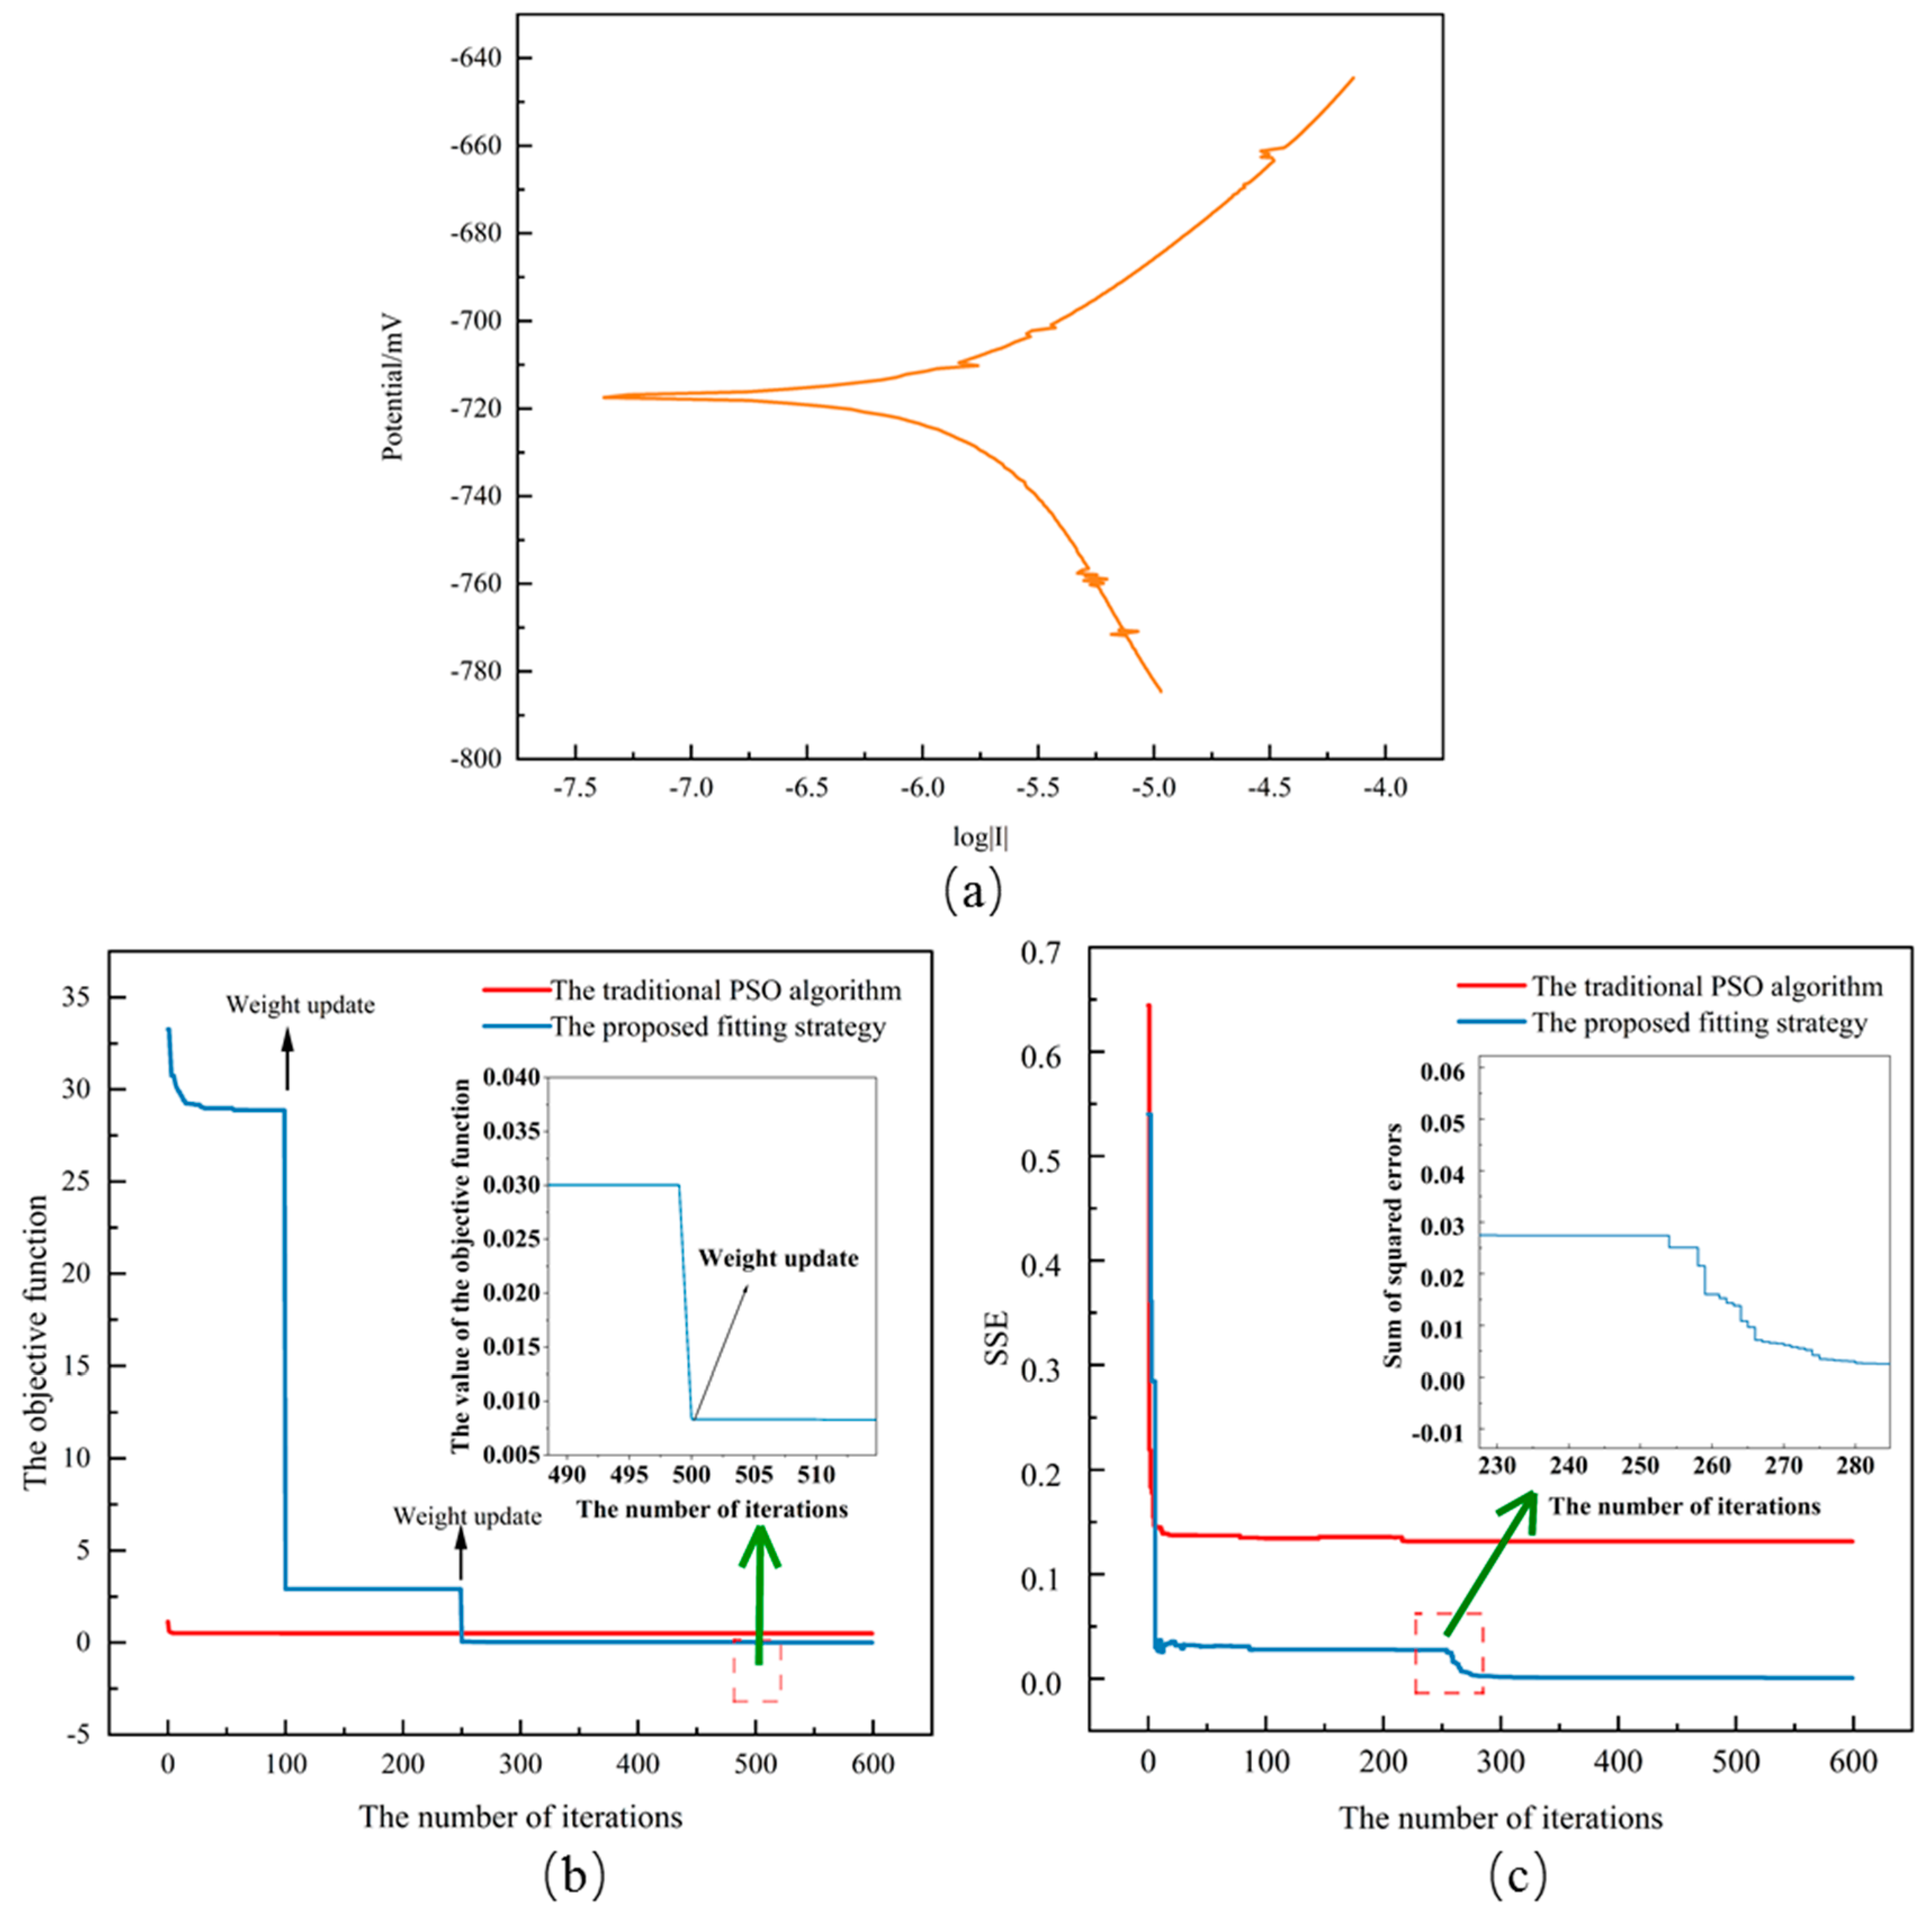
The fitted results are shown in Figure 3. Figure 3a shows the weak polarization curve measured after 2 days of immersion. The convergence behavior of the traditional PSO algorithm and the proposed strategy is compared in Figure 3b (objective function value) and Figure 3c (SSE). The traditional PSO exhibited pronounced premature convergence, with its objective function value rapidly decreasing from 1.13 to 0.5 within the first 5 iterations and the SSE plummeting from 0.64 to 0.13 within 20 iterations, after which both values stabilized with minimal further change.
Figure 3.
The tested weak polarization curve and the convergence curve of the fitting processes. (a) the tested weak polarization curve (b) the convergence curve of the objective function (c) the convergence curve of SSE.
In contrast, the proposed strategy demonstrated superior and progressive convergence. As illustrated in Figure 3b, the objective function value decreased significantly from 28.86 at iteration 100 to 2.91 at iteration 150, then to 0.056 at iteration 250, and further to 0.0083 at iteration 500, finally converging to 0.00784. This improvement was achieved by gradually reducing the penalty factors εa and εc from their initial value of 0.2 to 0.02 at iteration 100, and subsequently to 0.005 at iteration 250, thereby progressively shifting the optimization focus from trend similarity to precise point-wise alignment.
A quantitative comparison of the fitted kinetic parameters from the two methods is presented in Table 5. Significant discrepancies were observed. Notably, the cathodic Tafel slope fitted by the traditional PSO reached the lower bound of the search space, indicating an unreliable result. Furthermore, the corrosion current density obtained from the traditional PSO was substantially higher than that from the proposed strategy. Interestingly, the traditional PSO also yielded higher βc and βa, which typically correlate with lower corrosion rates. The discrepancy in the data and the boundary violation of βc highlight the poor performance of the traditional PSO for this fitting task and highlights the robustness of the proposed strategy. In addition, with the same number of iterations, the proposed strategy demonstrates higher convergence efficiency, with a computation time of 466 s, significantly better than the 840 s of the traditional PSO algorithm. This efficiency gain is primarily attributed to the robustness of the slope-consistency penalty, which enables reliable convergence with smaller population sizes than conventional PSO requires.
Table 5.
The fitted results of the traditional PSO and the proposed strategy.
It is important to note that under MIC conditions, cathodic kinetics are often influenced by biofilm-mediated electron transfer, enzymatic catalysis, and metabolite accumulation. Under AC interference, apparent Tafel slopes and exchange current densities may not strictly correspond to classical charge-transfer parameters [29]. Therefore, the parameters obtained from polarization curve fitting represent effective kinetic parameters under the combined influence of MIC and AC interference, rather than intrinsic electrochemical constants of the carbon steel corrosion process.
Although developed for X70 steel under MIC and AC interference, the slope-consistency principle of the proposed fitting strategy is potentially applicable to other corrosion systems where polarization curves exhibit non-ideal behavior, such as CO2 or H2S corrosion, strongly passivating systems, and localized corrosion. However, to achieve reliable fitting results, the electrochemical model must incorporate parameters that account for the specific factors influencing the polarization curve in each corrosion system.
3.2. Reliability of Fitted Kinetic Parameters
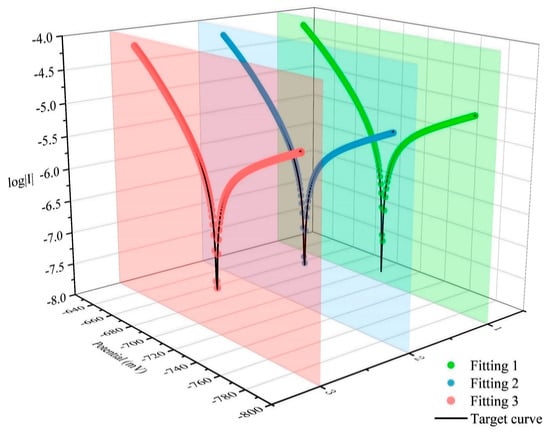
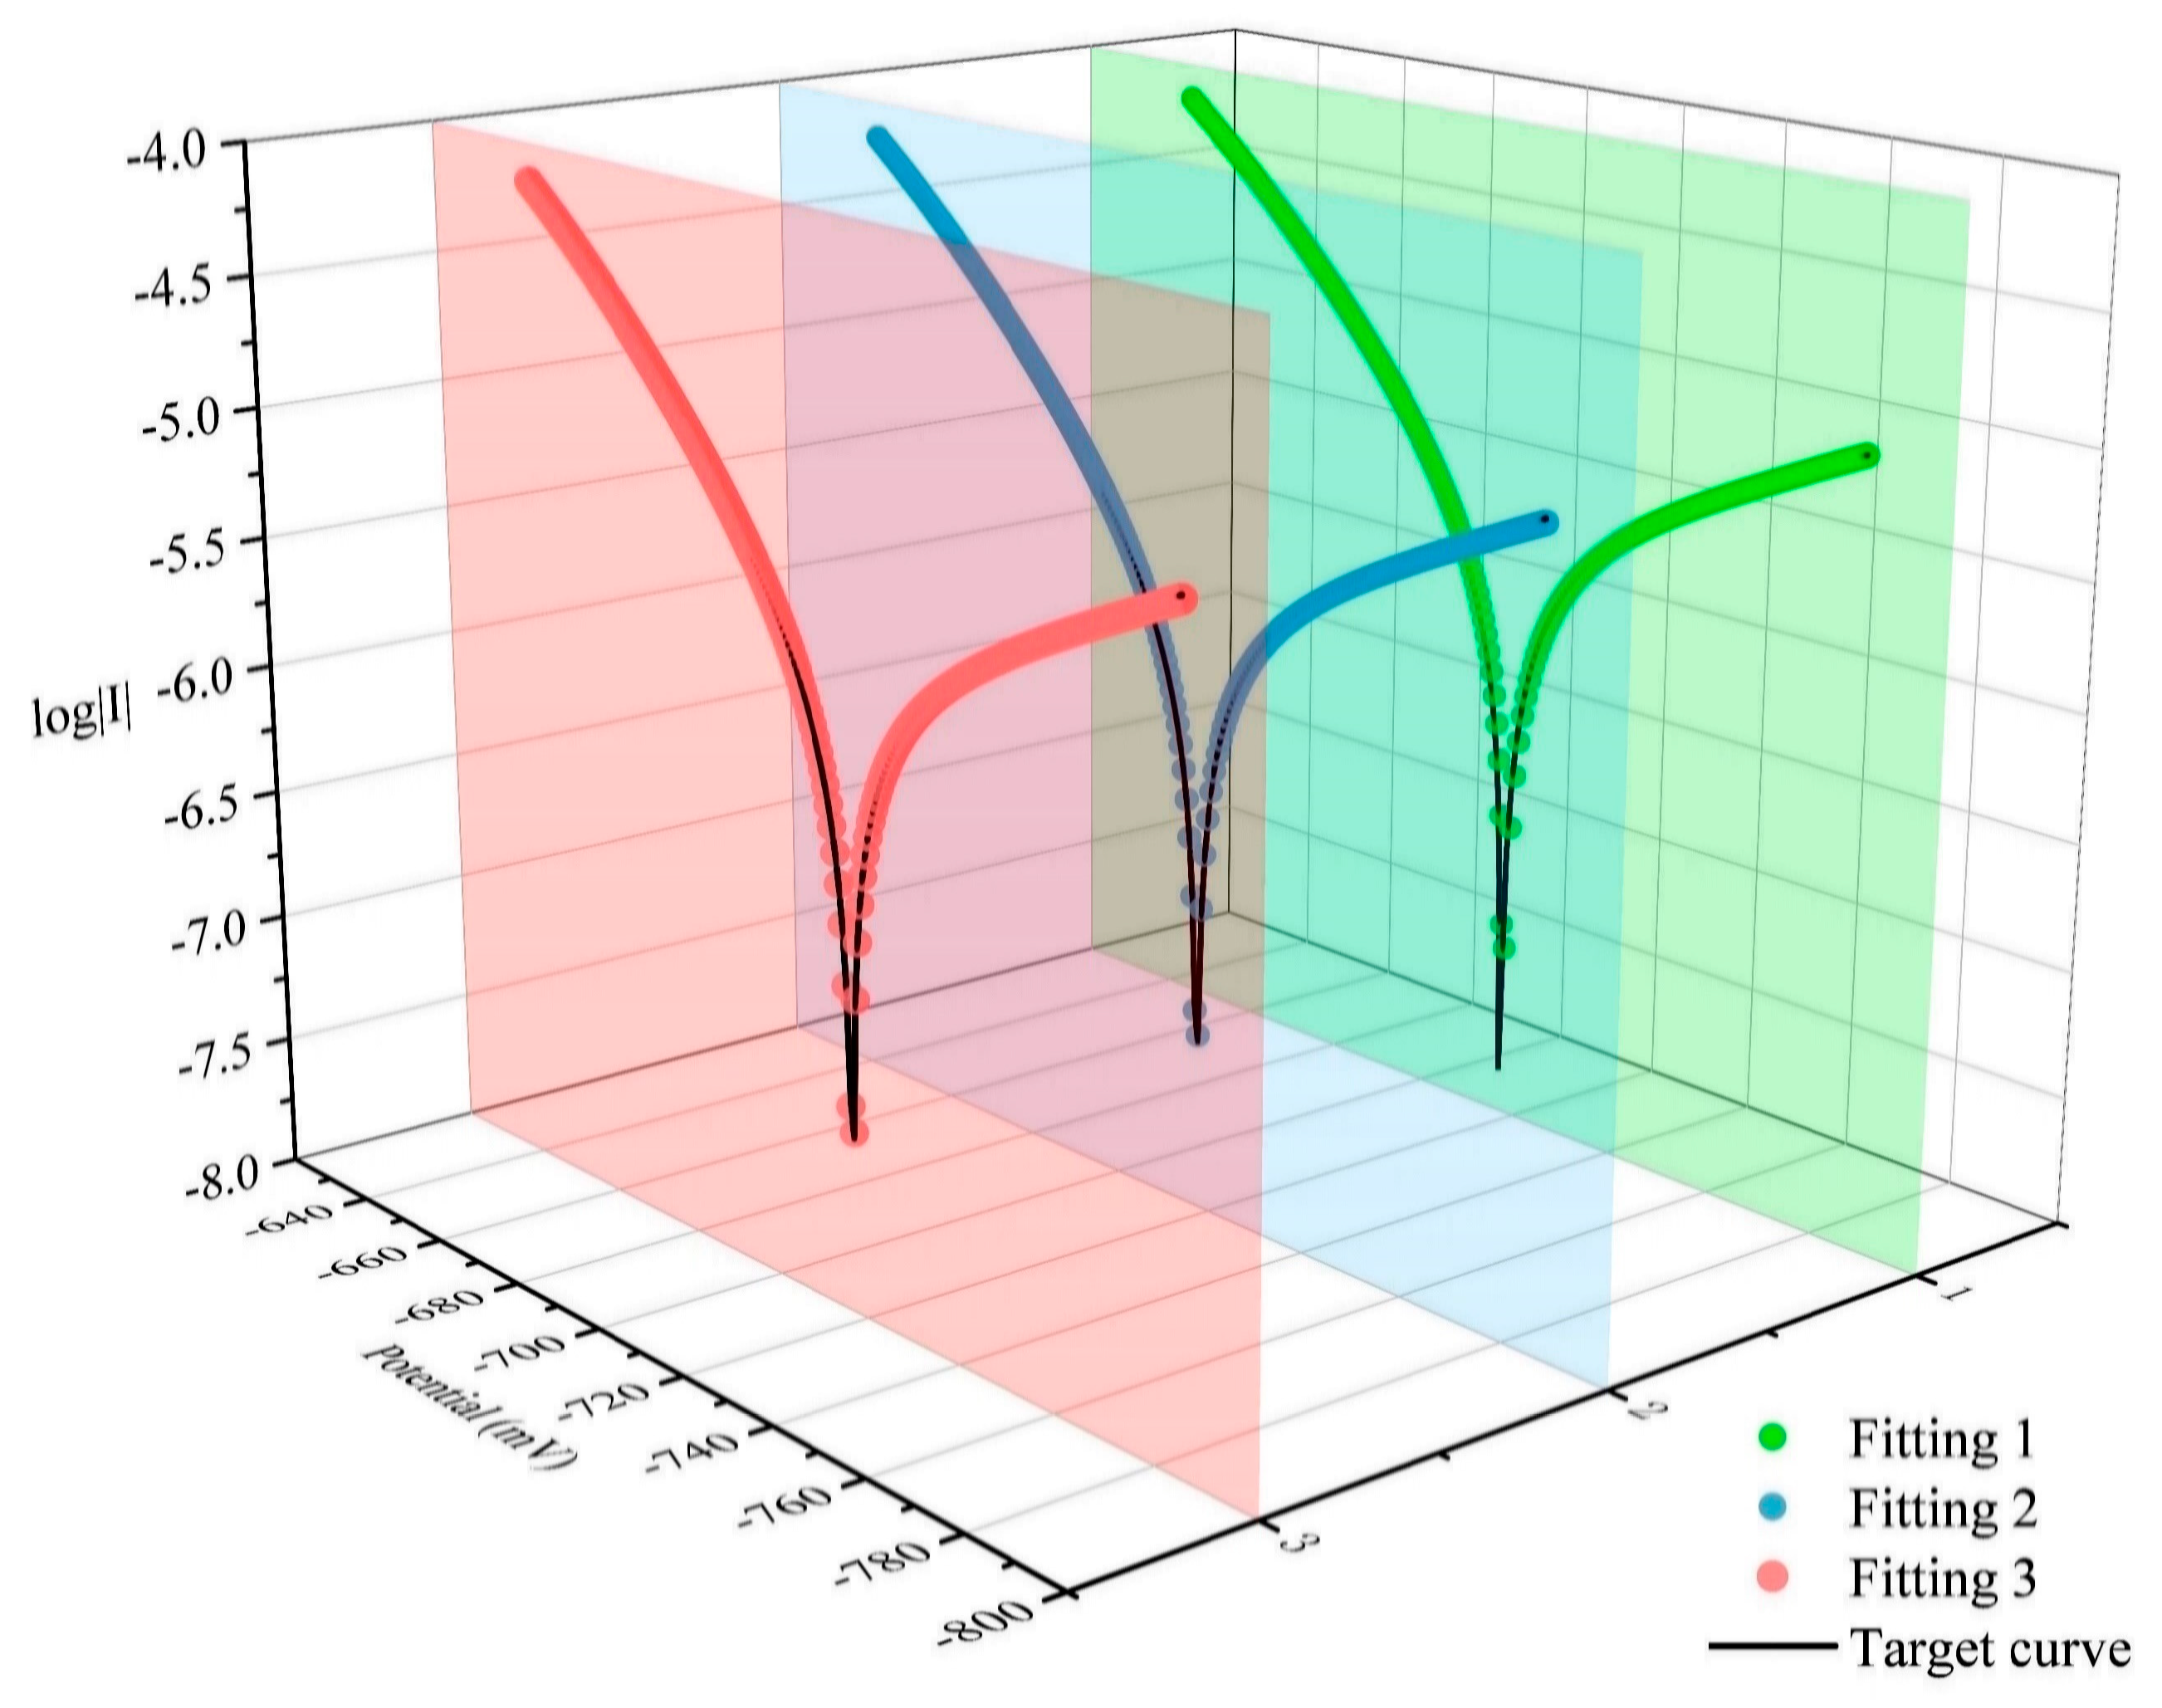
To validate the reliability of the proposed fitting strategy, a benchmark weak polarization curve was generated from simulated ideal polarization data. These data were generated from the SYMADEC model using a plausible set of known kinetic parameters. Three independent fitting analyses were performed on this benchmark curve. As shown in Figure 4, all three fitted curves exhibit excellent agreement with the original benchmark curve, visually confirming the strategy’s effectiveness.
Figure 4.
The fitting results of the curve generated from preset kinetic parameters.
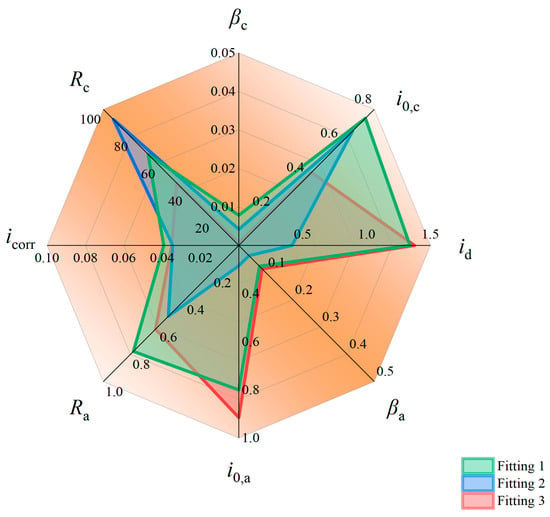
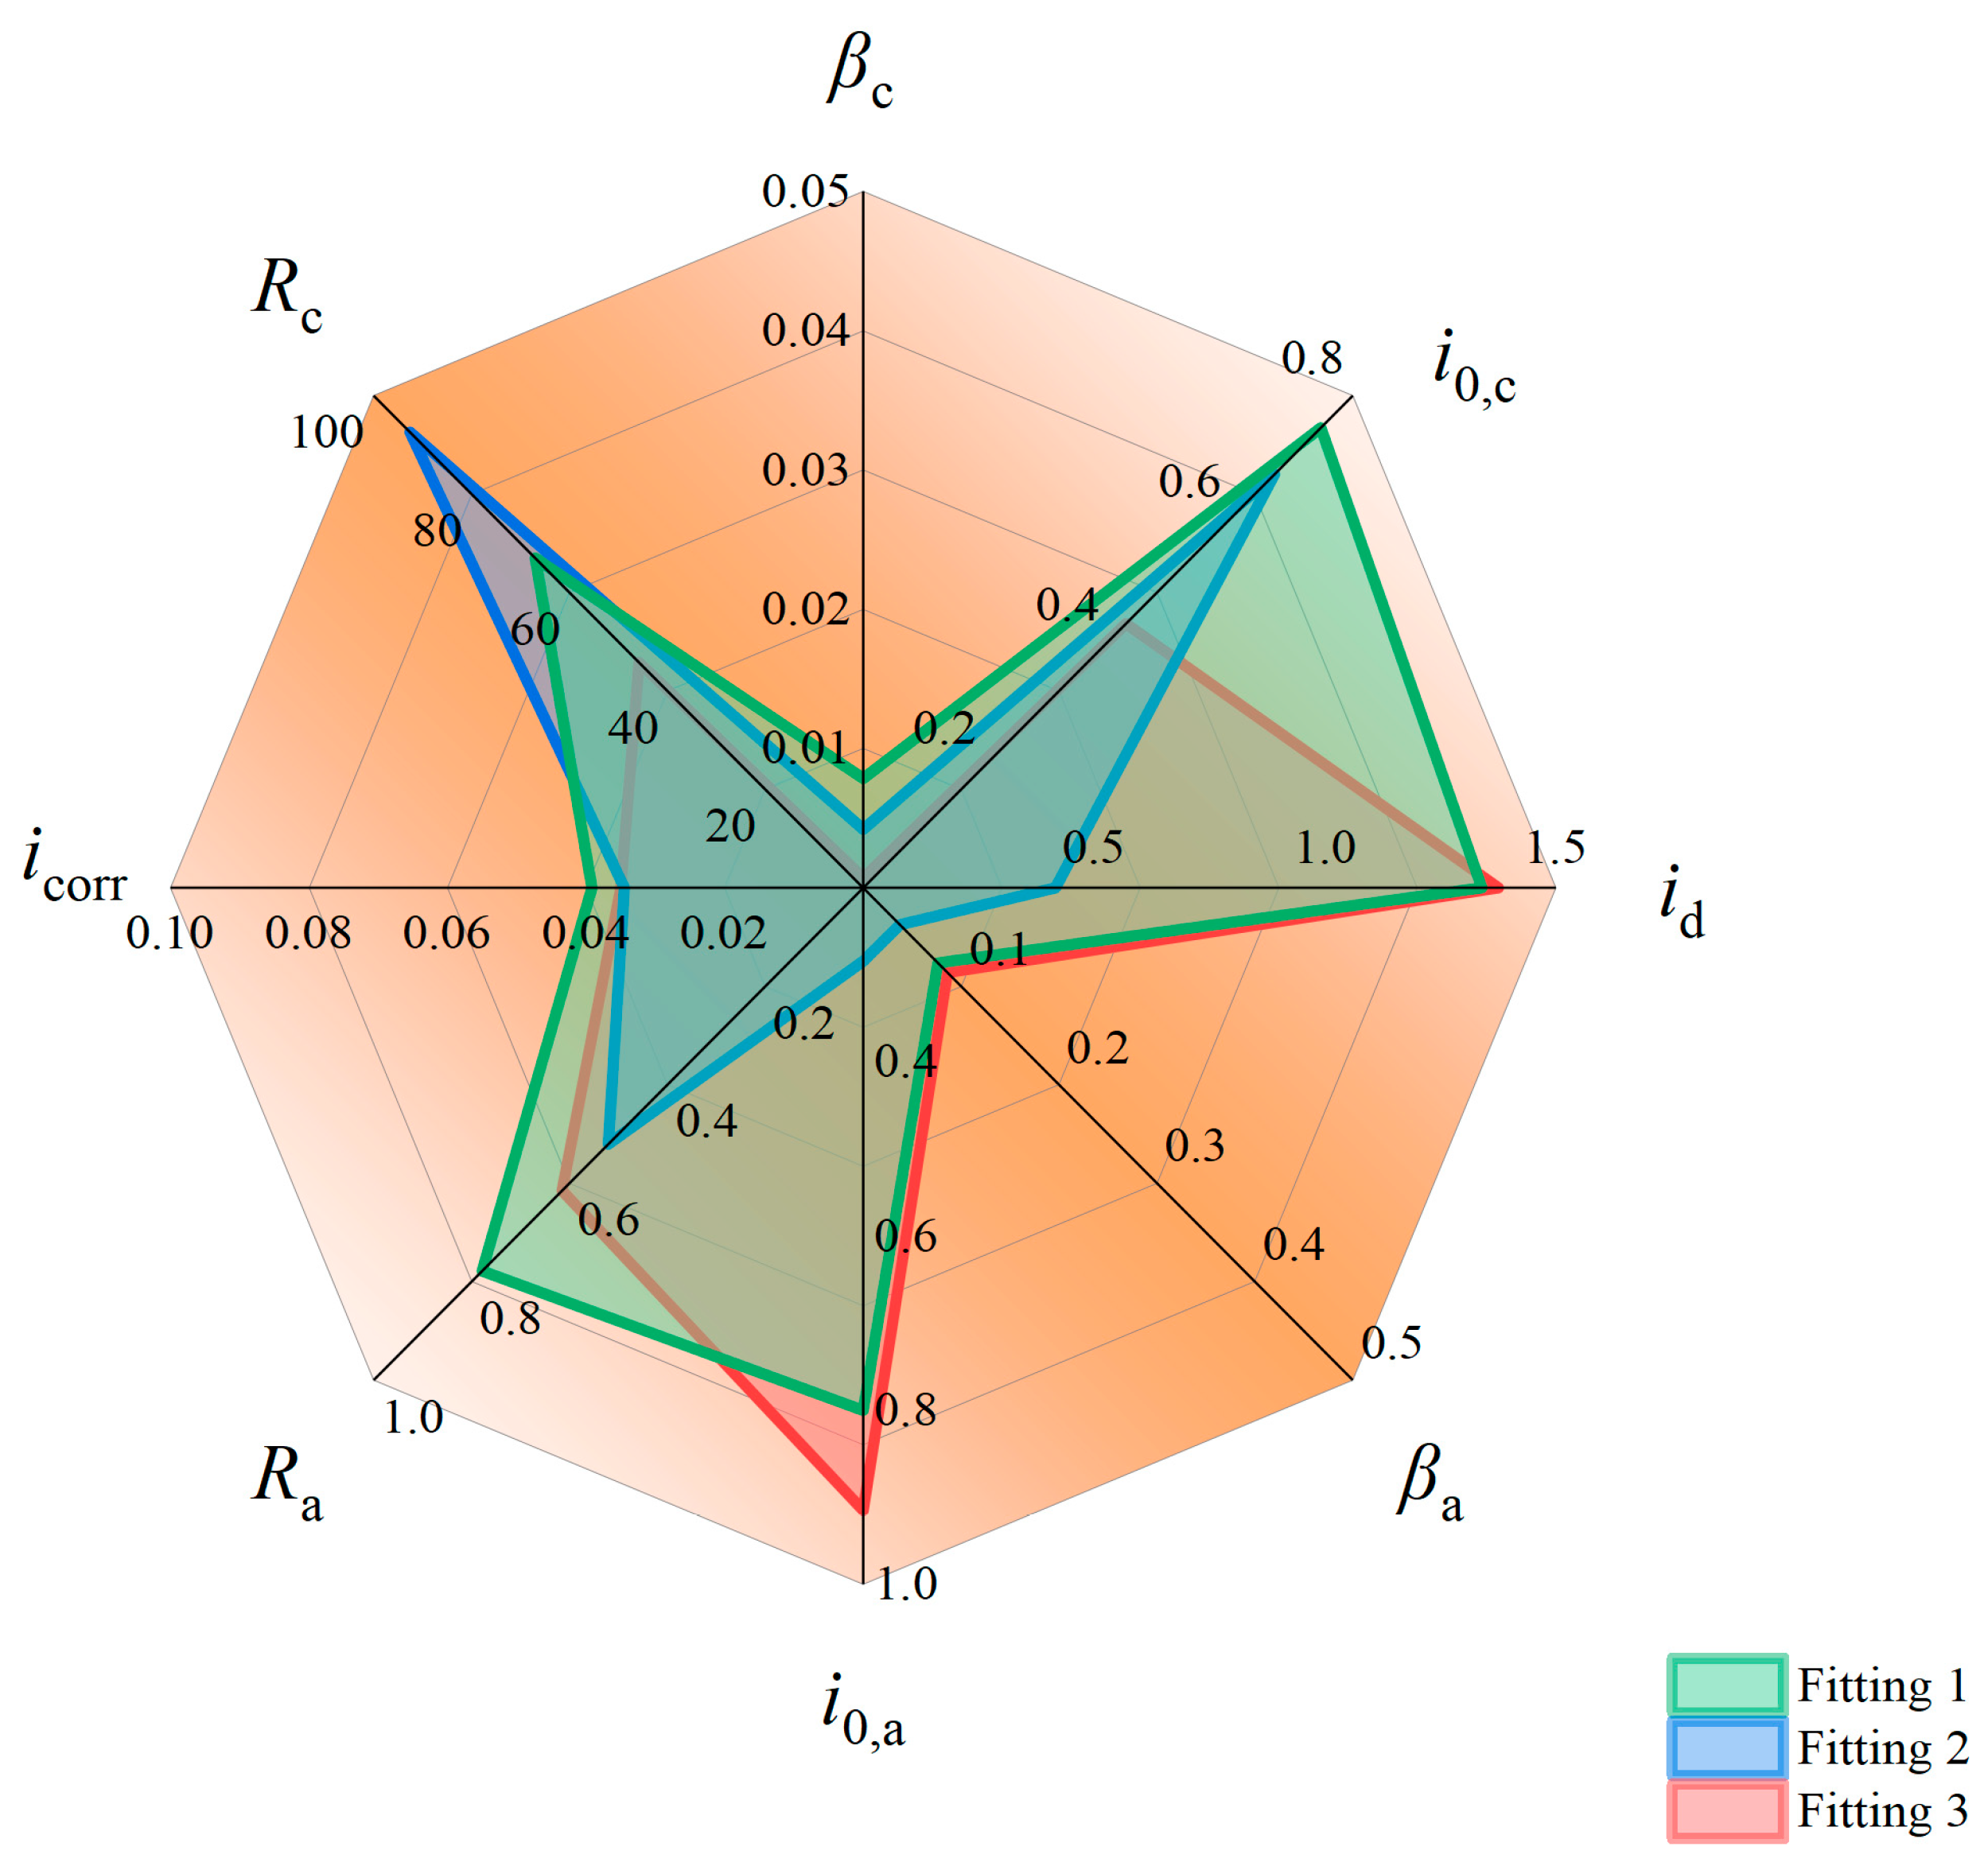
The relative errors between the fitted parameters and the reference values were calculated to quantitatively assess reliability, as shown in Figure 5. The Tafel slopes exhibited the highest reliability, with fitting errors ranging from 0.07% to 0.79% for the cathodic branch (βc) and 3.76% to 8.58% for the anodic branch (βa). In contrast, the exchange current densities (cathodic: 42.94–74.71%; anodic: 28.44–91.51%) and the limiting diffusion current density (41.67–137.60%) showed considerably larger uncertainties. The fitting errors for the resistances were the largest, particularly for the cathodic resistance (4576–9256%), whereas the anodic resistance errors were relatively lower (37.80–61.49%).
Figure 5.
The relative errors between the fitted and true parameters.
Most importantly, the corrosion current density, a critical parameter for corrosion rate assessment, was fitted with high consistency, showing minimal errors less than 4%. These results clearly demonstrate a hierarchy in the reliability of the fitted parameters: the Tafel slopes are the most reliable, followed by current–density-related parameters, while the resistance parameters are the least reliable. Crucially, the method provides a highly reliable estimate of the corrosion current density. It should be noted that Ra and Rc are treated as empirical fitting parameters that capture film-related interfacial complexity, rather than representing precise physical impedances. For quantitative impedance characterization, complementary EIS measurements are recommended.
The large fitting errors of the cathodic resistance parameters indicate that their contribution to the overall error is insensitive during the optimization of the objective function, making it difficult for the algorithm to uniquely determine their true values. In the MIC system under study, the cathodic reaction is likely limited mainly by charge transfer or mass transport control, while the surface film, which is primarily electronically conductive, has a relatively weak influence on the cathodic resistance. Within the weak polarization region, the variation in cathodic current is inherently limited, further diminishing its influence on the shape of the polarization curve. Together, these factors allow the parameter values to vary over a wide range without significantly altering the fitted curve.
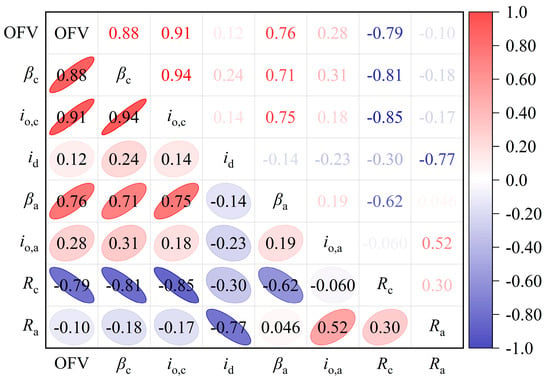
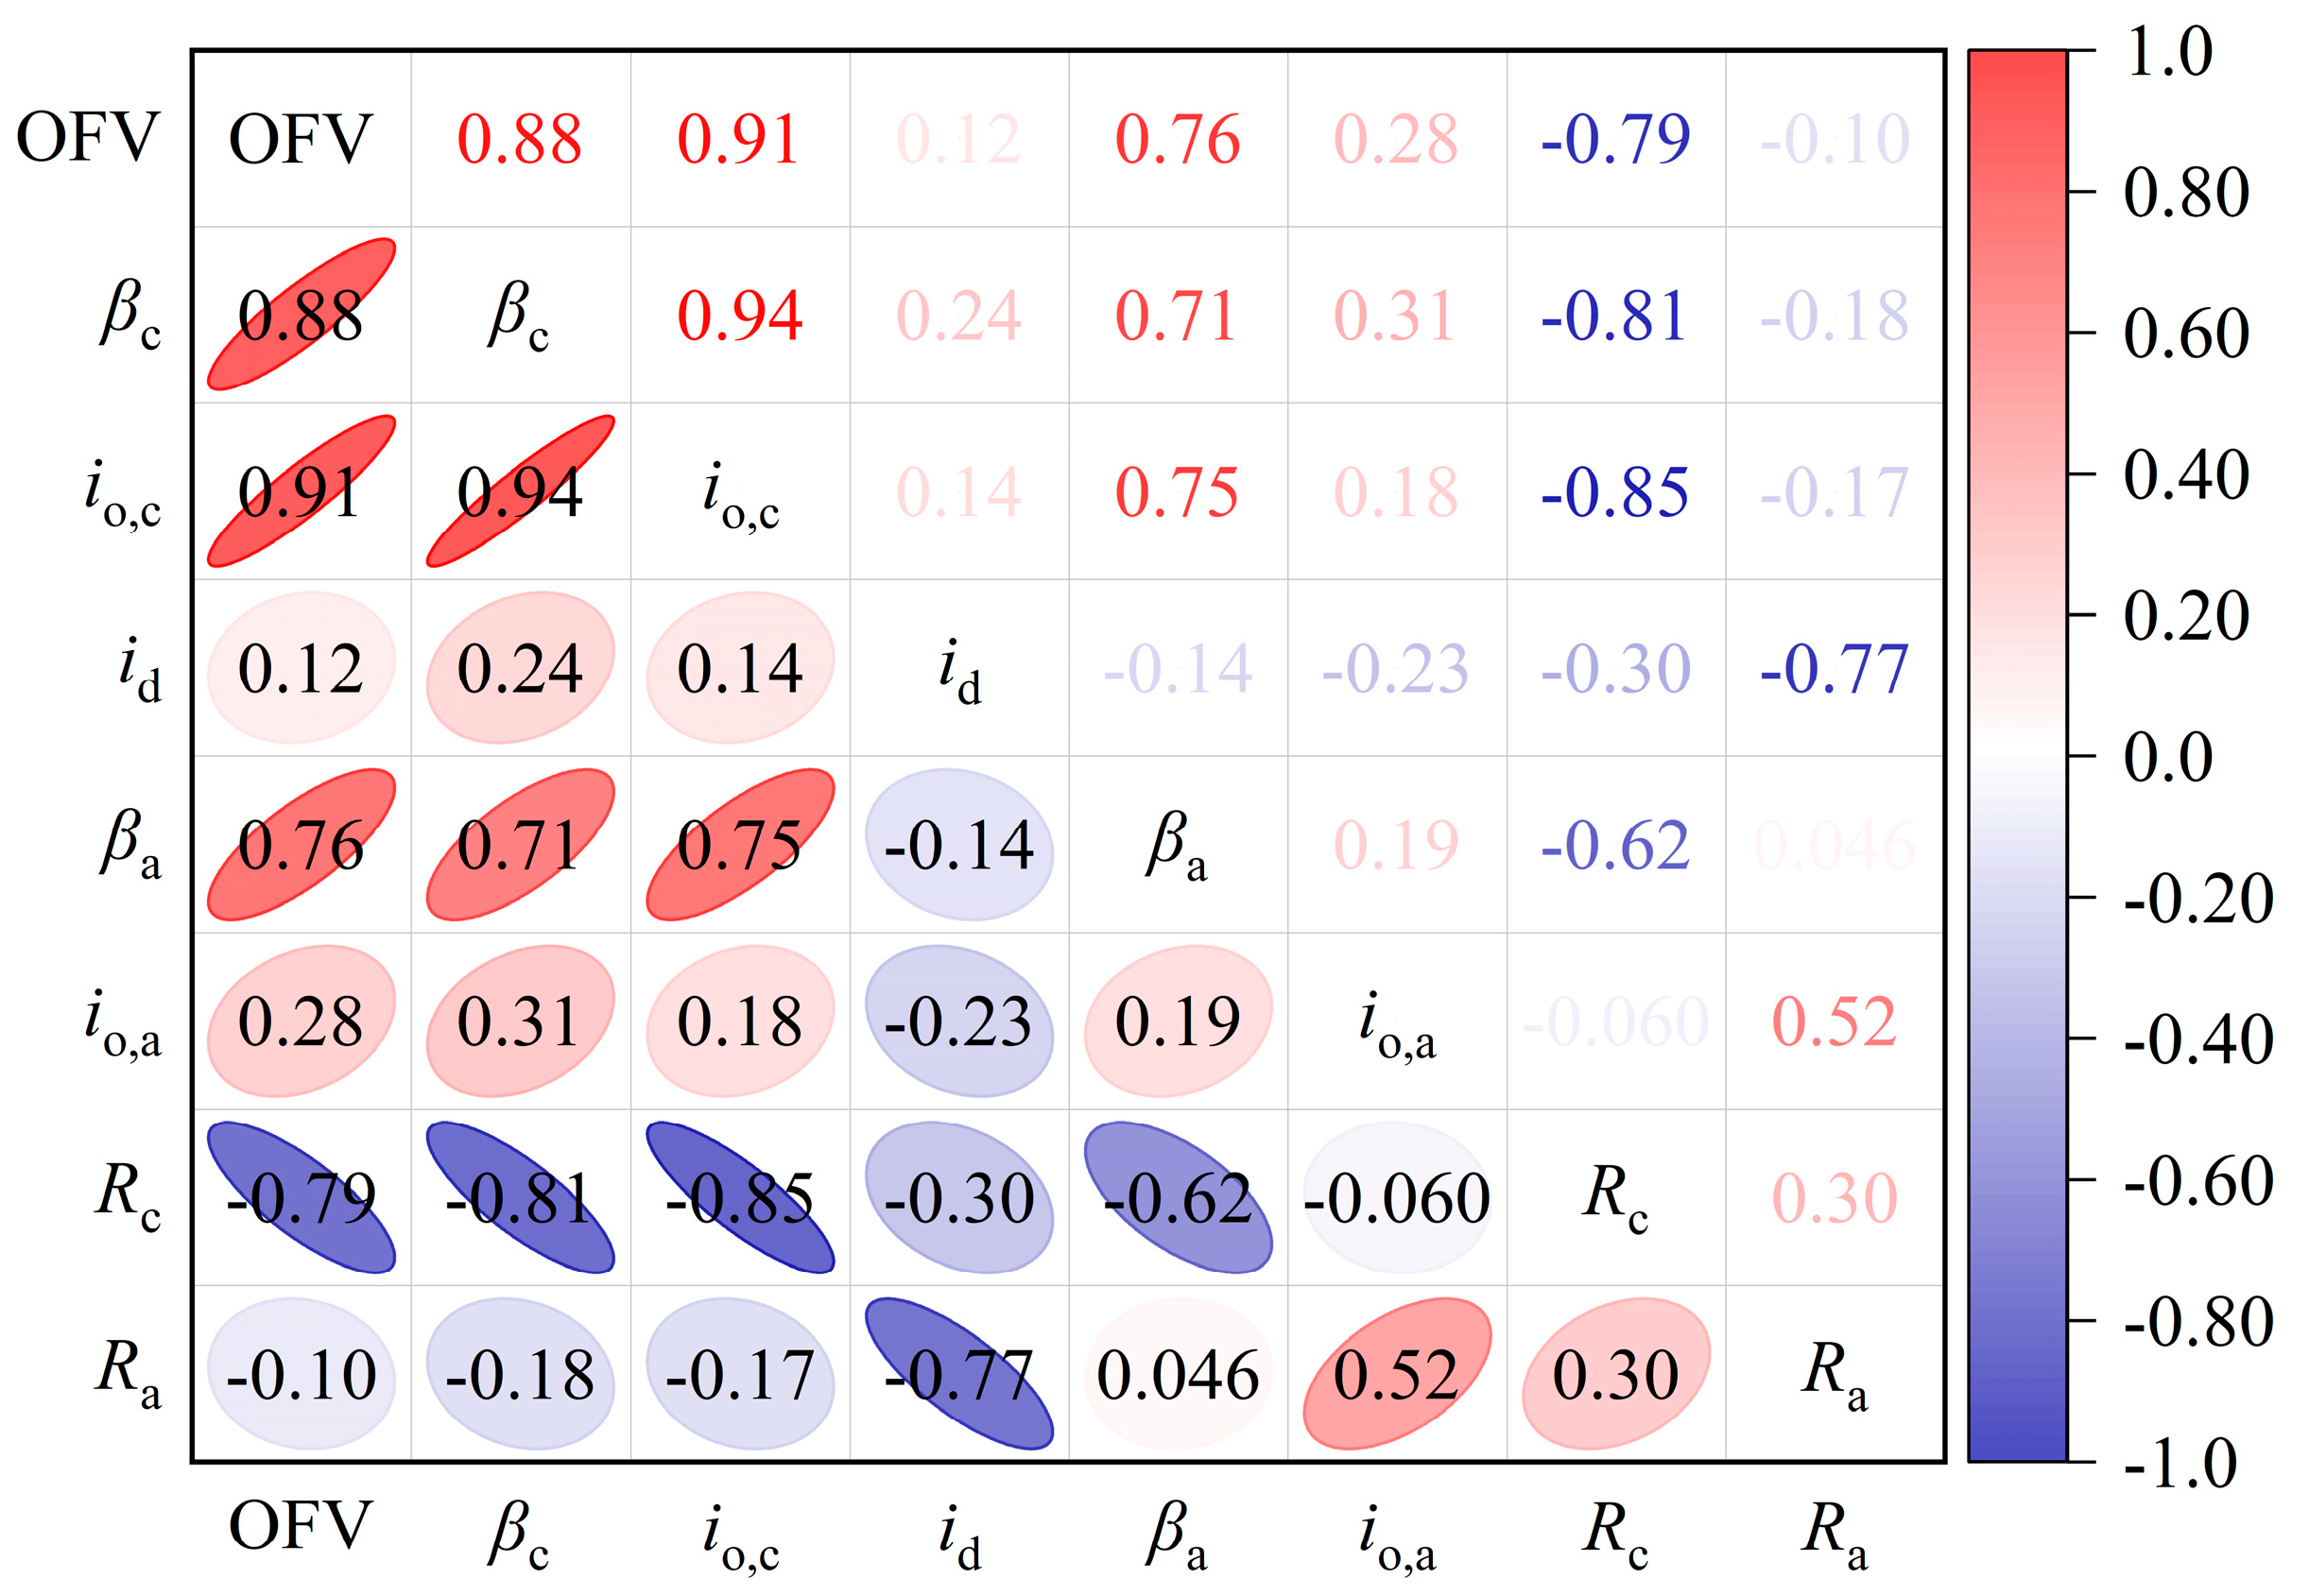
The best-fit individuals from each generation of the PSO optimization were extracted, and Spearman correlation analysis was performed on these data, resulting in the correlation coefficient matrix shown in Figure 6. The objective function value (OFV) exhibited a strong positive correlation with the cathodic Tafel slope (r = 0.88) and cathodic exchange current density (r = 0.91), alongside a relatively high positive correlation with the anodic Tafel slope (r = 0.76). In contrast, the anodic exchange current density (r = 0.28) showed only a weak positive correlation with the OFV. In addition, the OFV displayed a strong negative correlation with cathodic resistance (r = −0.79), while anodic resistance (r = −0.10) and limiting diffusion current density (r = 0.12) were found to be nearly uncorrelated.
Figure 6.
The correlation coefficient matrix between the fitted parameters and objective function value.
Based on a comprehensive assessment integrating fitting error analysis and correlation results, only the Tafel slopes (βa, βc) simultaneously demonstrated high fitting reliability and significant correlation with the objective function, thus emerging as the most stable and credible parameters influencing the OFV. Although the exchange current densities, limiting diffusion current density, and resistance parameters showed varying degrees of association in the correlation analysis, their correlations with the OFV should only be considered as trend indicators rather than supporting strict quantitative interpretation, due to the large fitting errors.
3.3. Influence of Key Parameters of PSO on the Fitting Results
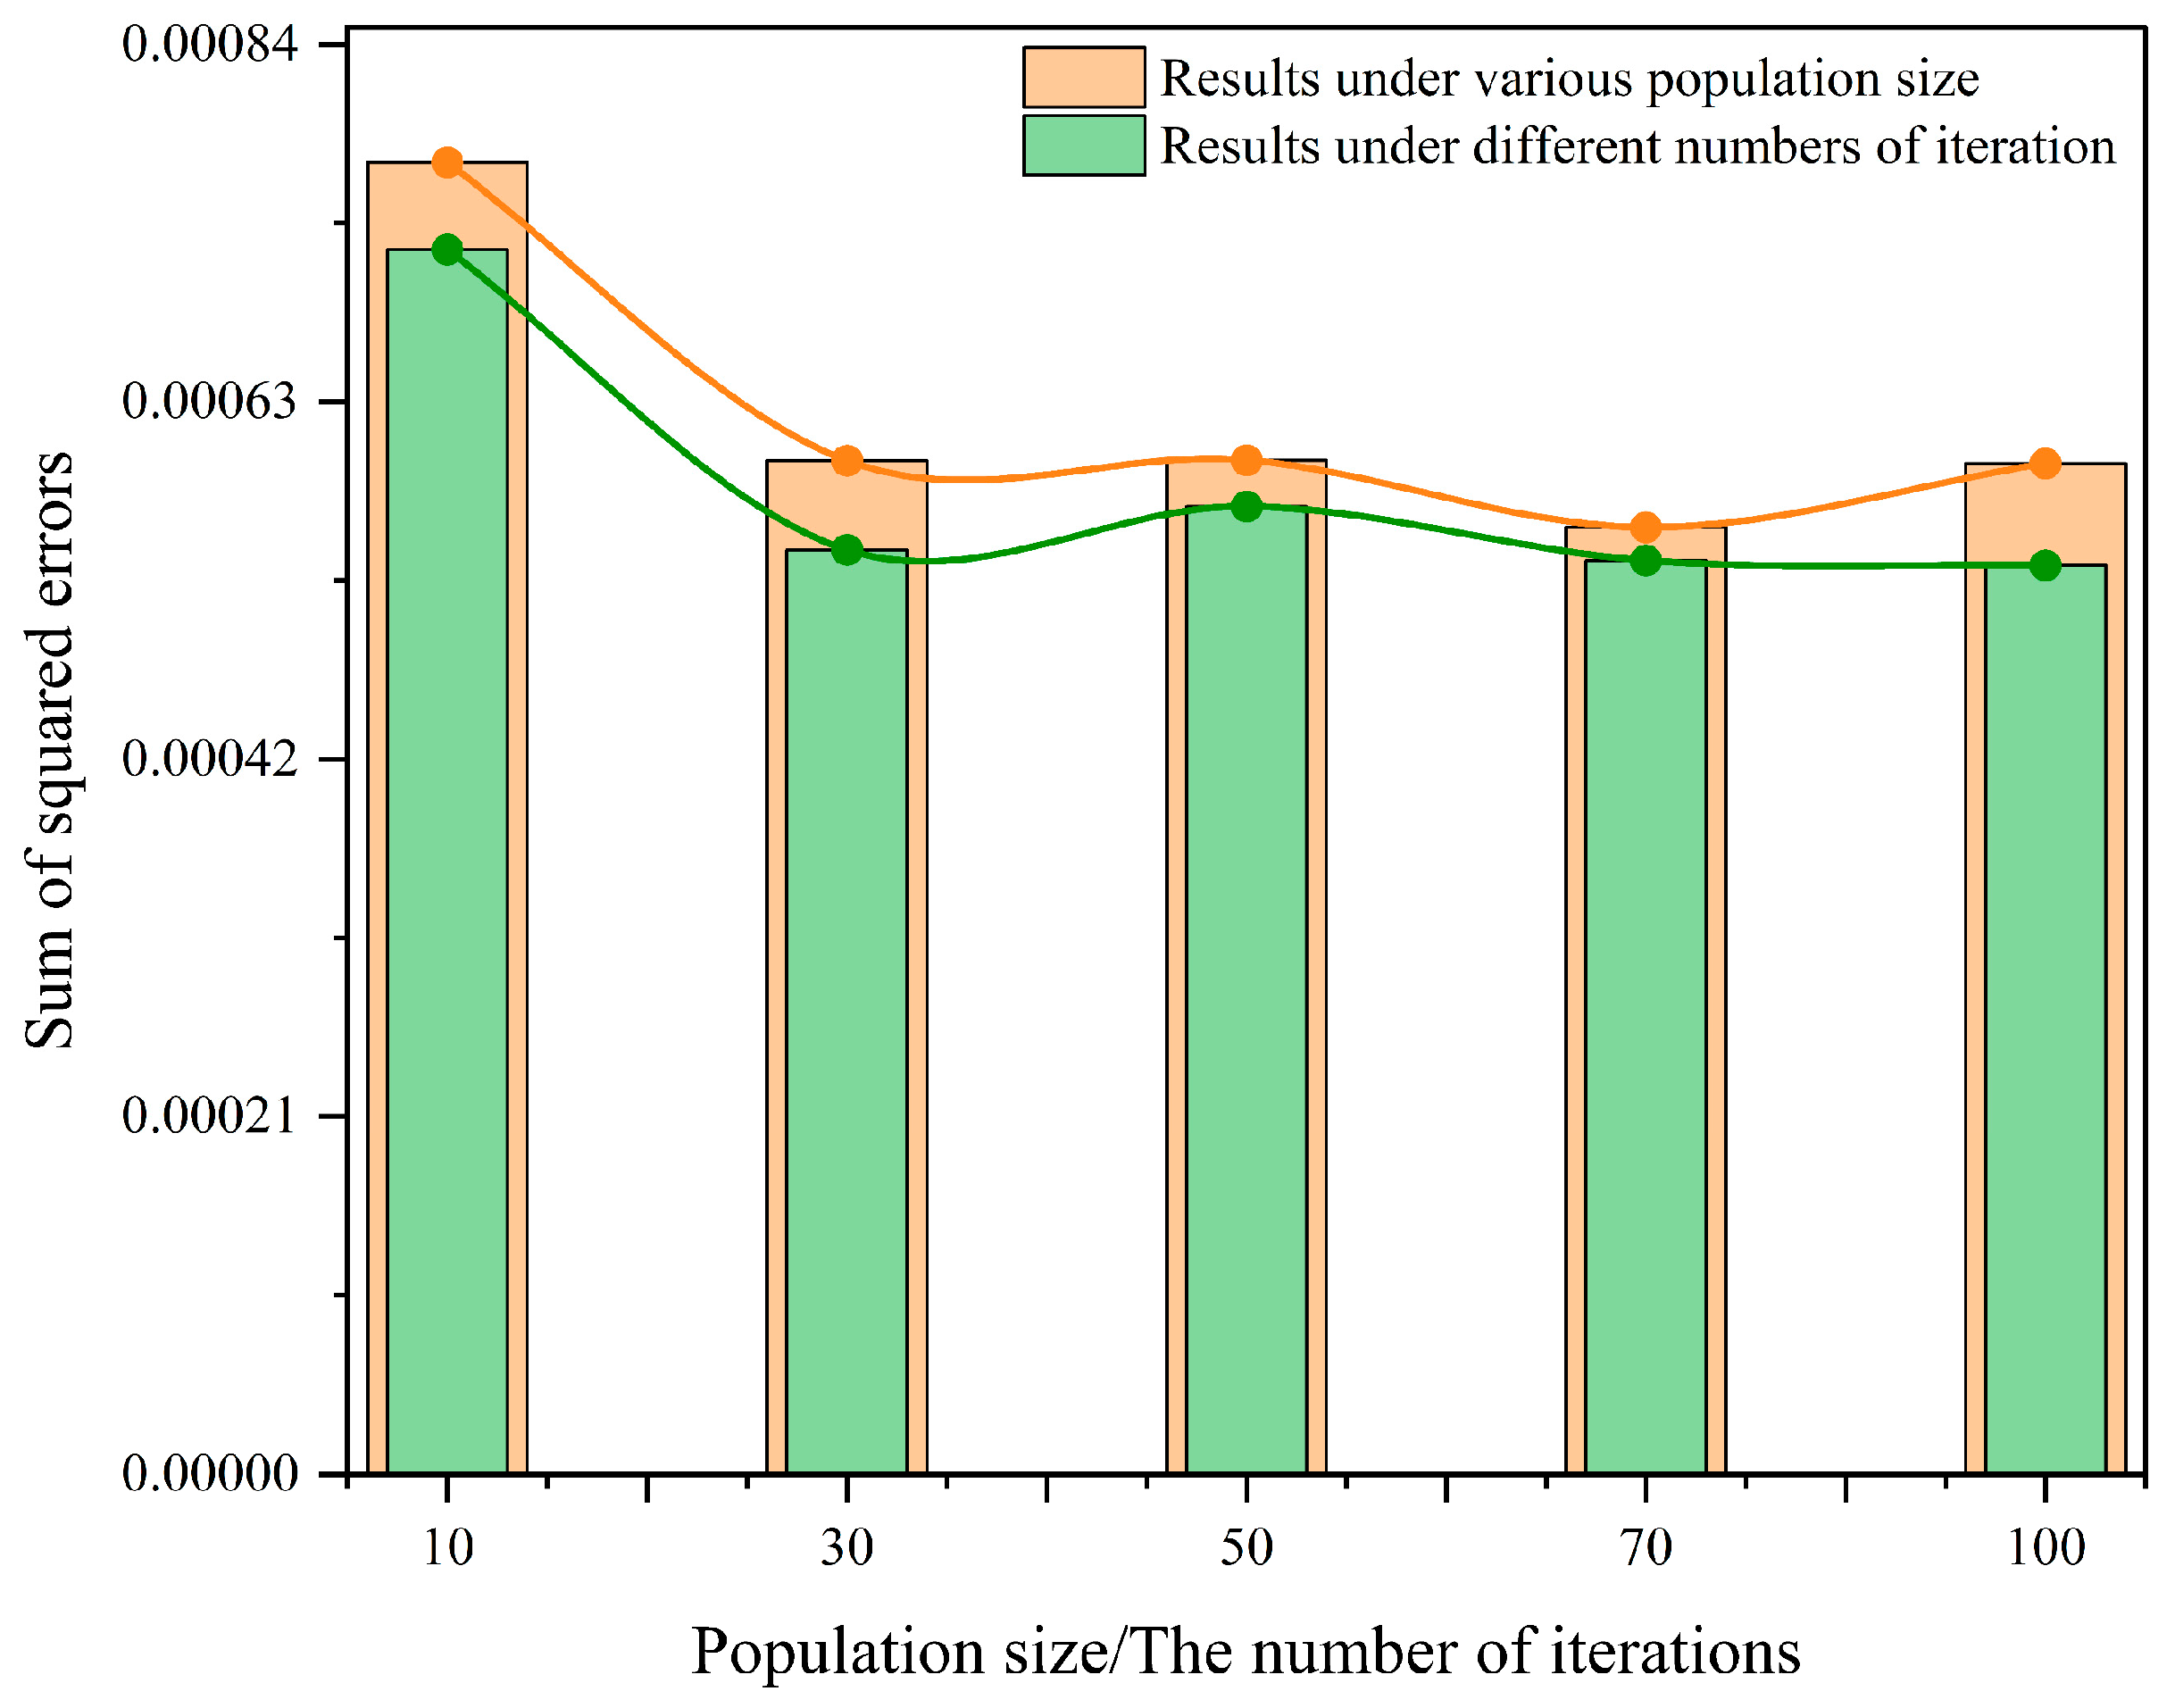
The population size and the number of iterations are key parameters affecting the performance of the PSO algorithm [30]. Their influence on the fitting results was investigated by varying one parameter while holding the other constant.
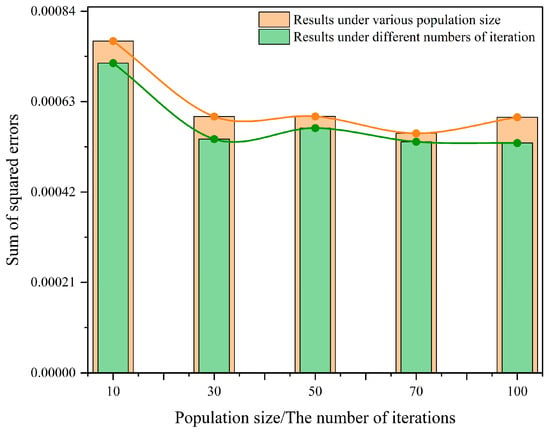
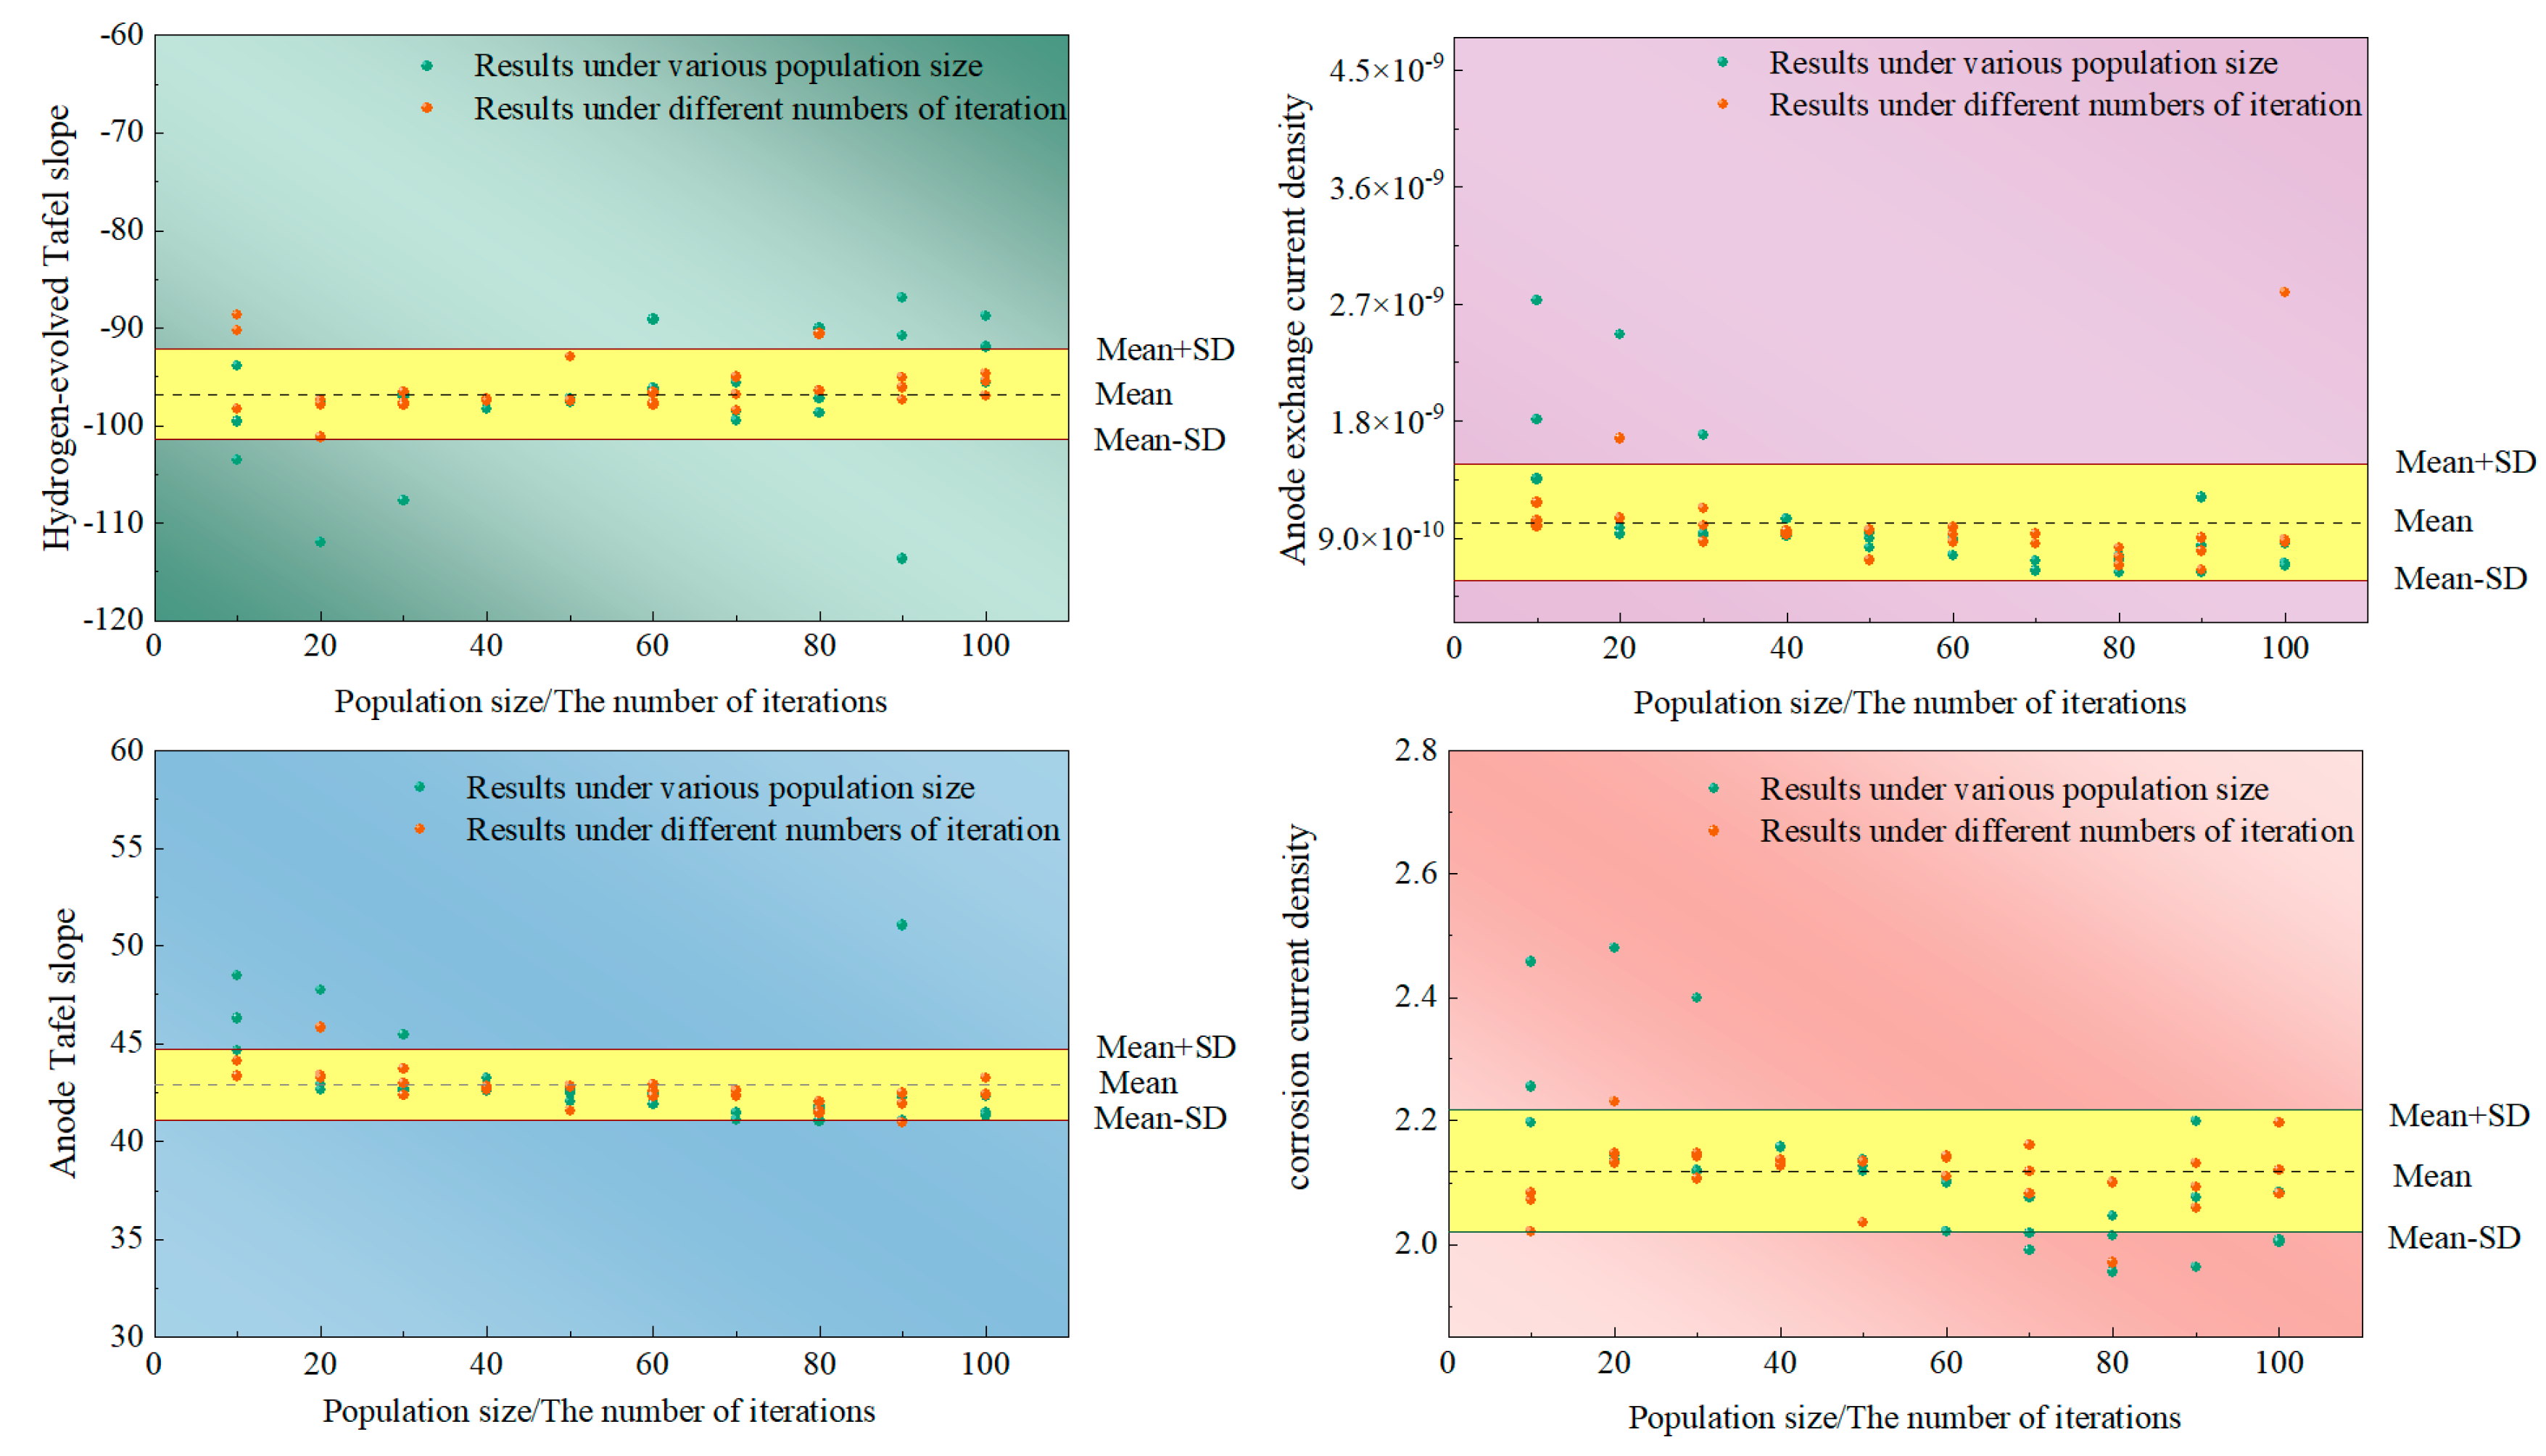
Figure 7 shows the variation in the final SSE under different parameter settings. SSE decreased markedly as the population size increased from 10 to 40 (with iterations fixed at 50) and as the number of iterations increased from 10 to 40 (with population size fixed at 40). However, beyond these thresholds (population size > 40, iterations > 40), further increases yielded diminishing returns, and the SSE stabilized. The scatter plots in Figure 8 show that the distributions of key kinetic parameters (Tafel slopes and icorr) remain stable within the [Mean ± SD] range and exhibit no significant statistical correlation with the population size or iteration number once the thresholds are exceeded.
Figure 7.
The variations in the curve coincidence degree under different PSO parameters.
Figure 8.
The distribution of key kinetic parameters.
These observations indicate that the PSO algorithm becomes less sensitive to its key parameters once a certain computational resource threshold is met. This behavior is likely attributable to the relatively low dimensionality of the optimization problem and the sufficiently smooth characteristics of the objective function, which enable rapid convergence [31]. Therefore, the fitting results demonstrate robustness against variations in the PSO population size and iteration number beyond minimal required values.
3.4. Sensitivity Analysis of Polarization Data Reduction
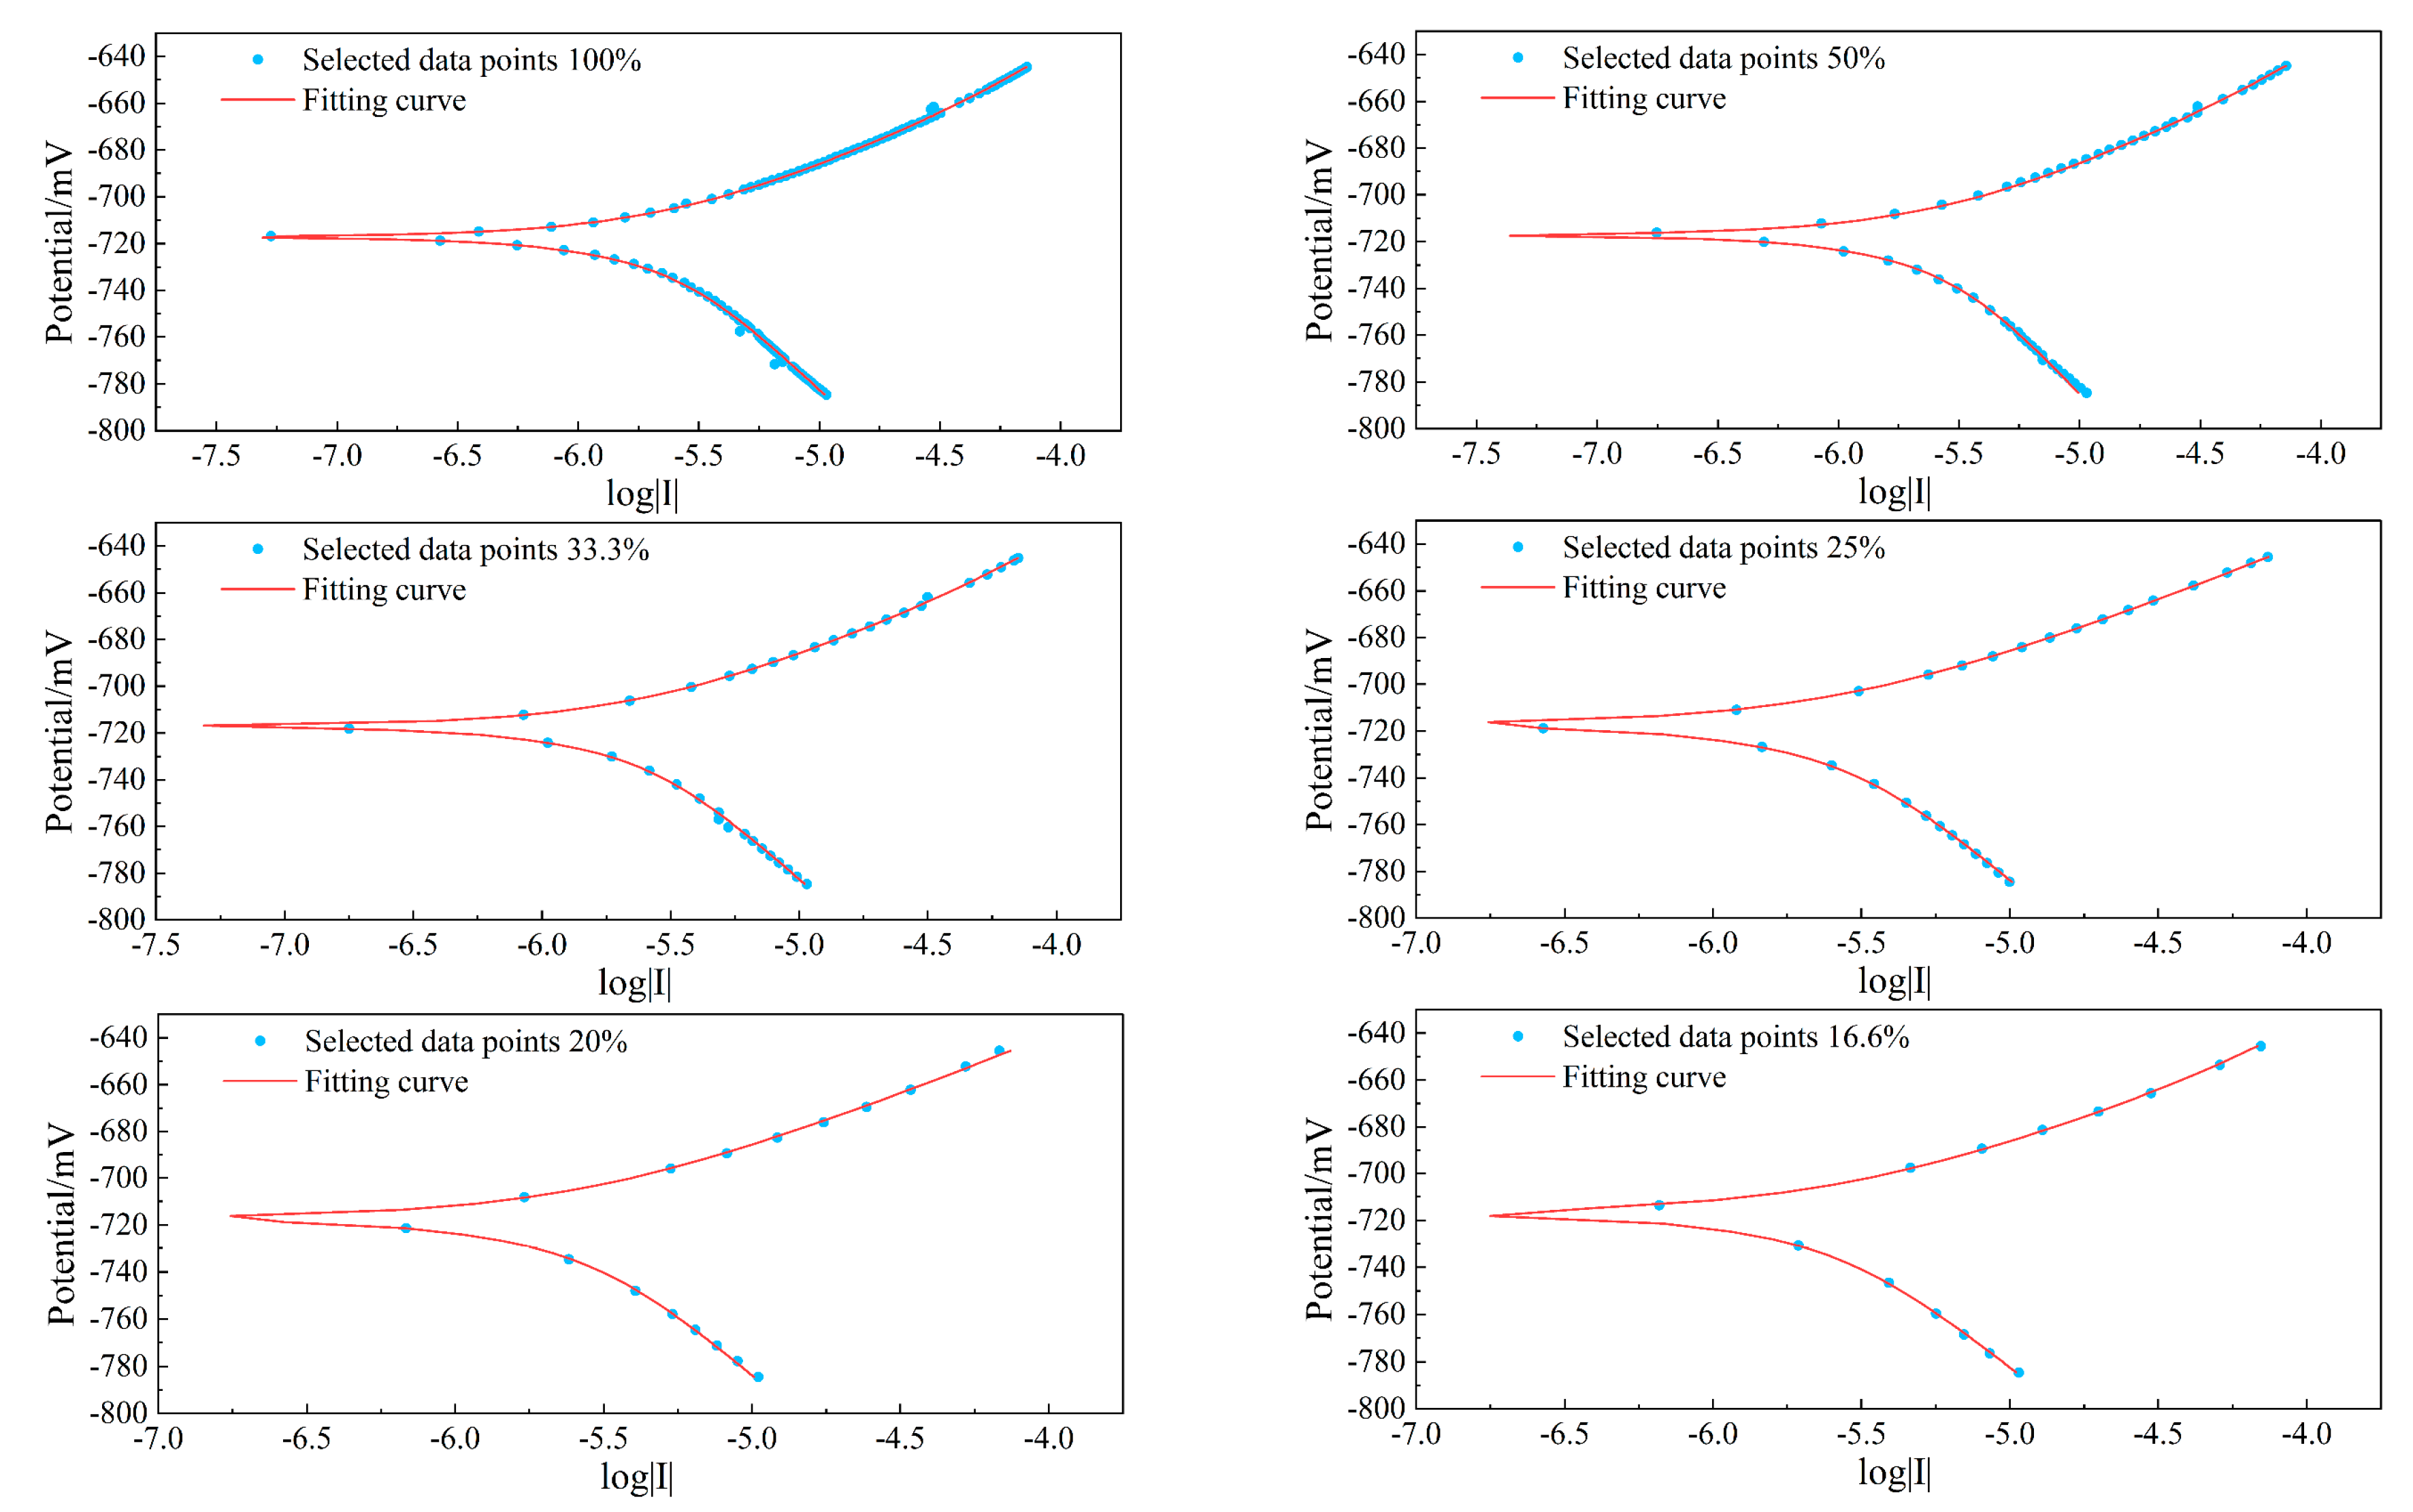
A standard slow scan rate (0.1666 mV/s) for weak polarization curves often generates a large number of data points [32], increasing computational cost during fitting. We investigated the impact of reducing data point density on fitting accuracy and the results are shown in Figure 9.
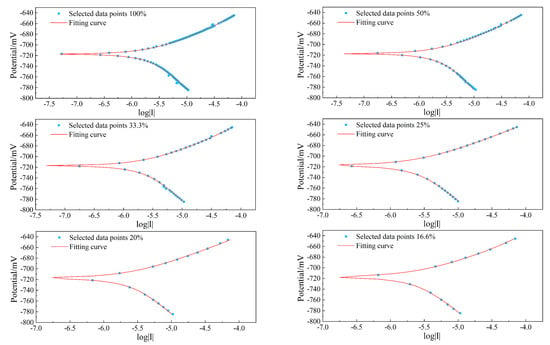
Figure 9.
The fitting results of polarization curves at different data point densities.
Figure 9 demonstrates that even when using only 16.77% of the original data points, the fitted curve maintains excellent agreement with the original data. The fitting results for the kinetic parameters at different data densities are presented in Table 6. The parameters exhibit low sensitivity to data reduction, with negligible variations across the different density levels. This indicates that substantial improvements in computational efficiency can be achieved through data reduction without compromising the accuracy of the fitting process.
Table 6.
The fitting results of each optimized parameter at different data point densities.
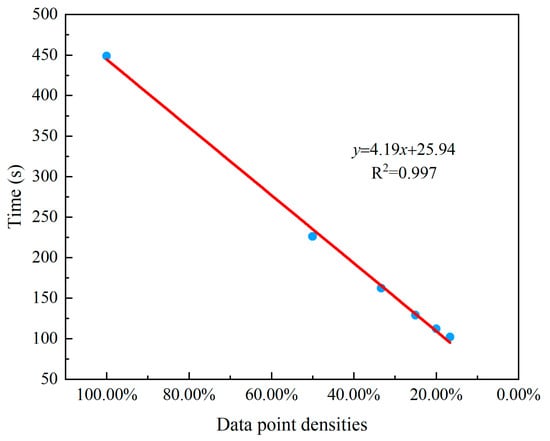
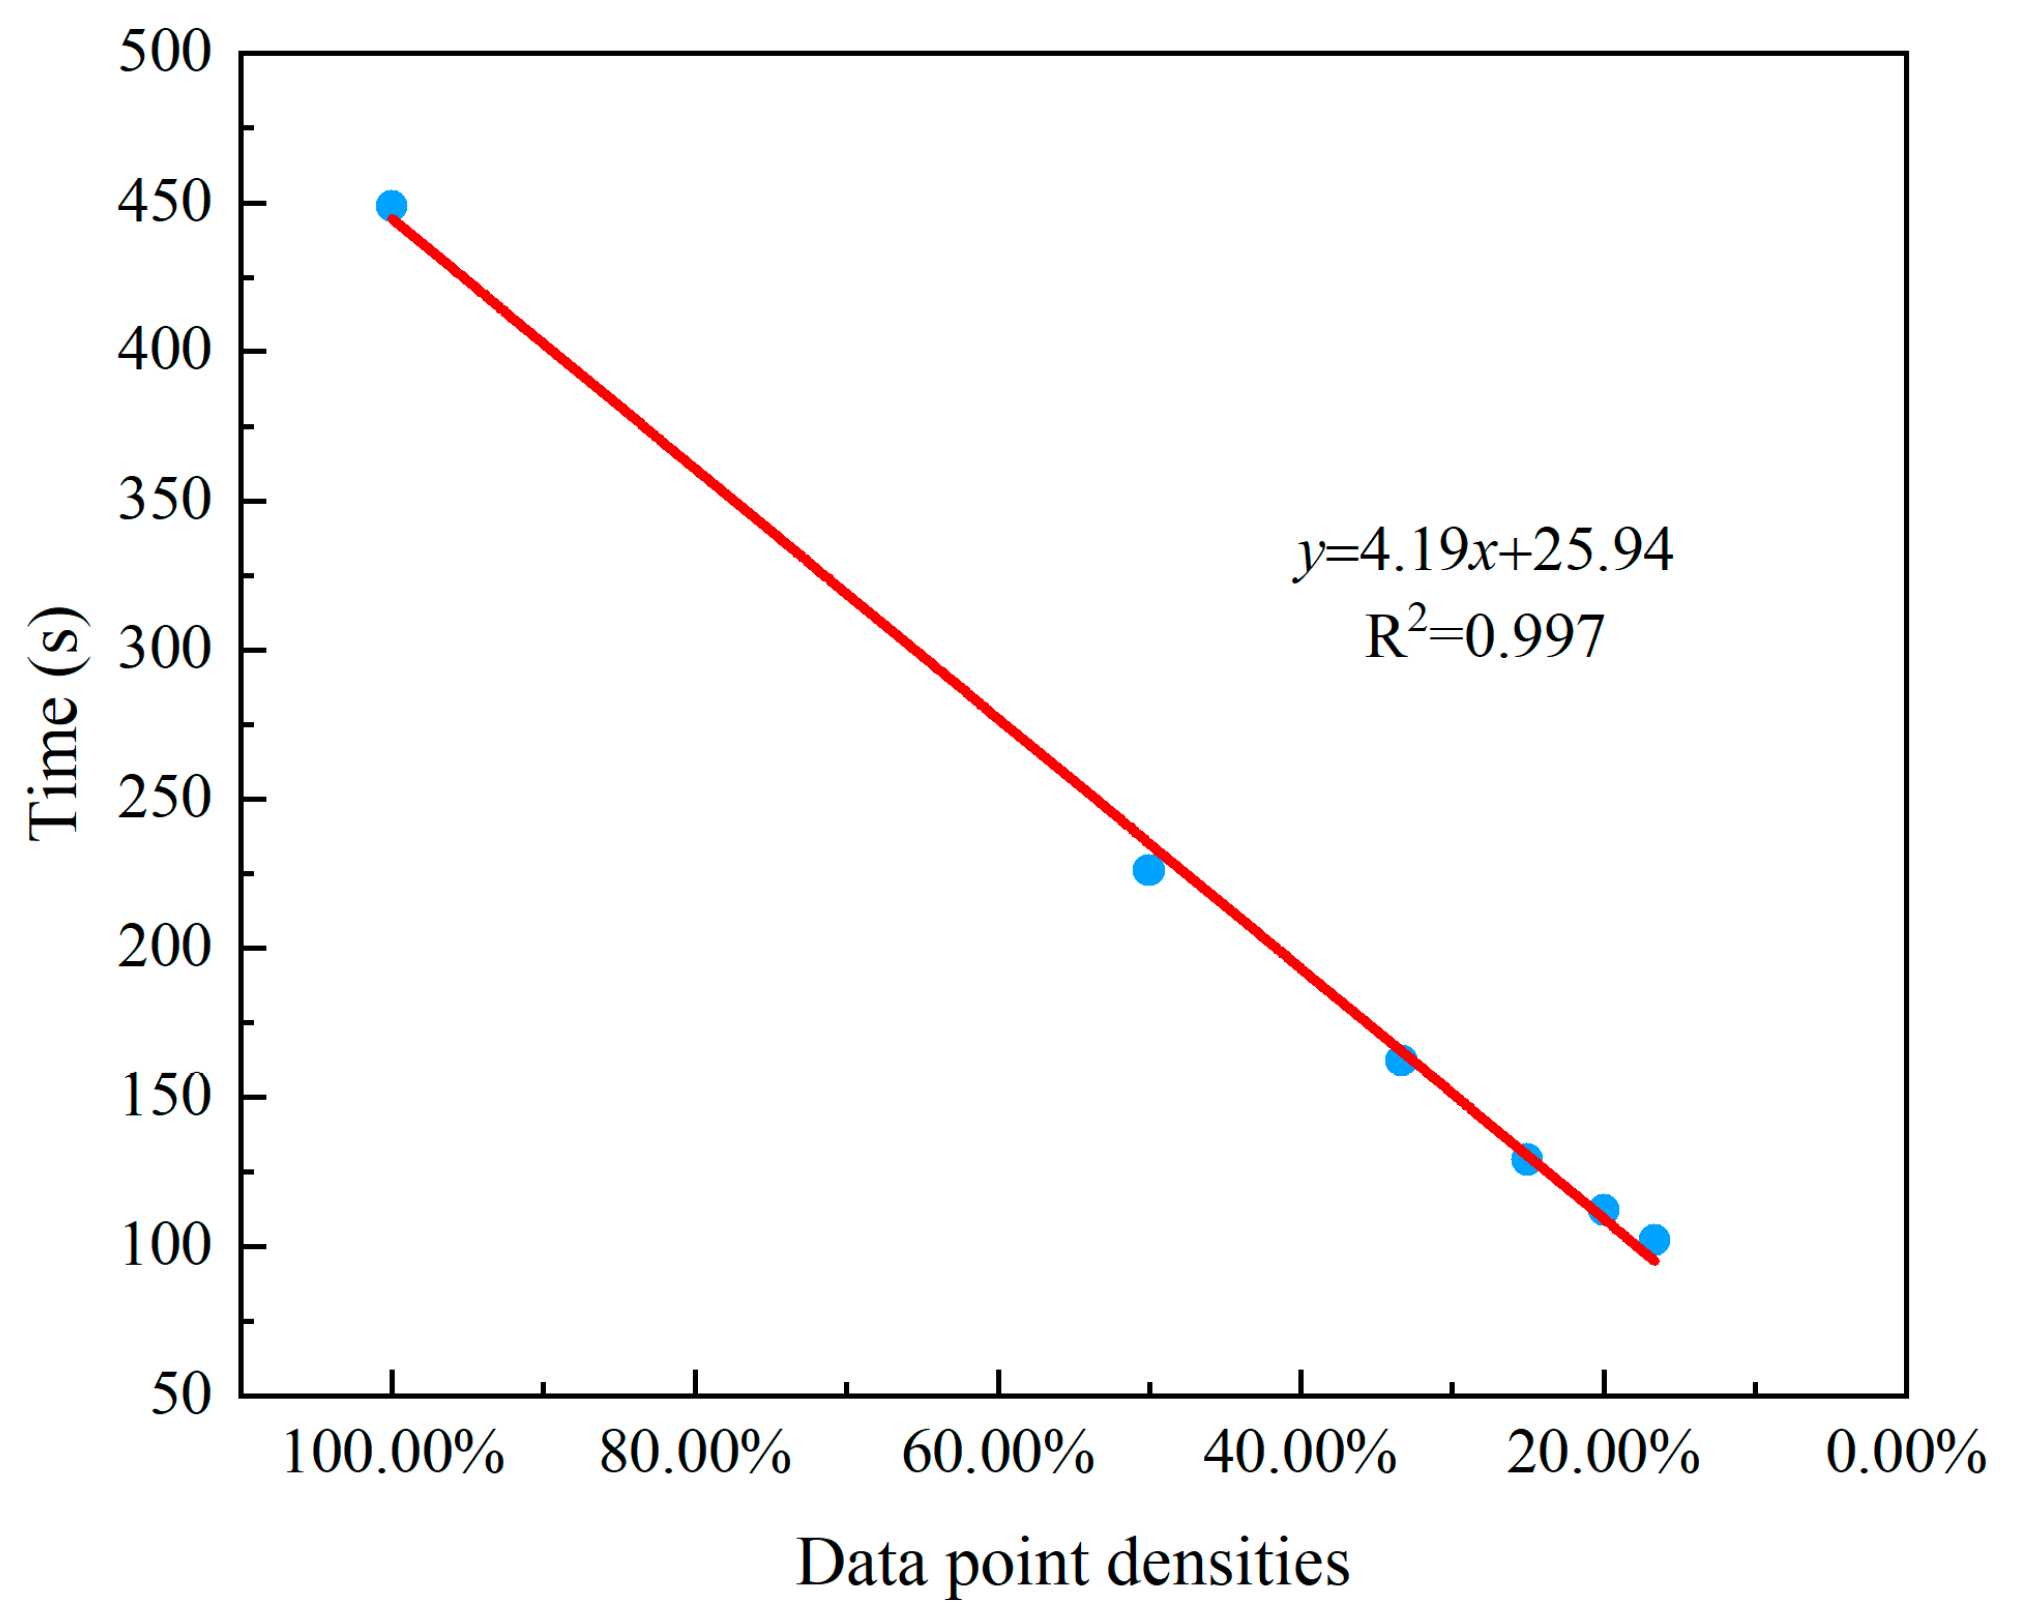
Figure 10 quantifies the effect of data point density on the fitting time. As the data density decreased from 100% to 16.60%, the fitting time progressively decreased from 449 s to 102 s. Linear regression analysis indicates that each 1% reduction in data point density corresponds to an average decrease of approximately 4.19 s in fitting time, demonstrating a strong linear relationship between data point density and computational cost.
Figure 10.
Time required for fitting with different data point densities.
3.5. Impact of the Potential Window on Fitting Reliability
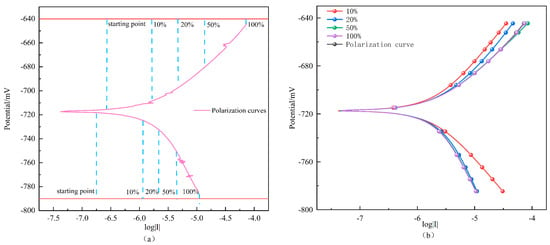
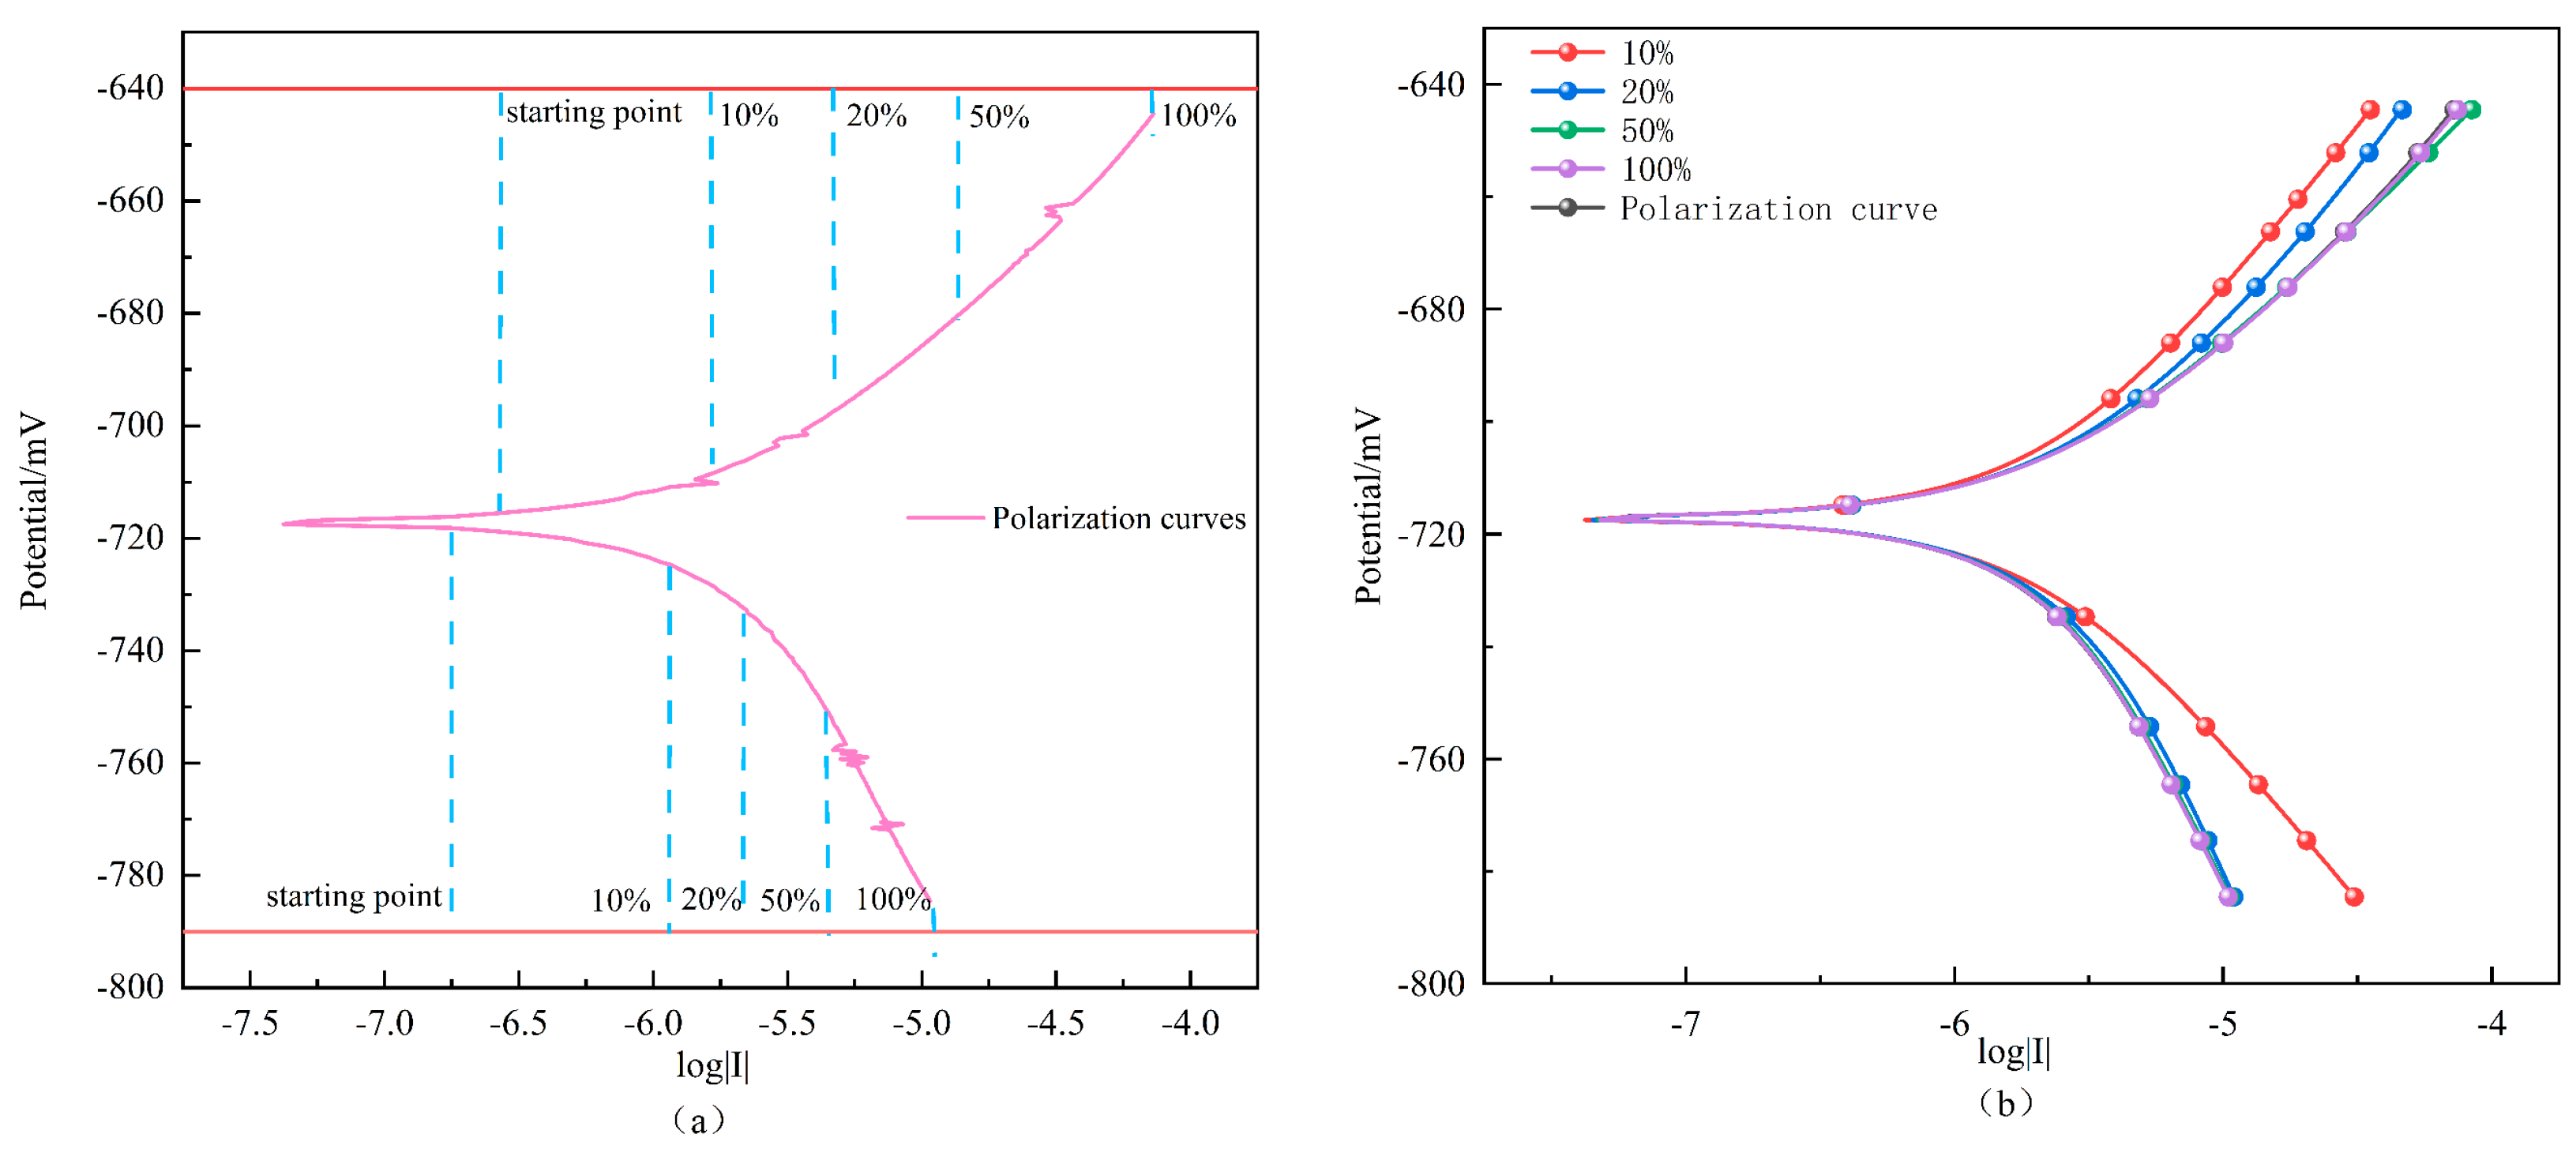
The selection of the potential window for fitting is critical, as different regions of the polarization curve contain varying levels of information about the corrosion processes. To identify the minimal reliable window, the fitted potential range was progressively expanded from the open-circuit potential, as illustrated in Figure 11a. The corresponding fitted curves are shown in Figure 11b.
Figure 11.
The potential windows (a) and fitted curves (b).
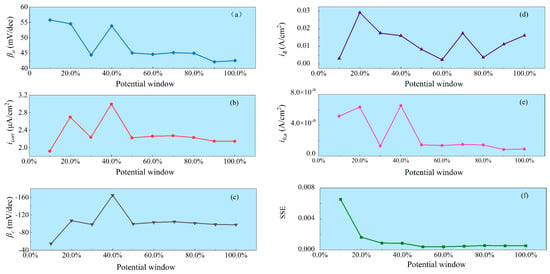
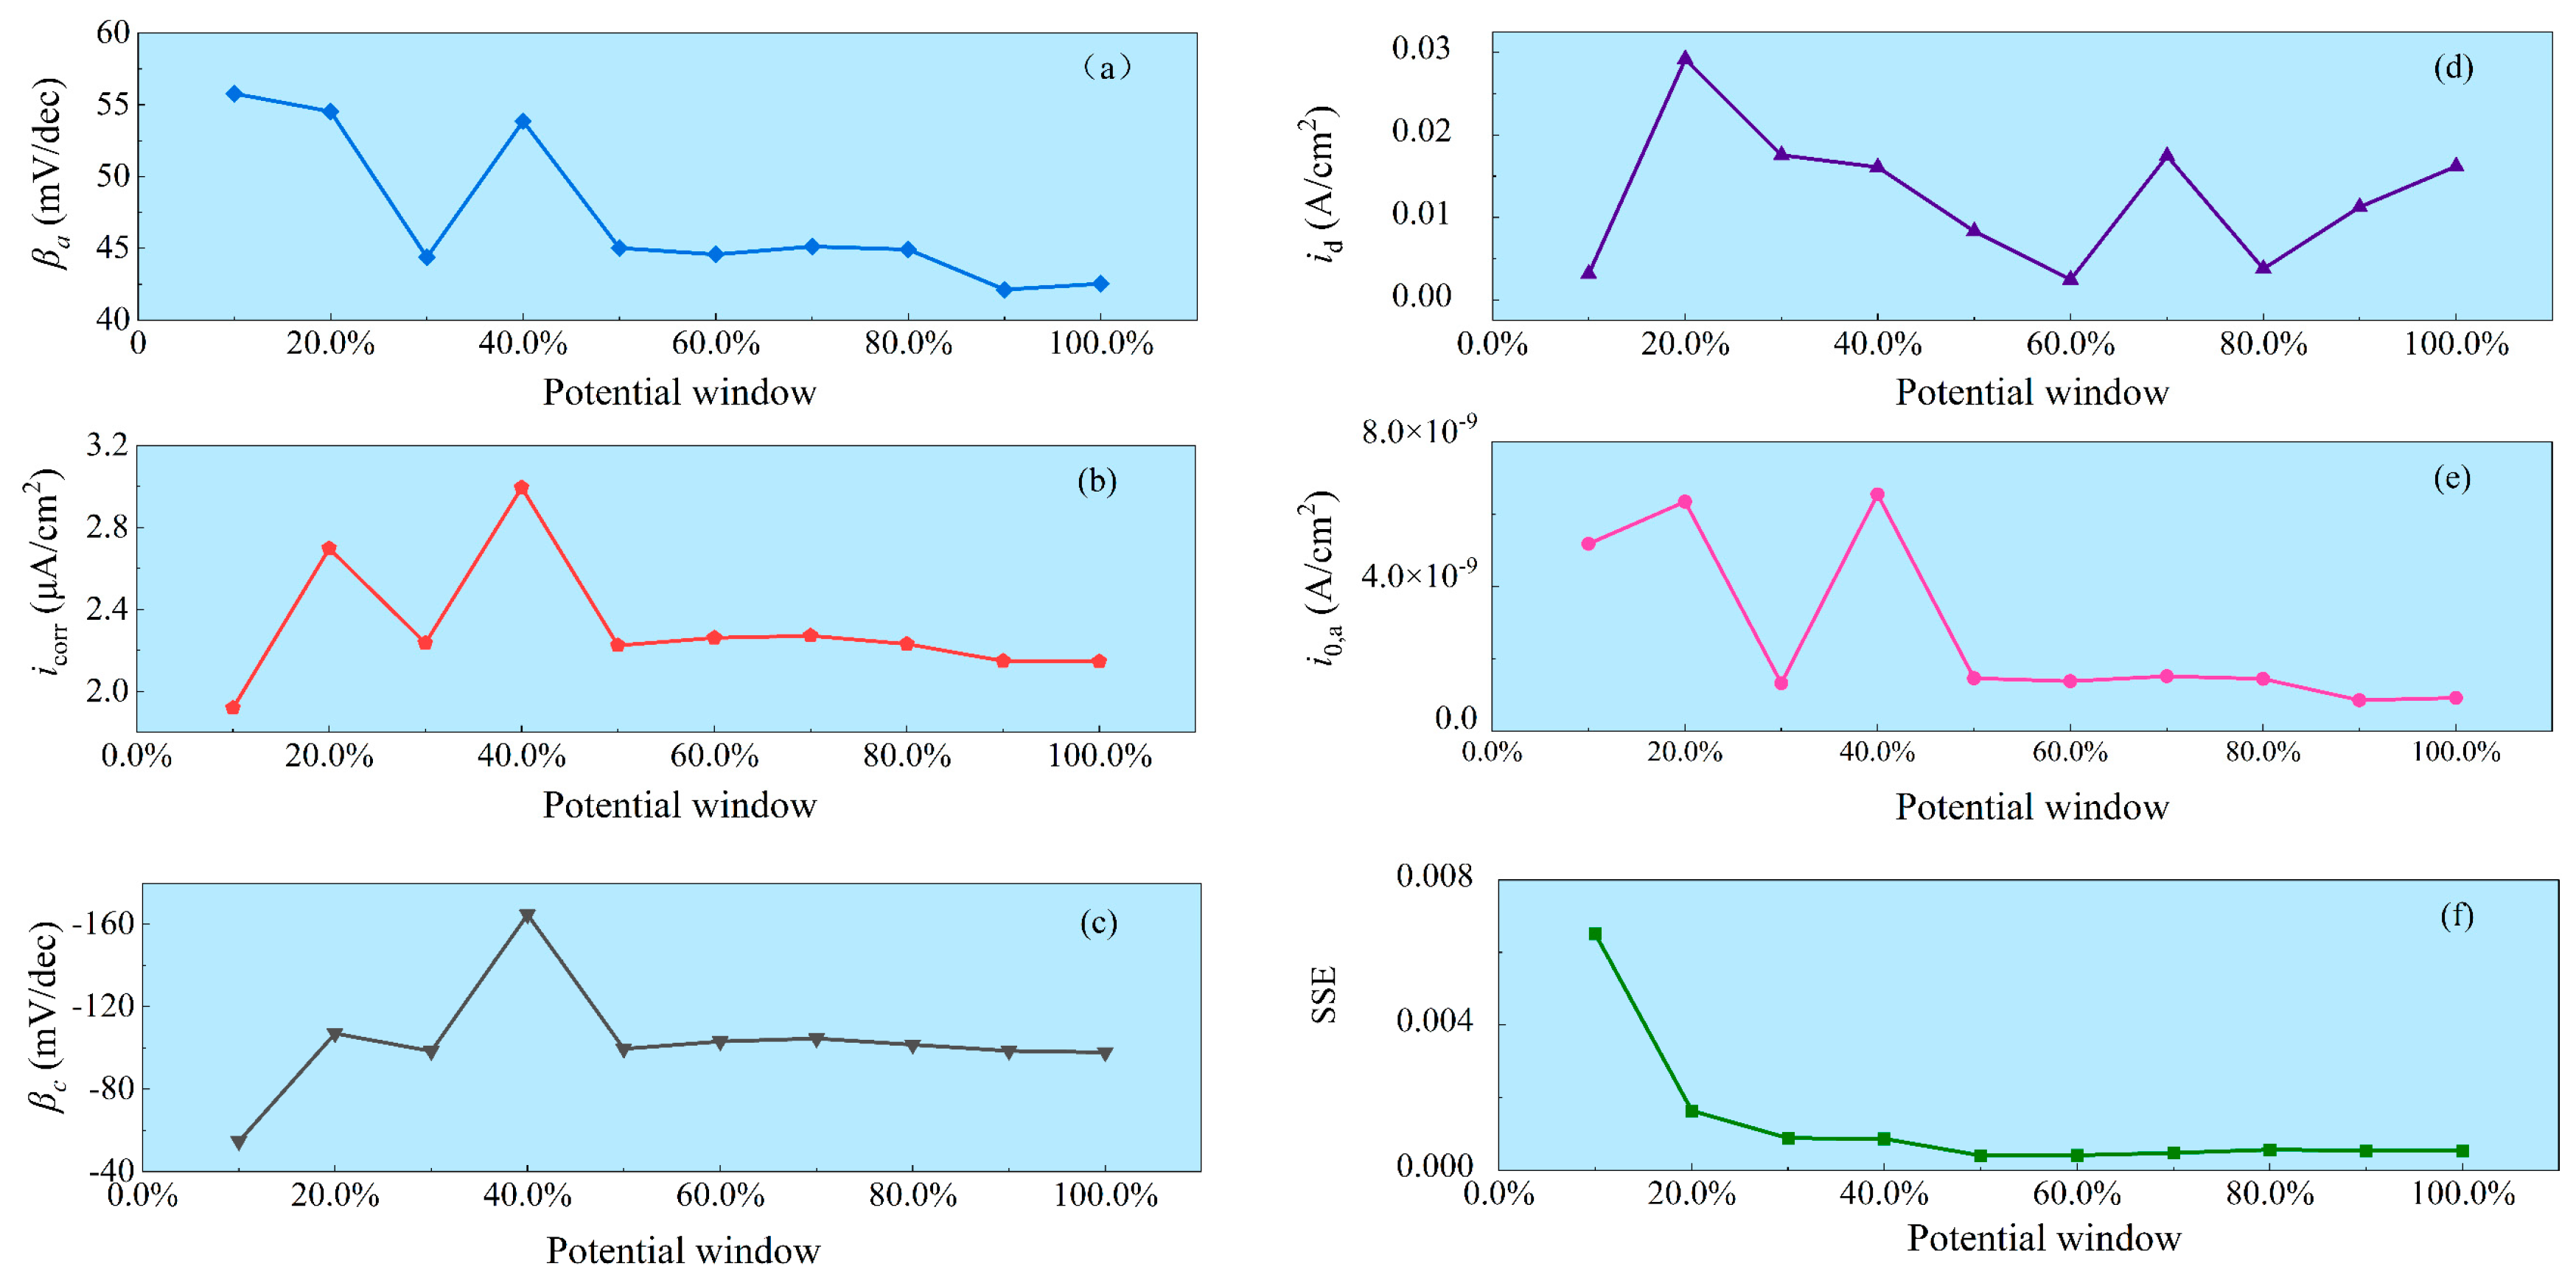
The fitting results for kinetic parameters across different potential windows are shown in Figure 12. Initial fits using narrow windows (e.g., 10–40% of the full range) yielded unstable and physically less meaningful parameters. For instance, the cathodic Tafel slope sharply dropped from −54.69 mV/dec at a 10% window to −164.77 mV/dec at a 40% window before stabilizing between −98 and −104 mV/dec for windows ≥ 60%. Similarly, the anodic Tafel slope fluctuated between 42 and 56 mV/dec for windows below 50% and stabilized between 42 and 45 mV/dec for windows ≥ 50%. The corrosion current density and other parameters also stabilized within narrower, more plausible ranges when the fitting window was ≥50%. Concurrently, the SSE decreased significantly and stabilized at a low level for windows ≥ 40%.
Figure 12.
The influence of the potential window on the fitting results. (a) βa (b) icorr (c) βc (d) id (e) i0,a (f) SSE.
These findings consistently indicate that the fitted kinetic parameters become reliable and stable when the potential window used for fitting covers at least 50% of the tested range. Employing narrower windows leads to greater uncertainty and potential misinterpretation of the corrosion kinetics.
4. Conclusions
This study developed a novel fitting strategy for polarization curves to quantify the corrosion kinetics of X70 steel under combined MIC and AC interference. The innovation lies in incorporating the consistency of the anodic and cathodic Tafel slopes into the objective function, which is strategically phased to ensure robust convergence. The key findings are summarized as follows:
(1) The proposed slope-consistency strategy effectively mitigates premature convergence. By initially prioritizing the shape fidelity between the measured and fitted curves and then progressively refining the point-wise alignment, the strategy achieves a more accurate and reliable fit compared to traditional methods.
(2) The PSO algorithm demonstrates inherent robustness for this fitting task. The fitting results show low sensitivity to the algorithm’s key parameters (population size and iteration number) beyond minimal thresholds, simplifying its practical application.
(3) Computational efficiency is greatly enhanced without sacrificing accuracy. Data reduction techniques can be employed to significantly decrease processing time, while maintaining the reliability of the extracted kinetic parameters.
(4) A potential window covering at least 50% of the polarization range is required to obtain stable and reliable kinetic parameters. Fitting with narrower windows leads to increased uncertainty and instability in the results.
In summary, the proposed fitting strategy provides a robust, efficient, and reliable tool for analyzing corrosion behavior through weak polarization curves, lowering the technical barrier for accurate electrochemical parameter extraction.
Author Contributions
Conceptualization, S.Z., Y.C. and B.Z.; methodology, S.Z.; software, S.Z. and Y.C.; validation, Y.W., J.Z. and B.H.; investigation, H.X., B.H., D.L. and Z.C.; resources, S.Z. and B.Z.; writing—original draft preparation, S.Z. and Y.C.; writing—review and editing, S.Z., H.X., D.L. and Z.C.; visualization, Y.W. and J.Z.; supervision, S.Z. and B.Z.; funding acquisition, B.Z. All authors have read and agreed to the published version of the manuscript.
Funding
This research was supported by the National Key Research and Development Program of China (2024YFF0619602) and the Central-Guided Local S&T Development Fund of Zhejiang Province (2025ZY01079).
Data Availability Statement
The raw data supporting the conclusions of this article will be made available by the authors on request.
Conflicts of Interest
Huizhong Xu was employed by Tongbiao Standard Technical Services Co., Ltd. The remaining authors declare that they have no known competing financial interests or personal relationships that could have appeared to influence the work reported in this paper.
References
- Liu, P.; Zhang, H.; Fan, Y.; Xu, D. Microbially Influenced Corrosion of Steel in Marine Environments: A Review from Mechanisms to Prevention. Microorganisms 2023, 11, 2299. [Google Scholar] [CrossRef] [Scilit]
- Xu, D.; Gu, T.; Lovley, D.R. Microbially mediated metal corrosion. Nat. Rev. Microbiol. 2023, 21, 705–718. [Google Scholar] [CrossRef] [Scilit]
- Li, Z.; Chen, Y.; Guo, Q.; Zhang, X.; Li, X.; Li, Y.; Cai, J.; Fan, Y.; Yang, J. A Comparative Evaluation of Microbiologically Induced Corrosion Behaviors of 316L Austenitic and 2205 Duplex Stainless Steels Inoculated in Desulfovibrio vulgaris. Metals 2025, 15, 1040. [Google Scholar] [CrossRef] [Scilit]
- AlAbbas, F.M.; Kakpovbia, A.; Olson, D.L.; Mishra, B.; Spear, J.R. The Role of Bacterial Attachment to Metal Substrate and Its Effects on Microbiologically Influenced Corrosion (MIC) in Transporting Hydrocarbon Pipelines. In Biomaterials Science: Processing, Properties and Applications II; John Wiley & Sons: Hoboken, NJ, USA, 2012; pp. 131–144. [Google Scholar]
- Khan, M.; Hussain, M.; Djavanroodi, F. Microbiologically influenced corrosion in oil and gas industries: A review. Int. J. Corros. Scale Inhib. 2021, 10, 80–106. [Google Scholar] [CrossRef] [Scilit]
- Guo, D.; Wang, Y.; Zhang, Y.; Duan, J.; Guan, F.; Hou, B. Effects of marine eutrophication environment on microbial corrosion: A review. Mar. Pollut. Bull. 2024, 205, 116637. [Google Scholar] [CrossRef] [Scilit]
- Li, G.; Du, M. Electrochemical corrosion, hydrogen penetration and stress corrosion cracking behavior of X80 steel heat-affected zone in sulfate-reducing bacteria-containing seawater. Corros. Sci. 2025, 243, 112590. [Google Scholar]
- Yan, M.; Wei, B.; Xu, J.; Yu, C.; Sun, C. Hydrogen permeation in X80 steel during corrosion induced by the synergistic effects of sulfate-reducing bacteria and alternating current. Int. J. Hydrogen Energy 2025, 106, 604–615. [Google Scholar] [CrossRef] [Scilit]
- Wang, Q.-W.; Zhang, J.-X.; Gao, Y.; Dai, N.-W.; Chen, Y.-X.; Lin, D.-Y.; Xia, X.-J. Galvanic effect and alternating current corrosion of steel in acidic red soil. Metals 2022, 12, 296. [Google Scholar] [CrossRef] [Scilit]
- He, S.; Wang, K.; Zhao, Y.; Lu, Y.; Jiang, R.; Li, J.; Xiang, Y. Comparative analysis of corrosion resistance of pipeline steels exposed to sulfate-reducing bacteria: Insights on L360, L245NS and antibacterial steels. Int. J. Electrochem. Sci. 2025, 20, 100960. [Google Scholar]
- Hu, J.; Lin, G.; Deng, P.; Li, Z.; Tian, Y. Galvanic corrosion of E690 offshore platform steel in a simulated marine thermocline. Metals 2024, 14, 287. [Google Scholar] [CrossRef] [Scilit]
- Xu, Z.; Zhang, T.; Wan, H.; He, Y.; Wang, J.; He, R.; Liu, H. Electrochemical investigation of the “double-edged” effect of low-dose biocide and exogenous electron shuttle on microbial corrosion behavior of carbon steel and copper in enriched seawater. Electrochim. Acta 2024, 476, 143687. [Google Scholar] [CrossRef] [Scilit]
- Khadke, P.; Tichter, T.; Boettcher, T.; Muench, F.; Ensinger, W.; Roth, C. A simple and effective method for the accurate extraction of kinetic parameters using differential Tafel plots. Sci. Rep. 2021, 11, 8974. [Google Scholar] [CrossRef] [Scilit]
- Lukacs, Z.; Kristóf, T. Linear transformations of the Butler-Volmer equation. Electrochem. Commun. 2023, 154, 107556. [Google Scholar] [CrossRef] [Scilit]
- Lukacs, Z.; Kristóf, T. Determination of kinetic parameters from a new quadratic approximation of the Butler-Volmer equation. J. Electroanal. Chem. 2022, 918, 116443. [Google Scholar] [CrossRef] [Scilit]
- Lukacs, Z.; Vidosits, P.B.; Tomasek, S.; Kristóf, T. A comparative experimental survey of the performance of new linearized transformations of the Butler-Volmer equation for the corrosion rate assessment of AISI 316L stainless steel. J. Mater. Res. Technol. 2025, 38, 3175–3182. [Google Scholar] [CrossRef] [Scilit]
- Shen, X.; Sinclair, N.; Wainright, J.; Savinell, R.F. Methods—Analyzing electrochemical kinetic parameters in deep eutectic solvents using an extended Butler-Volmer equation. J. Electrochem. Soc. 2021, 168, 056520. [Google Scholar] [CrossRef] [Scilit]
- Ahmed, S.L.; Thamida, S.K.; Narasaiah, N. Novel optimization technique to determine polarization characteristics of a corroding metal. Electrochem. Energy Technol. 2017, 3, 1–8. [Google Scholar] [CrossRef]
- Cho, S.; Weitzner, S.E.; Zagalskaya, A.; Hsu, T.; Pham, T.A.; Castaneda, H.; Wood, B.C.; Orme, C.A. Revisiting a minimally destructive analytic approach for determining electrochemical kinetic parameters: Measuring aluminum corrosion across a wide pH range based on the Butler-Volmer equation. Corros. Sci. 2025, 251, 112900. [Google Scholar] [CrossRef] [Scilit]
- van Ede, M.C.; Angst, U. Tafel slopes and exchange current densities of oxygen reduction and hydrogen evolution on steel, Corrosion Engineering. Sci. Technol. 2024, 59, 39–55. [Google Scholar]
- van Ede, M.C.; Angst, U. Analysis of Polarization Curves Under Mixed Activation-Diffusion Control: An Algorithm to Minimize Human Factors. Corrosion 2022, 78, 1087–1099. [Google Scholar] [CrossRef] [Scilit]
- Zhang, S.; Yan, J.; Chen, Z.; Huan, H.; Ye, C. The corrosion behaviors of X70 steel under the effect of alternating current and sulfate-reducing bacteria in seawater. Corrosion 2024, 80, 630–644. [Google Scholar] [CrossRef] [Scilit]
- Wang, D.; Kijkla, P.; Saleh, M.A.; Kumseranee, S.; Punpruk, S.; Gu, T. Tafel scan schemes for microbiologically influenced corrosion of carbon steel and stainless steel. J. Mater. Sci. Technol. 2022, 130, 193–197. [Google Scholar] [CrossRef] [Scilit]
- Cristiani, P.; Moradi, M.; Basseguy, R.; Macdonald, D.; Gu, T.; Zhang, D.; Wharton, J.; Xu, D. Fundamentals and critical appraisal of electrochemical techniques for investigating microbial corrosion. Corros. Sci. 2025, 246, 112694. [Google Scholar] [CrossRef] [Scilit]
- Flitt, H.J.; Schweinsberg, D.P. A guide to polarisation curve interpretation: Deconstruction of experimental curves typical of the Fe/H2O/H+/O2 corrosion system. Corros. Sci. 2005, 47, 2125–2156. [Google Scholar]
- Hamelers, H.V.; Heijne, A.T.; Stein, N.; Rozendal, R.A.; Buisman, C.J. Butler-Volmer-Monod model for describing bio-anode polarization curves. Bioresour. Technol. 2011, 102, 381–387. [Google Scholar] [CrossRef] [Scilit]
- Yeum, K.; Devereux, O. An iterative method for fitting complex electrode polarization curves. Corrosion 1989, 45, 478–487. [Google Scholar] [CrossRef] [Scilit]
- Wang, D.; Tan, D.; Liu, L. Particle swarm optimization algorithm: An overview. Soft Comput. 2018, 22, 387–408. [Google Scholar] [CrossRef] [Scilit]
- Kokalj, A.; Lozinšek, M.; Kapun, B.; Taheri, P.; Neupane, S.; Losada-Pérez, P.; Xie, C.; Stavber, S.; Crespo, D.; Renner, F.U.; et al. Simplistic correlations between molecular electronic properties and inhibition efficiencies: Do they really exist? Corros. Sci. 2021, 179, 108856. [Google Scholar] [CrossRef] [Scilit]
- Ashraf, A.; Almazroi, A.A.; Bangyal, W.H.; Alqarni, M.A. Particle Swarm Optimization with New Initializing Technique to Solve Global Optimization Problems. Intell. Autom. Soft Comput. 2022, 31, 191–206. [Google Scholar] [CrossRef] [Scilit]
- Jain, M.; Saihjpal, V.; Singh, N.; Singh, S.B. An Overview of Variants and Advancements of PSO Algorithm. Appl. Sci. 2022, 12, 8392. [Google Scholar] [CrossRef] [Scilit]
- Zhang, X.L.; Jiang, Z.H.; Yao, Z.P.; Song, Y.; Wu, Z.D. Effects of scan rate on the potentiodynamic polarization curve obtained to determine the Tafel slopes and corrosion current density. Corros. Sci. 2009, 51, 581–587. [Google Scholar] [CrossRef] [Scilit]


Disclaimer/Publisher’s Note: The statements, opinions and data contained in all publications are solely those of the individual author(s) and contributor(s) and not of MDPI and/or the editor(s). MDPI and/or the editor(s) disclaim responsibility for any injury to people or property resulting from any ideas, methods, instructions or products referred to in the content. |
© 2026 by the authors. Licensee MDPI, Basel, Switzerland. This article is an open access article distributed under the terms and conditions of the Creative Commons Attribution (CC BY) license.