


Abstract
Natural volcanic ash can modify titanium-alloy oxidation, yet the role of ash chemistry at intermediate temperatures remains poorly resolved. Here, near-α Ti65 alloy is coated with three natural ashes having comparable particle-size ranges but different bulk compositions. Specimens are exposed in air at 650 °C for 24 h, then assessed by mass change, microscopy, EDS, and XRD. Compared with Bare-Ti, the ash-coated specimens show greater observed mean surface-particle coverage (1.77 ± 0.53% for Bare-Ti and 7.53 ± 1.57% to 11.29 ± 2.49% for the coated groups) and higher mean values of apparent oxide-layer thickness estimated by EDS (0.44 ± 0.04 μm for Bare-Ti and 1.29 ± 0.04 to 1.59 ± 0.03 μm for the coated groups). Particle regions on coated specimens are enriched in O, Al, Si, Na, and Ca. Combined EDS and XRD evidence is consistent with TiO2-related signals and tentative albite-like (NaAlSi3O8) and anorthite-like (CaAl2Si2O8) assignments for the surface-particle assemblage. The coated specimens show similar local particle-composition groups but different observed mean responses. VA3 has the highest observed mean whole-specimen net mass change after exposure and cleaning (0.52 ± 0.14 mg cm−2), whereas VA2 has the highest mean particle coverage (11.29 ± 2.49%). These differences may be associated with variations in the relative availability of Si–Al-bearing, silicate-network-modifying, and Fe–Mg–Ti-related constituents. Taken together, these findings suggest that natural volcanic ash is more than a passive deposit during Ti65 oxidation at 650 °C.
1. Introduction
The overlap between major air routes and volcanically active regions makes volcanic eruptions a persistent threat to aviation safety and operational continuity. Fine ash can reach cruising altitudes and be distributed over vast distances, resulting in damage to aircraft components, flight diversions, and airport closures [1,2]. The 2010 eruption of Eyjafjallajökull in Iceland disrupted European air transportation for almost a week [1]. Once ingested by an aeroengine, ash particles may pass through the compressor, combustor, and turbine. Their passage may cause erosion, surface deposition, cooling-channel blockage, and deterioration of aerodynamic performance [3,4,5]. Whether particles rebound, or adhere and form deposits, depends on their concentration, particle size and physico-chemical properties as dictated by phase state and chemistry, as well as impact conditions such as flow temperature and wall temperature [5,6]. Thus, the assessment of volcanic-ash-related aviation hazards must consider particle dynamics and thermal state together with the chemical variability of the ash.
Natural volcanic ash is largely an assemblage of fragments of volcanic glass (vitrified from a high temperature magmatic liquid), cognate crystalline minerals in different size classes and with different chemical stoichiometries and structures (crystallized from the magmatic liquid), and “so-called” lithic fragments (rock fragments caught up in eruption columns). Its glass-to-crystal ratio, bulk composition, particle-size distribution, and thermophysical properties vary with geological source. Taltavull et al. showed that particle size and thermal state govern adhesion after impact [6]. Dean et al. identified ash composition and high-temperature viscosity as key controls on adhesion, while showing that glass-transition temperature or glass content alone is an insufficient descriptor of adhesion propensity [7]. Sintering, melting, wetting, and deposition are further relevant processes which are controlled by combinations of chemical composition, glass-to-crystal ratio, and particle size [8,9]. Consequently, ashes from different sources can exhibit markedly different thermal responses and damage potential. This variability limits our ability to extrapolate from a single characteristic temperature or ash composition (natural or simulated).
To date, studies of volcanic-ash-induced material degradation have focused primarily on hot-section environments, particularly combustors and high-pressure turbines. Above the ash softening or melting range, molten silicates wet and infiltrate pores or columnar gaps in thermal barrier coatings. This infiltration promotes dissolution and reprecipitation of ceramic phases such as yttria-stabilized zirconia (YSZ), accompanied by stabilizer depletion and dissolution into the melt phase and microstructural stiffening of the partially infiltrated and corroded composite TBC assembly [10,11]. Thermal stresses generated during cooling promote channel cracking, interfacial delamination, and coating spallation [12,13]. Ash chemistry also controls melting temperature, infiltration kinetics, and reaction-product chemistry [14,15,16].
These findings come from studies of molten deposits on ceramic coatings at high temperatures. They do not describe interactions between natural volcanic ash and cold-section metallic components at intermediate temperatures. Yet as the operating temperatures of cold-section metallic components rise, it remains unclear whether ash deposition promotes interfacial reactions in addition to mechanical erosion. It is this regime which is investigated below.
Ti65 is a ten-component near-α titanium alloy developed for service at 650 °C (Ti-Al-Sn-Zr-Mo-Si-Nb-Ta-W-C) [17], making its response to ash deposition directly relevant to this intermediate-temperature gap. During exposure to air, titanium alloys form a TiO2-rich oxide scale while oxygen dissolves and diffuses into the substrate. The resulting oxygen-enriched zone hardens and embrittles the near-surface region, limiting long-term use at elevated temperatures [18,19,20,21]. Ti65 develops a multilayered oxide scale and an underlying oxygen-diffusion zone during exposure in air at 650–850 °C [17]. More broadly, oxidation kinetics, scale stability, and oxygen transport in high-temperature titanium alloys depend on alloy chemistry and microstructure [19,20,21]. Most previous work, however, has examined deposit-free oxidation.
Bardel et al. showed that synthetic CMAS deposits altered surface products and α-phase precipitation during thermal aging of β21S titanium alloy [22], demonstrating that although silicate deposits can modify oxidation and microstructural evolution, synthetic CMAS cannot reproduce the glass-crystal heterogeneity or source-dependent chemistry of natural volcanic ash in such processes. Consequently, how natural-ash composition affects oxidation and surface reactions in high-temperature titanium alloys requires examination.
To address this gap, Ti65 specimens were coated with three natural volcanic ashes collected from Datong, China, and the Lokon and Merapi Volcanoes, Indonesia. Lokon and Merapi ashes originate from highly volcanically active Southeast Asia and are directly relevant to aeroengine exposure [23] in that region and elsewhere, whereas Datong ash provides a compositionally distinct geological reference. Using ashes with broadly comparable particle-size ranges, this study examines and compares their effects on Ti65 during exposure in air at 650 °C. Specifically, it evaluates mass change and surface-product morphology, the participation of ash-derived elements in particle-phase formation and phase evolution, and composition-dependent surface reactivity. This comparison shows that chemically distinct natural ashes can yield similar types of surface products on Ti65 at its intended service temperature of 650 °C, while mean particle coverage and oxide-layer thickness vary among the ash-coated groups. Together, this comparative design provides an experimental basis for assessing volcanic-ash-induced degradation of titanium-alloy components in aeroengines.
2. Materials and Methods
2.1. Ti65 Substrate and Volcanic Ash Characteristics
The substrate was a bimodal Ti65 high-temperature titanium alloy (Baoti Group Co., Ltd., Baoji, China) with a nominal composition of Ti-5.8Al-4.0Sn-3.5Zr-0.5Mo-0.4Si-0.3Nb-1.0Ta-0.8W-0.05C (wt.%). Rectangular specimens measuring 15 mm × 10 mm × 2 mm were machined from the alloy. Before thermal exposure, each specimen was ground to 2000 grit, ultrasonically cleaned (Supmile, Kunshan, China) in absolute ethanol (Sinopharm Chemical Reagent Co., Ltd., Shanghai, China), and dried.
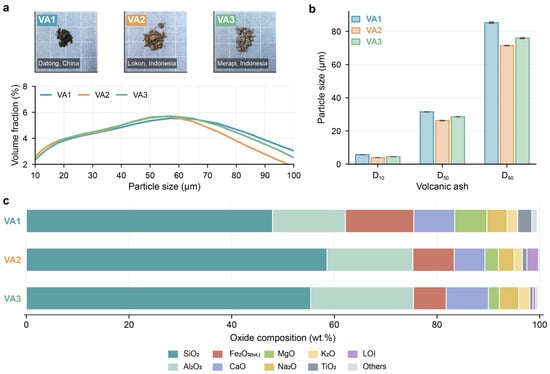
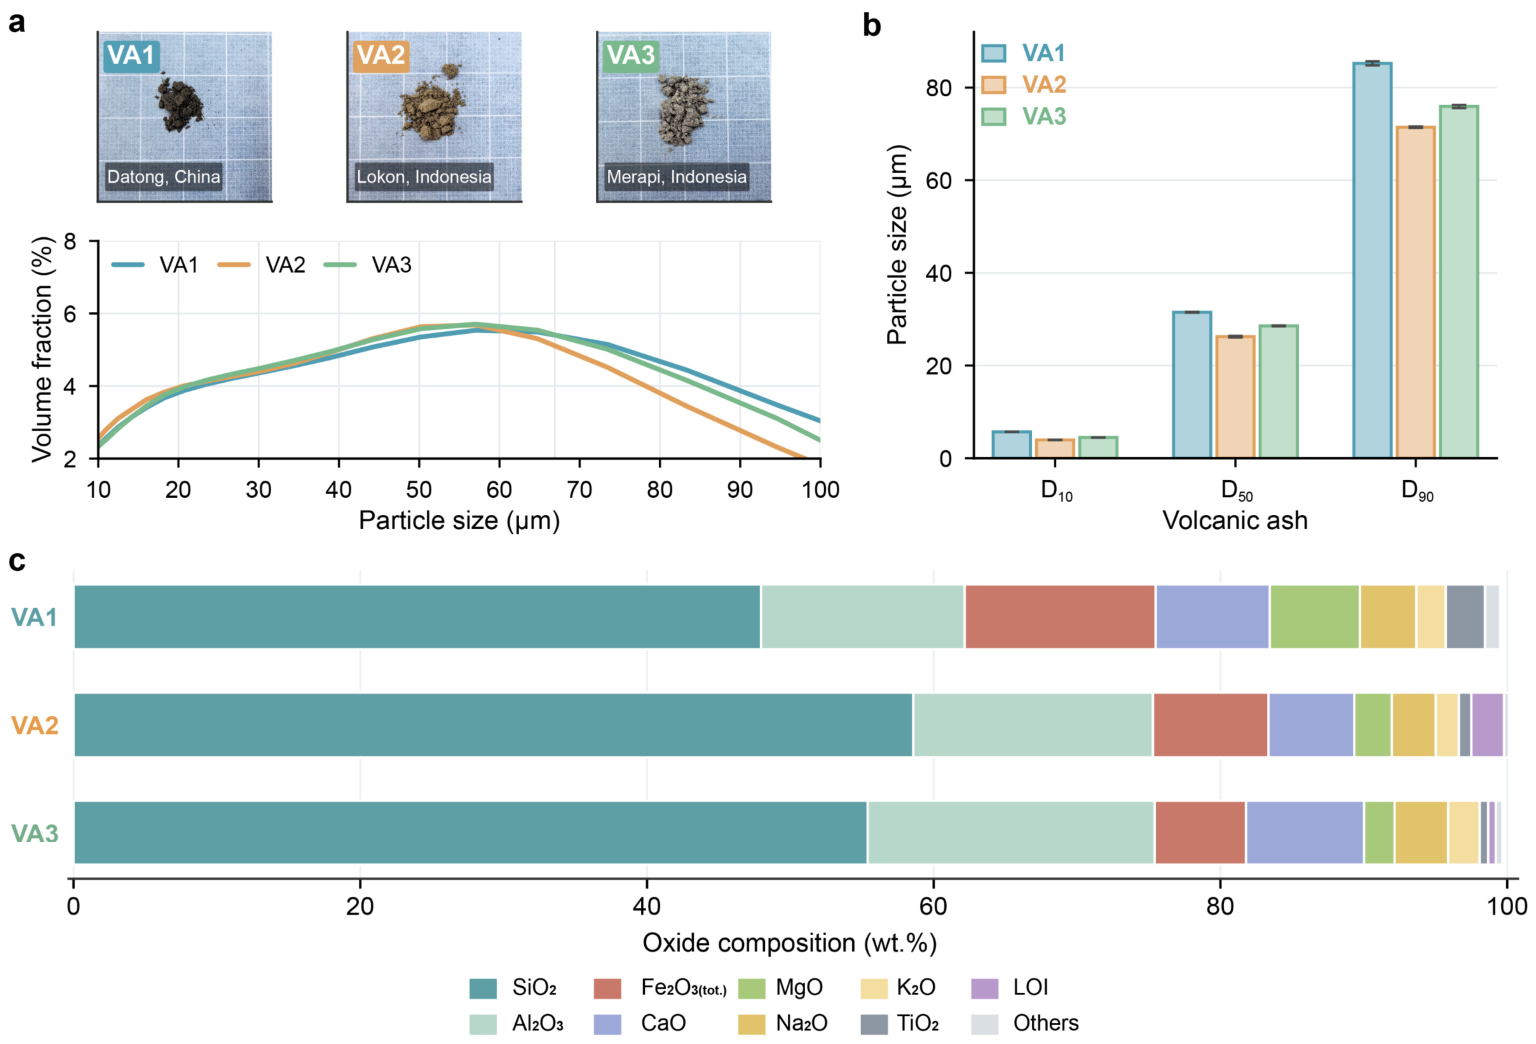
The three natural volcanic ashes were labeled VA1, VA2, and VA3 according to their sources. VA1 was collected from Datong Volcano in China, while VA2 and VA3 originated from Lokon and Merapi Volcanoes in Indonesia, respectively. Powders for particle-size analysis and coating were prepared by homogenizing, drying, grinding, and sieving the as-received ashes. All powders remained agglomerated after processing. Their colors differed: VA1 was dark gray to blackish gray, VA2 was light brown, and VA3 was grayish brown (Figure 1a).
Figure 1.
Appearance, particle-size distribution, and bulk oxide composition of the three volcanic ashes. (a) Macroscopic appearance and particle-size distributions of VA1 (Datong, China), VA2 (Lokon, Indonesia), and VA3 (Merapi, Indonesia). (b) D10, D50, and D90 percentiles (μm; mean ± standard deviation, n = 3). (c) Oxide composition (wt.%) and loss on ignition (LOI). ‘Others’ comprises P2O5 and MnO. The lines in the picture are error bars.
Particle-size distributions and bulk oxide compositions (wt.%) are presented in Figure 1b,c and Table 1. The bulk oxide compositions of the starting ash powders were determined using X-ray fluorescence (XRF)(Rigaku, Akishima, Japan). For VA1, VA2, and VA3, the D50 values were 31.50 ± 0.10, 26.23 ± 0.17, and 28.56 ± 0.10 μm, respectively. The corresponding D90 values were 85.22 ± 0.45, 71.44 ± 0.17, and 75.92 ± 0.34 μm (Table 1). These values indicate broadly comparable particle-size distributions. All ashes consisted primarily of SiO2 and Al2O3, with CaO, MgO, Fe2O3(tot.), Na2O, K2O, and minor TiO2, P2O5, and MnO. VA1 had the highest Fe2O3(tot.), MgO, TiO2, and P2O5 fractions; VA2 had the highest SiO2 fraction; and VA3 had the highest Al2O3, CaO, and K2O fractions. These materials therefore enabled comparison of composition-dependent surface reactions at broadly comparable particle-size ranges.
Table 1.
Bulk oxide composition and particle-size percentiles of the volcanic ashes; particle-size data are mean ± standard deviation (n = 3).
2.2. Volcanic Ash Coating and High-Temperature Exposure
Before coating, each volcanic-ash powder was dried at 110 °C for 30 min to remove physically adsorbed water, then cooled to room temperature in a desiccator (ANSAI, Shenzhen, China). The target deposit loading was 20 mg cm−2, corresponding to 30 mg of ash over the 1.5 cm2 coated area of each Ti65 specimen. For each specimen, 30 mg of ash was dispersed in 0.5 mL of absolute ethanol and shaken to form a spray suspension. Specimens were preheated to 90 °C on a hot plate, and the suspension was applied uniformly with a small airbrush (Haosheng, Ningbo, China) to one 15 mm × 10 mm face. The reverse and side faces received the same surface preparation across all groups and were left unmasked during thermal exposure.
After ethanol evaporation, the coated groups were denoted VA1, VA2, and VA3; uncoated specimens (Bare-Ti) served as air-oxidation controls. All specimens were heated in air from room temperature to 650 °C at 10 °C·min−1 and held for 24 h. The 24 h hold provided a common endpoint for comparing surface products and assessing possible interfacial product formation. It was selected to allow reaction-related features to develop sufficiently for characterization within a practical test duration. After exposure, the specimens were removed from the furnace and cooled in air to room temperature. For each condition, three replicate specimens were prepared and subjected to the same exposure protocol.
2.3. Mass Measurement and Surface Characterization
Specimen mass was measured before coating (m0), after coating (m1), and after thermal exposure and cleaning (m2). After cooling in air to room temperature, specimens from all groups were ultrasonically cleaned in absolute ethanol for 10 min before the final weighing. The actual deposit loading was verified as m1 − m0. The net mass change in the whole specimen after exposure and cleaning was calculated as Δm = m2 − m0 and reported as Δm/A (mg cm−2), where A = 1.5 cm2 is the geometric area designated for ash deposition. The same reference area was used for all groups, including Bare-Ti. The measured Δm includes the net contributions from oxidation of all exposed alloy surfaces, retained ash-derived material, and any material loss during exposure, cooling or cleaning. These contributions were not quantified separately. Mass measurements were obtained with an analytical balance (Mettler-Toledo GmbH, Greifensee, Switzerland) having a stated precision of 0.1 mg. Summary values are reported as arithmetic mean ± sample standard deviation (SD), with SD calculated using n − 1 in the denominator. Net mass change uses three specimens per condition. Other observation units are SEM fields, measured particle features, EDS mapped areas, selected spots or line scans, as specified in the captions. Comparisons are descriptive: rankings refer to observed means within the stated sampling units, and no statistical significance between groups is claimed.
Surface particle products and their morphologies were examined using scanning electron microscopy (SEM; Sigma 300, Zeiss, Carl Zeiss Microscopy GmbH, Oberkochen, Germany) at 10 kV and a working distance of 8.5 mm. Particle coverage and size were assessed from three SEM fields per condition, each calibrated using its scale bar. Surface features were delineated manually. Each 8-connected region of at least three pixels was treated as one feature. Coverage was calculated as the total projected area of the retained features divided by the analyzed field area. Energy-dispersive X-ray spectroscopy (EDS) (Oxford Instruments NanoAnalysis, High Wycombe, UK) analyses were conducted at an accelerating voltage of 10 kV and a working distance of 10 mm. Elemental mapping was used to assess the spatial distributions and local enrichment of surface elements. EDS spots were selected from SEM images on identifiable surface particles and in particle-free oxidized surface regions, defined as regions without discrete particles visible in the SEM images. Line scans were performed to profile elemental distributions from the oxide scale into the substrate. X-ray diffraction (XRD; DX-2700BH, Haoyuan, Dandong, China) was performed on initial Ti65, thermally exposed Bare-Ti and VA1–VA3 specimens, and the starting ash powders. The measurements used Cu radiation (λ = 1.54184 Å) at 40 kV and 30 mA, with a 2θ sampling interval of 0.02°. The recorded 2θ ranges were 20.00–90.00° for the Ti65 specimens and the ash powders.
3. Results and Analysis
3.1. Net Mass Change After Thermal Exposure
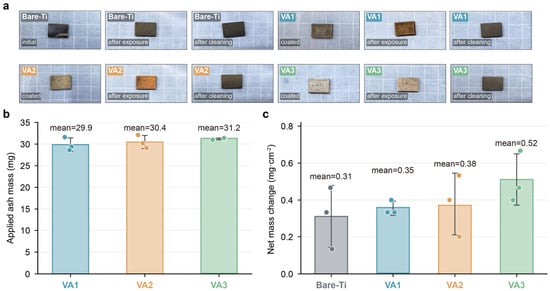
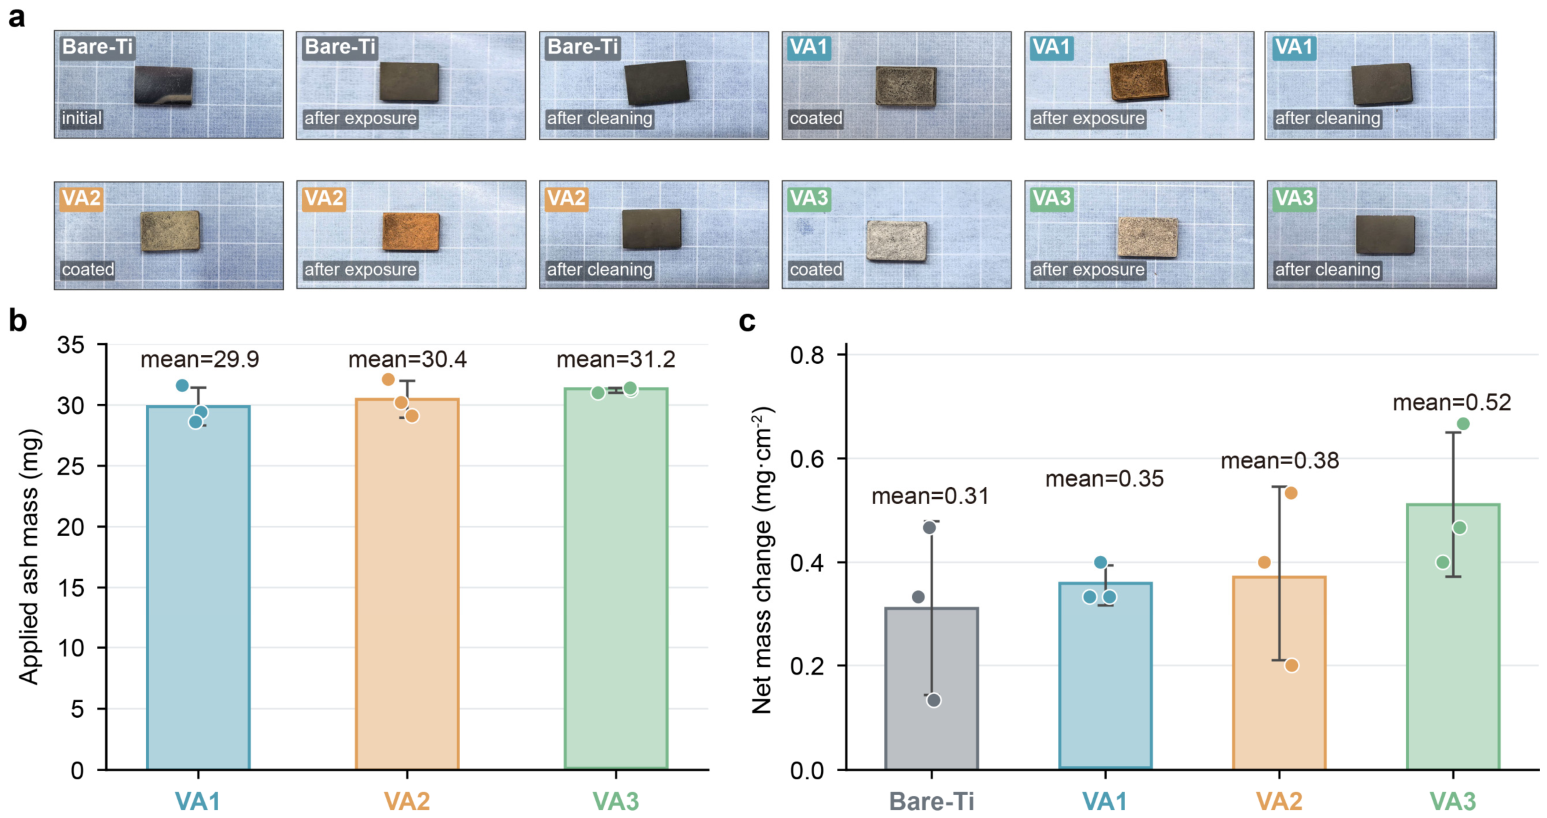
Figure 2a compares the macroscopic appearance of Bare-Ti and volcanic-ash-coated specimens before and after thermal exposure at 650 °C. Deposits were visible on the coated specimens before and after exposure. After ultrasonic cleaning, these macroscopic deposits were no longer discernible in the images, and all four groups had broadly similar surface appearances. However, these images do not establish complete removal of ash-derived material at smaller scales. The applied masses of VA1, VA2, and VA3 were 29.9 ± 1.5, 30.4 ± 1.5, and 31.2 ± 0.2 mg, respectively (Figure 2b). All three values were close to the 30 mg target, indicating comparable initial deposit loadings. After cleaning, the area-normalized net mass changes were 0.31 ± 0.17 mg cm−2 for Bare-Ti and 0.35 ± 0.03, 0.38 ± 0.17, and 0.52 ± 0.14 mg cm−2 for VA1, VA2, and VA3, respectively (Figure 2c). VA3 had the highest observed mean whole-specimen net mass change after exposure and cleaning, while VA1 and VA2 had intermediate observed means.
Figure 2.
Macroscopic appearance, applied volcanic-ash mass, and net mass change in Ti65 specimens exposed in air at 650 °C. (a) Bare-Ti and VA1–VA3 specimens in the initial or coated condition, after 24 h exposure, and after cleaning. (b) Applied volcanic-ash mass (mg). (c) Whole-specimen net mass change after exposure and cleaning, normalized to the reference area A = 1.5 cm2 (mg cm−2). Bars in (b,c) show means and error bars indicate ±1 SD (n = 3 specimens per applicable condition). The lines in the picture are error bars.
3.2. Surface Particle Morphology and Coverage
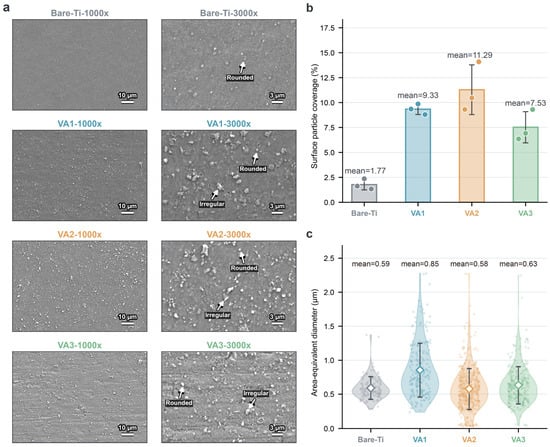
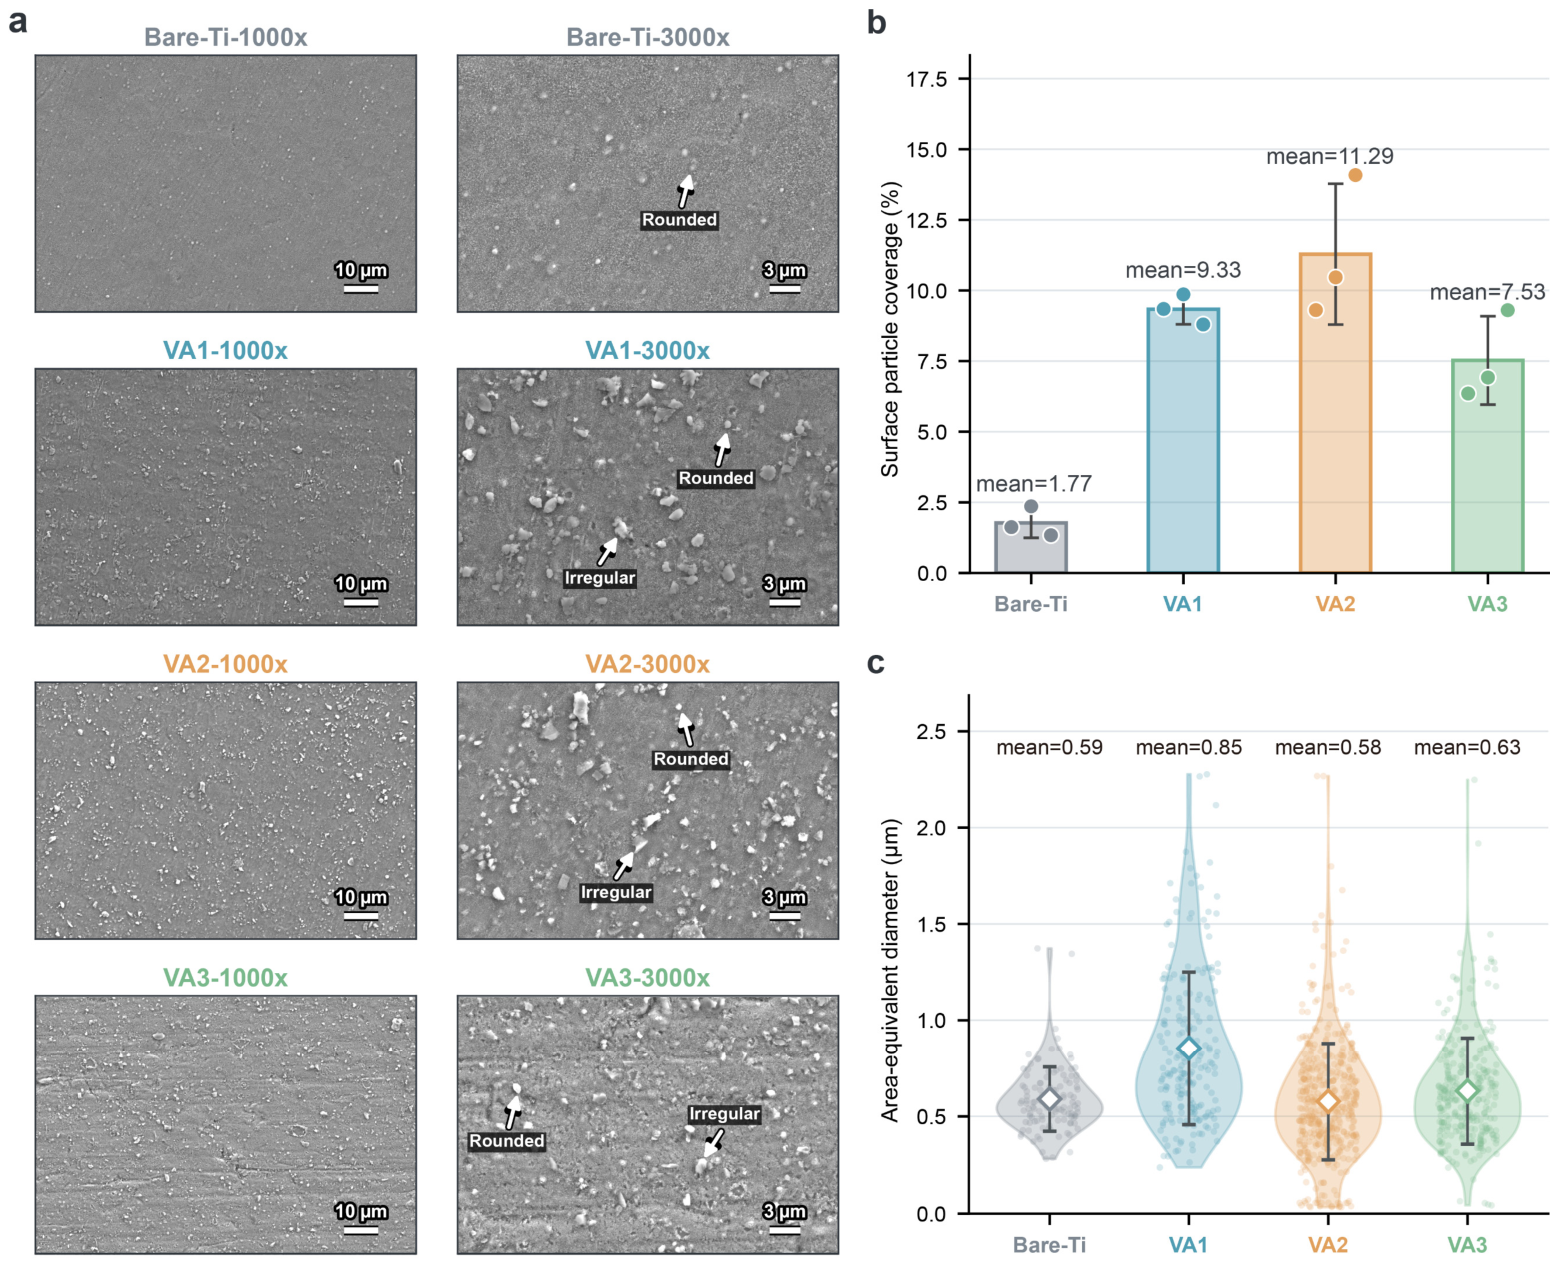
Surface morphology differed clearly between Bare-Ti and the three volcanic-ash-coated specimens after exposure at 650 °C (Figure 3a). Bare-Ti had a relatively smooth surface with only a few fine bright particles. In contrast, the coated specimens contained numerous bright blocky particles and irregular agglomerates. VA1 contained blocky particles and irregular agglomerates over a range of sizes. VA2 showed a denser distribution of bright particles, whereas VA3 was dominated by finer particles.
Figure 3.
Surface particle morphology, coverage, and size after thermal exposure. (a) Representative SEM images of Bare-Ti and VA1–VA3 after 24 h exposure in air at 650 °C. (b) Surface particle coverage (mean ± SD, n = 3 SEM fields per condition). (c) Distribution and mean ± SD of area-equivalent diameters across the three fields (n = 118, 211, 472, and 299 features for Bare-Ti, VA1, VA2, and VA3, respectively). The lines in the picture are error bars.
Surface particle coverage was 1.77 ± 0.53% for Bare-Ti and 9.33 ± 0.53%, 11.29 ± 2.49% and 7.53 ± 1.57% for VA1, VA2 and VA3, respectively (mean ± SD across three SEM fields per condition; Figure 3b). The observed mean coverage was higher in each coated group, with VA2 having the highest field mean. The area-equivalent particle diameters were 0.59 ± 0.17, 0.85 ± 0.40, 0.58 ± 0.30 and 0.63 ± 0.27 μm, respectively (Figure 3c). These diameter summaries describe the measured features within the three fields; VA1 had the highest observed mean diameter.
3.3. Surface Elemental Enrichment
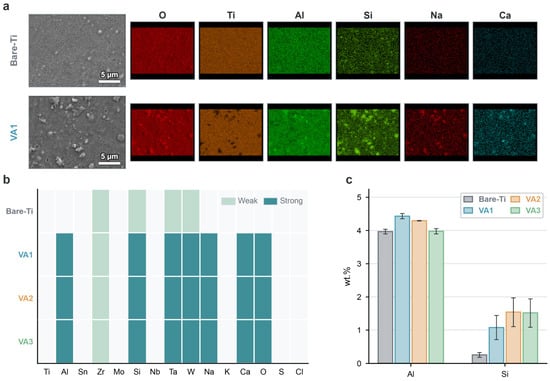
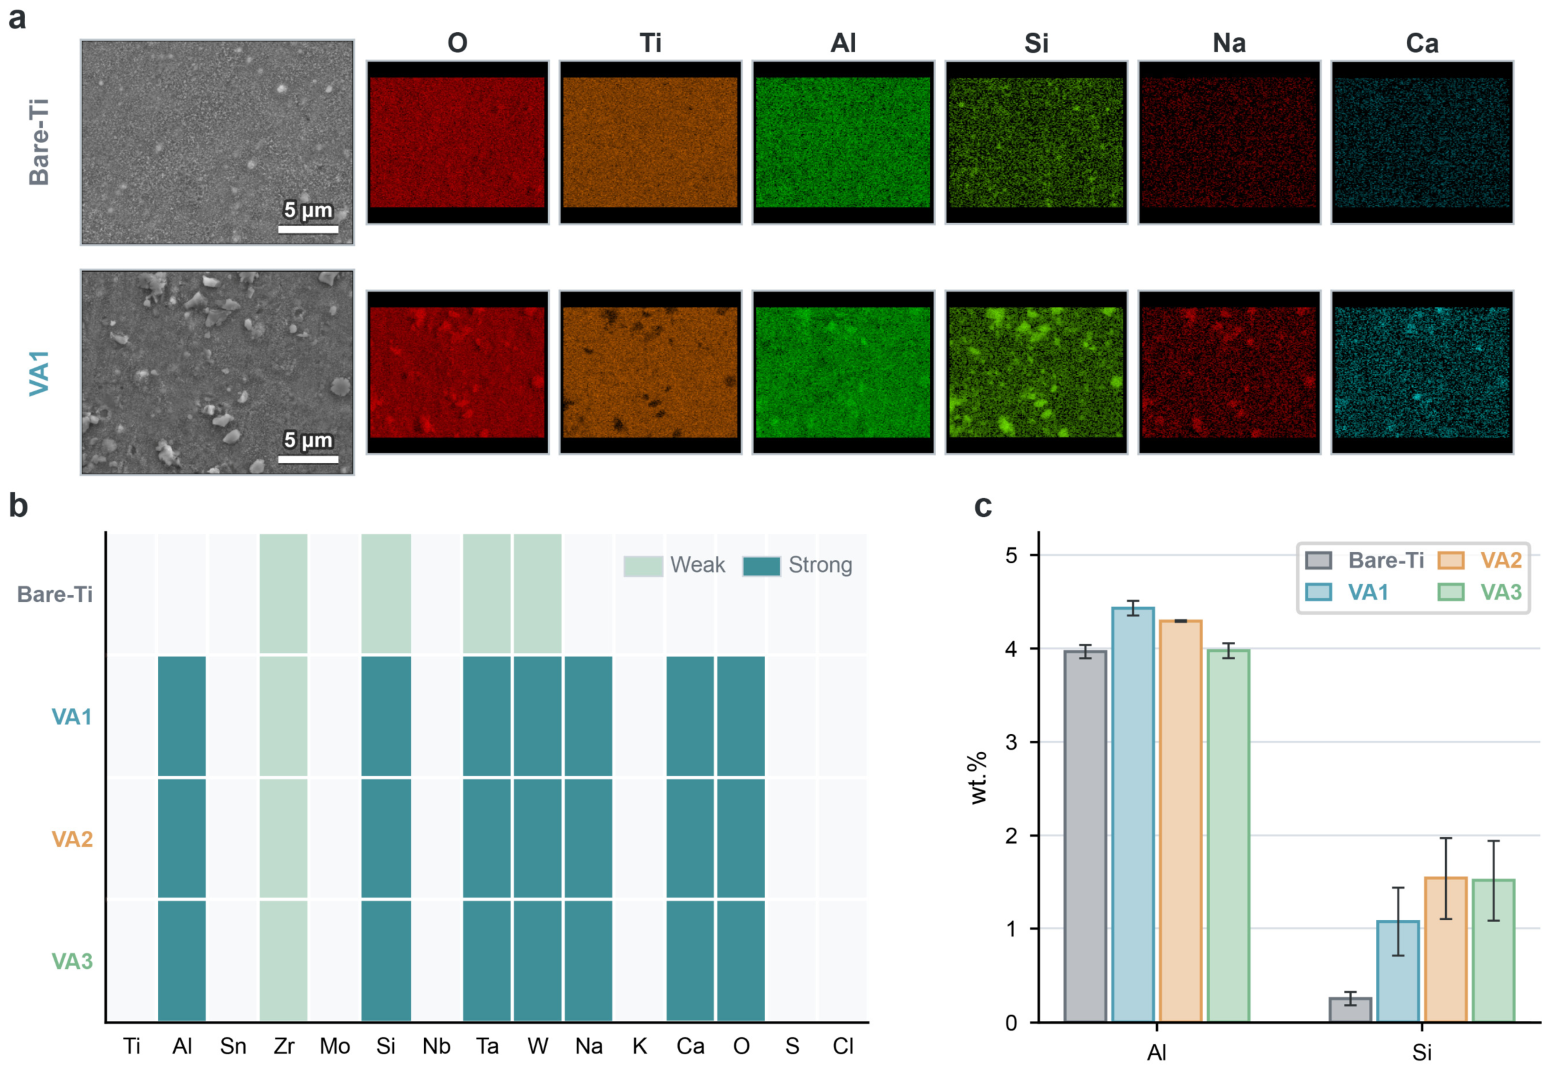
Surface EDS mapping resolved the elemental distributions after thermal exposure at 650 °C (Figure 4), with the corresponding compositions summarized in Table 2. Because the three coated specimens exhibited similar enrichment patterns, VA1 is shown as a representative example; the complete maps are provided in Supplementary Figure S1. Ti and O were the major detected elements on every surface. Across the mapped regions, the O and Ti mass fractions ranged from 35.2 to 37.7 wt.% and from 50.8 to 53.9 wt.%, respectively. Differences among the coated groups were apparent mainly in the local elemental distributions.
Figure 4.
Surface EDS elemental maps and local enrichment after thermal exposure. (a) Representative SEM images of Bare-Ti and VA1 and corresponding maps of O, Ti, Al, Si, Na, and Ca; maps for VA2 and VA3 are provided in Supplementary Figure S1. (b) Qualitative three-level particle-enrichment scores derived from the elemental maps. (c) Surface Al and Si contents obtained by EDS mapping (wt.%). Values in (c) are mean ± SD (n = 2 mapped areas per condition). The lines in the picture are error bars.
Table 2.
Surface elemental compositions determined by EDS mapping after thermal exposure (wt.%, mean ± SD, n = 2 mapped areas per condition).
Bare-Ti showed no pronounced local enrichment of O, Ti, or Al (Figure 4a). Weak Si enrichment occurred in only a few regions, while Na and Ca contents were close to zero. The analyzed coated-surface regions showed higher observed Na and Ca contents than Bare-Ti. The EDS maps showed local enrichment of O, Al, Si, Na, and Ca in visible particle regions, accompanied by a lower relative Ti signal at the same locations. Figure 4b summarizes the enrichment of Ti65 alloying elements and major ash-derived elements in particle regions. Sn, Mo, Nb, S, Cl, and K showed no distinct particle enrichment. Zr was enriched in particle regions to a similar extent on Bare-Ti and the coated specimens, whereas Ta and W exhibited stronger local enrichment on the coated specimens. The surface Si contents for Bare-Ti, VA1, VA2, and VA3 were 0.25 ± 0.07, 1.07 ± 0.36, 1.53 ± 0.44, and 1.51 ± 0.43 wt.%, respectively. The corresponding Al contents were 3.97 ± 0.07, 4.43 ± 0.08, 4.29 ± 0.01, and 3.98 ± 0.08 wt.% (Figure 4c and Table 2). Thus, variation among groups was more evident for Si than for Al within the mapped regions.
3.4. Surface-Particle Composition
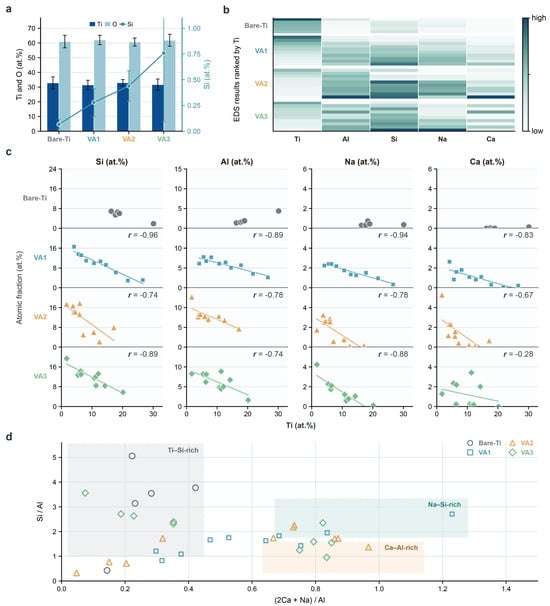
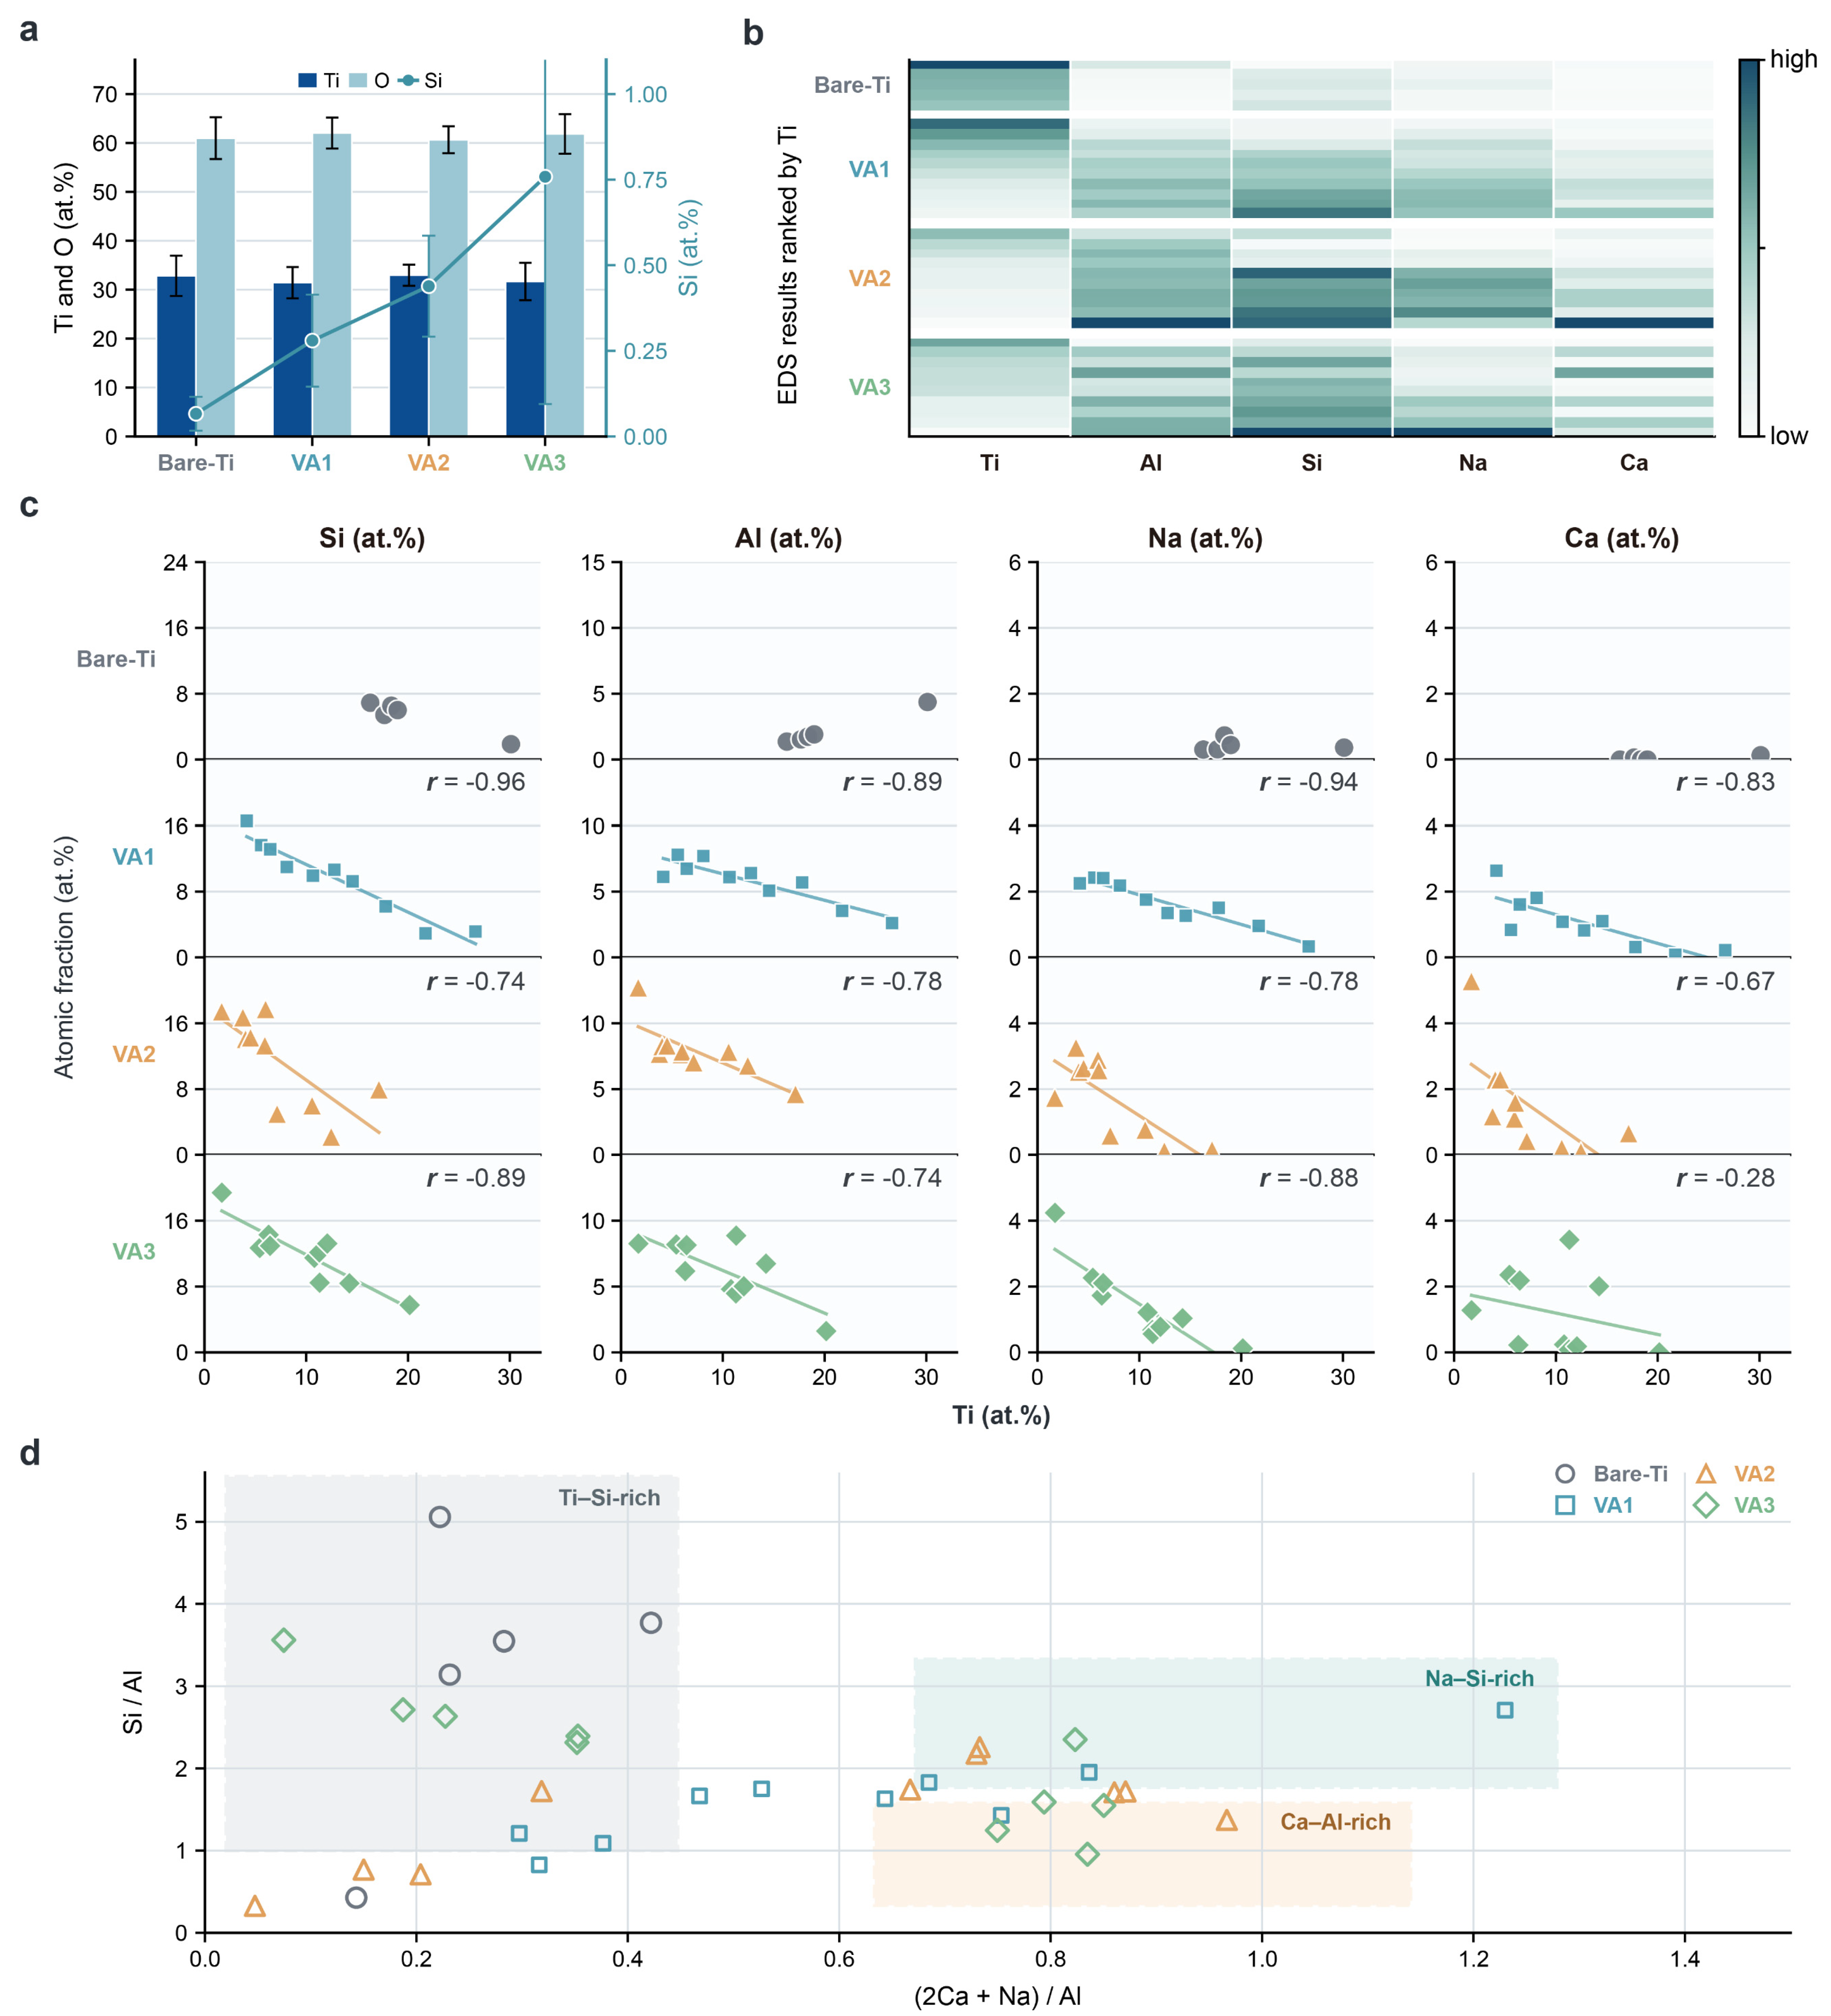
Figure 5a summarizes EDS point analyses of particle-free oxidized surface regions. For each condition, five spots were selected on areas of the exposed surface without discrete particles visible in the SEM images (Figure S2). Compositions were similar across the four groups and were dominated by Ti and O. For Bare-Ti, VA1, VA2, and VA3, the Ti contents were 32.84 ± 4.12, 31.43 ± 3.20, 32.95 ± 2.17, and 31.67 ± 3.82 at.%, respectively, and the O contents were 60.98 ± 4.27, 62.02 ± 3.17, 60.64 ± 2.76, and 61.84 ± 4.04 at.%, respectively. The corresponding Al contents were 4.38 ± 0.45, 4.35 ± 0.53, 3.93 ± 0.58, and 3.77 ± 0.77 at.%. The O/Ti atomic ratios calculated from the condition means ranged from 1.84 to 1.97, close to the stoichiometric ratio of TiO2. The Si contents were 0.07 ± 0.05, 0.28 ± 0.13, 0.44 ± 0.15, and 0.76 ± 0.84 at.%, respectively. VA3 had the highest mean Si content, although the absolute concentration remained low.
Figure 5.
Local EDS composition and composition-based classification of surface particles. (a) Ti, O, and Si contents in particle-free oxidized surface regions (at.%, mean ± standard deviation, n = 5 spots per condition). (b) EDS heat map of visible surface particles, ranked by decreasing Ti content within each group (five spots for Bare-Ti and ten per ash-coated condition). Each elemental column was independently min–max normalized, so color intensity cannot be compared quantitatively between columns. (c) Descriptive covariation between Ti and Si, Al, Na, and Ca in the selected particle spots, shown using Pearson r and linear fits. (d) Empirical composition groups based on the (2Ca + Na)/Al and Si/Al atomic ratios. Point locations and complete values are provided in Figure S2 and Table S1.
Figure 5b compares EDS point analyses of particles identifiable in the SEM images. Five particle spots were selected for Bare-Ti and ten for each ash-coated group (Figure S2). These points were selected to compare local compositions. Within each group, points were arranged in decreasing order of Ti content. Color intensity represents the relative content of each element, and complete values are provided in Table S1. Bare-Ti particles contained Ti, Zr, and Si at 20.28 ± 5.58, 5.22 ± 1.74, and 5.35 ± 2.03 at.%, respectively, and Al, Na, and Ca at 2.18 ± 1.24, 0.43 ± 0.18, and 0.04 ± 0.06 at.%, respectively, giving a Ti–Si-rich composition. Mean Ti contents decreased to 12.84 ± 7.40, 7.33 ± 4.71, and 9.98 ± 5.22 at.% in VA1, VA2, and VA3 particles, respectively, and the coated groups had higher mean Al, Si, Na, and Ca contents. VA2 particles had the highest mean Al and Ca contents (7.88 ± 2.01 and 1.51 ± 1.54 at.%, respectively), and VA3 particles had the highest mean Si content (11.89 ± 3.77 at.%). Within the selected spots, the coated specimens showed higher mean contributions from Na, Ca, Al and Si relative to the Ti–Si-rich regions on Bare-Ti.
Figure 5c summarizes covariation between Ti and the other elements using Pearson correlation coefficients. Negative r values denote inverse relationships, whose strength increases as |r| approaches 1. For VA1, r values between Ti and Al, Si, Na, and Ca were −0.89, −0.96, −0.96, and −0.82, respectively. Corresponding values were −0.78, −0.74, −0.78, and −0.67 for VA2. For VA3, the respective values were −0.74, −0.89, −0.88, and −0.28. Within the selected points, Ti was strongly inversely related to Al, Si, Na, and Ca in VA1 and VA2. VA3 retained strong inverse relationships between Ti and Al, Si, and Na, but the relationship with Ca was weaker. The EDS atomic percentages sum to 100%, so an increase in one elemental fraction reduces the combined fraction of the others. This constraint may contribute to the inverse correlations.
Three composition groups were identified from the local particle analyses (Figure 5d). The first comprised Ti–Si-rich particles similar to those on Bare-Ti, represented by VA1-9 and VA3-9. VA1-9 contained 21.72 at.% Ti and 2.92 at.% Si, while VA3-9 contained 20.16 at.% Ti and 5.75 at.% Si. Both points had low Al, Na, and Ca contents. The second group comprised Ca–Al-rich particles. VA2-2 contained 1.70 at.% Ti, together with 12.72 at.% Al, 5.28 at.% Ca, and 17.44 at.% Si. VA3-4, VA3-6, and VA3-10 also had high Al and Ca contents. The third group comprised Na–Si-rich particles, including VA2-9, VA2-10, and VA3-7, which combined high Si and Na contents with low Ca contents. Thus, the particles on the coated surfaces were grouped empirically as Ti–Si-rich, Ca–Al-rich, or Na–Si-rich according to their local EDS compositions. Tentative phase assignments are based on these compositions together with the XRD results.
3.5. XRD Observations and Tentative Phase Assignments
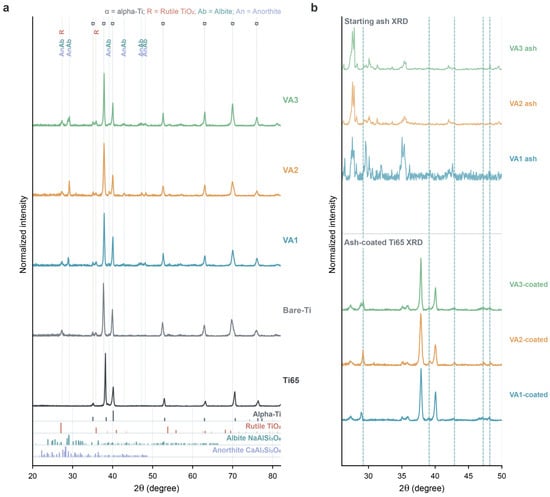
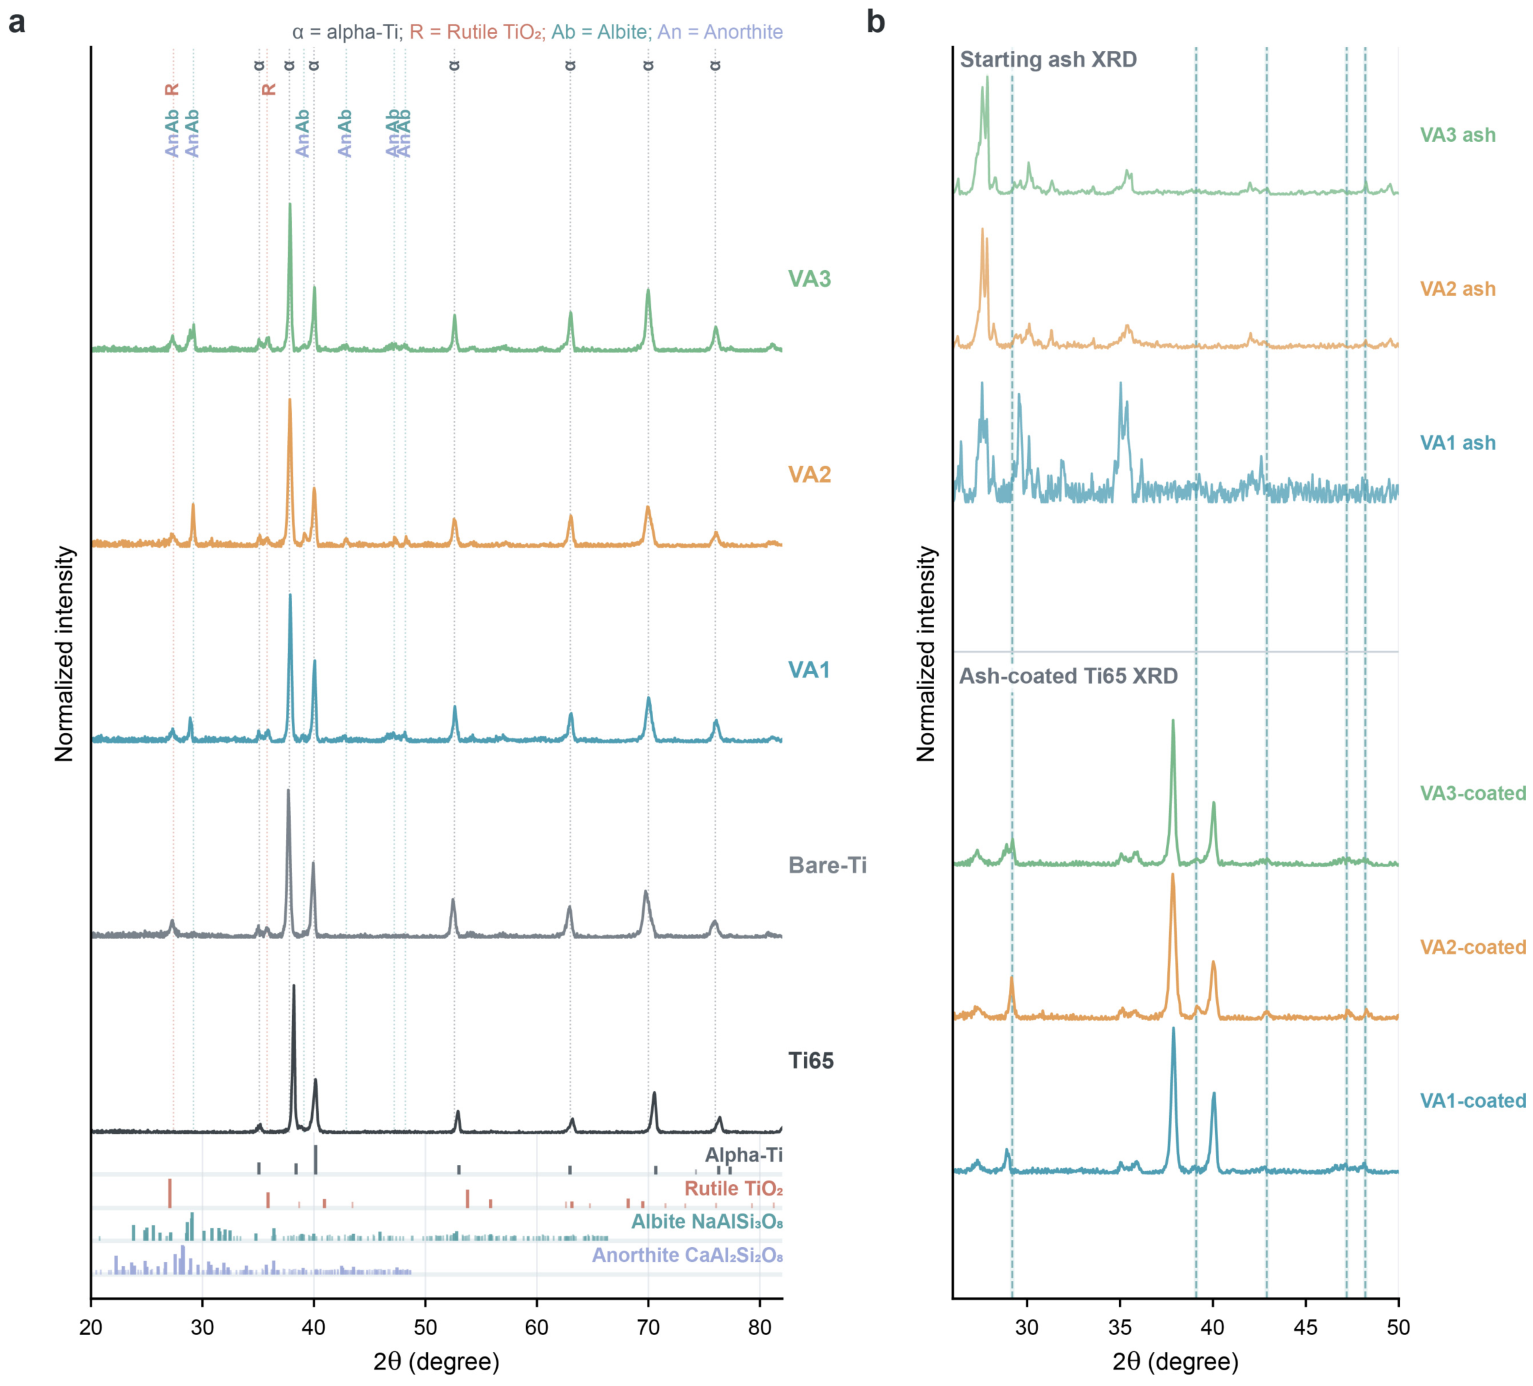
XRD patterns of initial Ti65 were compared with those of specimens exposed for 24 h in air at 650 °C (Figure 6a). Initial Ti65 exhibited major peaks at approximately 35.1°, 37.8°, 40.0°, 52.6°, 63.0°, 70.0°, and 76.0°, assigned to α-Ti. After exposure, Bare-Ti showed substrate peaks and TiO2-related peaks at approximately 27.4°, 35.8°, and 39.1°. VA1, VA2, and VA3 likewise showed substrate and TiO2-related peaks. Additional diffraction features near 29.2°, 42.9°, 47.2°, and 48.2° were observed in all three coated groups.
Figure 6.
XRD patterns of uncoated and volcanic-ash-coated Ti65 after thermal exposure. (a) Normalized patterns of initial Ti65 and specimens exposed for 24 h in air at 650 °C. Reference positions are shown for α-Ti (PDF 00-005-0682), rutile TiO2 (98-006-6650), albite NaAlSi3O8 (98-017-1092), and anorthite CaAl2Si2O8 (98-020-2711). (b) Comparison between the initial ashes and coated Ti65 specimens. Dashed lines mark selected 2θ positions for comparison between the starting ashes and the exposed specimens. The α-Ti and TiO2 assignments refer to measured specimen-level diffraction signals. The feldspar reference positions are considered together with local EDS compositions for tentative albite-like and anorthite-like assignments.
The starting-ash patterns were compared with those of the exposed specimens (Figure 6b). VA1 exhibited a relatively complex initial pattern, while VA2 and VA3 shared several peak positions. The starting-ash patterns did not reproduce the full set of additional features near 2θ = 29.2°, 42.9°, 47.2°, and 48.2° in the exposed specimens. In particular, the feature near 29.2° had no consistent, clearly resolved counterpart in the starting-ash patterns. Considered together with the local EDS compositions, these features are consistent with tentative albite-like (NaAlSi3O8) and anorthite-like (CaAl2Si2O8) assignments, as discussed in Section 4.1. This comparison does not exclude changes within the deposits during exposure, and does not independently demonstrate that new crystalline phases formed through ash–alloy interfacial reactions.
3.6. Apparent Oxide-Layer Thickness Estimated by EDS
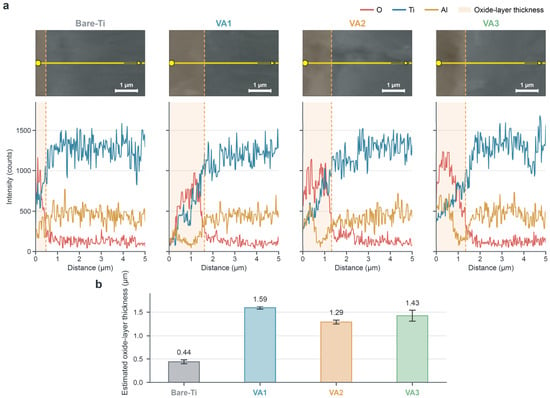
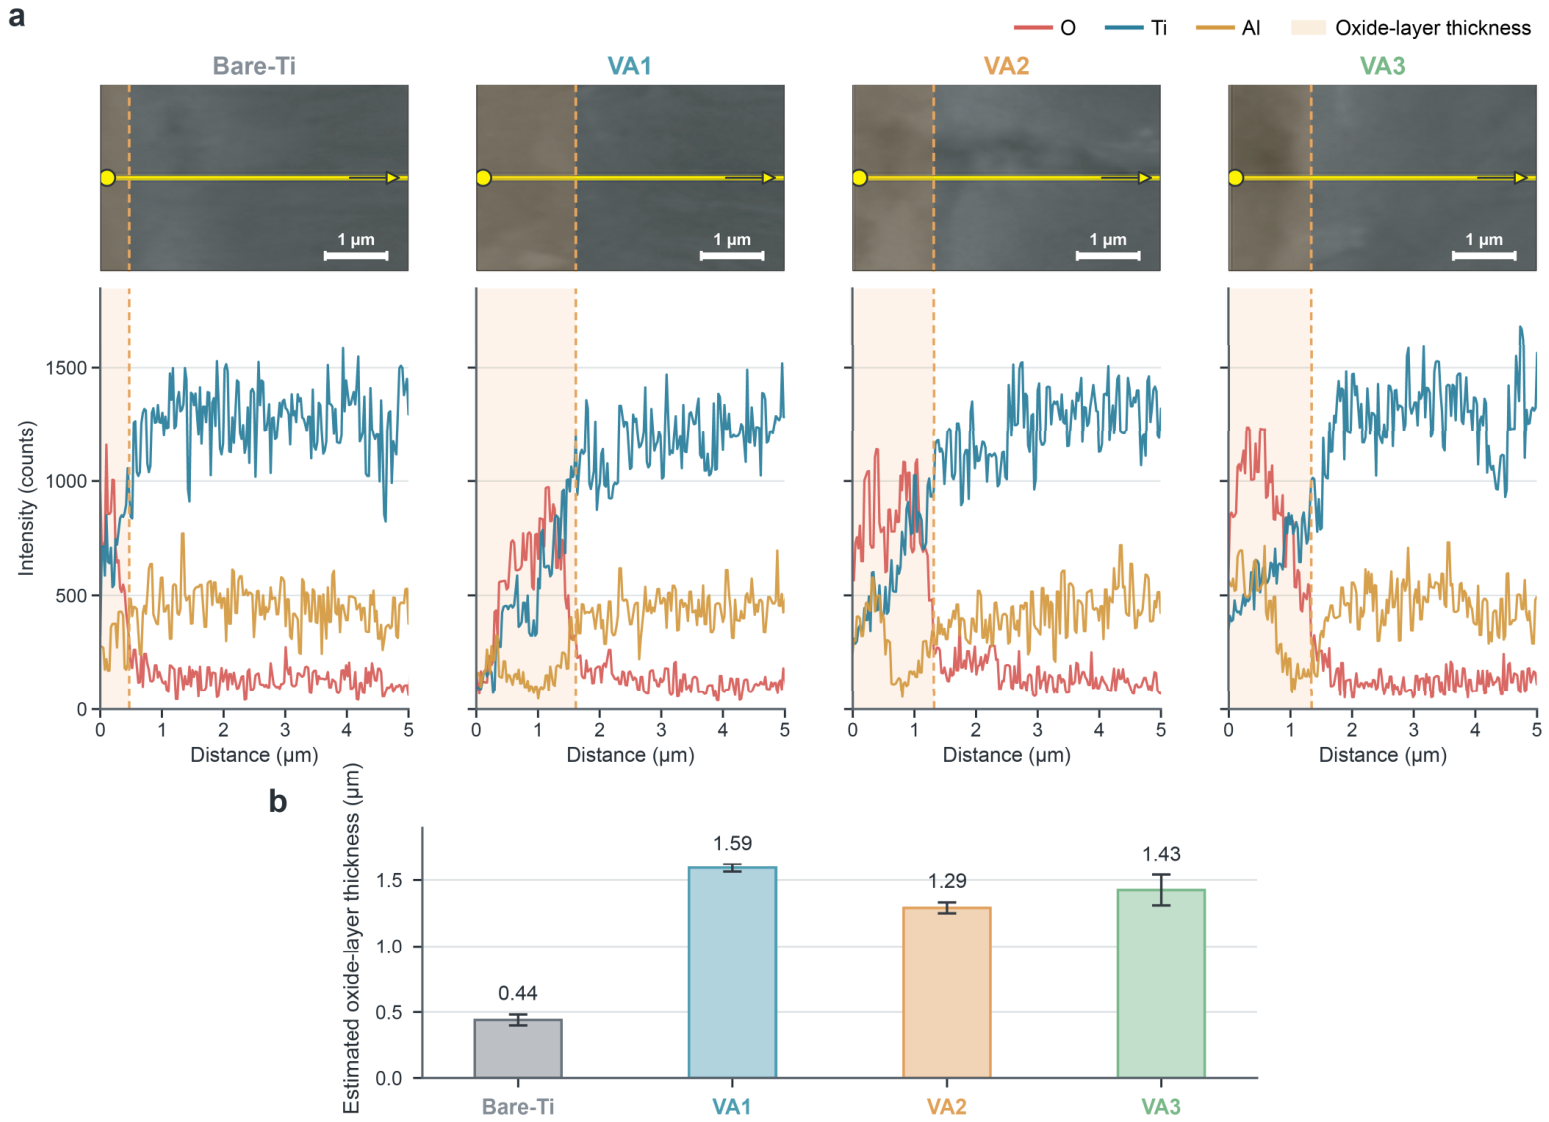
Cross-sectional Al, O and Ti line-scan profiles were compared for Bare-Ti and VA1–VA3 (Figure 7a). Scans proceeded from the outer surface towards the substrate. The near-surface Ti minimum defined the start of the measured interval, and the descending O profile near 300 counts defined its endpoint as the scan approached the substrate. The accompanying decrease in O and recovery in Ti identified the transition towards the substrate. The same criterion was applied to all four conditions. The value of approximately 300 counts is an operational threshold for these profiles, rather than a calibrated oxygen concentration. Electron interaction-volume effects can mix signals across the transition and affect the measured interval. The resulting distance is therefore reported as apparent oxide-layer thickness estimated by EDS. The interval was narrowest for Bare-Ti and was clearly wider for VA1, VA2, and VA3. The Al profiles were non-monotonic. From the outer surface inwards, Al counts initially increased and then decreased within the oxide layer. Counts rose again near the oxide-layer/substrate interface before returning to the substrate fluctuation range. This profile indicated a non-uniform Al distribution with local enrichment and depletion. The through-thickness variation was consistent with the localized Al enrichment observed by surface EDS.
Figure 7.
Cross-sectional EDS profiles and apparent oxide-layer thickness estimates after 24 h exposure in air at 650 °C. (a) Cross-sectional SEM images and O, Ti and Al line-scan profiles. Orange overlays show the intervals obtained from the corresponding EDS profiles using the criterion in Section 3.6. (b) Apparent oxide-layer thickness estimated by EDS, reported as mean ± SD (n = 2 line scans per condition).
Under this criterion, the apparent oxide-layer thickness estimated by EDS was 0.44 ± 0.04 μm for Bare-Ti and 1.59 ± 0.03, 1.29 ± 0.04 and 1.43 ± 0.12 μm for VA1, VA2 and VA3, respectively (mean ± SD, n = 2 line scans per condition; Figure 7b). The sampled intervals were wider in the coated specimens, with observed means ordered VA1 > VA3 > VA2 > Bare-Ti. These values describe local oxygen-profile intervals under the adopted criterion.
4. Discussion
4.1. Volcanic-Ash-Induced Surface Reactions of Ti65
After 24 h exposure at 650 °C, surface particle coverage was 1.77 ± 0.53% on Bare-Ti (Figure 3). Values increased to 9.33 ± 0.53%, 11.29 ± 2.49%, and 7.53 ± 1.57% on VA1, VA2, and VA3, respectively. Particle regions on all coated specimens were enriched in O, Al, Si, Na, and Ca and depleted in Ti. Mean Ti content in particle spots fell from 20.28 ± 5.58 at.% on Bare-Ti to 12.84 ± 7.40, 7.33 ± 4.71, and 9.98 ± 5.22 at.% for VA1, VA2, and VA3, respectively. By contrast, particle-free oxidized surface regions remained dominated by Ti and O, with O/Ti atomic ratios of 1.84–1.97 (Figure 5 and Table S1). Cross-sectional scans gave higher mean apparent oxide-layer thickness estimates for the coated specimens under the adopted EDS criterion. Together, these observations are consistent with possible ash–surface interactions involving ash-derived elements, but do not establish the individual reaction steps or their intensity.
Oxidation of deposit-free near-α titanium alloys can produce Si/Zr-enriched regions through elemental partitioning, transport near phase boundaries, and local oxide nucleation. Randomly distributed spherical particles were also reported on additively manufactured Ti6Al4V after 24 h oxidation in air at 600 °C [24]. For TA15, the initial surface condition affects oxide nucleation density, morphology, and layer thickness [25]. Accordingly, the sparse Ti–Si-rich particles on Bare-Ti may reflect the intrinsic oxidation behavior of Ti65 rather than ash-related reactions.
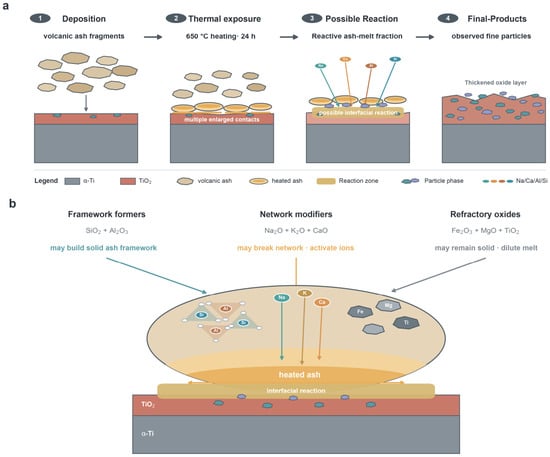
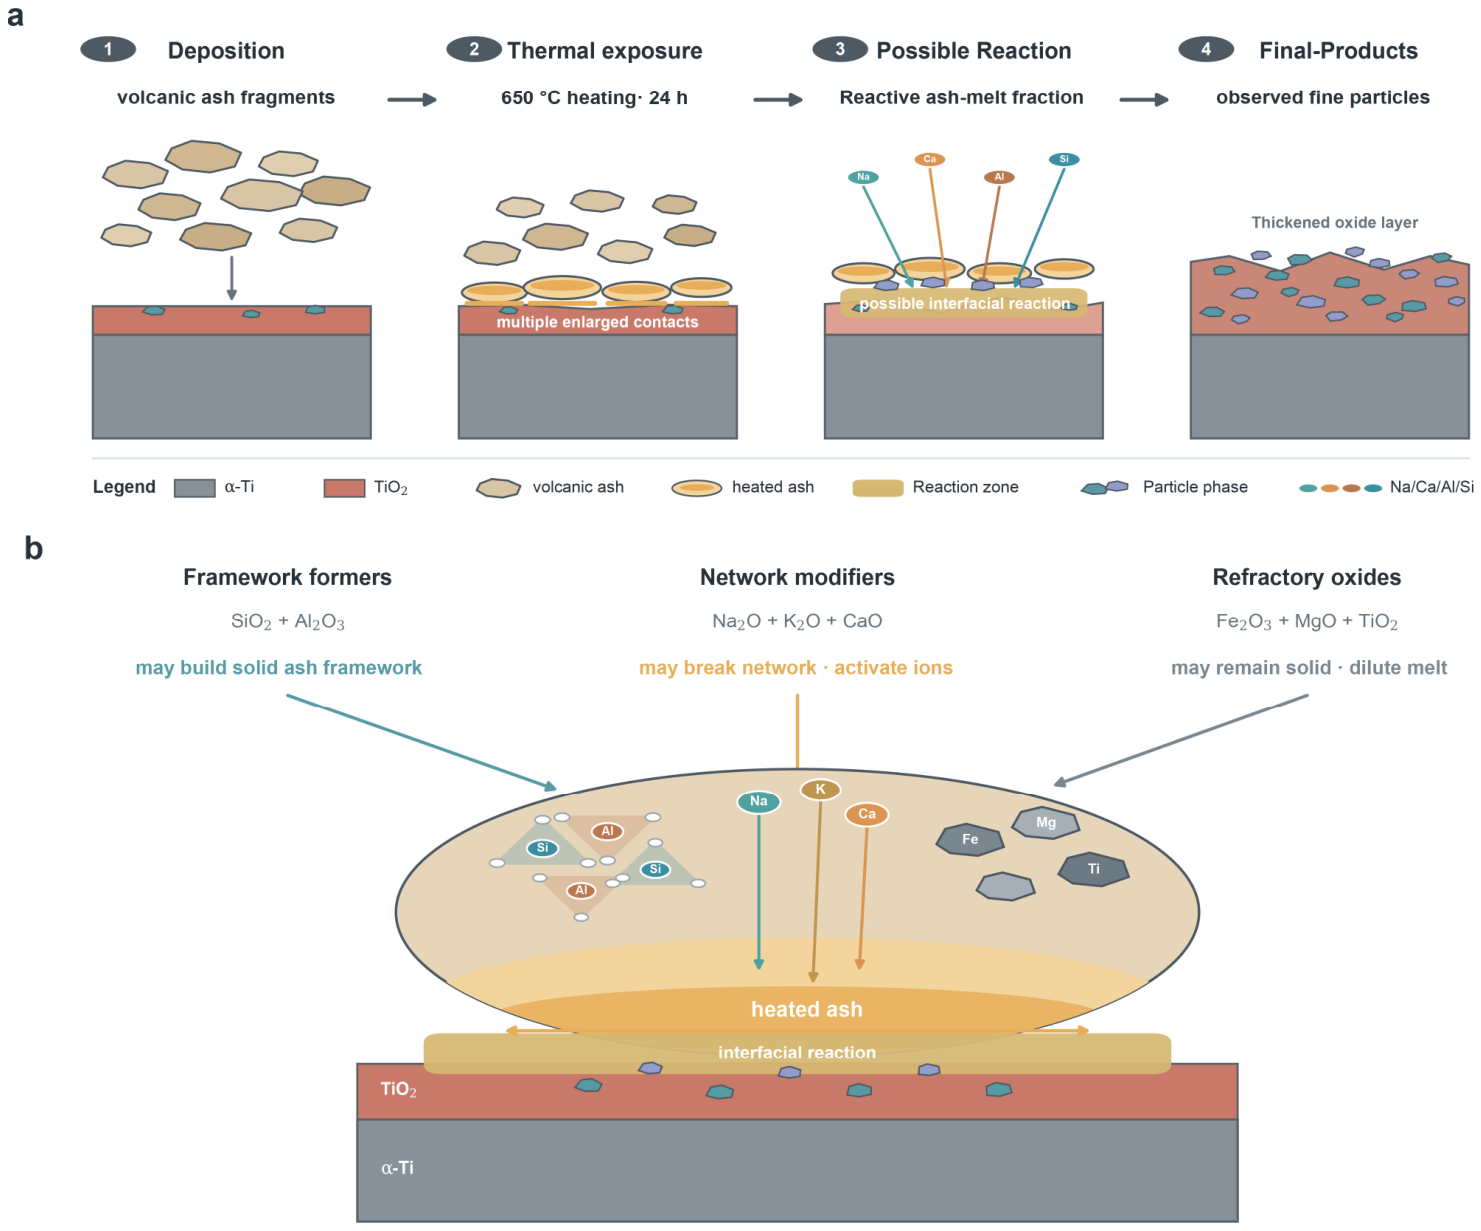
Volcanic ash was deposited on the alloy surface, with the three ashes having similar particle-size ranges (D50 = 26.23–31.50 μm). During the subsequent hold at 650 °C, adhesion may increase the number and area of local ash–alloy contacts, providing potential sites for interfacial reactions (Figure 8a). Natural volcanic ash commonly contains both glassy and crystalline phases. Its thermal response depends on glass composition, glass-to-crystal ratio, cooling history, and bulk SiO2 content [6,7,8,26,27,28]. Kueppers et al. reported structural relaxation of natural Eyjafjallajökull ash beginning near 600 °C, within a glass-transition range of approximately 600–800 °C [26]. If partial glass relaxation occurs at 650 °C, it could improve local ash–alloy contact. Partial melting of an ash fraction is another possible contribution to local contact changes at this temperature. However, a liquid phase at 650 °C has not been experimentally demonstrated. Ash-derived Na, Ca, Al, and Si provide additional reaction components. The lower relative Ti signals in particle regions and Si enrichment in particle-free oxidized surface regions indicate local compositional differences. Interfacial rearrangement and short-range transport are possible interpretations of these observations.
Figure 8.
Proposed interactions between natural volcanic ash and Ti65. (a) Schematic illustration of volcanic-ash deposition, possible adhesion-enhanced ash–alloy contact during thermal exposure, potential interfacial reactions, and observed surface particles after exposure. The proposed intermediate processes are hypothetical and have not been directly verified. (b) Possible roles of ash constituents in interfacial reactions.
The EDS point-analysis results allow the particles in the volcanic-ash-coated specimens to be classified into three categories. The first composition group comprised Ti–Si-rich particles similar to those on Bare-Ti. Bare-Ti showed predominantly α-Ti and TiO2-related XRD signals. Deposit-free titanium alloys can also develop oxide nodules, particle nuclei, and local alloy-element segregation during oxidation [24,25,29]. The Ti–Si-rich particles are therefore most plausibly intrinsic TiO2-dominated oxide particles with localized Si/Zr enrichment.
The second group comprised Ca–Al-rich particles, with Al/Si ratios of 0.63–1.05, Ca/Al ratios of 0.27–0.42, and O contents of 60.92–68.46 at.%. These ratios differed from ideal anorthite, CaAl2Si2O8, for which Al/Si = 1 and Ca/Al = 0.5. Nevertheless, they followed the same compositional trend. Additional XRD signals from the coated specimens also overlapped anorthite reference positions. The particles are therefore described as anorthite-like rather than assigned definitively to anorthite.
The third group comprised Na–Si-rich particles, with Al/Si ratios of 0.43–0.46, Na/Al ratios of 0.33–0.51, and O contents of 63.54–66.75 at.%. Ideal albite, NaAlSi3O8, jadeite, NaAlSi2O6, and nepheline, NaAlSiO4, have Al/Si ratios of 0.33, 0.50, and 1.00, respectively. These local Al/Si ratios differ from that of ideal nepheline, but EDS alone cannot establish the relative abundance of the proposed phases or distinguish albite from jadeite. Indeed, the uncorrected Al/Si ratio was closer to that of jadeite. Three observations nevertheless support an albite-like assignment. First, the additional XRD signals were consistent with albite reference positions. Second, the experiment was conducted in air at ambient pressure, whereas jadeite commonly forms at high pressure and temperature [30]. Third, the EDS interaction volume may have sampled both the small particles and substrate, thereby affecting the measured Al content. Taken together, these observations support describing the Na–Si-rich particles as albite-like. This assignment remains tentative because the crystal structures of individual particles were not directly verified by TEM electron diffraction.
The combined SEM, EDS, and XRD observations support the presence of ash-associated surface particles and tentative feldspar-related assignments. It is worth noting that homogeneous albite nucleation is reportedly slow at ambient pressure [31], and crystallization times reported for anorthite in related systems also substantially exceed the 24 h exposure used here [32,33]. Accordingly, the Ca–Al-rich and Na–Si-rich particles remain designated as anorthite-like and albite-like, respectively. Their origins may include changes within the deposits during exposure, and possible interfacial reactions. The present evidence does not resolve these contributions separately or establish a specific pathway for forming new feldspar crystals at the ash–alloy interface.
4.2. Possible Compositional Influences on the Observed Surface Responses
The bulk SiO2 contents of VA1, VA2, and VA3 were 47.95, 58.58, and 55.39 wt.%, respectively (Table 1). VA2 had the highest SiO2 content, while VA3 had the highest mean net mass change after cleaning (Figure 2c) and VA1 had the largest mean EDS-based oxide-layer thickness estimate (Figure 7b). The thickness estimates ranked inversely with bulk SiO2 content across the three ashes, whereas net mass change followed a different order. The apparent oxide-layer thickness estimated by EDS describes a local oxygen-rich interval under the adopted boundary criterion. The net mass change after exposure and cleaning describes the overall specimen mass balance, including oxidation of all exposed alloy surfaces, retained constituents of the starting ash, any ash-derived products formed during exposure, and material loss. Mean net mass changes after cleaning were 0.31 ± 0.17, 0.35 ± 0.03, 0.38 ± 0.17, and 0.52 ± 0.14 mg cm−2 for Bare-Ti, VA1, VA2, and VA3, respectively. The EDS and XRD results are consistent with feldspathic aluminosilicate material on the coated surfaces, with tentative albite-like and anorthite-like assignments. These tentative assignments do not quantify the relative abundance of the proposed phases. The similarity in local particle chemistry may be associated with the shared Ti65/TiO2 surface and the presence of Na, Ca, Al, and Si in all three ashes. Previous high-temperature ash/oxide-substrate studies found that different volcanic ashes can generate similar types of reaction products, while the amount, local composition, and extent of reaction remain dependent on the initial ash composition [16,34,35]. Similar local particle chemistry therefore does not establish a common formation pathway across the three coated groups.
Table 1 separates the bulk-composition differences into three groups for the following interpretation. SiO2 and Al2O3 are considered possible sources of the aluminosilicate-related surface chemistry. Na2O, CaO, and K2O may influence local silicate chemistry, while Fe2O3(tot.), MgO, and TiO2 may affect component distribution among glassy and crystalline constituents. The combined SiO2 + Al2O3 + Na2O + K2O + CaO contents were 76.11, 85.95, and 89.59 wt.% for VA1, VA2, and VA3, respectively. The corresponding Fe2O3(tot.) + MgO + TiO2 contents were 22.36, 11.55, and 9.09 wt.%. These measured proportions provide context for possible local chemical differences.
VA3 had the highest observed mean net mass change after cleaning. It contained 55.39 wt.% SiO2 and the highest Al2O3, CaO, and K2O contents, at 20.02, 8.24, and 2.20 wt.%, respectively. Its Na2O content was 3.74 wt.%, while Na2O + K2O + CaO totaled 14.18 wt.%. This composition may favor local Na–Al–Si- and Ca–Al–Si-rich environments. Differences in network-modifying constituents could also contribute to contact changes or local chemical rearrangement [7,8,26]. These are possible explanations for the surface response.
VA2 had the highest SiO2 content, at 58.58 wt.%, while its Al2O3 content was 16.71 wt.%. Its Na2O, K2O, and CaO contents were 3.07, 1.61, and 5.98 wt.%, respectively. Their combined content was 10.66 wt.%, the lowest of the three ashes. The Si-rich bulk composition is compatible with the Si-rich chemistry of the selected surface particles. Lower Al, Ca, and alkali-oxide contents may also be associated with differences in local silicate-network structure. Such differences could contribute to local chemical rearrangement [7,8,26]. VA2 could therefore form similar dominant particle types without producing the highest mean net mass change.
The lower mean net mass change in VA1 cannot be explained simply by Na2O or CaO deficiency. VA1 had the highest Na2O content, at 3.94 wt.%, and its CaO content, 7.96 wt.%, approached that of VA3. More distinctively, VA1 had the lowest SiO2 and Al2O3 contents, at 47.95 and 14.21 wt.%, respectively. It also had the highest Fe2O3(tot.), MgO, and TiO2 contents, at 13.32, 6.29, and 2.75 wt.%, respectively. The larger Fe–Mg–Ti-related fraction may dilute the Si–Al available for albite-like and anorthite-like frameworks. Retention of these components in other crystalline or glassy regions may further reduce Na/Ca–Al–Si rearrangement [7,8,16,34].
The EDS and XRD results provide context for this possible composition-based interpretation. Similar additional diffraction features and local particle-composition groups were observed across the coated specimens. In contrast, particle coverage, net mass change after cleaning, and local elemental enrichment varied among the coated groups. Ash composition therefore appears to affect particle formation, spatial coverage, and interfacial reaction extent. VA3 combined lower particle coverage, 7.53 ± 1.57%, with the highest mean net mass change after cleaning. Two-dimensional coverage alone therefore cannot represent reaction volume, oxygen uptake, or mass retained after cleaning.
Taken together, the compositional associations suggest a possible multicomponent interpretation (Figure 8b). SiO2 and Al2O3 may contribute to the feldspathic framework; Na2O, CaO, and K2O may influence local network polymerization, ion transport, and the availability of Na/Ca endmembers; Fe-, Mg-, and Ti-bearing constituents may influence component partitioning. This framework offers a possible interpretation of similar local particle chemistry alongside different observed mean net mass changes after cleaning (Figure 8b). As an extension of this chemical interpretation, mineralogical composition and the relative proportions of glassy and crystalline phases may also affect the thermal behavior and contact response of natural ash [6,7,8,26,27,28]. Their specific contributions are outside the scope of the present study and are not used to assign a separate mechanism to each ash.
Particles with tentative feldspar-related assignments may increase chemical and morphological heterogeneity at the TiO2-dominated surface. Particle/oxide-layer interfaces could consequently become sites of localized mass transfer or stress concentration. If the particles form hard protrusions or weakly bonded regions, later ash erosion could promote pullout, cracking, or exposure of fresh alloy. These possibilities remain untested because the present study did not assess local mechanical properties or erosion damage. Future high-temperature erosion experiments should test these hypotheses under coupled volcanic-ash erosion–corrosion conditions.
5. Conclusions
Three natural ashes with comparable particle-size ranges but different bulk compositions were deposited on Ti65 alloy and exposed in air at 650 °C for 24 h. The results support the following conclusions:
- (1)
- Ash-coated specimens showed higher mean post-cleaning net mass changes than Bare-Ti. Mean values were 0.31 ± 0.17, 0.35 ± 0.03, 0.38 ± 0.17, and 0.52 ± 0.14 mg cm−2 for Bare-Ti, VA1, VA2, and VA3, respectively. The ash-coated specimens also had higher observed mean surface-particle coverage and apparent oxide-layer thickness estimated by EDS than Bare-Ti after thermal exposure. In the same group order, surface-particle coverage was 1.77 ± 0.53%, 9.33 ± 0.53%, 11.29 ± 2.49%, and 7.53 ± 1.57%. The mean area-equivalent particle diameters were 0.59 ± 0.17, 0.85 ± 0.40, 0.58 ± 0.30, and 0.63 ± 0.27 μm. The apparent oxide-layer thicknesses estimated by EDS were 0.44 ± 0.04, 1.59 ± 0.03, 1.29 ± 0.04 and 1.43 ± 0.12 μm, respectively.
- (2)
- Bare-Ti showed α-Ti- and TiO2-related XRD signals, with sparse Si/Zr-enriched particles. Ash-coated surfaces exhibited particle regions enriched in O, Al, Si, Na, and Ca, which could be broadly classified as Ti–Si-rich, Ca–Al-rich, and Na–Si-rich types. The additional XRD features, considered together with these compositions, are consistent with tentative albite-like (NaAlSi3O8) and anorthite-like (CaAl2Si2O8) assignments.
- (3)
- The ashes showed similar particle-composition groups but different observed mean mass changes, surface coverage, and local elemental enrichment. These differences may be associated with their chemical compositions. VA3 combined higher Al2O3, CaO, and K2O contents with adequate SiO2 and Na2O, which may favor local Na–Al–Si and Ca–Al–Si chemistry. VA2 was SiO2-rich but had the lowest combined Na2O, K2O, and CaO content; greater polymerization of local Si-rich regions is a possible interpretation. VA1 had the lowest SiO2 and Al2O3 contents and the highest Fe2O3(tot.), MgO, and TiO2 contents. Its larger Fe–Mg–Ti-related fraction may affect component partitioning and local Na/Ca–Al–Si availability. These compositional associations may help interpret the observed surface responses.
Supplementary Materials
The following supporting information can be downloaded at https://www.mdpi.com/article/10.3390/met16111278/s1. Figure S1: Complete surface EDS elemental maps of Bare-Ti and volcanic-ash-coated specimens. (a–d) SEM images of Bare-Ti, VA1, VA2, and VA3 after 24 h exposure in air at 650 °C, together with maps of Ti, Al, Sn, Zr, Mo, Si, Nb, Ta, W, O, S, Cl, Na, K, and Ca; Figure S2: Locations of EDS point analyses in particle-free oxidized surface regions and visible surface particles after 24 h exposure in air at 650 °C. (a) Bare-Ti; (b,c) VA1; (d,e) VA2; (f,g) VA3. Point identifiers correspond to those in Table S1; Table S1: EDS point compositions of selected particle-free oxidized surface regions and visible surface particles after thermal exposure (at.%). Point identifiers correspond to those in Figure S2.
Author Contributions
D.Z.: Conceptualization, investigation, writing—original draft, visualization, formal analysis, data curation. Y.W. (Yunfei Wu) and Y.W. (Yuandi Wu): Investigation, data curation. Z.Z. and J.F.: Investigation, methodology. D.B.D.: Data curation, writing—review and editing. W.S.: Conceptualization, data curation, writing—review and editing, supervision, funding acquisition. All authors have read and agreed to the published version of the manuscript.
Funding
This research was funded by [Postdoctoral Research Funding of Hangzhou International Innovation Institute of Beihang University] grant number [No. 2025BKZ065], funded by [Key R&D Program of Zhejiang] grant number [2024SSYS0080], funded by [National Natural Science Foundation of China] grant number [52571061], funded by [Zhejiang Provincial Natural Science Foundation of China] grant number [LZ23E010003], funded by [Shaanxi Provincial Natural Science Foundation Funds Research Projects] grant number [No. 2025JC-YBMS-494].
Data Availability Statement
The original contributions presented in this study are included in the article/Supplementary Material. Further inquiries can be directed to the corresponding author.
Conflicts of Interest
Author Zhixin Zhang was employed by the company Baoti Group Co., Ltd., The remaining authors declare that the research was conducted in the absence of any commercial or financial relationships that could be construed as a potential conflict of interest.
References
- Reichardt, U.; Ulfarsson, G.F.; Pétursdóttir, G. Volcanic ash and aviation: Recommendations to improve preparedness for extreme events. Transp. Res. Part A Policy Pract. 2018, 113, 101–113. [Google Scholar] [CrossRef] [Scilit]
- Mastin, L.; Pavolonis, M.; Engwell, S.; Clarkson, R.; Witham, C.; Brock, G.; Lisk, I.; Guffanti, M.; Tupper, A.; Schneider, D.; et al. Progress in protecting air travel from volcanic ash clouds. Bull. Volcanol. 2022, 84, 9. [Google Scholar] [CrossRef] [Scilit]
- Dunn, M.G. Operation of gas turbine engines in an environment contaminated with volcanic ash. J. Turbomach. 2012, 134, 051001. [Google Scholar] [CrossRef] [Scilit]
- Davison, C.R.; Rutke, T.A. Assessment and characterization of volcanic ash threat to gas turbine engine performance. J. Eng. Gas Turbines Power 2014, 136, 081201. [Google Scholar] [CrossRef] [Scilit]
- Jiang, L.-Y.; Han, Y.; Patnaik, P. Characteristics of volcanic ash in a gas turbine combustor and nozzle guide vanes. J. Eng. Gas Turbines Power 2018, 140, 071502. [Google Scholar] [CrossRef] [Scilit]
- Taltavull, C.; Dean, J.; Clyne, T.W. Adhesion of volcanic ash particles under controlled conditions and implications for their deposition in gas turbines. Adv. Eng. Mater. 2016, 18, 803–813. [Google Scholar] [CrossRef] [Scilit]
- Dean, J.; Taltavull, C.; Clyne, T. Influence of the composition and viscosity of volcanic ashes on their adhesion within gas turbine aeroengines. Acta Mater. 2016, 109, 8–16. [Google Scholar] [CrossRef] [Scilit]
- Song, W.; Lavallée, Y.; Hess, K.-U.; Kueppers, U.; Cimarelli, C.; Dingwell, D.B. Volcanic ash melting under conditions relevant to ash turbine interactions. Nat. Commun. 2016, 7, 10795. [Google Scholar] [CrossRef] [Scilit] [PubMed]
- Giehl, C.; Brooker, R.A.; Marxer, H.; Nowak, M. An experimental simulation of volcanic ash deposition in gas turbines and implications for jet engine safety. Chem. Geol. 2017, 461, 160–170. [Google Scholar] [CrossRef] [Scilit]
- Krämer, S.; Yang, J.; Levi, C.G.; Johnson, C.A. Thermochemical interaction of thermal barrier coatings with molten CaO–MgO–Al2O3–SiO2 (CMAS) deposits. J. AM. Ceram. Soc. 2006, 89, 3167–3175. [Google Scholar] [CrossRef] [Scilit]
- Aygun, A.; Vasiliev, A.L.; Padture, N.P.; Ma, X. Novel thermal barrier coatings that are resistant to high-temperature attack by glassy deposits. Acta Mater. 2007, 55, 6734–6745. [Google Scholar] [CrossRef] [Scilit]
- Krämer, S.; Faulhaber, S.; Chambers, M.; Clarke, D.; Levi, C.; Hutchinson, J.; Evans, A. Mechanisms of cracking and delamination within thick thermal barrier systems in aero-engines subject to calcium-magnesium-alumino-silicate (CMAS) penetration. Mater. Sci. Eng. A 2008, 490, 26–35. [Google Scholar] [CrossRef] [Scilit]
- Drexler, J.M.; Shinoda, K.; Ortiz, A.L.; Li, D.; Vasiliev, A.L.; Gledhill, A.D.; Sampath, S.; Padture, N.P. Air-plasma-sprayed thermal barrier coatings that are resistant to high-temperature attack by glassy deposits. Acta Mater. 2010, 58, 6835–6844. [Google Scholar] [CrossRef] [Scilit]
- Schulz, U.; Braue, W. Degradation of La2Zr2O7 and other novel EB-PVD thermal barrier coatings by CMAS (CaO–MgO–Al2O3–SiO2) and volcanic ash deposits. Surf. Coat. Technol. 2013, 235, 165–173. [Google Scholar] [CrossRef] [Scilit]
- Naraparaju, R.; Schulz, U.; Mechnich, P.; Döbber, P.; Seidel, F. Degradation study of 7 wt.% yttria stabilised zirconia (7YSZ) thermal barrier coatings on aero-engine combustion chamber parts due to infiltration by different CaO–MgO–Al2O3–SiO2 variants. Surf. Coat. Technol. 2014, 260, 73–81. [Google Scholar] [CrossRef] [Scilit]
- Naraparaju, R.; Chavez, J.J.G.; Schulz, U.; Ramana, C. Interaction and infiltration behavior of Eyjafjallajökull, Sakurajima volcanic ashes and a synthetic CMAS containing FeO with/in EB-PVD ZrO2–65 wt.% Y2O3 coating at high temperature. Acta Mater. 2017, 136, 164–180. [Google Scholar] [CrossRef] [Scilit]
- Sun, J.; Lu, H.; Wang, Z.; Luo, K.; Lu, J. High-temperature oxidation behavior of Ti65 titanium alloy fabricated by laser direct energy deposition. Corros. Sci. 2024, 229, 111866. [Google Scholar] [CrossRef] [Scilit]
- Behera, A.; Nag, S.; Mahdak, K.; Mohseni, H.; Tiley, J.; Banerjee, R. Influence of oxygen ingress on fine scale precipitation of α-Ti during oxidation of Beta21S β-Ti alloy. J. Mater. Sci. 2013, 48, 6700–6706. [Google Scholar] [CrossRef] [Scilit]
- Put, A.V.; Dupressoire, C.; Thouron, C.; Emile, P.; Peraldi, R.; Dod, B.; Monceau, D. High-temperature oxidation behavior of Ti6242S Ti-based alloy. Oxid. Met. 2021, 96, 373–384. [Google Scholar] [CrossRef] [Scilit]
- Vincent, B.; Optasanu, V.; Herbst, F.; Chevalier, S.; Popa, I.; Montesin, T.; Lavisse, L. Comparison between the oxidation behaviors of Ti6242S, Ti6246, TiXT alloys, and pure titanium. Oxid. Met. 2021, 96, 283–294. [Google Scholar] [CrossRef] [Scilit]
- Gautier, K.; Epifano, E.; Gheno, T.; Connétable, D.; Monceau, D. Effects of Al and refractory alloying elements (W, Ta and Hf) on oxidation kinetics, oxygen dissolution and diffusion in titanium alloys. Corros. Sci. 2024, 237, 112330. [Google Scholar] [CrossRef] [Scilit]
- Bardel, J.; Edon, V.; Younes, T.A.; Lefez, B.; André, V. Influence of the CMAS on the aging of titanium alloy β21s. Surf. Coat. Technol. 2013, 220, 36–39. [Google Scholar] [CrossRef] [Scilit]
- Whelley, P.L.; Newhall, C.G.; Bradley, K.E. The frequency of explosive volcanic eruptions in Southeast Asia. Bull. Volcanol. 2015, 77, 1. [Google Scholar] [CrossRef] [Scilit] [PubMed]
- Wang, Q.; Song, P.; Niu, W.; Li, N.; Hu, N. High temperature oxidation behavior of additive manufactured Ti6Al4V alloy with the addition of yttrium oxide nanoparticles. Materials 2024, 17, 2544. [Google Scholar] [CrossRef] [Scilit] [PubMed]
- Li, Z.-C.; Xu, J.; Zhang, D.-H.; Xu, Z.-H.; Yang, S.-R.; Shan, D.-B.; Guo, B. High-temperature oxidation behaviors of TA15 titanium alloy after mechanical grinding and laser cleaning. Coatings 2021, 11, 1090. [Google Scholar] [CrossRef] [Scilit]
- Kueppers, U.; Cimarelli, C.; Hess, K.-U.; Taddeucci, J.; Wadsworth, F.B.; Dingwell, D.B. The thermal stability of Eyjafjallajökull ash versus turbine ingestion test sands. J. Appl. Volcanol. 2014, 3, 4. [Google Scholar] [CrossRef] [Scilit]
- Wadsworth, F.B.; Vasseur, J.; von Aulock, F.W.; Hess, K.; Scheu, B.; Lavallée, Y.; Dingwell, D.B. Nonisothermal viscous sintering of volcanic ash. J. Geophys. Res. Solid Earth 2014, 119, 8792–8804. [Google Scholar] [CrossRef] [Scilit]
- Dingwell, D.B. Experimental access to volcanic eruptions. Ann. Geophys. 2024, 67, V441. [Google Scholar] [CrossRef] [Scilit]
- Kuczyńska-Zemła, D.; de Lucas, M.M.; Lavisse, L.; Zemła, M.; Herbst, F.; Pacorel, V.; Kwaśniak, P. Microstructural influence on high-temperature oxidation of near-α titanium alloys: Timetal 834 and 6242S. Corros. Sci. 2025, 255, 113081. [Google Scholar] [CrossRef] [Scilit]
- Goto, A.; Kunugiza, K.; Miyajima, H. Phase relation in the NaAlSiO4–SiO2–H2O system for the hydrothermal precipitation of jadeite, albite, natrolite, and analcime in jadeitite of the Itoigawa–Omi area, Japan. J. Mineral. Petrol. Sci. 2017, 112, 271–280. [Google Scholar] [CrossRef] [Scilit]
- Zanotto, E.D.; Cassar, D.R. The microscopic origin of the extreme glass-forming ability of Albite and B2O3. Sci. Rep. 2017, 7, 43022. [Google Scholar] [CrossRef] [Scilit] [PubMed]
- Bhatty, M.S.Y.; Gard, J.A.; Glasser, F.P. Crystallization of anorthite from CaO–Al2O3–SiO2 glasses. Mineral. Mag. 1970, 37, 780–789. [Google Scholar] [CrossRef] [Scilit]
- Allu, A.R.; Balaji, S.; Tulyaganov, D.U.; Mather, G.C.; Margit, F.; Pascual, M.J.; Siegel, R.; Milius, W.; Senker, J.; Agarkov, D.A.; et al. Understanding the formation of CaAl2Si2O8 in melilite-based glass-ceramics: Combined diffraction and spectroscopic studies. ACS Omega 2017, 2, 6233–6243. [Google Scholar] [CrossRef] [Scilit] [PubMed]
- Rivera-Gil, M.A.; Gomez-Chavez, J.J.; Ramana, C.; Naraparaju, R.; Schulz, U.; Muñoz-Saldaña, J. High temperature interaction of volcanic ashes with 7YSZ TBC’s produced by APS: Infiltration behavior and phase stability. Surf. Coat. Technol. 2019, 378, 124915. [Google Scholar] [CrossRef] [Scilit]
- Hornby, A.; Gazel, E.; Bush, C.; Dayton, K.; Mahowald, N. Phases in fine volcanic ash. Sci. Rep. 2023, 13, 15728. [Google Scholar] [CrossRef] [Scilit] [PubMed]

Disclaimer/Publisher’s Note: The statements, opinions and data contained in all publications are solely those of the individual author(s) and contributor(s) and not of MDPI and/or the editor(s). MDPI and/or the editor(s) disclaim responsibility for any injury to people or property resulting from any ideas, methods, instructions or products referred to in the content. |
© 2026 by the authors. Licensee MDPI, Basel, Switzerland. This article is an open access article distributed under the terms and conditions of the Creative Commons Attribution (CC BY) license.