


Abstract
Studies of artificial intelligence report different employment outcomes for different groups of workers. We use public Quarterly Workforce Indicators to examine employment at ages 22–24 relative to ages 25–54 in five professional-service industries across 47 states and the District of Columbia from 2006 to 2025. Between 2022Q4 and 2025Q4, young employment fell by 27.0% in computer services and by 19.4% in consulting, while total employment changed by −4.2% and +1.3%. Young employment grew in law offices and engineering and fell in accounting. The mean state young-to-older ratio departed below its historical path by 20.6% in computer services and by 18.4% in consulting, with unadjusted historical bootstrap p-values of 0.030 and 0.033. Both ratio declines exceed every one of the 56 earlier pre-ChatGPT three-year declines in this fixed record beginning in 2006. Differences across the five-industry departures are also unusual (p = 0.0049). The analysis does not establish how much AI caused these changes. The findings support monitoring employment by age and evaluating paid training responses as AI use expands.
1. Introduction
Whether generative artificial intelligence (AI) is already reducing employment remains disputed. Studies examine different workers, outcomes, and measures of AI use. The Stanford Digital Economy Lab’s payroll study finds that employment at ages 22–25 in occupations whose tasks have high potential for AI assistance or automation is 19% below the level implied by growth among similarly aged workers in less exposed occupations, using data up to June 2026. The authors attribute most of the difference to reduced hiring. They also find greater declines where AI is used to automate tasks previously performed by workers. The Stanford study also finds no widespread employment displacement across the economy, and Anthropic finds no detectable increase in unemployment associated with high observed AI exposure [1,2]. Danish adoption research finds no average change in earnings or recorded hours, while U.S. survey research finds that changes in the occupational mix began before ChatGPT 3.5 [3,4]. These findings can coexist: a loss concentrated among young workers can be too small to produce a clear change in an industry’s total employment.
The Anthropic report by Massenkoff and McCrory [2] illustrates why the outcome matters. It finds no detectable increase in unemployment associated with high observed AI exposure but tentative evidence of fewer new job starts among workers aged 22–25. A new job start means taking a job that the person did not hold in the previous month; it need not be a first job. Fewer people starting jobs does not necessarily mean more people becoming unemployed. For example, a young person who cannot obtain a professional job can keep an existing job or take work in another field. That person is employed, although access to the intended career has become more difficult. Anthropic compares occupations grouped by AI exposure. We instead count employment by age within individual industries to ask where paid work has increased or decreased at ages when many people begin a professional career.
AI can change who does the work before it changes the total number of jobs. Acemoglu and Restrepo [5] explain that automation can remove some tasks while increasing demand for work that remains. Autor and Thompson [6] show why the result depends on which parts of a job are automated. If AI performs preparation previously assigned to junior staff, experienced workers can complete client work with less junior assistance. If service growth does not offset that reduction, employers can need fewer junior workers. AI can also help beginners perform work that previously required more experience. A recent experiment with information technology (IT) apprentices provides evidence of that expansion in the tasks that they can perform [7]. If better or cheaper services attract enough additional demand, employers can hire more young workers. We therefore examine both employment losses and gains.
We investigate how young, older, and total employment changed in five professional-service industries. We then compare each industry’s young-to-older ratio change with its own history and examine whether the recent differences across industries are unusual. The historical comparison distinguishes a recurring age pattern from a change not previously observed in the available record. An unusual change during the spread of AI gives a stronger reason to investigate AI as a contributing explanation. It does not distinguish AI from every other new or changing influence. Monetary tightening, pandemic staffing adjustments, and remote work are also potential explanations for the employment changes.
The Quarterly Workforce Indicators (QWI) are well suited to these questions because they report employment by detailed industry, state, age group, and quarter over a long period. Their administrative foundation permits analysis of a narrow age group in many locations without relying on a small national survey subsample. We focus on ages 22–24, when many people begin employment after undergraduate education, and compare them with ages 25–54. The data identify jobs held in these age groups. They do not identify graduates, first jobs, or junior positions. We use age to examine employment near the beginning of working life while keeping those distinctions explicit.
We selected professional services and the five industries before examining their employment results. Professional services ranks fourth among 19 sectors on our principal measure of theoretical AI exposure, behind finance and insurance, management of companies, and information. The measure estimates the potential for language models to shorten occupational tasks. It measures technical potential and contains no information about employers’ adoption of AI [8]. Professional services offers a clearer connection between the service being sold and the professional work needed to provide it. The three higher-ranked sectors are less suitable for interpreting age and career progression in this design. Finance and insurance combines banking, insurance sales, and investment activities; client business and commission or performance pay complicate the relationship between experience and compensation. Management of companies groups headquarters and holding companies with many different internal functions. Information combines publishing, telecommunications, and film, which have different products and career structures. In the core work of professional services, junior preparation and supervised practice provide a more direct route toward greater responsibility and pay, although several occupations and entry routes remain within each industry. We study computer systems design, management consulting, accounting, law offices, and engineering because they are the five largest five-digit industries within professional services, formally professional, scientific, and technical services, under the North American Industry Classification System (NAICS 541). Subsequent size checks place their combined coverage at about 69% of employment aged 22–54; the sixth-largest industry is appreciably smaller [9]. These choices favor interpretable services and sufficient published employment observations. Appendix A reports the exposure calculation and size checks.
Our first contribution is to describe changes in employment by age within these five industries, using job counts as well as young-to-older ratios. The second is to determine whether each ratio change and the final comparison of differences across industries are unusual in the available history. The state evidence shows whether the changes are widespread, while separate age bands show where losses or gains are concentrated. The comparisons distinguish an absolute loss of young jobs from a lower young-worker share produced only by older employment growth. They complement occupation- and firm-based research by identifying the changes in particular professional services that a study of AI adoption and work assignments must explain.
The policy concern is whether young people can obtain paid professional work and the experience needed to progress. A person who takes a job outside a preferred profession can remain employed while losing access to that profession’s training and career opportunities. Research on graduating during recessions shows that disadvantages at the start of a career can persist, with larger losses for less advantaged graduates [10]. QWI do not measure those later consequences. The employment changes nevertheless give a reason to monitor employment by age and to test training responses before waiting for a rise in total unemployment.
2. Literature Review
2.1. Potential AI Exposure and Observed Use
Eloundou et al. [8] measure whether language models could reduce the time needed for occupational tasks by at least half without lowering quality. Our principal score uses their human ratings: tasks receive full weight when a language model alone could achieve that reduction, half weight when additional software is needed, and zero otherwise. Occupational employment weights produce an industry score; the sector ranking averages the four-digit industry scores. The score describes technical potential. Employment also depends on whether firms adopt a tool, whether its output is reliable enough for the task, and whether demand expands when costs fall.
Massenkoff and McCrory [2] combine technical potential with observed work-related use of Claude. Their measure gives more weight to automated use and to application programming interface traffic, which occurs when software calls an AI model within a workflow. They also weight tasks by estimated time spent on them. The result describes observed use more closely than a capability score alone, but it is not a representative employer adoption rate or a count of jobs replaced. One provider’s traffic also cannot describe every tool used in the five industries.
Anthropic reports observed coverage of 33% for computer and mathematical occupations, compared with theoretical coverage of 94%, and identifies computer programmers as its most exposed occupation. Legal occupations also have high theoretical coverage but lower observed coverage. These differences justify examining services separately, because similar technical potential need not produce similar deployment. The usage snapshots are from August and November 2025, however, and occupational categories do not correspond directly to our five-digit industries. We use the report to guide interpretation, not as a measure of AI use among the QWI employers [2].
Deployment can differ even when technical capabilities are similar. Brynjolfsson, Rock, and Syverson [11] explain that new general-purpose technologies require complementary changes in processes, skills, and business organization before their gains are fully realized. Adoption measures can also change with the survey question. In November 2025, Census broadened its business AI question from use in producing goods or services to use in any business function and began a new series because the wording produced a level shift [12]. Later adoption percentages therefore cannot be treated as a continuous measure of AI treatment over our 2022–2025 window.
2.2. Employment Changes and Their Causes
Anthropic’s employment analysis uses the Current Population Survey to compare occupations with higher and lower observed exposure. Its unemployment estimate is close to zero, while its analysis of new job starts among workers aged 22–25 reports an approximately 14% relative reduction from the 2022 baseline. The study therefore finds a tentative change in starting jobs without detecting a corresponding increase in unemployment. Survey errors in reported job transitions add uncertainty [2,13]. Our QWI analysis measures how many jobs are held by each age group in each industry. It does not follow individual job searches or measure unemployment.
The Stanford payroll findings directly guide our attention to age structure and to the difference between replacing tasks and assisting workers. Brynjolfsson, Chandar, and Chen [1] use records from ADP, a payroll provider, to compare occupations and age groups. Their August 2026 revision reports the 19% relative gap at ages 22–25 up to June 2026. Losses are greater in occupations relying on codified knowledge, meaning knowledge recorded in text or formal procedures; experienced-worker gains are greater in occupations requiring knowledge learned through practice. The authors examine changes affecting entire firms, interest-rate sensitivity, remote work, alternative exposure measures, and sample changes. They also report earlier differences in trends, smaller gaps after education controls, and differences from national survey benchmarks. The results describe employment changes but do not establish how much is caused by AI. Our industry analysis adds longer histories for individual services and state comparisons while measuring neither occupational tasks nor within-firm hiring.
Tucker [14] studies QWI hiring and employment at ages 22–24 across industry–state cells with different AI exposure. Employment in the most exposed group falls by 12% relative to the comparison group over ten quarters after ChatGPT, with reduced hiring accounting for most of the decline. His analysis also finds some earlier changes around the pandemic. This is a close comparison for our data and age band. Our analysis follows individual professional services over twenty years and asks whether their recent changes in age structure differ from their own histories.
Humlum and Vestergaard [3] link surveys of chatbot adoption to administrative records in Denmark. They find changes in work assignments without detectable average changes in earnings or recorded hours. They also reproduce early-career employment declines in exposed occupations, but their workplace comparisons do not attribute those declines to adopting firms. Their evidence shows why a decline in exposed work is insufficient to identify AI as its cause. Differences between Denmark and the United States leave the causes of our industry changes open.
Chandar and Klein Teeselink [15] infer AI adoption from job advertisements across 41 countries. Their study compares employment around adoption and uses an instrument, a source of adoption variation intended to be independent of other employment influences. It finds a lower junior employment share at foreign affiliates of adopting companies, driven mainly by senior employment growth. A share can fall without junior employment falling. Our separate job counts and ratios distinguish that outcome from an absolute loss of young employment. Their adoption-based design and our historical comparison answer different questions, and junior status in their data is not the same measure as age in QWI.
Some studies estimate effects in narrower settings with a specified comparison. Hui, Reshef, and Zhou [16] compare freelance occupations differently affected by generative tools around their releases and find reduced employment and earnings in more affected categories. Their design relies on assumptions about the comparison between those categories. It provides evidence that our industry histories alone cannot supply.
Hampole et al. [17] examine AI exposure to occupational tasks and employment at firms over 2010–2023. They find lower labor demand for exposed tasks, while expansion at adopting firms offsets some losses. Concentrating exposure in a few tasks can also allow workers to spend more time on other work. Their adoption analysis uses historical university hiring networks as a source of variation and depends on the assumptions supporting that instrument. These findings help explain why task replacement and productivity gains can produce different employment outcomes.
2.3. Productivity and the Organization of Professional Work
Productivity measures how much useful work a person completes in a given amount of time; employment measures how many jobs employers provide. Brynjolfsson, Li, and Raymond [18] find that an AI assistant increased customer-support issues resolved per hour by 15%, with greater gains among less experienced workers. Faster work can reduce the staff needed for an unchanged volume of service. It can also make better service or lower prices possible and bring in enough additional demand to increase staffing. A productivity gain therefore does not determine an employment change by itself.
Dell’Acqua et al. [19] find that AI improved performance on consulting tasks within the system’s capabilities but reduced correctness on a task outside those capabilities. The experiment measures task performance. Its design provides no estimate of hiring. It shows why the tasks being assigned and the need to check AI output matter when interpreting employment in consulting.
Brosch et al. [7] directly test whether AI expands the tasks that beginners can perform. They randomly assign AI access to 673 final-year IT apprentices at twelve German vocational schools and compare their performance with a no-internet control group. AI raises scores by 26–31 percentage points on tasks beyond the apprenticeship curriculum, without reducing immediate comprehension. This supports a mechanism through which young workers can take on more demanding work. The experiment does not estimate employer hiring or long-term learning, so it cannot determine whether the performance gains create more young jobs.
Task-based theories predict different outcomes depending on what is automated and what people do afterward. Acemoglu and Restrepo [5] distinguish replacement in existing tasks from new tasks and expanded production. Autor and Thompson [6] explain how automating one part of a job changes the expertise needed for the remaining work. For our study, the question is whether AI reduces junior preparation, lets beginners do more demanding work, or expands the service enough to support more jobs.
Gans and Goldfarb [20] examine production in which the quality of the final output depends on the quality of several tasks performed together. Automating one task can give workers more time to improve tasks that still require their attention. Partial automation can therefore increase the value of the remaining work. Their model provides another reason to examine how tasks fit together within a service before interpreting a measure of average AI exposure as a prediction of job loss.
2.4. Career Entry and Age Structure
Age composition has been used to study changing job opportunities before generative AI. Autor and Dorn [21] show how growing occupations become younger and declining occupations become older as recruitment changes. That relationship makes age composition informative, but it also means that a falling young-to-older ratio is not unique to AI. We compare each industry with its earlier record to establish whether its recent change goes beyond the age patterns previously observed there.
Junior assignments can also provide training. Gathering evidence, preparing documents, and checking calculations let a worker practice before taking responsibility for client decisions. Removing those assignments without other supervised work can reduce opportunities to learn. Helping beginners perform more useful assignments can expand those opportunities. QWI do not record assignments or training. They identify employment changes that a study of work organization must explain.
Studies of work and learning show why the concern deserves investigation. Beane [22] describes how robotic surgery reduced trainees’ participation in work previously shared with experienced surgeons. Emanuel, Harrington, and Pallais [23] find that sitting near coworkers increases coding feedback, especially for younger and less tenured engineers. These studies identify ways in which technology and workplace arrangements can change learning. They do not establish that the young-employment losses in our five industries represent lost training.
3. Materials and Methods
3.1. Employment Measures and Sample
We use the Census Bureau’s QWI release R2026Q3 for private employers, unadjusted for seasonality, by state and five-digit industry. The variable Emp estimates jobs on the first day of the quarter. QWI link unemployment–insurance employment records with worker information. Public estimates include imputation, which fills missing information, and disclosure protection, which changes or suppresses values to protect confidentiality. A person working for more than one employer can contribute more than one job. The data exclude self-employment and do not identify occupation, education, experience, or employer AI use [24].
Young employment is the published age group 22–24, code A03. Older employment is the sum of ages 25–34, 35–44, and 45–54, codes A04–A06. Total employment is the published all-age value A00; it includes workers outside ages 22–54. We retain positive values with publication status 1 and require complete young and older employment for all five industries in every quarter from 2006Q1 to 2025Q4. The resulting panel contains 47 states and the District of Columbia, referred to below as 48 reporting areas. Alaska, Massachusetts, and Michigan do not meet that requirement. We follow the same areas for twenty years, from 2006Q1 to 2025Q4. This record includes the Great Recession and the subsequent expansion. The same areas enter every comparison. Industry codes are 54151, 54161, 54121, 54111, and 54133.
The main comparison is 2022Q4 vs. 2025Q4. The new 2025Q4 rows come from the same public release as the earlier extracts, and all 48 reporting areas remain eligible. This is the latest quarter available for these areas in that frozen release. Later releases can revise earlier estimates. Comparing the same quarter in two years avoids ordinary seasonal differences between quarters. Because Emp is measured at the quarter’s beginning, the baseline is 1 October 2022, before ChatGPT’s 30 November release, and the endpoint is 1 October 2025. Coding assistants and other AI tools were already available at the baseline. We also compare 2019Q4 with 2025Q4 and average the latest four same-quarter three-year changes. These dates define the employment comparison.
3.2. Historical Comparison for Each Industry
For each area and industry, we calculate the natural logarithm of young employment divided by older employment. Log changes express proportional changes and allow young and older employment growth to be subtracted. The change equals the change in log young employment minus the change in log older employment. We subtract three times the mean annual Q4 log-ratio change ending in 2007–2019 from the recent three-year change. The benchmark ends in 2019 to keep pandemic-era labor-market disruption out of the historical reference period. This measures how far the recent ratio change departs from continuation of the industry’s usual historical drift. We average the departures equally across areas and convert the mean log departure into a percentage. This equal-area estimate describes the average geographic change. The employment totals, by contrast, sum all covered jobs and give more weight to areas with more jobs.
To evaluate whether a departure is unusual, we use a circular block bootstrap: we repeatedly draw consecutive groups of historical years, continuing from the end to the start of the record when needed. Each selected year carries all areas together, so a common national shock is not counted as 48 independent events. Each of 30,000 draws uses three-year blocks to simulate a historical mean and a subsequent three-year outcome. The difference includes uncertainty in the mean as well as in the subsequent outcome. The primary two-sided p-value is the proportion of simulated errors whose absolute size is at least as large as the observed departure. The corresponding 95% bounds use the 95th percentile of absolute simulated errors. Appendix B provides the formula and checks. Each industry is evaluated against its own history. The five-industry p-values are unadjusted. We do not apply a correction for multiple testing across the five industries, and we do not interpret the five tests as one family of tests. The test of differences across the five industries (Section 3.3) is a separate analysis.
These p-values describe unusualness if the historical mean and pattern of year-to-year dependence remain useful for the recent period. They are not tests of AI causation or full estimates of uncertainty in the underlying administrative data. The primary benchmark contains only 13 annual changes. We therefore show the observed rolling history and repeat the calculation with two- and four-year blocks, histories ending in 2021 or 2022, and the four-quarter comparison.
3.3. Geographic Changes and Differences Across Industries
We report young, older, and total employment changes separately in each area, and examine the four age bands separately. The final analysis asks whether the five-industry ratio changes differ unusually from one another. We measure their spread with the population standard deviation, which summarizes their distances from the five-industry mean. The historical bootstrap draws the same years for all industries so that their historical tendency to move together is retained. We compare the observed spread of departures with the simulated spread and show raw ratio changes for every rolling three-year window. The windows share observations because they overlap. They are not independent samples. We also remove each industry in turn to check whether one alone produces the finding.
3.4. Software and Verification
The calculations use Python 3.14.3 with NumPy 2.5.3, pandas 3.0.6, PyArrow 25.0.1, and Matplotlib 3.11.2. Supplementary Material S1 supplies the frozen public data and runnable scripts. A separate implementation reconstructs the employment endpoints and historical bootstrap from the inputs and checks agreement with the main calculation. The scripts run offline after the listed Python packages have been installed.
4. Results
4.1. Employment Changes Within Each Industry
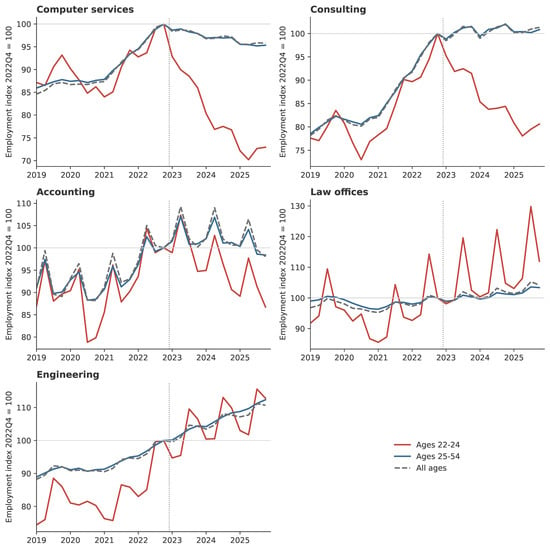
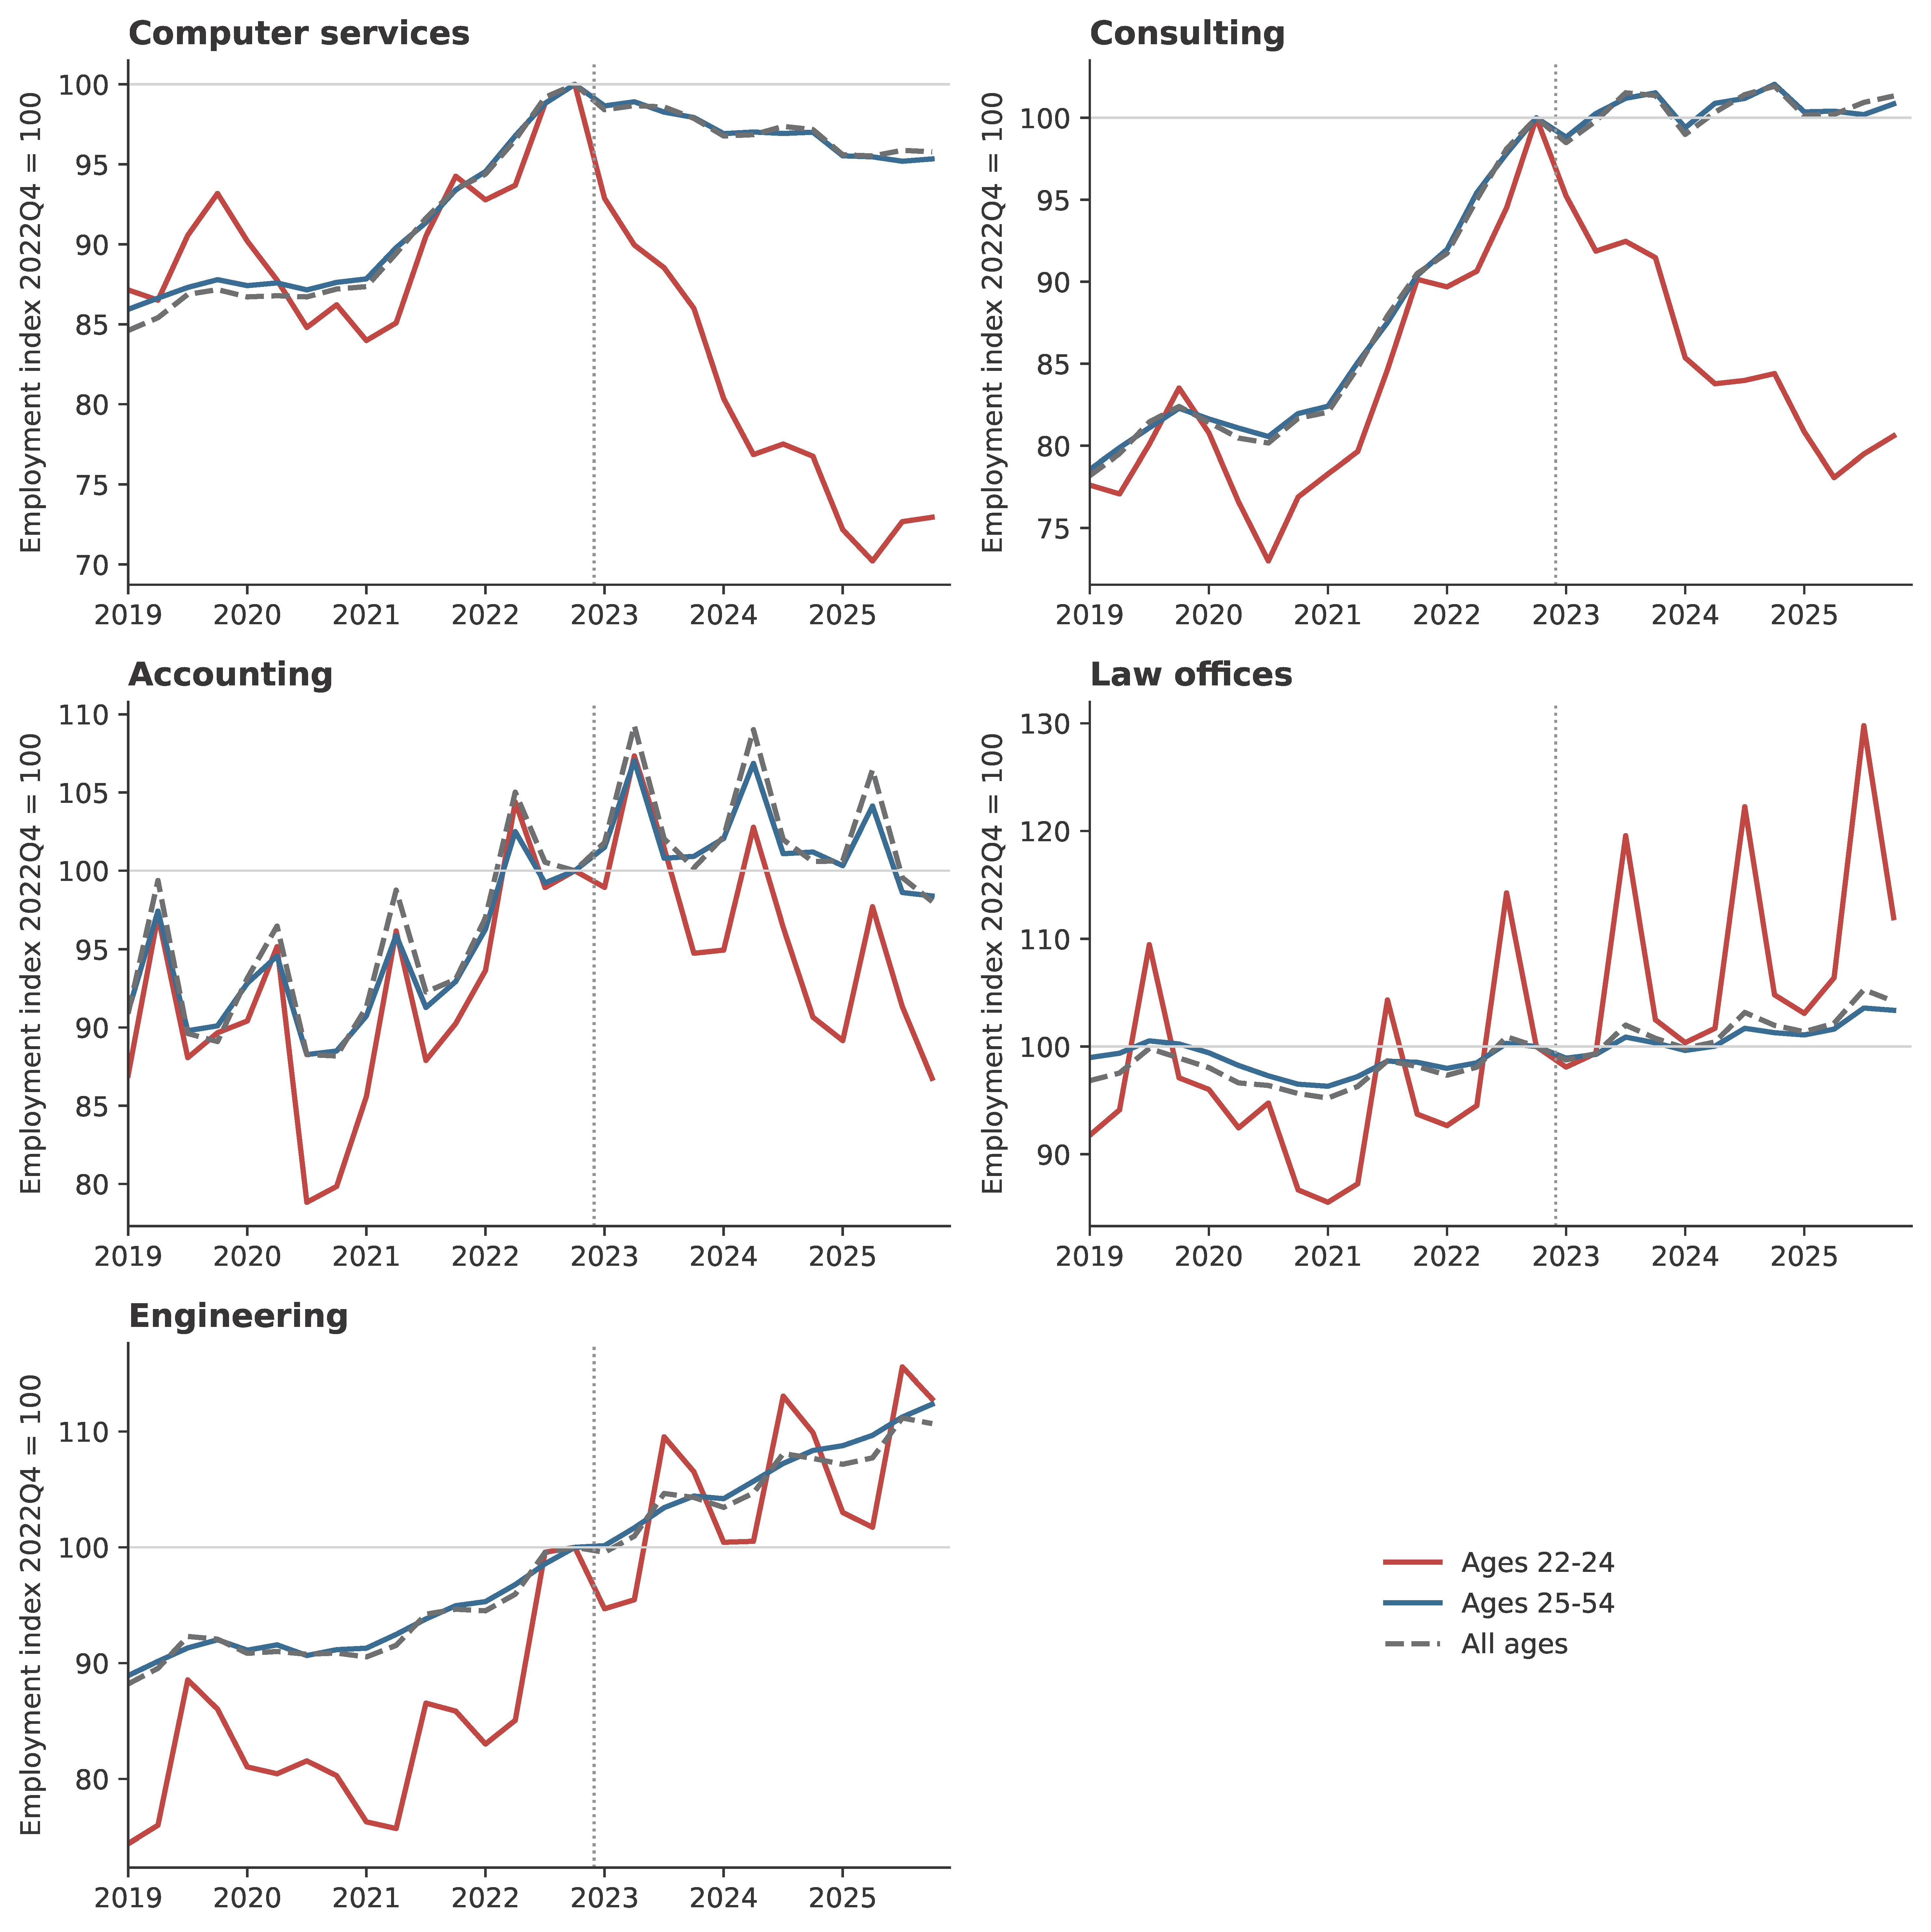
Young employment fell in three industries and grew in two (Table 1 and Figure 1). Computer services lost 23,959 jobs held at ages 22–24, a decline of 27.0%. Employment at ages 25–54 declined by 4.7%, and all-age employment declined by 4.2%. The young-to-older ratio fell by 23.5%. The young loss therefore greatly exceeded the industry’s overall contraction.
Table 1.
Employment changes from 2022Q4 to 2025Q4.
Figure 1.
Employment by age and total employment. QWI R2026Q3; 47 states and DC. Quarterly beginning-of-quarter jobs, indexed to 2022Q4 = 100. Red: ages 22–24; blue: ages 25–54; dashed dark line: all ages. Vertical dotted line marks 30 November 2022. It is a time reference, not an estimated break. Quarterly seasonal movements remain visible.
Consulting lost 15,240 young jobs, a decline of 19.4%, while older employment grew by 0.8%, and all-age employment grew by 1.3%. Its ratio fell by 20.1%. Consulting therefore combines an absolute young job loss with total industry employment growth.
Accounting recorded a 13.2% young decline, a 1.6% older decline, and a 2.0% all-age decline. Law offices recorded a young growth of 12.0%, compared with 3.4% at older ages and 4.2% overall. Engineering grew across the age distribution: young employment increased by 12.8%, older employment increased by 12.4%, and all-age employment increased by 10.7%. In the job counts summed across areas, young employment thus outgrew older employment in law offices and, by a small margin, in engineering, despite the sector’s high theoretical exposure.
4.2. Departures from Industry History
The average state ratio departed by −20.6% from its historical path in computer services and by −18.4% in consulting (Table 2). The primary historical bootstrap gives unadjusted two-sided absolute-error p-values of 0.030 and 0.033. Accounting’s estimated departure is −7.7% (p = 0.411); law offices’ is +12.9% (p = 0.071); engineering’s is −2.3% (p = 0.867). These tests concern changes relative to historical average behavior. Engineering’s ratio based on summed jobs rises by 0.4%, while its equal-area mean ratio falls by 0.7%. The difference reflects the weighting: the first sums jobs, and the second gives small- and large-area equal weight.
Table 2.
Each industry compared with its historical ratio path.
The estimates for computer services and consulting remain close to −20% and −18%, respectively, when the history includes 2020–2021 or 2022 (Table A1). Averaging the latest four same-quarter comparisons gives approximately −20% in each industry. Their absolute-error p-values remain below 0.05 with two-, three-, and four-year blocks. Law offices’ positive departure is less stable across historical choices; accounting and engineering do not show clear departures under the reported tests.
A decline measured from 2022 could partly reverse unusually strong hiring during the pandemic. We therefore also compare employment in 2025 with employment in 2019, before that expansion. By 2025Q4, computer services’ young employment was 21.7% below 2019Q4, while older employment was 8.6% above it. Consulting’s young employment was 3.5% below 2019Q4, while older employment was 22.6% above it. Both ratios declined from the pre-pandemic baseline.
Table A2 compares the recent ratio changes with the earlier extremes. The recent equal-area mean log-ratio changes are −25.3 log points in computer services and −22.1 in consulting. Across all 56 earlier three-year windows ending from 2009Q1 to 2022Q4, the corresponding minima are −23.3 and −19.2. The recent changes are more negative by 2.0 and 2.9 log points, respectively. The bootstrap p-values compare departures with historical mean behavior.
4.3. Geography and Age Groups
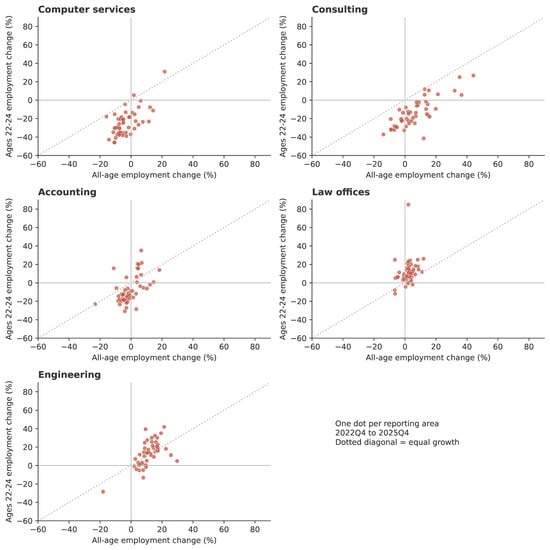
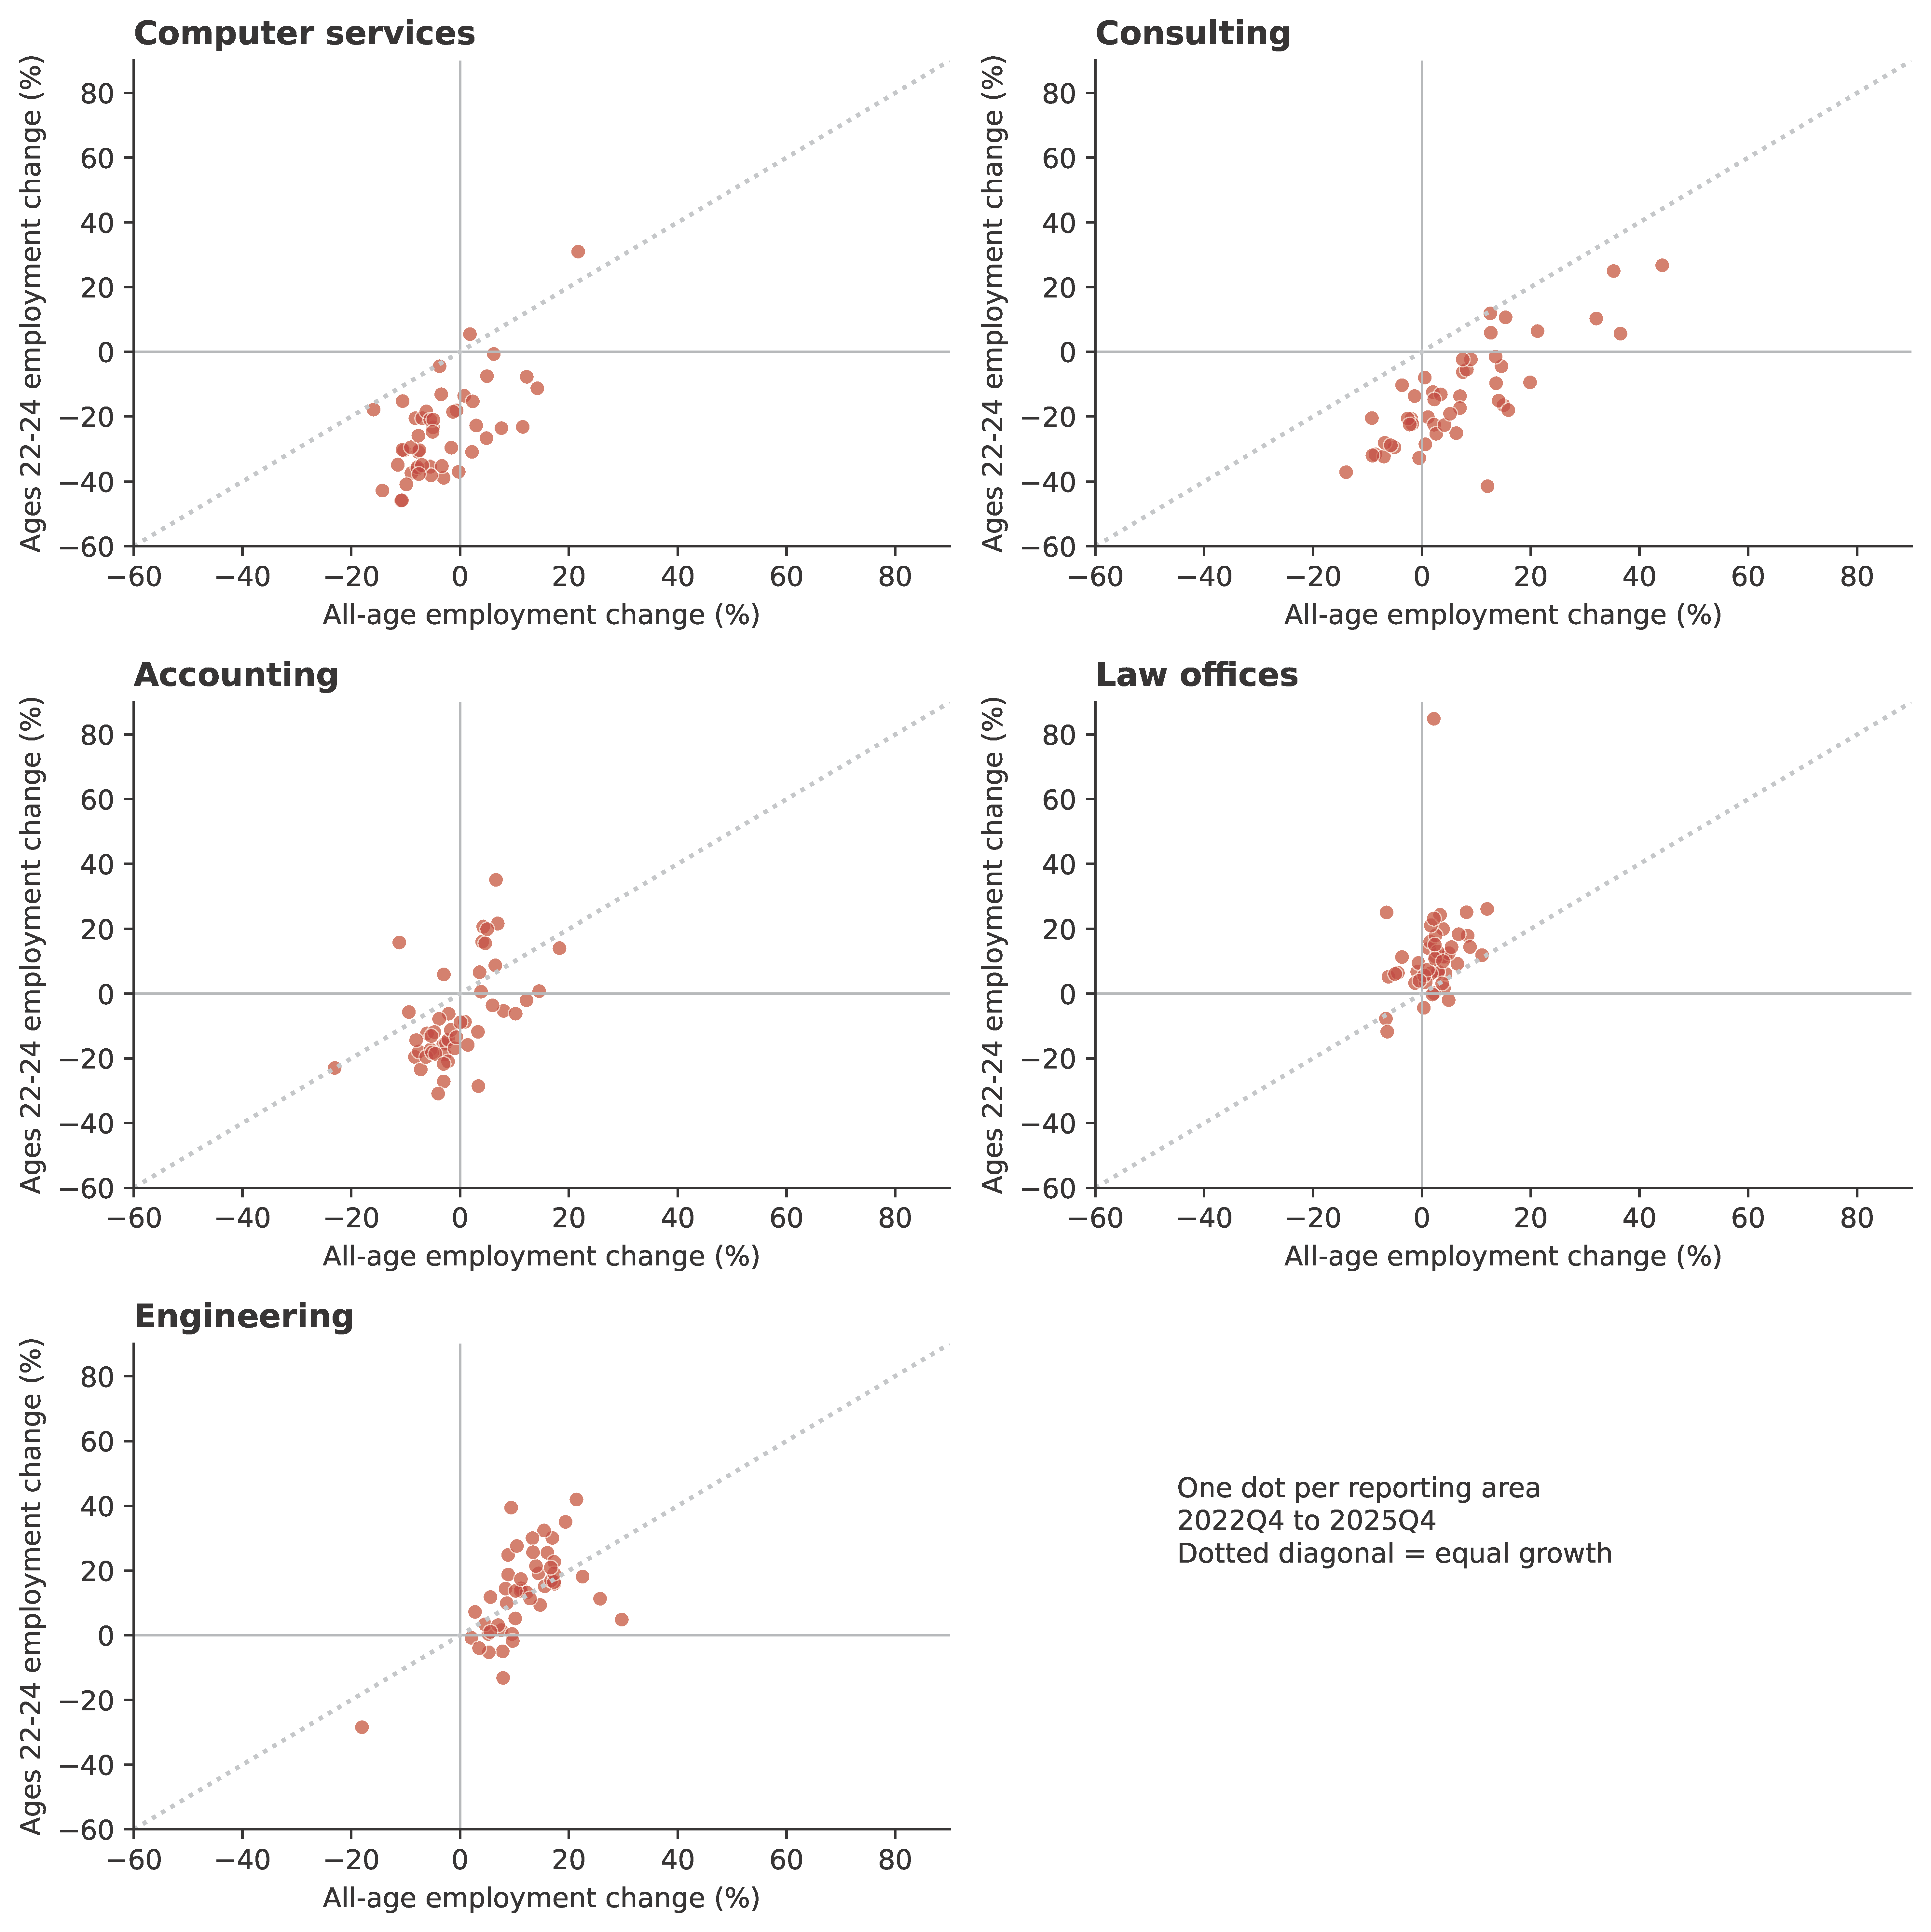
The declines are geographically widespread. Computer services had young losses in 46 of the 48 reporting areas: in 34, older employment also fell, while in 12, it rose. Consulting had young losses in 40 areas, including 25 where older employment grew. Young employment grew in 43 areas in law offices and in 41 in engineering. Figure 2 uses all-age employment to show whether young losses occurred within a growing industry. The young-to-older ratio separately measures age structure. In the all-age comparison, 11 computer-services areas and 25 consulting areas combined young loss with total employment growth. Comparing each state’s ratio with its own historical drift gives negative departures in 44 areas for computer services and 46 for consulting.
Figure 2.
State changes in young and total employment. QWI R2026Q3. Each dot is one of the same 47 states and DC. Horizontal axis: all-age job change; vertical axis: job change for ages 22–24, 2022Q4 to 2025Q4. Dotted diagonal indicates equal growth. The lower-right quadrant shows young losses with total growth. All panels use the same axes and include every reporting area.
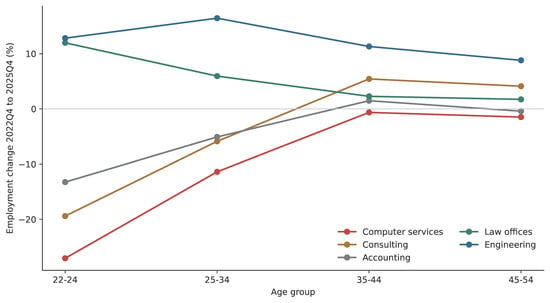
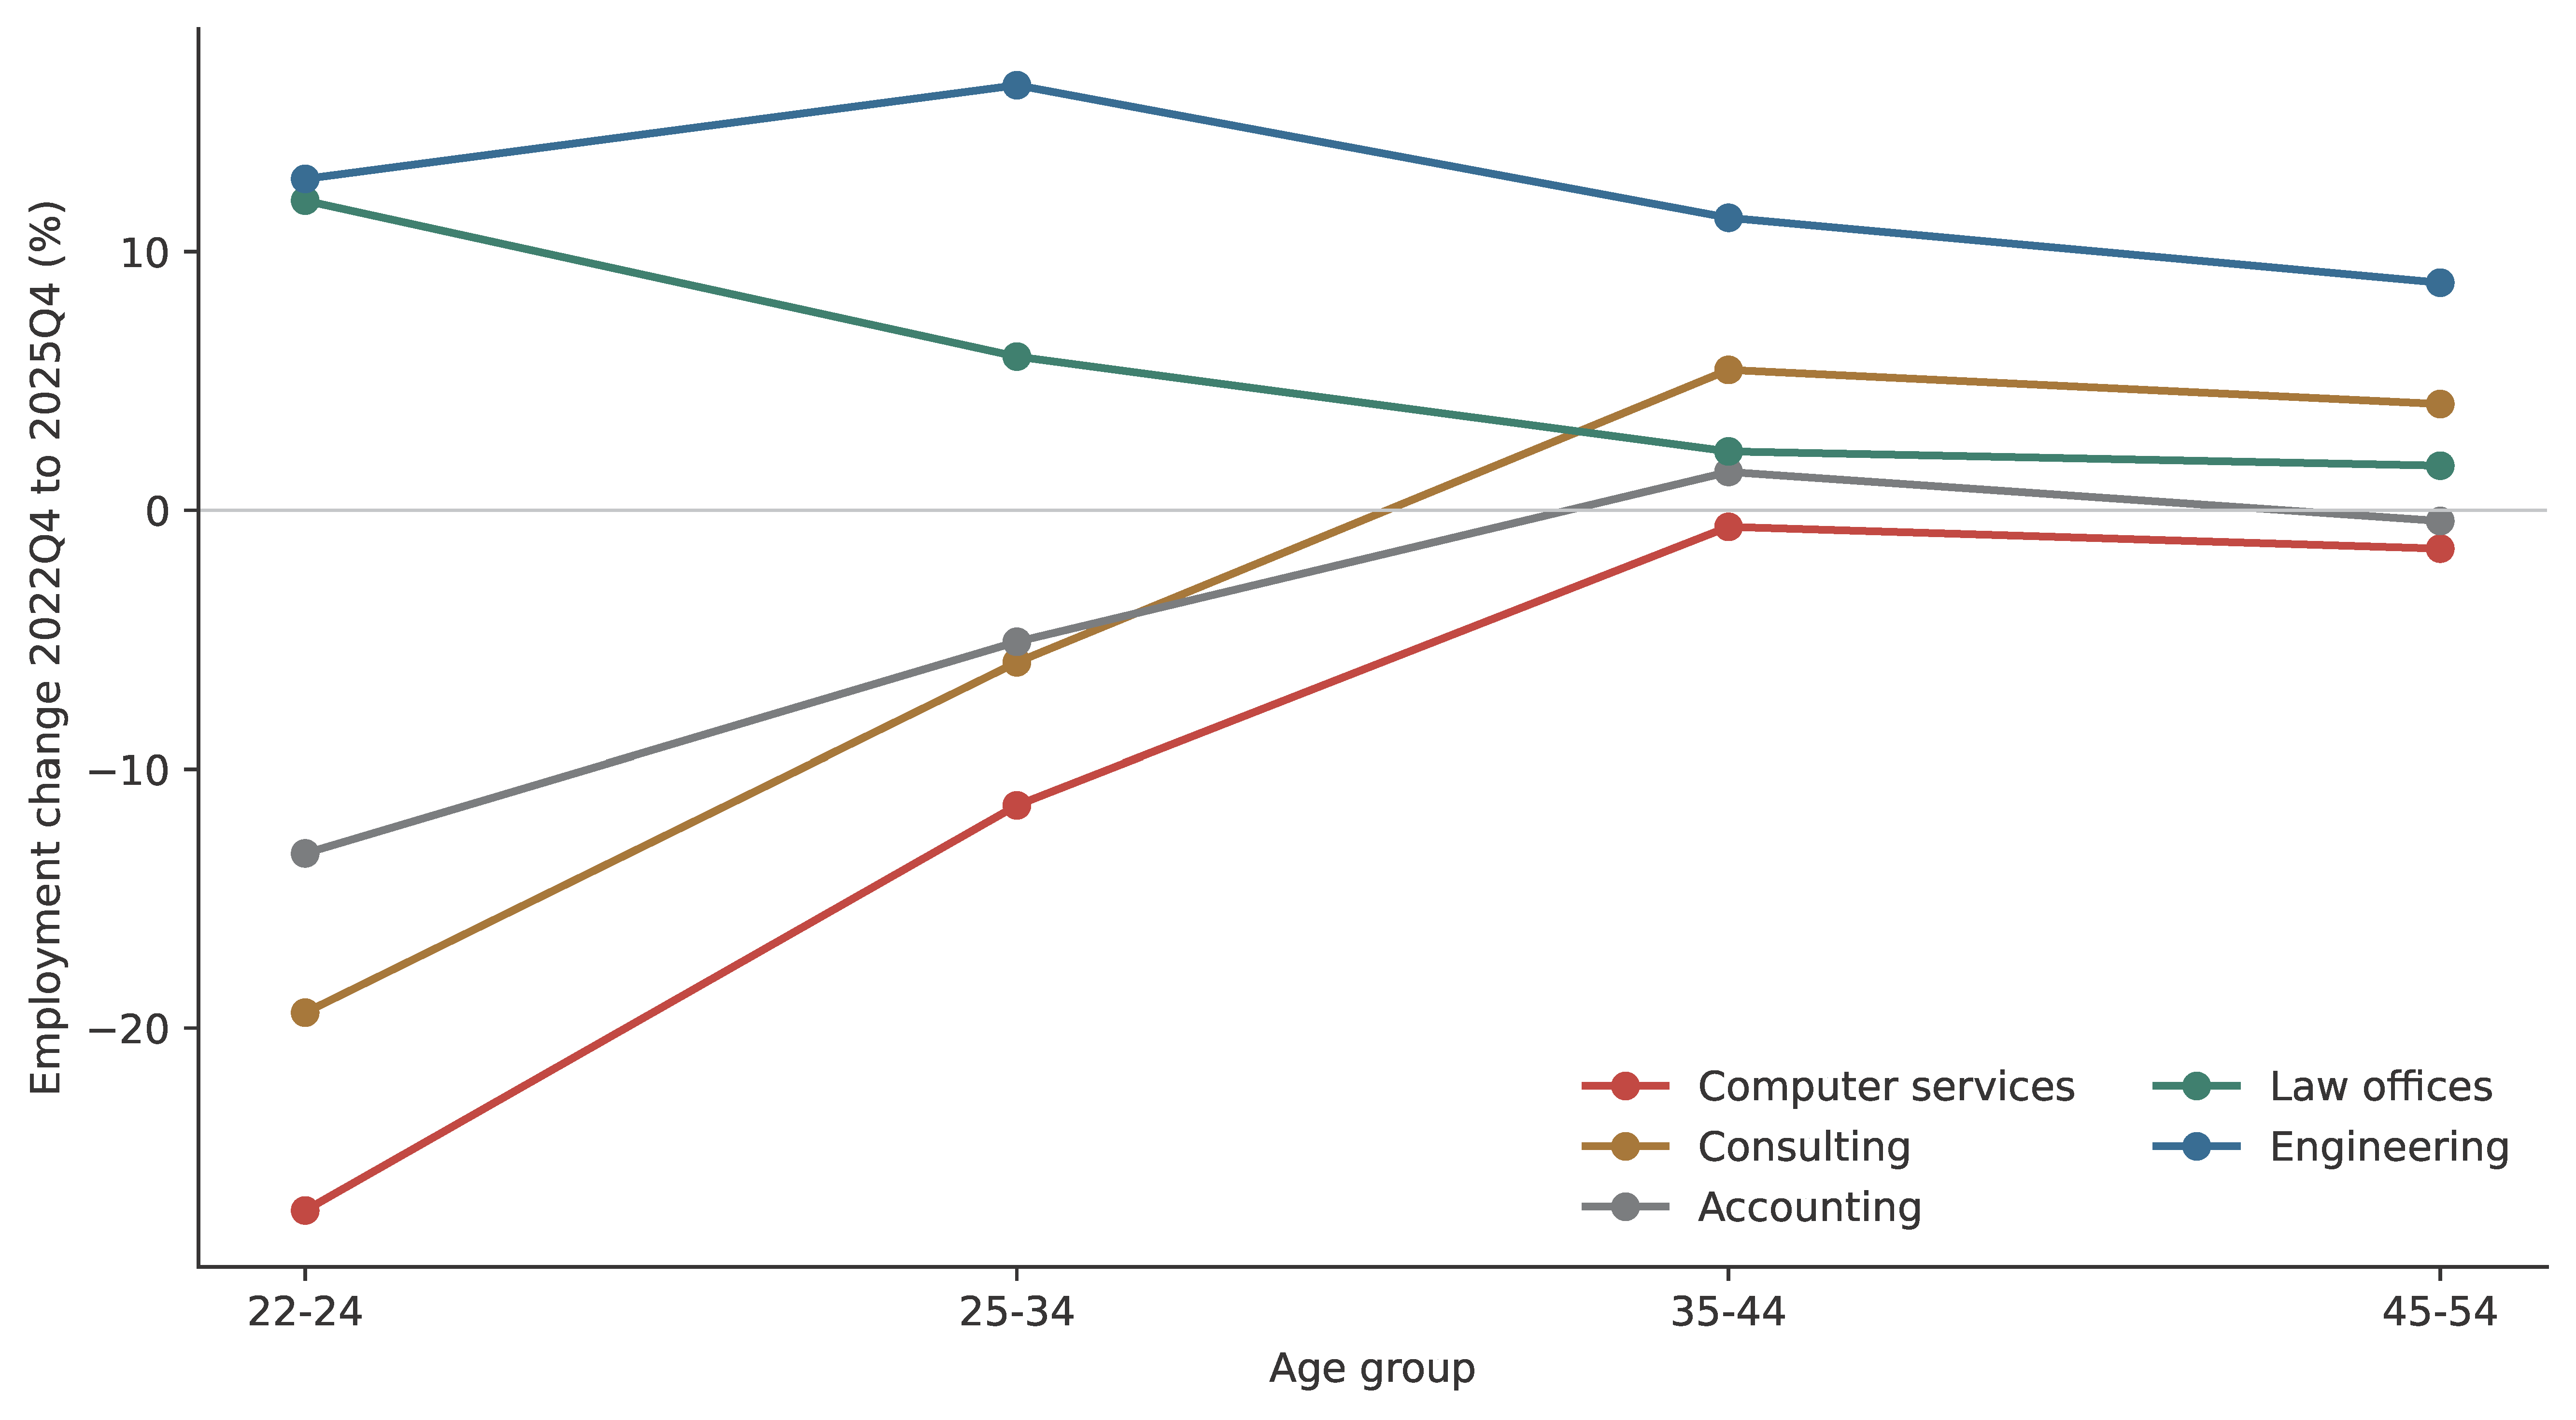
The separate age bands show where the combined job changes are concentrated (Figure 3). In computer services, employment fell by 27.0% at ages 22–24 and by 11.4% at ages 25–34, while the declines for ages 35–44 and 45–54 were 0.6% and 1.5%. Consulting fell by 19.4% at ages 22–24 and by 5.9% at ages 25–34, while employment grew by 5.4% and 4.1% in the two older bands. Law offices show the reverse ordering: growth is the strongest for ages 22–24 and smaller in each older band. Engineering grew the most for ages 25–34, followed by ages 22–24. These are changes in counts within age groups, not the subsequent careers of the same individuals.
Figure 3.
Employment changes in four age groups. QWI R2026Q3; sums across the fixed panel of 47 states and DC. Percent change from 2022Q4 to 2025Q4 for each age group and industry. Lines connect separate age groups to show the ordering of changes; they do not follow a cohort as it ages.
4.4. Unusually Large Differences Across Industries
The final test asks whether the five historical departures are unusually far apart. The standard deviation of the five historical departures is 12.8 log points, compared with a bootstrap 95th percentile of 8.7; the p-value is 0.0049. Using the distance between the largest and smallest departures gives p = 0.0094.
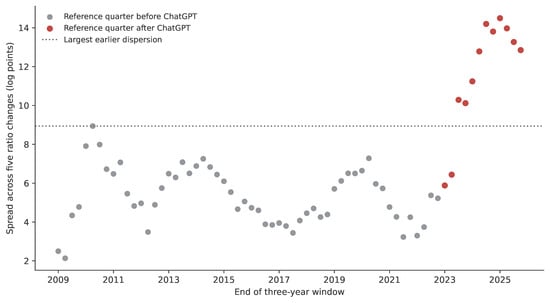
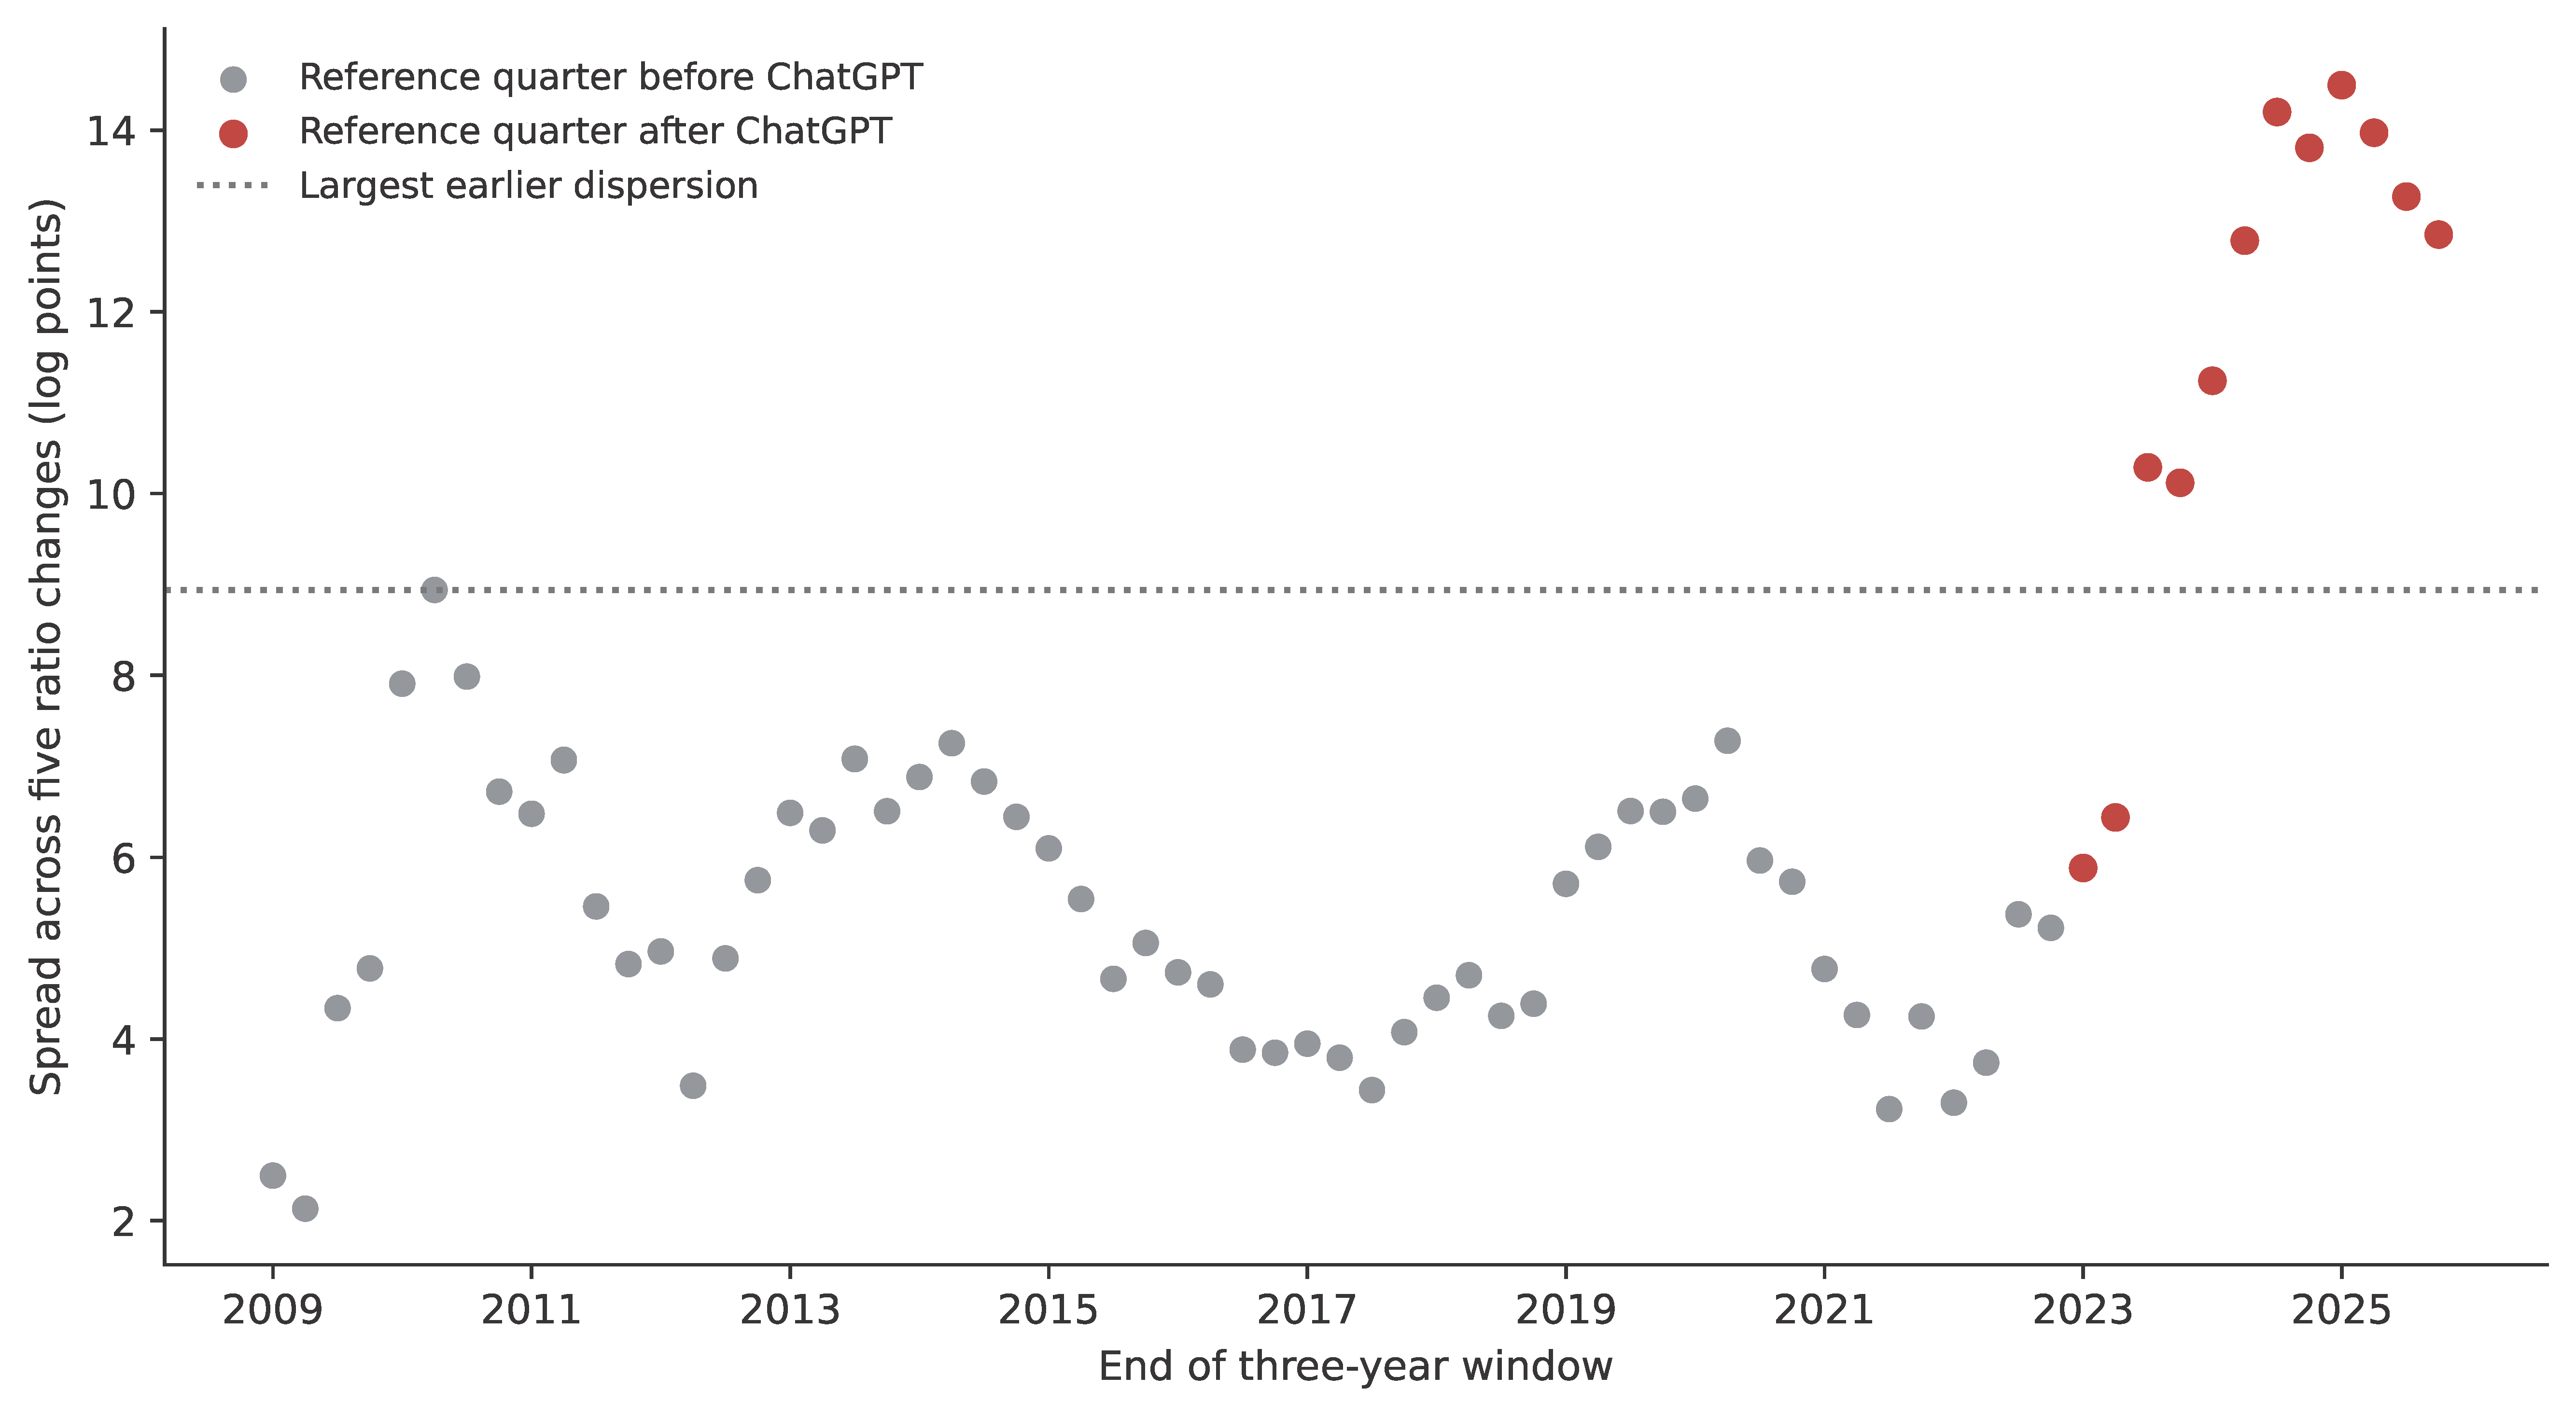
The observed rolling record supports the same descriptive conclusion (Figure 4). The latest spread of raw three-year log-ratio changes is 12.9 log points. The maximum among the 56 windows ending before the first post-ChatGPT reference quarter is 8.9. The spread first exceeds that earlier maximum in 2023Q3 and remains above it up to 2025Q4, reaching 14.5 in 2025Q1. Because these windows overlap, this sequence is not a set of independent discoveries or a statistical estimate of when an AI effect began.
Figure 4.
Differences across industries in the rolling history. QWI R2026Q3; equal reporting-area weights. Each dot gives the population standard deviation across the five industries’ mean state three-year log-ratio changes. Gray endpoints refer to employment measured before ChatGPT; red endpoints refer to employment measured after its launch. The dashed line marks the largest of 56 earlier windows. Windows overlap and are not independent observations. Log points = 100 × a change in the natural logarithm.
Removing any one industry leaves the primary dispersion p-value below 0.05. Removing both computer services and consulting gives p = 0.109; the three remaining industries do not alone establish an unusual spread. The result reflects opposing movements involving the large negative departures.
5. Discussion
5.1. What the Employment Evidence Adds
Computer services and consulting lost far more employment at ages 22–24 than at ages 25–54. Law offices gained young employment faster than older employment, engineering grew across ages, and accounting contracted less than computer services or consulting. The computer services’ and consulting’s ratio declines exceed the pre-ChatGPT three-year declines in the fixed record beginning in 2006, and differences across the five-industry departures are unusually wide. Consulting’s total growth conceals its young loss; computer services’ total contraction understates the concentration of its losses at young ages. These separate results provide more information than a single professional-service employment total.
Our findings describe jobs held by age within particular industries. They do not measure attempts to enter an industry, and they do not measure national unemployment. A young person who cannot find a job in a preferred professional service can remain employed elsewhere or continue education. The adjustment can still affect the career experience available to that person. Conversely, the loss of one QWI job cannot be treated as evidence that one graduate became unemployed. This distinction connects our industry counts with Anthropic’s evidence of fewer young job starts without a detectable increase in exposed-worker unemployment [2].
5.2. How AI Could Produce Different Age Responses
One explanation worth testing is that AI reduces junior preparation, while experienced staff retain responsibility for review, integration, and client decisions. That division of work could produce young losses in computer services or consulting if growth in the services is too small to offset the reduced junior labor requirement. The age gradient and Stanford’s evidence on automated use and codified knowledge support examining that explanation [1]. Our data do not show which tasks the workers performed or whether employers assigned those tasks to AI.
The pre-pandemic comparison gives another reason to examine this mechanism. In both computer services and consulting, employment at ages 22–24 was lower in 2025 than in 2019, while employment at ages 25–54 was higher. AI reducing junior assistance could produce that combination. Changes in staffing and demand could also change how work is assigned across age groups, so this comparison cannot identify the mechanism on its own.
Firms can assign preparation and routine work to junior staff and reserve experienced staff for review and difficult decisions. Garicano [25] explains why this division can save money: less costly staff handle ordinary work, while experts spend their time on problems that need their knowledge. AI could change that arrangement. If AI prepares a draft or completes basic research, an experienced worker could check the result without asking a junior colleague to prepare it. The firm could then provide the same service with fewer junior staff. Whether that saves money depends on the junior work and supervision no longer needed, the cost of the AI tools, and any additional time spent checking their output. QWI do not record those tasks or costs, so the employment changes are consistent with this mechanism but do not demonstrate it.
AI can help young workers complete a wider range of useful assignments. Brosch et al. [7] provide experimental evidence of that possibility, while the customer-support and consulting experiments show performance gains in particular tasks [18,19]. More useful work per person can support hiring if firms expand services enough. The young employment gains in law offices and engineering also need an explanation. Investment demand could also contribute to their employment growth. Engineering services could benefit from greater demand for design work, but QWI do not measure the source of that demand. Many workers aged 22–24 in law offices perform support work and are not licensed lawyers, so their assignments must be identified before attributing the growth to a specific AI mechanism.
Anthropic’s gap between technical potential and observed use helps explain why industries with high exposure need not move together. Computer tasks show greater observed coverage than legal tasks despite high theoretical coverage in both [2]. Organizational changes and reliable deployment also take time [11]. The different employment directions are therefore consistent with differences in use, tasks, and demand. They cannot establish which explanation operates in each industry, because the QWI employers’ adoption and work assignments are not observed.
5.3. Alternative Explanations
The recent changes differed sharply across services, and young losses in computer services and consulting spread across many states. An explanation must account for their historically large ratio declines and for young employment gains in law offices and engineering. Several influences can contribute at the same time.
Pandemic staffing adjustments could reduce new hiring after an unusually large hiring expansion. A return only to pre-pandemic employment, however, does not explain computer services’ young employment falling by 21.7% below 2019Q4 while older employment remained 8.6% above it. Consulting’s young employment was only 3.5% below 2019, leaving more room for a return toward that earlier level, but its older employment was 22.6% higher. An explanation based on pandemic staffing must account for the different changes in young and older employment. Workers hired at ages 22–24 can also age out of the band without losing their jobs. The declines at ages 25–34 show that losses extend beyond the youngest band, but they do not track the earlier cohort and cannot exclude aging as part of the explanation.
Weaker demand and higher interest rates can reduce recruitment before employers release experienced staff. Recession research also shows that firms can shift toward more skilled work during a downturn [26]. Our history contains an earlier example of young losses alongside broader growth: between 2007Q4 and 2010Q4, young employment fell by 12.8% in computer services and by 12.1% in consulting, while total employment rose by 5.9% and 4.7%. The recent young losses are larger, 27.0% and 19.4%. Demand and financing conditions differ between the two periods. Tucker’s historical decomposition attributes up to one-quarter of a broader early-career employment decline to monetary-policy shocks and does not explain the sudden hiring decline [14]. His comparison uses exposure groups across industries, so that fraction cannot be applied directly to our five services. Demand and interest rates remain possible contributors.
Remote work could affect junior hiring if employers find it harder to train workers who are rarely near experienced colleagues. Emanuel, Harrington, and Pallais [23] find that proximity increases coding feedback, particularly for younger and less tenured engineers. Lambert and Schindler [27] find lower junior hiring associated with remote work; the AI–exposure relationship shrinks when remote work enters the same analysis. Their checks also connect remote or hybrid job advertisements in 2021–2022 to lower junior hiring later. Stanford’s youth-employment gap remains in several remote-work checks [1]. The studies differ in their data and comparisons. QWI do not record remote-work adoption, so our industry histories cannot determine how much remote work contributed.
Outsourcing, changes in the supply of graduates, immigration, and movement of firms between industry classifications could also affect these counts. Young losses spreading across many states are insufficiently explained by a shock confined to one state. Young gains in law offices and engineering are inconsistent with a uniform decline across all five services. National changes can nevertheless affect industries differently. QWI do not measure these influences, and we cannot conclude that none fits the findings.
The findings support investigating AI as a contributing explanation, especially where tools can perform junior preparation while experienced staff remain responsible for the finished work. The historical comparisons establish the unusual size and separation of the age changes. A study of their causes would need employer adoption dates, information about tasks, and employment by age. It would compare firms with similar business conditions that adopted tools at different times while accounting for demand and workplace changes.
5.4. Implications for Access to Careers and Responses Worth Testing
The immediate concern is how young people will obtain paid practice if firms offer less of the work that formerly introduced them into a profession. Junior assignments provide income and opportunities to receive feedback before taking greater responsibility. Removing those assignments without alternatives can make access depend more on family support, prior experience, or an ability to work without pay. QWI do not measure these consequences. The risk matters if the observed job losses represent fewer routes into supervised professional work.
Employers, universities, and public agencies can test paid placements that combine AI-assisted preparation with supervised client work and responsibility for checking results. The apprentice experiment shows that AI-assisted performance can improve without lowering immediate task comprehension, but it does not establish lasting learning or employment gains [7]. Training should therefore assess work completed without AI as well as assisted output. Subsidies or procurement incentives can be evaluated by whether they add paid places, improve skills, and support later employment and pay progression. Training tools can require trainees to explain their reasoning and check errors. These proposals need evaluation before their effectiveness can be established.
Employment gains among older workers or in other services should also be monitored as AI develops. The history of textile production illustrates why an early gain need not last: improved spinning supported the expansion of cotton handloom weaving, while later mechanization displaced that work [28]. This history does not predict the disappearance of today’s professions. It shows why work that initially benefits from one innovation can later be affected by another. The same concern applies if AI moves from junior preparation toward tasks now assigned to experienced workers. Monitoring changes by age and task can provide warning before losses become large enough to appear in total unemployment.
5.5. Data Limitations and Uncertainty
Age approximates career stage, and industry approximates the type of work offered. Neither measures occupation, experience, or first-job status directly. QWI also do not identify hours, vacancies, or graduates who sought work but could not enter an industry. People age into and out of 22–24, so changes in that band are not hires minus separations and do not follow the same people over time. Cohort size, schooling, immigration, firm composition, and classification changes can affect the counts. The statistical tests do not incorporate all uncertainty from record linkage, imputation, or confidentiality protection.
Keeping the same areas throughout prevents changes in the geographic sample from creating the results but omits three states. Equal-area historical tests give small states the same weight as large ones. The primary history contains only 13 annual changes, including the Great Recession, and assumes that resampling those years describes relevant recent variation. The results are conditional on that historical model, which is why we report alternative histories, block lengths, and observed extremes. Causal attribution requires employer adoption data and a comparison design that separates adoption from other employment influences.
6. Conclusions
From 2022Q4 to 2025Q4, employment at ages 22–24 fell sharply in computer services and consulting, rose in law offices and engineering, and fell less sharply in accounting. The losses in the first two industries are concentrated at younger ages, and their young-to-older ratio declines exceed the pre-ChatGPT three-year declines in this fixed record beginning in 2006. Differences across all five services are unusually wide under the historical model. These findings reveal changes concealed by industry totals and show what explanations of AI use, service demand, and work organization must account for. Monitoring employment by age and evaluating paid professional training are responses to test, not outcomes that this analysis measured. They can proceed while research establishes how much AI contributed.
Supplementary Materials
The following supporting information can be downloaded at: https://www.mdpi.com/article/10.3390/soc16110376/s1, Supplementary Material S1 contains the replication data, Python scripts, output tables, figure files, and instructions.
Author Contributions
Conceptualization, methodology, investigation, formal analysis, software, visualization, and original draft preparation, B.W.; supervision and review and editing, L.L. All authors have read and agreed to the published version of the manuscript.
Funding
This research study received no external funding.
Institutional Review Board Statement
Not applicable. This study analyzes publicly released aggregate employment statistics and involves no participant recruitment, intervention, nor access to identifiable private records.
Informed Consent Statement
Not applicable. No identifiable individual information was collected or reported.
Data Availability Statement
The source data are publicly available from the U.S. Census Bureau’s Quarterly Workforce Indicators release R2026Q3 at https://lehd.ces.census.gov/data/qwi/R2026Q3/ (accessed on 15 August 2026). The frozen extracts, 2025Q4 extension, selection inputs, code, and outputs used in this study are supplied in Supplementary Material S1. The instructions describe how to reproduce the calculations and reconstruct the selected rows from the public source files.
Acknowledgments
The authors acknowledge the U.S. Census Bureau as the source of the public employment data.
Conflicts of Interest
The authors declare no conflicts of interest.
Appendix A. Sample Selection Checks
We calculate the sector ranking as the arithmetic mean of available four-digit industry exposure scores within each sector. Each industry score uses occupational employment weights from the May 2022 Occupational Employment and Wage Statistics matrix and the human-rated task measure described in Section 2.1. The first four sectors’ means are 0.5226 for finance and insurance, 0.4820 for management of companies, 0.4782 for information, and 0.4661 for professional services. These scores measure potential time savings under the task rubric, not adoption rates or predicted job losses. The selection inputs and code reproduce the calculation.
The five industries cover 69.3% of employment aged 22–54 within NAICS 541 in the 2019 size check and 69.2% in 2022, using a separate 49-area panel. Scientific research and development services (54171), the sixth-largest industry, is 28.5% smaller than the fifth in 2019 and 16.4% smaller in 2022. These checks document the sample that we chose before analysis. The coverage check uses 49 areas. The historical analysis uses the 48 areas described in Section 3.1.
Appendix B. Historical Tests and Sensitivity Checks
Let Y be employment aged 22–24, O employment aged 25–54, and r = ln(Y/O). For an industry, the recent departure D is the reporting-area average of r in 2025Q4 minus r in 2022Q4, less three times the reporting-area average annual Q4 change ending in 2007–2019. We report 100 × [exp(D) − 1] as the percentage departure. A log point is 100 times a change in the natural logarithm; it approximates a percentage change only for small changes.
For each bootstrap draw, the code samples 16 historical year indices in circular blocks: the first 13 estimate the historical mean, and the final three supply a simulated three-year outcome. Historical annual changes are centered on their industry mean, and all reporting areas move together when a year is drawn. The simulated error is the sum of the final three centered annual changes minus three times the average of the first 13. The finite-sample scale factor is the square root of 624/623. The two-sided p-value counts absolute simulated errors at least as large as the absolute observed departure, with one added to the count and to the number of draws. The 95% bounds use D plus or minus the 95th percentile of absolute simulated errors and then convert those bounds into percentages. They are approximate bounds under the resampling model, not full administrative-data uncertainty intervals.
Table A1.
Historical sensitivity checks for each industry.
For the four-quarter comparison, the code averages the three-year changes ending in 2025Q1–Q4 and resamples each historical year’s four quarters together. It does not treat those quarters as four independent samples. For dispersion, the code calculates the standard deviation across the five-industry departures and compares it with the same statistic across the five simulated errors. Resampling years jointly preserves correlations across industries. The rolling record uses all 56 windows ending from 2009Q1 to 2022Q4 as pre-launch employment observations because Emp refers to the first day of the quarter. Later endpoints begin in 2023Q1.
Table A2.
Historical three-year ratio changes.
References
- Brynjolfsson, E.; Chandar, B.; Chen, R. Canaries in the Coal Mine? Six Facts About the Recent Employment Effects of Artificial Intelligence; Working Paper; Stanford Digital Economy Lab: Stanford, CA, USA, 2025; Available online: https://digitaleconomy.stanford.edu/app/uploads/2026/08/Canaries_August2026.pdf (accessed on 8 October 2026).
- Massenkoff, M.; McCrory, P. Labor Market Impacts of AI: A New Measure and Early Evidence; Anthropic: San Francisco, CA, USA, 2026; Available online: https://www.anthropic.com/research/labor-market-impacts (accessed on 8 October 2026).
- Humlum, A.; Vestergaard, E. Still Waters, Rapid Currents: Early Labor Market Transformation Under Generative AI; RFBerlin Discussion Paper 078/26; RFBerlin: Berlin, Germany, 2025; Available online: https://www.rfberlin.com/wp-content/uploads/2026/03/26078.pdf (accessed on 9 October 2026).
- Gimbel, M.; Kinder, M.; Kendall, J.; Lee, M. Evaluating the Impact of AI on the Labor Market: Current State of Affairs; The Budget Lab at Yale: New Haven, CT, USA, 2025; Available online: https://budgetlab.yale.edu/research/evaluating-impact-ai-labor-market-current-state-affairs (accessed on 9 October 2026).
- Acemoglu, D.; Restrepo, P. Automation and New Tasks: How Technology Displaces and Reinstates Labor. J. Econ. Perspect. 2019, 33, 3–30. [Google Scholar] [CrossRef] [Scilit]
- Autor, D.; Thompson, N. Expertise. J. Eur. Econ. Assoc. 2025, 23, 1203–1271. [Google Scholar] [CrossRef] [Scilit]
- Brosch, H.; Langer, C.; Lergetporer, P.; Mueller, S.; Pfeifer, H.; Tschöpe, N. Task Expansion with Generative AI: Experimental Evidence on Middle-Skilled, Early-Career Workers; Working Paper; CESifo: Munich, Germany, 2026; Available online: https://digitaleconomy.stanford.edu/app/uploads/2026/10/AI_Task_Expansion_07102026.pdf (accessed on 8 October 2026).
- Eloundou, T.; Manning, S.; Mishkin, P.; Rock, D. GPTs Are GPTs: Labor Market Impact Potential of LLMs. Science 2024, 384, 1306–1308. [Google Scholar] [CrossRef] [Scilit] [PubMed]
- U.S. Census Bureau. North American Industry Classification System United States 2022. Available online: https://www.census.gov/naics/reference_files_tools/2022_NAICS_Manual.pdf (accessed on 8 October 2026).
- Oreopoulos, P.; von Wachter, T.; Heisz, A. The Short- and Long-Term Career Effects of Graduating in a Recession. Am. Econ. J. Appl. Econ. 2012, 4, 1–29. [Google Scholar] [CrossRef] [Scilit]
- Brynjolfsson, E.; Rock, D.; Syverson, C. The Productivity J-Curve: How Intangibles Complement General Purpose Technologies. Am. Econ. J. Macroecon. 2021, 13, 333–372. [Google Scholar] [CrossRef] [Scilit]
- U.S. Census Bureau. BTOS AI Core Question Updates. 2025. Available online: https://www.census.gov/hfp/btos/downloads/AI%20Question%20Wording%20Updates.pdf (accessed on 8 October 2026).
- Fujita, S.; Moscarini, G.; Postel-Vinay, F. Measuring Employer-to-Employer Reallocation. Am. Econ. J. Macroecon. 2024, 16, 1–51. [Google Scholar] [CrossRef] [Scilit]
- Tucker, L.C. You’re (not) Hired: Artificial Intelligence and Early Career Hiring in the Quarterly Workforce Indicators. Center for Economic Studies Working Paper CES-26-27. 2026. Available online: https://www.census.gov/library/working-papers/2026/adrm/CES-WP-26-27.html (accessed on 9 October 2026).
- Chandar, B.; Klein Teeselink, B. How Does AI Change Labor Demand? Evidence from 41 Countries; Working Paper; Stanford Digital Economy Lab: Stanford, CA USA, 2026; Available online: https://digitaleconomy.stanford.edu/publication/how-does-ai-change-labor-demand/ (accessed on 8 October 2026). [CrossRef] [Scilit]
- Hui, X.; Reshef, O.; Zhou, L. The Short-Term Effects of Generative Artificial Intelligence on Employment: Evidence from an Online Labor Market. Organ. Sci. 2024, 35, 1977–1989. [Google Scholar] [CrossRef] [Scilit]
- Hampole, M.; Papanikolaou, D.; Schmidt, L.D.W.; Seegmiller, B. Artificial Intelligence and the Labor Market; Originally NBER Working Paper 33509; NBER: Cambridge, MA, USA, 2025. [Google Scholar] [CrossRef] [Scilit]
- Brynjolfsson, E.; Li, D.; Raymond, L. Generative AI at Work. Q. J. Econ. 2025, 140, 889–942. [Google Scholar] [CrossRef] [Scilit]
- Dell’Acqua, F.; McFowland, E., III; Mollick, E.; Lifshitz, H.; Kellogg, K.C.; Rajendran, S.; Krayer, L.; Candelon, F.; Lakhani, K.R. Navigating the Jagged Technological Frontier: Field Experimental Evidence of the Effects of Artificial Intelligence on Knowledge Worker Productivity and Quality. Organ. Sci. 2026, 37, 403–423. [Google Scholar] [CrossRef] [Scilit]
- Gans, J.S.; Goldfarb, A. O-Ring Automation; NBER Working Paper 34639; NBER: Cambridge, MA, USA, 2026. [Google Scholar] [CrossRef] [Scilit]
- Autor, D.; Dorn, D. This Job Is Getting Old: Measuring Changes in Job Opportunities Using Occupational Age Structure. Am. Econ. Rev. 2009, 99, 45–51. [Google Scholar] [CrossRef] [Scilit]
- Beane, M. Shadow Learning: Building Robotic Surgical Skill When Approved Means Fail. Adm. Sci. Q. 2019, 64, 87–123. [Google Scholar] [CrossRef] [Scilit]
- Emanuel, N.; Harrington, E.; Pallais, A. The Power of Proximity to Coworkers. Q. J. Econ. 2026, 141, 1825–1870. [Google Scholar] [CrossRef] [Scilit]
- U.S. Census Bureau. Quarterly Workforce Indicators, Release R2026Q3; Private Ownership, Unadjusted State Age-by-Five-Digit-Industry Files. Available online: https://lehd.ces.census.gov/data/qwi/R2026Q3/ (accessed on 8 October 2026).
- Garicano, L. Hierarchies and the Organization of Knowledge in Production. J. Political Econ. 2000, 108, 874–904. [Google Scholar] [CrossRef] [Scilit]
- Hershbein, B.; Kahn, L.B. Do Recessions Accelerate Routine-Biased Technological Change? Evidence from Vacancy Postings. Am. Econ. Rev. 2018, 108, 1737–1772. [Google Scholar] [CrossRef] [Scilit]
- Lambert, P.J.; Schindler, Y. The Broken Ladder: AI, Remote Work, and Early-Career Hiring; Discussion Paper 2193; Centre for Economic Performance: London, UK, 2026; Available online: https://cep.lse.ac.uk/pubs/download/dp2193.pdf (accessed on 9 October 2026).
- Allen, R.C. The Hand-Loom Weaver and the Power Loom: A Schumpeterian Perspective. Eur. Rev. Econ. Hist. 2018, 22, 381–402. [Google Scholar] [CrossRef] [Scilit]

Disclaimer/Publisher’s Note: The statements, opinions and data contained in all publications are solely those of the individual author(s) and contributor(s) and not of MDPI and/or the editor(s). MDPI and/or the editor(s) disclaim responsibility for any injury to people or property resulting from any ideas, methods, instructions or products referred to in the content. |
© 2026 by the authors. Licensee MDPI, Basel, Switzerland. This article is an open access article distributed under the terms and conditions of the Creative Commons Attribution (CC BY) license.