


Abstract
Prevailing models of neurodegeneration center on amyloid- and tau, yet metabolic dysfunction precedes proteinopathy by decades. We propose compartment-specific citrate uncoupling: opposing disturbances of citrate in neurons and astrocytes as a proteinopathy-independent driver of neurodegeneration. In neurons, a Warburg-like shift depletes cytosolic citrate, which starves ATP-citrate lyase (ACLY) and erodes the H3K27ac/H3K9ac marks that sustain synaptic gene expression, while loss of citrate-mediated PFK1 inhibition collapses the SLC13A5-dependent glycolytic gate. In surviving astrocytes, loss of ACO1, with SLC13A3 a weaker and less specific accompaniment, traps newly synthesized citrate intracellularly; ACLY then hyper-activates and STAT3 hyperacetylation drives an A1 identity. The intercellular citrate gradient inverts. We reanalyzed GSE5281 (161 postmortem samples across six brain regions). Core TCA-cycle enzymes were coherently downregulated in Alzheimer’s disease in five of six regions, more strongly in women, and not in the disease-spared visual cortex. The SLC13 transporter family instead shifted in opposite directions across regions. A cell-type-resolved reanalysis of the SEA-AD multiregion atlas placed the astrocytic arm on ACO1, which fell with pseudo-progression in all nine regions tested; SLC13A3 fell across most cortical cell types and is not compartment-specific. A four-proposition framework then combines PDK1 induction, Cryo-NanoSIMS, MALDI-TIMS-MSI, and spatial transcriptomics. If the model holds, neurodegeneration reads as a routing failure of a central metabolic hub.
1. Introduction
Alzheimer’s disease and related dementias afflict about 57 million people worldwide [1], and the only approved disease-modifying therapies remain anti-amyloid [2,3]. That anchoring is no longer a record of failure alone. Lecanemab and donanemab both clear amyloid plaque and slow clinical progression in early symptomatic disease, and both are now approved [2,3]. The effects are real and partial. In TRAILBLAZER-ALZ 2, donanemab moved the integrated Alzheimer Disease Rating Scale by 3.25 points against placebo over 76 weeks in the low/medium-tau population, the stratum in which the trial’s primary analysis was pre-specified, while amyloid-related imaging abnormalities of edema or effusion appeared in 24% of treated participants [3]. Plaque clearance therefore bends the trajectory without arresting it, and what remains of that trajectory is where an upstream mechanism would have to act. Converging evidence now implicates neuroenergetic dysfunction as an early upstream event: brain 18F-FDG-PET hypometabolism is detectable in at-risk individuals who are not yet demented, including apolipoprotein E4 carriers, within a preclinical phase that can precede symptoms by two to three decades, reduced glycolytic flux tracks with the severity of amyloid and tau pathology, and apolipoprotein E4, the strongest genetic risk factor, dampens hexokinase expression and glycolytic flux in neuronal cell models [4,5]. The relationship between glycolysis and amyloid is not a simple inverse one, and the complication is worth stating: the cortical regions with the highest aerobic glycolysis in healthy young adults are also the regions where amyloid later accumulates, which has been read as a signature of the metabolic demand that makes those regions vulnerable [4]. The inverse relationship appears within established disease, not across the healthy baseline.
The Warburg effect, originally described in tumors as aerobic glycolysis in the presence of oxygen, has been invoked for the aging and degenerating brain in a specific form that we need to distinguish from ours [6,7]. In the inverse Warburg effect of Demetrius and colleagues, astrocytes up-regulate glycolysis while surviving neurons up-regulate oxidative phosphorylation, and the disease is driven by that astrocytic shift [7]. Our Axis I posits the opposite direction in the neuron: a contraction of the cytosolic citrate pool available to ACLY as glucose-derived carbon is diverted to lactate. We adopt their framing of AD as a cell-type-partitioned metabolic disorder and depart from them on which compartment carries the glycolytic shift, so the two models make opposite predictions for neuronal citrate and can be told apart by the measurements in Section 6. Post-mitotic cells, neurons included, derive roughly 88% of their energy from oxidative phosphorylation [7], so a shift of this kind acts at the branch point where pyruvate is either reduced to lactate or imported into mitochondria for the TCA cycle [8]. That shift has been read primarily as bioenergetic failure; its epigenetic consequences have received far less attention.
Here we argue that the TCA intermediate citrate is what links early metabolic dysregulation to epigenetic drift and synaptic failure. Citrate does three things at once in a neuron: it carries carbon through the TCA cycle, it supplies the cytosolic acetyl-CoA that histone acetyltransferases require, and it inhibits PFK1. Depletion compromises all three functions simultaneously. We further propose that neuronal citrate depletion and astrocytic citrate excess are mechanistically coupled consequences of a single failure of intercellular metabolic routing, which we term compartment-specific citrate uncoupling.
2. The Dual-Axis Hypothesis
Both axes below are claims about the tripartite synapse, the functional unit formed by the presynaptic terminal, the postsynaptic compartment, and the astrocytic process that ensheathes them [9]. The classical reading of that unit is electrochemical and concerns gliotransmission and transmitter clearance. Its metabolic reading, in which the astrocyte supplies the neuron with substrate on demand, is equally well established: glutamate uptake raises astrocytic glycolysis and the lactate exported from it supports neuronal oxidative metabolism and plasticity-related transcription [10]. The same interface carries the principal route of glutamate clearance: astrocytic SLC1A2 (EAAT2) and EAAT1 together clear roughly 90% of released glutamate, and the fall in astroglial glutamate uptake over the course of AD predisposes to excitotoxicity [11]; reactive astrocytes downregulate SLC1A2 along with other homeostatic transcripts [12]. Our model is complementary to that account, not an alternative to it, and the two converge on the same cell: SLC1A2 appears below among the homeostatic markers whose loss defines identity drift, so one astrocytic transition is predicted to compromise glutamate clearance and citrate routing together. This is also why Proposition 2 carries an NMDA-antagonist control (Section 6.2): the two mechanisms act on the same synapse and have to be separated experimentally. We add a second cargo to that picture. If citrate crosses the astrocyte-neuron interface, and if its concentration sets both the glycolytic tone of the terminal and the acetyl-CoA supply available to chromatin, then the tripartite synapse is also a metabolic-epigenetic unit, and a routing failure inside it should appear simultaneously as synaptic fatigue on the neuronal side and identity drift on the astrocytic side. Axis I describes the first, Axis II the second, and Section 2.3 treats the two as one circuit.
2.1. Axis I: The Neuronal Epigenetic Starvation Cascade
In oxidatively healthy neurons, mitochondria produce citrate in abundance via citrate synthase, and the mitochondrial citrate carrier SLC25A1 exports a fraction to the cytosol. Cytosolic ACLY cleaves citrate to oxaloacetate and acetyl-CoA, the latter serving as the obligate carbon donor for histone acetyltransferases (HATs) such as p300/CBP [13,14]. This citrate-ACLY-acetyl-CoA axis supplies the acetyl groups for active chromatin at synaptic loci. The link from acetyltransferase activity to synaptic gene expression has direct support: knocking down EP300 and CBP in human iPSC-derived neurons lowers H3K27ac, and CBP knockdown reduces expression of the vesicular glutamate transporter SLC17A7 [15], and the acyl-mark census in AD tissue shows that several acetylation-adjacent marks track metabolite availability [16]. The enhancer-level and H3K9ac components of the picture, and the specific dependence of glutamate receptor genes such as GRIA3, are extrapolations we make, not findings we can cite; mapping them is part of Proposition 1.
We use Warburg-like in a restricted sense, because the tumor analogy misleads if taken whole. We mean one feature only: a fraction of glucose-derived pyruvate is diverted to lactate instead of entering the TCA cycle even though oxygen is available, and the cytosolic citrate available to ACLY contracts as a result. We do not mean the rest of the tumor phenotype. Aerobic glycolysis in cancer serves anabolic growth and is accompanied by increased glucose uptake, and the point of citrate export there is to supply lipogenesis for a dividing cell. A post-mitotic neuron is not dividing, glucose uptake in AD cortex falls instead of rising, and the citrate that ACLY cleaves is used for acetylation, not for membrane synthesis. The disanalogy matters to the model: in a tumor the shift increases cytosolic acetyl-CoA supply, whereas here it is predicted to reduce it. The two share only the uncoupling of glycolysis from mitochondrial oxidation.
We hypothesize that such a shift in neurons, whether triggered by mitochondrial stress, early tau phosphorylation, or ApoE4-driven hexokinase downregulation, redirects glucose-derived carbon toward lactate and contracts the cytosolic citrate pool. The strongest available human test of this step supports where we place the shift and challenges what we claim follows from it. In neurons directly converted from fibroblasts of patients with sporadic AD, which retain age-associated signatures that reprogramming through an iPSC stage erases, PKM2 displaces PKM1 and drives a Warburg-like glycolytic reprogramming, with increased glucose uptake and lactate output [17]. The shift is therefore neuronal, which is the compartment Axis I assigns it to and the point on which we part company with the inverse Warburg effect [7]. The same study, however, traced 13C6-glucose and found flux to citrate stable, alongside unchanged total TCA-cycle metabolite levels, mitochondrial membrane potential, ATP/ADP ratio and respiration, concluding that the increased lactate production did not occur at the cost of TCA-cycle function [17]. Axis I as stated predicts a contraction of citrate production, and in that model it is not observed. Three features of the experiment bound how far the negative result carries, and we offer them as qualifications, not as rebuttals. The measurement is of glucose-derived label and of total metabolite pools, not of the free cytosolic pool, a small fraction of whole-cell citrate (about 75 µM free against 0.1–0.5 mM total, much of it mitochondrial) [18], which is the pool ACLY draws on. The neurons are monocultures, so the astrocyte-supplied extracellular citrate on which we argue human neurons depend (Section 2.1) is absent from both arms. And the cells are held in abundant glucose, not in the hypometabolic cortex that motivates the model. Proposition 1 should accordingly be read as asking whether a cytosolic, ACLY-accessible citrate deficit can arise without the global TCA contraction that this study excludes. Diverting pyruvate to lactate also lowers mitochondrial NADH delivery and consumes cytosolic NADH at lactate dehydrogenase, so the glycolytic shift is expected to arrive together with a change in cytosolic redox state; patient-derived AD neurons do show reduced NAD+, which those authors read as supporting the move to aerobic glycolysis [17]. We measured no redox variable here, and treat the connection to the oxidative-stress literature on AD as a prediction of the model. Free cytosolic citrate in mouse hippocampal dentate granule neurons has now been estimated at roughly 75 μM at rest by calibrated lifetime imaging of a genetically encoded sensor [18]. ACLY is not a Michaelian consumer of that pool: its citrate dependence is reported as sigmoidal with negative cooperativity in the unphosphorylated enzyme and hyperbolic once phosphorylated by cAMP-dependent protein kinase [19], so the enzyme is subject to homotropic allosteric control by its own substrate and its output tracks citrate supply instead of being buffered against it. A cytosolic citrate deficit should therefore translate into reduced nuclear acetyl-CoA and erosion of H3K27ac and H3K9ac at synaptic loci. We do not claim that 75 μM sits below a particular saturation point: the sensor reports free citrate whereas enzyme kinetics are measured as total citrate in magnesium-containing buffers, and the two numbers are not directly comparable. We term this process epigenetic starvation (Figure 1, left panel).
Figure 1.
The Dual-Axis Compartment-Specific Citrate Uncoupling Model. In the healthy state (top), neurons sustain active TCA flux and export citrate to the cytosol for ACLY-dependent histone acetylation and presynaptic PFK1 braking, while homeostatic Astro 2 astrocytes process citrate via ACO1 and hold up the extracellular pool through SLC13A3 and ANKH. In the disease state (second row), neuronal Warburg-type reprogramming depletes cytosolic citrate (left), which erodes H3K27ac at synaptic enhancers and collapses the SLC13A5-PFK1 glycolytic gate. On the other side (right), disease-associated loss of SLC13A3, ACO1, and ANKH traps newly synthesized citrate inside surviving Astro 2 astrocytes, hyper-activates ACLY, and drives STAT3 hyperacetylation toward a reactive A1 identity. The direction of the ANKH change in human astrocytes is unresolved and is marked with a question mark (Section 3.5). Together, these two compartmental failures invert the physiological intercellular citrate gradient (center), which couples synaptic bioenergetic exhaustion to glial identity drift in a self-reinforcing cycle.
The SLC13A5 Presynaptic Glycolytic Gate
Citrate acts as an allosteric inhibitor of phosphofructokinase, the rate-limiting enzyme of glycolysis. The in vitro values for uncomplexed citrate are reported to span 20 to 100 μM [18]. That range overlaps the concentration now measured in neurons, which is what makes the brake physiologically plausible. Using lifetime-readout citrate biosensors and two-photon imaging in acute mouse slices, Rosen et al. found that free cytosolic citrate sits at around 75 μM at rest and falls two- to three-fold within seconds of depolarization, recovering over minutes, with the dip attenuated when the mitochondrial calcium uniporter is depleted [18]. Neuronal activity therefore relieves a citrate brake on glycolysis on the timescale that synaptic transmission requires. Those authors are careful that free citrate has not been shown formally to inhibit mammalian phosphofructokinases and that citrate is one allosteric effector among several, and we adopt the same caution.
Where the citrate for that brake comes from is less settled. In rodent brain, SLC13A5 transcript is present in cortical, cerebellar and olfactory neurons, but there are no published reports of NaCT protein in human neurons or brain tissue [20], so presynaptic localization of the transporter is an assumption of this model and not an established fact. Neither is the specific burst physiology we invoke below: the synchronized fructose-1,6-bisphosphate and ATP transients at 10–40 Hz are the prediction Proposition 2 tests, not a result we are citing. What is established is that free cytosolic citrate in neurons falls transiently when they are activated, which those authors attribute to mitochondrial consumption and reduced export, not to a measured flux [18], and that SLC13A5 is a sodium-coupled citrate transporter expressed in brain [20,21].
In citrate-depleted Warburg-shifted neurons, the PFK1 brake is chronically absent. Basal glycolysis runs at an elevated rate but loses the dynamic range to mount a synchronized burst. Terminals stimulated at physiological frequencies cannot replenish ATP, leading to rapid bioenergetic exhaustion and vesicle recycling failure. In the human middle temporal gyrus, single-nucleus data show SLC13A5 expression concentrated in astrocytes with near-absent neuronal detection [22], in contrast to the canonical rodent picture of a neuronal citrate transporter [20], though human neuronal expression has not been ruled out. If human terminals do depend on astrocyte-supplied citrate, that dependence would be a vulnerability specific to human cortex, and Proposition 2 is designed to test it.
2.2. Axis II: The Astrocytic Citrate Trapping and Identity Drift
Astrocytes in the Seattle Alzheimer’s Disease Brain Cell Atlas (SEA-AD) middle temporal gyrus cohort [23] lose expression of two citrate-handling genes with pseudo-progression: SLC13A3 (encoding the dicarboxylate importer NaDC3) and ACO1 (cytosolic aconitase 1) [22]. The supertype structure of that loss matters for the mechanism, and it is not what a simple reading would suggest. Within MTG astrocytes, SLC13A3 and ACO1 are most highly expressed in Astro 3, the A1-like reactive supertype, whose relative proportion falls as pathology advances (), while the more homeostatic Astro 2, which carries most SLC13A5 expression, rises in relative proportion (). Most of the cohort-level decline in the two genes reflects that contraction [22]; a decline within surviving supertypes is the component the model needs, and we test it directly in Section 4.2. We propose that the within-cell co-downregulation of these two genes creates a cellular metabolic dead-end (Figure 1, right panel):
- SLC13A3 loss reduces import of extracellular dicarboxylates (malate, succinate), depriving the astrocyte of anaplerotic substrates. As a compensatory response, pyruvate carboxylase upregulation drives de novo citrate synthesis from glucose.
- ACO1 loss removes the enzymatic gateway from citrate to isocitrate in the cytosol, physically trapping newly synthesized citrate and blocking its onward metabolism.
- ANKH downregulation in aged brain tissue (observed in mouse liver and brain alongside increased senescence markers [24]) would further reduce plasma-membrane citrate export, compounding intracellular accumulation.
We propose that the resulting intracellular citrate surplus hyper-activates ACLY and raises nuclear acetyl-CoA, which in turn supports p300-mediated hyper-acetylation of STAT3 (Ac-STAT3) and so drives the reactive transcriptional program. This chain is the conjecture of the present work and not a reported finding: we are aware of no study that demonstrates a citrate-dependent increase in STAT3 acetylation in astrocytes, and Proposition 4 (Section 6.4) exists to test it. The literature establishes the endpoint, not the mechanism. Reactive astrocytes of the A1 type up-regulate complement C3 and are induced by IL-1, TNF and C1q [25], and reactive transitions in AD are accompanied by loss of homeostatic function [11,12]. The marker set we use as a readout in Proposition 4 (C3, CD44, SERPINA3 as reactive; GLUL, SLC1A2, KCNJ10 as homeostatic) is assembled from the astrocyte-state literature as a whole, and only C3 has been validated as a direct Ac-STAT3 target.
2.3. The Inverted Intercellular Citrate Gradient
The two axes together invert the physiological intercellular citrate gradient. Under homeostatic conditions, astrocytes sustain a positive extracellular citrate gradient that feeds neuronal SLC13A5 import and maintains the PFK1 brake (Figure 1). In disease, astrocytic citrate trapping depletes the interstitial pool while neuronal depletion amplifies the cytosolic deficit. This gradient inversion is self-reinforcing: reduced extracellular citrate further reduces neuronal citrate import, accelerating epigenetic starvation, which in turn impairs neuronal signaling of astrocyte support functions.
The hypothesis predicts measurable consequences in human postmortem tissue: (i) elevated intracellular citrate in reactive astrocytes; (ii) depleted interstitial citrate in AD-vulnerable cortical layers; (iii) spatial colocalization of high astrocytic citrate with within-cell erosion of ACO1; and (iv) lower H3K27ac at synaptic enhancers in neurons located in high-pathology regions. The mechanistic architecture of the full Dual-Axis Model is depicted in Figure 1.
3. Supporting Evidence from the Literature
3.1. Citrate as an Immunometabolic and Epigenetic Hub
Citrate’s signaling role beyond TCA-cycle energetics was worked out first in immune cells: in activated macrophages, mitochondrial citrate export supplies acetyl-CoA for fatty-acid synthesis, and blocking that export reduces nitric oxide, reactive oxygen species and prostaglandin E2 output; those authors are explicit that a direct link between citrate-derived acetylation and activation has not yet been made in these cells [26]. In neurons and glia, the same ACLY-acetyl-CoA axis scales histone acetylation to nutrient supply [13,14]. One qualification bears on how much weight the citrate-ACLY route can carry. In hippocampal neurons, acetyl-CoA derived from ACSS2 contributes substantially more to histone acetylation than acetyl-CoA derived from ACLY [13]. Axis I therefore does not claim that ACLY is the dominant source of neuronal acetyl-CoA; it claims that the ACLY-derived fraction is the citrate-sensitive one, which is why Proposition 1 inhibits ACSS2 to isolate it. ACLY is also regulated by SIRT6, which ties NAD+ metabolism to ACLY-dependent chromatin states: loss of SIRT6 elevates nuclear and chromatin-bound ACLY, raises nuclear acetyl-CoA and increases acetylation at migration-associated loci [14]. The effect reported there is transcriptional and post-transcriptional; direct deacetylation of ACLY by SIRT6 was raised as a possibility, not tested [14]. It is an oncological parallel to the ACLY-STAT3 axis we propose for reactive astrocytes.
3.2. Epigenetic Erosion in Alzheimer’s Disease
Histone modifications shift with normal brain aging, including a fall in H3K27ac in aged mouse hippocampus, and the AD brain additionally shows increased repressive H3K9 methylation through EHMT1 [27]. Histone acetylation in the AD brain is widely discussed as reduced, and reviews of the field collect gene-specific reports of hypoacetylation. The evidence is not uniform and we do not present it as settled: the same reviews note increased H3 and H4 acetylation in temporal gyrus in at least one postmortem series, and report increases in some postmortem series and decreases in others [28,29]. Nor is the reported hypoacetylation specifically enhancer-mapped. Our own position is that the direction of the acetylation change is an open question that a metabolic model should predict, not assume, which is what Proposition 1 does.
Acetylation level does appear to be functionally consequential. In an iPSC model of familial AD carrying an APP duplication, knockdown of the acetyltransferases EP300 and CBP reduced H3K27ac, measured by western blot, and, for CBP knockdown, lowered expression of the vesicular glutamate transporter SLC17A7; the authors state explicitly that they did not establish whether baseline H3K27ac differs between APP duplication and control neurons [15]. A recent census of histone modifications in AD tissue identifies crotonylation, succinylation, and lactoylation as additional acyl marks dysregulated in a metabolite-availability-dependent manner [16], consistent with a primary metabolic and not a purely enzymatic etiology. Genome architecture is also dysregulated in aging and in AD [28]; how early that reorganization begins relative to clinical onset has not been established.
3.3. SLC13A5, Citrate Transport, and Neuronal Vulnerability
SLC13A5 (NaCT) is the citrate-preferring member of the SLC13 family of sodium-coupled di- and tricarboxylate transporters, and imports extracellular citrate against its intracellular gradient [20,21]. Its relatives SLC13A2 and SLC13A3 are also sodium-coupled and differ in substrate preference, not in mechanism [21]. Biallelic loss-of-function mutations cause SLC13A5 deficiency, the developmental and epileptic encephalopathy formerly designated EIEE25, a severe neonatal disorder with seizures and intellectual disability [20,30]. Neuronal citrate import is therefore essential for normal brain function. Metabolomic analysis of Slc13a5−/− mice shows perturbed energy, lipid, and bile acid metabolism, with a liver–brain axis governing citrate homeostasis across compartments [30]. In hepatocytes and rodent liver, xenobiotic receptors (PXR, AhR) and hormonal signals regulate SLC13A5 transcription [21]. Whether the same regulation operates in brain has not been shown, so this is a candidate route by which environmental and metabolic stressors might reduce neuronal citrate import.
3.4. Astrocyte Heterogeneity and Reactive Transitions
Single-nucleus transcriptomics of the human AD brain has moved beyond the binary reactive/homeostatic dichotomy to define discrete astrocyte sub-states with different vulnerabilities and functional signatures [12,23]. Reactive astrocytes, originally characterized as “A1” astrocytes induced by microglial IL-1, TNF, and C1q, lose the ability to support neuronal survival, synaptogenesis, and phagocytosis, and secrete a neurotoxic factor [25]. Supertype-resolved analysis of the SEA-AD middle temporal gyrus data places the loss of SLC13A3 and ACO1 expression inside this cell-state transition: the transporter is most highly expressed in the A1-like Astro 3 supertype, which is depleted as pathology advances, and declines further within the supertypes that persist [22]. Part of what looked like a failure of metabolic housekeeping is a change in which astrocytes are present. The epigenetic machinery governing astrocyte identity during astrogliogenesis involves STAT3, NFI family members and histone acetylation [31], which makes an acetyl-CoA-dependent effector plausible; that work does not address ACLY, so the specific ACLY-STAT3 link remains ours to demonstrate.
3.5. ANKH as a Citrate Efflux Route
James et al. propose ANKH as a candidate astrocytic citrate exporter, based on its increased expression in senescent human astrocytes in vitro, but note that astrocytic Ank has not been shown to supply extracellular citrate to neurons [24]. ANKH expression is regulated by telomere dysfunction, p38 MAPK, TGF-, and p53 (all canonical senescence and inflammatory signaling pathways), and is downregulated in aged mouse brain and liver concurrent with elevated senescence markers [24]. This finding predicts that aging-associated ANKH downregulation in astrocytes would reduce citrate efflux, compounding the ACO1-mediated trapping. The direction of that regulation is not consistent across levels of observation, and the inconsistency constrains any therapeutic reading of it. ANKH transcript and protein are raised in senescent fibroblasts, where the transporter is what carries citrate out of the cell, whereas Ank is lowered in aged mouse liver and brain [24]. High ANKH is thus a feature of the senescent cell and low ANKH a feature of the aged tissue. Which of the two describes a reactive or a surviving astrocyte in human AD cortex has not been determined, so the gradient-restoring reading we adopt for Figure 1 is one of two possibilities.
4. Materials and Methods
Two independent public datasets were reanalyzed, one laser capture microscopy array of microdissected neurons and one single-nucleus atlas. They answer different questions and carry distinct limitations, so their methods are given separately.
4.1. Transcriptional Reanalysis of GSE5281
To test whether the citrate-uncoupling hypothesis finds support beyond the single-nucleus SEA-AD atlas cited above, we reanalyzed GSE5281 [32], a publicly available Affymetrix HG-U133 Plus 2.0 microarray series whose deposited records comprise 161 postmortem brain samples (87 Alzheimer’s disease, 74 control) spanning six regions of differential AD vulnerability: entorhinal cortex (EC), hippocampus (HIP), middle temporal gyrus (MTG), posterior cingulate (PC), superior frontal gyrus (SFG), and primary visual cortex (VCX, a regional control largely spared in AD). The six-region design, the laser-capture protocol and the selection of histopathologically normal neurons are those of the reference data set published by Liang et al. in Physiological Genomics [32]; the companion PNAS paper [33] is the targeted analysis of the same cohort, reporting reduced expression of nuclear-encoded electron transport chain subunits, most extensively in posterior cingulate. GSE5281 is therefore not a bulk-tissue dataset: the profiled material is laser-capture microdissected, non-tangle-bearing cortical neurons from each region, so the transcriptional signal is neuronal by construction and is not produced by astrogliosis or by a shift in the glia-to-neuron ratio [32]. Two caveats follow from that design. Laser capture does not yield perfectly pure neuronal material, so a minor glial contribution cannot be excluded. More importantly, the captured cells were selected as non-tangle-bearing, which makes the comparison one between surviving, relatively spared neurons in AD brain and neurons in control brain: a survivorship-biased contrast that strengthens any claim about metabolic repression in neurons that have not yet degenerated, and weakens any inference about the neurons that were lost. A third consequence constrains the scope of this dataset: because GSE5281 contains neurons, it can bear on Axis I and cannot test the astrocytic predictions of Axis II at all. Those are tested separately in Section 5.5.
Expression values and sample metadata were retrieved from the Gene Expression Omnibus accession GSE5281 with GEOquery [34]. The series matrix was taken as deposited, that is, already normalized by the original submitters; we performed no renormalization, no background correction and no reprocessing from CEL files. The deposited values are not on a logarithmic scale, so we applied a transformation before fitting, which is the transformation GEO2R applies automatically when it detects non-log data.
The 161 samples do not come from 161 independent donors. The published design draws them from 34 donors with AD and 14 elderly controls, with several regions sampled per brain. Also, not every donor contributed every region after QC [32]. The series matrix carries no donor identifier, so donor membership cannot be recovered from the deposited data; using sex, age and diagnosis as a proxy, the samples resolve into approximately 43 groupings, 31 of which appear in more than one region, which is consistent with that design. The whole-cohort contrast and the two sex contrasts therefore contain repeated measures from the same donors, so their standard errors are too small and their p values are anticonservative; we read those strata as hypothesis-generating, not confirmatory. The six region-level contrasts are unaffected, because each donor contributes at most one sample to a given region, and the regional claims of this paper rest on those. We retained the two-group model rather than fitting a mixed model for two reasons: the donor identifiers a random effect would require are not in the deposited metadata, and the two-group model is what GEO2R applies, which keeps our output comparable to the independent exports used for validation in Table S4. We defined 15 strata in advance: the full cohort; each of the six regions; each sex across all regions; and each sex within the three most AD-affected regions (EC, HIP, MTG). Sex stratification within region was confined to those three because the other three regions cannot support it: PC, SFG, and VCX contribute 9–23 AD and 11–13 control samples each, and splitting those by sex leaves cells too small for a stable moderated t statistic. The twelve possible region × sex combinations were therefore not all run. We report all six that were, including the ones that returned nothing (Section 5.3). For each stratum, differential expression between AD and control was estimated with limma [35] using a two-group model (AD − Control), which matches the statistical approach underlying NCBI’s GEO2R tool. Two distinct criteria are used in this paper and we distinguish them explicitly. For pathway enrichment, gene lists were filtered at adj. and (Benjamini–Hochberg correction) before submission to Enrichr. For the pre-specified citrate-axis panel reported in Section 5.1 and Section 5.4 and plotted in Figure 2, no fold-change filter was applied: every panel gene is reported with its own log2FC and adjusted p value, and significance is assessed at adj. alone. This is why genes such as ACLY () and ACO1 () are reported despite not passing a screen. The full unfiltered panel is Table S2. The gene list for each stratum was queried programmatically against KEGG_2026, Reactome_Pathways_2024, and GO_Biological_Process_2026 via the Enrichr API [36] using the enrichR R interface. A pathway was classified as significant at adj., trend-level at adj.p 0.05–0.15, and non-significant above 0.15. We treated a finding as reliable only when it replicated across at least two of the three independently curated databases. We report sample sizes per arm throughout, since the smaller arm governs power in a two-group contrast. Arm sizes ran from 3 controls (EC×female, HIP×female) to 87 AD and 74 controls in the full cohort; the six region-only strata carry 9–23 AD and 11–13 controls each. The two strata with fewer than four controls (EC×female, HIP×female) meet the underpowered criterion set in the analysis protocol; we report them for completeness and draw no inference from them. Fourteen of the fifteen strata have an independently produced NCBI GEO2R export, and we compared each against the corresponding pipeline output across all 54,675 probes. Thirteen of those exports are analyzable; eleven of them agree with the pipeline at on both log2FC and the moderated t-statistic, and the two that retain only three to four significant figures agree at (HIP) and (EC), with residuals of the size that rounding alone produces. The pipeline therefore reproduces the model GEO2R uses. Table S4 gives the comparison stratum by stratum. The R scripts that produce every contrast reported here, and the derived result tables they generate, are included as Supplementary Materials (File S1, Tables S1–S3).
Figure 2.
Citrate-axis gene expression across GSE5281 brain regions. fold change (Alzheimer’s disease vs. control) for 18 citrate-axis genes across the six GSE5281 regions (region-only contrasts, per arm). Asterisks mark adj. within that region’s own contrast. Core TCA-cycle enzymes (bottom rows) are mostly downregulated in AD. The citrate/dicarboxylate transporters (top rows) either trend upward or move in different directions in different regions. No citrate-axis gene changes significantly in the disease-spared primary visual cortex (VCX).
4.2. Cell-Type-Resolved Reanalysis of SEA-AD Multiregion Data
GSE5281 profiles neurons and therefore cannot test the astrocytic arm of the model, and the single-nucleus evidence we cited for that arm came from one published cohort in two regions. We therefore ran a second, cell-type-resolved reanalysis.
Data. The Seattle Alzheimer’s Disease Brain Cell Atlas (SEA-AD) was first released as an integrated multimodal atlas of middle temporal gyrus [23] and has since been extended to ten neocortical and allocortical regions, profiling approximately seven million nuclei from 84 donors [37,38]. The extension also defines the quantity we use as the exposure: a continuous pseudo-progression score (CPS) computed per region from region-specific quantitative neuropathology, which orders donors along a pathological continuum instead of assigning them to diagnostic groups. We used the local score (CPS_Local), not the whole-brain score, since the hypothesis concerns regional vulnerability.
Donor coverage is not uniform. Medial entorhinal cortex, middle temporal gyrus and prefrontal cortex (Brodmann area 9, reported here as DFC) were profiled in all 84 donors; the remaining regions were profiled in a 43-donor subset selected to exclude severe common comorbidities [37]; the neuropathological variables the release records for that screening are Lewy body disease stage, LATE (TDP-43) stage, and the cerebrovascular measures of arteriolosclerosis, atherosclerosis, cerebral amyloid angiopathy and microinfarct count. We analyzed the per-subclass pseudobulk objects for astrocytes and for entorhinal and hippocampal excitatory neurons (subclasses Astrocyte, EC-IT, DG, CA2–4 and Sub-CA1), which yielded nine regions with usable coverage of the panel. The regional extension is described in a preprint [37]; the data release itself is public, and the accessed version is recorded in the script header.
Unit of replication. The donor. Pseudobulk expression was taken per donor × region × supertype, so the n reported throughout is a donor count and the nested structure of nuclei within donors cannot inflate it. This is the same pseudoreplication problem that constrains the GSE5281 contrasts (Section 4.1). The two reanalyses are therefore not replicates of one another, and we do not present them as such. GSE5281 contrasts diagnostic groups across region samples with repeated donors; SEA-AD correlates donor-level pseudobulk against a continuous pathological score. They differ in unit of replication, in exposure variable and in cell-type resolution, so neither validates the other and a discrepancy between them is not evidence against either. What can be compared across the two is the direction of effect for a given gene in a given compartment, and that is the only comparison we draw.
Gene panel and tests. A 26-gene citrate panel, overlapping the 21-gene GSE5281 panel in 16 genes and extending it where the single-nucleus data support more of the cycle, with SLC13A3 and ACO1 pre-specified as the Axis II test pair. Association with CPS was measured by Spearman correlation of donor pseudobulk expression against the donor’s local score, separately for every region × supertype × gene combination. Spearman rather than Pearson because CPS is an ordering of donors by pathology, not a calibrated interval scale.
Quality control and multiplicity. Pseudobulk samples assembled from fewer than ten nuclei were discarded before testing, and any region × cell type retaining fewer than eight donors was skipped; together these removed roughly a quarter of the candidate rows. Benjamini–Hochberg correction was applied within region, which is the scope at which the panel constitutes one family of tests. Significance is throughout; nominal p values are also given in Table S5 so that readers who prefer a different correction scope can apply one. The analysis was implemented in R, reading the HDF5-backed pseudobulk objects directly; the script is File S2 and the full output is Table S5 (1774 rows after quality control, covering nine regions and 22 supertypes).
5. Results: Transcriptional Evidence
No metabolite was measured in this work. GSE5281 reports transcript abundance, and every statement in this section concerns transcripts. Transcript abundance constrains neither steady-state concentration nor flux, both of which are set by enzyme activity, substrate supply and compartmentalization. The citrate concentrations and the intercellular gradient the model predicts are untested here; Propositions 1 and 3 (Section 6) exist to measure them.
5.1. Coherent, Multi-Region Downregulation of Core TCA-Cycle Enzymes
Across the full GSE5281 cohort, genes encoding the oxidative core of the TCA cycle were consistently and significantly downregulated in AD: ACLY (log2FC , adj.), ACO1 (, adj.), ACO2 (, adj.), citrate synthase CS (, adj.), all three isocitrate dehydrogenase subunits IDH3A/B/G (adj. each), malate dehydrogenases MDH1/MDH2 (adj. each), PDHB (, adj.), and succinate dehydrogenase subunits SDHA/SDHB (adj. each). This pattern replicated independently in both sexes analyzed separately and in five of the six individual regions (EC, HIP, MTG, PC, SFG; Figure 2); no citrate-axis gene reached significance in VCX, the region-matched control least affected by AD pathology; that argues against a generic postmortem-handling artifact.
At the pathway level, KEGG’s Citrate Cycle (TCA Cycle) term was significantly enriched in the full cohort (9/30 overlap, adj.). Reactome’s Citric Acid Cycle (adj.) and GO’s Tricarboxylic Acid Cycle (adj.) corroborated this independently, so all three databases agree. The strongest citrate-axis signal in the full cohort was the Malate-Aspartate Shuttle, with 8 of its 9 pathway genes present (Reactome adj.; GO adj., same gene overlap). This points to a wider disruption of the neuronal mitochondrial redox and carbon shuttling that feeds the citrate pool. Because that shuttle is what sets the cytosolic NAD+/NADH ratio, its coordinated transcriptional loss places the cytosolic citrate deficit of Axis I alongside a redox disturbance, which is where this model meets the oxidative-stress literature on AD. We measured neither redox couples nor oxidative-damage markers, so the link is a prediction and not an observation. KEGG’s Alzheimer Disease pathway gave the single strongest enrichment in the cohort (adj.), so the filtered gene list does capture AD-relevant transcriptional change. The companion publication on this cohort reported reduced expression of nuclear-encoded electron transport chain genes, most extensively in posterior cingulate [33]; our results extend that observation from the electron transport chain to the citrate-handling enzymes upstream of it. The regional ordering is not the same, however: our strongest convergent pathway signal is in superior frontal gyrus (Section 5.3), so the two analyses agree on the direction of the change and not on where it is steepest.
5.2. A Female-Predominant Citrate/TCA Signal
Stratifying by sex revealed a marked asymmetry. In women, the TCA-cycle/citrate pathway signal was stronger than in the combined cohort across all three databases (KEGG adj.; Reactome adj.; GO adj., combined score 77.6 vs. 36.0 in the full cohort). In men, the same three pathways failed to reach significance in any database (adj.–). We have found no prior report of this sex asymmetry in citrate-pathway transcription in AD. We offer it as a hypothesis to be tested, and we cannot yet explain the mechanism behind it.
5.3. Regional Heterogeneity
Among individual regions, SFG showed the strongest convergent pathway signal (Reactome adj.; GO adj.; KEGG non-significant) and HIP showed a KEGG-level trend (adj.). EC, MTG, PC, and VCX showed no pathway-level enrichment, even though individual TCA-enzyme genes did reach significance in EC, MTG, and PC. Disruption is therefore diffuse, with a few regional hot-spots, which fits a broad and not a focal disturbance of citrate handling in AD cortex.
Within the three regions we stratified by sex, the result is largely negative. Only MTG×male produced a citrate-axis pathway signal: the Malate-Aspartate Shuttle reached significance in both Reactome (adj.) and GO (adj.), with KEGG’s Citrate Cycle at trend level (adj.). EC×male and HIP×male returned no citrate-axis term below adj. in any of the three databases. The three female region strata (EC×female, HIP×female, MTG×female) returned no citrate-axis pathway term at all; their only matches of any kind were two trend-level fatty-acid terms in HIP×female, each resting on a single gene. This follows from arm sizes of only three to six. The female-predominant signal of Section 5.2 therefore does not resolve at the level of individual regions in this cohort, and readers should not take the whole-cohort sex asymmetry as evidence that any particular region drives it.
5.4. The SLC13 Transporter Family Shows a Mixed, Region-Specific Pattern
Unlike the coherently downregulated oxidative enzymes, the SLC13 citrate/dicarboxylate transporter family showed no single consistent direction (Figure 3). SLC13A3 was significantly upregulated in the full cohort (, adj.), in women alone (, adj.), in EC (, adj.), and in MTG×male (, adj.), but significantly downregulated in HIP (, adj.) and MTG combined (, adj.). SLC13A4 was upregulated wherever it reached significance (full cohort, women, HIP, PC; all adj.), and was never significantly downregulated. SLC13A1 reached significance in one stratum only, an increase in posterior cingulate (, adj.), and SLC13A2 in none. SLC13A5 trended upward in the full cohort (, adj.) but reached significance in no stratum; its strongest result anywhere was adj. in women (Table S2). That is the expected result: human neurons do not appear to constitutively express SLC13A5, which is more prevalent in astrocytes [22], and GSE5281 profiles neurons. No individual SLC13 gene passed the fold-change threshold at a level that drove SLC-mediated transport pathway enrichment in any stratum. These data therefore show a region-dependent shift in both directions.
Figure 3.
SLC13 citrate/dicarboxylate transporter family across GSE5281 brain regions. log2FC (AD vs. control) for each SLC13 paralog in each region-only contrast; red bars indicate adj.. SLC13A3 is significantly upregulated in EC yet significantly downregulated in HIP and MTG, so the family does not shift in one direction across the brain.
The SLC13A3 result needs care, and the design of the dataset settles what it can mean. Axis II (Section 2.2) is a claim about reactive astrocytes; GSE5281 contains microdissected neurons. The signal reported here is therefore a neuronal measurement, and it neither supports nor contradicts an astrocytic prediction. What it does show is that neuronal SLC13A3 moves in different directions in different regions: up in the full cohort, in women, in EC and in MTG×male, down in HIP, in MTG combined and in HIP×male (, adj.). Our model does not explain the regional increases, and we report them as an open observation. Section 5.5 tests both the astrocytic prediction and the entorhinal increase directly, in cell-type-resolved data.
Figure 2 and Figure 3 summarize the citrate-axis gene panel across regions. The complete 15-stratum results are in Tables S2 (gene level) and S3 (pathway level), and the code that produced them is in File S1.
5.5. A Cell-Type-Resolved Test of Axis II in SEA-AD
The second reanalysis tests Axis II in cell-type-resolved data, with the donor as the unit of replication and local pseudo-progression as the exposure (Section 4.2). Full results are Table S5.
Axis II is supported, and ACO1 carries it. In the homeostatic Astro 2 supertype, ACO1 declines with pseudo-progression in all nine regions tested, and survives correction in the three with full donor coverage: MTG (, , ), DFC (, , ) and MEC (, , ). Nine negative coefficients from nine regions is itself unlikely under the null (sign test ). SLC13A3 is the weaker partner: also negative in all nine regions, but surviving correction in MTG alone (, ). Since SLC13A3 declines across most cortical cell types instead of selectively in astrocytes, we now attribute the astrocytic arm of the model to ACO1 and treat SLC13A3 as a weak, largely non-specific accompaniment. Astrocytic ACLY transcript does not change with pseudo-progression in any region; Axis II predicts ACLY hyper-activation, which is a claim about flux, not transcript, so these data neither support nor refute it.
The entorhinal increase is not reproduced. The regional SLC13A3 increase that GSE5281 reports in entorhinal cortex (Section 5.4) does not survive cell-type resolution. In MEC, all seven entorhinal neuronal types passing quality control are negative and none is positive, three significantly: ParaS_1 (, ), ParaS_2 (, ) and EC IT_2 (, ). Three explanations of the discordance remain open and we do not choose between them. The 2007 array may behave idiosyncratically at the SLC13A3 probe set; the two measurements may not address the same cells, since laser-captured entorhinal pyramidal neurons are not the EC-IT and ParaS subclasses resolved here; and the two contrasts estimate different quantities, a binary AD-versus-control difference against a continuous association with local pathology. A probe-level defect alone would be unlikely to produce a shift of this size in a single direction, so we record the discordance as unresolved.
What this analysis cannot do. Only MTG, DFC and MEC were profiled in the full cohort; six of the nine regions we analyzed carry 40 to 43 donors against 80 to 84 in those three [37]. Outside the three a non-significant result likely reflects low power, and we draw no negative conclusions from them.
6. Experimental Validation Framework
We propose a four-proposition experimental framework (Figure 4) with pre-specified falsification criteria for each mechanistic claim.
Figure 4.
Proposed four-phase experimental validation pipeline. Phase 1: PDK1-mediated Warburg induction in primary rodent and iPSC-derived neurons establishes whether citrate depletion causes H3K27ac loss at synaptic enhancers, with triethyl citrate and ACSS2 inhibitor controls. Phase 2: Presynaptic bioenergetic measurements using multiplexed optical sensors (GCaMP8, iATPSnFR2, synapto-Hylight) at physiological firing rates test the SLC13A5-PFK1 glycolytic gate. Phase 3: CRISPRi-mediated ACO1/SLC13A3 knockdown in iPSC astrocytes, coupled with 13C-citrate tracing and Cryo-NanoSIMS, validates the astrocytic citrate trapping mechanism. Phase 4: Co-registration of MALDI-TIMS-MSI (metabolomics) with Xenium spatial transcriptomics in human postmortem middle temporal gyrus tests the inverted intercellular gradient directly in tissue. Diamond nodes indicate pre-specified binary falsification readouts. The solid arrow marks the one genuine dependency, since Phase 4 co-registers the metabolite maps Phase 3 generates; dashed arrows mark methodological continuity only. Each phase is interpretable on its own and a negative result in one does not cancel the others (Section 6).
The four propositions are logically independent but operationally ordered, and the distinction governs how a negative result propagates. Propositions 1 and 2 test Axis I, Propositions 3 and 4 test Axis II, and no proposition needs a positive result from another in order to be interpretable. A negative Proposition 1 would refute the citrate dependence of the H3K27ac deficit, and with it Axis I, while leaving Proposition 3 standing, because Proposition 3 measures citrate, not acetylation, and concerns the astrocyte, not the neuron. The ordering drawn in Figure 4 is therefore methodological, not conditional, with one exception: Proposition 4 co-registers the metabolite maps that Proposition 3 generates and cannot be run before it. Proposition 3 is also the proposition whose failure would refute the hypothesis as a whole, since the inverted gradient is the claim from which both axes follow.
6.1. Proposition 1: Neuronal Citrate Depletion Drives Epigenetic Starvation
Model. Primary rodent cortical neurons (DIV 14–21) will be used to establish an oxidative baseline (high OCR/ECAR ratio), with isogenic human iPSC-derived neurons (APOE3 vs. APOE4) as a second-tier model. Warburg-type reprogramming will be induced by AAV-mediated overexpression of PDK1, which phosphorylates and inhibits the pyruvate dehydrogenase complex, effectively starving the TCA cycle of its primary carbon input without triggering acute bioenergetic collapse.
AAV-driven PDK1 overexpression is an artificial, acute and supraphysiological intervention; nothing in AD proceeds that way, and no PDK1 induction of that magnitude has been reported in human brain. It is used as a sufficiency test: it asks whether contracting mitochondrial pyruvate entry is enough to produce the epigenetic deficit, which is the causal claim Axis I makes. It cannot establish that this is how the deficit arises in disease. The iPSC APOE4 arm therefore carries the disease-relevant genetic cause without an engineered enzyme, and the prediction is that the two arms converge on the same citrate and acetylation phenotype. If the PDK1 arm reproduces the phenotype and the APOE4 arm does not, the mechanism is possible but not the one that operates.
Measurements. Cytosolic citrate will be monitored in real time with the single-fluorophore lifetime-readout biosensors CitA-Tq-LR and CitA-Tq-HR, which are pH-resistant, specific for free and not magnesium-complexed citrate, and bind it with dissociation constants of roughly 7 and 85 μM, respectively; both are temperature-sensitive and require calibration at the recording temperature [18]. Together they span the concentration range measured in neurons, where resting free cytosolic citrate is about 75 μM [18]. The low-affinity variant is the appropriate choice for detecting the increases predicted in astrocytes and the high-affinity variant for the neuronal decreases. H3K27ac and H3K9ac will be mapped by CUT&Tag to synaptic enhancers annotated in the ENCODE brain neuron atlas.
Falsification. If supplementation with membrane-permeant triethyl citrate rescues H3K27ac at synaptic enhancers despite maintained PDK1 expression, the epigenetic deficit is substrate-driven. The rescue must persist even when ACSS2 (the acetate-to-acetyl-CoA enzyme) is selectively inhibited, confirming specificity for the citrate-ACLY axis over the acetate bypass pathway.
6.2. Proposition 2: SLC13A5-Mediated Presynaptic Glycolytic Gating
Model. Primary rodent cortical neurons expressing endogenous SLC13A5 will be used for presynaptic bioenergetics; human iPSC-derived neurons will serve as a citrate-depleted comparator given the low neuronal SLC13A5 expression reported in human cortex.
The species difference noted in Section 2.1 dictates this design. Rodent neurons are the system in which neuronal SLC13A5 expression is best established, so they are where the existence and kinetics of the glycolytic gate can be tested most directly; a null result in human neurons with little transporter would be uninterpretable. The human arm then tests the configuration the model predicts for human brain, in which the terminal depends on citrate supplied by neighboring astrocytes instead of imported through its own transporter. Read together, the two arms separate a claim about the mechanism (rodent) from a claim about where the mechanism is vulnerable in humans (co-culture), and the second is the clinically relevant one: if human synapses are supply-dependent, astrocytic citrate trapping (Axis II) is sufficient to produce presynaptic failure without any neuronal transporter defect.
Measurements. Terminals will be identified by Synaptophysin-GCaMP and stimulated at 10–40 Hz. Presynaptic ATP dynamics will be recorded with iATPSnFR2 and glycolytic flux monitored with synapto-Hylight (FBP reporter). We predict an attenuated, asynchronous FBP/ATP burst in citrate-depleted neurons and a normal synchronized burst in controls.
Falsification. The glycolytic gate hypothesis is falsified if SLC13A5 knockdown fails to impair activity-dependent FBP bursts in wild-type neurons with normal baseline citrate. NMDA receptor antagonism (MK-801) will be included as a control to dissociate bioenergetic failure from excitotoxicity, since extracellular citrate has been reported to enhance synaptic NMDA receptor function, and NaCT activity to protect against zinc toxicity in high-citrate conditions [20].
6.3. Proposition 3: Astrocytic Citrate Trapping and Gradient Inversion
Model. iPSC-derived astrocytes will be benchmarked against the homeostatic Astro 2 phenotype as that supertype is actually described in the middle temporal gyrus cohort, by low C3 and CD44 prevalence (roughly 2% and 6% of nuclei) and modestly elevated ALDH1L1 relative to the reactive Astro 3 supertype [22], before gene manipulation. CRISPRi will be used to knock down ACO1 and SLC13A3, replicating the disease-associated transcriptional state.
Measurements. The 13C6-citrate will be supplied to organotypic slice cultures and cells will be snap-frozen by high-pressure freezing to immobilize soluble metabolites, which is the preparation the CryoNanoSIMS workflow was built around: vitrification, cryo-planing of the block face and isotope imaging of the frozen tissue at a mass and image resolution comparable to conventional NanoSIMS, so that soluble compounds are retained instead of washed out [39]. For a tracer experiment the case for cryogenic preparation is stronger than solute retention alone. Conventional resin embedding dilutes the label itself: 13C/12C ratios in 13C-labeled samples fall by roughly an order of magnitude as carbon of natural isotopic abundance is introduced during embedding [39]. A measurement of 13C enrichment therefore cannot use the conventional preparation at all, which is why Proposition 3 requires the cryogenic route. At roughly 100 nm lateral resolution [39], the probe is smaller than a cell and resolves cytoplasm from the adjacent extracellular space, which is what the compartmental claim requires. That same study demonstrates 15N/14N imaging of vitrified tissue and, in a supplementary analysis, CryoNanoSIMS measurement of carbon-isotope ratios [39], so the 13C/12C maps we propose ask for no capability beyond what has been shown. In human postmortem middle temporal gyrus, MALDI mass spectrometry imaging at 20 μM resolution will map citrate regionally. Citrate and isocitrate are structural isomers of identical elemental composition and therefore identical exact mass (m/z 191.0197), so no increase in mass resolving power can separate them; ultrahigh-resolution imaging platforms resolve isobaric overlaps of differing composition [40] but not this pair. Separation requires an orthogonal dimension, and ion mobility delivers it: differential mobility spectrometry has resolved the citrate/isocitrate pair with a resolving power of 1948 in collision cross-section space, calculated from literature collision cross-section values and reported by those authors as the highest yet achieved for a compound of the metabolome [41]. That demonstration was made by acoustic ejection into a screening platform, not on tissue, so transferring it to an imaging source is a design assumption of this proposal and not a published result. We therefore specify a mobility stage ahead of the mass analyzer, and treat the choice of implementation (trapped or differential) as an instrument question.
A 20 μM pixel contains several cells and the interstitial space between them, so imaging mass spectrometry at that scale cannot assign citrate to the intracellular or the extracellular compartment. MALDI-TIMS-MSI contributes regional and cell-type-enriched contrasts across tissue, not a compartmental measurement. The compartmental claim rests on Cryo-NanoSIMS alone, whose 100 nm probe is smaller than a cell and does resolve cytoplasm from extracellular space, which is why the 13C tracer experiment and not the imaging experiment carries Proposition 3. One limit of that probe should be stated with the claim. The cortical extracellular space is narrower than 100 nm, so an extracellular measurement at this resolution is an average over neuropil adjacent to the cell, not a reading from a clean interstitial compartment. The test is accordingly a contrast between astrocytic cytoplasm and adjacent non-astrocytic signal, which is sufficient to detect the predicted intracellular accumulation but does not by itself quantify interstitial citrate.
Falsification. The gradient inversion model is falsified if Cryo-NanoSIMS shows that 13C-citrate derived 13C/12C enrichment in astrocytic cytoplasm does not exceed enrichment in the adjacent extracellular space in AD-vulnerable cortex, or if the enrichment ratio is no different between AD and control tissue. The MALDI-TIMS-MSI maps provide the regional context in which that test is sited and can falsify nothing on their own.
6.4. Proposition 4: ACLY-Dependent Astrocyte Identity Drift
Model. The metabolite maps from Proposition 3 will be co-registered with Xenium spatial transcriptomics on adjacent 5 μM sections, so that cell-type assignment from Xenium segmentation can be attached to individual metabolite pixels. Co-registration of MALDI imaging with another modality on adjacent sections is established practice, and has been used to place gangliosides onto amyloid plaques in AD tissue by registering MALDI-MSI with histology [42]. Registering it with spatial transcriptomics specifically, and the question of whether MALDI matrix application degrades RNA on an adjacent section, are to our knowledge untested; the adjacent-section design is our way of avoiding that problem, not a published solution to it.
Measurements. We predict that astrocyte clusters with high intracellular citrate will exhibit: (i) elevated STAT3 and reactive markers (C3, CD44); (ii) reduced homeostatic markers (GLUL, SLC1A2, KCNJ10); and (iii) reduced ACO1 and SLC13A3 transcripts. Whether the reactive shift depends on ACLY-derived acetyl-CoA will be tested genetically, by CRISPRi knockdown of ACLY under the astrocytic GFAP or ALDH1L1 promoter in the same cells. Neither promoter has been used for ACLY knockdown before, so this is a proposed construct and not an adaptation of a published one.
The small-molecule inhibitor BMS-303141 cannot carry this test alone. ACLY is expressed in every cell type in the culture and BMS-303141 is not cell-type selective, so in a mixed or co-culture preparation its effect cannot be attributed to astrocytic ACLY, so the proposition does not rest on it. Promoter-restricted CRISPRi puts the manipulation in the cell type the claim is about. The inhibitor is retained only as a pharmacological cross-check in astrocyte monocultures, where cell-type attribution is not at issue, and as a proof of concept for whether the reactive state is reversible once established, which genetic knockdown before the transition cannot address.
Falsification. The ACLY-STAT3 axis is falsified if ACO1/SLC13A3-deficient astrocytes with confirmed intracellular citrate accumulation maintain homeostatic gene expression, or if the reactive transition persists when astrocytic ACLY is knocked down.
Table 1 gives the design parameters each proposition assumes, so the framework can be costed and criticized as a plan. The replicate numbers are the minimum we would accept, and the measurements they refer to are the primary endpoint of each proposition, not the full panel.
Table 1.
Design parameters assumed by each proposition. n denotes independent biological replicates: separate neuronal or astrocyte preparations for in vitro work, separate donors for postmortem tissue. Power figures are the detectable effect at and 80% power under the stated n and the variability reported in the cited source methods.
Table 2 summarizes the falsification criteria for each proposition as a structured test matrix.
Table 2.
Pre-specified falsification criteria for each proposition.
7. Therapeutic Implications
The citrate uncoupling hypothesis implies several intervention points that are distinct from, though not exclusive of, amyloid- and tau-directed therapy.
Substrate supplementation, by two different routes. These are not the same intervention and need separating. Membrane-permeant acetate donors such as glyceryl triacetate bypass the ACLY bottleneck entirely by supplying acetyl-CoA through ACSS2 [13]; triethyl citrate is a citrate ester, not an acetate ester, and acts upstream by restoring the ACLY substrate itself. The distinction is what makes Proposition 1 interpretable: a deficit rescued by citrate but not by acetate implicates the citrate-ACLY step, and one rescued by both implicates acetyl-CoA supply in general. Glyceryl triacetate is the acetate donor discussed in that context [13]; whether either route helps when the deficit is citrate depletion is untested.
PDK1 inhibition. Inhibiting pyruvate dehydrogenase kinase, the enzyme whose overexpression Proposition 1 uses to induce the shift, could keep pyruvate entering the TCA cycle and maintain mitochondrial citrate output. The prototype inhibitor, dichloroacetate, acts on all PDK isoforms; a usable agent would need isoform selectivity and CNS penetrance, and we make no claim about the development stage of such compounds. The neuronal Warburg shift itself has already been proposed as a target: de la Fuente et al. discuss shikonin, a PKM2 modulator, as acting on the metabolic shift caused by neuronal PKM2 in AD [43], the shift described in patient-derived neurons [17].
ANKH modulation, in a direction this model cannot yet specify. If ANKH exports citrate from astrocytes, raising its activity would be the direct way to refill the extracellular pool. We flag this as the least developed of the targets considered here, because the sign of the intervention is unsettled: ANKH is raised in senescent cells and lowered in aged brain tissue [24], so potentiation might restore the gradient or might instead push surviving astrocytes further toward a senescent phenotype. Establishing the direction in human astrocytes is a prerequisite to treating ANKH as a target at all, and we make no claim about available modulators.
ACLY inhibition in astrocytes. If astrocytic ACLY hyper-activation is confirmed as the proximal driver of identity drift, ACLY inhibitors would be candidates for normalizing astrocyte epigenetics. Two caveats are substantial. BMS-303141 has been used at micromolar concentrations in culture [14], and we are not aware of data establishing brain penetration for it or for NDI-091143; and because ACLY is expressed in neurons as well, systemic inhibition would not be astrocyte-selective. Cell-type selectivity would have to come from targeting, not from the molecule, which is why Proposition 4 tests the mechanism genetically.
Acetylation potential mapping. The stoichiometric ratio of citrate to acetylated histones, visualized by MALDI-TIMS-MSI, could work as a spatially resolved biomarker of early metabolic-epigenetic uncoupling at 20 μM resolution, substantially finer than current PET-based metabolic imaging.
None of these targets competes with amyloid or tau clearance for the same target, so the natural design is additive, not comparative: a citrate-axis agent layered onto an approved anti-amyloid antibody [2,3] would test whether restoring metabolic routing adds to what plaque removal achieves. The hypothesis makes that combination a prediction, not a convenience. If epigenetic starvation proceeds independently of aggregate burden, then clearing plaque around a citrate-depleted neuron leaves the proximate lesion in place, and the residual decline seen under antibody therapy is exactly where a citrate-axis agent would be expected to act. The same logic supplies a falsification: if citrate-axis intervention adds nothing on top of amyloid clearance in a model where both are deliverable, the proposed mechanism is either downstream of amyloid or clinically irrelevant.
8. Discussion: Limitations and Outstanding Questions
Several parts of the hypothesis rest on assumptions we cannot yet defend with data.
First, the prediction that Warburg-shifted neurons lose H3K27ac specifically because of ACLY substrate depletion requires ruling out other routes to cytosolic acetyl-CoA that do not pass through citrate. The carnitine acetyltransferase (CrAT) reaction is reversible and interconverts acetyl-CoA and acetylcarnitine, so acetylcarnitine can in principle regenerate acetyl-CoA outside the mitochondrion without involving ACSS2, which uses acetate, not acetylcarnitine, as its substrate. Including CrAT inhibitors alongside ACSS2 inhibitors in the rescue experiments is the way to close both routes at once. A prior constraint belongs with this one. Axis I is a claim about the cytosolic citrate pool that ACLY draws on, not about total TCA-cycle flux, and the distinction is forced by evidence: patient-derived AD neurons show the glycolytic shift with glucose-derived flux to citrate and total TCA-cycle metabolite levels preserved (Section 2.1) [17]. Whether a cytosolic deficit can arise without a global one is unresolved, and Proposition 1 is the experiment that would settle it.
Second, Proposition 2 depends on presynaptic localization of the SLC13A5 protein, and that is the weakest assumption in the manuscript. The transcript is detectable in rodent neurons, but there are no published reports of NaCT protein in human neurons or brain tissue [20], so the terminal-level machinery we invoke is inferred from mRNA. If the protein is absent from terminals, or works only at the plasma membrane and not at vesicles, the kinetics of PFK1 disinhibition will differ from those modeled. Direct detection of the protein, by antibody validation and super-resolution imaging in presynaptic boutons, is a prerequisite. The activity-dependent fall in neuronal cytosolic citrate is itself now measured [18], so the physiology the gate is meant to explain does not depend on this assumption; only our transporter-based account of it does.
Third, the astrocytic compensatory anaplerosis assumption (upregulation of pyruvate carboxylase upon SLC13A3 loss) has not been empirically tested in human astrocytes. Transcriptomic analysis of pyruvate carboxylase levels across SEA-AD Astro 2 sub-states would provide preliminary evidence.
Fourth, although ANKH is a candidate citrate exporter in senescent fibroblasts [24], its function in astrocytes at physiological citrate concentrations in the CNS has not been characterized. The astrocytic ANKH regulome may differ from peripheral tissues. The regulation reported for ANKH also runs in opposite directions at different levels of observation (Section 3.5), so neither the sign nor the size of an astrocytic intervention can be predicted from the present evidence.
Fifth, the MALDI-TIMS-MSI pipeline proposed for human tissue requires validated spatial calibration at the 20 μM scale, and the Cryo-NanoSIMS experiments sit at the edge of what is technically feasible for imaging soluble metabolites.
The GSE5281 evidence (Section 5) carries a different set of limitations. It comes from a 2007–2008 Affymetrix platform, and the probe-level behavior of that array is one of three candidate explanations for the one result it reports that cell-type-resolved data contradict (Section 5.5). Because the samples are microdissected neurons, cell-type composition is not a confounder for the signals we report, but two design features limit them instead: laser capture is not perfectly pure, and selecting non-tangle-bearing neurons makes the contrast one between surviving AD neurons and control neurons. The whole-cohort and sex-level contrasts also contain repeated measures from the same donors (Section 4.1), so their p values are anticonservative and we treat them as hypothesis-generating. Some strata are small, with the smallest control arms in the sex×region contrasts holding three samples. We flagged those as underpowered instead of dropping them, following the sample-size criterion set out in the original analysis protocol. Finally, the sex difference and the regional hot-spots are new findings, and they need replication in an independent cohort, ideally one based on RNA sequencing, before anyone builds on them. Neither dataset carries a tau measurement comparable to the staging used in the trials cited in Section 1: GSE5281 selected non-tangle-bearing neurons without quantifying burden per sample, and the SEA-AD exposure is a composite pathological ordering. Nothing here speaks to how the citrate axis behaves across tau strata.
Whether the female-predominant citrate-pathway signal bears on the higher lifetime incidence of AD in women cannot be settled with these data. The asymmetry appears in the whole-cohort and sex strata, which carry repeated measures from the same donors and anticonservative p values, and it does not resolve in any individual region (Section 5.3). We note the correspondence as a question for a replication cohort with donor-level modeling.
The SLC13A3 question has been resolved by correcting what the dataset is and then testing the prediction properly. GSE5281 profiles neurons, so the increase we reported is a neuronal measurement and cannot contradict an astrocytic prediction; the compositional argument we previously offered assumed a mixed-cell sample and does not apply. Tested directly in cell-type-resolved data (Section 5.5), astrocytic SLC13A3 declines with pseudo-progression in all nine regions examined, though it survives correction only in MTG, and the entorhinal increase does not reproduce in entorhinal neurons. Two things follow. The astrocytic arm of Axis II is supported, but by ACO1, not by the transporter. And SLC13A3 falls across most cortical cell types instead of selectively in astrocytes, so its decline is not compartment-specific in the sense the hypothesis requires; the compartment specificity we claim should be read as a property of the consequences of citrate mishandling, not of the transporter transcript itself. Proposition 3 (Section 6.3) remains the decisive test, because it measures citrate, not transcripts.
The SEA-AD analysis has limitations of its own. The multiregion release is described in a preprint, not a peer-reviewed paper [37], although the atlas it extends is published [23] and the data release is public. Six of the nine regions we analyzed carry 40 to 43 donors drawn from a comorbidity-screened subset, so outside MTG, DFC and MEC the absence of significance should be read as low power, not as a negative result. And pseudo-progression is a pathology-derived ordering of donors, not a time course, so these are cross-sectional associations and not trajectories in any individual brain.
9. Conclusions
We have proposed that neurodegeneration is, at least in part, driven by a bidirectional failure of citrate routing between neurons and astrocytes: a compartment-specific uncoupling that depletes the epigenome in neurons while trapping excess acetyl-CoA substrate in astrocytes. The framing is useful because one measurable metabolite carries both the bioenergetic and the epigenetic lesion, which turns the model into a measurement: citrate should move in opposite directions in the two cell types, and spatial mass spectrometry can check that. The drug targets it implies (acetate supplementation, PDK1 inhibition and ACLY blockade, with ANKH modulation in a direction still to be established) are also different from the anti-amyloid and anti-tau targets, so they could be used alongside them.
The transcriptional evidence now reaches both axes, though unevenly. The coherent multi-region loss of TCA-cycle and citrate-handling enzymes in microdissected AD neurons is what Axis I predicts, and the astrocytic arm of Axis II is supported in cell-type-resolved data by a decline in ACO1 with local pathology in every region tested (Section 5.5). SLC13A3 falls too, but across most cortical cell types, so it does not carry the compartment specificity the name of the hypothesis claims. That specificity now has to be demonstrated at the level of citrate itself.
The four-proposition validation framework keeps each step falsifiable. If the predicted inversion of the intercellular citrate gradient is confirmed in human postmortem tissue and replicated in cellular models, compartment-specific citrate uncoupling would give a new mechanistic account of the metabolic-epigenetic origins of neurodegeneration, along with a set of tractable drug targets.
Supplementary Materials
The following supporting information can be downloaded at https://www.mdpi.com/article/10.3390/epigenomes10040071/s1, Table S1, per-stratum sample sizes for all 15 strata (AD and control arm sizes, with the underpowered flag applied at fewer than four samples per arm); Table S2, citrate-axis gene panel giving log2FC, adj.p, probe identifier, and direction for 21 genes across all 15 strata (315 rows); Table S3, pathway-level results for 10 pre-specified search terms across KEGG_2026, Reactome_Pathways_2024, and GO_Biological_Process_2026 in every stratum returning a match (177 rows); File S1, the seven annotated R scripts implementing the pipeline from GEO retrieval through limma contrasts, pipeline validation against GEO2R, Enrichr queries, and final synthesis, together with the probe annotation table the scripts use to map Affymetrix identifiers to gene symbols; Table S4, the per-stratum concordance between each independent GEO2R export and the pipeline, giving on log2FC, the contrast direction each export was run in, and any defect found in the export; Table S5, donor-level Spearman associations between pseudobulk expression of the 26-gene citrate panel and local pseudo-progression score in the SEA-AD Multiregion 2026 release, by region and cell type, with donor counts, nominal P and Benjamini–Hochberg FDR within region (1774 rows after quality control); File S2, the annotated R script implementing the SEA-AD analysis, from data retrieval through the per-region correlation tests.
Author Contributions
Conceptualization, methodology, formal analysis (GSE5281 reanalysis), writing—original draft, and writing—review and editing, H.R.F.; data curation (entorhinal cortex strata), A.C.C.d.M.; data curation (hippocampus × female and middle temporal gyrus × male strata), T.A.S.; data curation (hippocampus × male stratum), M.B.d.S.A.; data curation (posterior cingulate, superior frontal gyrus, and primary visual cortex strata), E.R.O. and S.P.E.R.; data curation (sex-stratified, all regions), L.S.d.A.C.; data curation (entorhinal cortex × male stratum and male sex-stratified analysis), A.L.C.S.; data curation, J.F.L. All authors have read and agreed to the published version of the manuscript.
Funding
This research received no external funding.
Institutional Review Board Statement
Not applicable. This work is a literature-based hypothesis supported by reanalysis of pre-existing, publicly available, de-identified human data (GSE5281); no new human or animal studies were conducted by the authors.
Informed Consent Statement
Not applicable.
Data Availability Statement
This hypothesis paper’s central claims generate no new primary data. Section 4.1 reanalyses the publicly available dataset GSE5281 from the NCBI Gene Expression Omnibus (https://www.ncbi.nlm.nih.gov/geo/query/acc.cgi?acc=GSE5281 (accessed on 19 September 2026)) [32]. The analysis pipeline and all derived result tables are supplied as Supplementary Material (File S1, Tables S1–S3), so every contrast reported here can be regenerated from the public accession without further input from the authors. The cached GEO download (gse5281.rds) and the 15 full per-stratum differential expression tables are available from the corresponding author on request; they are omitted here only for size. Section 4.2 analyses the SEA-AD multiregion data release [37,38], whose per-subclass pseudobulk objects and donor metadata are publicly available from the SEA-AD single-cell profiling bucket (https://sea-ad-single-cell-profiling.s3.amazonaws.com/ (accessed on 19 September 2026)). The script in File S2 downloads those objects and reproduces Table S5 without further input from the authors. The regional extension is currently a preprint, so the version accessed is recorded in the script header.
Acknowledgments
During the preparation of this manuscript, the authors used Claude Opus 5.5 (Anthropic) to assist with reanalysis of the GSE5281 dataset (implementation of the GEOquery/limma/Enrichr pipeline described in Section 4.1), synthesis of results, and drafting of portions of the manuscript text. The authors have reviewed and edited the output and take full responsibility for the content of this publication.
Conflicts of Interest
The authors declare no conflicts of interest.
Abbreviations
The following abbreviations are used in this manuscript:
| ACLY | ATP-citrate lyase |
| ACO1 | cytosolic aconitase 1 |
| AD | Alzheimer’s disease |
| ANKH | progressive ankylosis protein homolog/SLC62A1 |
| ARIA | amyloid-related imaging abnormalities |
| CrAT | carnitine acetyltransferase |
| EC | entorhinal cortex |
| ECAR | extracellular acidification rate |
| FBP | fructose-1,6-bisphosphate |
| FLIM | fluorescence lifetime imaging microscopy |
| HAT | histone acetyltransferase |
| HIP | hippocampus |
| iADRS | integrated Alzheimer Disease Rating Scale |
| iPSC | induced pluripotent stem cell |
| MALDI-TIMS-MSI | matrix-assisted laser desorption ionization trapped ion mobility spectrometry mass spectrometry imaging |
| MTG | middle temporal gyrus |
| NaCT | sodium-coupled citrate transporter |
| NanoSIMS | nanoscale secondary ion mass spectrometry |
| OCR | oxygen consumption rate |
| PC | posterior cingulate |
| PDK1 | pyruvate dehydrogenase kinase 1 |
| PFK1 | phosphofructokinase 1 |
| SEA-AD | Seattle Alzheimer’s Disease Brain Cell Atlas |
| SFG | superior frontal gyrus |
| SLC13A3/NaDC3 | sodium-dependent dicarboxylate transporter 3 |
| SLC13A5/NaCT | sodium-coupled citrate transporter |
| SLC25A1 | mitochondrial citrate carrier |
| STAT3 | signal transducer and activator of transcription 3 |
| TCA | tricarboxylic acid |
| TIMS | trapped ion mobility spectrometry |
| VCX | primary visual cortex |
References
- GBD 2019 Dementia Forecasting Collaborators. Estimation of the global prevalence of dementia in 2019 and forecasted prevalence in 2050: An analysis for the Global Burden of Disease Study 2019. Lancet Public Health 2022, 7, e105–e125. [Google Scholar] [CrossRef]
- van Dyck, C.H.; Swanson, C.J.; Aisen, P.; Bateman, R.J.; Chen, C.; Gee, M.; Kanekiyo, M.; Li, D.; Reyderman, L.; Cohen, S.; et al. Lecanemab in early Alzheimer’s disease. N. Engl. J. Med. 2023, 388, 9–21. [Google Scholar] [CrossRef] [Scilit]
- Sims, J.R.; Zimmer, J.A.; Evans, C.D.; Lu, M.; Ardayfio, P.; Sparks, J.; Wessels, A.M.; Shcherbinin, S.; Wang, H.; Monkul Nery, E.S.; et al. Donanemab in early symptomatic Alzheimer disease: The TRAILBLAZER-ALZ 2 randomized clinical trial. JAMA 2023, 330, 512–527. [Google Scholar] [CrossRef] [Scilit]
- Zhang, X.; Alshakhshir, N.; Zhao, L. Glycolytic metabolism, brain resilience, and Alzheimer’s disease. Front. Neurosci. 2021, 15, 662242. [Google Scholar] [CrossRef] [Scilit]
- Zhang, X.; Wu, L.; Swerdlow, R.H.; Zhao, L. Opposing effects of ApoE2 and ApoE4 on glycolytic metabolism in neuronal aging supports a Warburg neuroprotective cascade against Alzheimer’s disease. Cells 2023, 12, 410. [Google Scholar] [CrossRef] [Scilit]
- Burns, J.S.; Manda, G. Metabolic pathways of the Warburg effect in health and disease: Perspectives of choice, chain or chance. Int. J. Mol. Sci. 2017, 18, 2755. [Google Scholar] [CrossRef] [Scilit]
- Demetrius, L.A.; Magistretti, P.J.; Pellerin, L. Alzheimer’s disease: The amyloid hypothesis and the inverse Warburg effect. Front. Physiol. 2015, 5, 522. [Google Scholar] [CrossRef] [Scilit]
- Rumpf, S.; Sanal, N.; Marzano, M. Energy metabolic pathways in neuronal development and function. Oxf. Open Neurosci. 2023, 2, kvad004. [Google Scholar] [CrossRef] [Scilit]
- Araque, A.; Parpura, V.; Sanzgiri, R.P.; Haydon, P.G. Tripartite synapses: Glia, the unacknowledged partner. Trends Neurosci. 1999, 22, 208–215. [Google Scholar] [CrossRef] [Scilit]
- Magistretti, P.J.; Allaman, I. A cellular perspective on brain energy metabolism and functional imaging. Neuron 2015, 86, 883–901. [Google Scholar] [CrossRef] [Scilit]
- Rodríguez-Giraldo, M.; González-Reyes, R.E.; Ramírez-Guerrero, S.; Bonilla-Trilleras, C.E.; Guardo-Maya, S.; Nava-Mesa, M.O. Astrocytes as a therapeutic target in Alzheimer’s disease—Comprehensive review and recent developments. Int. J. Mol. Sci. 2022, 23, 13630. [Google Scholar] [CrossRef] [Scilit]
- Preman, P.; Alfonso-Triguero, M.; Alberdi, E.; Verkhratsky, A.; Arranz, A.M. Astrocytes in Alzheimer’s disease: Pathological significance and molecular pathways. Cells 2021, 10, 540. [Google Scholar] [CrossRef] [Scilit]
- Bradshaw, P.C. Acetyl-CoA metabolism and histone acetylation in the regulation of aging and lifespan. Antioxidants 2021, 10, 572. [Google Scholar] [CrossRef] [Scilit]
- Zheng, W.; Tasselli, L.; Li, T.M.; Chua, K.F. Mammalian SIRT6 represses invasive cancer cell phenotypes through ATP citrate lyase (ACLY)-dependent histone acetylation. Genes 2021, 12, 1460. [Google Scholar] [CrossRef] [Scilit]
- Xu, D.C.; Sas-Nowosielska, H.; Donahue, G.; Huang, H.; Pourshafie, N.; Good, C.R.; Berger, S.L. Histone acetylation in an Alzheimer’s disease cell model promotes homeostatic amyloid-reducing pathways. Acta Neuropathol. Commun. 2024, 12, 3. [Google Scholar] [CrossRef] [Scilit]
- Qin, Y.; Yang, P.; He, W.; Li, D.; Zeng, L.; Li, J.; Zhou, T.; Peng, J.; Cao, L.; Huang, W. Novel histone post-translational modifications in Alzheimer’s disease: Current advances and implications. Clin. Epigenetics 2024, 16, 39. [Google Scholar] [CrossRef] [Scilit]
- Traxler, L.; Herdy, J.R.; Stefanoni, D.; Eichhorner, S.; Pelucchi, S.; Szücs, A.; Santagostino, A.; Kim, Y.; Agarwal, R.K.; Schlachetzki, J.C.M.; et al. Warburg-like metabolic transformation underlies neuronal degeneration in sporadic Alzheimer’s disease. Cell Metab. 2022, 34, 1248–1263.e6. [Google Scholar] [CrossRef] [Scilit]
- Rosen, P.C.; Fu, P.; Ferrán, B.; Kim, E.; Brooks, D.J.; Lim, D.C.; Díaz-García, C.M.; Yellen, G. Activity-dependent citrate dynamics in neurons. Proc. Natl. Acad. Sci. USA 2025, 122, e2519902122. [Google Scholar] [CrossRef] [Scilit]
- Potapova, I.A.; El-Maghrabi, M.R.; Doronin, S.V.; Benjamin, W.B. Phosphorylation of recombinant human ATP:citrate lyase by cAMP-dependent protein kinase abolishes homotropic allosteric regulation of the enzyme by citrate and increases the enzyme activity. Allosteric activation of ATP:citrate lyase by phosphorylated sugars. Biochemistry 2000, 39, 1169–1179. [Google Scholar] [CrossRef] [Scilit]
- Beltran, A.S. Novel approaches to studying SLC13A5 disease. Metabolites 2024, 14, 84. [Google Scholar] [CrossRef] [Scilit]
- Li, Z.; Wang, H. Molecular mechanisms of the SLC13A5 gene transcription. Metabolites 2021, 11, 706. [Google Scholar] [CrossRef] [Scilit]
- Schuck, P.F.; da Costa Ferreira, G.; Freitas, H.R. Astrocyte subtype-specific expression of the sodium-coupled citrate transporter SLC13A5 and citrate metabolism genes across Alzheimer’s disease pseudoprogression: A single-nucleus RNA sequencing analysis of the human middle temporal gyrus. Curr. Issues Mol. Biol. 2026, 48, 691. [Google Scholar] [CrossRef] [Scilit]
- Gabitto, M.I.; Travaglini, K.J.; Rachleff, V.M.; Kaplan, E.S.; Long, B.; Ariza, J.; Ding, Y.; Mahoney, J.T.; Dee, N.; Goldy, J.; et al. Integrated multimodal cell atlas of Alzheimer’s disease. Nat. Neurosci. 2024, 27, 2366–2383. [Google Scholar] [CrossRef] [Scilit]
- James, E.N.; Teh, M.T.; Li, Y.; Wagner-Bock, C.; Al-Khateeb, Z.F.; Karen-Ng, L.P.; Roberts, T.; Synchyshyn, L.; Lewis, A.; O’Loghlen, A.; et al. Membrane transporter progressive ankylosis protein homologue (ANKH/Ank) partially mediates senescence-derived extracellular citrate and is regulated by DNA damage, inflammation, and ageing. Front. Aging 2025, 6, 1583288. [Google Scholar] [CrossRef] [Scilit]
- Liddelow, S.A.; Guttenplan, K.A.; Clarke, L.E.; Bennett, F.C.; Bohlen, C.J.; Schirmer, L.; Bennett, M.L.; Münch, A.E.; Chung, W.S.; Peterson, T.C.; et al. Neurotoxic reactive astrocytes are induced by activated microglia. Nature 2017, 541, 481–487. [Google Scholar] [CrossRef] [Scilit]
- Williams, N.C.; O’Neill, L.A.J. A role for the Krebs cycle intermediate citrate in metabolic reprogramming in innate immunity and inflammation. Front. Immunol. 2018, 9, 141. [Google Scholar] [CrossRef] [Scilit]
- Ding, Y.; Liu, C.; Zhang, Y. Aging-related histone modification changes in brain function. Ibrain 2023, 9, 205–213. [Google Scholar] [CrossRef] [Scilit]
- Winick-Ng, W.; Rylett, R.J. Into the fourth dimension: Dysregulation of genome architecture in aging and Alzheimer’s disease. Front. Mol. Neurosci. 2018, 11, 60. [Google Scholar] [CrossRef] [Scilit]
- Park, J.; Lee, K.; Kim, K.; Yi, S.J. The role of histone modifications: From neurodevelopment to neurodiseases. Signal Transduct. Target. Ther. 2022, 7, 217. [Google Scholar] [CrossRef] [Scilit]
- Milosavljevic, S.; Glinton, K.E.; Li, X.; Medeiros, C.; Gillespie, P.; Seavitt, J.R.; Graham, B.H.; Elsea, S.H. Untargeted metabolomics of Slc13a5 deficiency reveal critical liver–brain axis for lipid homeostasis. Metabolites 2022, 12, 351. [Google Scholar] [CrossRef] [Scilit]
- Ma, S.; Wang, L.; Zhang, J.; Geng, L.; Yang, J. The role of transcriptional and epigenetic modifications in astrogliogenesis. PeerJ 2024, 12, e18151. [Google Scholar] [CrossRef] [Scilit]
- Liang, W.S.; Dunckley, T.; Beach, T.G.; Grover, A.; Mastroeni, D.; Ramsey, K.; Caselli, R.J.; Kukull, W.A.; McKeel, D.; Morris, J.C.; et al. Altered neuronal gene expression in brain regions differentially affected by Alzheimer’s disease: A reference data set. Physiol. Genom. 2008, 33, 240–256. [Google Scholar] [CrossRef] [Scilit]
- Liang, W.S.; Reiman, E.M.; Valla, J.; Dunckley, T.; Beach, T.G.; Grover, A.; Niedzielko, T.L.; Schneider, L.E.; Mastroeni, D.; Caselli, R.; et al. Alzheimer’s disease is associated with reduced expression of energy metabolism genes in posterior cingulate neurons. Proc. Natl. Acad. Sci. USA 2008, 105, 4441–4446. [Google Scholar] [CrossRef] [Scilit]
- Davis, S.; Meltzer, P.S. GEOquery: A bridge between the Gene Expression Omnibus (GEO) and BioConductor. Bioinformatics 2007, 23, 1846–1847. [Google Scholar] [CrossRef] [Scilit]
- Ritchie, M.E.; Phipson, B.; Wu, D.; Hu, Y.; Law, C.W.; Shi, W.; Smyth, G.K. limma powers differential expression analyses for RNA-sequencing and microarray studies. Nucleic Acids Res. 2015, 43, e47. [Google Scholar] [CrossRef] [Scilit]
- Kuleshov, M.V.; Jones, M.R.; Rouillard, A.D.; Fernandez, N.F.; Duan, Q.; Wang, Z.; Koplev, S.; Jenkins, S.L.; Jagodnik, K.M.; Lachmann, A.; et al. Enrichr: A comprehensive gene set enrichment analysis web server 2016 update. Nucleic Acids Res. 2016, 44, W90–W97. [Google Scholar] [CrossRef] [Scilit]
- Travaglini, K.J.; Gabitto, M.I.; Ding, Y.; Agrawal, A.; Postupna, N.; Mahoney, J.T.; Kaplan, E.S.; Melief, E.J.; Goldy, J.; Chakka, A.B.; et al. Multiregional single-cell profiling reveals shared and specialized cellular vulnerability in Alzheimer’s disease. bioRxiv 2026. [Google Scholar] [CrossRef] [Scilit]
- Seattle Alzheimer’s Disease Brain Cell Atlas (SEA-AD) Consortium. SEA-AD Multiregion Single-Cell and Single-Nucleus Data Release. Available online: https://portal.brain-map.org/explore/seattle-alzheimers-disease (accessed on 19 September 2026).
- Meibom, A.; Plane, F.; Cheng, T.; Grandjean, G.; Haldimann, O.; Escrig, S.; Jensen, L.; Daraspe, J.; Mucciolo, A.; De Bellis, D.; et al. Correlated cryo-SEM and CryoNanoSIMS imaging of biological tissue. BMC Biol. 2023, 21, 126. [Google Scholar] [CrossRef] [Scilit]
- Grgic, A.; Nagornov, K.O.; Kozhinov, A.N.; Michael, J.A.; Anthony, I.G.M.; Tsybin, Y.O.; Heeren, R.M.A.; Ellis, S.R. Ultrahigh-mass resolution mass spectrometry imaging with an Orbitrap externally coupled to a high-performance data acquisition system. Anal. Chem. 2024, 96, 794–801. [Google Scholar] [CrossRef] [Scilit]
- Bazargan, S.; Dranchak, P.; Liu, C.; Inglese, J.; Janiszewski, J.; Schneider, B.B.; Covey, T.R. Differential mobility spectrometry acoustic ejection mass spectrometer system for screening isomerization-mediating enzyme drug targets. Anal. Chem. 2024, 96, 20645–20655. [Google Scholar] [CrossRef] [Scilit]
- Ollen-Bittle, N.; Pejhan, S.; Pasternak, S.H.; Keene, C.D.; Zhang, Q.; Whitehead, S.N. Co-registration of MALDI-MSI and histology demonstrates gangliosides co-localize with amyloid beta plaques in Alzheimer’s disease. Acta Neuropathol. 2024, 147, 105. [Google Scholar] [CrossRef] [Scilit]
- de la Fuente, A.G.; Pelucchi, S.; Mertens, J.; Di Luca, M.; Mauceri, D.; Marcello, E. Novel therapeutic approaches to target neurodegeneration. Br. J. Pharmacol. 2023, 180, 1651–1673. [Google Scholar] [CrossRef] [Scilit]
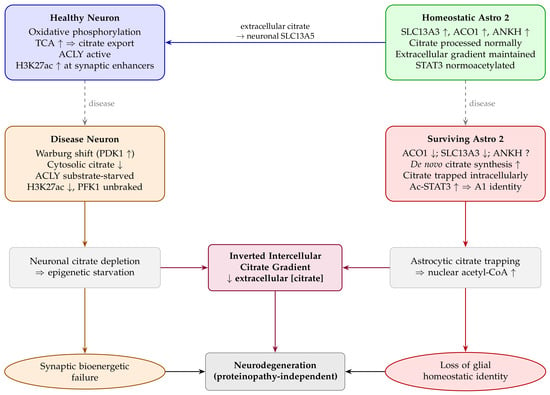
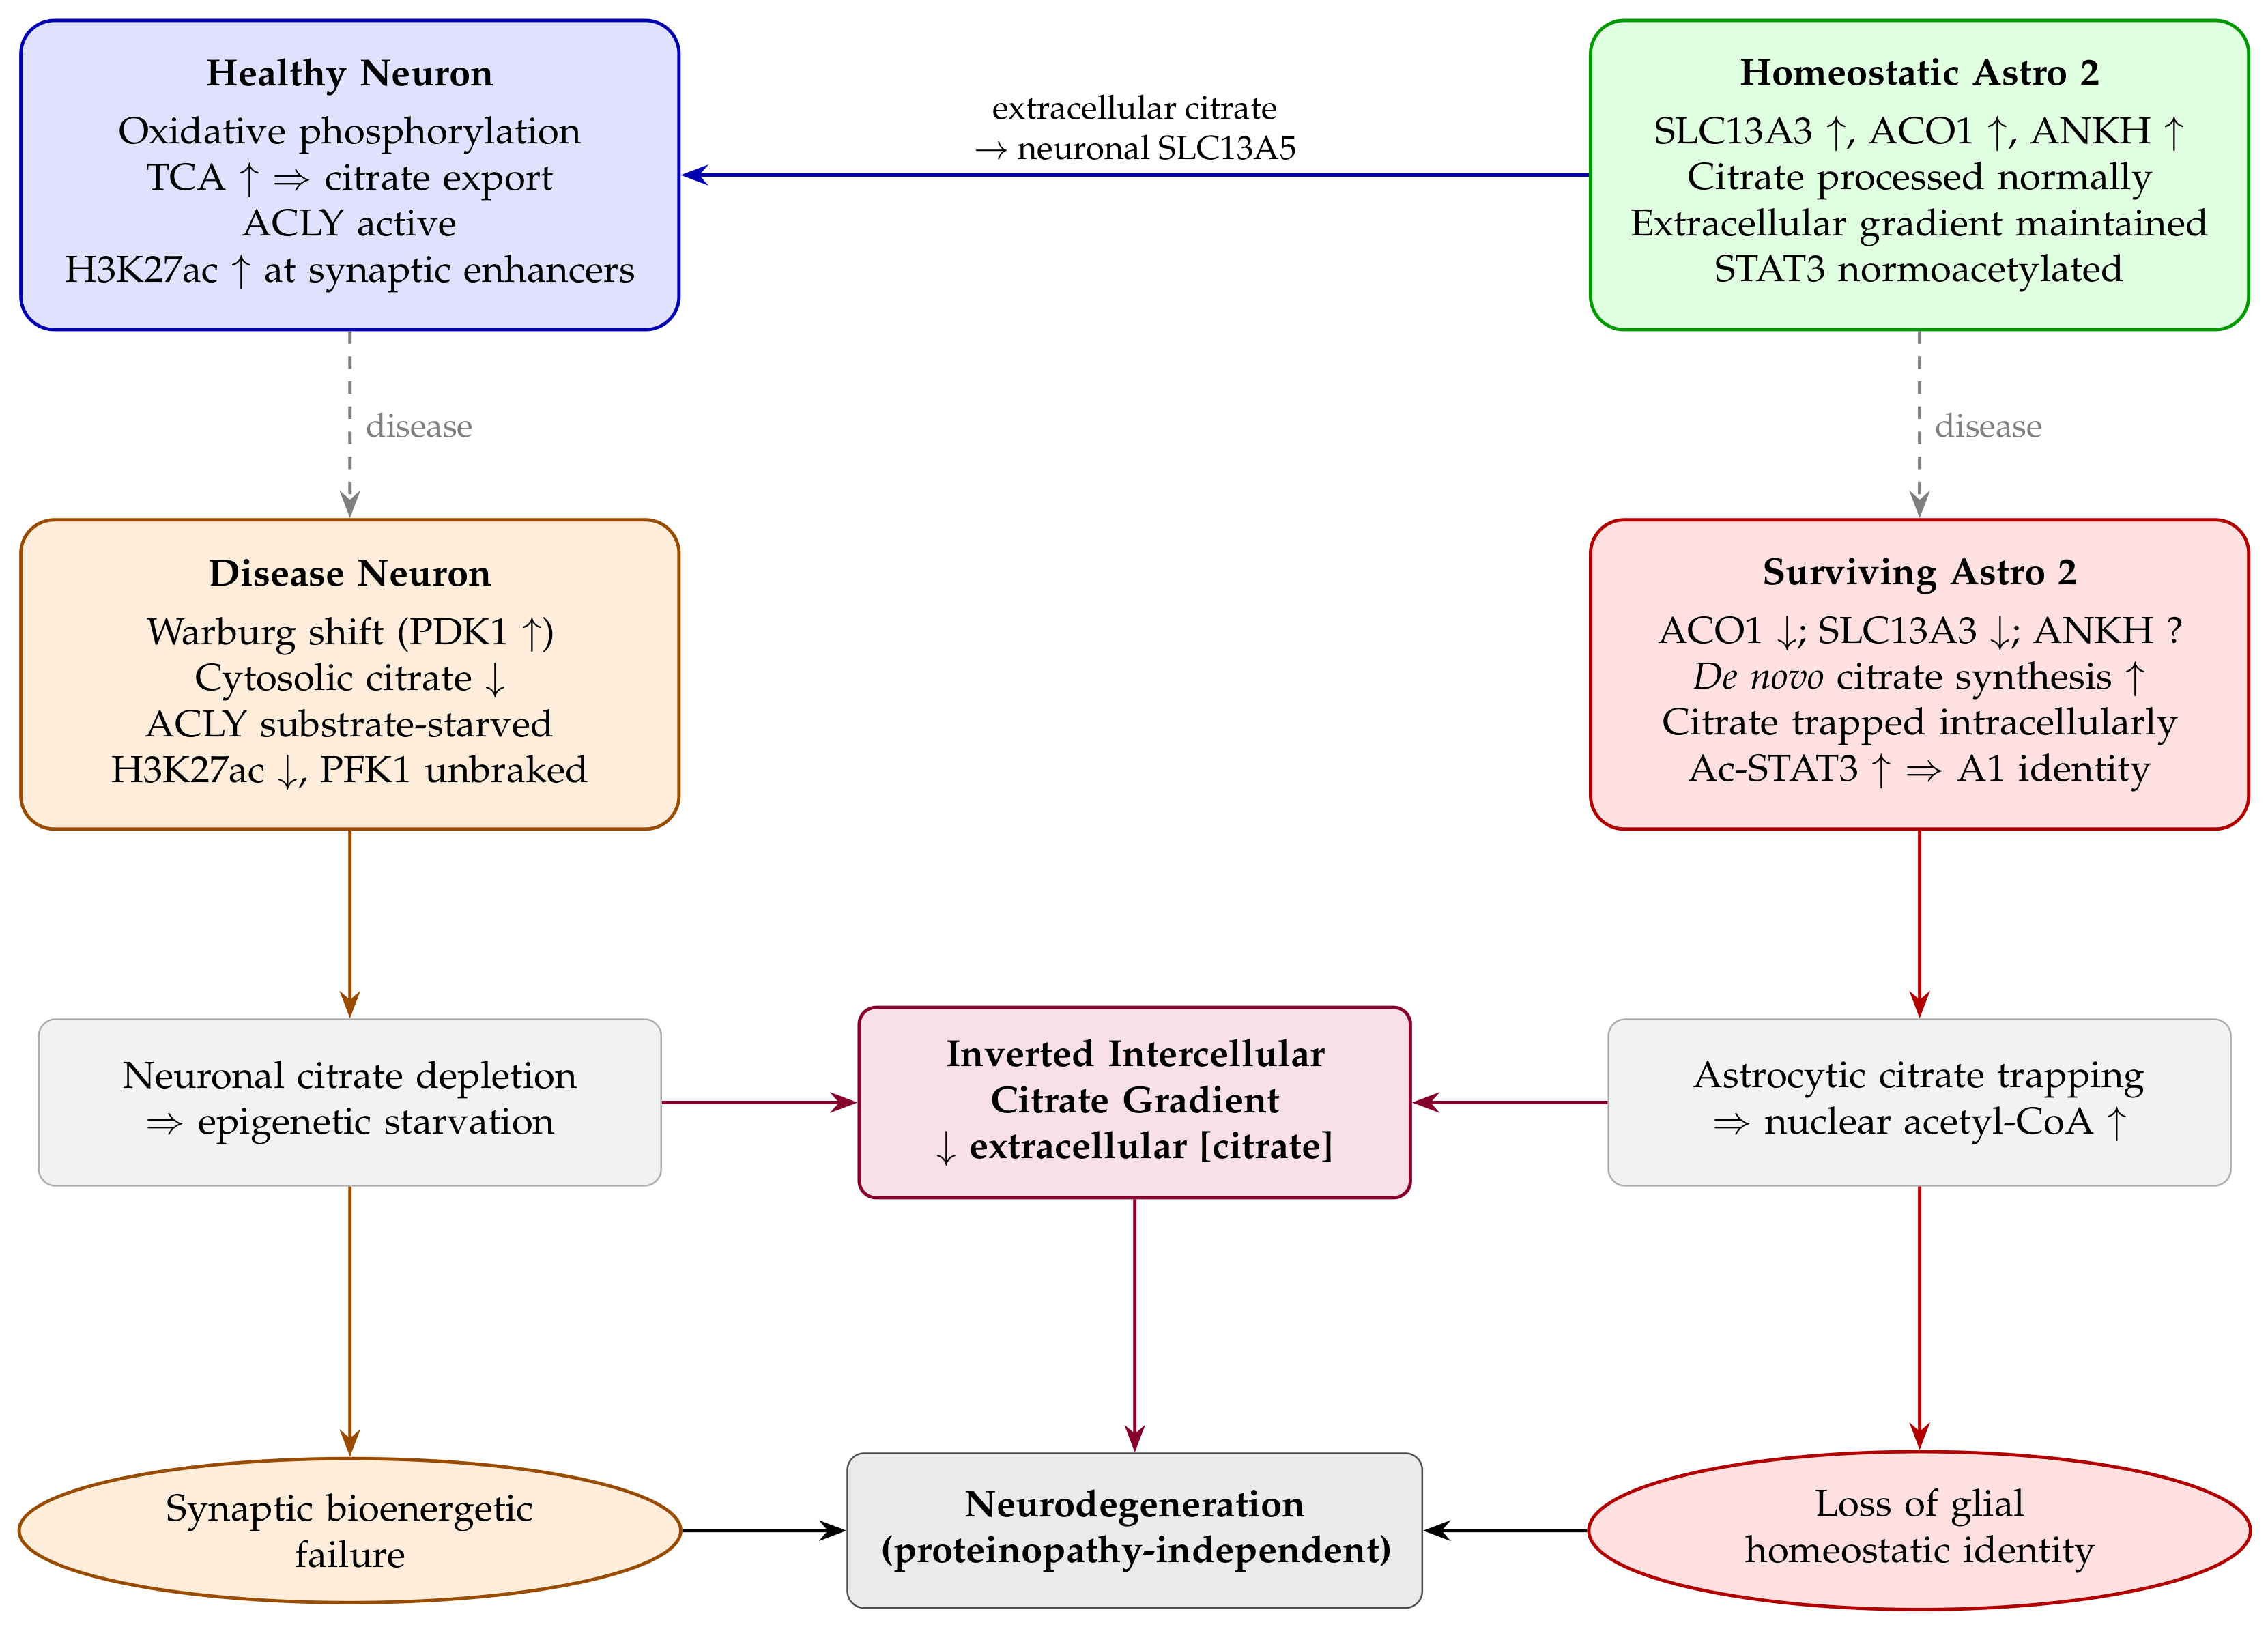
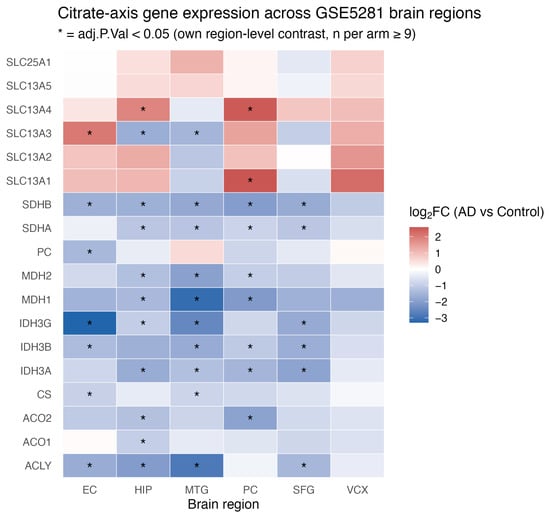
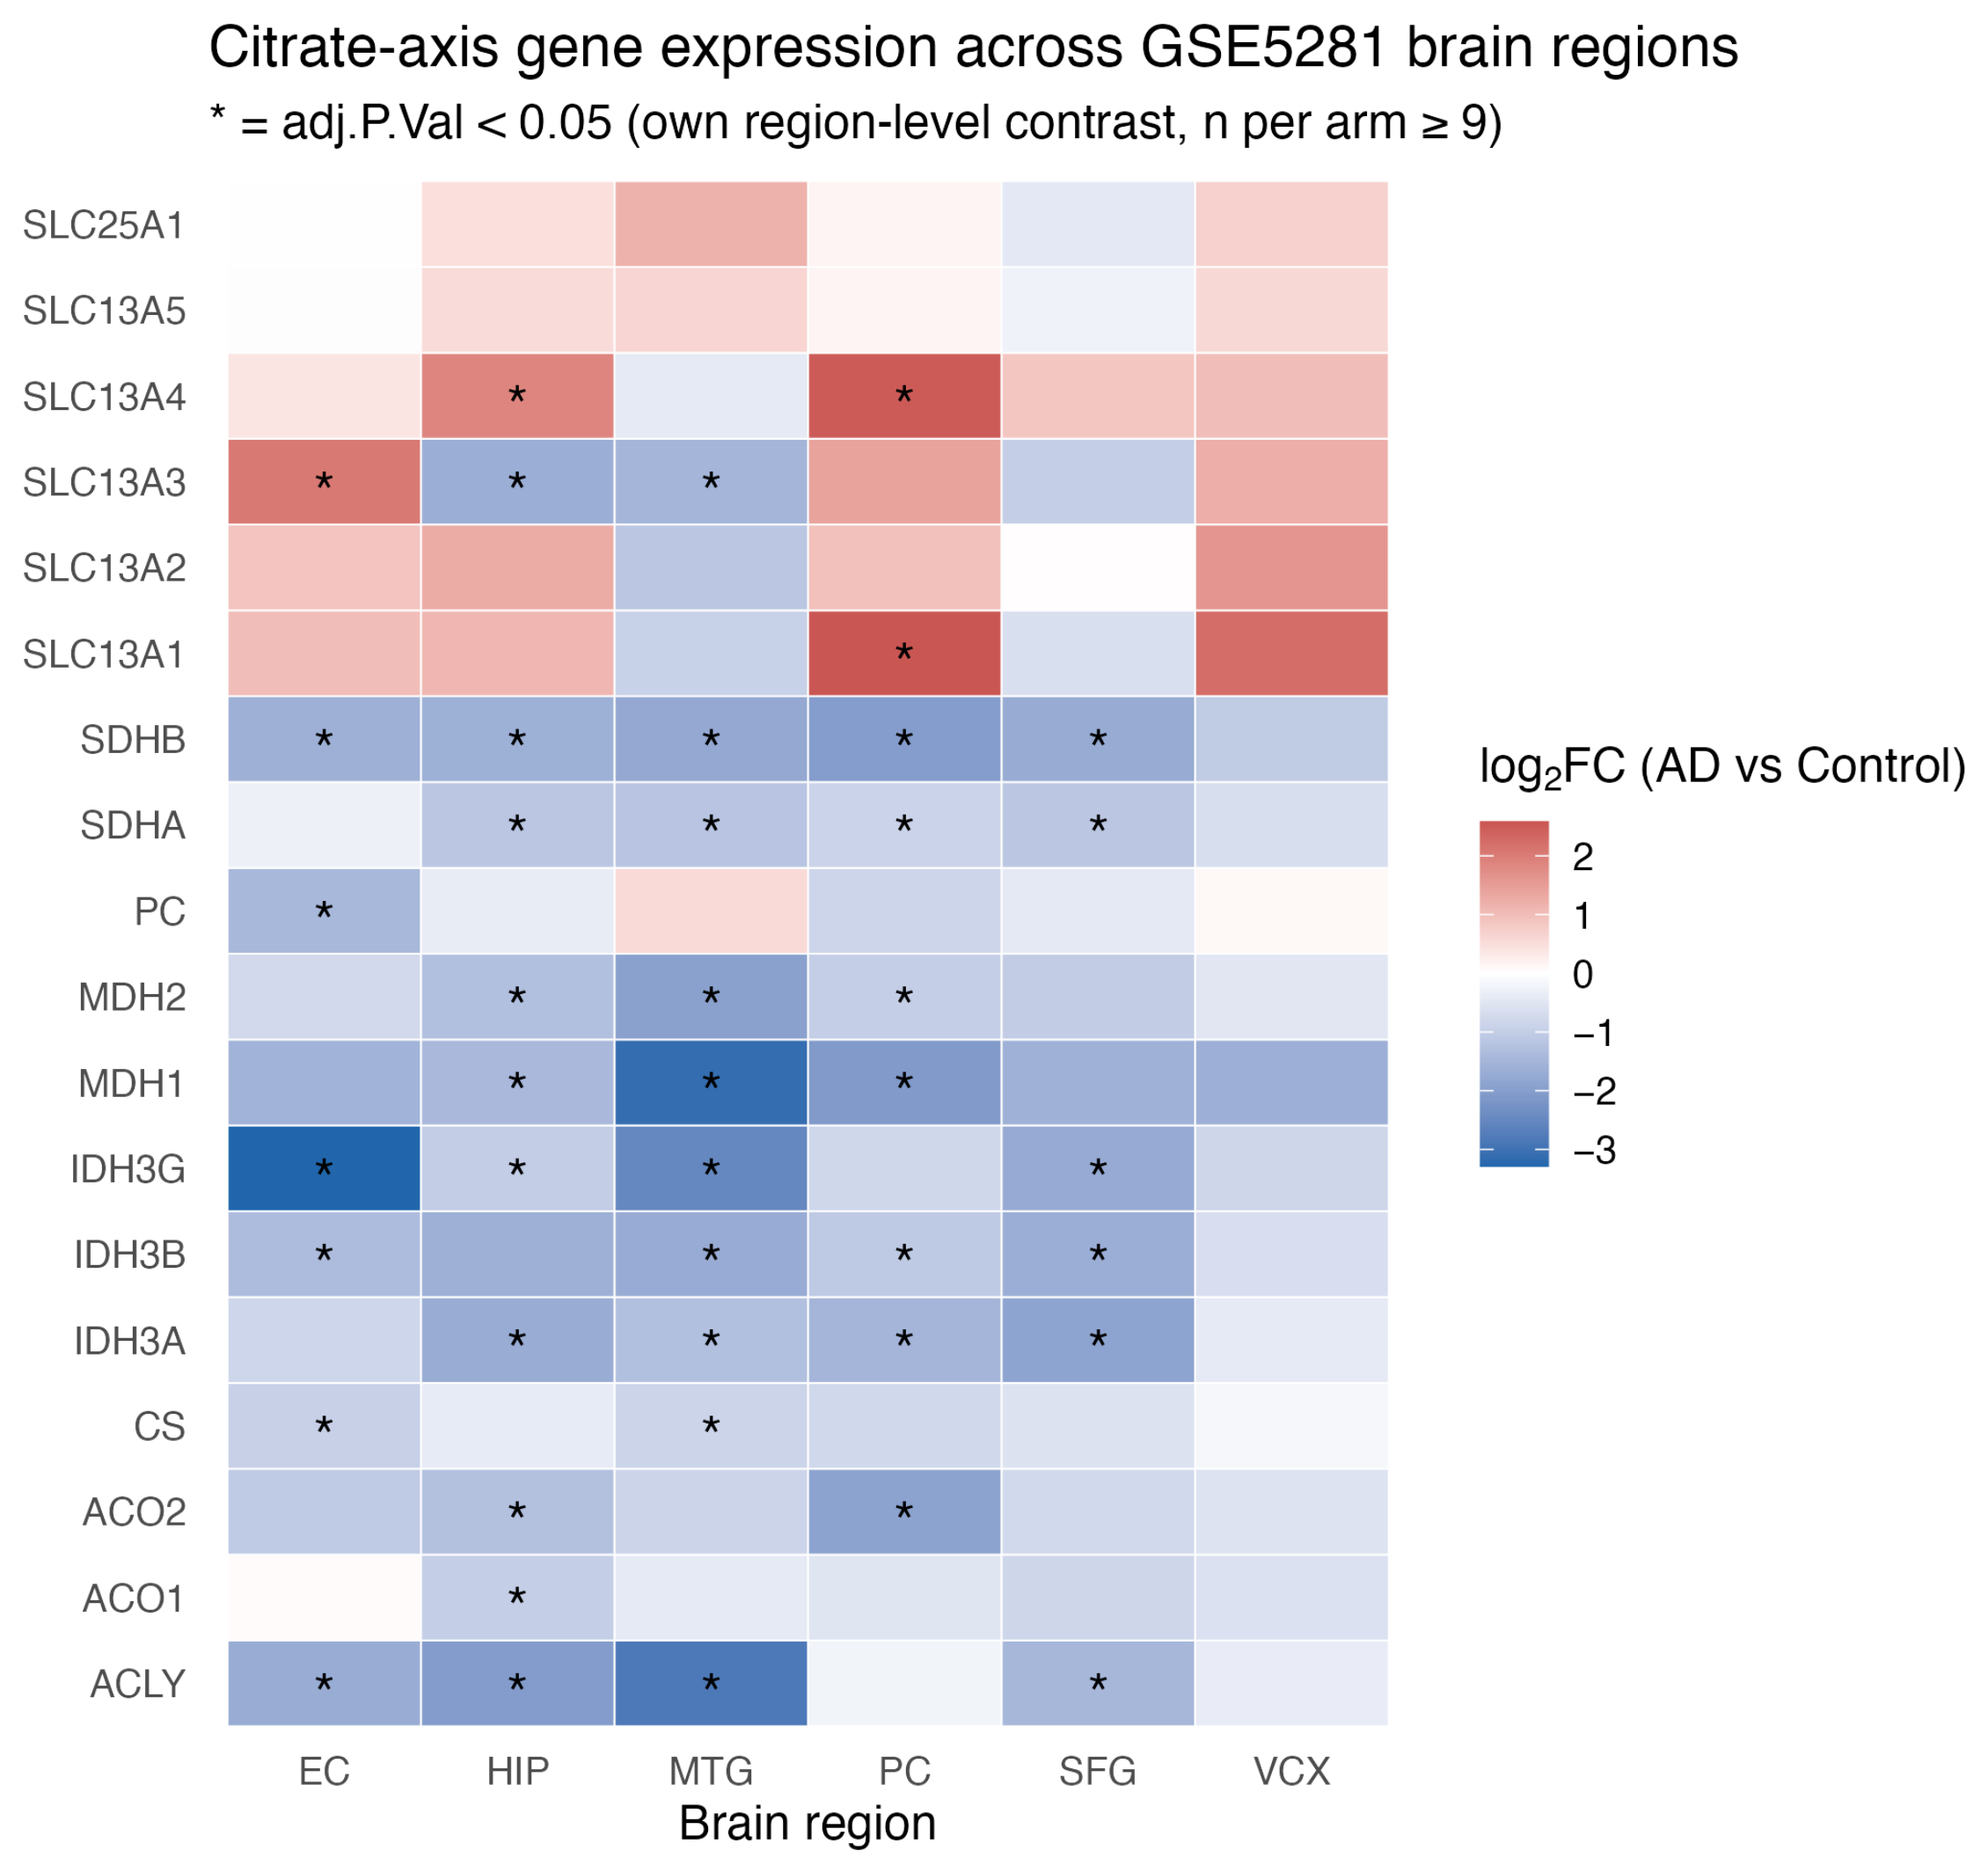
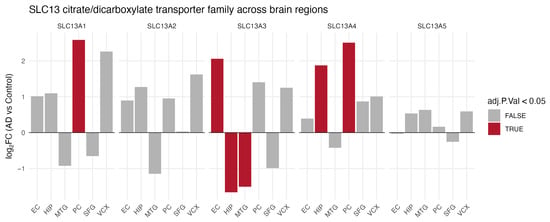
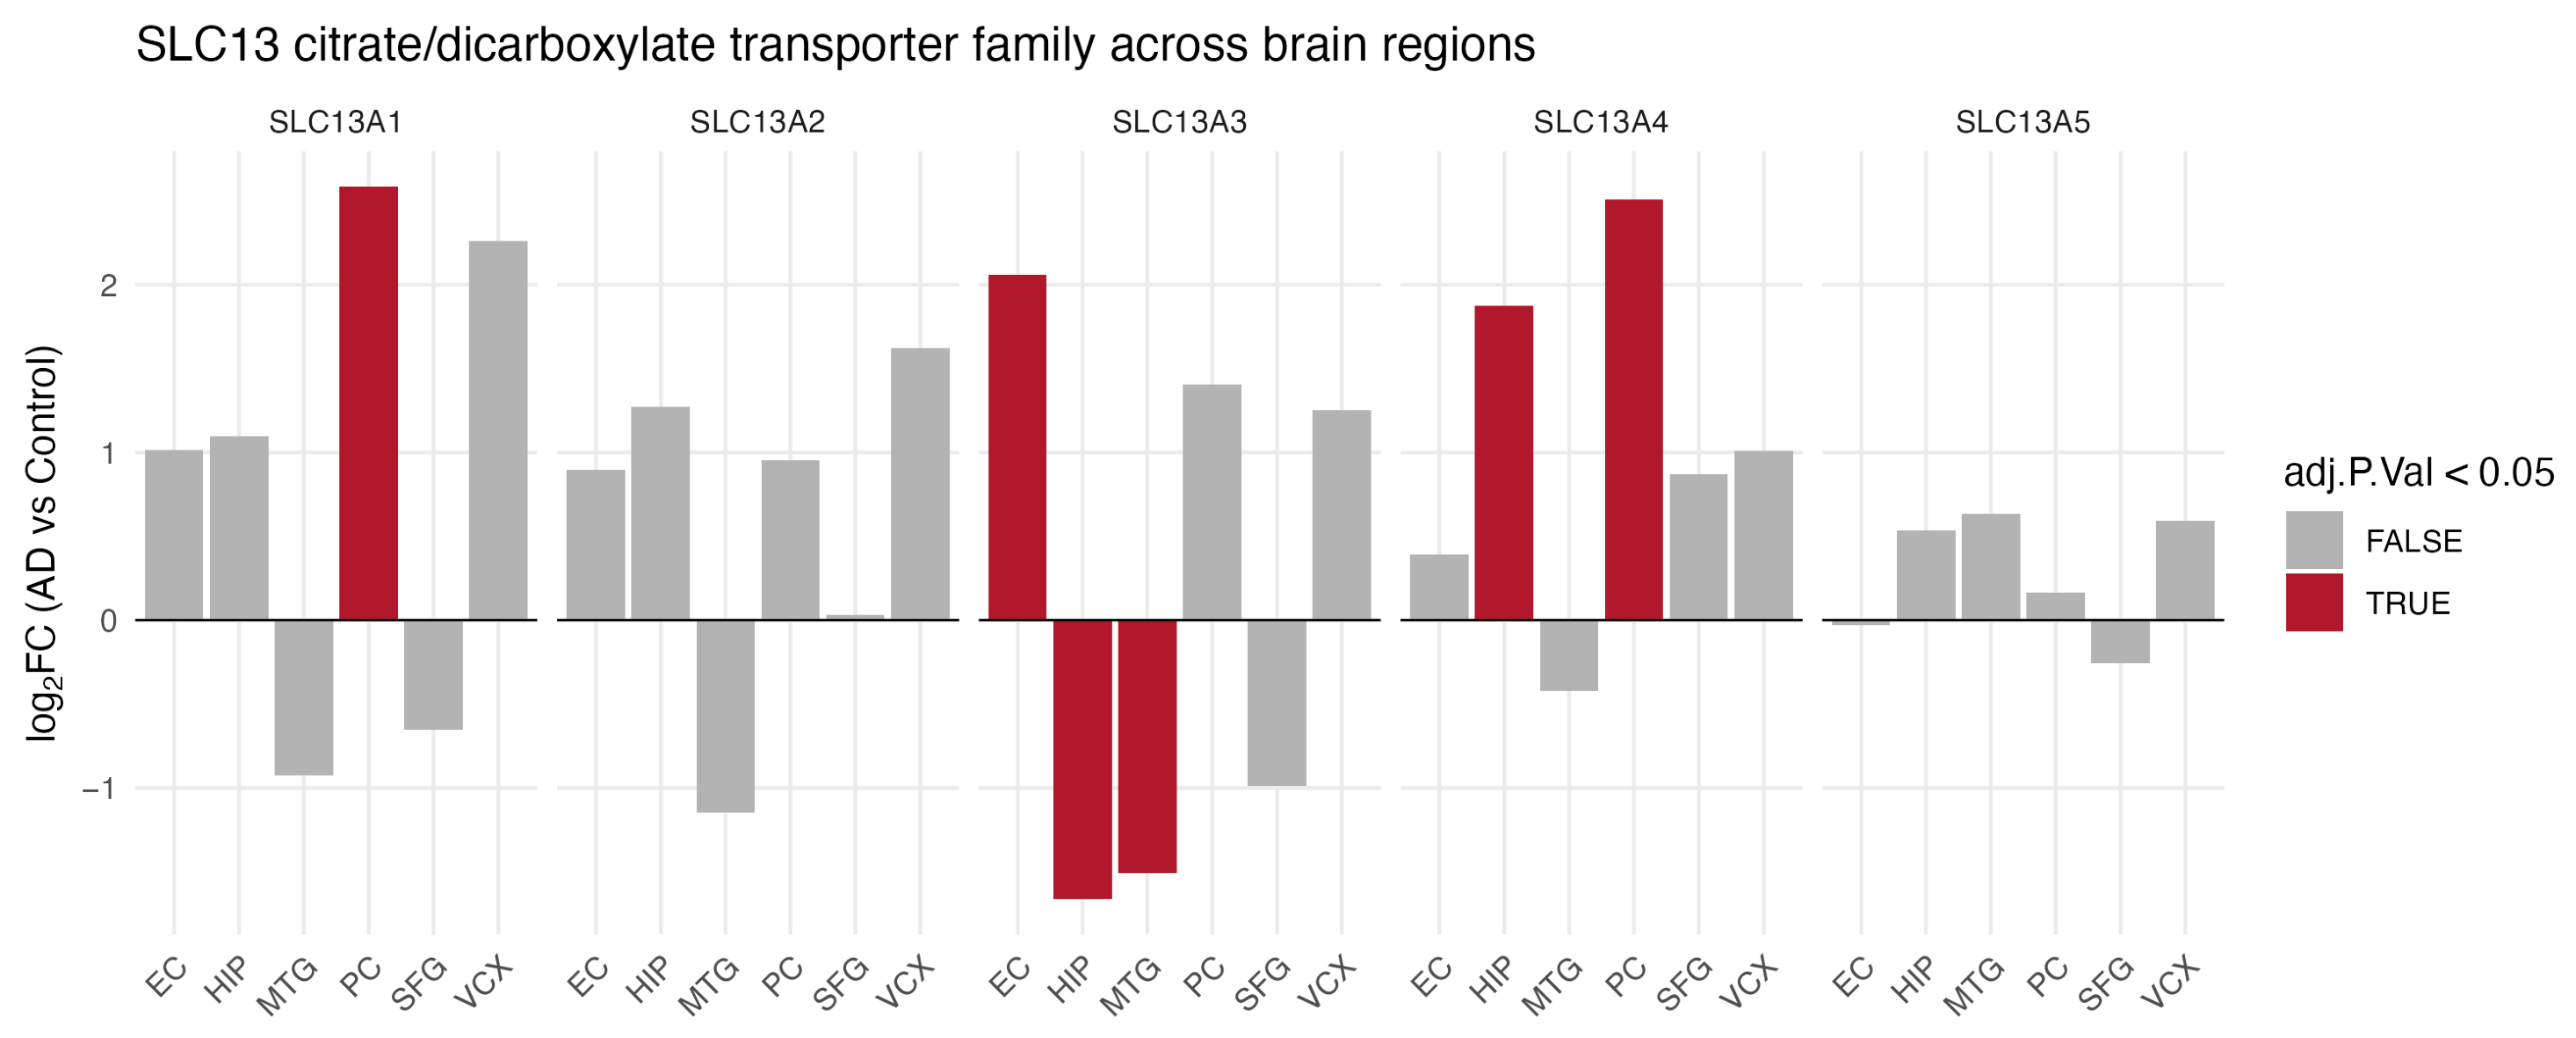
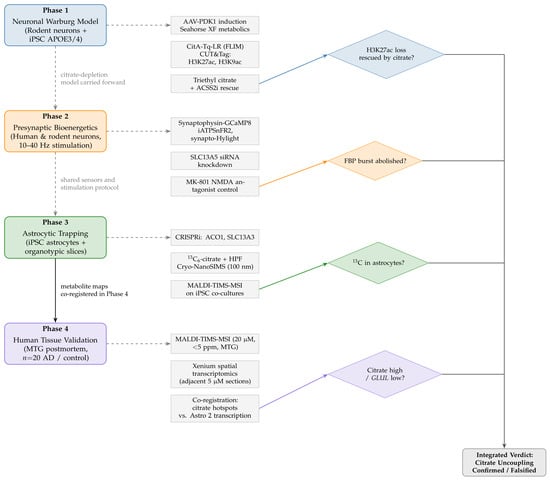
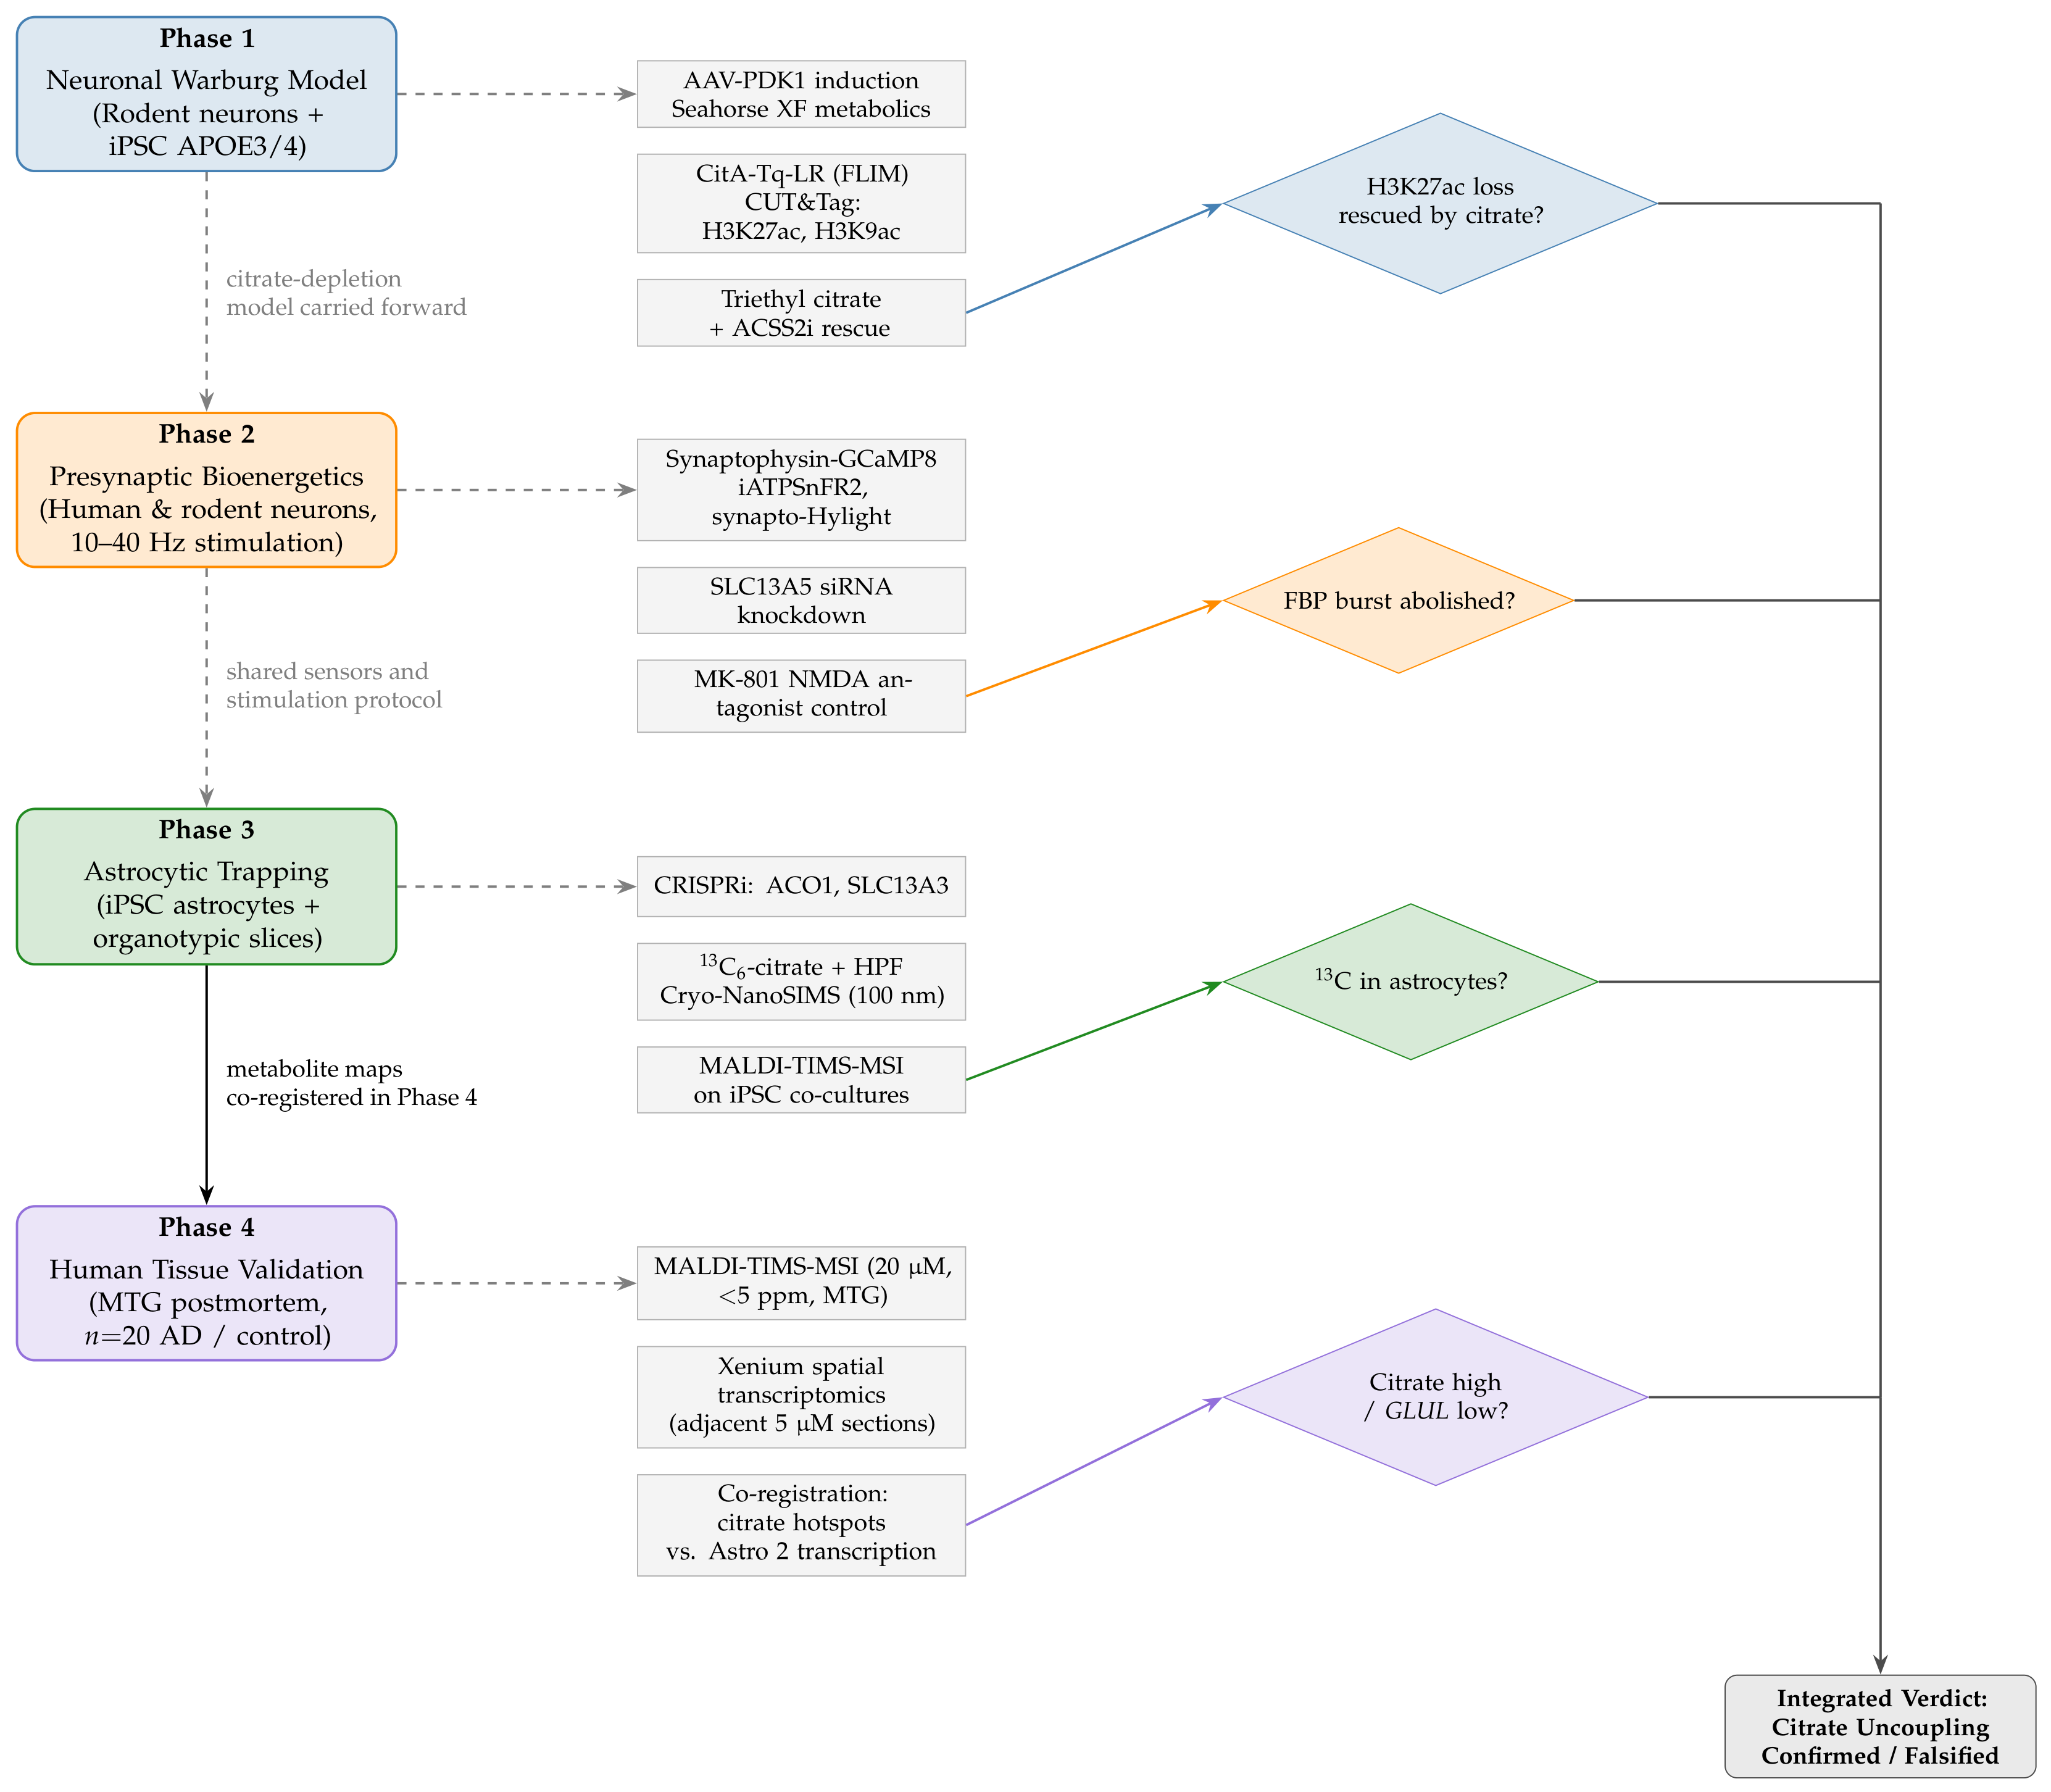

Disclaimer/Publisher’s Note: The statements, opinions and data contained in all publications are solely those of the individual author(s) and contributor(s) and not of MDPI and/or the editor(s). MDPI and/or the editor(s) disclaim responsibility for any injury to people or property resulting from any ideas, methods, instructions or products referred to in the content. |
© 2026 by the authors. Licensee MDPI, Basel, Switzerland. This article is an open access article distributed under the terms and conditions of the Creative Commons Attribution (CC BY) license.