


Abstract
This paper presents an experimental investigation into the flow characteristics and volumetric efficiency (ηvol) of a fixed-displacement external gear pump (GHD 17R) operating under coupled hydraulic parameters using an eco-friendly synthetic ester-based hydraulic fluid (48 mm2·s−1 at 40 °C). Measurements were performed on a laboratory single-circuit hydraulic test rig across a rotational speed range of 500–2500 min−1, operating pressure range of 2–10 MPa, and fluid temperature range of 30–60 °C. To eliminate flow fluctuations caused by structural vibrations at 1250 and 1750 min−1, a 15% trimmed mean statistical filter was successfully implemented. A comparative sensitivity analysis—evaluating absolute, normalized, and relative significance—was developed and compared against a three-way analysis of variance (ANOVA) effect size model (η2 and partial η2). The relative sensitivity approach identified rotational speed as the dominant parameter for direct hydraulic flow, accounting for 95.80% of total variation. Conversely, when evaluating volumetric efficiency, the proportional impact of speed was removed, revealing a balanced distribution of internal losses: rotational speed contributed 54.73%, fluid temperature 26.08%, and pressure 19.19%. The three-way ANOVA confirmed that all primary parameters and their cross-interactions had a statistically significant effect (p < 0.05). The findings scientifically demonstrate that temperature-induced viscosity collapse exhibits a stronger relative dynamic sensitivity on volumetric losses than pressure fluctuations within standard operating envelopes. The constructed multi-dimensional flow and efficiency maps provide practical input for advanced diagnostic tools, real-time thermal condition monitoring, predictive maintenance, and energy-optimized control schemes in modern fluid power systems using eco-friendly lubricants.
1. Introduction
Hydraulic systems remain a standard solution wherever high power density, reliable energy transfer, and accurately controlled actuator motion are required. One of their key components is the hydraulic pump, because the pump determines the delivered fluid flow rate and thus directly affects actuator speed, system response, and overall hydraulic performance. Gear pumps still retain an important place in engineering practice due to their simple design, compact dimensions, and relatively low manufacturing cost [1]. For a fixed-displacement positive-displacement pump, the theoretical flow rate is primarily determined by the pump displacement and rotational speed [2]. Under real operating conditions, however, the actual delivered flow rate is lower than the theoretical one because part of the displaced volume is lost through internal volumetric losses.
These volumetric losses are mainly associated with fluid leakage through functional clearances inside the pump, including radial, axial, and side leakage paths between moving and stationary parts. Their magnitude depends not only on pump geometry, but also on differential pressure, operating speed, fluid viscosity, and the overall condition of the hydraulic system [2,3]. Increasing pressure raises the driving force for internal leakage, whereas increasing oil temperature reduces viscosity and usually weakens the fluid’s ability to limit backflow. At the same time, rotational speed changes not only the theoretical flow rate but also the relative contribution of volumetric losses to the delivered volume [1,2,3,4,5]. As a result, the flow behavior of a gear pump cannot be described sufficiently by a single nominal value or a single catalog characteristic but should be treated as the outcome of coupled operating parameters.
Previous studies have confirmed that hydraulic–fluid properties directly affect the energy efficiency of hydraulic systems [3,6], the growth of functional clearances reduces the volumetric efficiency of external gear pumps [2], and pump modeling and experimental evaluation should reflect real operating conditions [5,7]. In this context, temperature-dependent characteristics are particularly important. Stawiński et al. [1] showed that mapping the volumetric efficiency of a gear pump as a function of pressure, rotational speed, and oil temperature provides substantially more practical information than conventional single-point characteristics, and that increasing oil temperature may noticeably deteriorate pump performance. Similarly, our recent published works indicate that viscosity is one of the decisive fluid properties in hydraulic systems and that excessively low viscosity promotes leakage, thereby unfavorably affecting flow behavior and long-term operating performance [6,7].
Despite this, design practice still often relies on catalog data related only to a limited number of operating points. For real system design, estimation of hydrostatic actuator speed, diagnostics, and control, such information is frequently insufficient because it does not capture the combined effect of pressure, temperature, and rotational speed on the actual delivered flow rate [1,5,8]. Within the source base used in this study, no directly applicable experimental map of actual flow rate was identified for the GHD 17R pump in the specific operating window corresponding to our laboratory measurements. Therefore, a practically and scientifically relevant task remains: to experimentally determine how the actual flow rate of this pump changes in the operating space defined by rotational speed, pressure, and oil temperature.
The aim of this paper is to experimentally investigate the flow rate of the GHD 17R gear pump as a function of rotational speed, pressure, and oil temperature within the ranges of 500–2500 min−1, 2–10 MPa, and 30–60 °C. The measurements are carried out on a laboratory single-circuit hydraulic test rig equipped with HYDAC sensors, and the resulting data are used to construct flow maps describing the dependence of the measured flow efficiency on rotational speed, pressure, and oil temperature. The main contribution of this paper is an experimentally verified description of the actual flow behavior of a specific fixed-displacement gear pump, together with an evaluation of the relative influence of the individual operating parameters on flow variation, providing a practical basis for a more accurate design, control, and diagnostics of hydraulic systems using this pump type.
While previous investigations [1,2,9,10] evaluated volumetric losses under isolated operating points, an integrated empirical framework that uncouples dynamic parameter-interaction effects for biodegradable synthetic esters remains scarce in the current literature. The main research gap addressed by this study is the quantitative determination of dynamic sensitivity hierarchies combining real-time thermal, speed, and pressure fluctuations. The primary limitation of this study lies in testing a single representative production pump, meaning absolute efficiency offsets may vary within manufacturing tolerance bands (±5 µm axial clearance variations), although relative physical sensitivity trends remain highly generalizable.
2. Materials and Methods
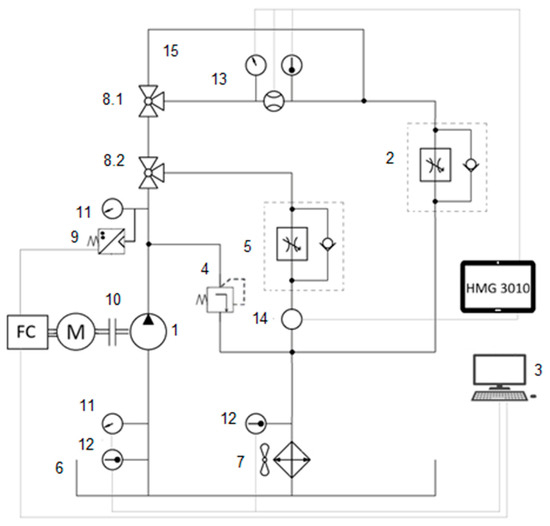
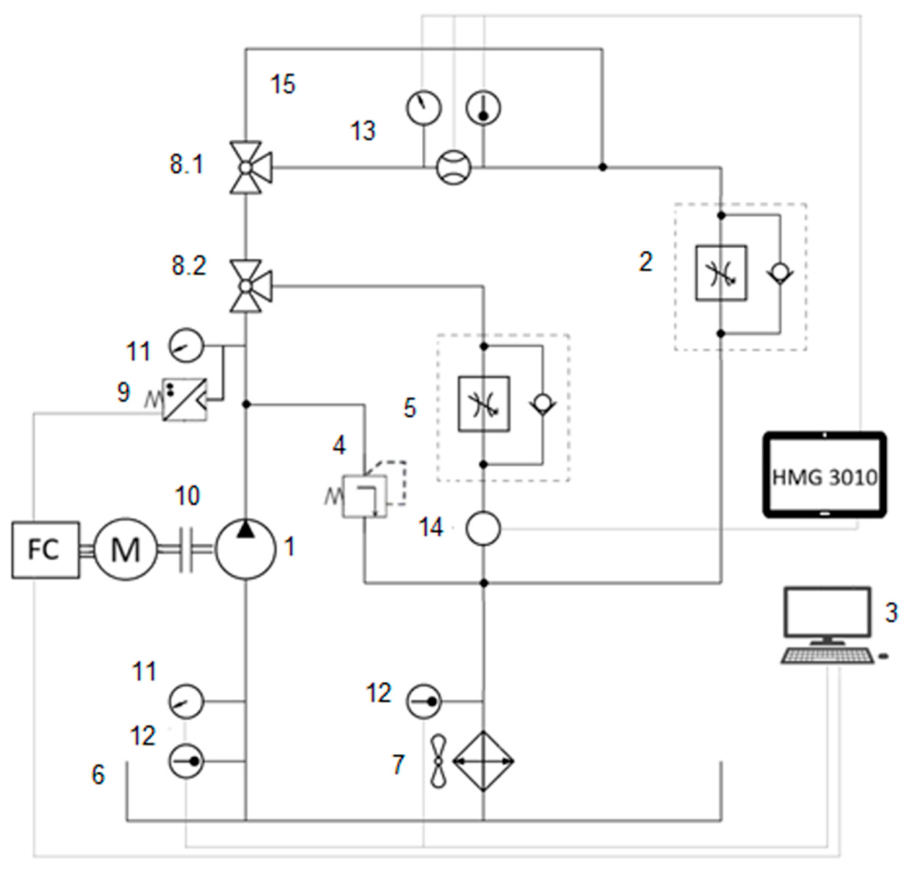
For the experiment, a parallel testing device located at the Slovak University of Agriculture in Nitra was utilized. The device is shown in Figure 1. This device consists of two separate circuits, but for our test it was reconfigured to one-circuit use. Electrical energy was delivered to the rig via a frequency converter providing a stable current and voltage, thereby maintaining the stable rotational speed of the electric motor. This electromotor was directly connected with a hydraulic pump by a clutch but without a change in torque. The hydraulic pump used in this test was from the gear pump GHD 17R (Jihostroj, Velesin, Czech Republic). The pump produces a fluid flow, which was slowed down by a choke valve controlled mechanically, by hand. This enables higher operational pressures to be set within the circuit; fluid friction across the restriction generates heat, causing the oil temperature to rise. To maintain a stable temperature during measurements, an air–oil cooler was positioned on the circuit return line directly above the fluid tank. This cooler uses two fans and air–fluid heat exchange, and it is controlled automatically, by a computer and algorithm created in the graphical programming language LabVIEW (Version 14) when the set temperature is reached. Prior to the main experimental phase, a precise calibration of the rotational speed of the motor and the frequency converter Delta VFD-C2000 (Delta Electronics, Tchaj-pej, Taiwan) was performed to verify the linearity of the speed control system. For the independent verification of the actual shaft rotational speed during calibration, a certified and calibrated ALMEMO measurement system (ALMEMO measurement system Holzkirchen, Germany) was utilized. An automated calibration algorithm was developed in the LabVIEW environment, which systematically increased the control voltage from 0 to 10 V with a step of 0.5 V. To allow full stabilization of the motor shaft speed at each level, a dwell time of 15 s was implemented between consecutive voltage steps. Due to the safe operating limits of the attached Jihostroj GHD 17R gear pump, the maximum calibration speed was restricted to 2700 min−1. The evaluated GHD 17R external spur gear pump represents a standardized industrial design widely deployed in mobile hydraulic applications, agricultural machinery, and industrial power packs. It features standard involute spur gears and dynamic axial clearance compensation. While the quantitative metrics in this study stem from a single factory-calibrated pump unit—acknowledging that manufacturing tolerances (±5 µm clearance variations) and assembly fits introduce minor absolute offset variations—the qualitative relative sensitivity hierarchy and dynamic response patterns depend primarily on fundamental fluid mechanics (gap backflow vs. fluid viscosity). Therefore, the physical trends and sensitivity ratios are qualitatively transferable to other external spur gear pumps of comparable geometric proportions. The hydraulic pump characteristics are summarized in Table 1.
Figure 1.
Hydraulic scheme of the testing device, where: 1. Hydraulic gear pump, 2. Choke valve for loading, 3. Computer, 4. Mechanical safety valve, 5. Choke valve for heating up the circuit, 6. Tank, 7. Cooler, 8.1, 8.2 Three-way valves, 9. Electronic safety valve, 10. Clutch, 11. Pressure gauge, 12. Thermometer, 13. HYDAC measurement device, 14. HLB sensor, 15. Bypass for protecting sensors during loading, M—electromotor, and FC—Frequency converter.
Table 1.
Properties of the hydraulic pump (source: Jihostroj datasheet available at https://www.jihostroj.com/cs/produkce/hydraulika/cerpadla-a-motory/produkt/ghd1, (accessed on 22 July 2026)
Traditional design practice and manufacturer datasheets typically provide static, single-point performance curves for fixed-displacement external gear pumps under nominal operating conditions. Such catalog data fail to capture the coupled dynamic loss mechanics that occur under real-world operational variations. The primary novelty of this study lies in establishing an experimentally validated, transferable evaluation framework that uncouples the simultaneous effects of rotational speed, operating pressure, and fluid temperature when using biodegradable synthetic ester fluids. The key transferable process innovation introduced by this research is a dual-sensitivity ANOVA mapping approach. By distinguishing raw hydraulic flow sensitivity from normalized volumetric efficiency sensitivity, this framework provides quantitative scaling metrics that reveal how temperature-induced viscosity collapse dominates volumetric degradation over pressure variations within standard operating envelopes (2–10 MPa, 30–60 °C). These generalized trends are directly applicable to the development of real-time thermal monitoring algorithms, digital twins, and predictive maintenance schemes for external spur gear pumps of comparable geometric construction.
A biodegradable synthetic hydraulic fluid based on esters was used as the working medium. According to the manufacturer’s technical data, the typical properties of the fluid are: density at 15 °C of 0.918 g·cm−3, kinematic viscosity at 40 °C of 48 mm2·s−1, viscosity index of 184, pour point of −42 °C, Cleveland open-cup flash point of 320 °C, FZG failure load stage of 12, and biodegradability higher than 90%. These properties are relevant for the present experiment because the viscosity and density of the working fluid affect internal leakage, pressure losses, and the resulting volumetric efficiency of the tested gear pump.
Data collection was executed using a comprehensive suite of calibrated HYDAC instrumentation. Fluid flow rate was monitored via an EVS 3100 (HYDAS, Sulzbach, Germany) turbine flow meter, system operating pressure was captured using HDA 4700 (HYDAS, Sulzbach, Germany) tensometric pressure transducers, and fluid temperature was tracked using ETS 4100 (HYDAS, Sulzbach, Germany) silicon-based temperature sensors. All primary sensors were interfaced directly with a HYDAC HMG 3010 (HYDAS, Sulzbach, Germany) handheld data acquisition and display unit, enabling real-time multi-channel logging at a sampling frequency of 100 Hz (10 ms interval). The detailed technical specifications, operational ranges, and verified measurement accuracies of all test bench hardware components and sensors are systematically summarized in Table 2.
Table 2.
Technical specifications of the experimental test bench components and operational instrumentation.
After collecting data from all the measurements, statistical methods were used. From pre-set parameters (pressure, temperature), the arithmetic mean was computed, as small fluctuations around nominal values were expected. However, when processing the data for hydraulic flow, only 95% of values were counted as the arithmetic mean, as extremes from both sides were excluded. This was done in Excel by the “trimean” function.
From the obtained values of hydraulic flow, we could compute volumetric efficiency using Formula (1). These efficiencies provide a better insight into the quality of the performance of the hydraulic gear pump, because volumetric efficiency is not directly dependent on the rotational speed of gear pump hydraulic flow.
where:
Q—measured flow [dm3·min−1].
Vg—geometric volume of the pump [dm3].
n—rotational speed [min−1].
For practical reasons, especially because flow is easily measured in practice, we continued the experiment with two sets of values—flow rates and volumetric efficiencies, using the same statistical methods.
To determine which input parameter plays the greatest role in the change in flow (or change in flow efficiency), we computed the relative contribution of factor to change ΔQ (Δη), normalized sensibility of the system ΔQ/ΔX, and relative sensibility (ΔQ/Qavg)/(ΔX/Xavg) to determine the contributions. After converting relative sensibility to percentages, we could obtain the index of relative significance.
Based on the data distribution, Table 3 was created, comparing various methods to determine the influence of the change in respective parameters on hydraulic flow.
Table 3.
Three different methods used to determine normalized sensitivity.
For this statistical method, we need to know the difference between maximal and minimal values if only one input parameter changes (e.g., 30 °C, 2 MPa, and flow at 2500 min−1–500 min−1). This was calculated using Formula (2).
Relative contributions of factor to flow (later efficiency) variations ΔQrpm, ΔQpres, and ΔQtemp were computed to assess which parameter changed hydraulic flow the most (in our measurement, we neglected the ranges of entrance parameters). ΔQrpm was calculated as the maximal minus minimal value of the flow while two input parameters were stabilized (pressure and temperature, e.g., 30 °C, 2 MPa). From all the combinations, with these two stabilized parameters, we obtained 9 combinations for different rotational speeds. We obtained the maximal and minimal values and computed their difference. We computed these differences for all combinations of the two stabilized parameters and then calculated the arithmetic mean, median, and trimean values of all ΔQrpm values. Analogically, we proceeded for pressure and temperature.
Influence on measured flow was computed from the sum of respective influences and their conversion to %, according to Formula (3):
The same formula was used for median values and trimean values.
Normalized sensitivity was calculated using Formula (4):
This formula was applied for every row in Table 3, and then Formula (3) was applied in the same way as before to convert normalized sensitivities into percentage values.
Table 3 can be supplemented with relative sensitivity following Formula (5):
where:
ΔQ—average flow of max–min values for two stabilized parameters;
Qavg—average flow of the entire experiment (all combinations);
ΔX—range of measurement;
X—average of respective input parameters in the entire experiment.
All of the mentioned statistical approaches were used for flow efficiencies as well, but the previous section was presented for the sake of briefly explaining hydraulic flow only.
Apart from LabView software and Excel, MATLAB R2026a was used as well. This program enabled us to create 3D charts from our measurements, showing the evolution of flow in various backgrounds. It was also used to create ANOVA tables to confirm the results of our method. From the results in the MATLAB ANOVA tables, parameter η2 was computed and transferred into percentages from Formula (6) to assess how variability is explained by the respective factors. Partial η2 was computed and transferred into % from Formula (7) to express the strength of each factor with respect to the unexplained errors of the model.
3. Results
Operational testing followed a fully factorial design matrix. Oil temperature was regulated dynamically using an automated computer-controlled air/oil heat exchanger to within +1.0 °C/−0.5 °C around set nominal values (30, 40, 50, 60 °C). Operating pressure was established using a manual throttling valve to within ±0.1 MPa of set points (2, 4, 6, 8, 10 MPa). Shaft rotational speed was controlled via the Delta VFD-C2000 frequency converter from 500 to 2500 min−1 in increments of 250 min−1. The speed precision of the frequency converter drive remained under 1% across the maximum operational range, even when subjected to sudden pressure fluctuations. At each steady-state operating point, high-frequency data sampling (10 ms interval over 5 s, yielding 500 records per point) was executed.
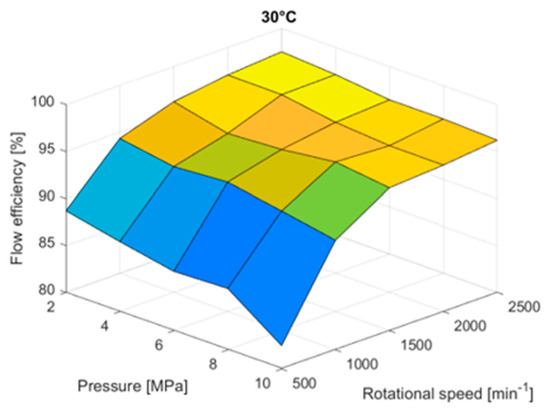
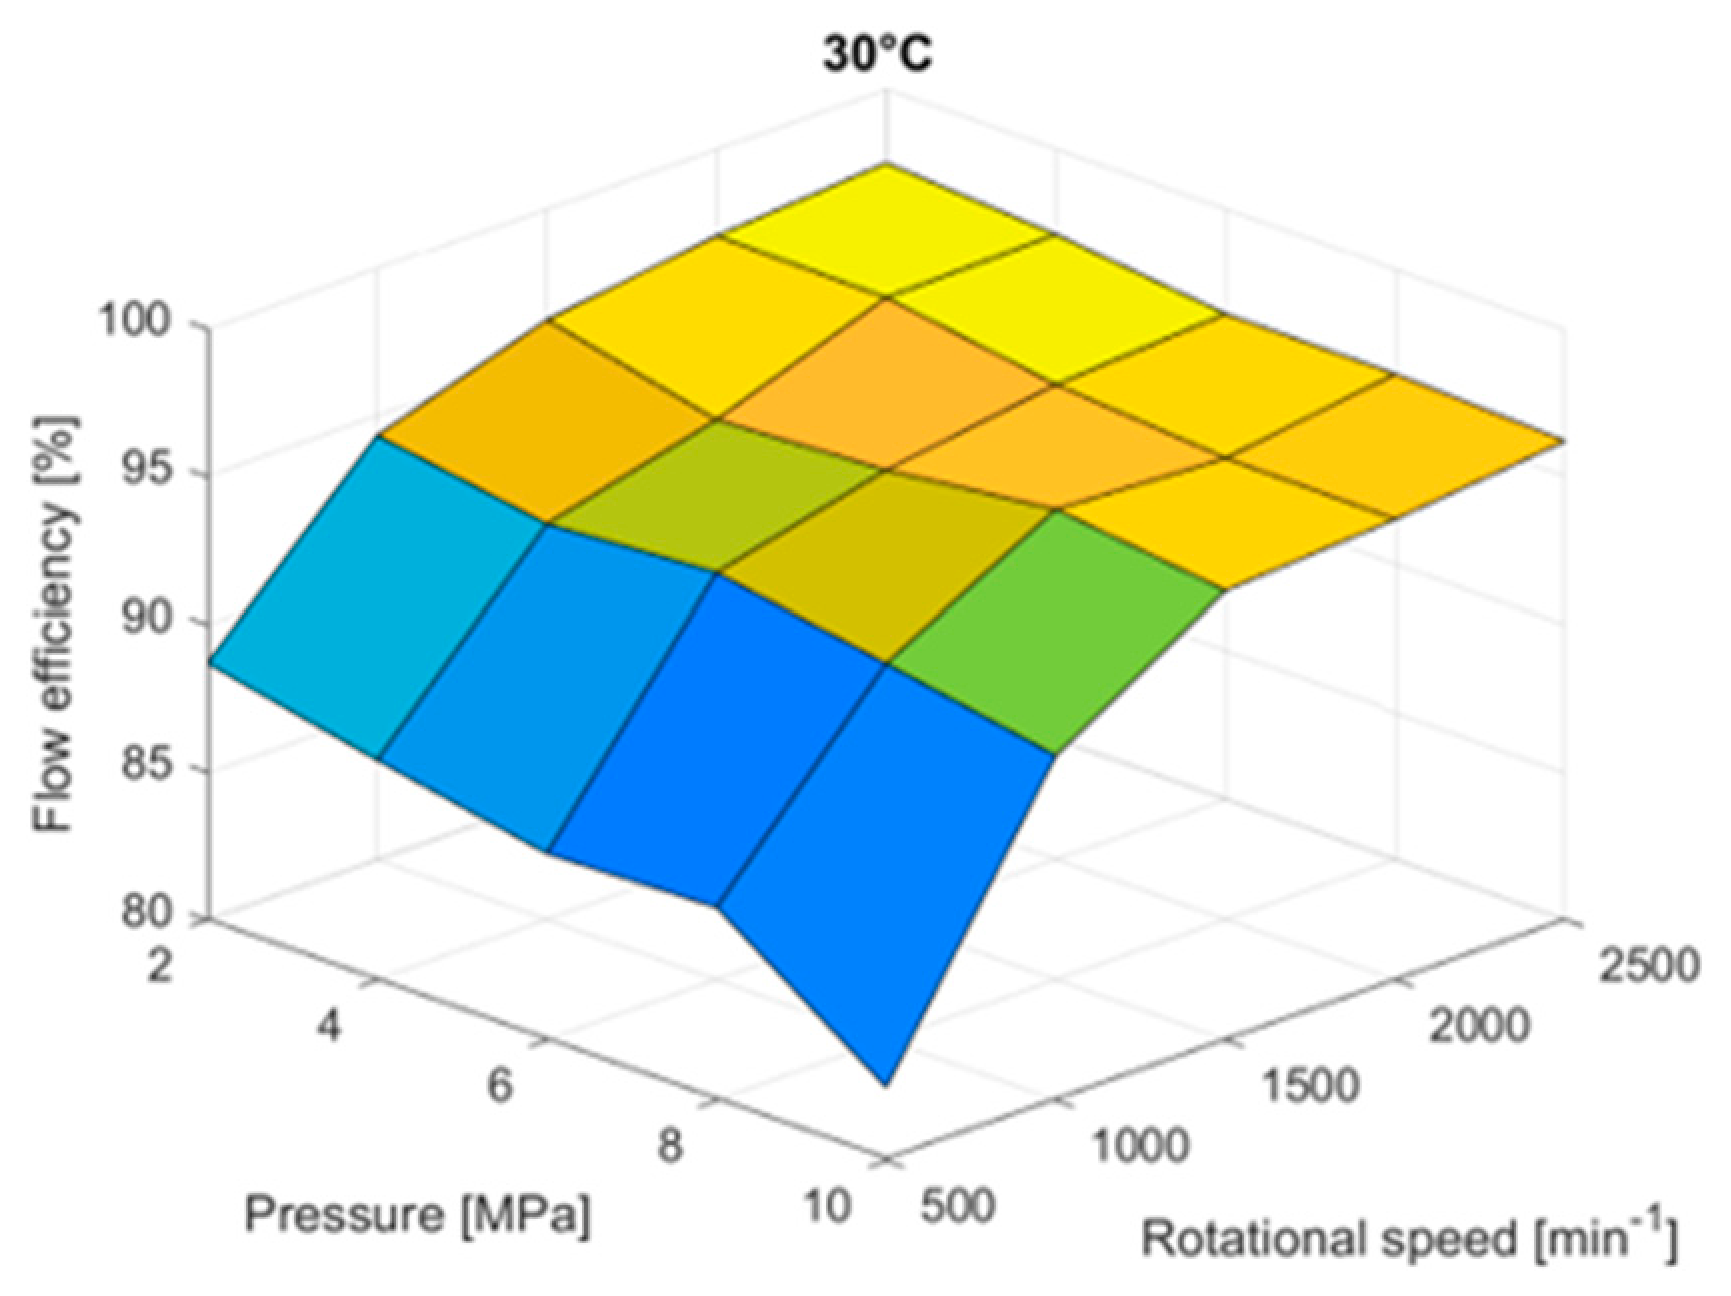
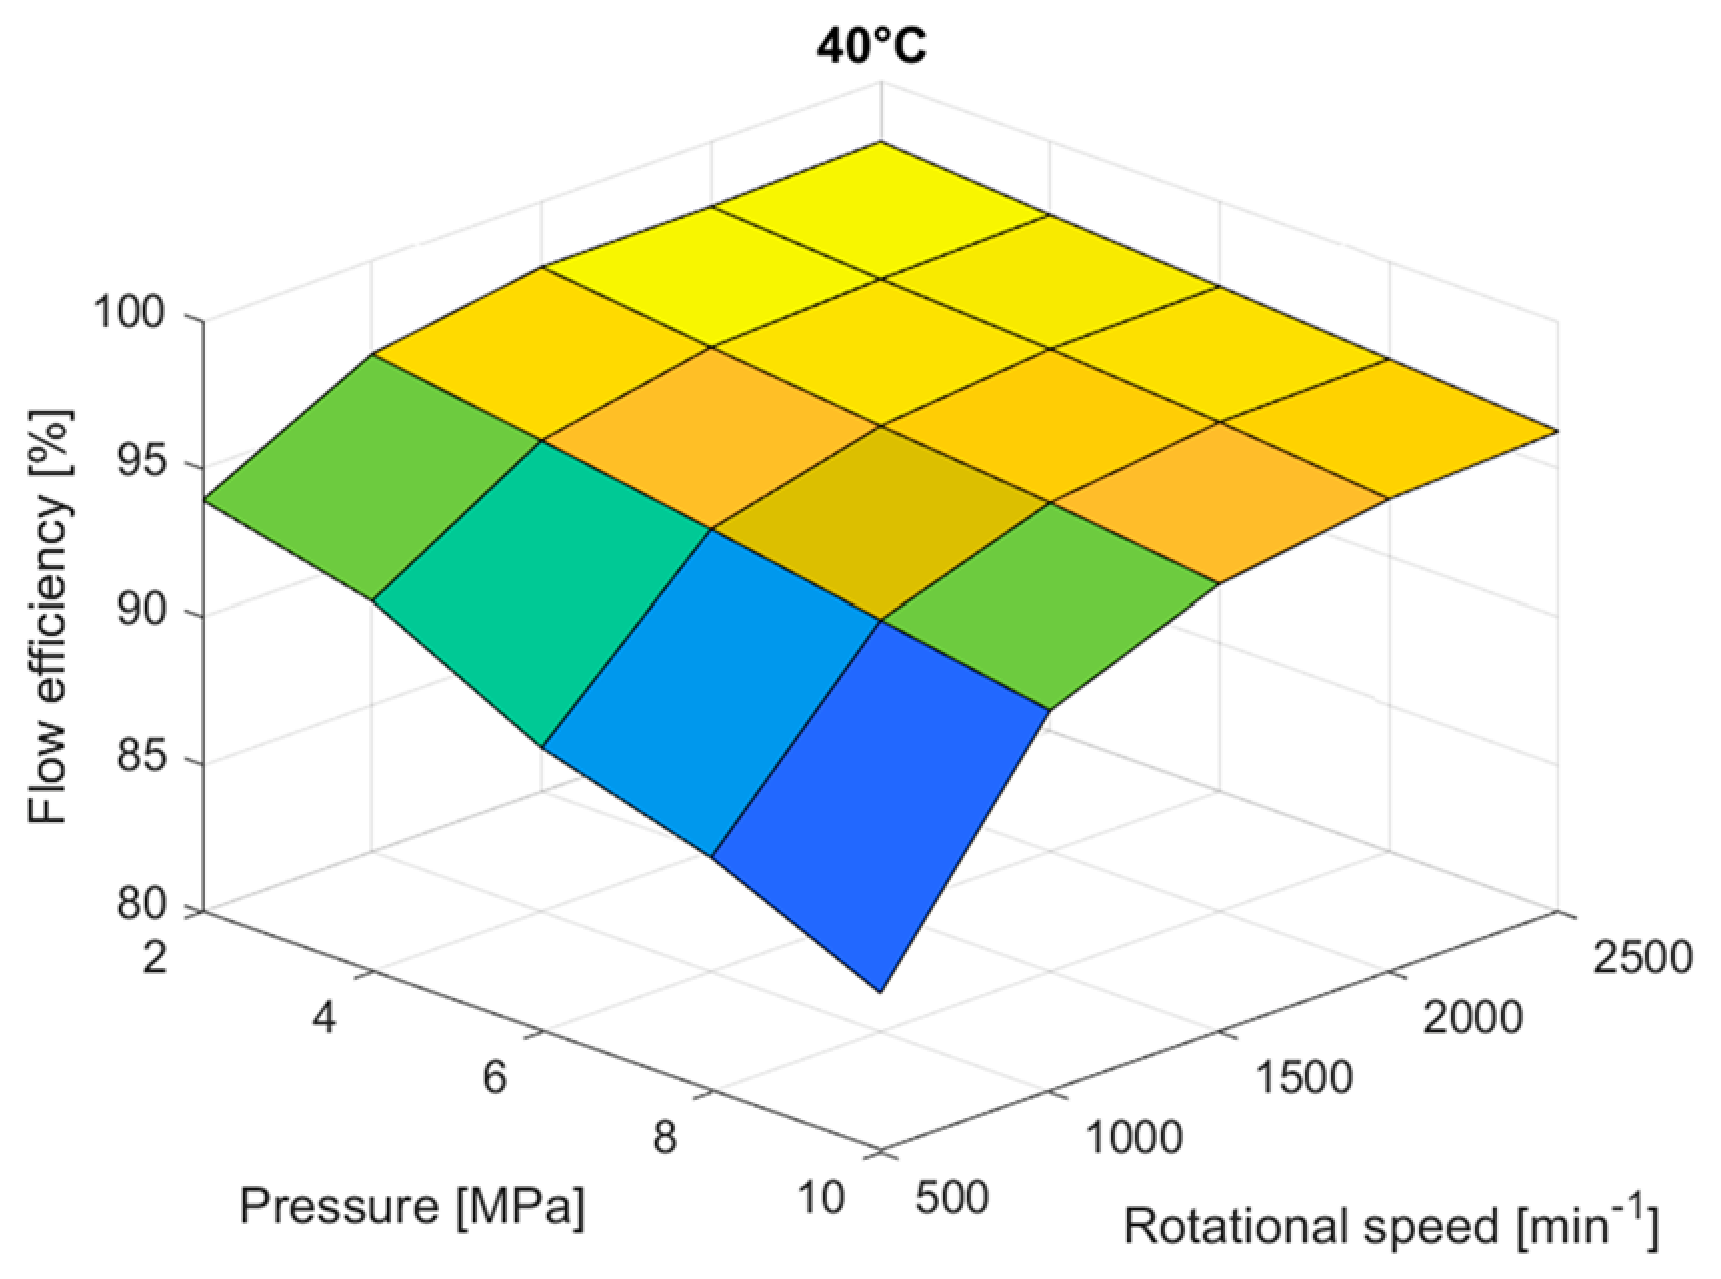
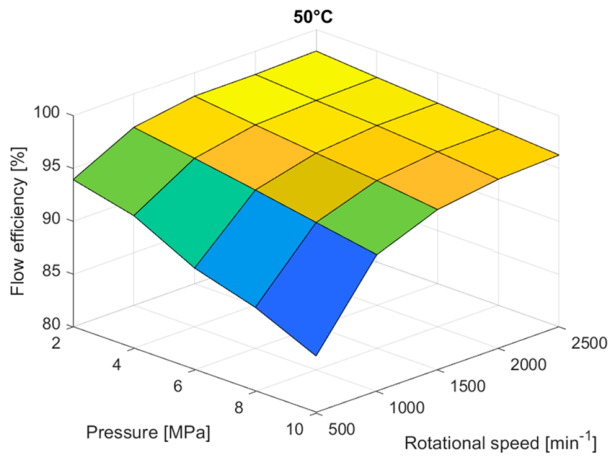
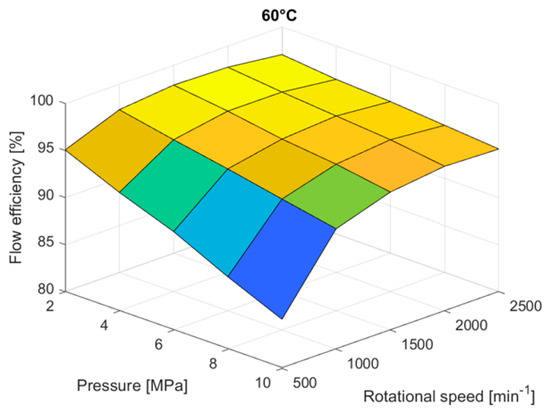
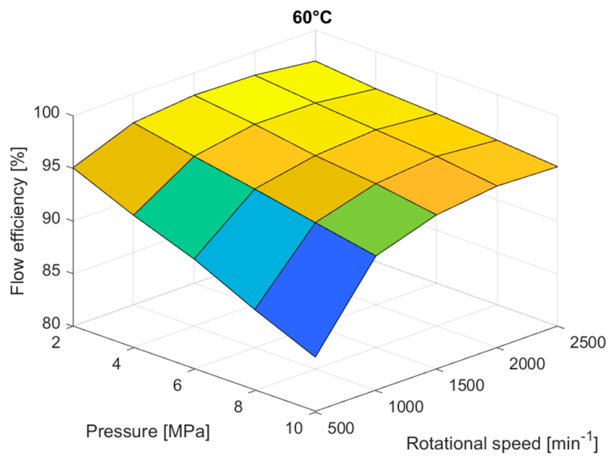
The obtained results seen in Figure 2, Figure 3, Figure 4 and Figure 5 are expressed as four graphs from the temperature standpoint (each figure shows the evolution of combinations at the preset temperature):
Figure 2.
Three-dimensional map of flow efficiencies with respect to pressure and rotational speed, for various temperatures (30 °C).
Figure 3.
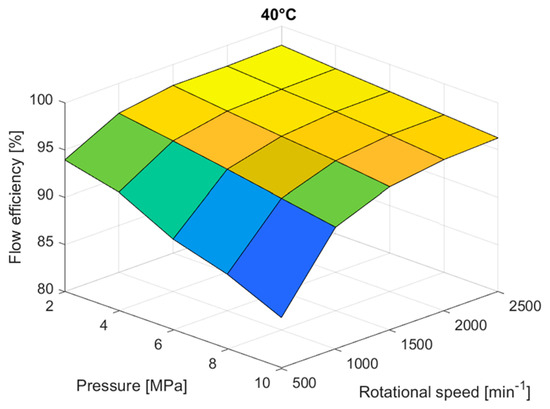
Three-dimensional map of flow efficiencies with respect to pressure and rotational speed, for various temperatures (40 °C).
Figure 4.
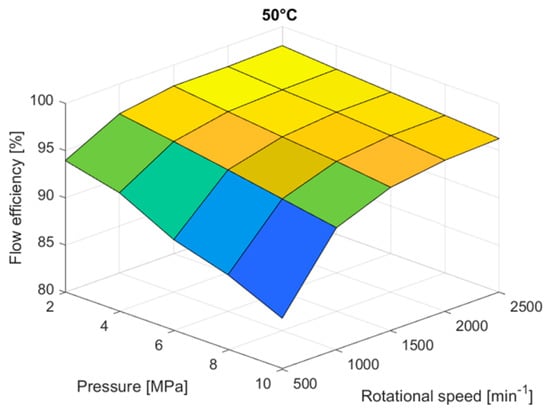
Three-dimensional map of flow efficiencies with respect to pressure and rotational speed, for various temperatures (50 °C).
Figure 5.
Three-dimensional map of flow efficiencies with respect to pressure and rotational speed, for various temperatures (60 °C).
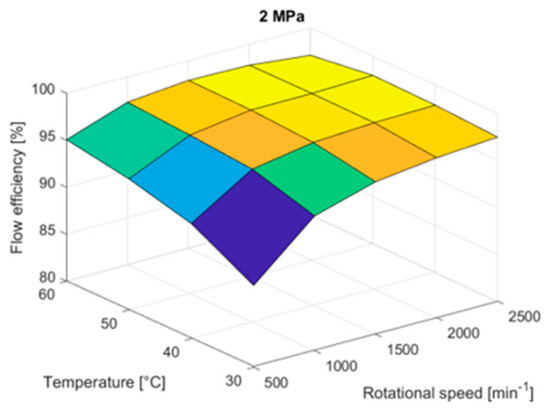
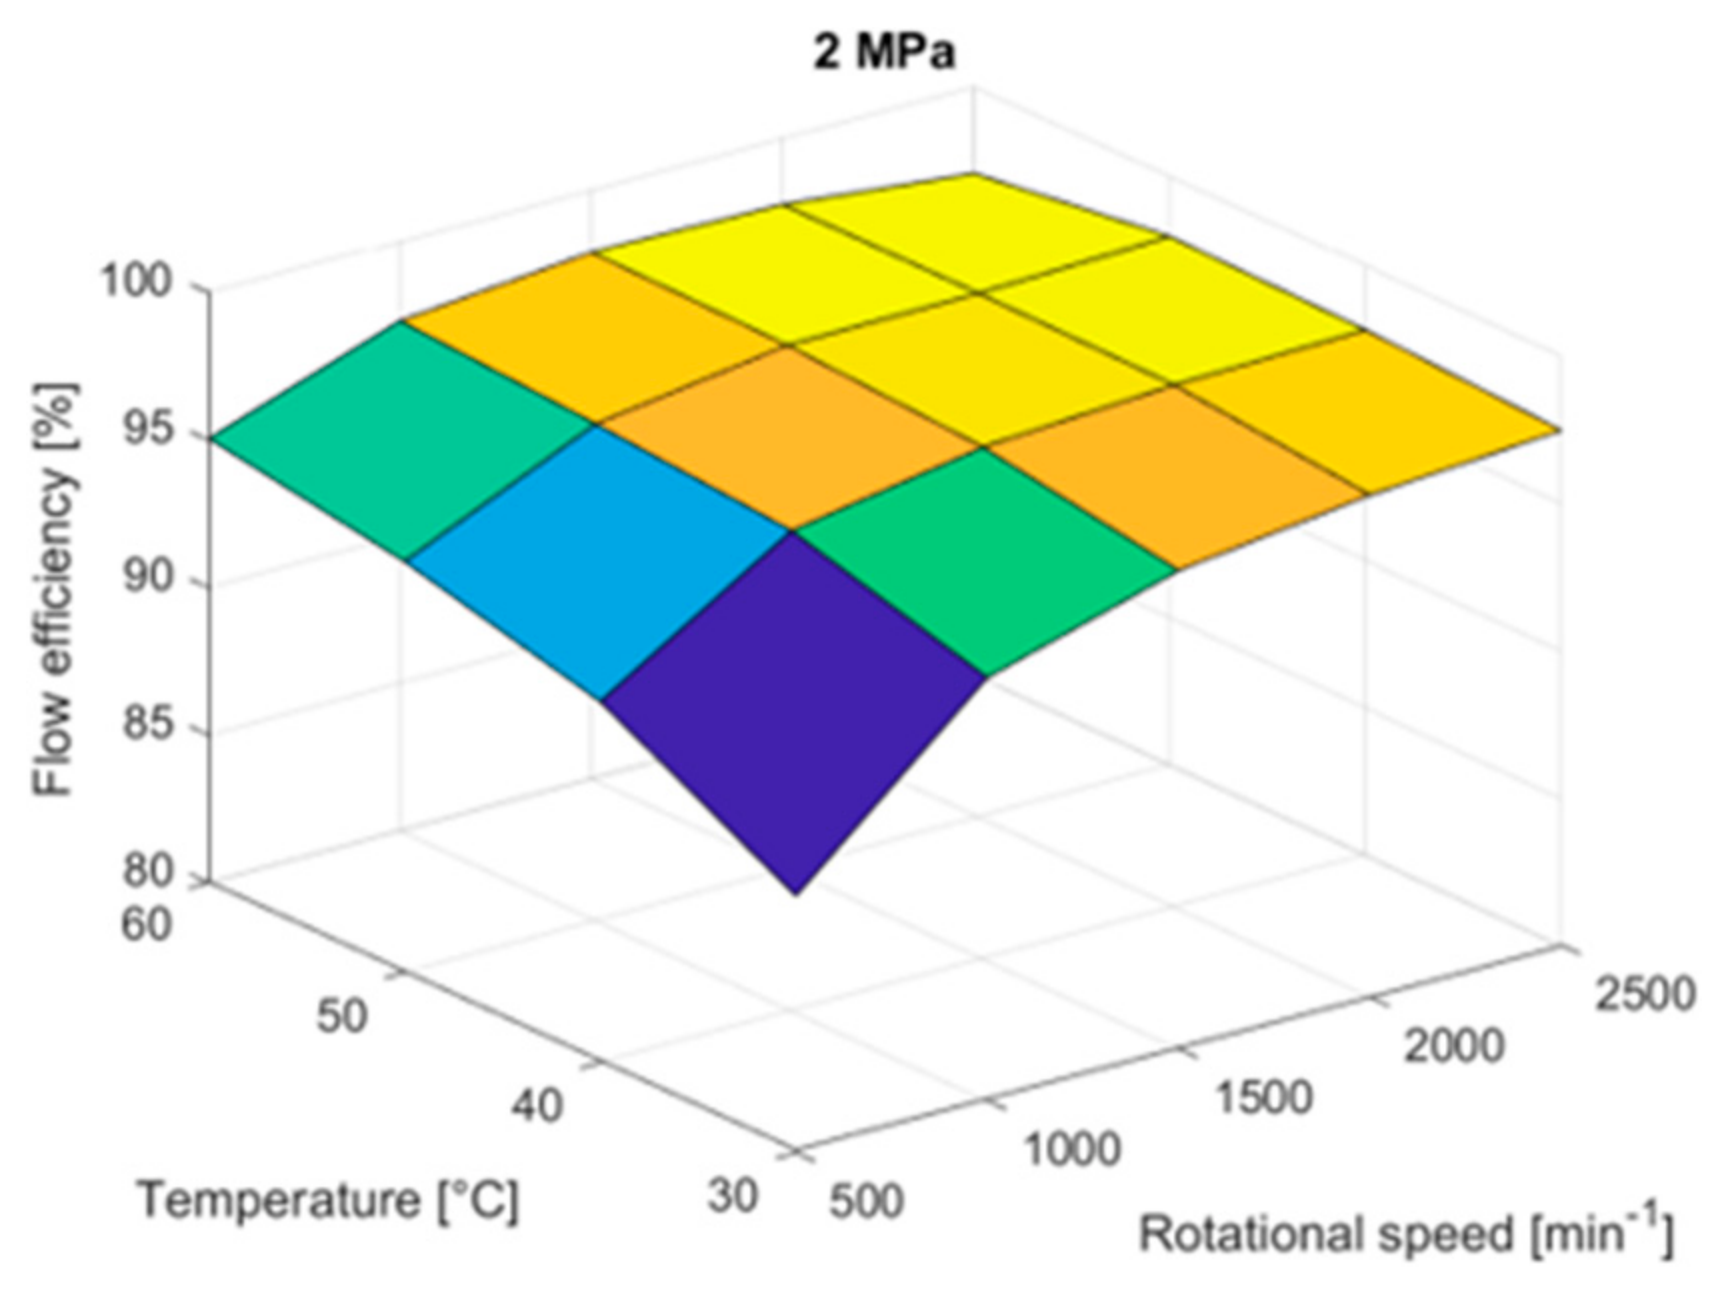
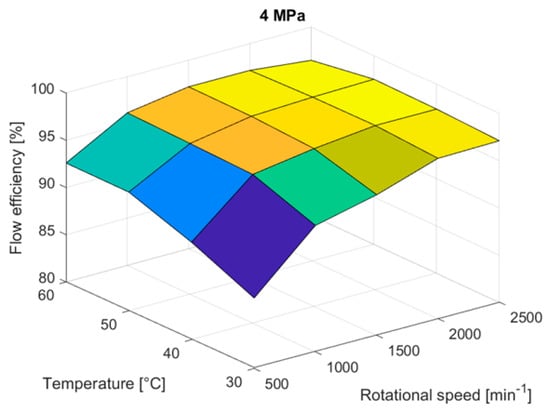
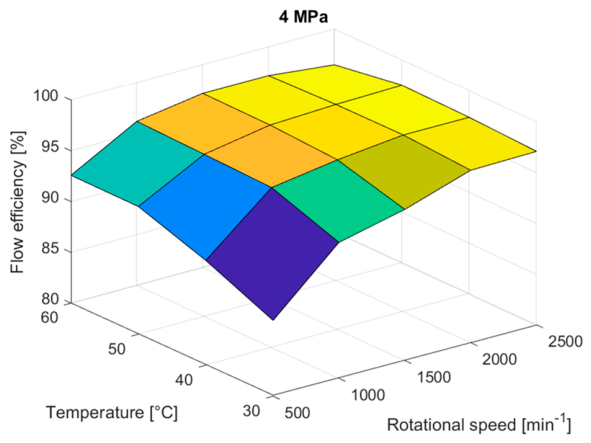
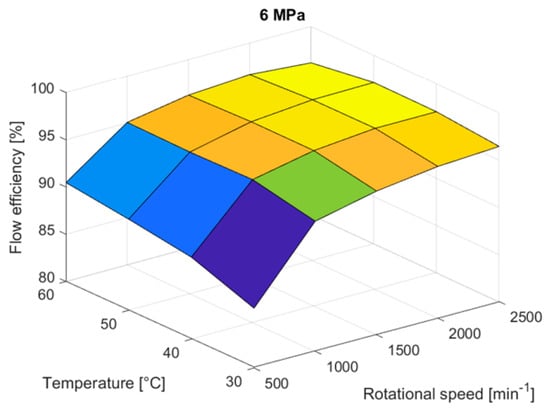
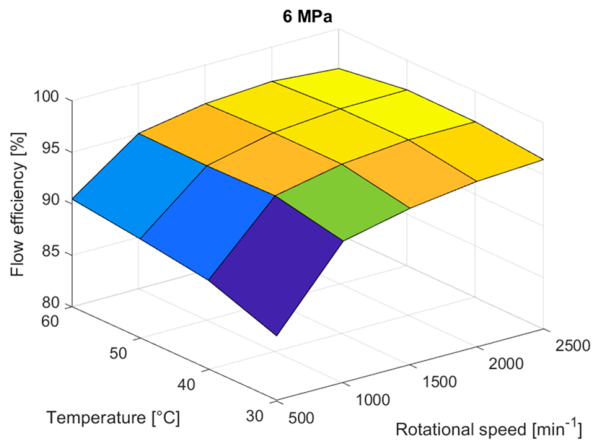
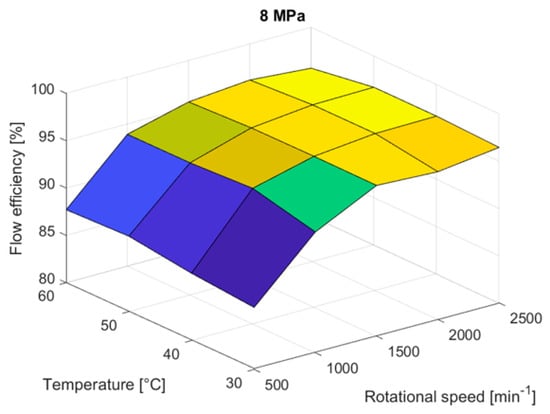
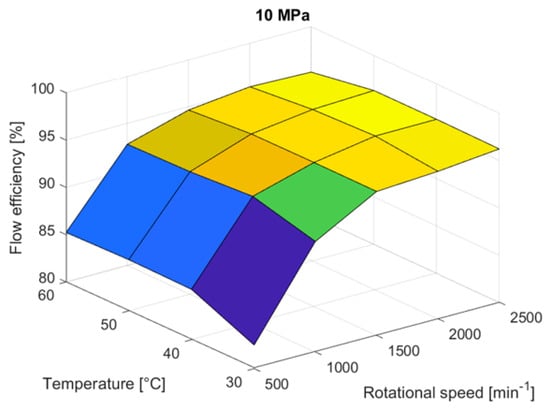
The same graphical interpretation was presented from the standpoint of pressure as well, as seen in Figure 6, Figure 7, Figure 8, Figure 9 and Figure 10.
Figure 6.
Three-dimensional map of flow efficiencies with respect to temperature and rotational speed, for various pressures (2 MPa).
Figure 7.
Three-dimensional map of flow efficiencies with respect to temperature and rotational speed, for various pressures (4 MPa).
Figure 8.
Three-dimensional map of flow efficiencies with respect to temperature and rotational speed, for various pressures (6 MPa).
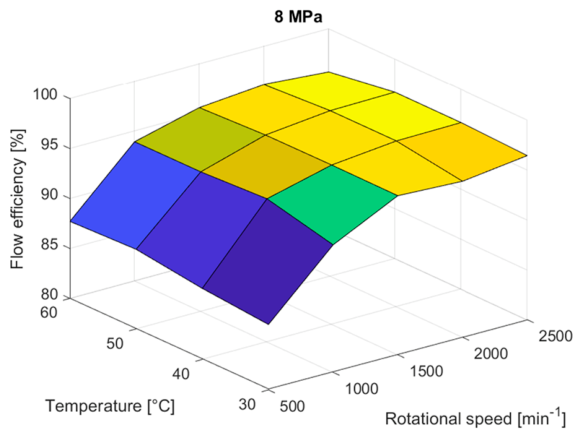
Figure 9.
Three-dimensional map of flow efficiencies with respect to temperature and rotational speed, for various pressures (8 MPa).
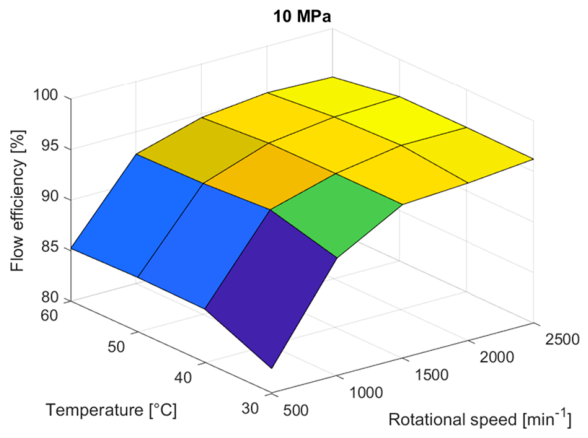
Figure 10.
Three-dimensional map of flow efficiencies with respect to temperature and rotational speed, for various pressures (10 MPa).
The steep efficiency declines and localized depressions observed on the 3D response surfaces—most pronounced at low rotational speeds (N ≤ 750 min−1) combined with high oil temperatures (T ≥ 50 °C)—represent operating regimes characterized by high relative internal slip. At low rotational speeds, theoretical pump-displacement flow (Qth = Vg. N) is small. When combined with the high thermal thinning of the oil, absolute gap leakage (Qleak) is a high percentage of theoretical flow, resulting in a severe localized efficiency cliff. Furthermore, transient thermal expansion differences between steel gear shafts and aluminum housing plates under extreme thermal gradients temporarily alter design clearances (h), forming localized surface depressions.
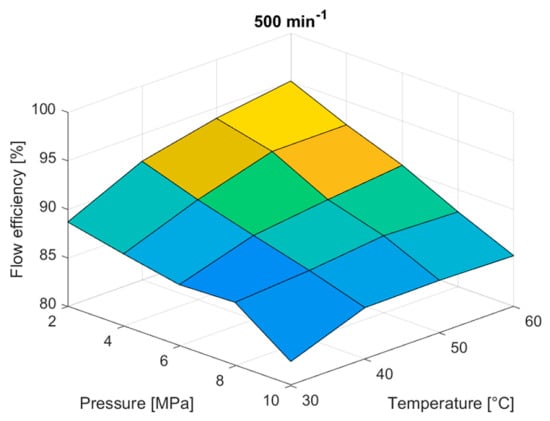
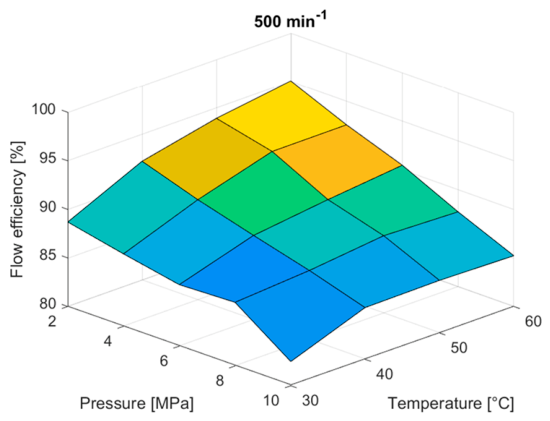
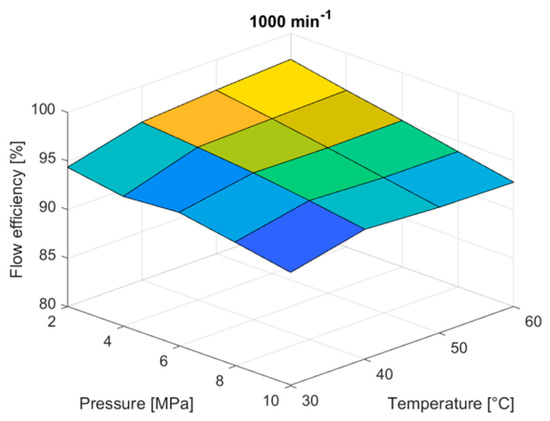
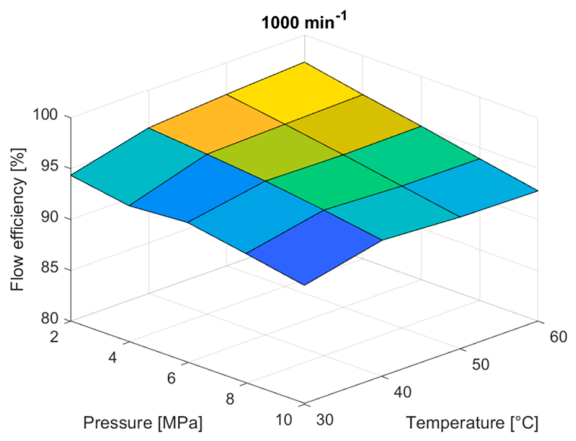
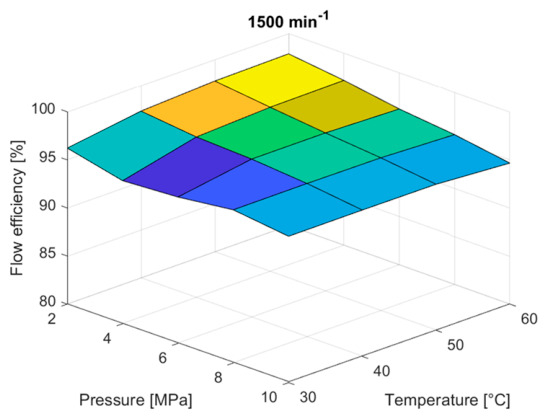
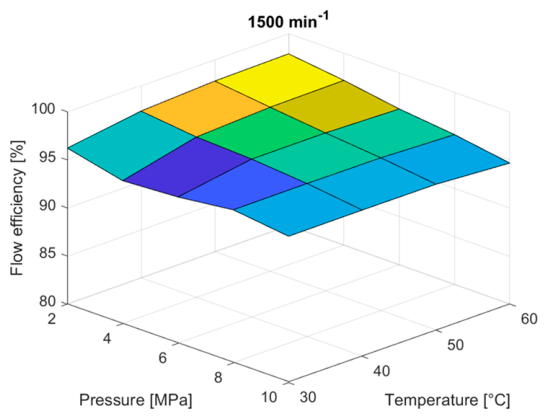
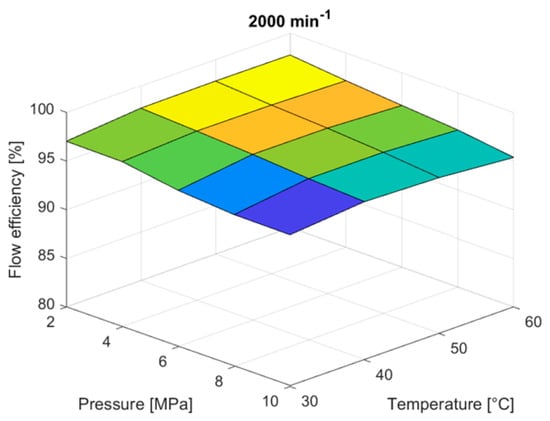
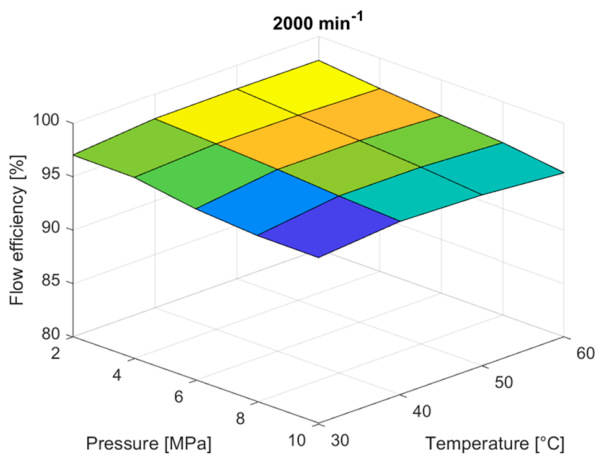
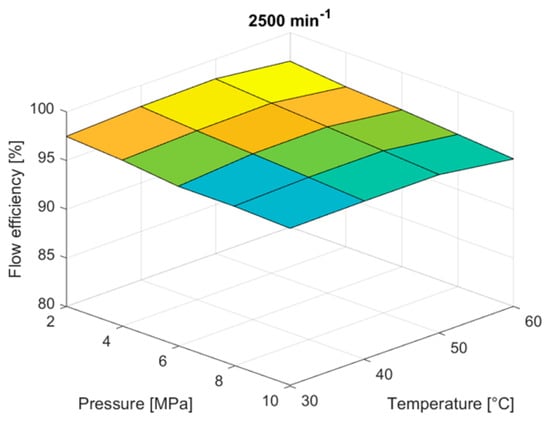
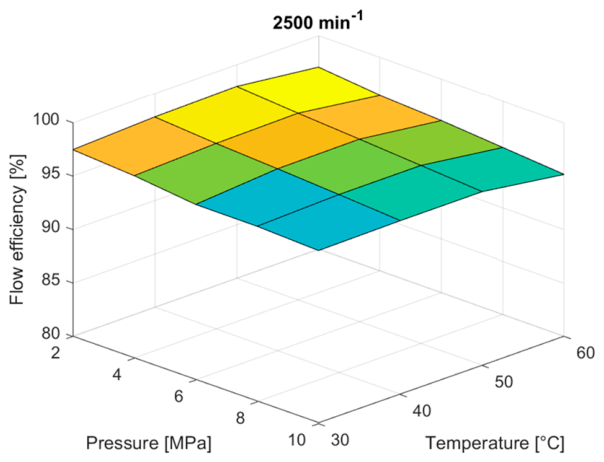
The same graphical interpretation was performed from the standpoint of rotational speed as seen in Figure 11, Figure 12, Figure 13, Figure 14 and Figure 15.
Figure 11.
Three-dimensional map of flow efficiencies with respect to pressure and temperature, for various rotational speeds (500 min−1).
Figure 12.
Three-dimensional map of flow efficiencies with respect to pressure and temperature, for various rotational speeds (1000 min−1).
Figure 13.
Three-dimensional map of flow efficiencies with respect to pressure and temperature, for various rotational speeds (1500 min−1).
Figure 14.
Three-dimensional map of flow efficiencies with respect to pressure and temperature, for various rotational speeds (2000 min−1).
Figure 15.
Three-dimensional map of flow efficiencies with respect to pressure and temperature, for various rotational speeds (2500 min−1).
During dynamic testing, structural resonance occurred at specific rotational speeds, particularly around 1250 and 1750 min−1. At these operating points, flow signal fluctuations were observed; to eliminate outlier tail noise, a 15% trimmed mean filter was applied to the dataset. This trimean function was applied to ΔQ values. For comparison, arithmetic mean without this exclusion and median were calculated as well. Table 4 shows the results and partial results leading to an evaluation of normalized sensitivity according to Table 3.
Table 4.
Normalized sensitivity computed from three different databases.
As presented in Table 4, rotational speed variation provides the dominant relative contribution to change in flow at around 97%. All three methods, average, median, and trimean, led us to very similar results. However, the rotational speed was changed at a significantly bigger interval than pressure or temperature, so normalized sensitivity was computed. This describes how strongly the system reacts to small change in parameter values. And in this case, the system is the most sensitive to changes in pressure at around 73%.
Normalized sensitivity also helped to convert all the values into usable units, because by dividing we obtained: , , and . These results now express a change in flow dependent on change in the entrance value by 1 unit; in other words, local sensitivity. However, it is important to notice that 1 MPa creates a larger interval than 1 min−1. For a global evaluation, seen in Table 5, the relative sensitivity needs to be computed.
Table 5.
Global relative sensitivity analysis of dynamic hydraulic flow rate (Qmeas) with respect to operating parameters (rotational speed, pressure, and oil temperature).
Relative sensitivity is a huge advantage for this research, because it better recognizes the strength of respective intervals of values. Rotational speed was established as having a 95.80% contribution, pressure value of 1.88%, and temperature value of 2.32%. Even when accounting for measurement uncertainty (temperature: −0.5 °C/+1 °C), we cannot consider 2.32% of the influence to change in flow as remarkable. This result, however, indicates the dominant influence of rotational speed on flow in the entire range, which was expected. For this reason, all statistical approaches were recalculated for the flow efficiencies as well, and this can be seen in Table 6.
Table 6.
Normalized sensitivity analysis of volumetric efficiency (ηvol) computed across arithmetic mean, median, and 15% trimmed mean statistical bases.
The justification for the marked shift in relative sensitivity between Table 6 (raw dynamic flow) and Table 7 (volumetric efficiency) lies in the mathematical formulation of displacement machinery. In raw flow analysis, rotational speed directly drives the theoretical volume (Qth = Vg·N), resulting in the speed dominating 95.80% of global variation. When evaluating volumetric efficiency (ηvol = Qmeas/Qth), the linear multiplier N is normalized out. This exposes the true balance of internal fluid dynamic losses, shifting the relative importance toward oil temperature (26.08%) and operating pressure (19.19%). The relative contribution to change in flow is divided more evenly in efficiency analysis, with maxima still at rotational speed, however with higher variation between the respective methods. Normalized sensitivity then reduces this variability, identifying pressure as the most significant contributor per unit parameter change. As mentioned before, because units are not comparable, relative sensitivity was computed to gain global picture of sensitivities. This is illustrated in Table 7.
Table 7.
Relative sensitivity of flow efficiency to respective parameters.
Relative sensitivity describes rotational speed as the biggest contributor to change in flow efficiency, with contribution at almost 55%. What is interesting is that, within our range of measurement, temperature influences efficiency more than pressure. This result may vary with different hydraulic pumps and different measurement ranges.
The Anova method computed in the MATLAB program was used to confirm the validity of our approach. Three-way ANOVA confirmed that pressure, temperature, and rotational speed have a statistically significant effect on the flow rate with p values < 0.05, as seen in Table 8 and Table 9. The size of their effect was determined using η2.
Table 8.
ANOVA table for hydraulic flow analysis.
Table 9.
ANOVA table for hydraulic efficiency analysis.
In Table 10, a comparison of the relative sensitivity method to the ANOVA-based effect size method is illustrated.
Table 10.
Comparison of relative sensitivity analysis and ANOVA analysis for hydraulic flow and hydraulic efficiency analysis.
Comparing the ANOVA-based effect size method to relative sensibility, we observed a similar trend—when assessing the hydraulic flow, the rotational speed was the most significant contributor to variance. But when assessing volumetric efficiencies, the rotational speed’s contribution fell to 68%, 54%. However, when comparing pressures and temperatures, the relative sensibility tells us that temperature is the greatest contributor to the overall change in the output parameter, but the ANOVA effect size reveals the opposite result. This could be explained by interactions, which the ANOVA method deals with separately, while our approach using relative sensitivity neglects these interactions.
The statistically significant cross-interaction terms identified by three-way ANOVA (P × T accounting for 1.215% η2 and N × P for 6.832%) represent underlying physical coupling mechanisms rather than statistical noise. The P × T interaction term captures the non-linear coupling between pressure-driven Poiseuille gap flow and dynamic fluid viscosity reduction. As the working pressure rises, internal leakage is forced through radial and tip clearances; however, the magnitude of this leakage increases exponentially if elevated temperatures simultaneously reduce dynamic oil viscosity. Similarly, the N × T interaction reflects fluid shear heating in gear mesh zones at high speeds, which localizes thermal thinning beyond bulk fluid measurements.
4. Discussion
The results of the present study confirm that the flow rate of the GHD 17R gear pump is mainly controlled by rotational speed. This agrees with Shi et al. [4], who describe the theoretical flow of positive-displacement pumps as a function of displacement volume and rotational speed. In the present experiment, rotational speed contributed approximately 96% to the direct change in measured hydraulic flow when the ΔQ-based evaluation was used. This confirms its dominant role over the whole measured range. A similar relationship between pump speed and flow behavior was also considered by Vacca et al. [11] for external gear pumps.
The obtained results also support the approach of Stawiński et al. [1], who emphasized that pump performance should be evaluated using maps including pressure, rotational speed, and oil temperature. Their study mainly focused on volumetric efficiency and temperature effects, while the present study applies a similar mapping approach to both measured hydraulic flow and flow efficiency of the GHD 17R pump. This is also consistent with Rydberg et al. [5], who highlighted the need to evaluate gear pumps under real operating conditions.
When the direct change in measured hydraulic flow was evaluated using arithmetic mean, median, and 15% trimmed mean, rotational speed was clearly the dominant parameter. Depending on the statistical method, its contribution to ΔQ was approximately 96%, while the contributions of pressure and temperature were much smaller. This result is expected for a fixed-displacement gear pump, because theoretical flow is directly proportional to pump displacement and rotational speed. Therefore, even though pressure and temperature influence internal leakage and fluid properties, their direct effect on total measured flow was much smaller than the effect of rotational speed in the investigated operating range.
The normalized sensitivity evaluation provided a different interpretation. After dividing the flow change by the investigated interval of each parameter, pressure showed the highest normalized sensitivity, followed by rotational speed and temperature. This does not contradict the dominant absolute influence of rotational speed. Rather, it indicates that a unit change in pressure had a stronger local effect on measured flow than a unit change in rotational speed or temperature. This is also expected because 1 MPa represents a much larger part of the investigated pressure interval than 1 min−1 represents in the rotational-speed interval. The high normalized sensitivity of pressure is physically reasonable because increasing pressure promotes internal leakage through functional clearances inside the gear pump.
In the hydraulic flow analysis based on ΔQ and normalized sensitivity, oil temperature showed the weakest influence among the three investigated parameters. Although the investigated temperature interval was larger than the pressure interval, its contribution to the direct change in measured flow remained low. This behavior can be explained by the indirect nature of the temperature effect. Temperature does not change the theoretical displacement flow directly, as rotational speed does, but affects the hydraulic system mainly through changes in oil viscosity. A decrease in viscosity may reduce flow resistance in pipes and throttling elements, but at the same time it may increase internal leakage in the pump clearances and therefore reduce volumetric efficiency. In the present hydraulic flow evaluation, these viscosity-related effects were smaller than the dominant effect of rotational speed and the normalized pressure effect within the investigated range.
The pressure-related interpretation is consistent with Mitov et al. [2], who showed that radial and axial clearances significantly affect the volumetric efficiency of external gear pumps. The present study did not measure internal clearances directly, but the observed pressure sensitivity supports the same general mechanism: increasing the pressure increases the driving force for leakage and reduces the actual delivered flow. This mechanism is also consistent with the gear pump analyses of Azeez et al. [12] and Liu et al. [13], where leakage and internal flow behavior are important factors in gear pump performance.
For a global evaluation of parameter importance, relative sensitivity was also calculated. In this evaluation, rotational speed remained the dominant parameter affecting measured hydraulic flow. It accounted for 95.80% of the relative sensitivity, while temperature and pressure contributed only 2.32% and 1.88%, respectively. Therefore, within the investigated operating ranges of 500–2500 min−1, 2–10 MPa, and 30–60 °C, the measured hydraulic flow was influenced primarily by rotational speed, followed by oil temperature, while pressure had the lowest relative contribution. This confirms that the direct speed-dependent displacement flow dominated the measured hydraulic flow, whereas viscosity-related temperature effects and pressure-induced leakage had only minor global influence on the flow rate.
A different but more informative result was obtained when flow efficiency was evaluated instead of measured flow. In this case, rotational speed accounted for 54.73% of the relative sensitivity, followed by temperature with 26.08% and pressure with 19.19%. This shows that, after the direct proportional effect of rotational speed on theoretical flow was reduced through the efficiency calculation, the influence of temperature and pressure became more visible. Nevertheless, rotational speed remained the most influential parameter even for flow efficiency. The final order of relative importance was therefore the same for both measured hydraulic flow and flow efficiency: rotational speed had the strongest influence, followed by temperature, while pressure had the lowest relative contribution.
The observed influence of rotational speed on flow efficiency is consistent with the general behavior of positive-displacement pumps and with the results of Kosiba et al. [14]. In their laboratory testing of a GHD-type gear hydraulic pump using an environmentally friendly hydraulic fluid under controlled pressure and temperature conditions, pump behavior was evaluated together with hydraulic–fluid properties. Their work supports the interpretation that operating speed is an important factor influencing pump flow characteristics and volumetric efficiency. This is consistent with the present result, where rotational speed had the strongest influence not only on measured hydraulic flow but also on flow efficiency.
The finding that temperature had a higher relative influence than pressure in both final relative sensitivity evaluations is physically reasonable. Oil temperature changes the viscosity of the hydraulic fluid, and viscosity directly affects leakage, friction losses, and the energy behavior of hydraulic systems. Torrent et al. [3] showed that viscosity loss is connected with hydraulic system performance, while Rydberg [5] emphasized that hydraulic–fluid properties, including viscosity, have a direct impact on energy efficiency. Therefore, the higher contribution of temperature compared with pressure can be explained by temperature-induced changes in fluid viscosity. These changes affect not only internal leakage in the pump but also the hydraulic resistance of the circuit.
The dominant dynamic effect of fluid temperature over pressure on volumetric efficiency (26.08% vs. 19.19% relative sensitivity) is quantitatively explained by the dynamic viscosity response curve of the tested synthetic ester fluid. According to manufacturer specifications, kinematic viscosity collapses non-linearly from 82 mm2/s at 30 °C to 48 mm2/s at 40 °C, further dropping to 18.5 mm2/s at 60 °C (a total reduction of >77%). In contrast, increasing the working pressure from 2 MPa to 10 MPa represents a five-fold increase in driving head. Because internal backflow through internal clearances is inversely proportional to dynamic viscosity (Qleak 1/µ), this thermal collapse of fluid shear resistance causes volumetric slip to grow exponentially, making the fluid thermal state the governing factor of volumetric efficiency.
The physical mechanics underlying the significant pressure–temperature (P × T) interaction term stem from the synergistic coupling between pressure-driven Poiseuille gap flow and thermal viscosity degradation. Under laminar flow conditions through the pump’s radial and axial clearances (h), volumetric leakage scales linearly with pressure gradient (ΔP) but inversely with dynamic fluid viscosity (μ). When operating at moderate temperatures, the higher dynamic viscosity provides sufficient hydraulic shear resistance, dampening the leakage-promoting effect of elevated working pressure. However, as the temperature approaches 60 °C, the non-linear collapse of ester fluid viscosity diminishes this resistance, causing gap backflow to surge multiplicatively under elevated working pressures, which aligns with the recent findings on synthetic ester degradation mechanisms [15,16].
The present findings are also related to the work of Stawiński et al. [1], who reported a pronounced influence of hydraulic oil temperature on variable-speed pump performance and emphasized the need for temperature-dependent pump maps. In comparison with their results, the temperature effect in the present study was not dominant. However, it was still the second most important parameter in the final relative sensitivity evaluation of both measured hydraulic flow and flow efficiency. This confirms that temperature should not be neglected, although its relative importance depends on the investigated pump, working fluid, operating range, and evaluation method.
Pressure showed the lowest relative sensitivity in the final relative sensitivity evaluation, with 1.88% for measured hydraulic flow and 19.19% for flow efficiency. This does not mean that pressure is unimportant in gear pump operations. Increased pressure promotes internal leakage through functional clearances, which is why pressure becomes more visible in the flow efficiency analysis than in the direct flow analysis. However, within the investigated pressure range of 2–10 MPa, its global relative contribution was lower than the contribution of temperature and rotational speed. This result is therefore valid mainly for the selected operating range and should not be generalized to substantially higher pressure ranges.
From the point of view of practical operation, the results confirm that measured flow and flow efficiency should be interpreted together. The measured flow rate is important for practical design, actuator speed estimation, and system control, but it is mainly governed by rotational speed. Flow efficiency provides more information about pump operation because it better reflects losses caused by pressure-dependent leakage and temperature-dependent viscosity changes. The importance of monitoring hydraulic oil condition and temperature is also supported by Shi et al. [17], who showed that integrated oil sensors measuring viscosity, density, and temperature can provide useful information about hydraulic oil and machine condition. Continuous condition monitoring of hydraulic oil temperature and fluid degradation plays a crucial role in modern sustainable fluid power design. Operating gear pumps outside optimal thermal windows accelerates ester fluid oxidation, altering fluid chemistry and leading to premature oil replacement, increased maintenance downtime, and hazardous chemical waste generation. Furthermore, running at elevated temperatures severely reduces volumetric efficiency, requiring higher power input per unit of delivered hydraulic work. Implementing thermal-efficiency mapping into real-time-condition monitoring schemes enables predictive maintenance, minimizes total energy consumption, extends fluid operational life, and directly contributes to greener industrial operations.
The use of arithmetic mean, median, and 15% trimmed mean led to very similar conclusions, which supports the reliability of the observed trends. The trimmed mean was appropriate because flow fluctuations occurred at selected rotational speeds, especially around 1250 and 1750 min−1. The importance of experimental validation under real operating conditions is also emphasized by Ketelsen et al. [9] and Sheng et al. [18].
Overall, the present study confirms that the GHD 17R pump should be evaluated by experimentally determined flow and efficiency maps rather than by a single nominal value. This conclusion is consistent with Stawiński et al. [1], Torrent et al. [3], and Kučera et al. [19], who emphasize the importance of evaluating hydraulic pumps under variable operating conditions. The main contribution of this study is therefore the experimental quantification of how rotational speed, pressure, and temperature influence the actual flow rate and flow efficiency of the GHD 17R pump in the selected operating range.
5. Conclusions
This study successfully quantified the simultaneous influence of rotational speed, operating pressure, and oil temperature on the flow behavior and volumetric efficiency of the GHD 17R external gear pump. The experiments were conducted using an environmentally friendly biodegradable synthetic ester hydraulic oil, which enabled a comprehensive assessment of how fluid properties affect internal losses under variable conditions. To ensure data robustness against flow fluctuations caused by pump vibrations at selected speeds, a 15% trimmed mean statistical approach was applied, which proved highly reliable when compared to standard arithmetic mean and median values.
The results demonstrated that the evaluation of actual flow rate alone is insufficient for a complete understanding of positive-displacement pump mechanics. When evaluating raw flow rate directly, relative sensitivity indicated that rotational speed is the dominant factor (accounting for 95.80% of global influence), while pressure and temperature showed minimal absolute impacts. However, recalculating the dataset into volumetric efficiencies eliminated the directly proportional effect of speed on theoretical volume. Under this approach, the relative significance of temperature and pressure rose to 26.08% and 19.19%, respectively, highlighting the critical role of temperature-dependent viscosity changes and pressure-driven leakage across internal clearances.
To validate the findings, a three-way ANOVA was utilized to identify the effect size (η2 and partial η2) of each parameter and their cross-interactions. The ANOVA confirmed that all primary parameters and their interactions are statistically significant (p < 0.05). While relative sensitivity highlighted temperature as a stronger direct contributor to global variance, ANOVA highlighted the absolute significance of pressure (η2 = 10.24% vs. 3.98% for temperature), revealing that parameter cross-interactions play an essential role in pump loss mechanics.
The main contribution of this work is the generation of experimentally verified, coupled flow and volumetric efficiency maps for the GHD 17R pump using a high-performance bio-lubricant. These multi-dimensional maps offer significantly more detailed input than conventional catalog single-point characteristics and provide a practical foundation for the precise design, simulation, and real-time thermal diagnostics of modern hydraulic systems. Future research will extend this methodology to long-term pump wear tracking and wide-range fluid degradation analysis.
Author Contributions
Conceptualization, J.K. and Z.T.; methodology, J.K.; software, L.T.; validation, D.S., M.N. and Z.T.; formal analysis S.B.; investigation, Z.T. resources, S.D.; data curation, S.B.; writing—original draft preparation, J.K., M.O. and D.S.; writing—review and editing, J.K.; visualization, M.O.; supervision, J.K.; project administration, J.K. All authors have read and agreed to the published version of the manuscript.
Funding
This work was supported by Visegrad Funds, No. 52410187.
Data Availability Statement
The original contributions presented in this study are included in this article; further inquiries can be directed to the corresponding author.
Acknowledgments
We greatly thank the editor and reviewers for their valuable comments that improved the quality of this paper.
Conflicts of Interest
The authors declare no conflicts of interest.
References
- Stawiński, Ł.; Kosucki, A.; Cebulak, M.; Górniak vel Górski, A.; Grala, M. Investigation of the Influence of Hydraulic Oil Temperature on the Variable-Speed Pump Performance. Eksploat. Niezawodn. 2022, 24, 289–296. [Google Scholar] [CrossRef] [Scilit]
- Mitov, A.; Nikolov, N.; Kralov, I. Influence of the Radial Gap on the External Gear Pump Performance. Appl. Sci. 2025, 15, 907. [Google Scholar] [CrossRef] [Scilit]
- Torrent, M.; Gamez-Montero, P.; Codina, E. Parametrization, Modeling, and Validation in Real Conditions of an External Gear Pump. Sustainability 2021, 13, 3089. [Google Scholar] [CrossRef] [Scilit]
- Shi, B.; Yuan, Y. Structural design and performance analysis of external gear pump for high viscosity polymer pumping. Sci. Rep. 2025, 15, 41153. [Google Scholar] [CrossRef] [Scilit] [PubMed]
- Rydberg, K. Hydraulic Fluid Properties and their Impact on Energy Efficiency. In Proceedings of the 13th Scandinavian International Conference on Fluid Power, SICFP 2013, Linköping, Sweden, 3–5 June 2013; pp. 447–453. [Google Scholar] [CrossRef] [Scilit]
- Michael, P.; Cheekolu, M.; Panwar, P.; Devlin, M.; Davidson, R.; Johnson, D.; Martini, A. Temporary and Permanent Viscosity Loss Correlated to Hydraulic System Performance. Tribol. Trans. 2018, 61, 901–910. [Google Scholar] [CrossRef] [Scilit]
- Lunev, A.S.; Kaverzina, A.S.; Nikitin, A.A.; Novik, A.V.; Kramarenko, V.A. The impact of viscosity and propagation velocity of the flow on the initiation of the cavitation in a gear pump. J. Phys. Conf. Ser. Eng. Innov. Technol. 2025, 1515, 042039. [Google Scholar] [CrossRef] [Scilit]
- Novak, N.; Trajkovski, A.; Polajnar, M.; Kalin, M.; Majdič, F. Wear of hydraulic pump with real particles and medium test dust. Wear 2023, 532–533, 205101. [Google Scholar] [CrossRef] [Scilit]
- Ketelsen, S.; Michel, S.; Andersen, T.; Ebbesen, M.; Weber, J.; Schmidt, L. Thermo-Hydraulic Modelling and Experimental Validation of an Electro-Hydraulic Compact Drive. Energies 2021, 14, 2375. [Google Scholar] [CrossRef] [Scilit]
- Zharkevich, O.; Berg, A.; Reshetnikova, O.; Berg, A.; Nurzhanova, O.; Altynbayev, A.; Zhunuspekov, D.; Stukach, O. The Study and Determination of Rational Hydraulic Parameters of a Prototype Multi-Gear Pump. Fluids 2025, 10, 211. [Google Scholar] [CrossRef] [Scilit]
- Vacca, A.; Guidetti, M. Modelling and experimental validation of external spur gear machines for fluid power applications. Simul. Model. Pract. Theory 2011, 19, 2007–2031. [Google Scholar] [CrossRef] [Scilit]
- Azeez, A.A.; Mazzei, P.; Minav, T.; Frosina, E.; Senatore, A. A New Approach to Study the Effect of Complexity on an External Gear Pump Model to Generate Data Source for AI-Based Condition Monitoring Application. Actuators 2023, 12, 401. [Google Scholar] [CrossRef] [Scilit]
- Liu, X.; Mou, J.; Xu, X.; Qiu, Z.; Dong, B. A Review of Pump Cavitation Fault Detection Methods Based on Different Signals. Processes 2023, 11, 2007. [Google Scholar] [CrossRef] [Scilit]
- Kosiba, J.; Tkáč, Z.; Jablonický, J.; Čurgaliová, G.; Tulík, J.; Halenár, M. Laboratory Test of a Gear Hydraulic Pump during the Application of an Environmentally Friendly Hydraulic Fluid with Constant Pressure and Temperature. Lubricants 2024, 12, 304. [Google Scholar] [CrossRef] [Scilit]
- Deuster, S.; Schmitz, K. Bio-Based Hydraulic Fluids and the Influence of Hydraulic Oil Viscosity on the Efficiency of Mobile Machinery. Sustainability 2021, 13, 7570. [Google Scholar] [CrossRef] [Scilit]
- Kamyab, B.; Beims, R.; Chambers, D.W.; Bassi, A.S.; Xu, C. Sustainable production of high-performance bio-based hydraulic fluids from vegetable oils: Recent advances, current challenges, and future perspectives. Biomass Bioenergy 2024, 183, 107160. [Google Scholar] [CrossRef] [Scilit]
- Shi, H.; Yu, S.; Xie, Y.; Li, W.; Zhang, H.; Zheng, Y.; Zhang, S.; Li, G.; Sun, Y.; Chen, H. Comprehensive detection method for multi-contaminants in hydraulic oil based on inductance-resistance-capacitance analysis. Tribol. Int. 2022, 173, 107609. [Google Scholar] [CrossRef] [Scilit]
- Sheng, C.; Li, H.; Rao, X.; Feng, W. An innovative inductive wear particle sensor using four-coils with a full-bridge detection method for sensitivity improvement and high flow rate. Measurement 2025, 251, 117245. [Google Scholar] [CrossRef] [Scilit]
- Kučera, M.; Drmla, J.; Aleš, Z. Comparative Experimental Investigation of Environmentally Non-Hazardous Rapeseed Oils Using Technical Reliability Indicators. Acta Technol. Agric. 2025, 28, 71–79. [Google Scholar] [CrossRef] [Scilit]

Disclaimer/Publisher’s Note: The statements, opinions and data contained in all publications are solely those of the individual author(s) and contributor(s) and not of MDPI and/or the editor(s). MDPI and/or the editor(s) disclaim responsibility for any injury to people or property resulting from any ideas, methods, instructions or products referred to in the content. |
© 2026 by the authors. Licensee MDPI, Basel, Switzerland. This article is an open access article distributed under the terms and conditions of the Creative Commons Attribution (CC BY) license.