


Abstract
Existing piston–cylinder lubrication studies often simplify the pressure boundary as a constant load or a single field, making it difficult to capture pump-level pressure excitation, local oil-film response, and non-concentric posture under variable loading. This paper establishes a thermo–fluid–solid coupling framework integrating an AMESim full-pump model, a Fluent transient oil-film model, and a Transient Structural model; UDF transfer of periodic pressure, dynamic meshes, and a calibrated Roelands law were used to analyze parallel-offset and center-tilted postures. As the load pressure increased from 10 to 30 MPa, the maximum discharge–half-cycle temperature rose from 28.39 to 36.95 °C, and the average positive leakage during the third-cycle high-pressure stage increased from 0.0201 to 0.1026 L/min; increasing speed from 1000 to 3000 r/min reduced cycle-averaged leakage by 8.93%. At 500 r/min and 30 MPa, the parallel-offset case reached 46.34 °C, 41 kPa, and 0.0990 L/min in maximum temperature, maximum shear stress, and average leakage, whereas the center-tilted case produced a peak resultant force of 3537.12 N, a cylinder inner-wall high-stress band of 76.96 MPa, and a maximum piston deformation and equivalent stress of 4.31 μm and 83.16 MPa. These results clarify the distinct lubrication behavior and potential uneven-wear risk associated with the two representative non-concentric postures, and provide a basis for clearance design and posture-sensitive condition assessment of axial piston pumps.
1. Introduction
Axial piston pumps offer high power density, a wide speed-control range, and a compact structure. The piston–cylinder pair simultaneously fulfills load-bearing, sealing, and guiding functions, and its micrometer-scale annular clearance involves pressure-driven flow, wall shear, and viscous dissipation. Wear and side loads can drive the piston from a concentric state toward parallel offset or tilting, thereby altering leakage, load capacity, and output stability; full-pump simulations and experiments also show that these effects become more pronounced at low speed and high pressure [1]. Meanwhile, the inlet pressure of the oil film is jointly determined by piston reciprocation, port switching, fluid compressibility, and leakage from friction pairs. Bergada et al. developed a full-pump model including leakage from the three major friction pairs and revealed the link between clearance leakage and outlet flow ripple [2]; Edge and Darling clarified the roles of the porting process and piston-chamber pressure in pressure and flow fluctuations [3]. Therefore, local oil-film analysis should retain the pressure peaks, rate of change, and phase of the full-pump pressure, rather than relying only on constant high- and low-pressure boundary conditions.
In local lubrication modeling, Yamaguchi established the mechanical relationship between oil-film pressure, micro-motion, and piston posture [4]; Fang and Shirakashi incorporated hydrodynamic load support and asperity contact into a mixed-lubrication model [5]. Wieczorek and Ivantysynova developed the CASPAR tool to solve oil-film pressure, micro-motion, leakage, and power loss in a coupled manner [6]; Pelosi and Ivantysynova improved the efficiency of Reynolds-equation solutions in complex oil-film regions using geometric multigrid methods [7]. These studies laid the foundation for piston-pair thin-film lubrication analysis, and numerical tools have progressed from analytical film models to multiphysics coupled solutions. However, most calculations still begin from prescribed boundary conditions, and a traceable transfer path between full-pump dynamic excitation and local interfacial response is still missing. Likewise, steady-state, isothermal, or fixed-posture assumptions are insufficient to describe the cyclic evolution caused by suction-discharge switching, reciprocating motion, and viscous heating.
Thermal effects and structural deformation further broaden the scope of piston-pair research. Zhang et al. incorporated oil-film pressure, viscous temperature rise, and solid deformation into a fluid–thermal–structural coupling model, showing that thermoelastic deformation can in turn alter local clearance and lubrication state [8]; Haidak et al. quantified the influence of temperature fields on friction, leakage, and efficiency loss, and pointed out that neglecting viscosity–temperature effects and thermal deformation can lead to prediction errors [9]. Zhao et al. used a time-domain localization method to measure transient pressure distributions, providing experimental support for model validation and pressure-boundary verification [10]. Existing work has therefore established links between temperature, viscosity, pressure, and elastic deformation. In particular, under high pressure and long-duration cycles, temperature-induced viscosity changes and solid thermal deformation may simultaneously modify flow and load, so the applicability of one-way or isothermal approximations still needs to be clarified. The correspondence among thermo-shear behavior, load capacity, and structural response under different non-concentric postures also lacks a unified quantification.
Posture and wear studies further reveal clearance reconstruction and its service consequences. Lyu et al. analyzed the effect of rotational speed on piston micro-motion and leakage in an EHA pump [11], and coupled oil-film load support with a wear model to establish a cyclic wear prediction method [12]; Lin et al. discussed wear evolution at different service stages [13]. For high-pressure large-scale piston pairs, Zhao et al. showed that eccentricity and tilting reconstruct the clearance flow path and change sealing efficiency [14]; Li et al. jointly evaluated oil-film pressure, friction force, and leakage loss [15], while Wang et al. used three-dimensional oil-film calculations to reveal pressure distributions and load-support characteristics [16]. Taken together, these studies have addressed pump-level pressure dynamics, non-isothermal gap lubrication, fluid–structure interaction, and posture or wear evolution, but largely within separate modeling frameworks. The present contribution is therefore not the introduction of any one of these individual elements. Instead, it establishes a controlled cross-scale comparison in which a pump-derived, phase-resolved pressure history is transferred to a three-dimensional transient oil-film model and subsequently to a structural model. Under the same dynamic excitation, the concentric reference, parallel-offset, and center-tilted postures can thus be compared directly. Table 1 positions this framework relative to representative piston–cylinder modelling approaches.
Table 1.
Comparison of representative piston–cylinder modeling approaches and the scope of the present framework.
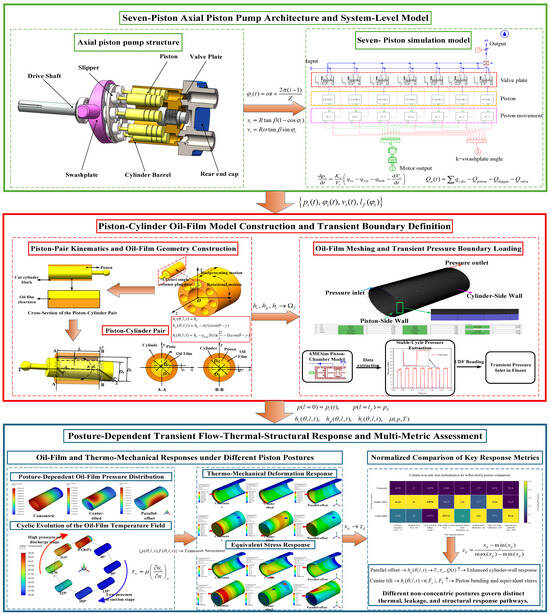
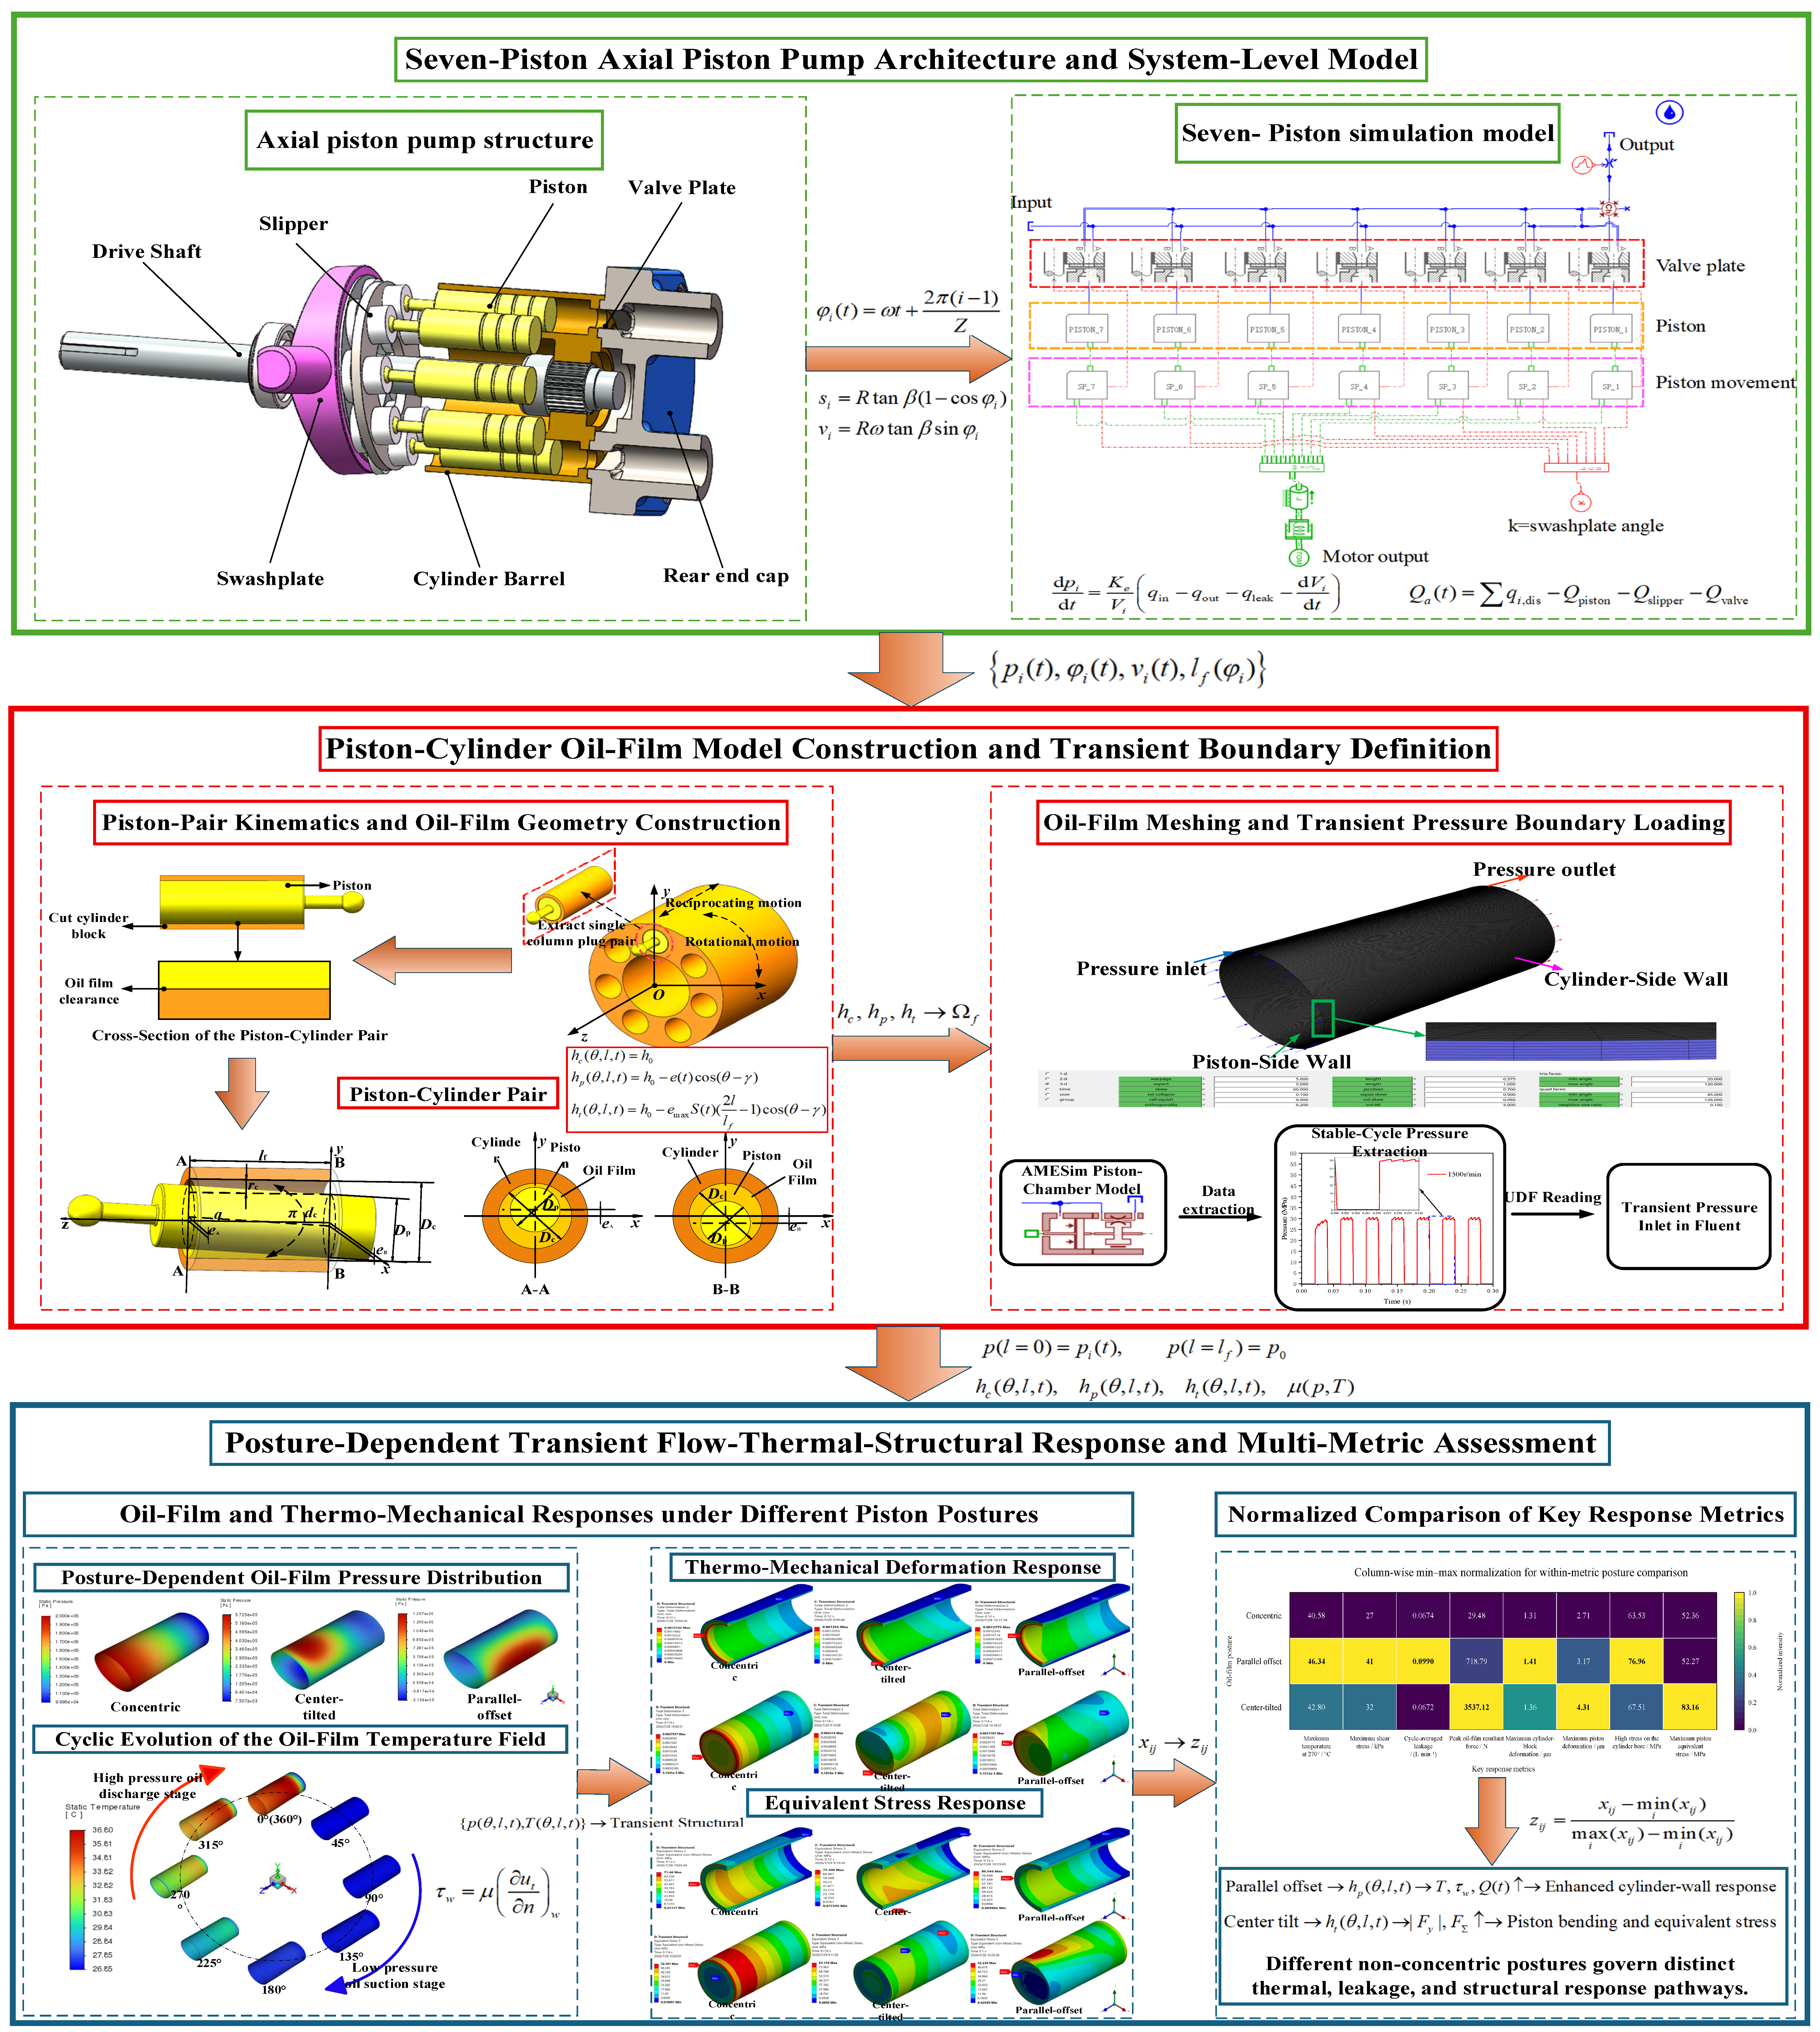
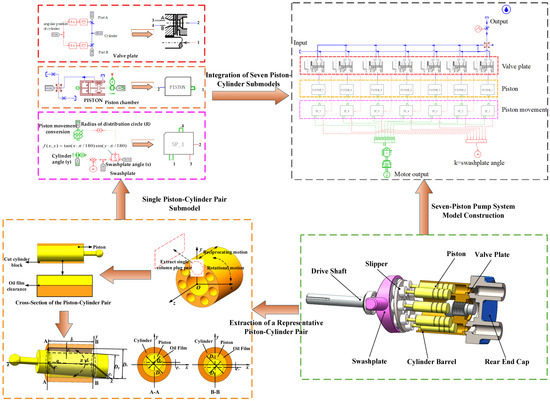
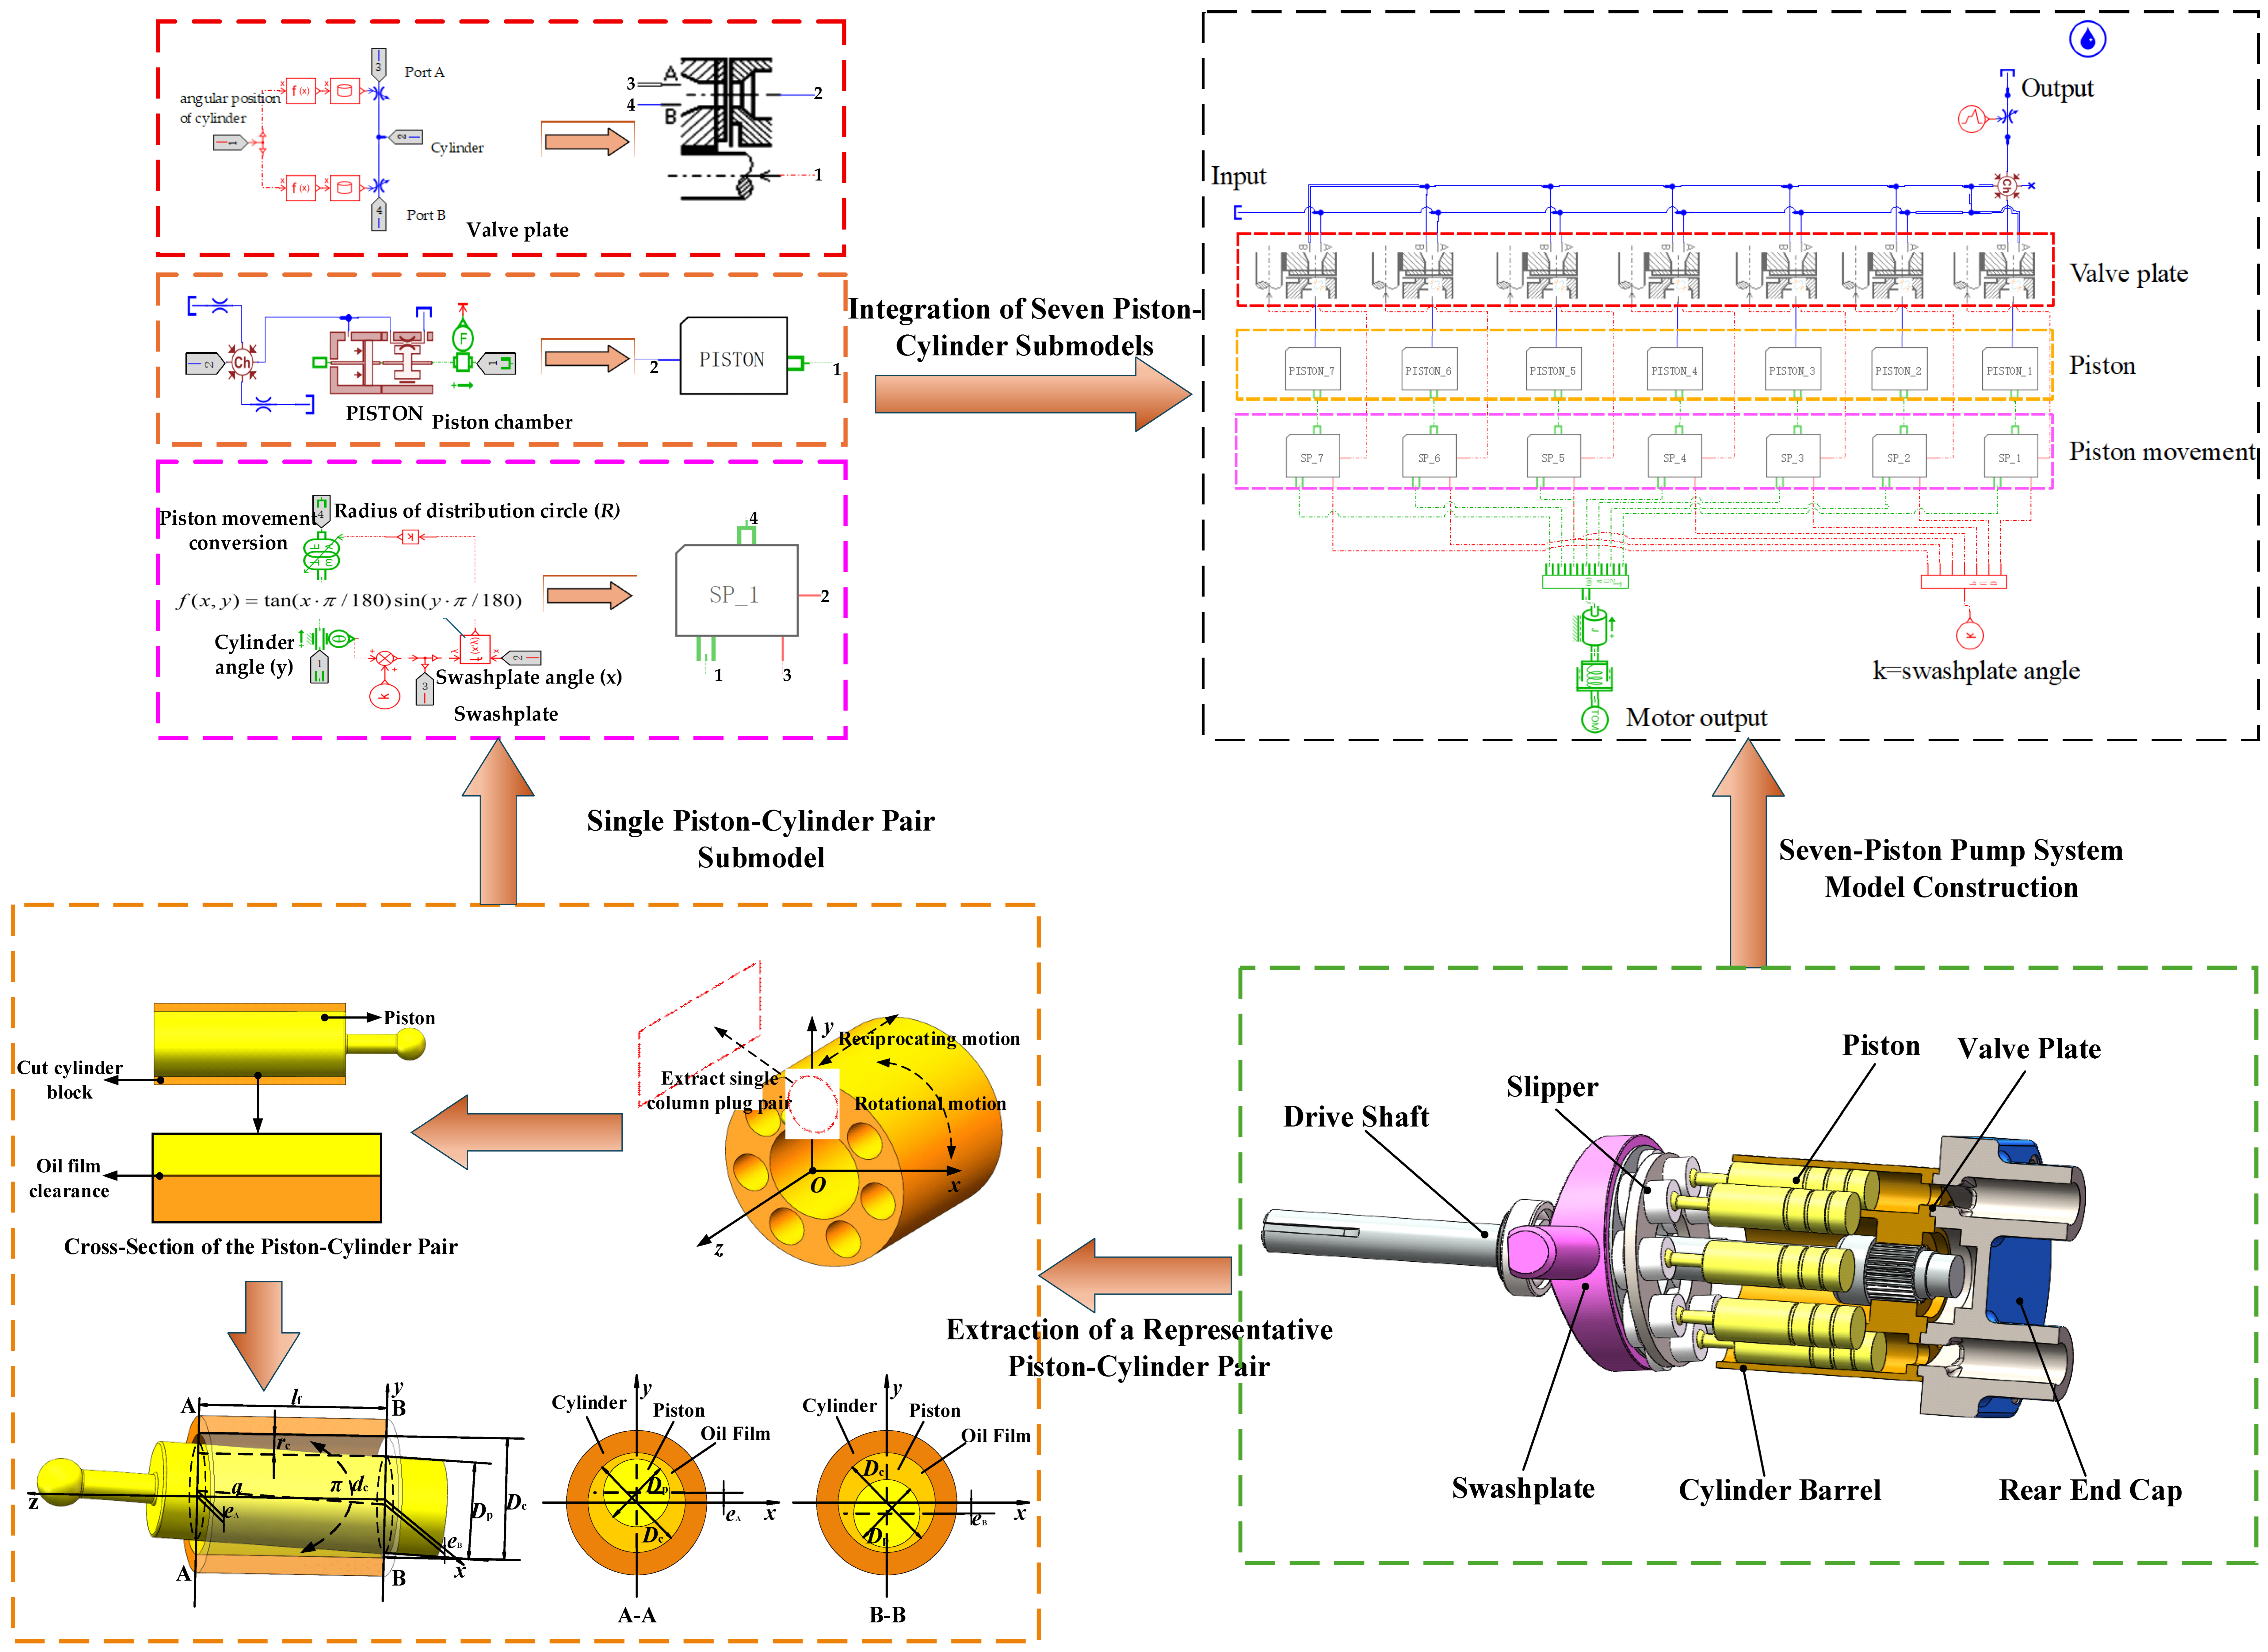
Based on this comparison, a one-way sequential framework linking a seven-piston AMESim model, a three-dimensional transient Fluent oil-film model, and a Transient Structural model is established, as shown in Figure 1. The same phase-resolved chamber-pressure history is imposed for all posture cases, so that differences caused by clearance redistribution can be separated from differences in external excitation. The model resolves pressure, temperature, wall shear, leakage, resultant force, deformation, and equivalent stress over load pressures of 10–30 MPa and rotational speeds of 500–3000 r/min. Thus, the contribution is methodological rather than a claim of a new thin-film governing equation: excitation, nominal clearance, fluid properties, and operating conditions are held constant while only the prescribed gap topology is changed. The framework is intended for posture-sensitivity comparison and adverse-load-location identification rather than for predicting natural multi-degree-of-freedom piston motion or wear depth.
Figure 1.
Transient boundary transfer, thermo–fluid–solid response, and multi-index evaluation framework for the piston–cylinder pair of an axial piston pump.
2. Theoretical Model and Numerical Method
2.1. Piston Kinematics and Transient Pressure Boundary
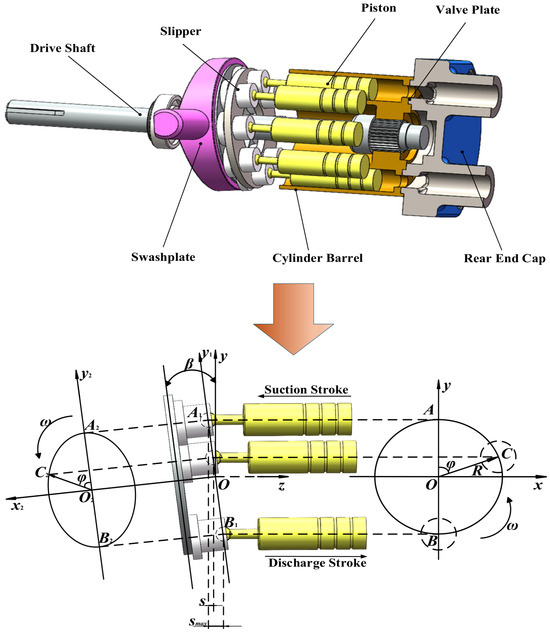
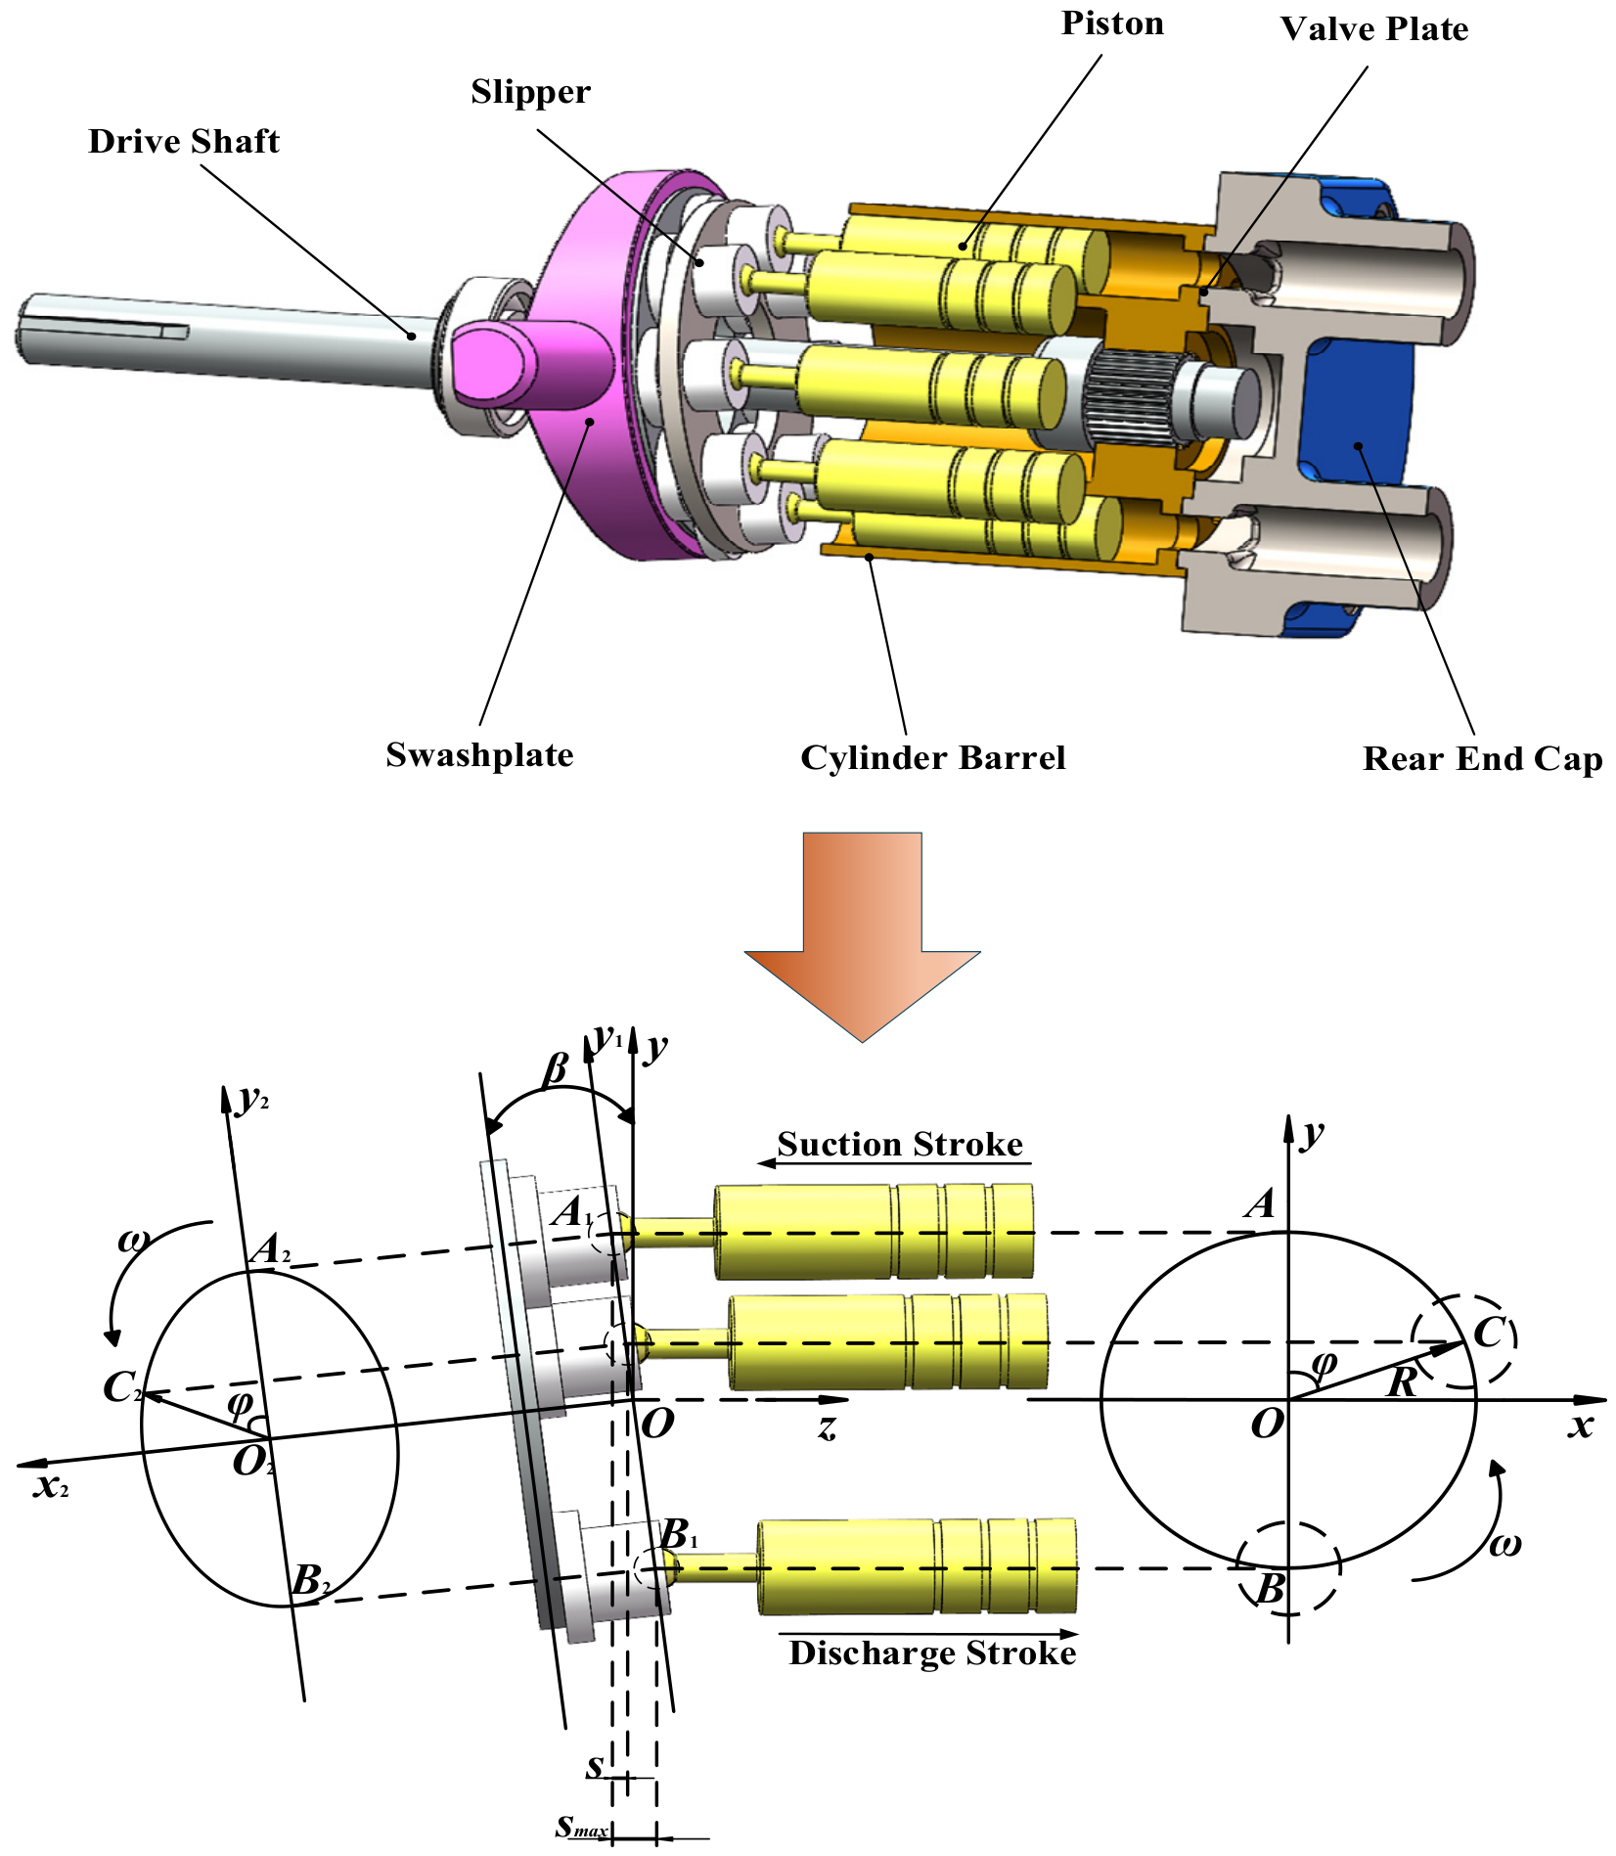
Figure 2 presents a schematic of the structure and piston kinematics of an axial piston pump.
Figure 2.
Structure and piston kinematics of an axial piston pump.
As shown in Figure 2, the piston motion of the axial piston pump is governed by the rotation of the cylinder block. Accordingly, a piston motion model was established using the cylinder-block rotation angle as the independent variable. Let β denote the swash-plate angle, R the piston pitch-circle radius, ω the angular velocity of the drive shaft, and Z the number of pistons. The initial position at which a reference piston enters the low-pressure port was defined as 0°. Since the phase difference between adjacent pistons is 2π/Z, the instantaneous angular position of the i-th piston is expressed as:
Neglecting the local deformation of the slipper ball joint and the deflection of the swash plate, the axial displacement of the piston is determined by the geometric projection of the swash plate. The corresponding axial velocity is then obtained by differentiating the displacement with respect to time. According to the continuity relation, the theoretical instantaneous flow rate of a single piston equals the product of the effective piston end-face area and the axial velocity, and is thus given by:
The reciprocating motion of the piston causes the piston-chamber volume Vi to vary periodically. Taking the flow entering the piston chamber as positive, and accounting for oil compressibility, valve-plate port throttling, and leakage through the three major friction pairs, the piston-chamber pressure Pi is governed by the compressible control-volume continuity equation [17]:
where Ke is the effective bulk modulus; qin and qout are the flow rates exchanged between the piston chamber and the low- and high-pressure ports, respectively; and qleak is the total leakage through the piston–cylinder pair, slipper–swash–plate pair, and valve–plate–cylinder-block pair.
The flow through each valve-plate port is jointly determined by the instantaneous effective flow area Av(φi) and the pressure difference across the port. Accordingly, a direction-dependent orifice equation is adopted:
where Cd is the discharge coefficient, and pv is the pressure at the corresponding valve-plate port. The effective flow area Av varies continuously with the rotation angle, while the high- and low-pressure ports have a phase difference of 180°. Equations (6) and (7) form the core of the AMESim piston-chamber pressure submodel, enabling the oil-film inlet boundary to retain the effects of port transition, volumetric compression, and pressure pulsation rather than imposing an ideal square-wave pressure profile.
2.2. Clearance Leakage Mechanisms and Overall Pump Flow Rate
Previous studies of leakage under variable sealing-length and eccentricity conditions have shown that the effective sealing length and circumferential clearance non-uniformity are key parameters governing leakage in the piston–cylinder pair [18,19]. Let lfmax and lfmin denote the maximum and minimum effective sealing lengths, respectively. Combined with the piston displacement given in Equation (2), the instantaneous effective sealing length of the i-th piston can be expressed as:
Under the assumptions that h0/Dp ≪ 1, the lubricant behaves as a Newtonian fluid, the flow is laminar and satisfies the no-slip condition, and the pressure gradient across the film thickness is negligible, the axial momentum equation is simplified as:
With the cylinder-bore wall velocity set to zero and the axial velocity of the piston surface defined as Ul, integration across the film thickness yields the axial velocity distribution and the flow rate per unit circumferential width:
where y is the coordinate across the oil-film thickness.
For the concentric clearance, h = h0 and Ul = vi are assumed, and the axial pressure gradient is approximated as ∂p/∂l = −Δp/lf. Integrating over the circumferential length πDp then gives the total leakage flow rate of the concentric piston–cylinder pair:
For a parallel-offset posture, the circumferential oil-film thickness is expressed as:
where ε = e/h0.
By integrating the local pressure-driven flow rate around the circumference and applying the circumferentially averaged relation:
the leakage rate of the eccentric piston–cylinder pair can be approximated as:
Equation (15) shows that pressure-driven leakage is proportional to the cube of the nominal clearance, while eccentricity further amplifies this contribution by a factor of 1 + 1.5ε2. In contrast, the circumferentially averaged Couette-flow contribution is governed by the mean clearance h0. Therefore, even when the nominal clearance remains unchanged, circumferential clearance redistribution may substantially reduce sealing performance. The instantaneous outlet flow rate of the complete pump is expressed as the sum of the theoretical flow rates of all pistons in the discharge stroke minus the leakage through the three major lubricating interfaces:
Equations (12) and (15) are used to analytically elucidate the effects of pressure difference, viscosity, sealing length, sliding velocity, and eccentricity ratio on leakage. In the three-dimensional transient simulations, leakage is obtained directly by integrating the mass flow rate over the outlet cross-section, thereby retaining the coupled effects of temperature, piston posture, local pressure gradients, and axial motion.
2.3. Non-Concentric Postures and Time-Varying Oil-Film Thickness
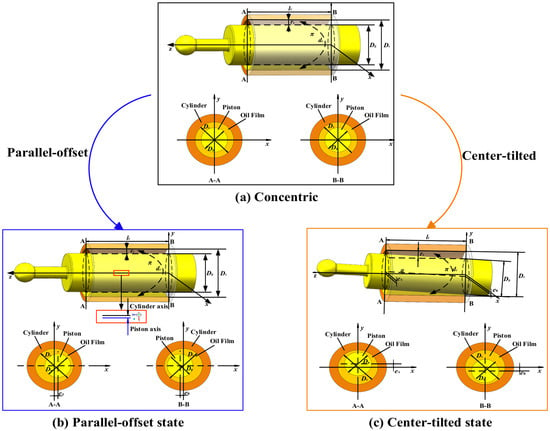
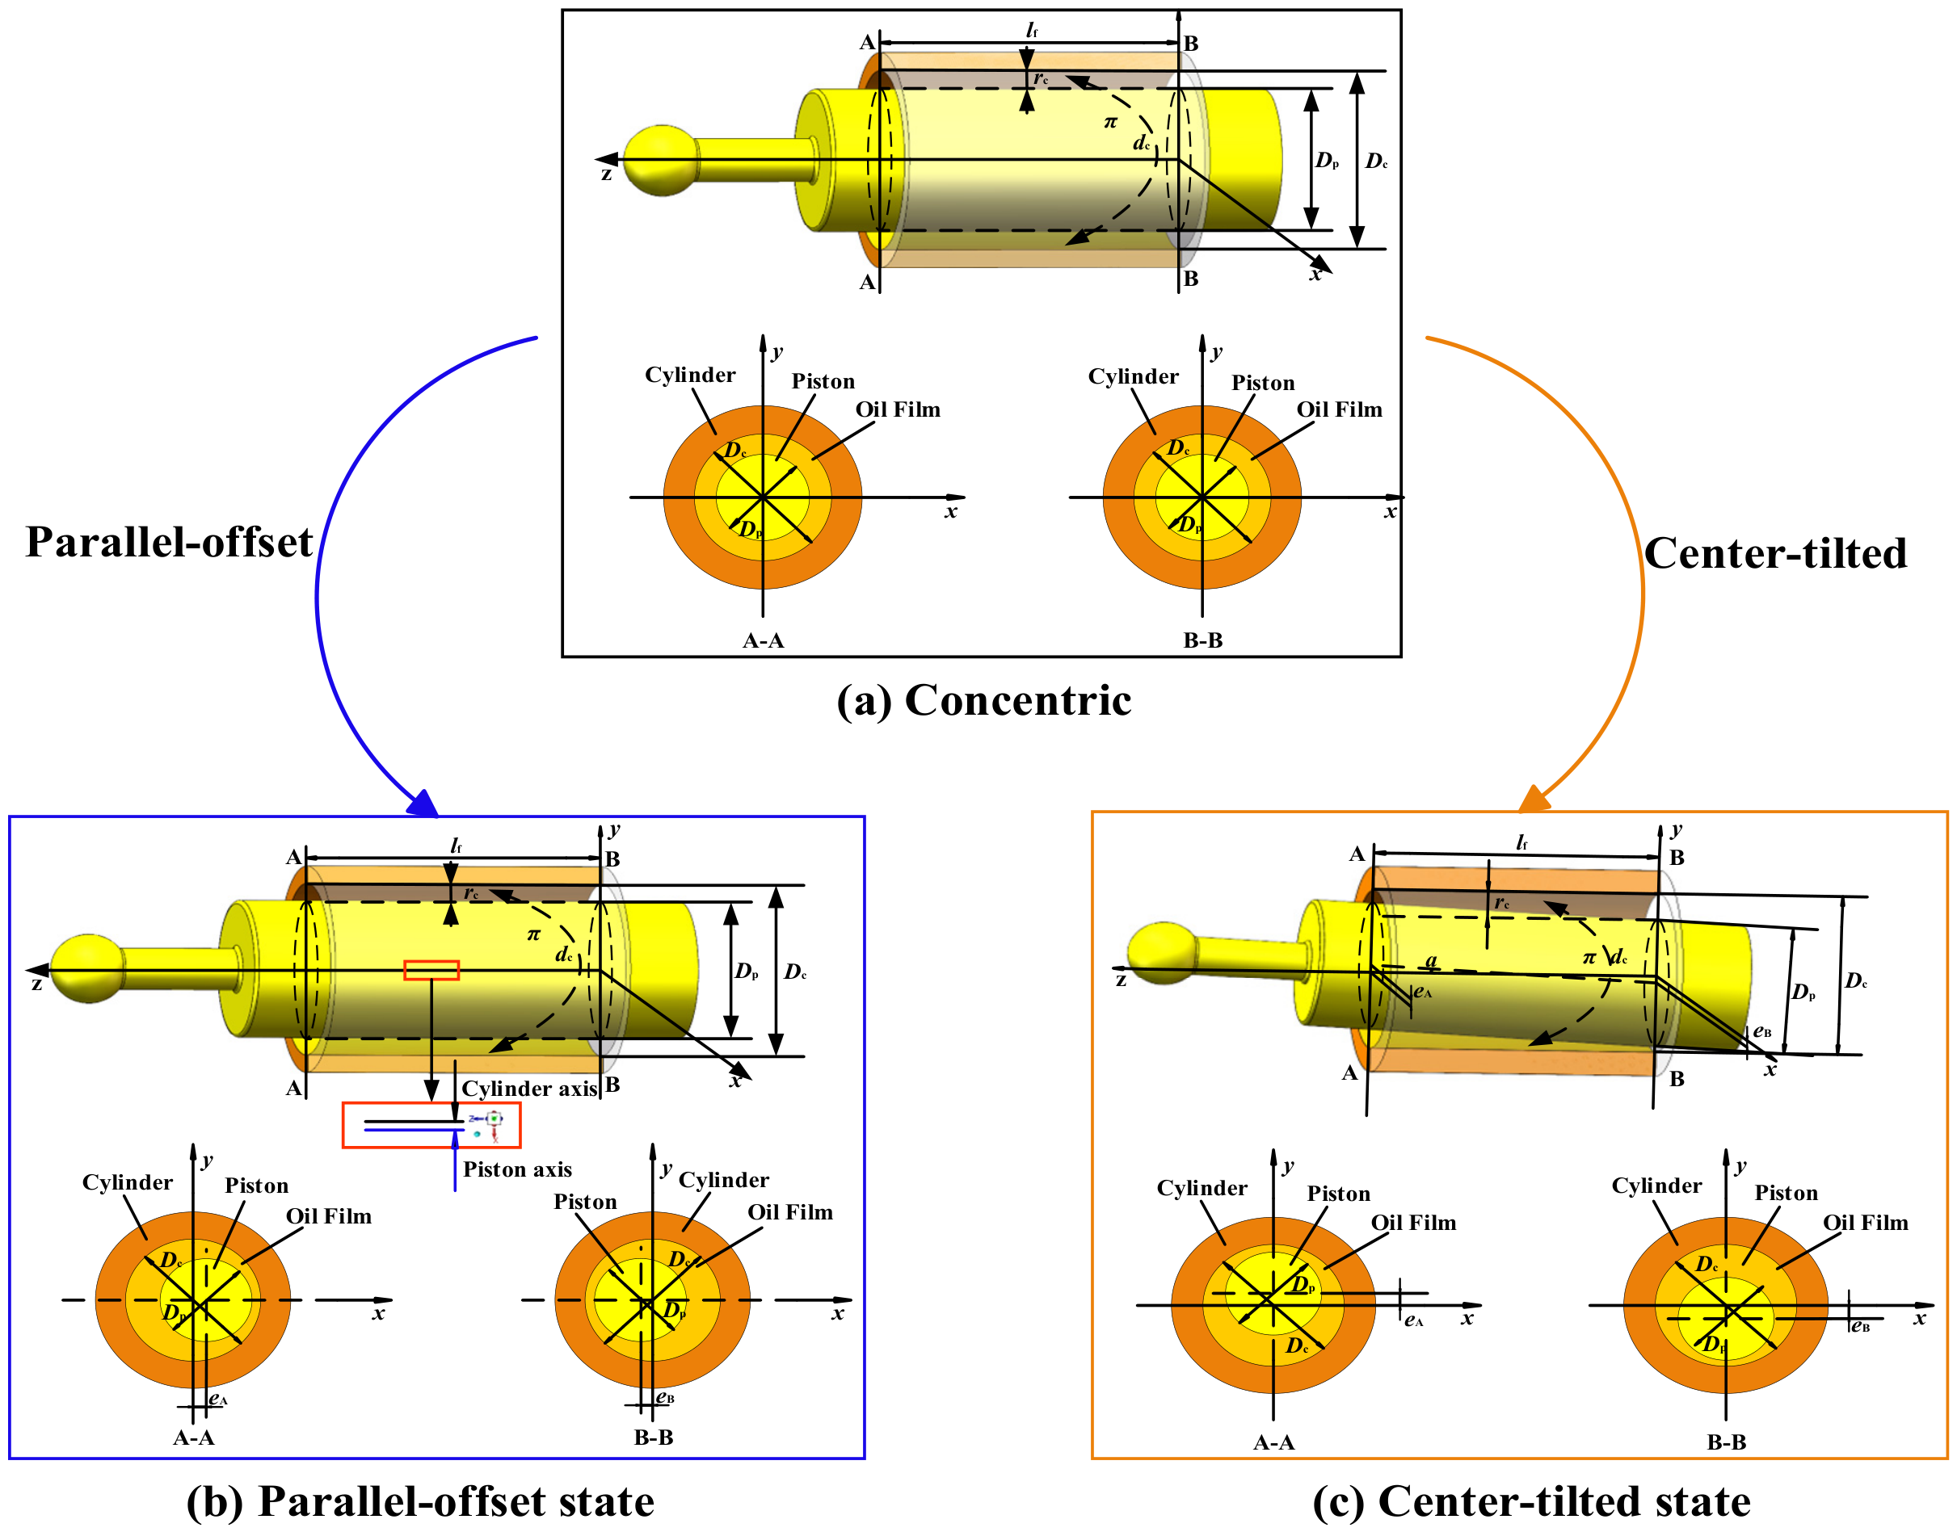
Figure 3 schematically illustrates the oil-film geometries and thickness distributions of the piston–cylinder pair under concentric, parallel-offset, and center-tilted postures.
Figure 3.
Schematic of oil-film thickness distributions under concentric, parallel-offset, and center-tilted piston postures.
As shown in Figure 3, the oil film of the piston–cylinder pair forms a thin annular layer between the outer surface of the piston and the inner surface of the cylinder bore. Let h0 denote the nominal radial clearance, θ the circumferential angle, l the axial coordinate, and γ the direction angle of piston offset. Under the concentric posture, the film thickness is circumferentially uniform. For the parallel-offset posture, the piston axis remains parallel to the cylinder-bore axis, and the film thickness is expressed as:
For the center-tilted posture, the piston rotates about the midpoint of the piston–cylinder engagement length. The two end cross-sections are displaced in opposite directions, whereas the middle cross-section remains concentric. Let emax denote the maximum offset at either end. The local axial offset and the corresponding oil-film thickness are then expressed as:
To prevent abrupt mesh-node displacement at the initial stage of the dynamic-mesh calculation, a cubic smoothing function S(t) with a continuous first derivative is introduced. The offset is thus smoothly increased from zero to its prescribed target value over the establishment time te:
In this study, h0 = 0.03 mm and ε = 0.5, corresponding to emax = 0.015 mm. Parallel offset forms continuous wide- and narrow-clearance channels in the same circumferential direction along the entire sealing length, whereas central tilt produces oppositely directed clearance expansion and contraction at the two ends. This geometric difference governs the distinct responses of the two postures in terms of axial leakage compensation, local hydrodynamic pressure generation, and resultant radial force.
2.4. Pressure–Temperature-Dependent Thermophysical Property Model
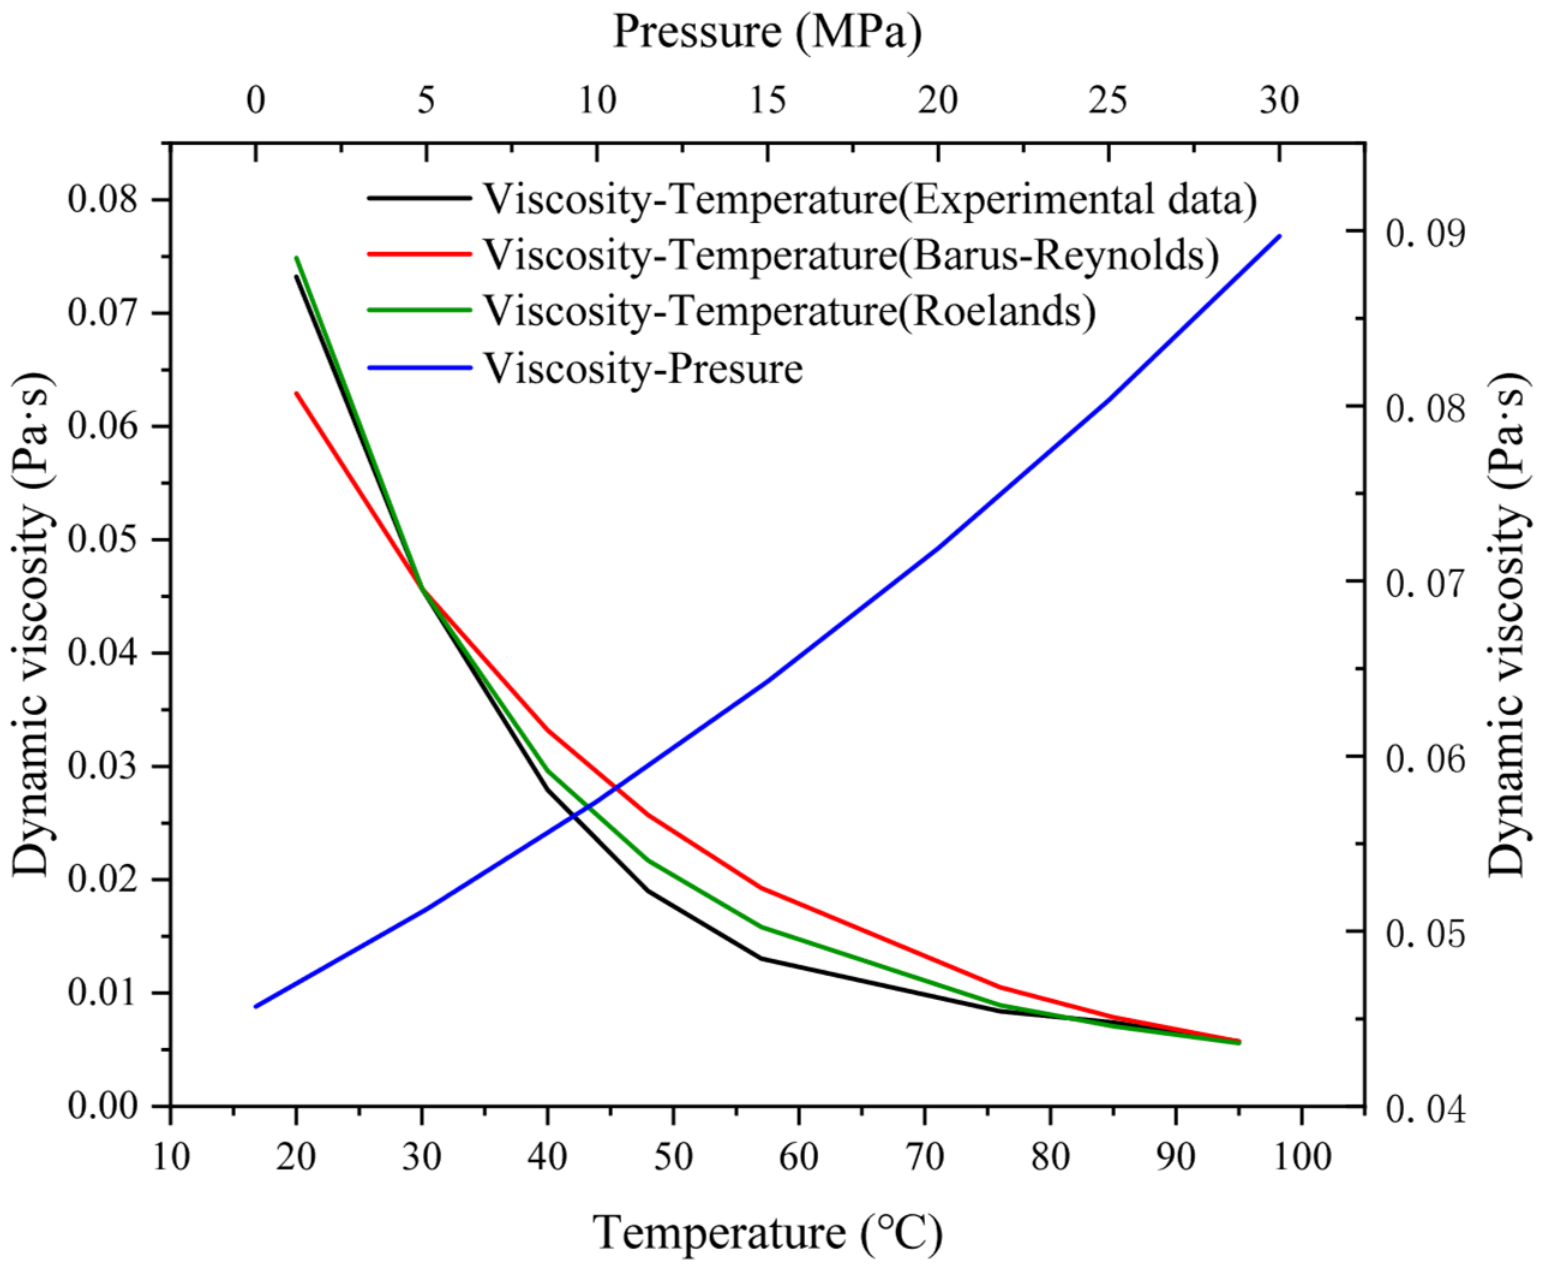
The piston–cylinder clearance is small and subjected to high local shear rates. Consequently, lubricant viscosity decreases with increasing temperature but increases with pressure. To cover the ranges of 20–95 °C and 0–30 MPa the atmospheric pressure–viscosity–temperature data of the ISO VG 46 hydraulic oil were used for property calibration, as listed in Table 2 [20].
Table 2.
Atmospheric pressure–dynamic viscosity data of the ISO VG 46 antiwear hydraulic oil [20].
A modified Roelands relation was then adopted to describe the coupled pressure–temperature dependence of viscosity [21,22,23]:
where μref and Tref are the dynamic viscosity and temperature at the reference state, respectively; ZR and SR are the Roelands pressure–viscosity and temperature–viscosity indices, respectively; and p is expressed in Pa.
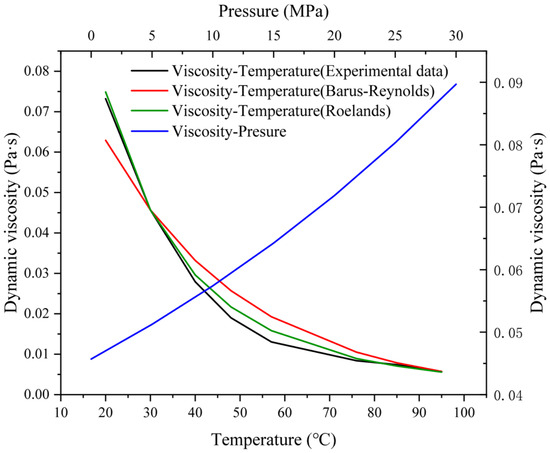
As shown in Figure 4, compared with the single Barus–Reynolds exponential fit, the Roelands model reduces the maximum relative error from 47.8% to 21.3% and the mean absolute relative error from 18.4% to 7.2%. Within the investigated pressure range of 0–30 MPa, the dynamic viscosity at 30 °C increases from 0.04570 Pa·s to approximately 0.08970 Pa·s, demonstrating that piezoviscous effects are non-negligible under the 30 MPa operating condition.
Figure 4.
Viscosity–temperature fitting and pressure-dependent viscosity of the ISO VG 46 antiwear hydraulic oil.
Although the variation in lubricant density is comparatively small, it affects mass conservation and the transient compression process. Accordingly, weak compressibility and thermal expansion are considered, and the density is described using a linearized relation about the reference state:
2.5. Oil-Film Governing Equations and Response Metrics
Thermal-lubrication and thermo–fluid–structure coupling studies commonly combine the Reynolds equation, the energy equation, and the thermoelastic response of the solid within a thin-film laminar-flow framework [24,25,26]. The validity of this framework for the present piston–cylinder pair is quantitatively verified by the Reynolds number evaluation presented below.
For the annular micro-gap flow, the Reynolds number is defined as:
where ρ is the oil density, v is the estimated mean axial film velocity, μ is the dynamic viscosity, and the hydraulic diameter of the thin annular clearance is approximated as Dh = 2h0 = 0.06 mm. Substituting a mean film velocity of approximately 1.19 m/s together with the viscosity range of the ISO VG 46 oil over the investigated temperature and pressure ranges (approximately 0.0056–0.0897 Pa·s) gives Re ≈ 0.69–11.1. The maximum value in this envelope is more than two orders of magnitude lower than the commonly used critical Reynolds number for internal flows (Rec ≈ 2300), so inertial effects remain negligible and the clearance flow can be treated as viscous laminar flow. This quantitative check also supports the laminar-flow assumption adopted in Section 2.2, and it is consistent with previous CFD studies of the piston–cylinder interface, in which the clearance leakage was considered laminar under all working conditions [27].
With the thin-film and weak-inertia conditions verified above, integration of the three-dimensional mass-conservation and momentum equations across the film thickness yields the generalized Reynolds equation, including circumferential wedge, axial entrainment, and transient squeeze terms:
where rp is the piston radius, and Uθ and Ul are the circumferential and axial velocities of the piston surface, respectively.
The oil-film temperature is governed by convective transport, three-dimensional heat conduction, and viscous dissipation. The corresponding energy equation and dissipation function are approximated as:
The pressure boundary conditions at the oil-film inlet and outlet are prescribed as p(l = 0, t) = pi(t) and p(l = l_f, t) = p0, respectively. Here, pi(t) is obtained from the stable periodic pressure predicted by the AMESim model, whereas p0 denotes the casing return pressure.
Once the transient pressure field p(θ, l, t) has been obtained, the outlet leakage flow rate is evaluated by integrating the axial velocity component over the outlet circumference:
The pressure field is then integrated over the piston surface to determine the radial force components Fx and Fy, from which the resultant radial oil-film force is calculated as Fr:
Finally, the overall oil-film resultant force, including the axial component FΣ is expressed as:
3. Full-Pump System Model and Three-Dimensional Oil-Film Numerical Model
3.1. Full-Pump System Model and Experimental Validation
To obtain the transient piston-chamber pressure consistent with the actual valve-plate commutation process, an AMESim model was constructed comprising valve-plate port, variable-volume piston-chamber, and piston-motion submodels. The valve-plate ports were represented by effective throttling-area functions varying with the cylinder-block rotation angle, with a 180° phase difference between the high- and low-pressure ports. The piston chamber was modeled as a variable-volume chamber to account for oil compressibility and was coupled to the piston-motion submodel through a piston element. The piston–cylinder pair was represented by an annular-clearance leakage element, whereas the background leakage of the slipper–swashplate and valve plate–cylinder block interfaces was equivalently represented by fixed orifices. The piston motion was prescribed by Equations (2) and (3). The submodels and their signal-transfer relationships are illustrated in Figure 5.
Figure 5.
AMESim full-pump model, piston–cylinder submodels, and transient pressure-boundary extraction.
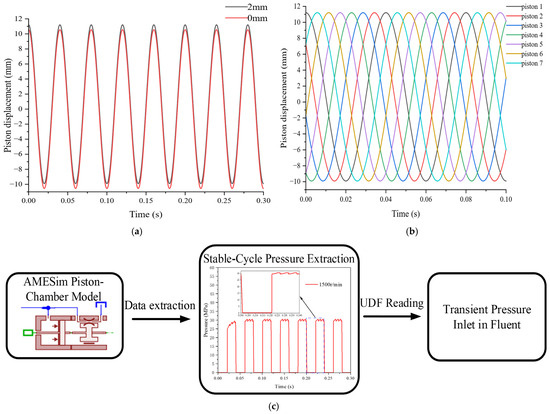
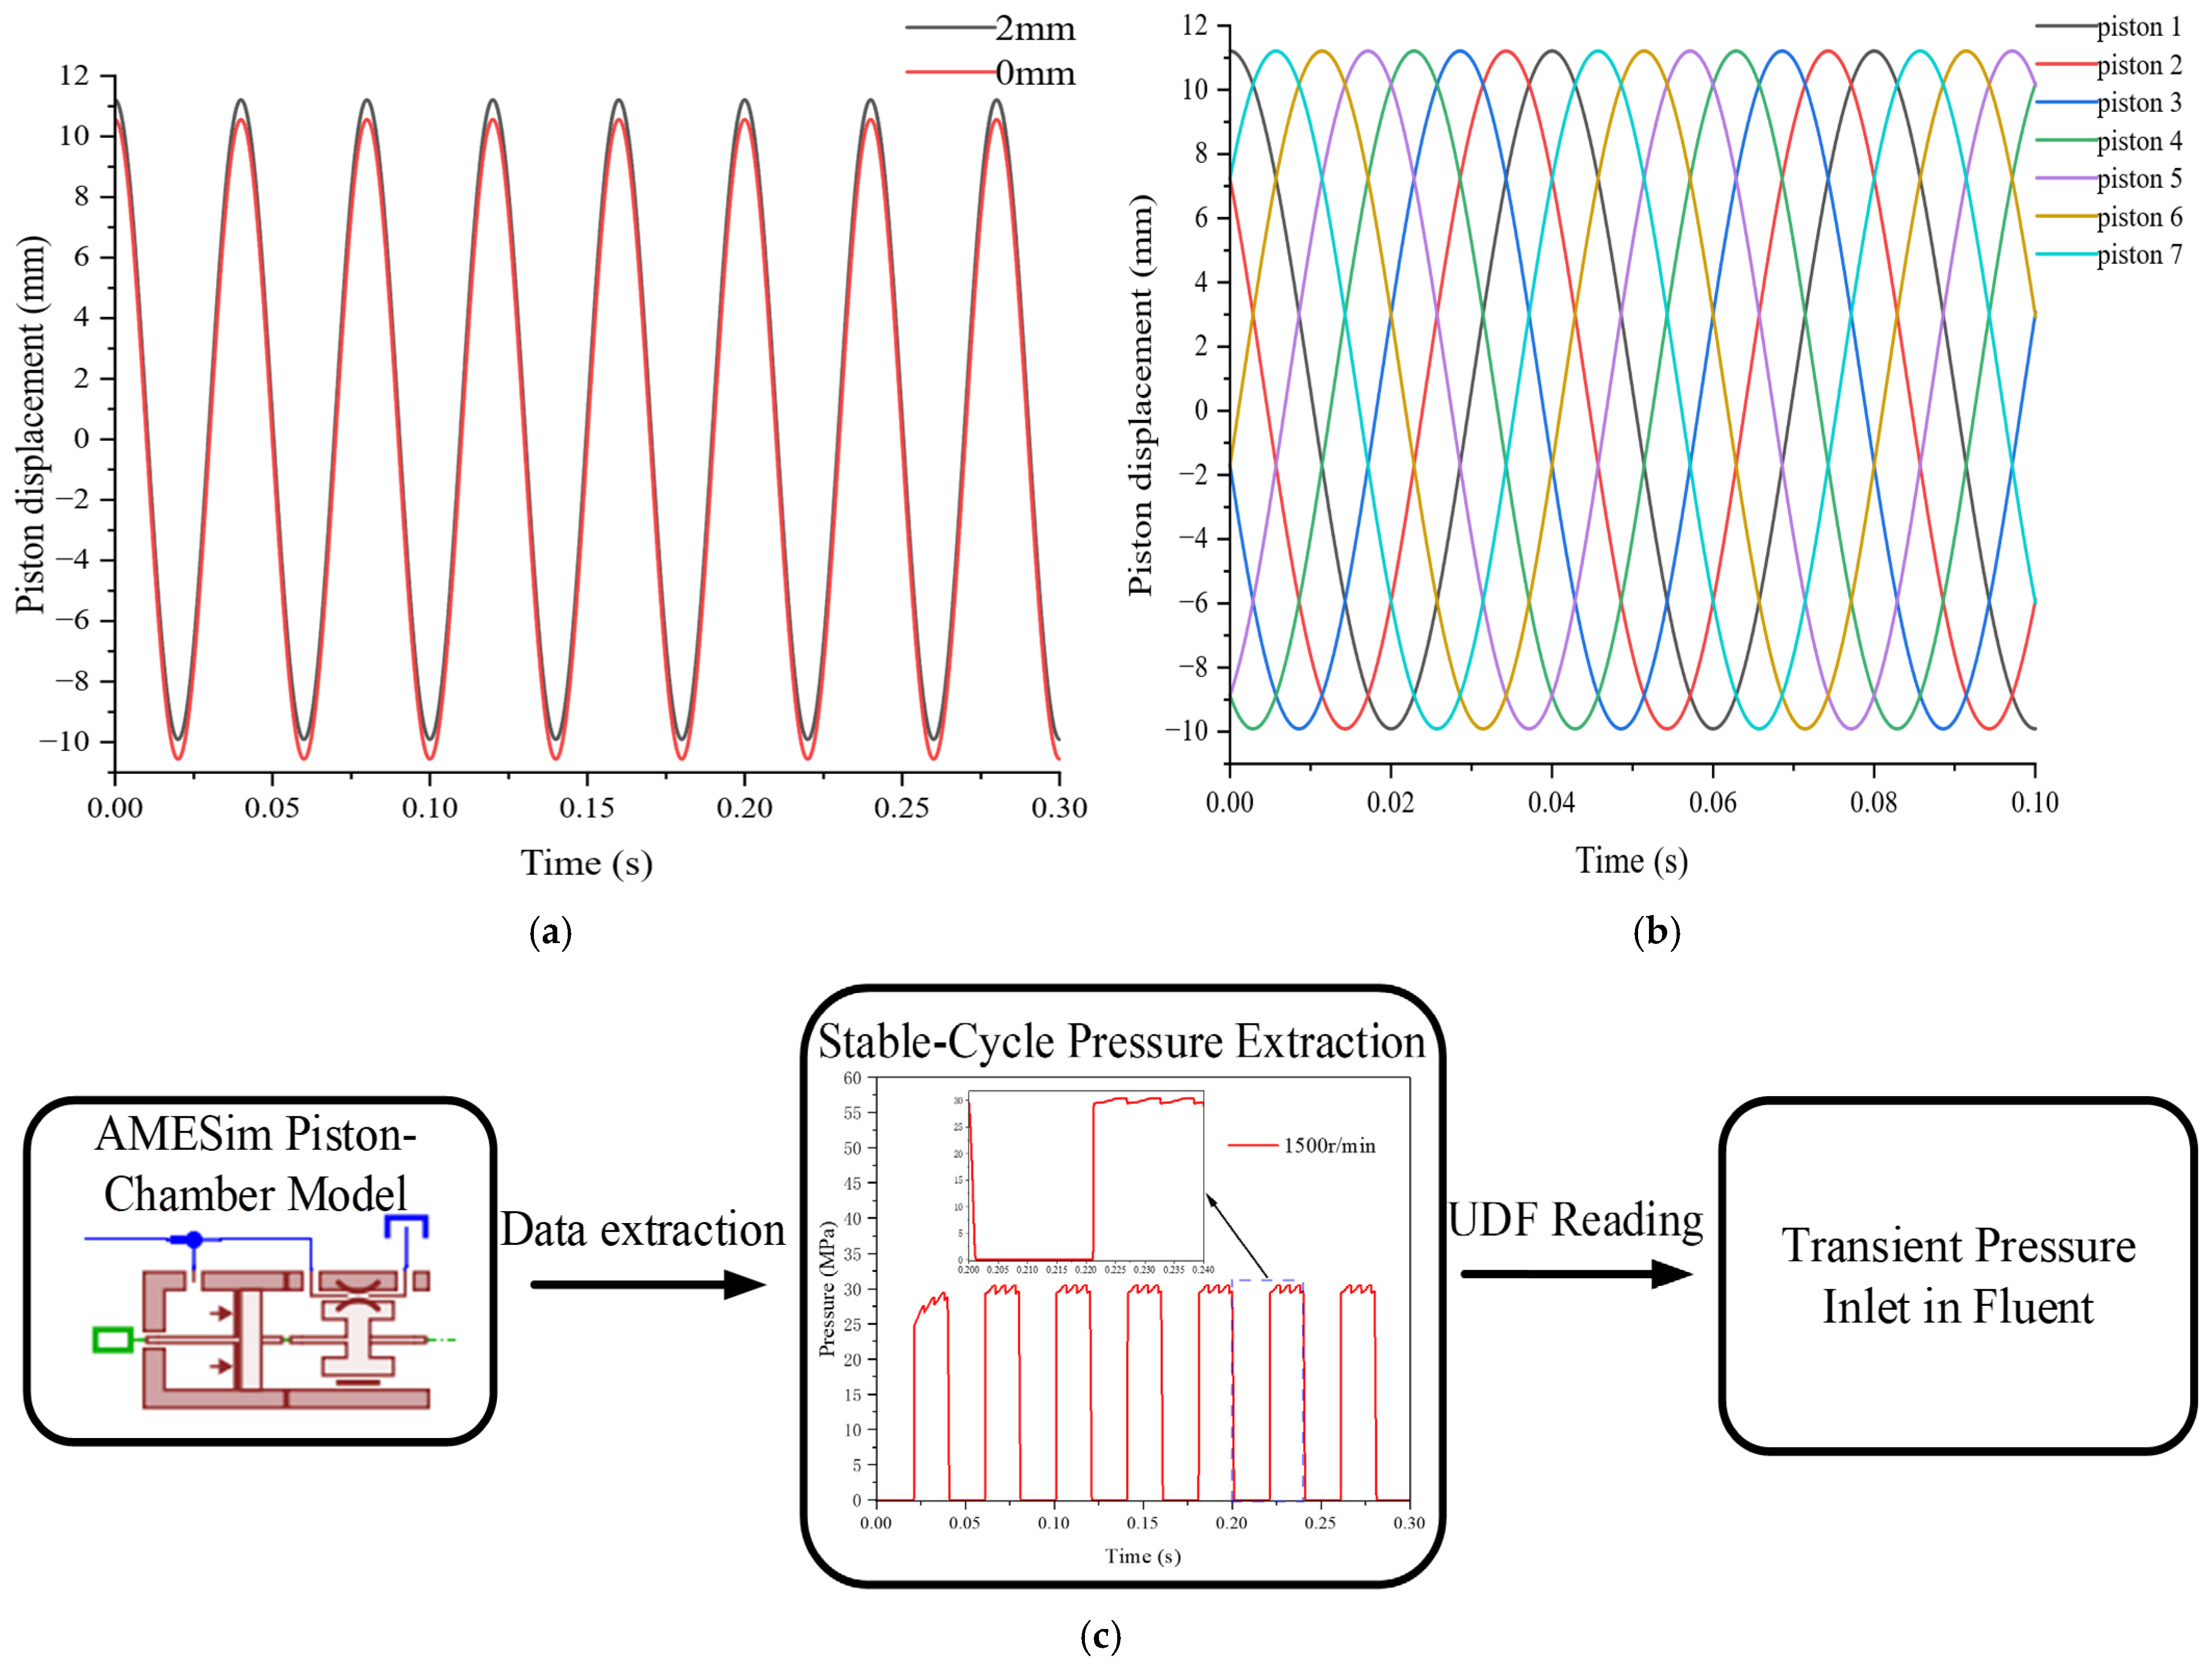
With the main parameter settings of the AMESim full-pump model summarized in Table 3, the piston displacement and velocity predicted by AMESim were compared with the analytical solutions of Equations (2) and (3). Good agreement in amplitude, phase, and period was obtained, thereby validating the motion submodel. As shown in Figure 6b, the displacement histories of the seven pistons exhibit the prescribed phase difference. After the full-pump model reached periodic steady state, a complete piston-chamber pressure cycle from 0.020 to 0.024 s was extracted and converted into a time-pressure sequence. This sequence was read by the Fluent inlet UDF and updated at every time step using piecewise-linear interpolation, as shown in Figure 6c. Since steady and transient pressure boundaries can substantially affect pump flow ripple and measurement results [28], the local oil-film calculations were driven exclusively by stable-cycle pressure data. Thus, the actual high- and low-pressure commutation process was retained rather than replaced by an ideal step-pressure boundary.
Table 3.
Main parameters of the AMESim full-pump model.
Figure 6.
(a) Comparison of the analytical and AMESim displacement histories of a representative piston; (b) displacement histories of the seven pistons; and (c) extraction and transfer of the stable-cycle piston-chamber pressure to Fluent.
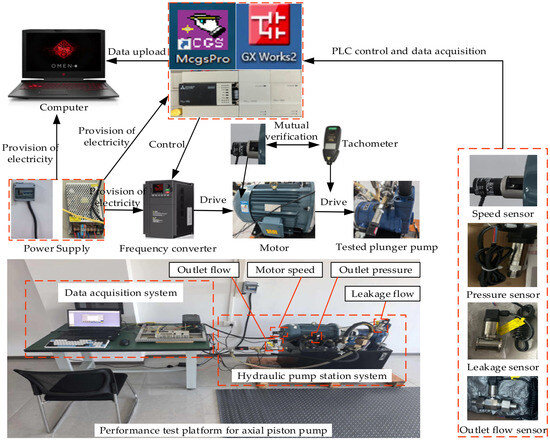
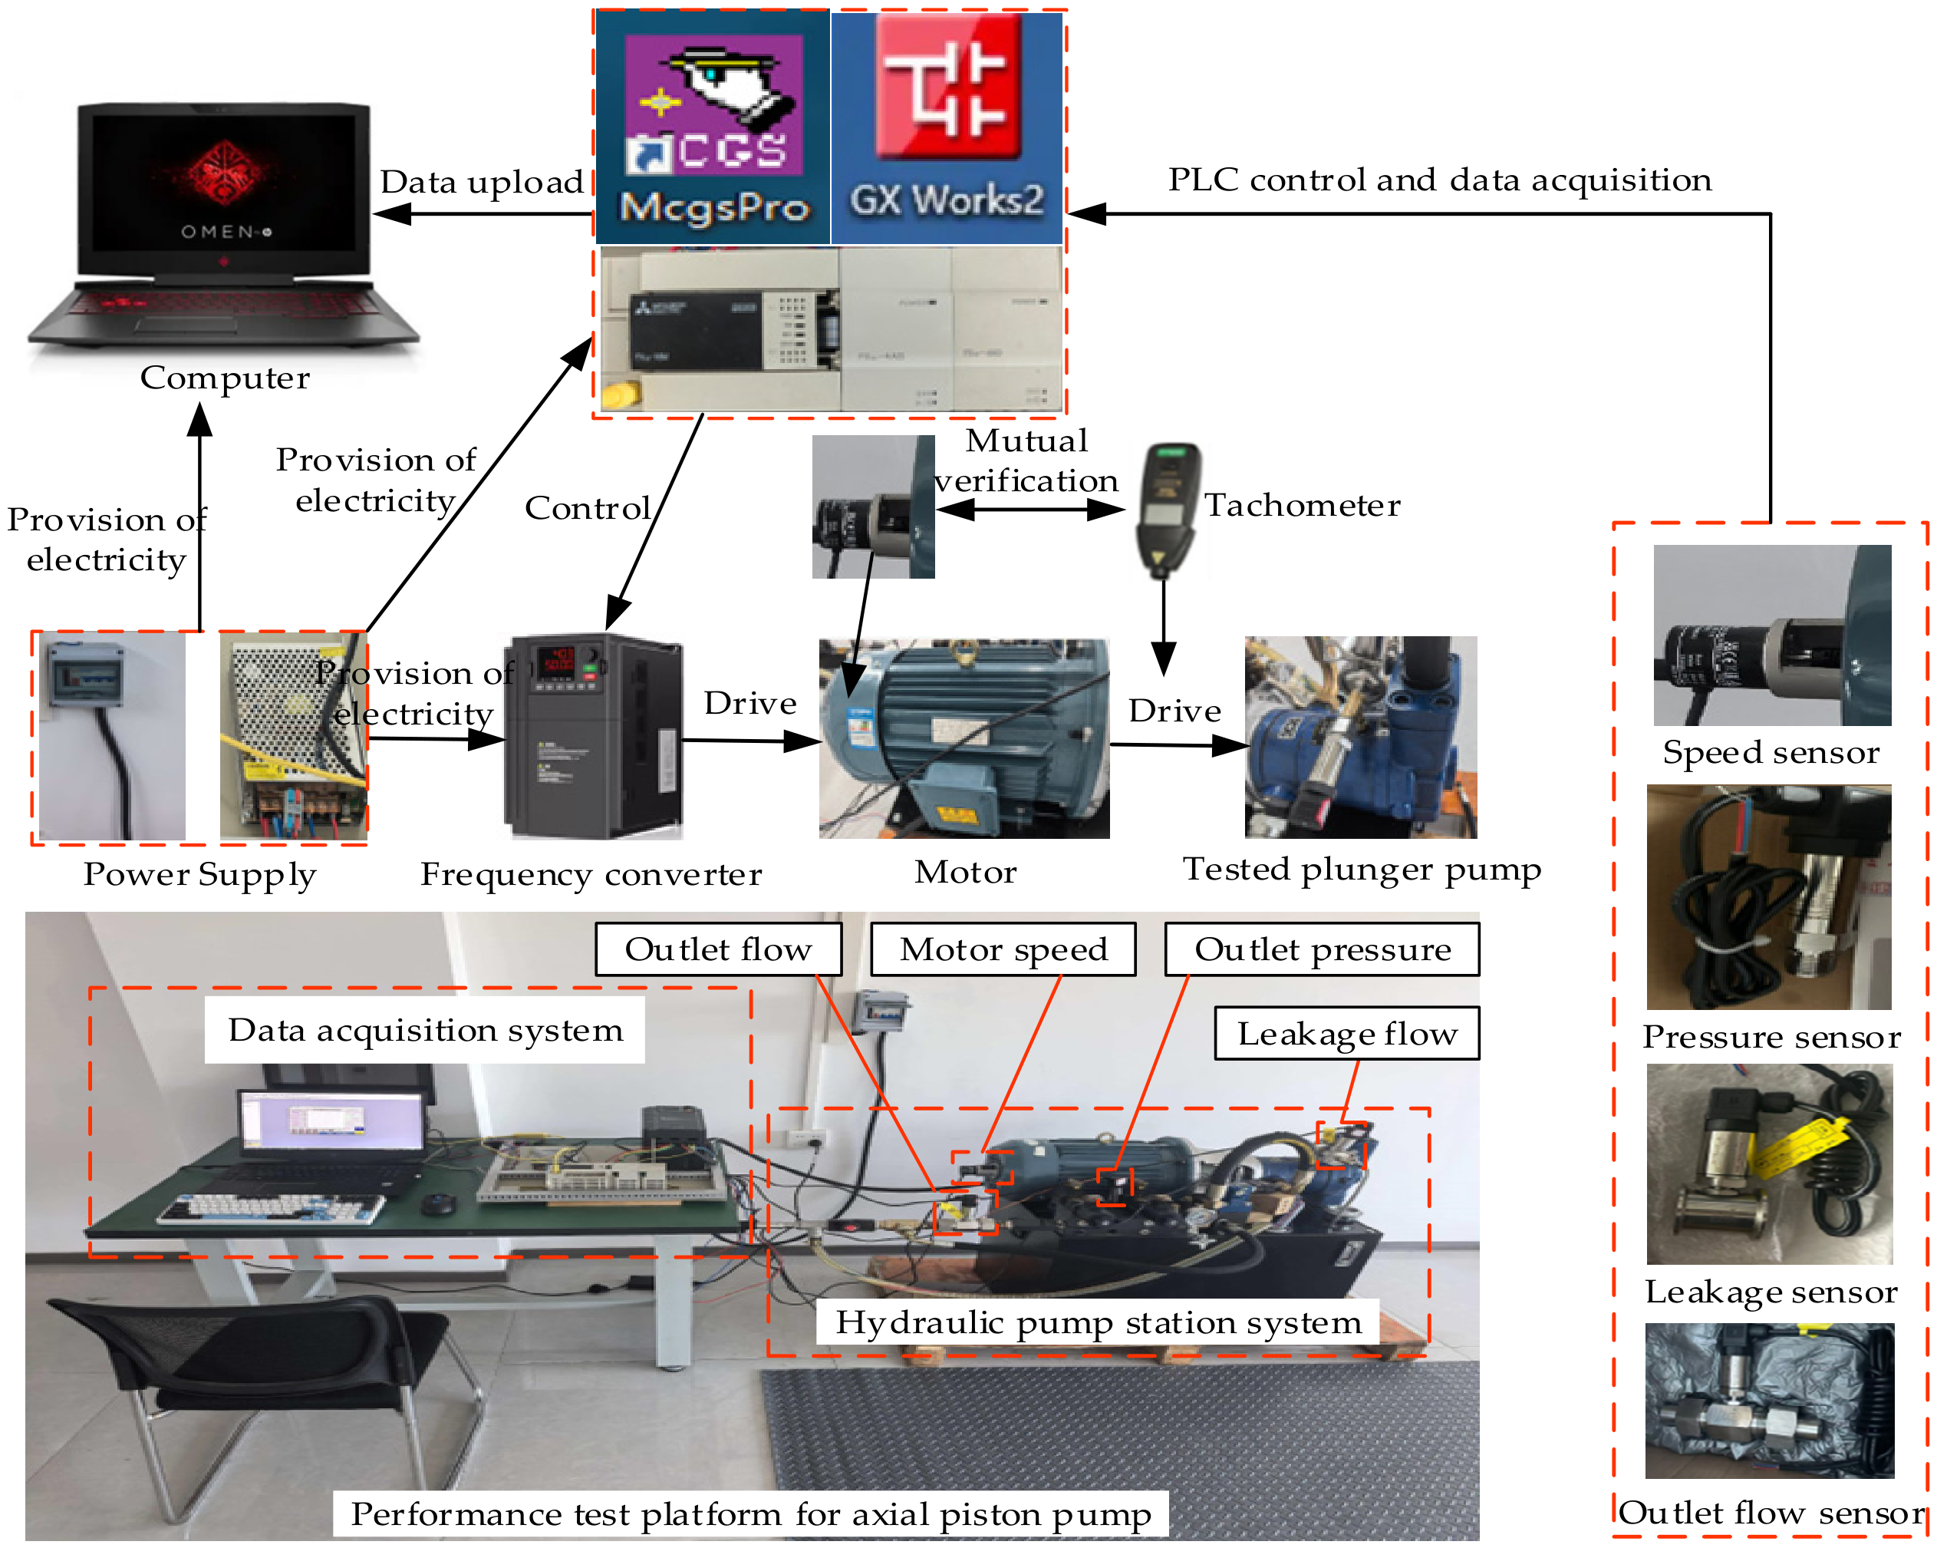
To further assess the validity of the full-pump model, the predicted pump output flow rate was compared with the experimental data measured on the same seven-piston axial piston pump in our previous study. The test rig and measurement layout are shown in Figure 7.
Figure 7.
Performance test platform for axial piston pump [1].
The tests were conducted at load pressures of 0 and 20 MPa over the investigated speed range, with the output flow rate, rotational speed, and pressures measured simultaneously. Because the pump was driven by an asynchronous motor, its rotational speed decreased under load, so the measured flow reduction at high pressure included a drive-speed contribution. The slip-induced flow loss was estimated as ΔQslip = Vth(n0 − np), where Vth is the theoretical displacement and n0 and np are the no-load and loaded rotational speeds, respectively; the measured slip was approximately 100 r/min, corresponding to ΔQslip ≈ 2.764 L/min. After adding this slip-induced flow loss back to the measured flow rate, the relative error of the normal pump at 20 MPa decreased from 10.86% to 2.87%, as listed in Table 4.
Table 4.
Comparison between simulation and experiment.
Overall, after the motor-slip correction, the maximum relative error is 1.48% at 0 MPa and 2.87% at 20 MPa, confirming that the full-pump model reliably predicts the pump output flow and the transient piston-chamber pressure used as the inlet boundary of the local oil-film model. It should be noted that this comparison is conducted at the pump level; it validates the full-pump model and the pressure boundary transferred to the local oil-film model, rather than the local film quantities directly.
3.2. Three-Dimensional Oil-Film Numerical Model and Grid Verification
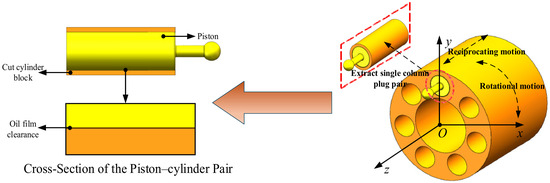
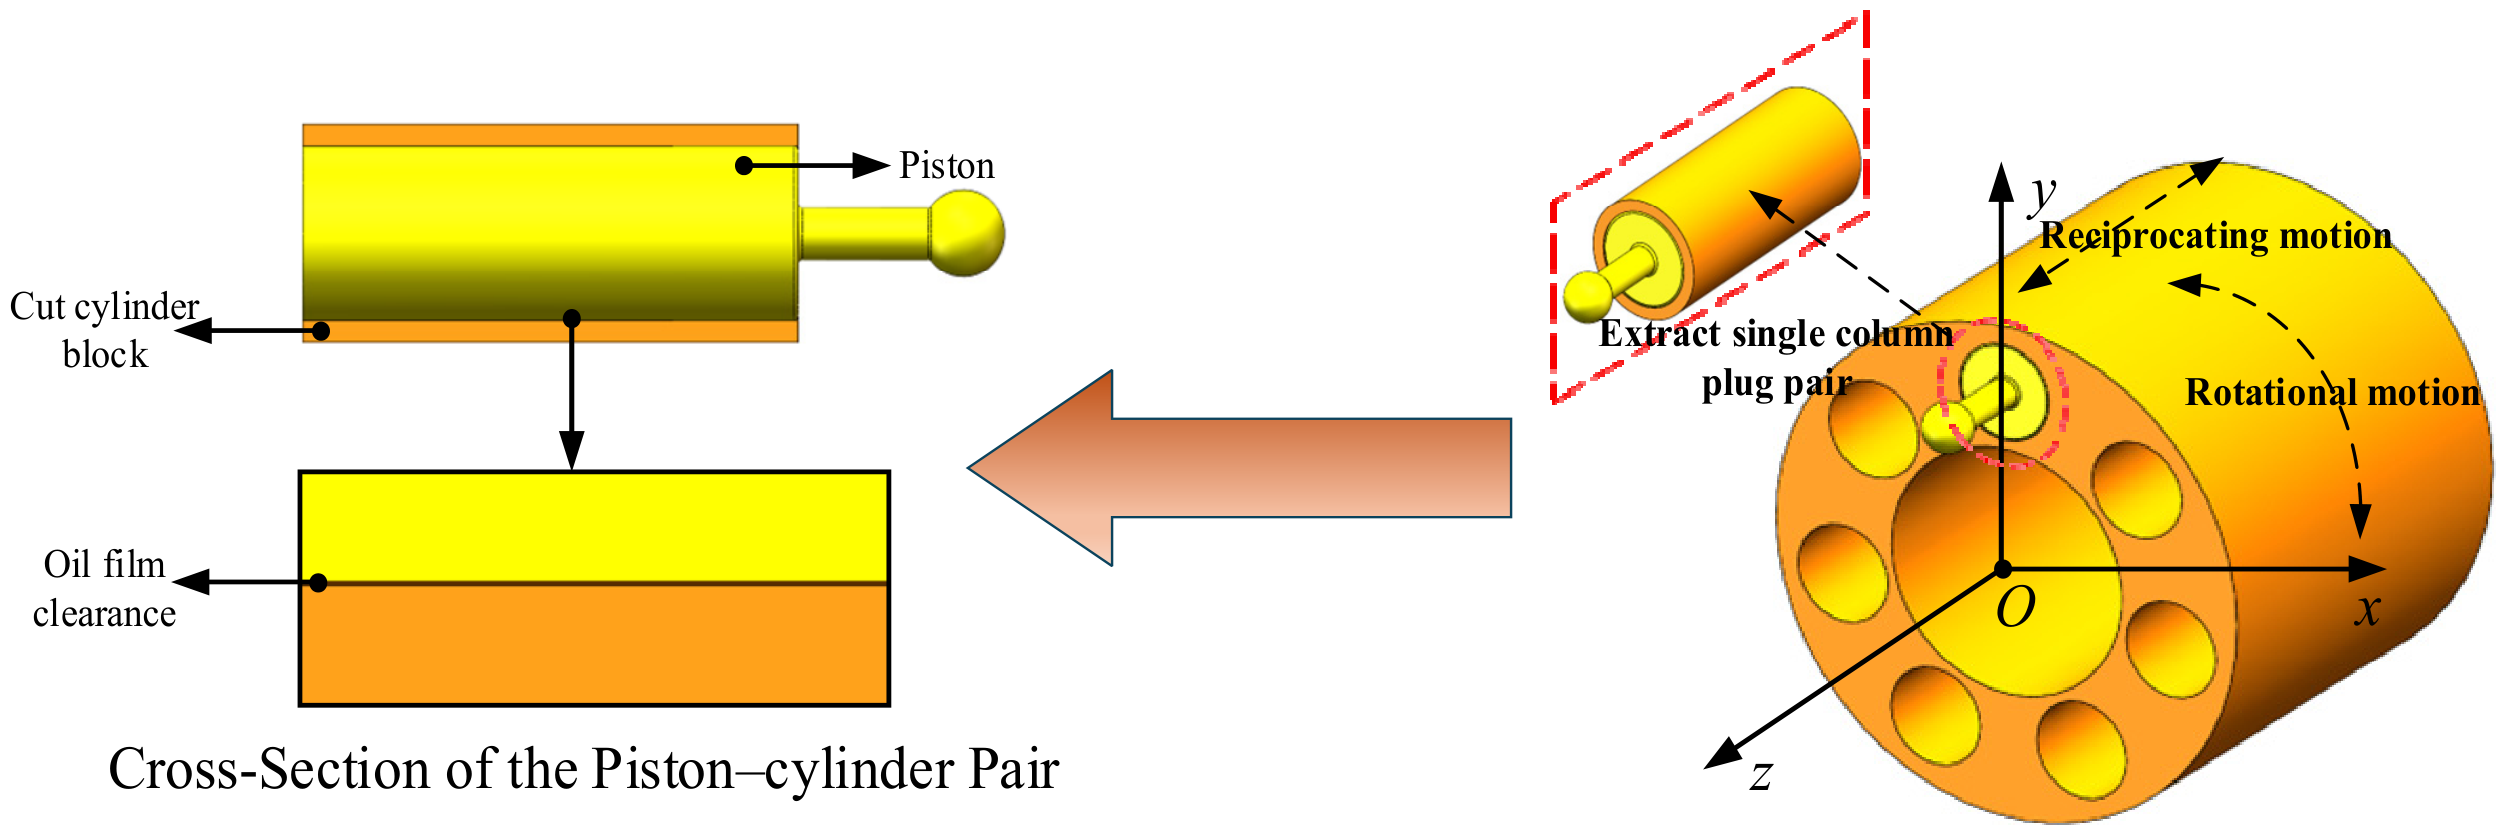
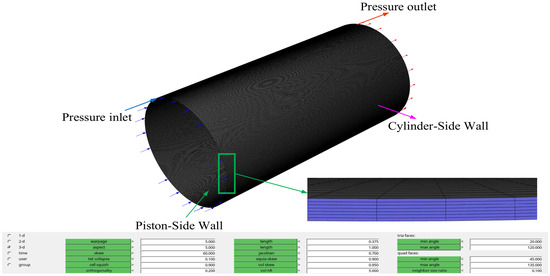
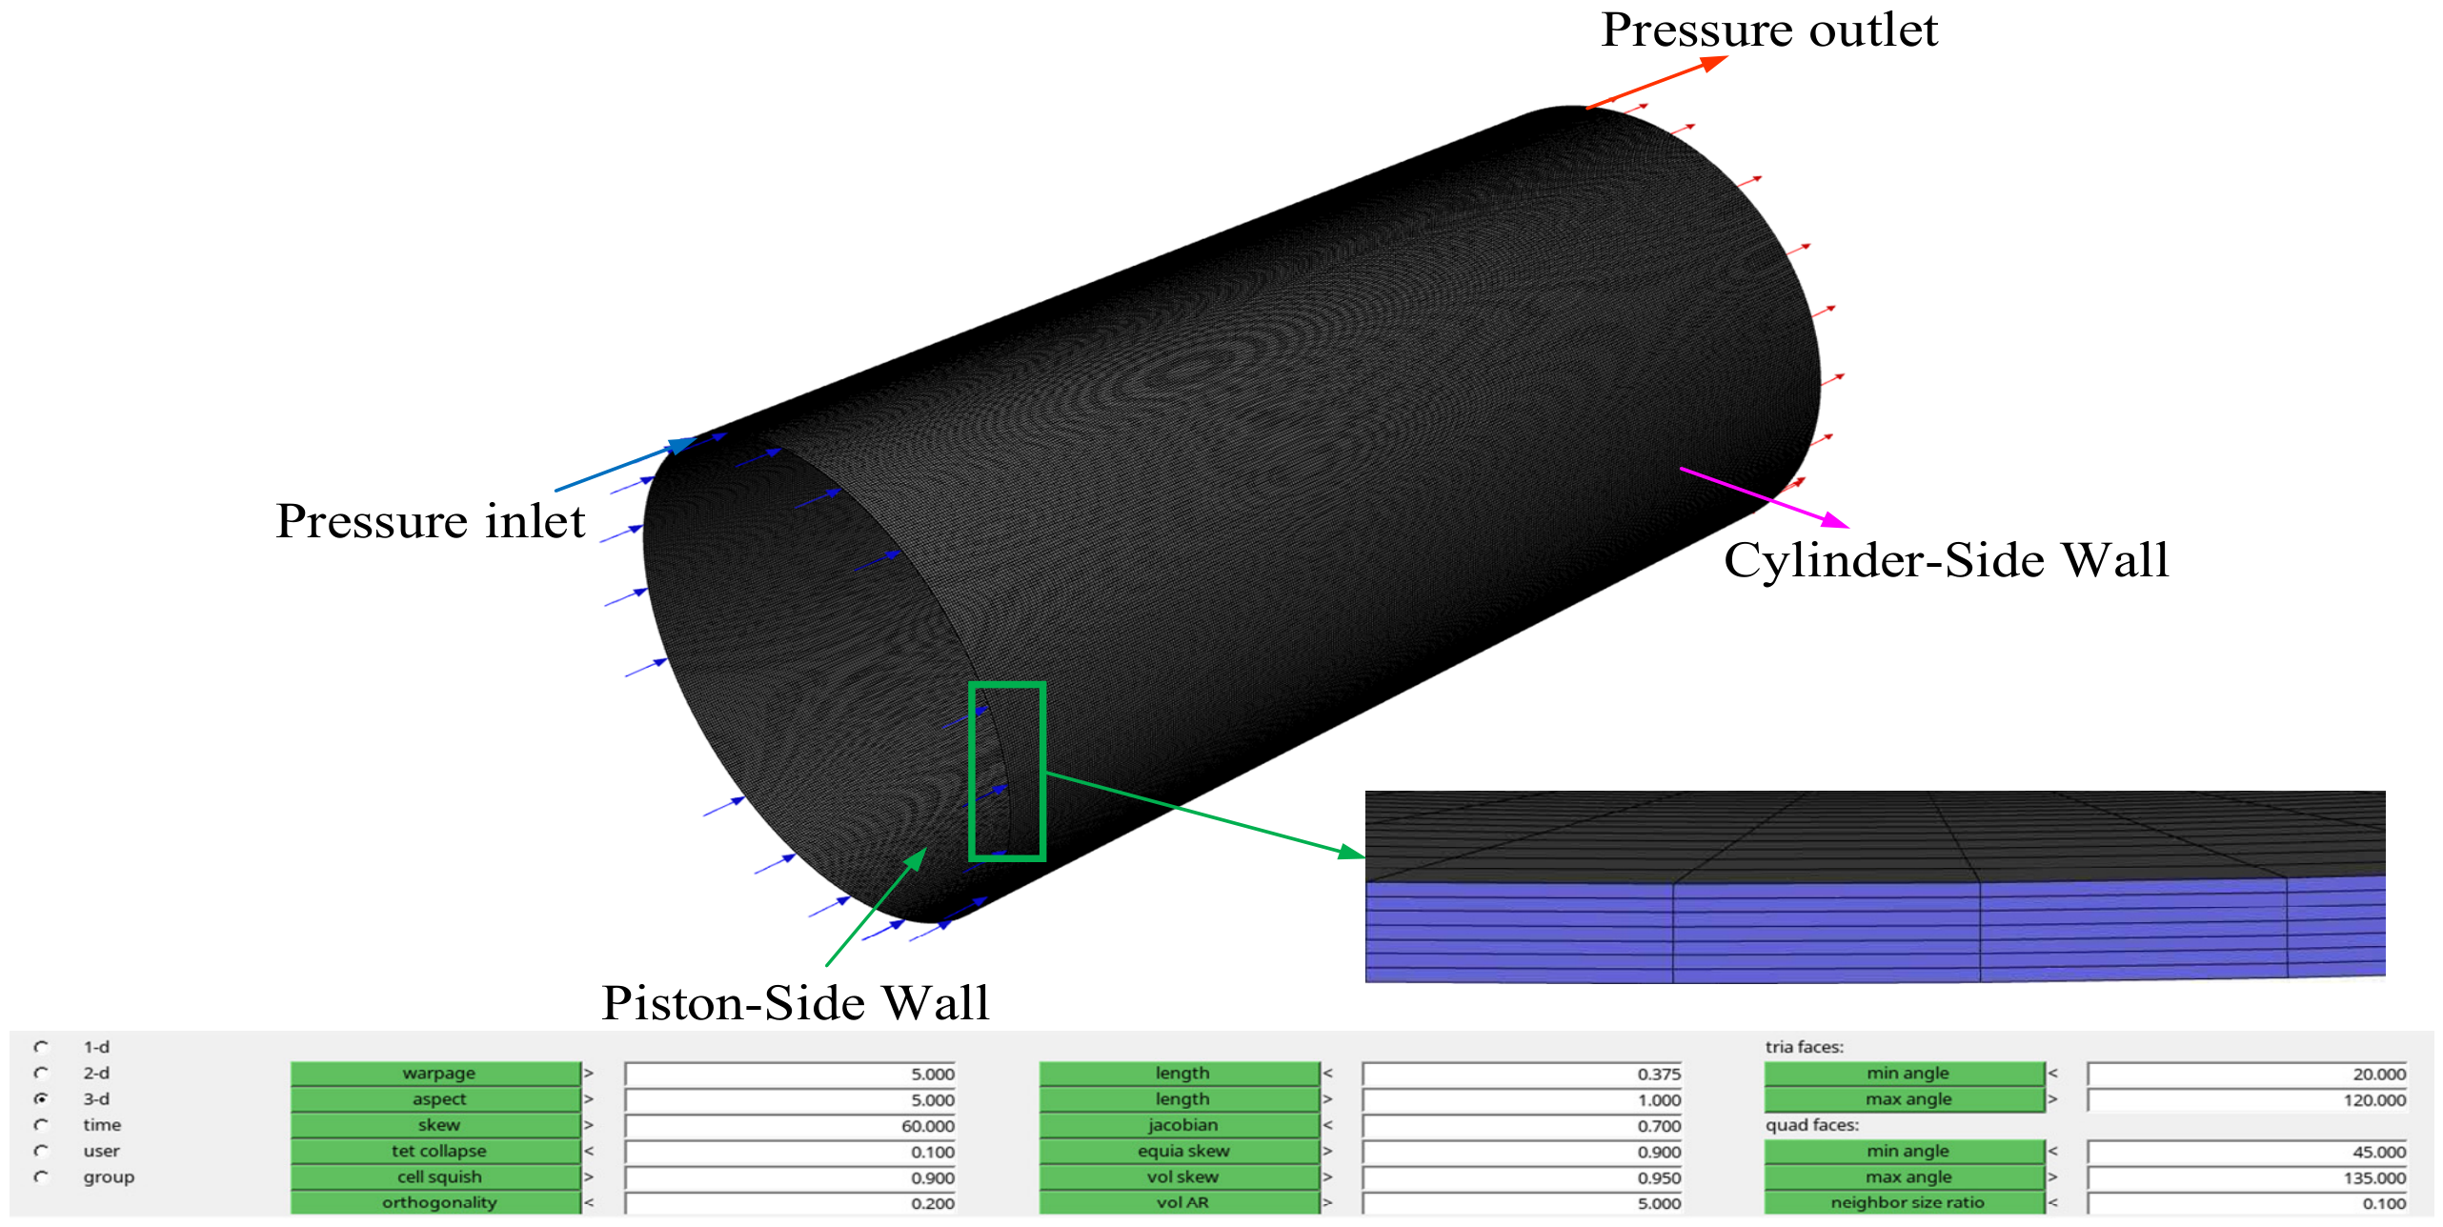
Following the extraction of the stable-cycle pressure boundary, a representative piston–cylinder pair was extracted from the axial piston pump, and its annular clearance was defined as the three-dimensional oil-film fluid domain, as illustrated in Figure 8. The computational domain, boundary conditions, and structured hexahedral mesh are shown in Figure 9. The mesh was generated in HyperMesh 2019 and then imported into ANSYS Fluent 2025 R1.
Figure 8.
Extraction of the representative piston–cylinder pair and its annular oil-film domain from the axial piston pump.
Figure 9.
Three-dimensional oil-film computational domain, boundary conditions, and structured hexahedral mesh.
The piston-side wall was prescribed as a moving boundary, with its axial velocity specified by Equation (3). The parallel-offset and center-tilted postures were introduced by updating the wall-node positions using the DEFINE_GRID_MOTION macro. At the pressure inlet, the stable-cycle piston-chamber pressure obtained from AMESim was imposed through UDF-based interpolation. The pressure outlet was set to 0.2 MPa, and the initial oil temperature was set to 26.85 °C.
The model parameters, boundary conditions, and numerical settings are summarized in Table 5. The mesh was uniformly distributed in the circumferential and axial directions, and seven cell layers were arranged across the film thickness to resolve the velocity and temperature gradients. A pressure-based solver with SIMPLEC pressure–velocity coupling and second-order spatial discretization was adopted. The energy equation was enabled, and the lubricant viscosity was updated in real time according to Equation (22). The time step was set to 4 × 10⁻⁵ s for the load-pressure and rotational-speed cases and to 6 × 10⁻⁵ s for the posture-comparison cases at 500 r/min. Each condition was simulated for at least three cycles, with periodic convergence determined by stabilization of the leakage flow rate and maximum temperature between successive cycles.
Table 5.
Parameters and operating conditions of the three-dimensional oil-film numerical model.
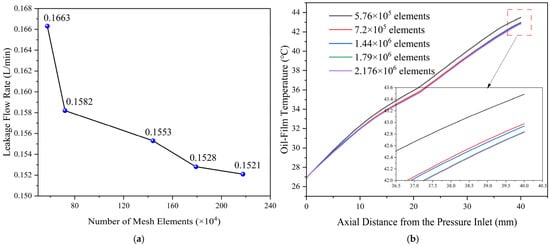
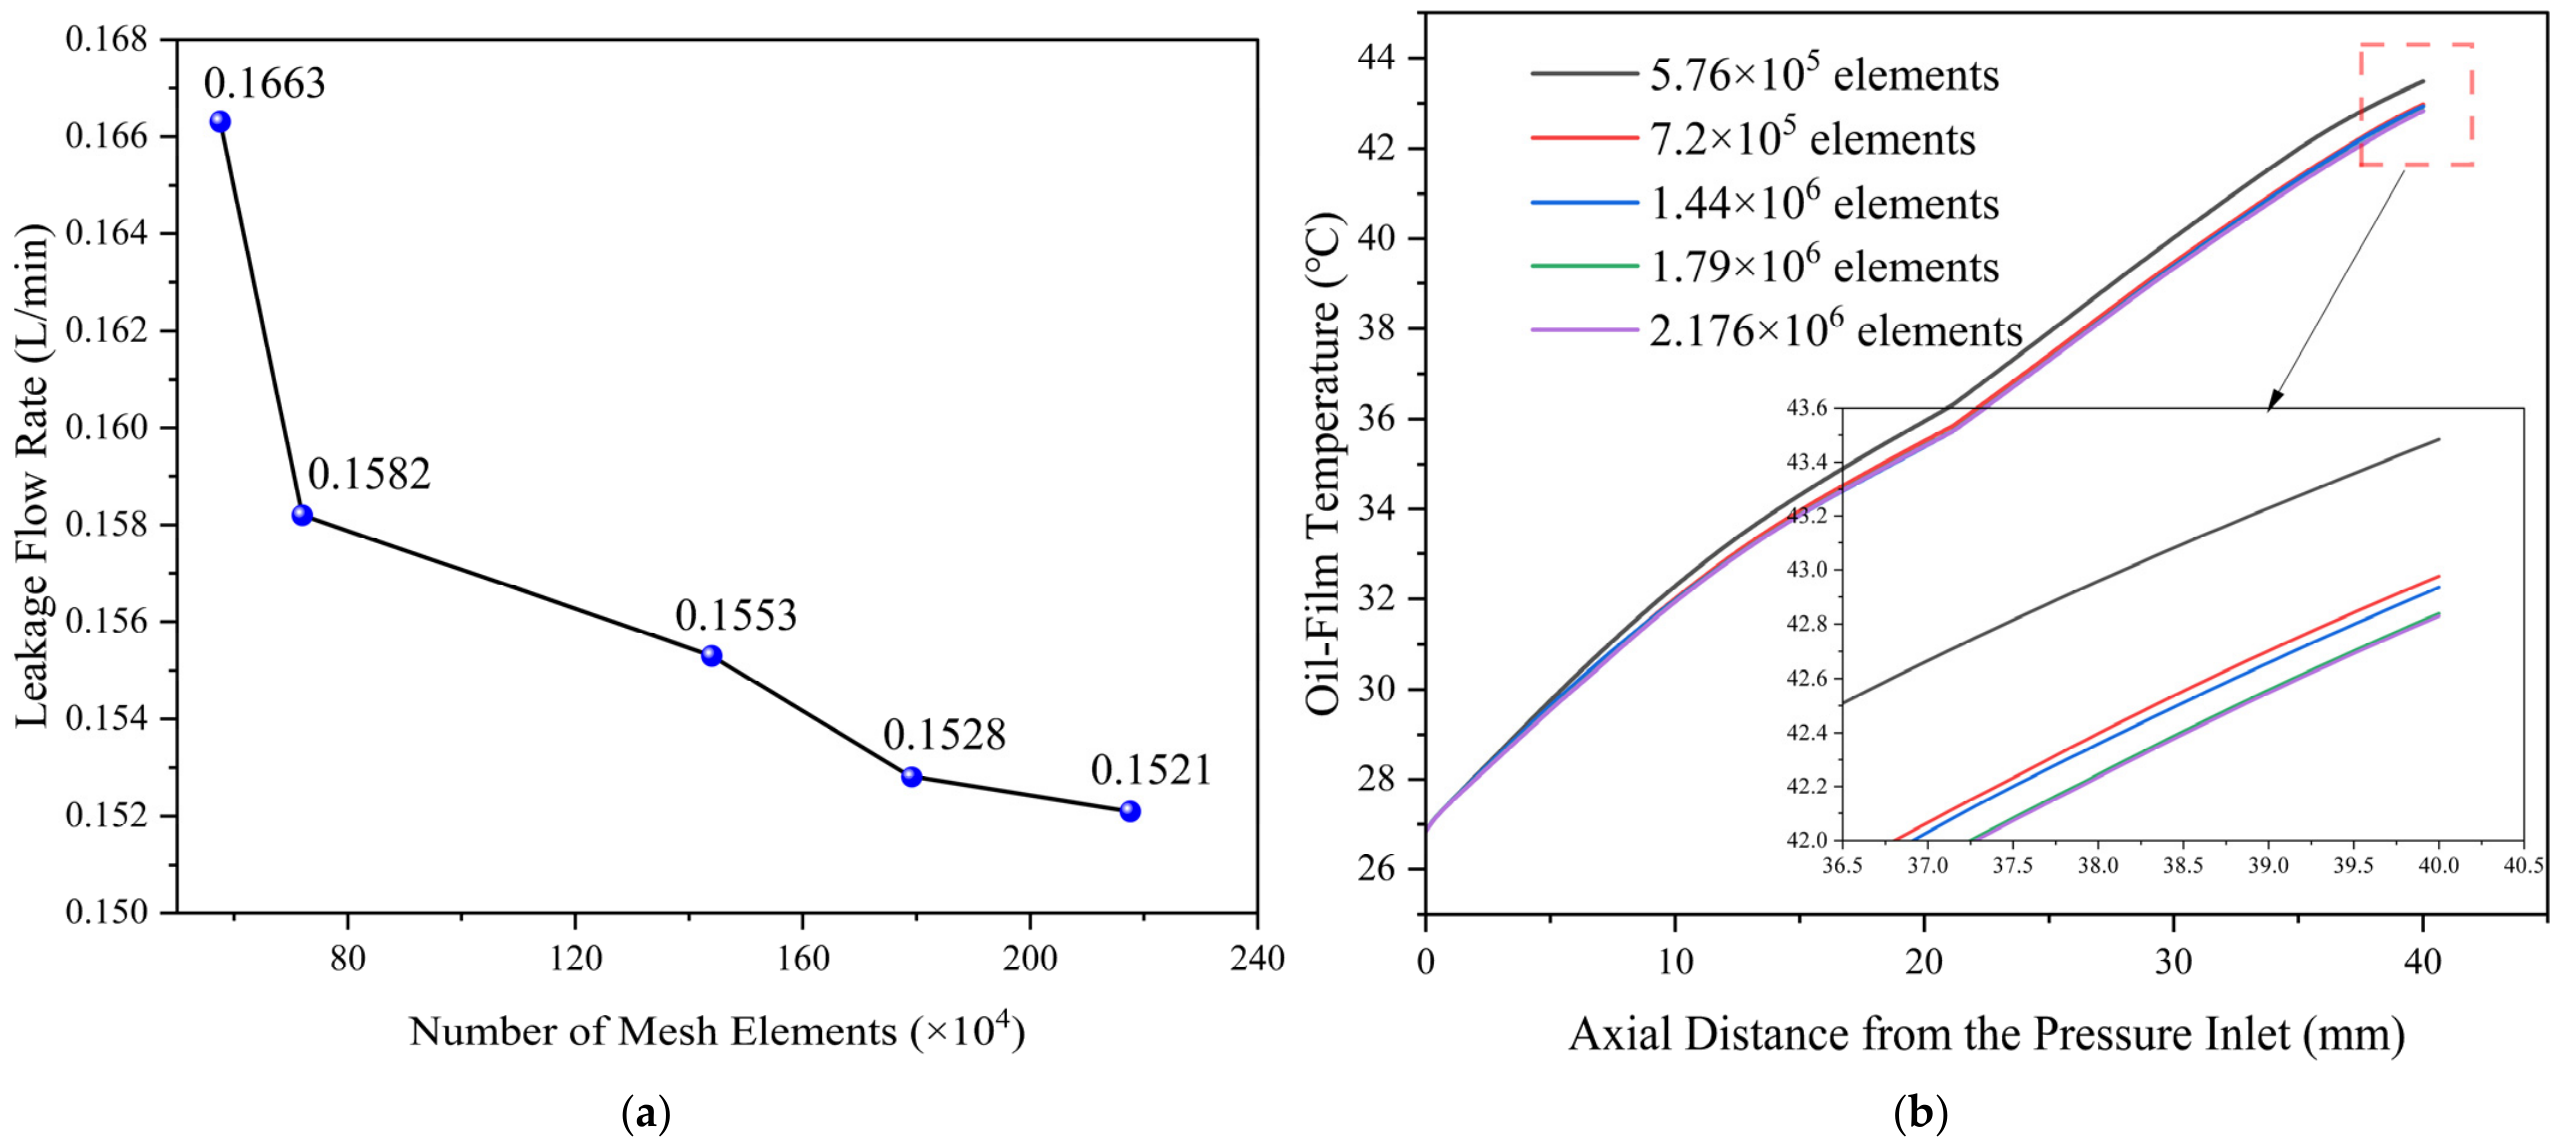
Grid sensitivity was evaluated under the baseline operating condition of 30 MPa and 1500 r/min, using the cycle-averaged leakage flow rate and maximum oil-film temperature as the assessment indicators. As shown in Figure 10a, the leakage flow rate gradually converged as the cell count increased from 7.2 × 10⁵ to 2.176 × 10⁶. Figure 10b further shows that the axial temperature distributions progressively converge with mesh refinement. When the mesh was refined from 1.79 × 10⁶ to 2.176 × 10⁶ cells, the relative deviations in leakage flow rate and maximum temperature were both below 1%. Therefore, the mesh containing 1.79 × 10⁶ cells was adopted for all subsequent simulations. Its minimum orthogonal quality exceeded 0.96 and its maximum aspect ratio was 29.16, providing an appropriate balance between resolving gradients in the micrometer-scale clearance and the computational cost of three-cycle transient calculations.
Figure 10.
(a) Cycle-averaged leakage flow rate and (b) axial distribution of maximum oil-film temperature for different mesh densities.
Following the mesh-independence assessment, time-step sensitivity was evaluated under two representative conditions to verify the temporal resolution of the numerical model. The first was the constant-pressure delivery condition at 1500 r/min and 30 MPa, used to isolate the influence of time-step size on the local oil-film solution. The second used the AMESim-derived transient piston-chamber pressure boundary during the third operating cycle, thereby retaining the pressure commutation and periodic thermal response. For each condition, the mesh, material-property model, boundary conditions other than the prescribed pressure history, and convergence settings were kept unchanged. At each time step, a maximum of 80 inner iterations was permitted. The solution was considered converged when the scaled residuals of continuity and the three momentum components decreased below 10−3, while the energy residual decreased below 10−6. The outlet leakage flow rate and maximum oil-film temperature were also monitored to ensure that no appreciable variation occurred during the final inner iterations. Three time steps, 8.0 × 10⁻⁵, 4.0 × 10⁻⁵, and 2.0 × 10⁻⁵ s, corresponding to 500, 1000, and 2000 steps per cycle, respectively, were considered. The peak leakage flow rate and end-of-cycle maximum oil-film temperature were used as the assessment indicators. The relative deviations were calculated with respect to the adopted time step of 4.0 × 10⁻⁵ s.
Table 6 and Table 7 show that the calculated responses are only weakly affected by further time-step refinement. Under the constant-pressure delivery condition, the largest deviations in peak leakage and end-of-cycle maximum temperature are 0.393% and 0.187%, respectively. Under the transient pressure boundary, the corresponding maximum deviations are 0.292% and 0.108%. Reducing the time step from 4.0 × 10⁻⁵ to 2.0 × 10⁻⁵ s produces deviations below 0.131% for leakage and 0.023% for temperature in the constant-pressure case, and below 0.073% and 0.022%, respectively, in the transient-pressure case. Therefore, the adopted time step of 4.0 × 10⁻⁵ s provides sufficient temporal resolution for both the local constant-pressure calculation and the third-cycle simulation with the imported transient pressure boundary.
Table 6.
Time-step sensitivity of the leakage flow rate and maximum oil-film temperature under the constant-pressure discharge condition.
Table 7.
Time-step sensitivity of the third-cycle response under the transient piston-chamber pressure boundary.
4. Transient Oil-Film Characteristics of the Piston–Cylinder Pair
4.1. Effect of Load Pressure on the Thermohydrodynamic Characteristics of the Oil Film
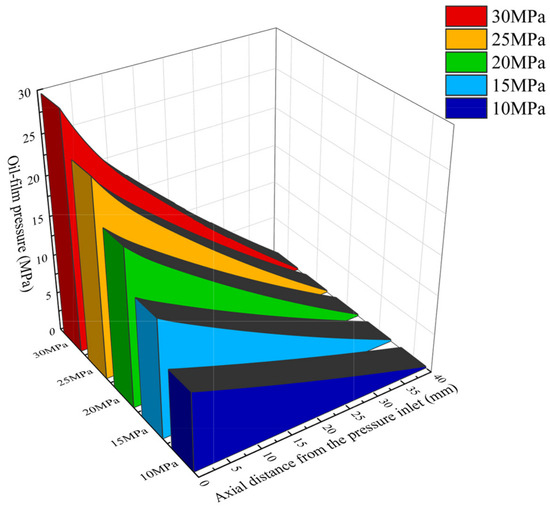
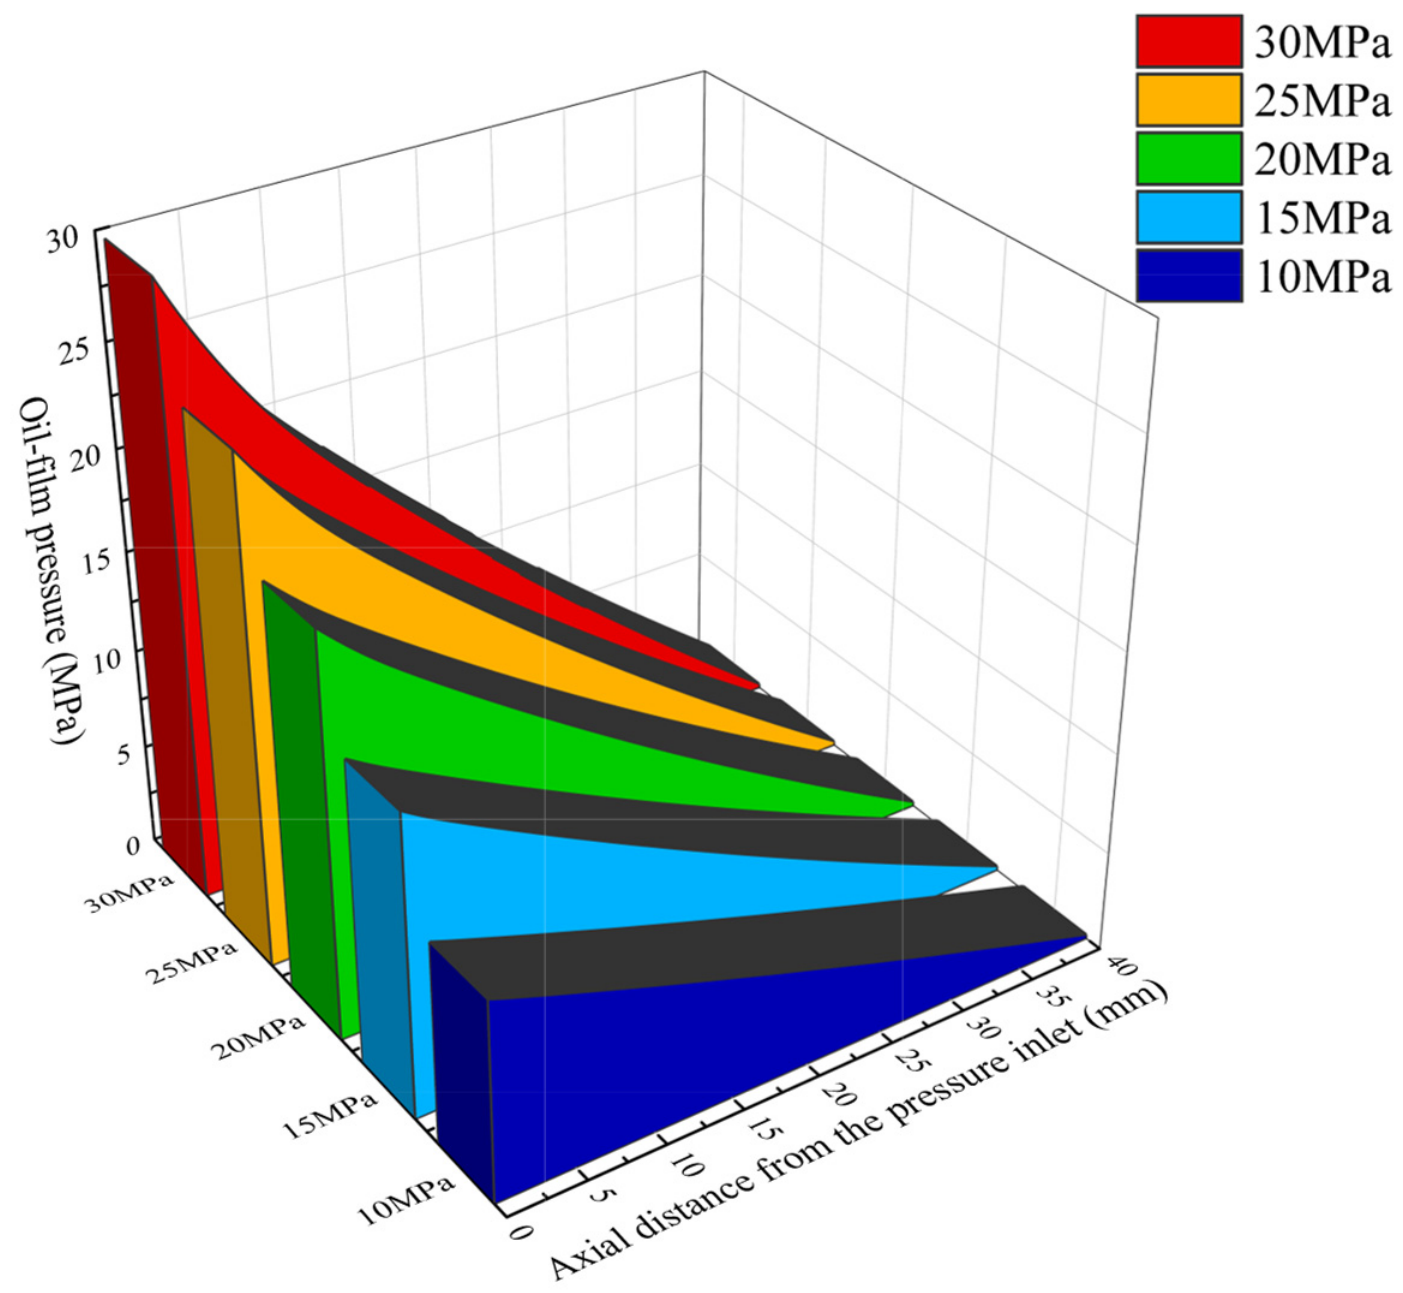
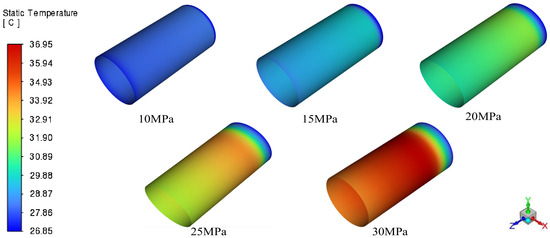
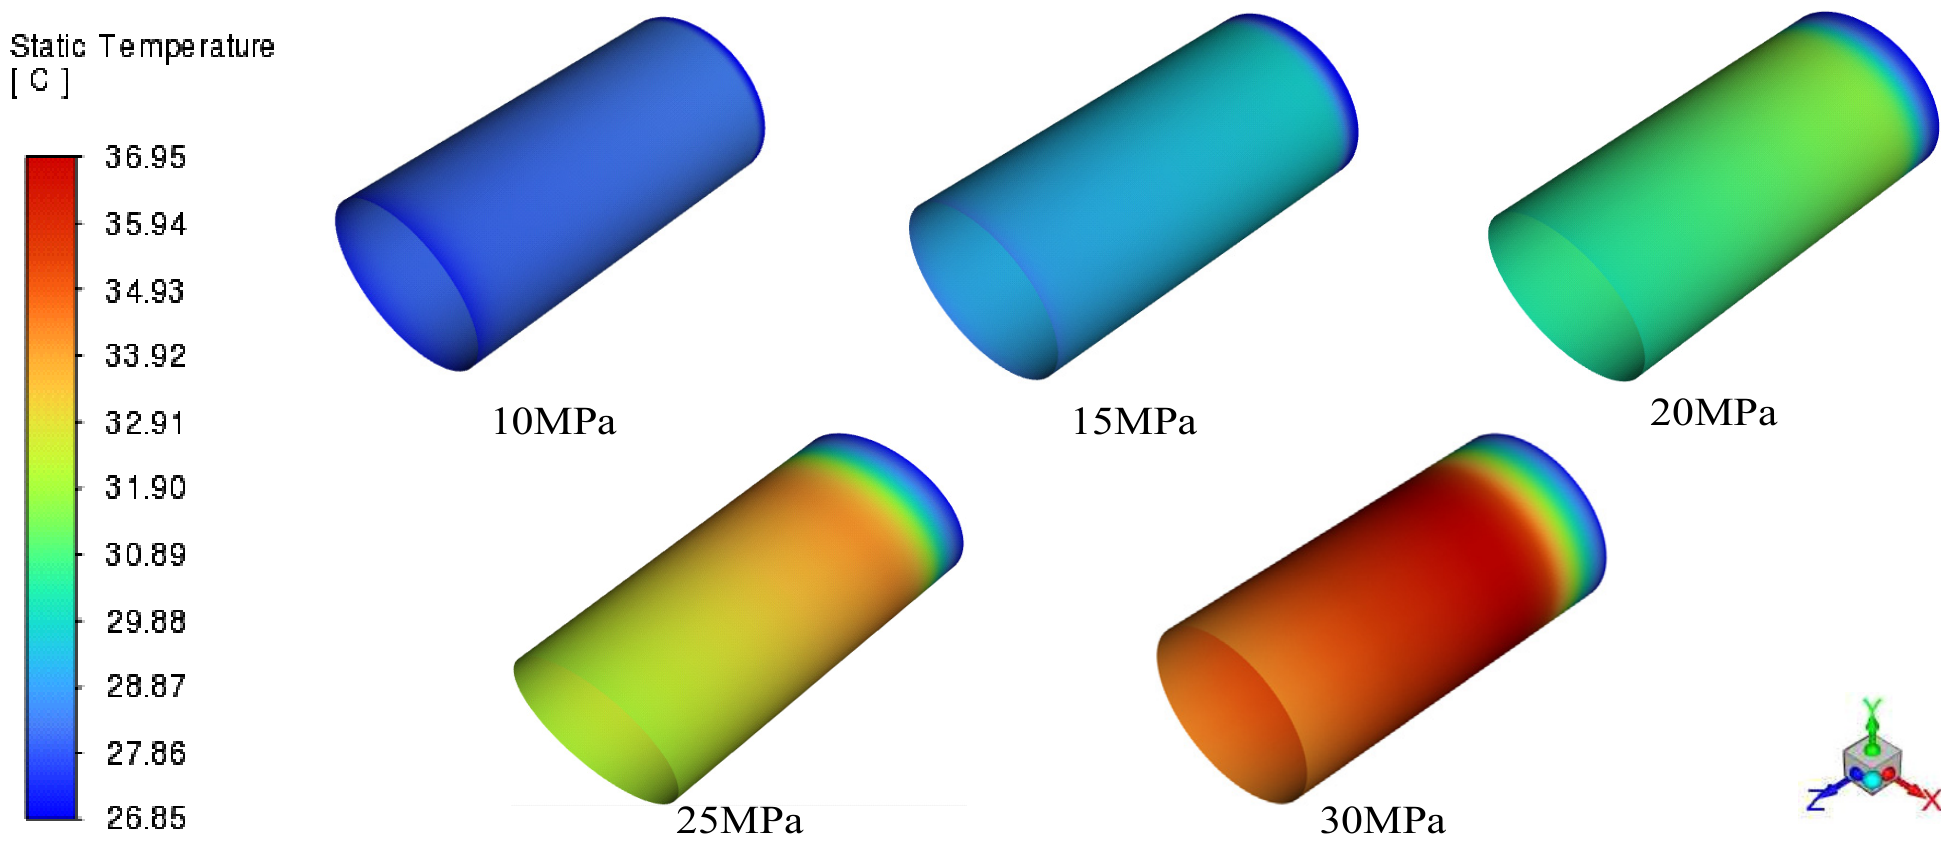
During one operating cycle, the piston–cylinder pair undergoes suction and delivery strokes with markedly different pressure differentials and viscous-dissipation levels. Because the high-pressure delivery stroke represents the critical condition for pressure-driven leakage and thermal loading, the following analysis focuses on this half-cycle. The rotational speed was fixed at 1500 r/min, and five piston-chamber inlet pressures of 10, 15, 20, 25, and 30 MPa were imposed. A complete delivery half-cycle was simulated using a time step of 4 × 10⁻⁵ s, corresponding to 500 time steps. During this stroke, the piston retracts toward the valve plate; therefore, the piston-wall velocity was applied in the negative z-direction. The resulting axial pressure distributions and oil-film temperature contours are presented in Figure 11 and Figure 12, respectively.
Figure 11.
Axial oil-film pressure distributions under different load pressures.
Figure 12.
Oil-film temperature contours under different load pressures during the high-pressure delivery stage.
As shown in Figure 11, the oil-film pressure decreases approximately linearly from the piston-chamber inlet to the casing outlet at all load levels, confirming that the flow is primarily driven by the axial pressure difference. Increasing the load pressure strengthens the axial pressure gradient and consequently increases the pressure-driven clearance flow. Under the concentric posture, circumferential pressure variations remain small, and the radial pressure-force components are therefore largely balanced. The corresponding thermal response is shown in Figure 12. As the load pressure increases, the high-temperature region expands gradually along the oil film because the stronger pressure-driven flow and piston-wall shear intensify viscous dissipation. Accordingly, the maximum oil-film temperature rises from 28.39 °C at 10 MPa to 36.95 °C at 30 MPa, demonstrating that higher load pressure increases both the leakage-driving pressure gradient and the thermal load of the piston–cylinder interface.
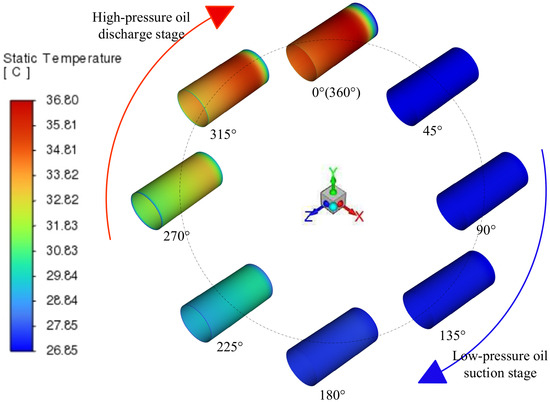
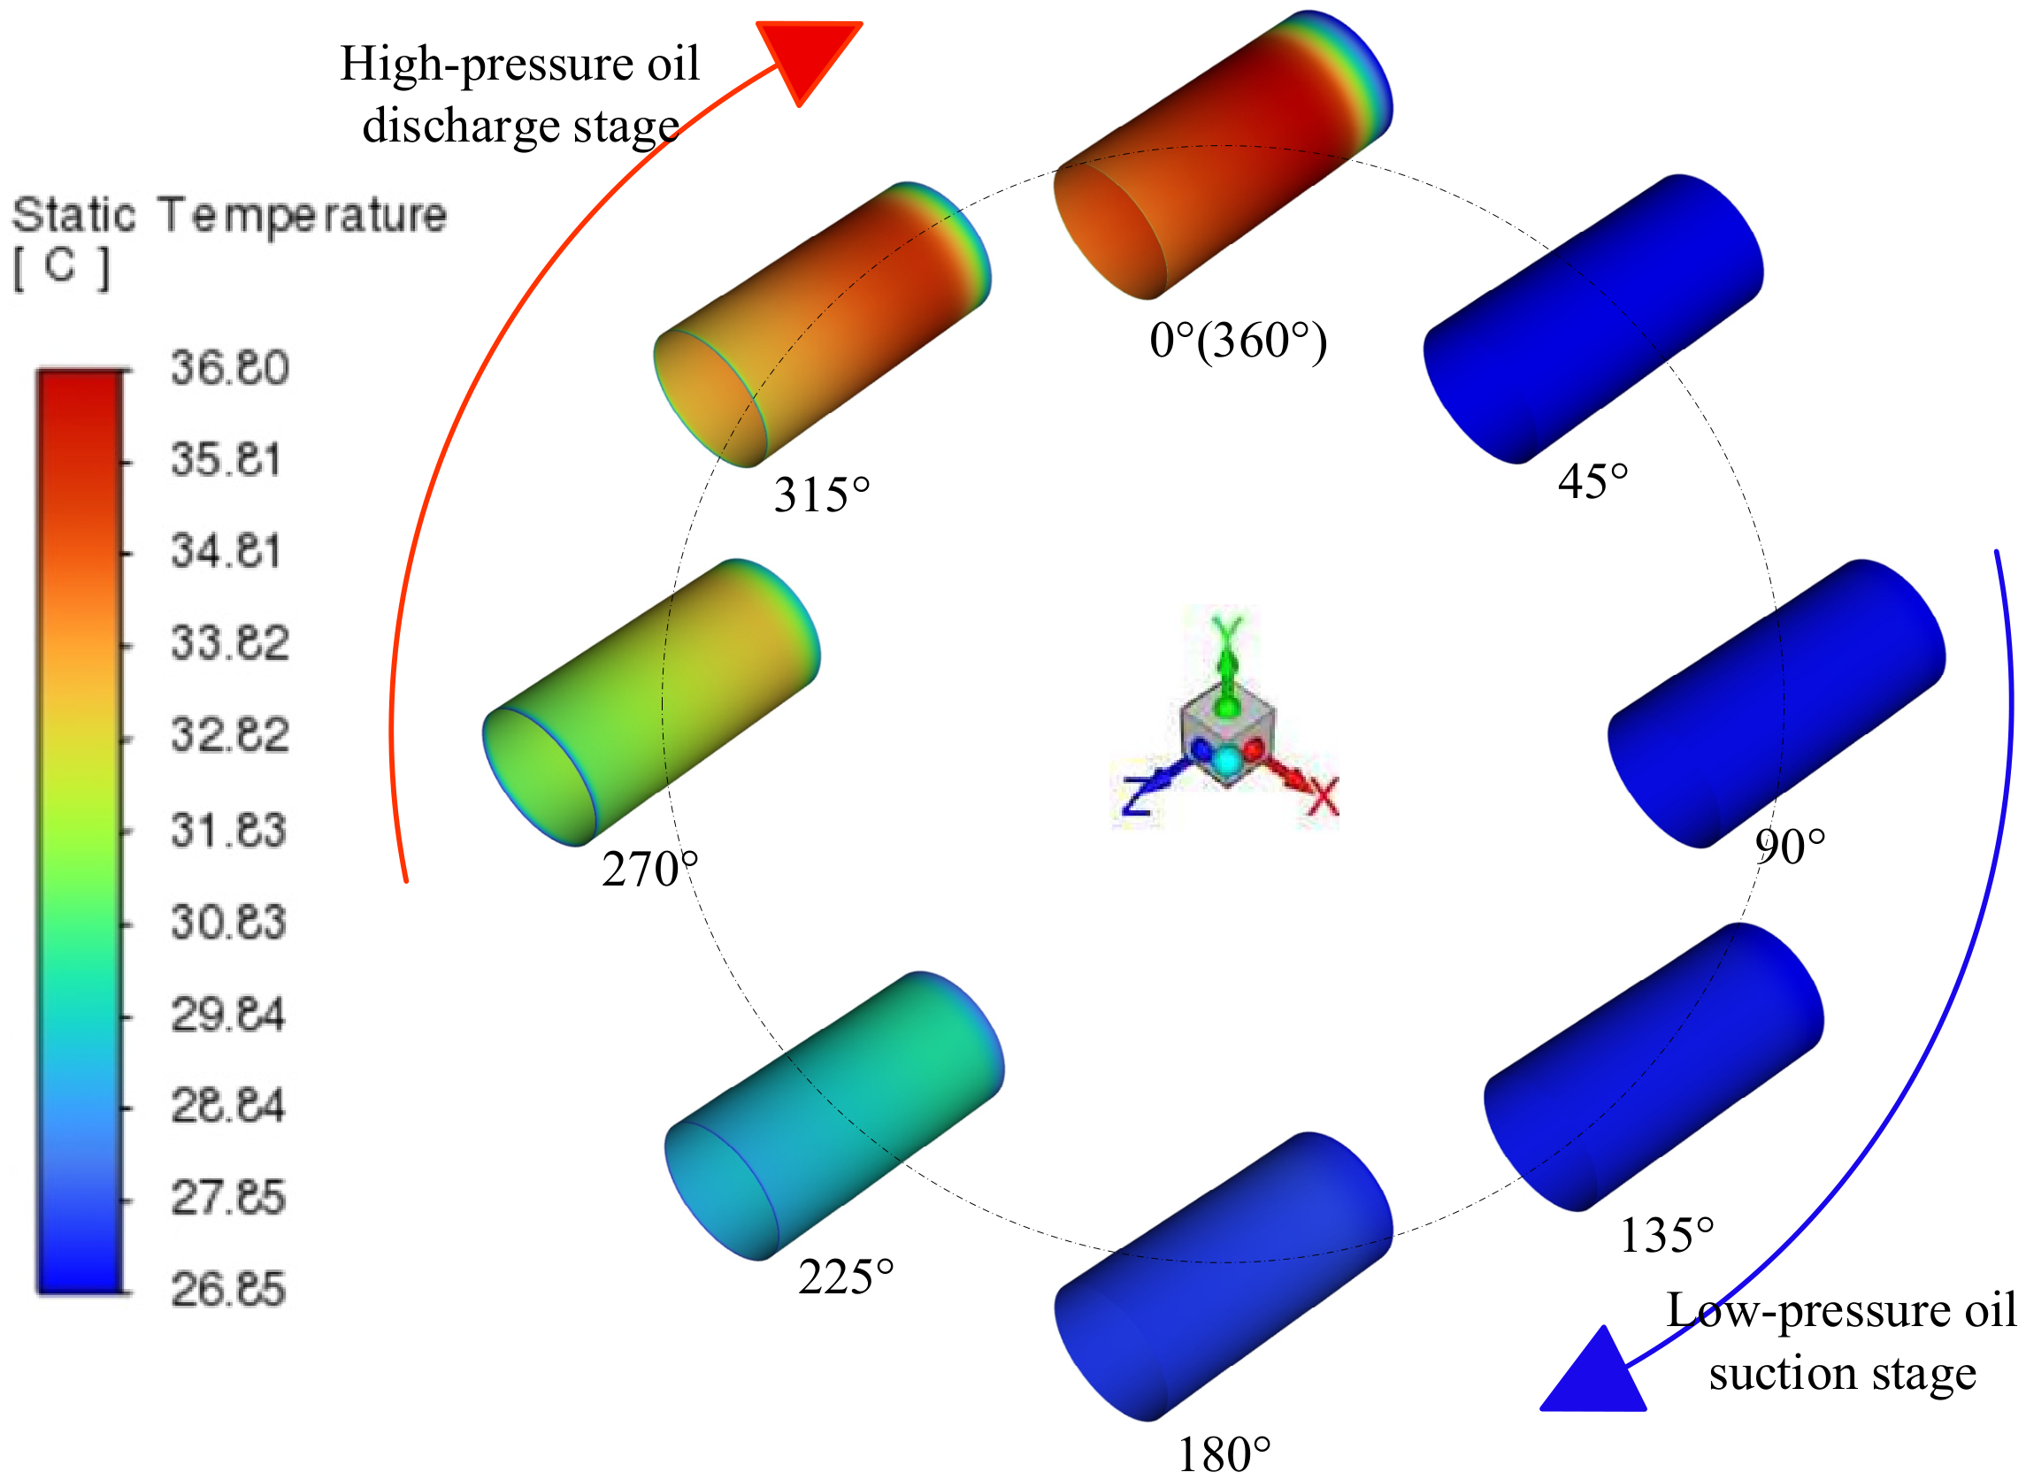
Following the preceding analysis of the isolated high-pressure delivery half-cycle, full-cycle transient simulations including both suction and delivery phases were conducted to capture the periodic oil-film response induced by valve-plate commutation and piston reciprocation. The stable periodic piston-chamber pressure obtained from AMESim was imposed at the inlet through the Fluent UDF, while the outlet pressure was maintained at 0.2 MPa. At 1500 r/min, one operating cycle corresponds to 0.04 s. Three consecutive cycles were simulated over 0.12 s using a time step of 4 × 10⁻⁵ s. For visualization of the initially cold oil-film response, the temperature field at 30 MPa was extracted every 45° during the first operating cycle, as shown in Figure 13.
Figure 13.
Transient evolution of the oil-film temperature field over the first complete operating cycle at 30 MPa and 1500 r/min.
As shown in Figure 13, 0° and 360° denote the beginning and end of one operating cycle, respectively. During the low-pressure suction stage from 0° to 180°, the piston-chamber pressure and axial pressure gradient remain low; consequently, the oil-film temperature stays close to the initial oil temperature. After the transition to the high-pressure delivery stage from 180° to 360°, the increasing chamber pressure intensifies pressure-driven flow and its interaction with the moving piston wall. The oil-film temperature therefore rises progressively, and a pronounced high-temperature region develops near 315–360°. This result confirms that the delivery stage is the dominant period governing the thermal load of the piston–cylinder interface.
To reduce the influence of the initially cold hydraulic oil and the developing flow field, the cycle-averaged leakage flow rate, peak leakage flow rate, and maximum temperature at the end of each cycle were compared over the first three operating cycles for all load-pressure conditions. The results are summarized in Table 8.
Table 8.
Cycle-averaged and peak leakage flow rates and end-of-cycle maximum oil-film temperature under different load pressures.
As indicated in Table 8, the first cycle is noticeably affected by the initially low oil temperature and the developing flow field. The higher initial viscosity increases the flow resistance and leads to relatively low leakage. As the simulation proceeds, viscous heating reduces the lubricant viscosity, causing the leakage flow rate and maximum temperature to increase. The changes between the second and third cycles become smaller at all load levels, indicating that the flow and temperature fields approach a periodic state. Therefore, the third-cycle results were adopted for the subsequent comparisons of load-dependent leakage, temperature, and structural response.
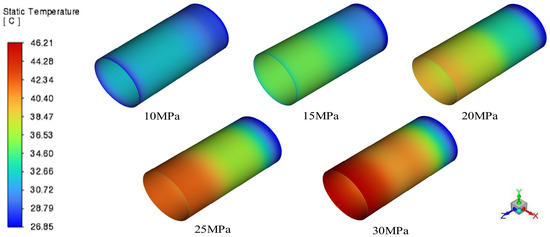
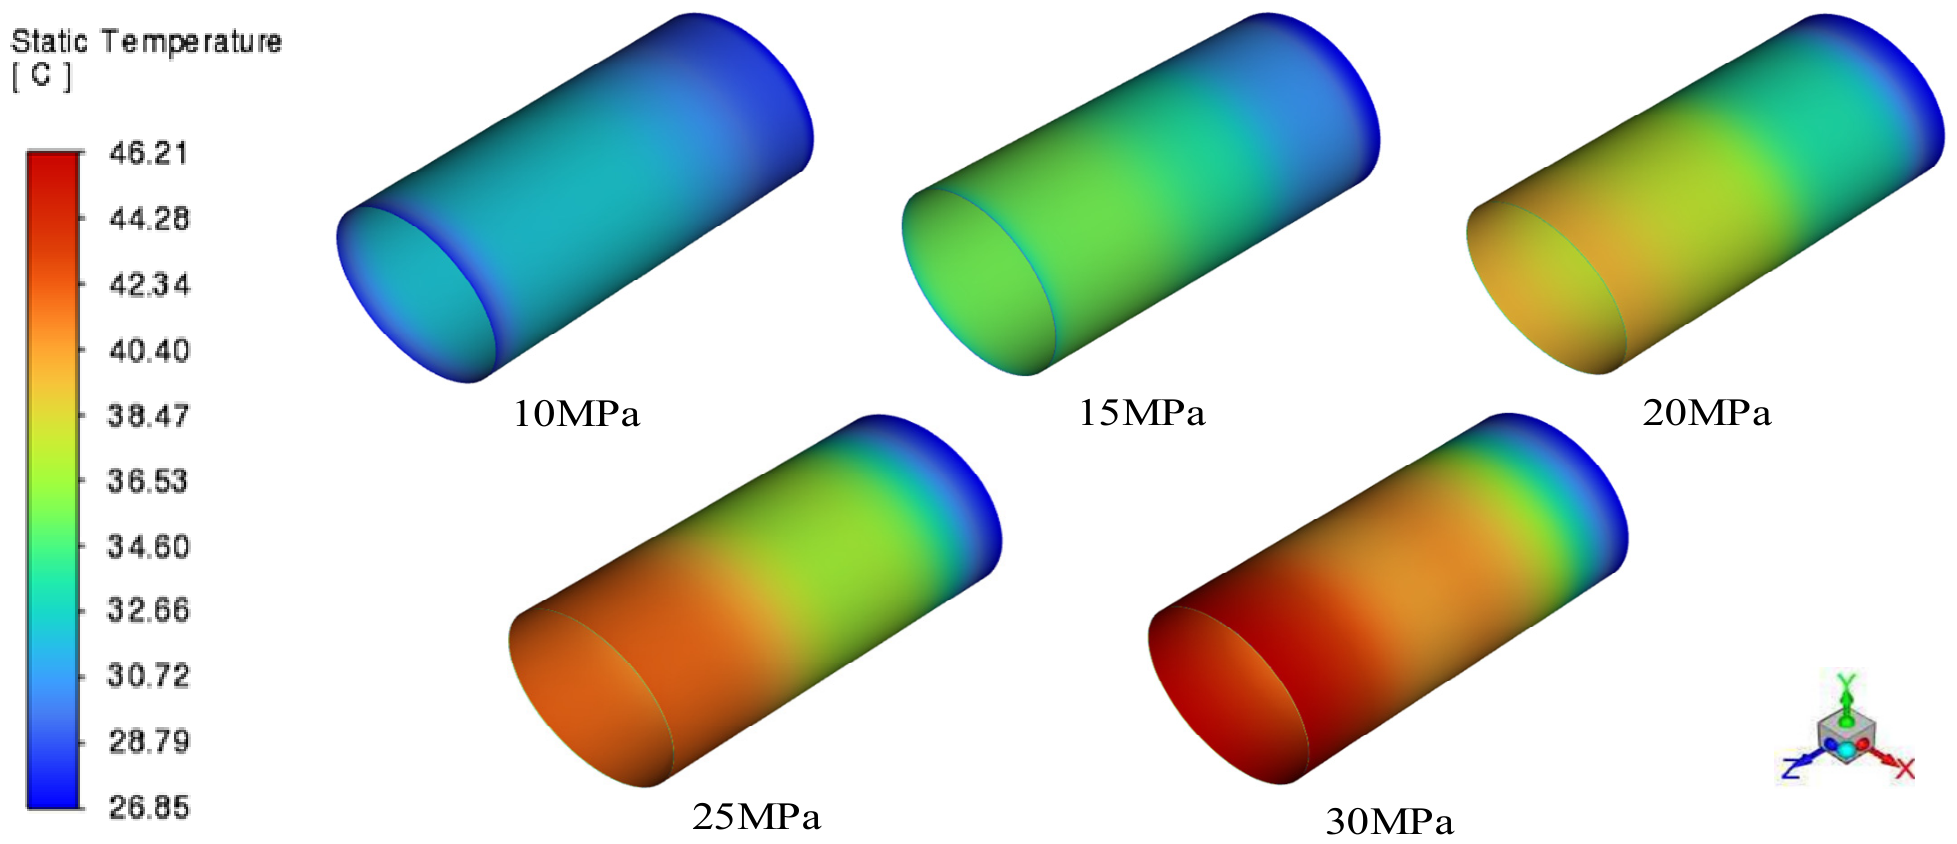
Based on the periodic-convergence assessment in Table 4, the temperature fields at the end of the third operating cycle were selected for comparison under different load pressures, as shown in Figure 13.
As shown in Figure 14, the oil film remains at a relatively low temperature under the 10 MPa condition, with no pronounced high-temperature region. As the load pressure increases, the high-temperature region expands progressively from the central region toward the inlet-side region. At 25 and 30 MPa, a distinct high-temperature zone develops in the middle and inlet-adjacent portions of the oil film, with the most pronounced temperature concentration occurring at 30 MPa. This spatial evolution is consistent with the end-of-cycle maximum temperatures reported in Table 6 and confirms the substantial increase in thermal loading under high-pressure conditions.
Figure 14.
Oil-film temperature contours at the end of the third operating cycle under different load pressures.
4.2. Effect of Rotational Speed on Flow Renewal and Wall Shear
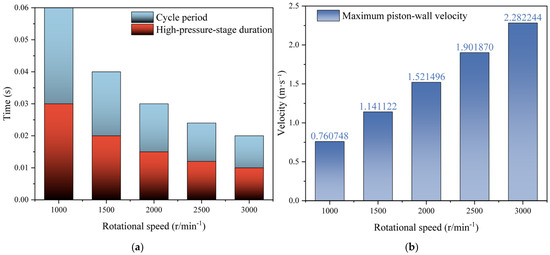
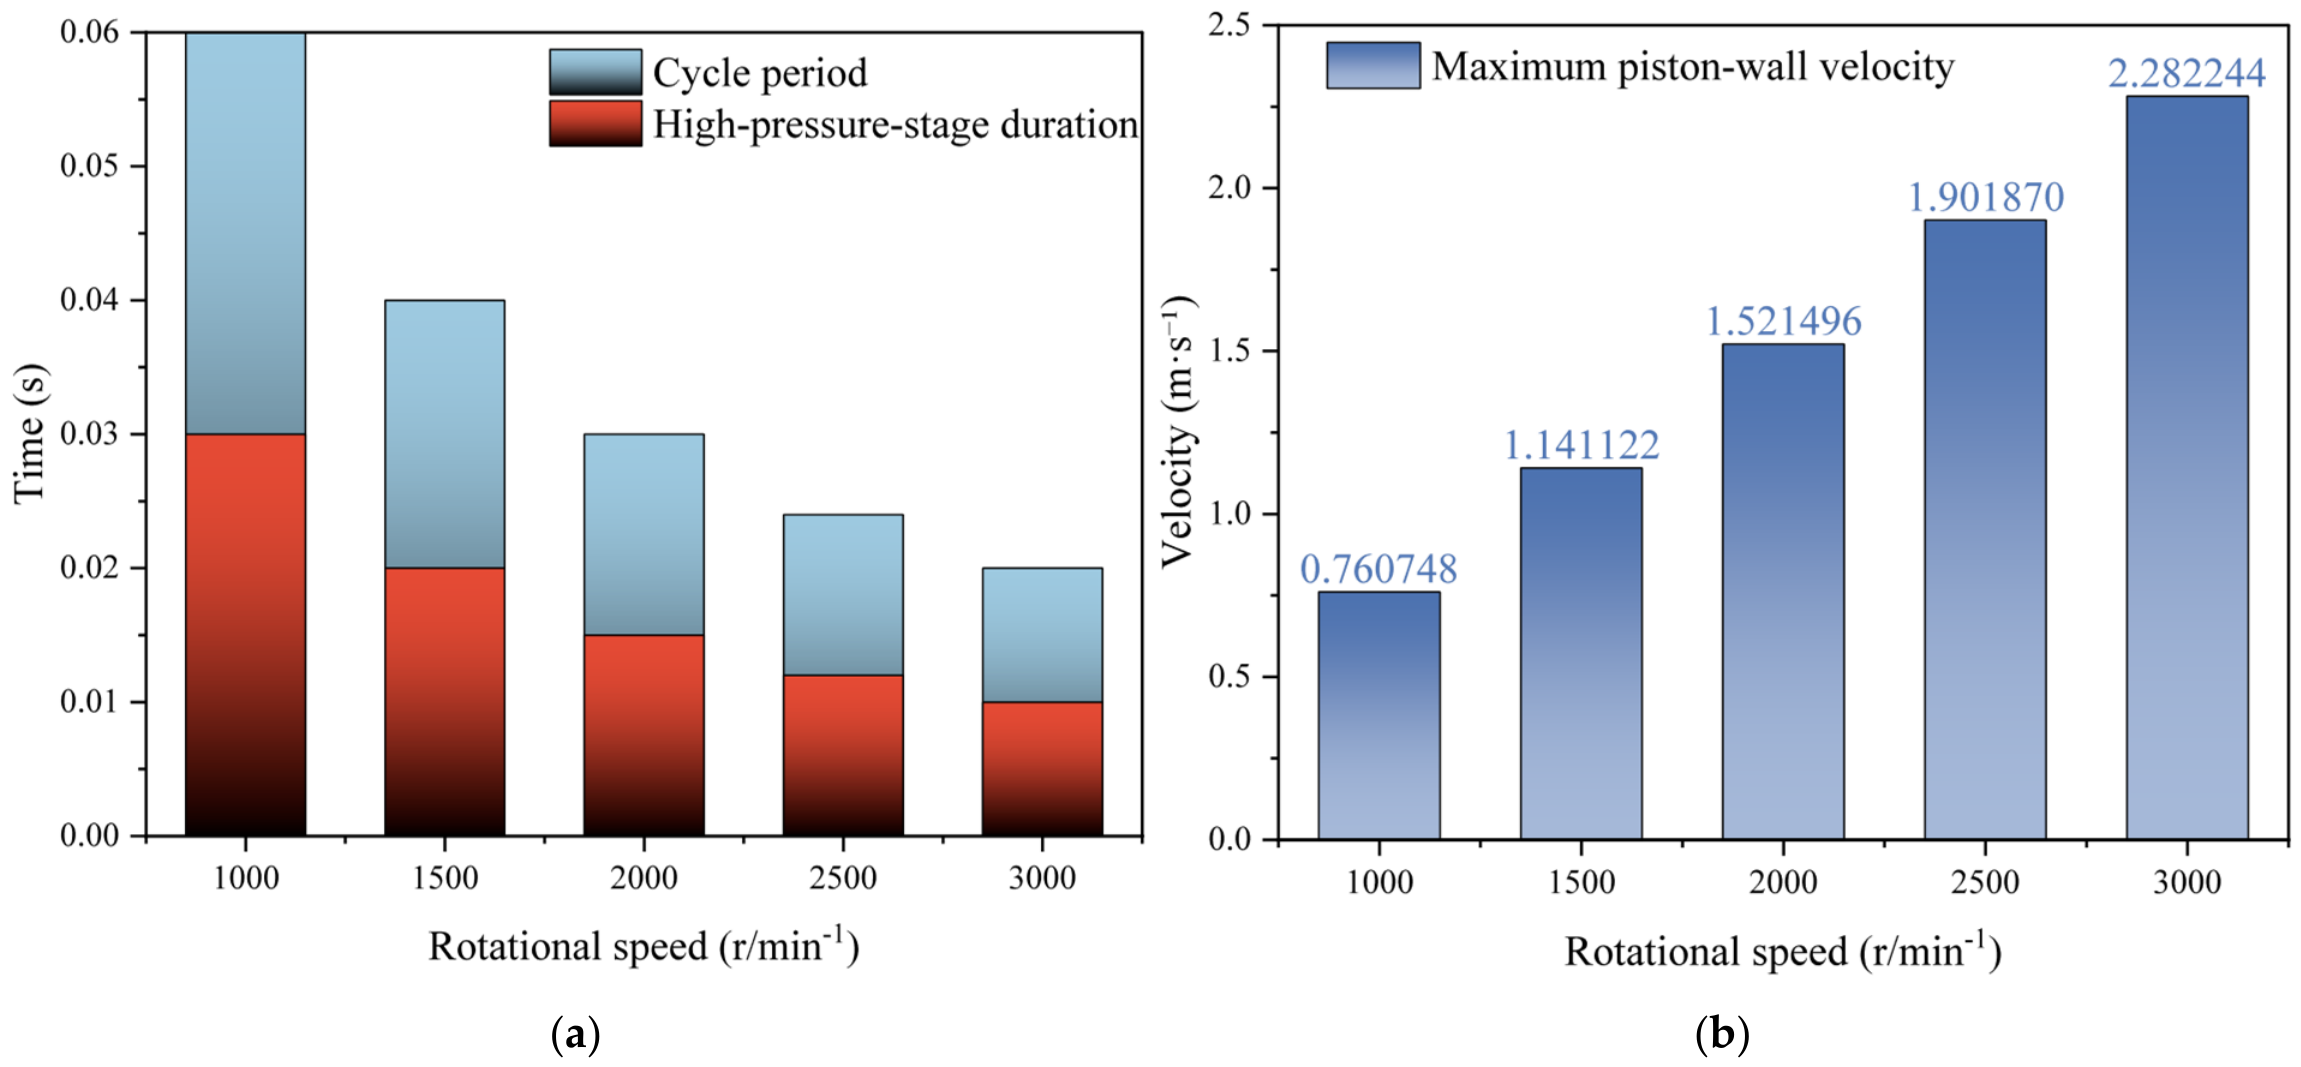
At a load pressure of 30 MPa, transient thermohydrodynamic simulations were conducted at rotational speeds of 1000, 1500, 2000, 2500, and 3000 r/min. Because the period duration differs with rotational speed, the total simulation time was fixed at 0.12 s for all cases to provide a common physical-time basis for comparison of the thermal response. According to Equation (3), the piston-wall velocity varies periodically with the cylinder-block rotation angle and reaches its maximum magnitude at 90° and 270°. Figure 15 compares the high-pressure-stage duration and the maximum piston-wall velocity at different rotational speeds.
Figure 15.
(a) High-pressure-stage duration and (b) maximum piston-wall velocity.
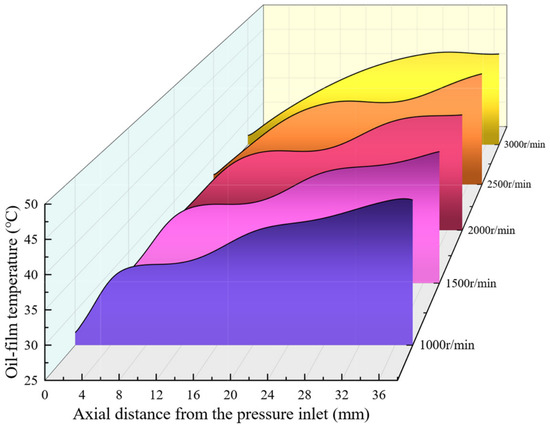
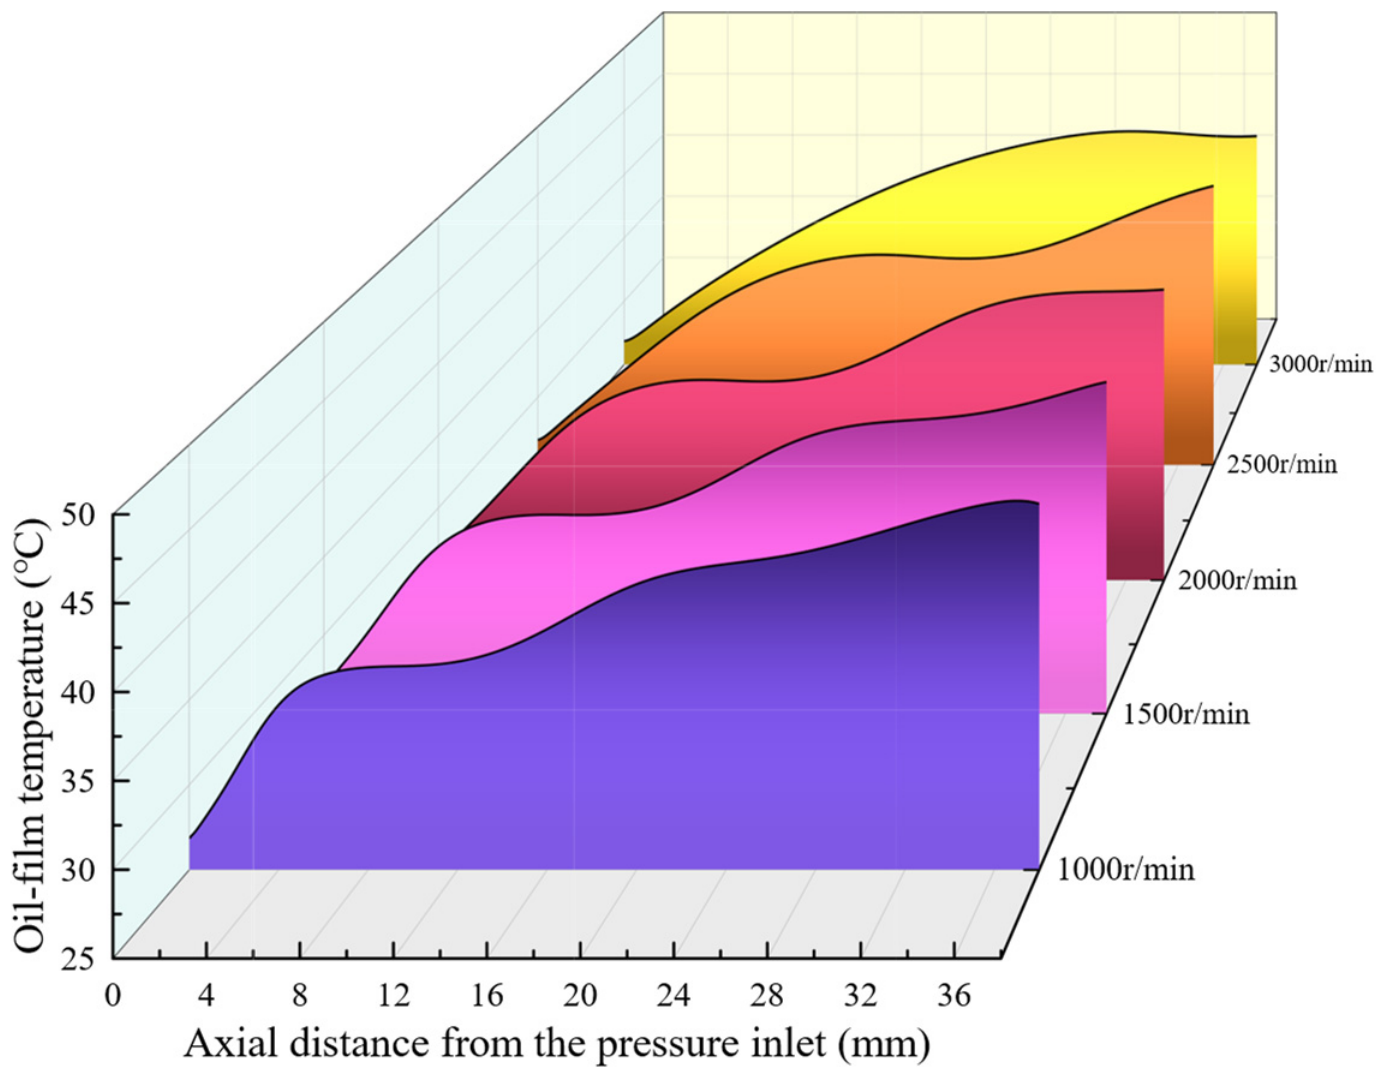
To compare the thermal response at different rotational speeds, the axial oil-film temperature distributions at t = 0.12 s were extracted, as shown in Figure 16.
Figure 16.
Axial oil-film temperature distributions at different rotational speeds under a 30 MPa load.
As shown in Figure 16, the oil-film temperature increases rapidly from the pressure inlet and then rises more gradually toward the downstream region, indicating the accumulation of viscous dissipation along the leakage path. The maximum temperature increases from approximately 43 °C at 1000 r/min to 45–47 °C at 1500–3000 r/min. Although a higher rotational speed increases piston-wall shear, it also shortens the high-pressure-stage duration and promotes hydraulic-oil renewal during the suction stage. Consequently, the temperature differences among the 1500–3000 r/min cases remain limited.
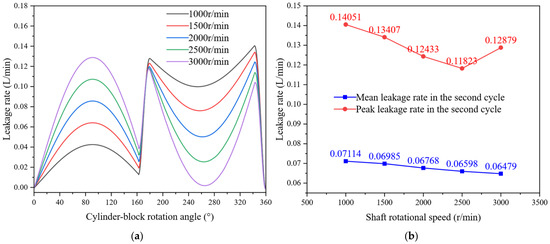
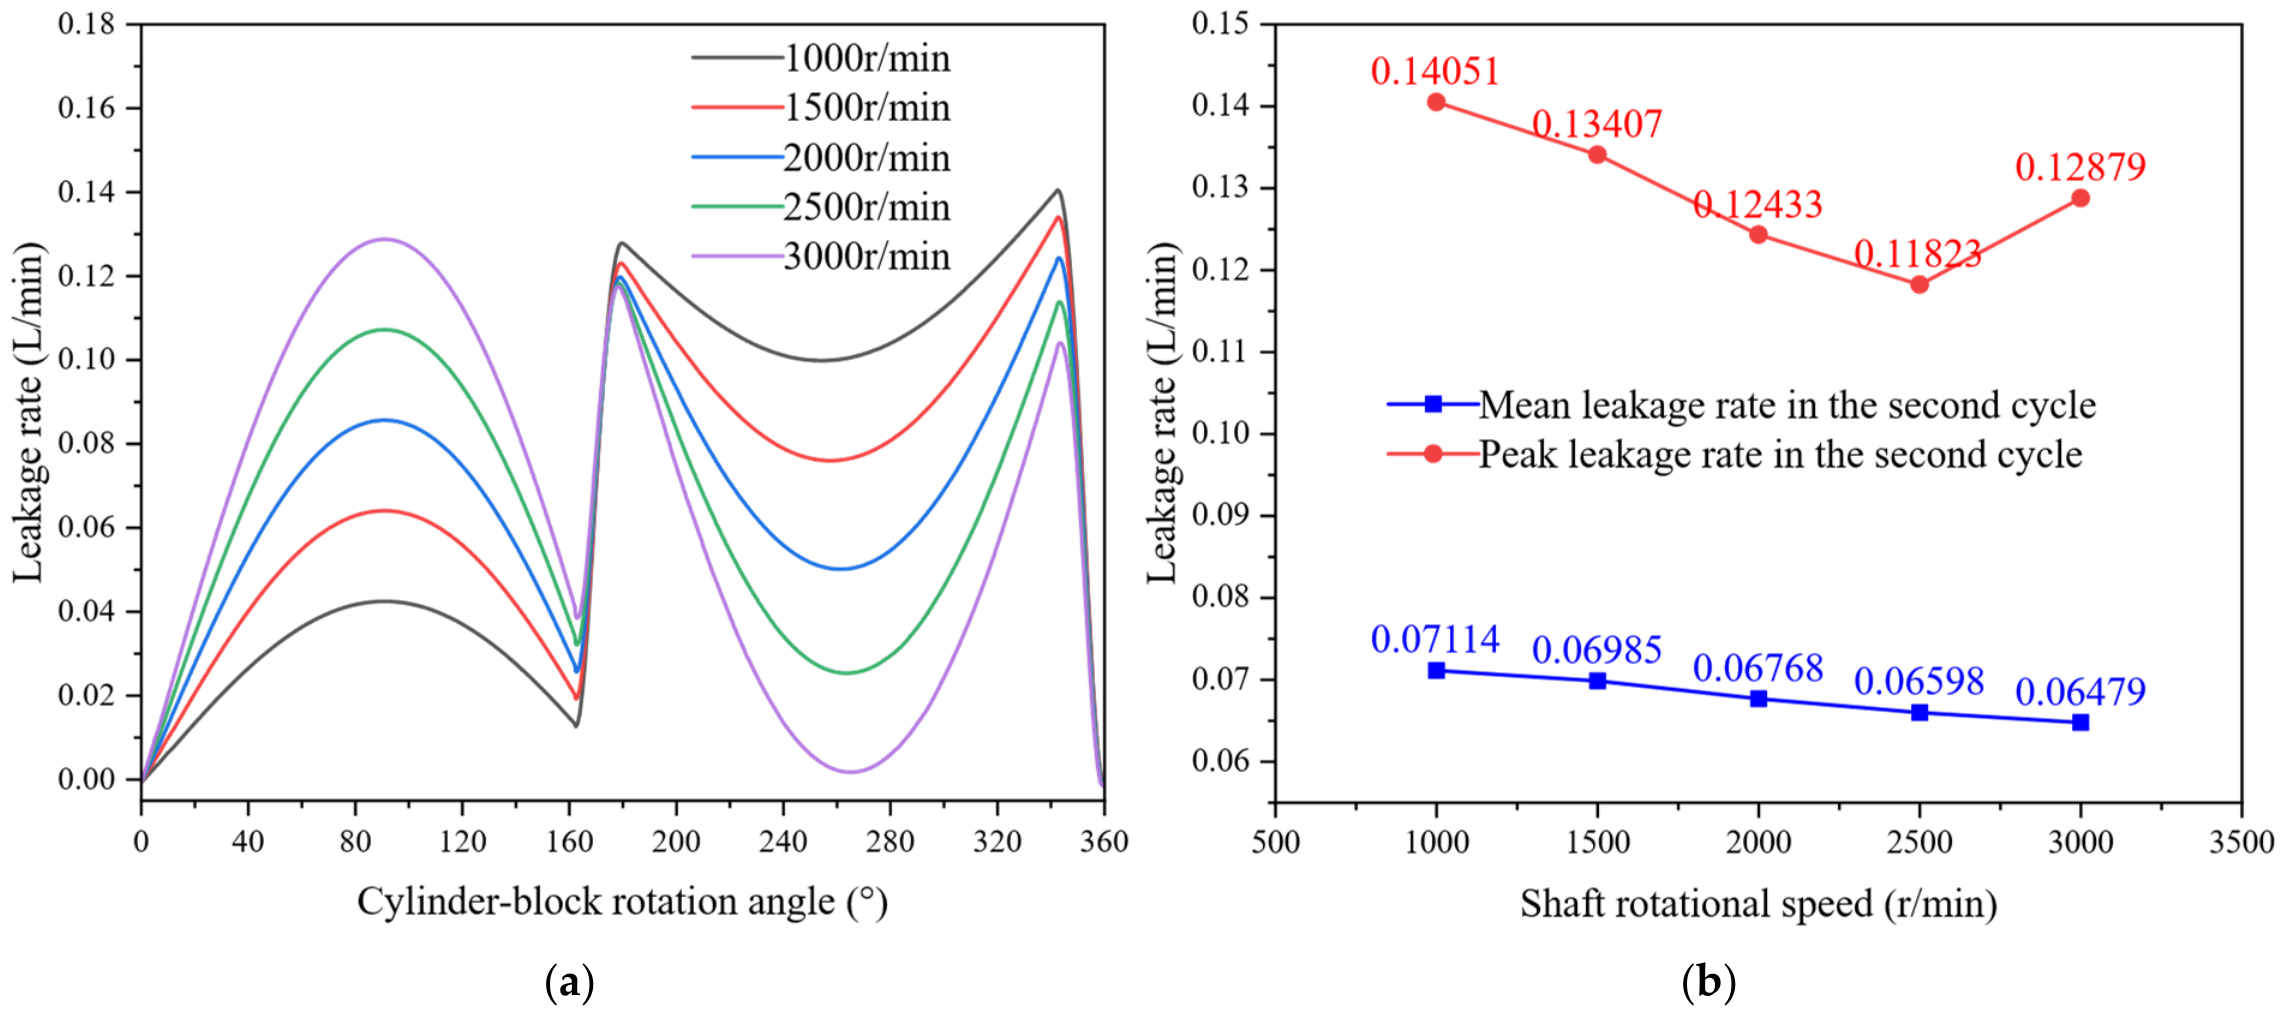
After evaluating the temperature response, the leakage characteristics were compared to quantify the effect of rotational speed on the sealing performance of the piston–cylinder interface. Because the operating period differs among the rotational-speed cases, the second complete operating cycle was selected to reduce the influence of the initially cold hydraulic oil and flow-field development. The leakage-flow histories and the corresponding cycle-averaged and peak leakage flow rates are shown in Figure 17.
Figure 17.
(a) Leakage-flow histories over one operating cycle and (b) cycle-averaged and peak leakage flow rates.
As shown in Figure 17a, the leakage flow rate varies periodically with the cylinder-block rotation angle. During the low-pressure suction stage from 0° to 180°, the pressure difference across the oil film is small, and the leakage is mainly governed by the wall-driven flow induced by piston reciprocation. During the high-pressure delivery stage from 180° to 360°, pressure-driven flow becomes dominant and interacts with the wall-driven component, resulting in an asymmetric leakage history. Figure 17b shows that the cycle-averaged leakage flow rate decreases from 0.07114 L/min at 1000 r/min to 0.06479 L/min at 3000 r/min, corresponding to a reduction of 8.93%. The peak leakage flow rate decreases from 0.14051 L/min at 1000 r/min to 0.11823 L/min at 2500 r/min, but rises to 0.12879 L/min at 3000 r/min. This trend indicates that a higher rotational speed shortens the high-pressure duration and promotes hydraulic-oil renewal, while also strengthening wall-driven flow and pressure-switching transients.
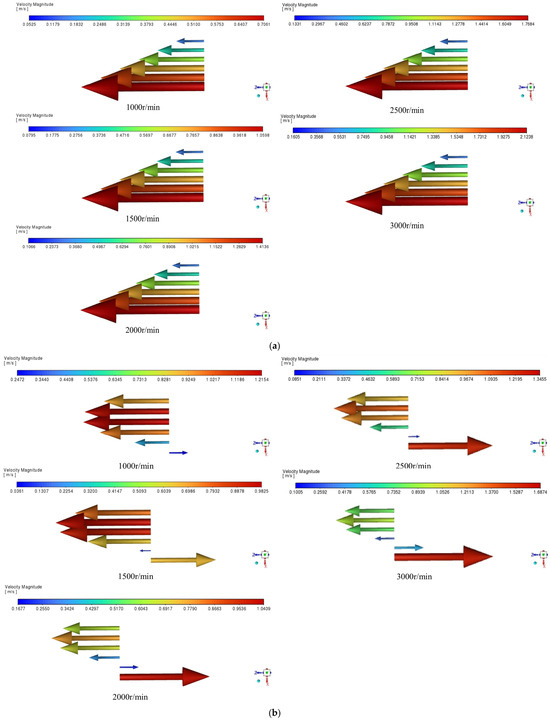
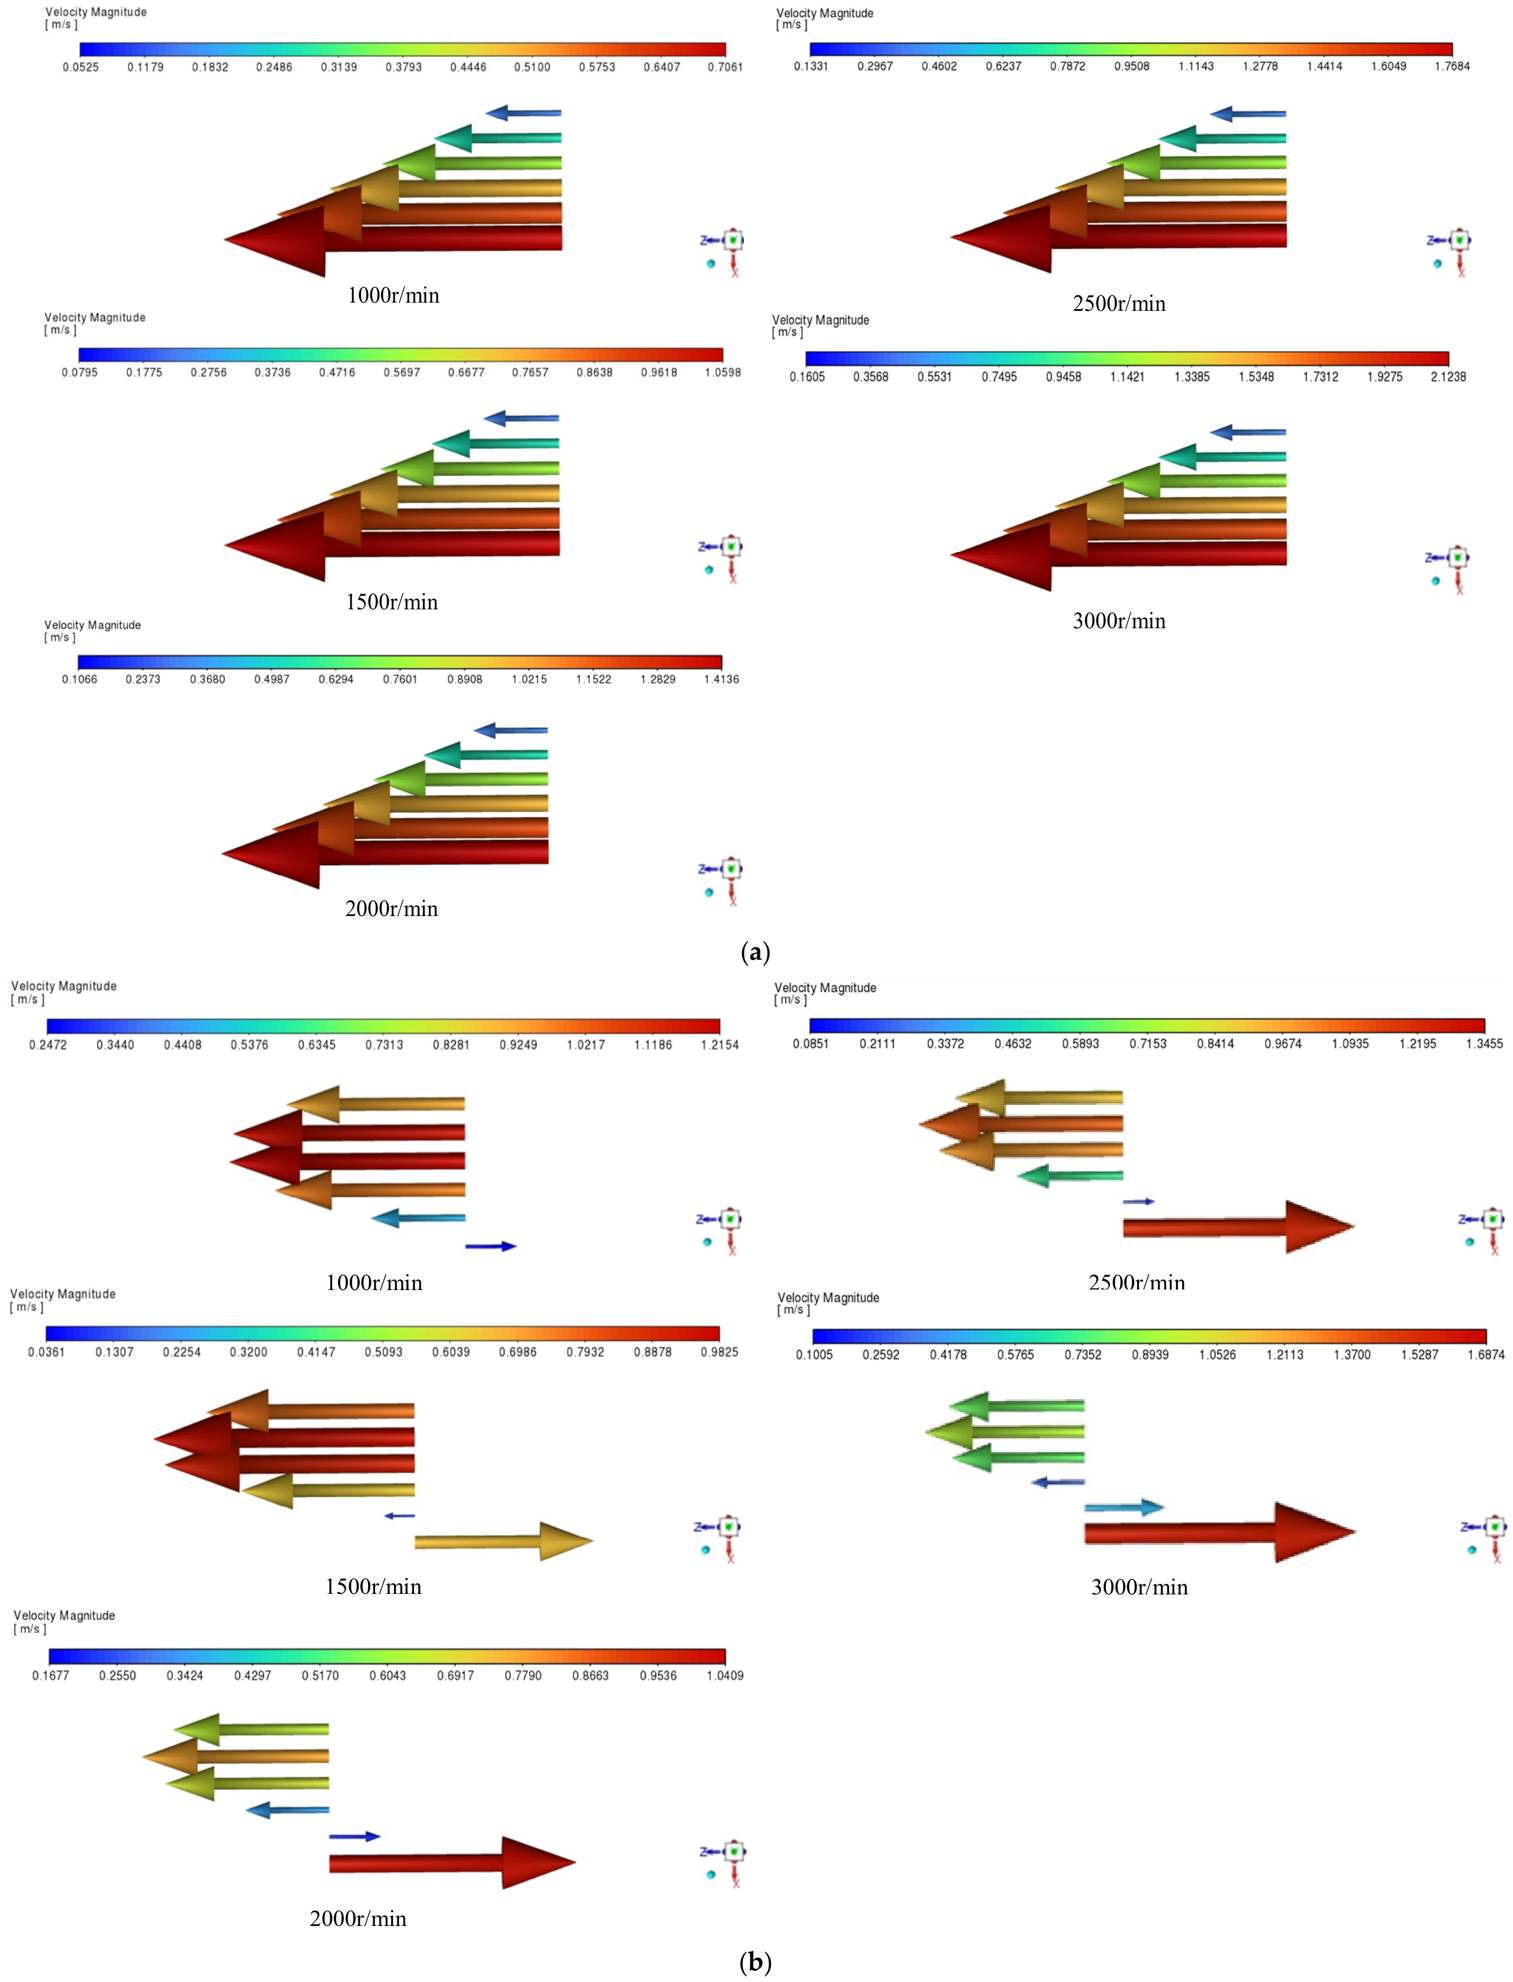
To clarify the flow mechanism underlying the leakage response, velocity vectors were examined at 90° and 270°, where the piston-wall velocity reaches its maximum magnitude. The 90° position corresponds to the low-pressure suction stage and mainly reflects wall-driven flow, whereas the 270° position corresponds to the high-pressure delivery stage and reflects the combined effects of pressure-driven and wall-driven flow. The velocity-vector fields at different rotational speeds are shown in Figure 18.
Figure 18.
(a) The 90° low-pressure suction stage and (b) 270° high-pressure delivery stage.
As shown in Figure 18a, the velocity field during the low-pressure suction stage is dominated by Couette flow. The velocity decreases from the moving piston-side wall to the stationary cylinder-side wall, and its magnitude increases with rotational speed. In contrast, Figure 18b shows that the high-pressure delivery stage contains both pressure-driven Poiseuille flow and wall-driven Couette flow. The relative magnitude and direction of these two components change with rotational speed, resulting in an asymmetric velocity field rather than a simple linear distribution. Therefore, the local hydraulic-oil flow during delivery is governed jointly by the pressure gradient and piston-wall motion.
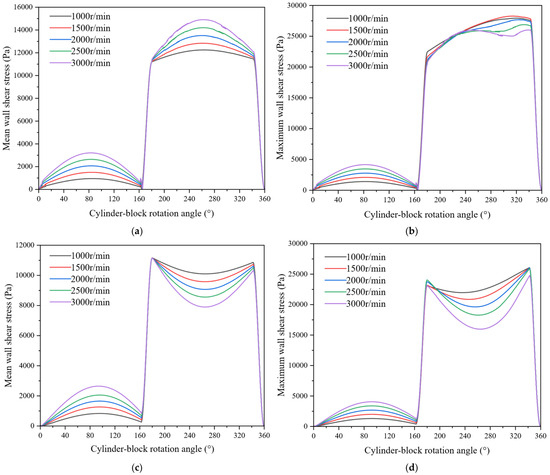
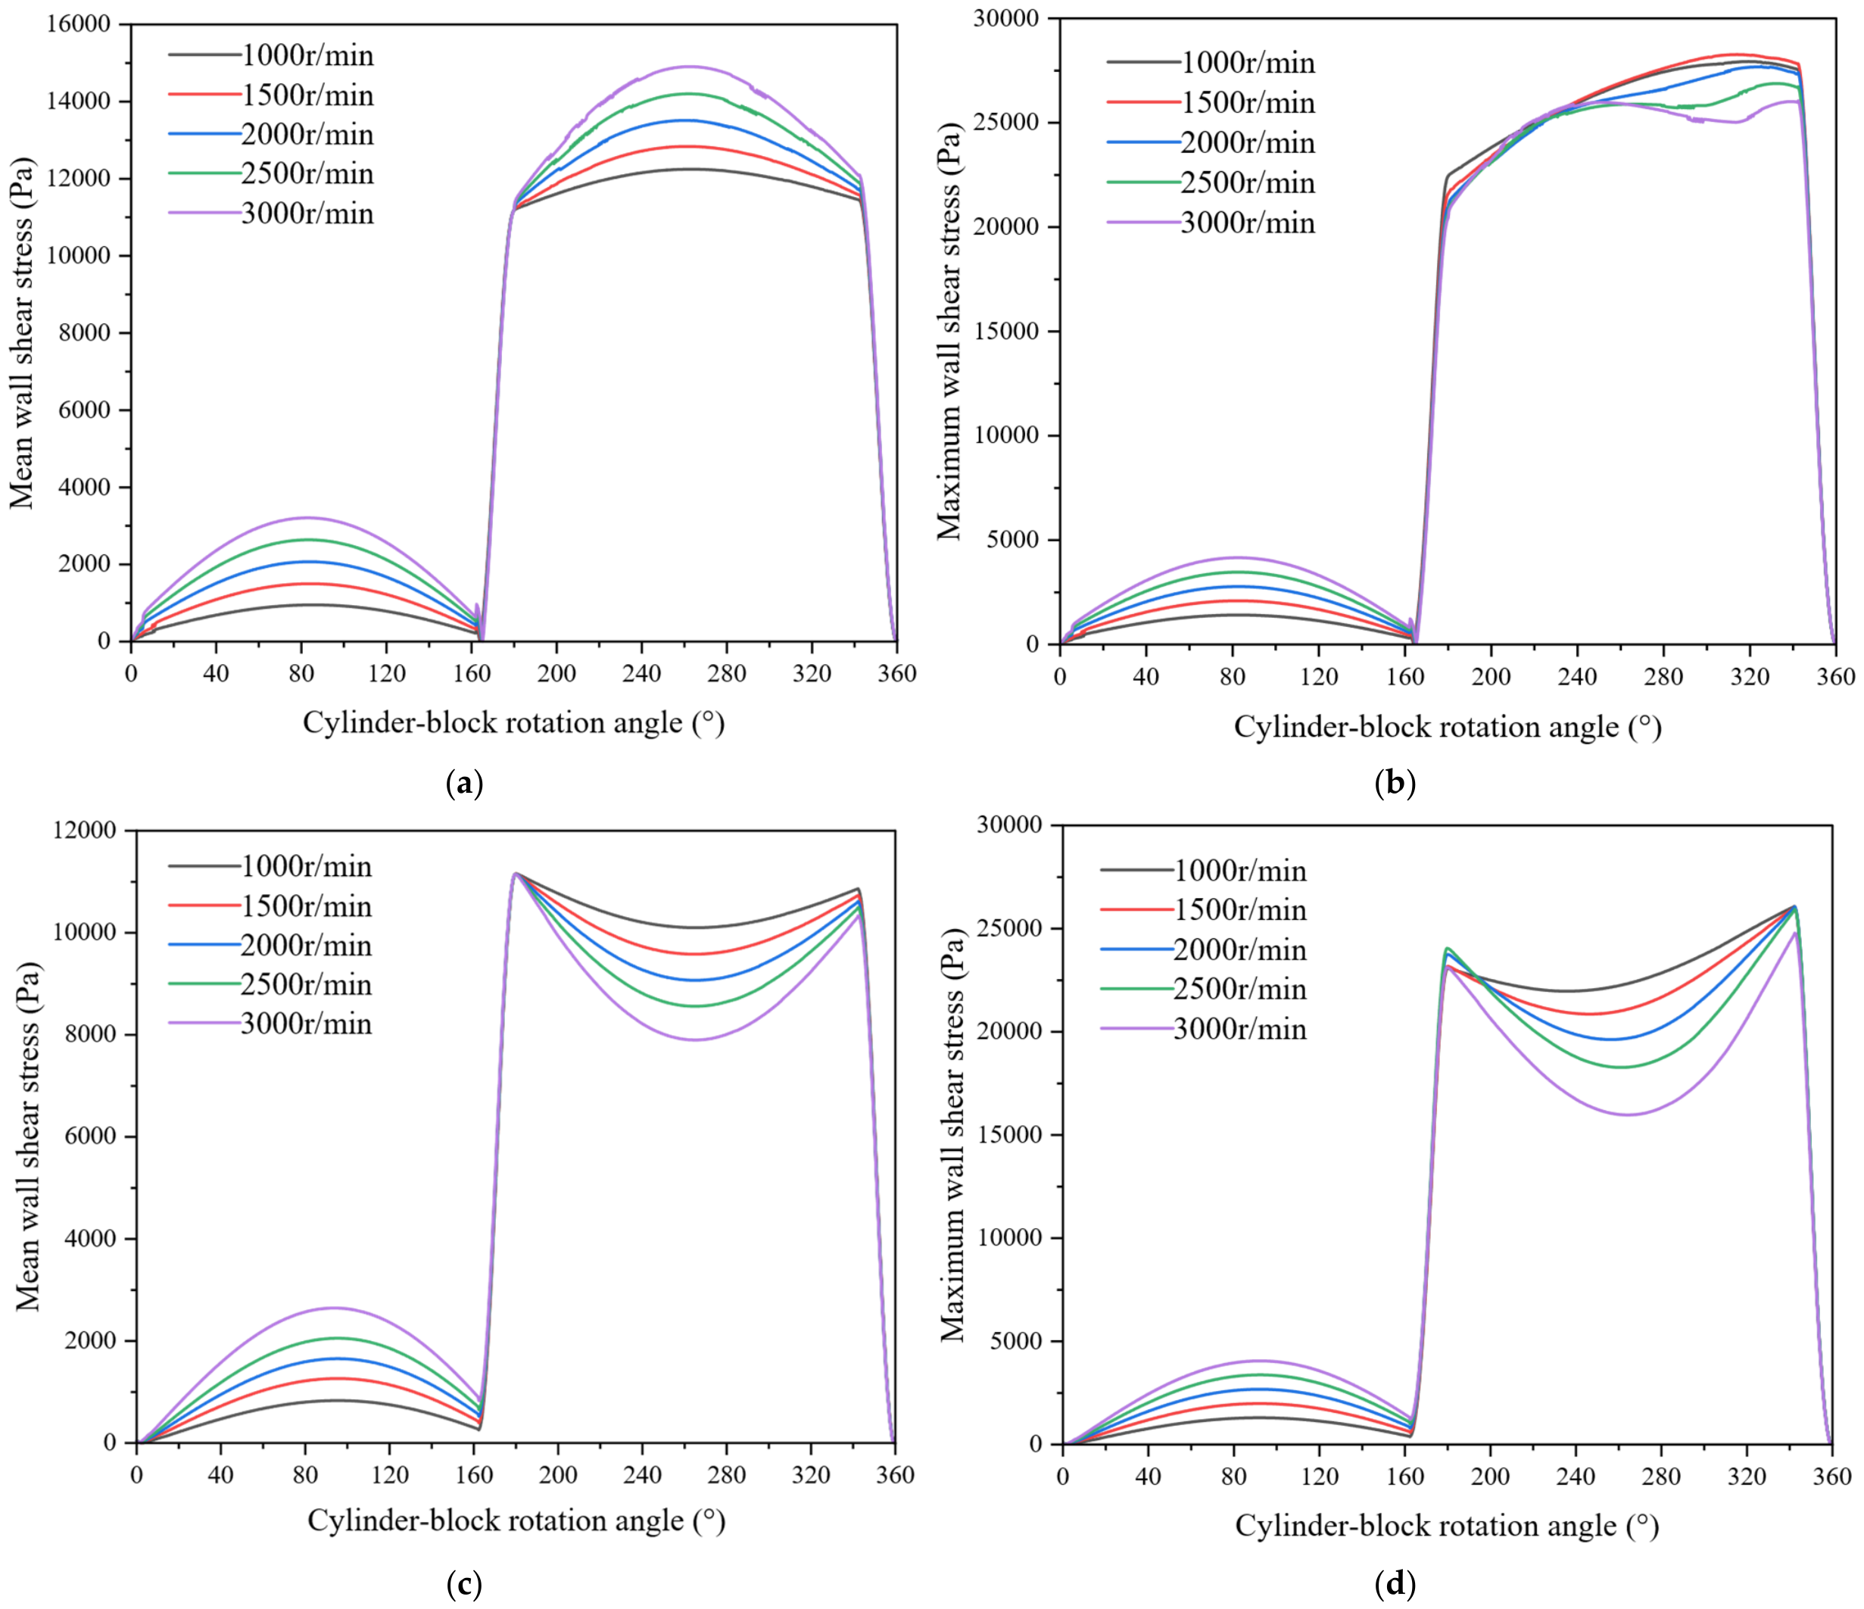
The stage-dependent velocity fields shown in Figure 18 indicate that the relative contributions of pressure-driven and wall-driven flow differ between suction and delivery. To quantify the resulting frictional response, the mean and maximum wall shear stresses on the piston-side and cylinder-side surfaces were evaluated over one operating cycle at different rotational speeds, as shown in Figure 19.
Figure 19.
(a) Mean shear stress on the piston-side wall; (b) maximum shear stress on the piston-side wall; (c) mean shear stress on the cylinder-side wall; (d) maximum shear stress on the cylinder-side wall.
As shown in Figure 19, the wall shear stress exhibits distinct responses during the suction and delivery stages. During the low-pressure suction stage from 0° to 180°, the small axial pressure difference causes wall shear to be dominated by piston-wall motion. Consequently, both the mean and maximum shear stresses increase monotonically with rotational speed. On the stationary cylinder-side wall, the mean shear stress increases from approximately 0.83 kPa at 1000 r/min to 2.64 kPa at 3000 r/min, while the maximum value increases from 1.30 to 4.05 kPa.
During the high-pressure delivery stage from 180° to 360°, pressure-driven flow becomes substantial and interacts with the wall-driven component. The cylinder-side mean and maximum shear stresses decrease from approximately 10.10 and 22.50 kPa at 1000 r/min to 7.91 and 16.01 kPa at 3000 r/min, respectively. In contrast, the peak mean shear stress on the moving piston-side wall increases from 12.24 to 14.46 kPa. These opposing trends demonstrate that increasing rotational speed primarily intensifies near-wall shear on the moving piston surface, whereas the cylinder-side shear response remains strongly governed by the pressure-driven flow field.
4.3. Effect of Non-Concentric Postures on Oil-Film Load-Carrying Capacity, Thermal Response, and Leakage
As discussed in the Introduction, this operating regime is more prone to non-concentric posture development. Accordingly, 500 r/min and 30 MPa were selected as the representative case. The non-concentric postures were established smoothly during the low-pressure suction stage and then held during the subsequent high-pressure delivery stage, allowing a direct comparison of posture-induced variations in oil-film pressure, temperature, leakage, and load-carrying capacity.
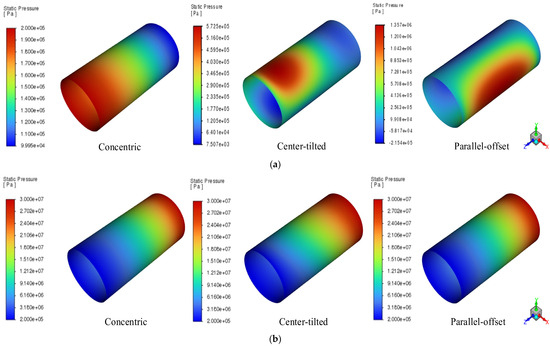
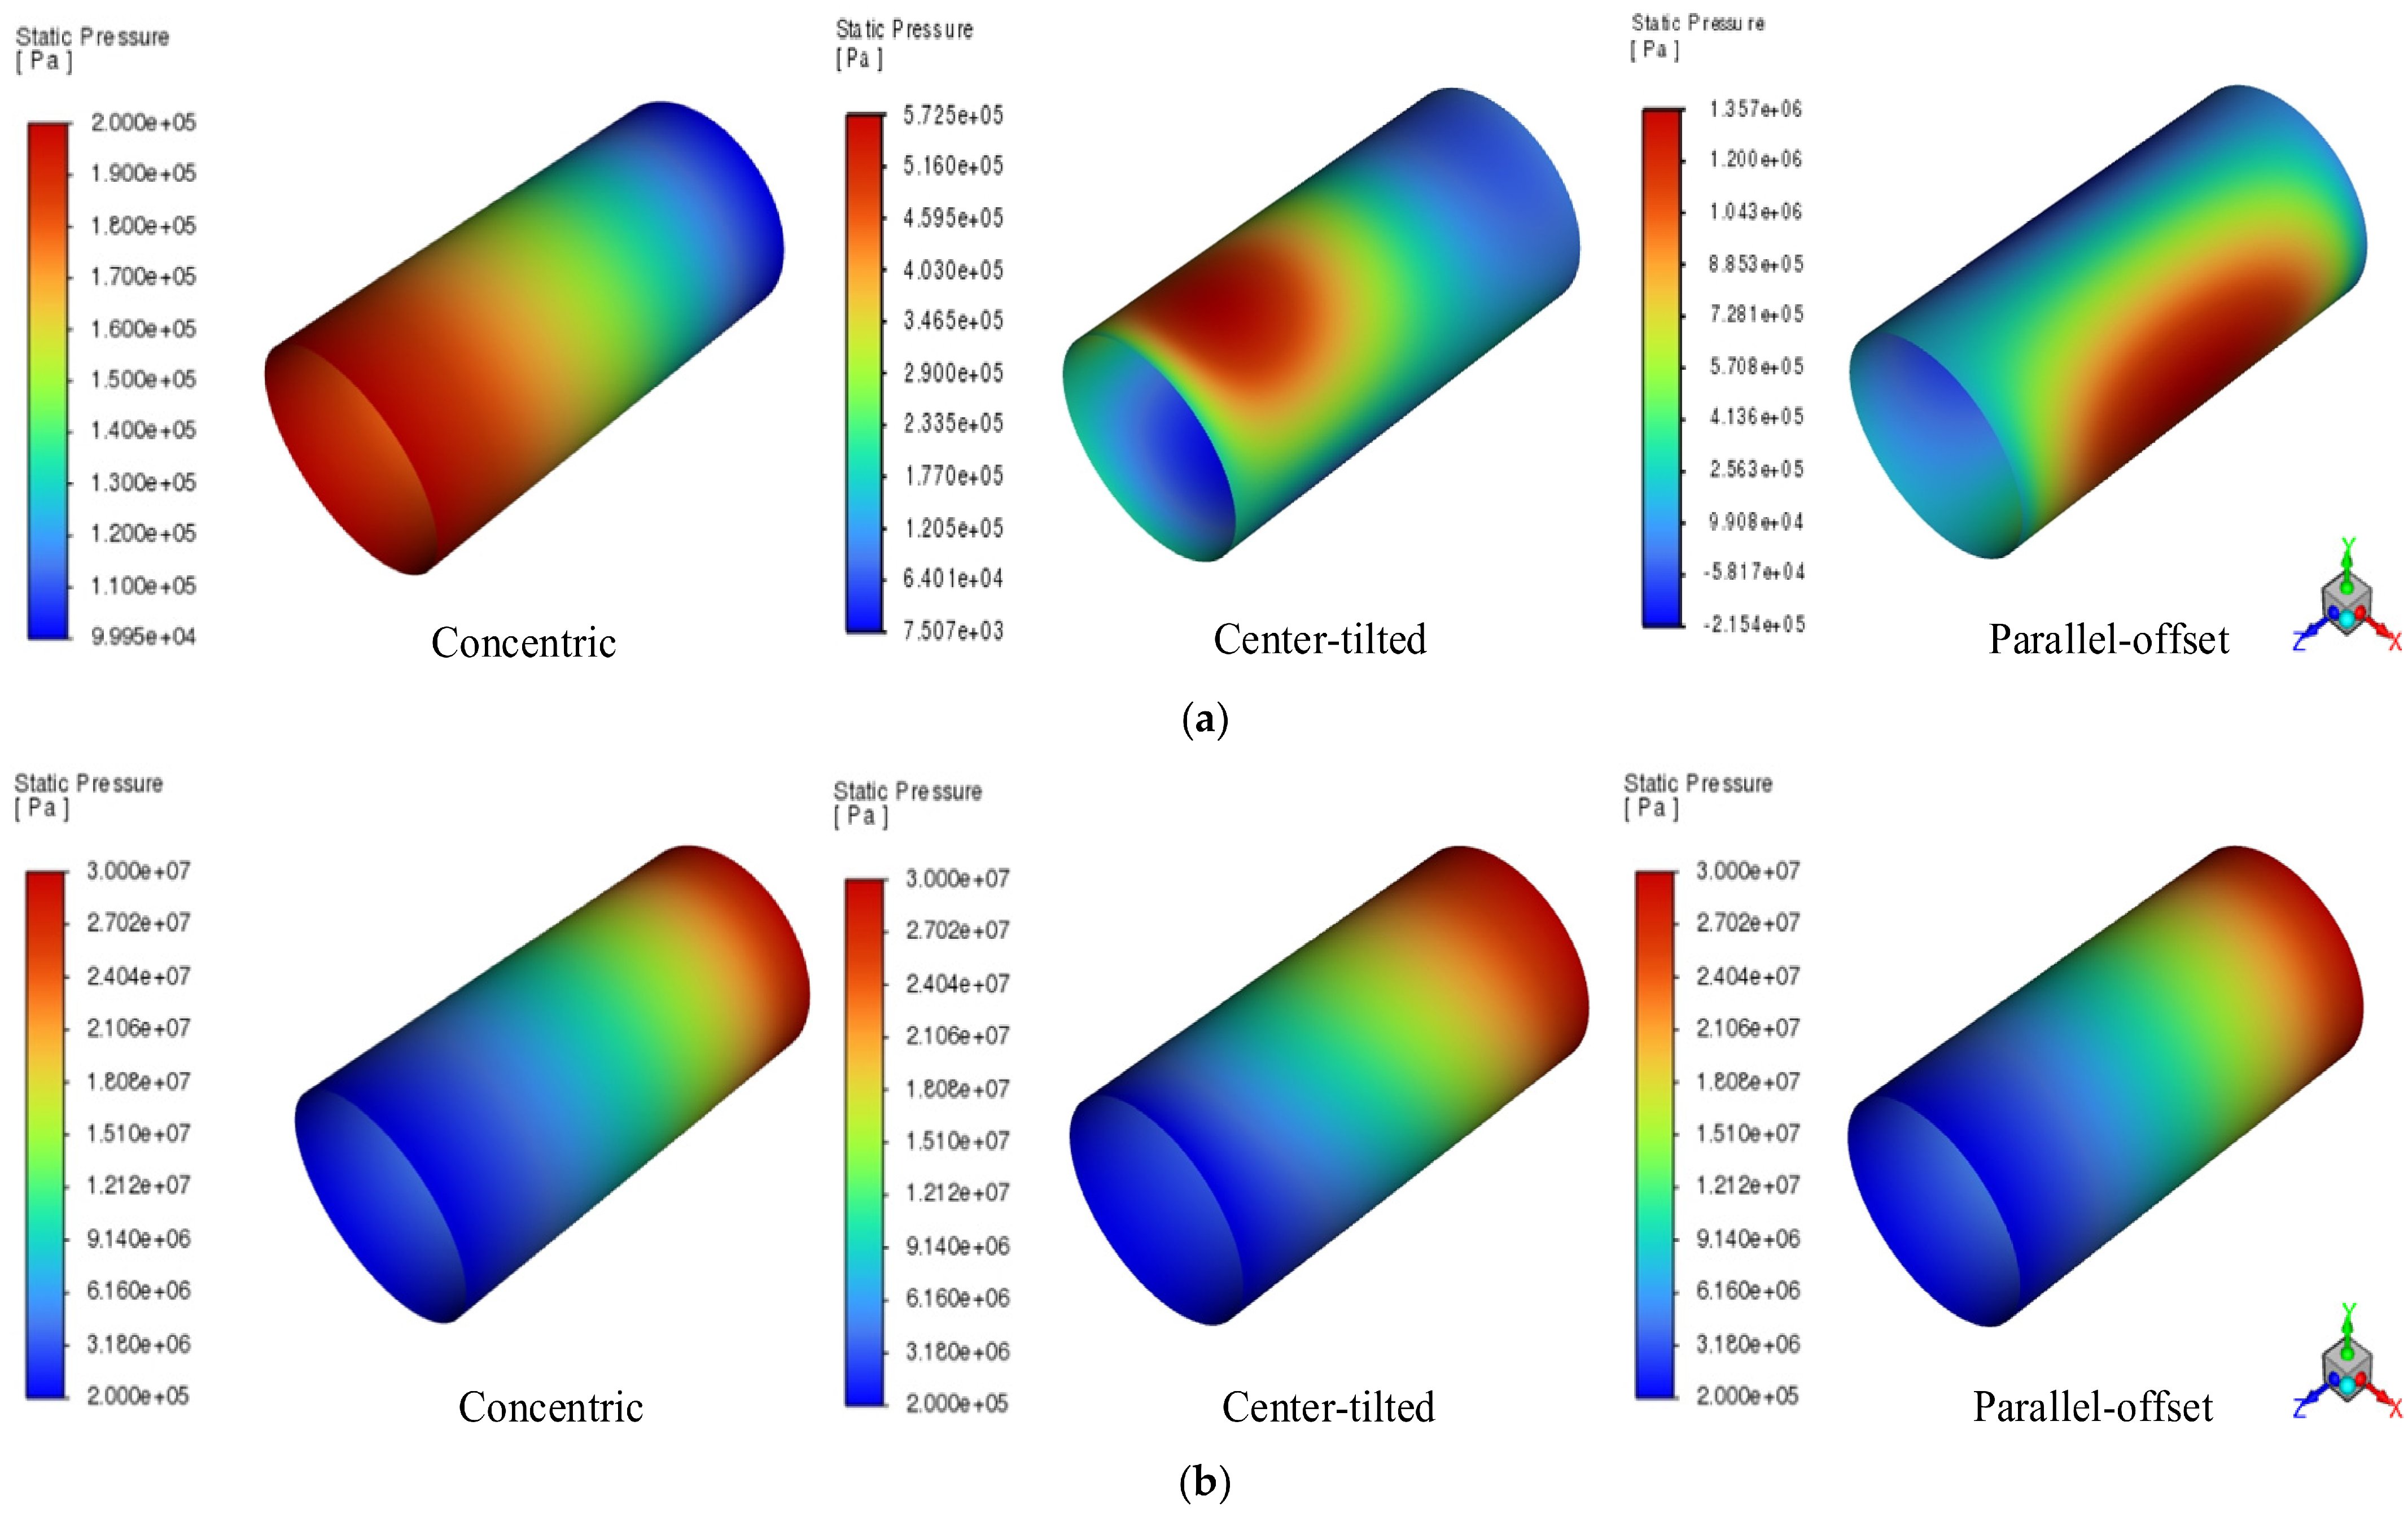
To evaluate the posture-induced redistribution of oil-film pressure, the pressure fields at 90° during suction and 270° during delivery were extracted for the three postures, as shown in Figure 20.
Figure 20.
(a) The 90° low-pressure suction; (b) 270° high-pressure delivery.
As shown in Figure 20, the oil-film pressure distribution differs markedly among the three postures during the low-pressure suction stage at 90°. Under the concentric posture, the pressure distribution is relatively uniform and the maximum pressure is approximately 0.20 MPa. The local maximum pressure increases to 0.56 MPa for the center-tilted posture and to 1.36 MPa for the parallel-offset posture, indicating that non-concentricity reconstructs the local load-carrying region. The parallel-offset posture produces the strongest pressure concentration because the reduced clearance persists along the sealing length. During the high-pressure delivery stage at 270°, the maximum pressure in all three cases remains close to 30 MPa and is primarily controlled by the axial pressure difference. Nevertheless, the non-concentric postures still shift the location of the local high-pressure region and alter the radial pressure distribution.
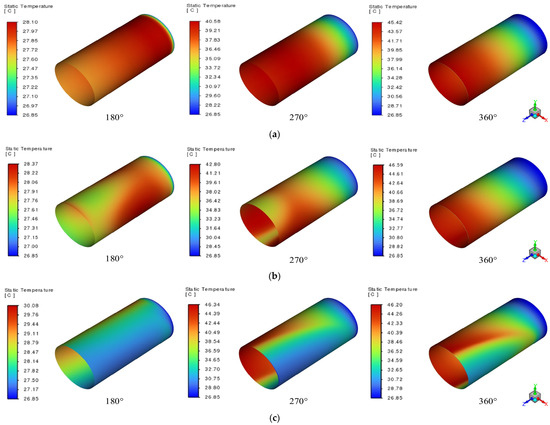
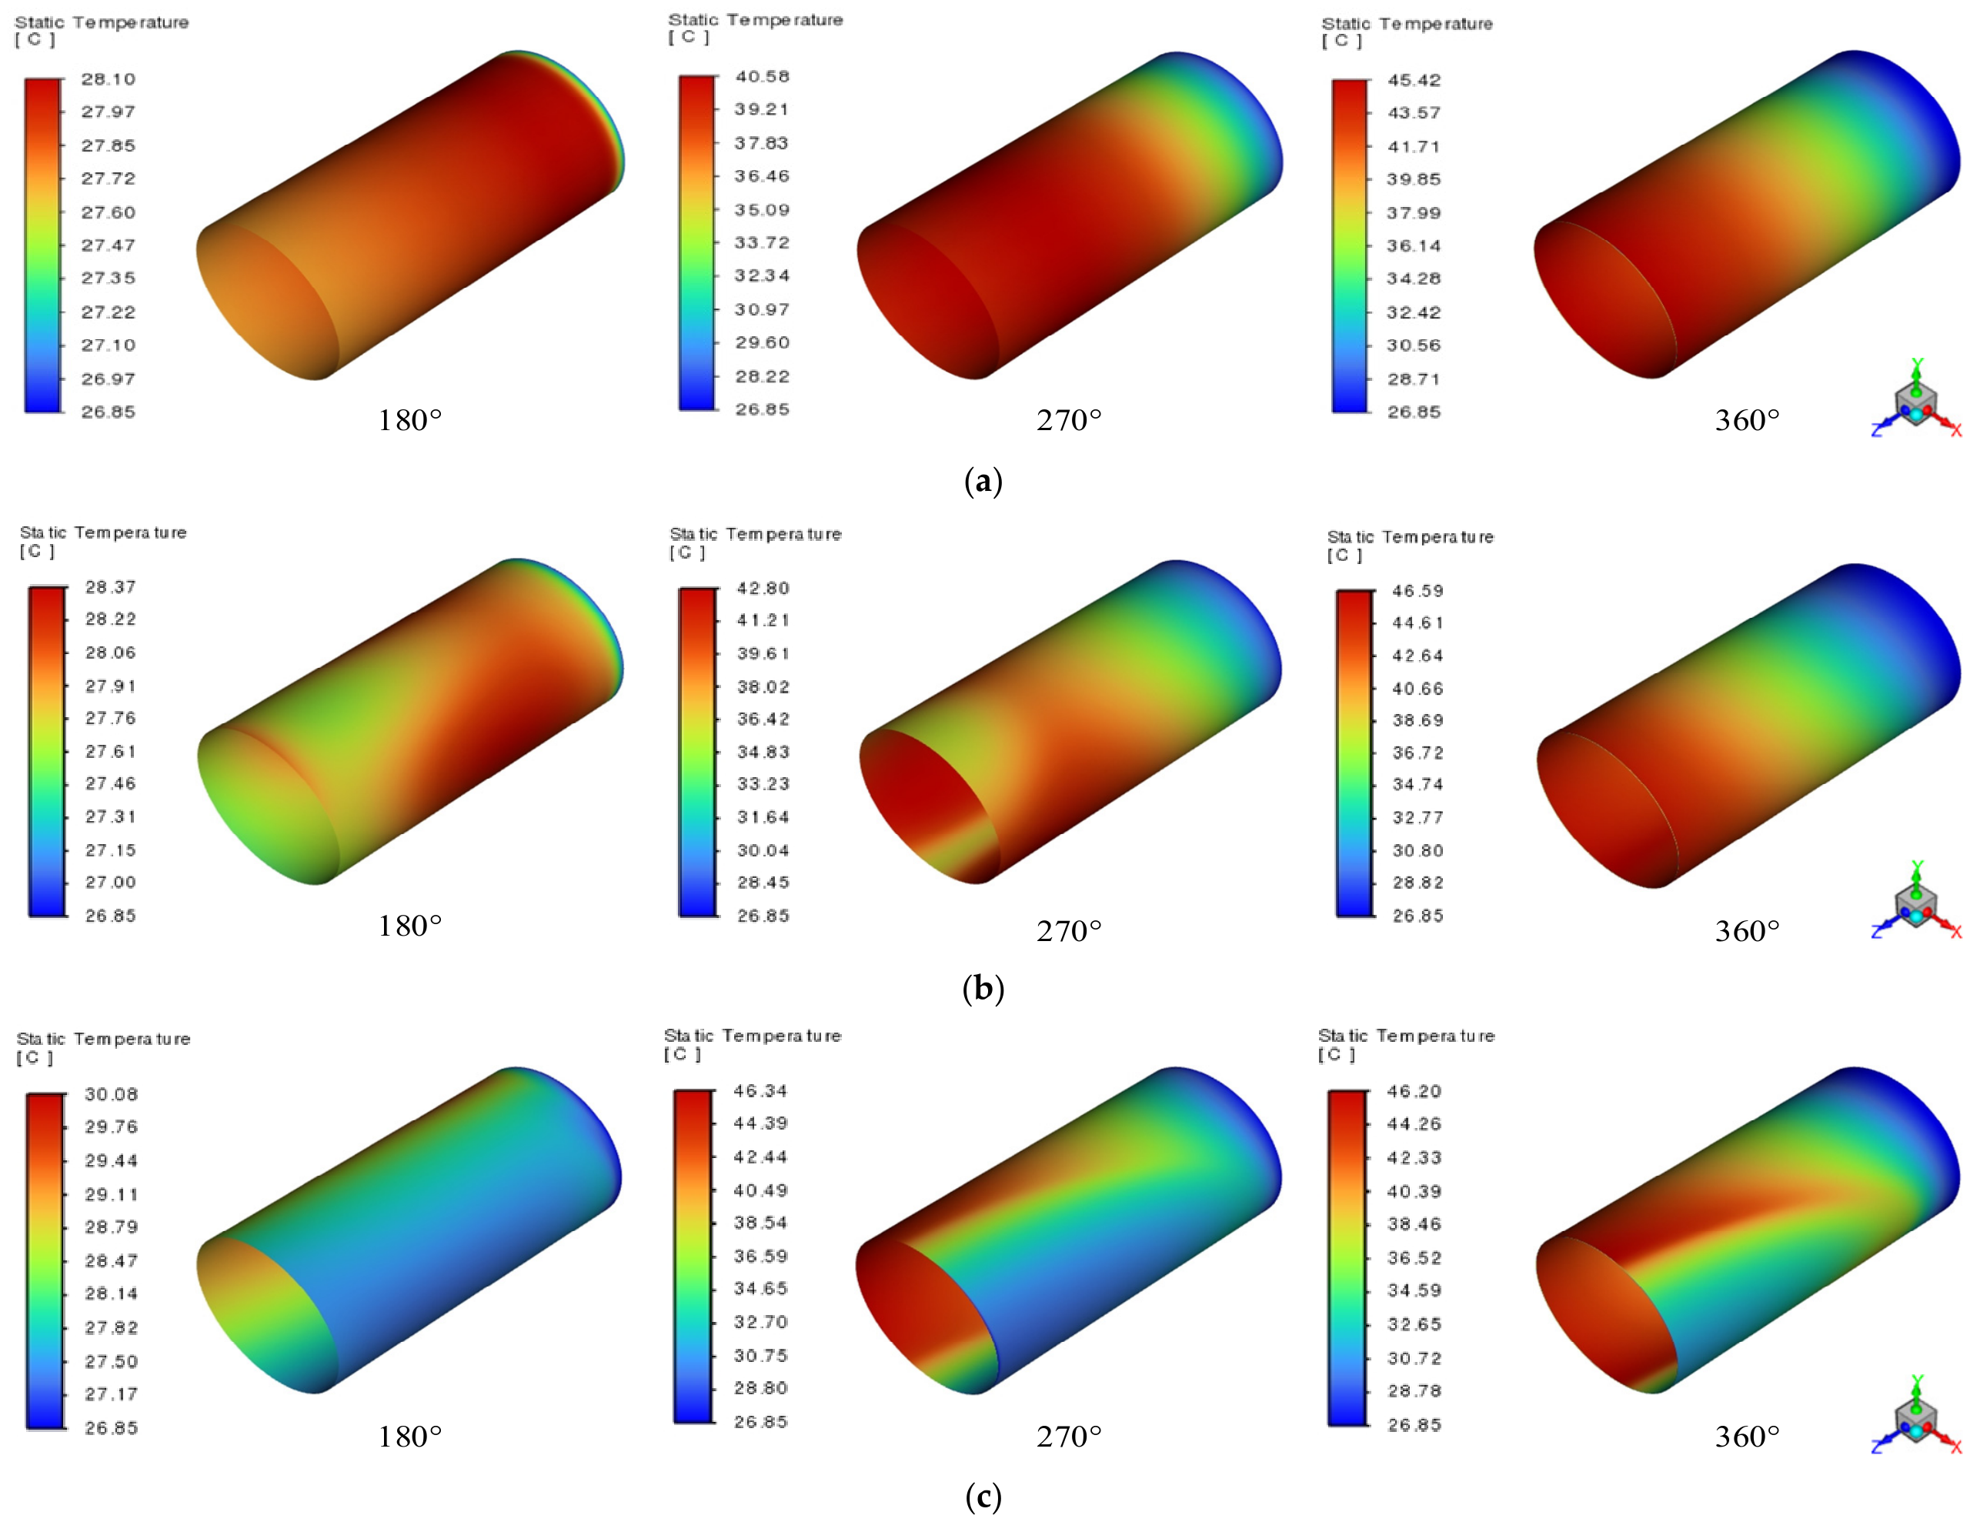
To examine the time-dependent thermal response of the three postures, the oil-film temperature fields were extracted at 180°, 270°, and 360°, as shown in Figure 21. These angles correspond to the completion of posture establishment, the middle of the high-pressure delivery stage, and the end of the operating cycle, respectively.
Figure 21.
(a) Concentric, (b) center-tilted, and (c) parallel-offset postures.
As shown in Figure 21, the oil-film temperatures remain relatively low at 180°, with maximum values of 28.10 °C, 28.37 °C, and 30.08 °C for the concentric, center-tilted, and parallel-offset postures,, respectively. After entering the high-pressure delivery stage, the temperature increases markedly. At 270°, the maximum temperatures reach 40.58 °C for the concentric posture, 42.80 °C for the center-tilted posture, and 46.34 °C for the parallel-offset posture. The parallel-offset posture produces the strongest local thermal concentration because the reduced clearance intensifies the local velocity gradient and viscous dissipation. In contrast, center tilt shifts the high-temperature region in both the axial and circumferential directions. At the end of the cycle 360°, the maximum temperatures are 45.43 °C, 46.59 °C, and 46.20 °C, respectively. Thus, posture-induced temperature differences are limited during suction but become pronounced during high-pressure delivery.
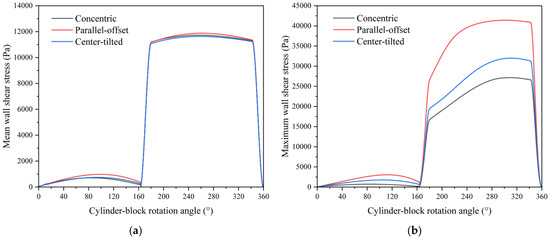
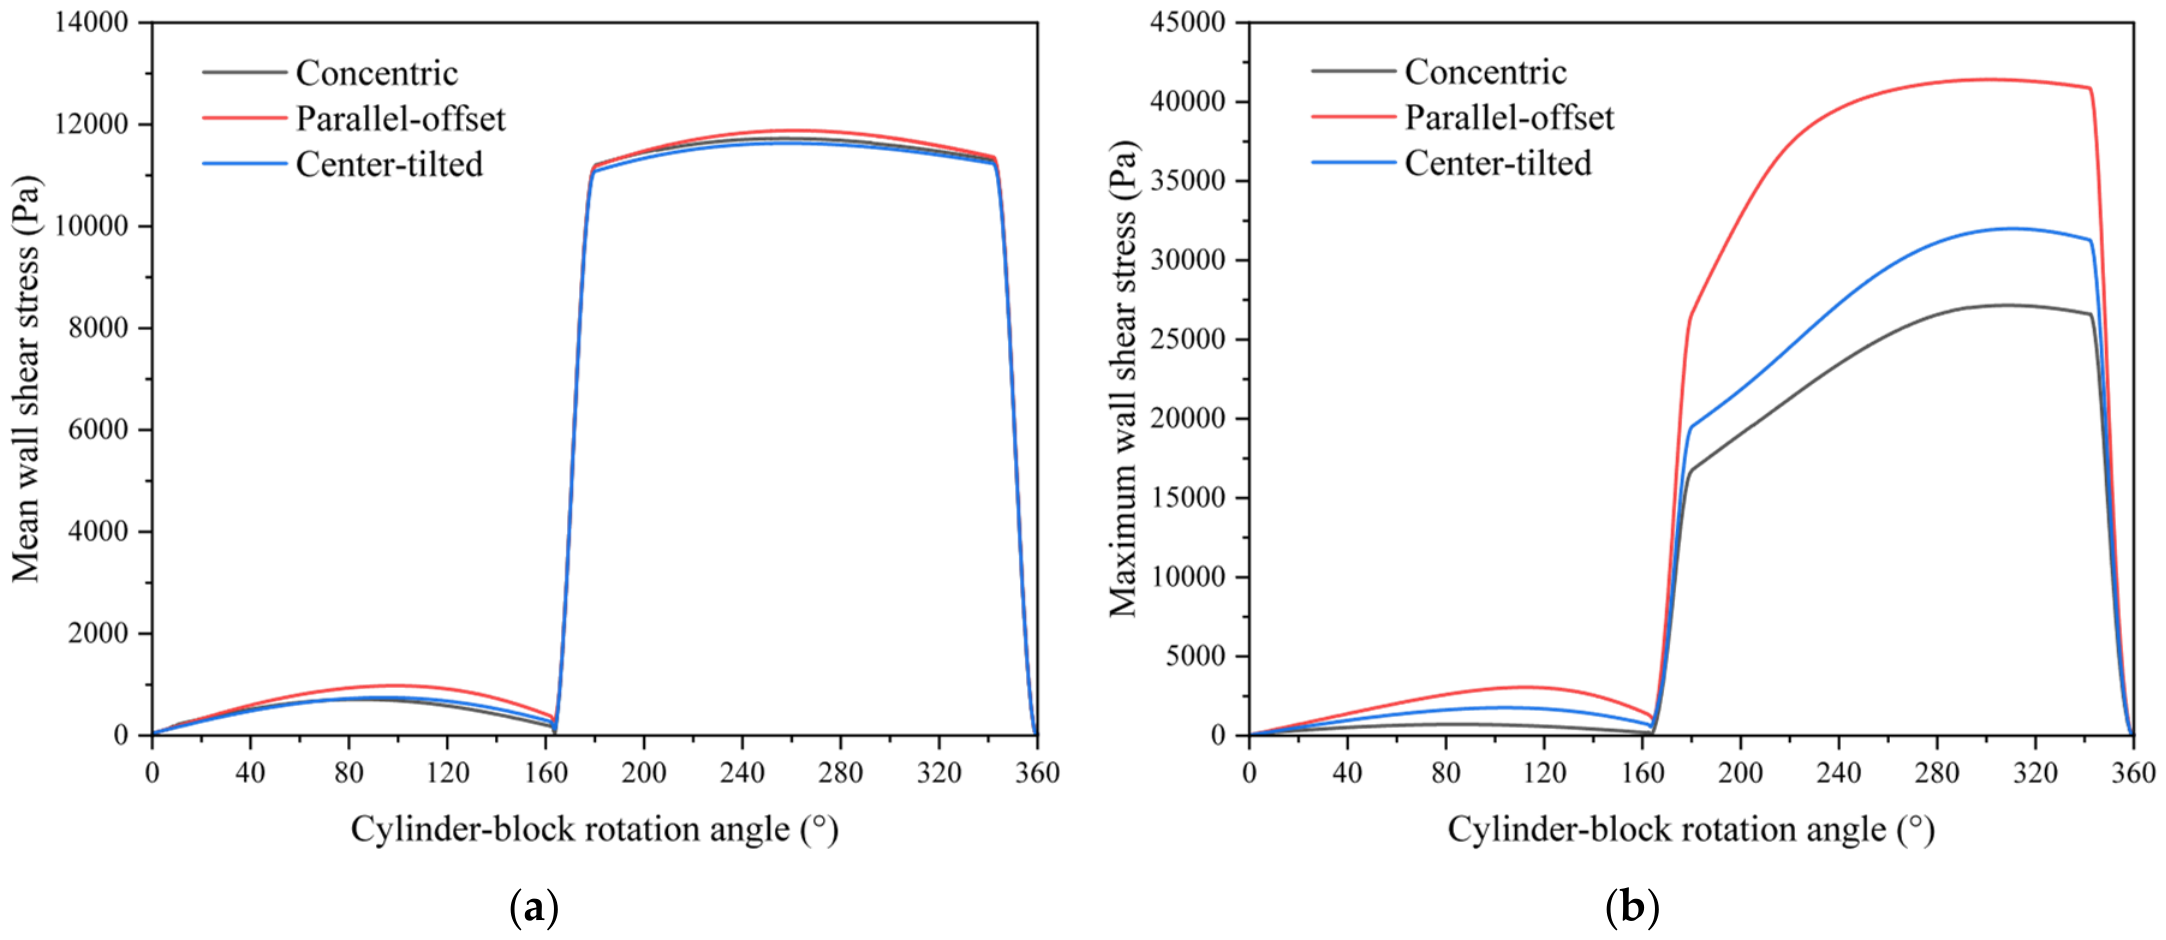
To quantify the local frictional response caused by posture-induced clearance redistribution, the mean and maximum shear stresses on the moving piston-side wall were extracted over one operating cycle for the three postures, as shown in Figure 22.
Figure 22.
(a) Mean shear stress and (b) maximum shear stress.
As shown in Figure 22, the mean shear-stress peaks of the three postures are similar, ranging from approximately 11.5 to 11.8 kPa, indicating that the overall shear level is mainly governed by the high-pressure delivery stage. In contrast, the maximum shear stress is more sensitive to local clearance variation. The peak values are approximately 27 kPa for the concentric posture, 32 kPa for the center-tilted posture, and 41 kPa for the parallel-offset posture. The parallel-offset posture therefore produces the strongest local shear concentration because the reduced clearance on one side markedly increases the local velocity gradient.
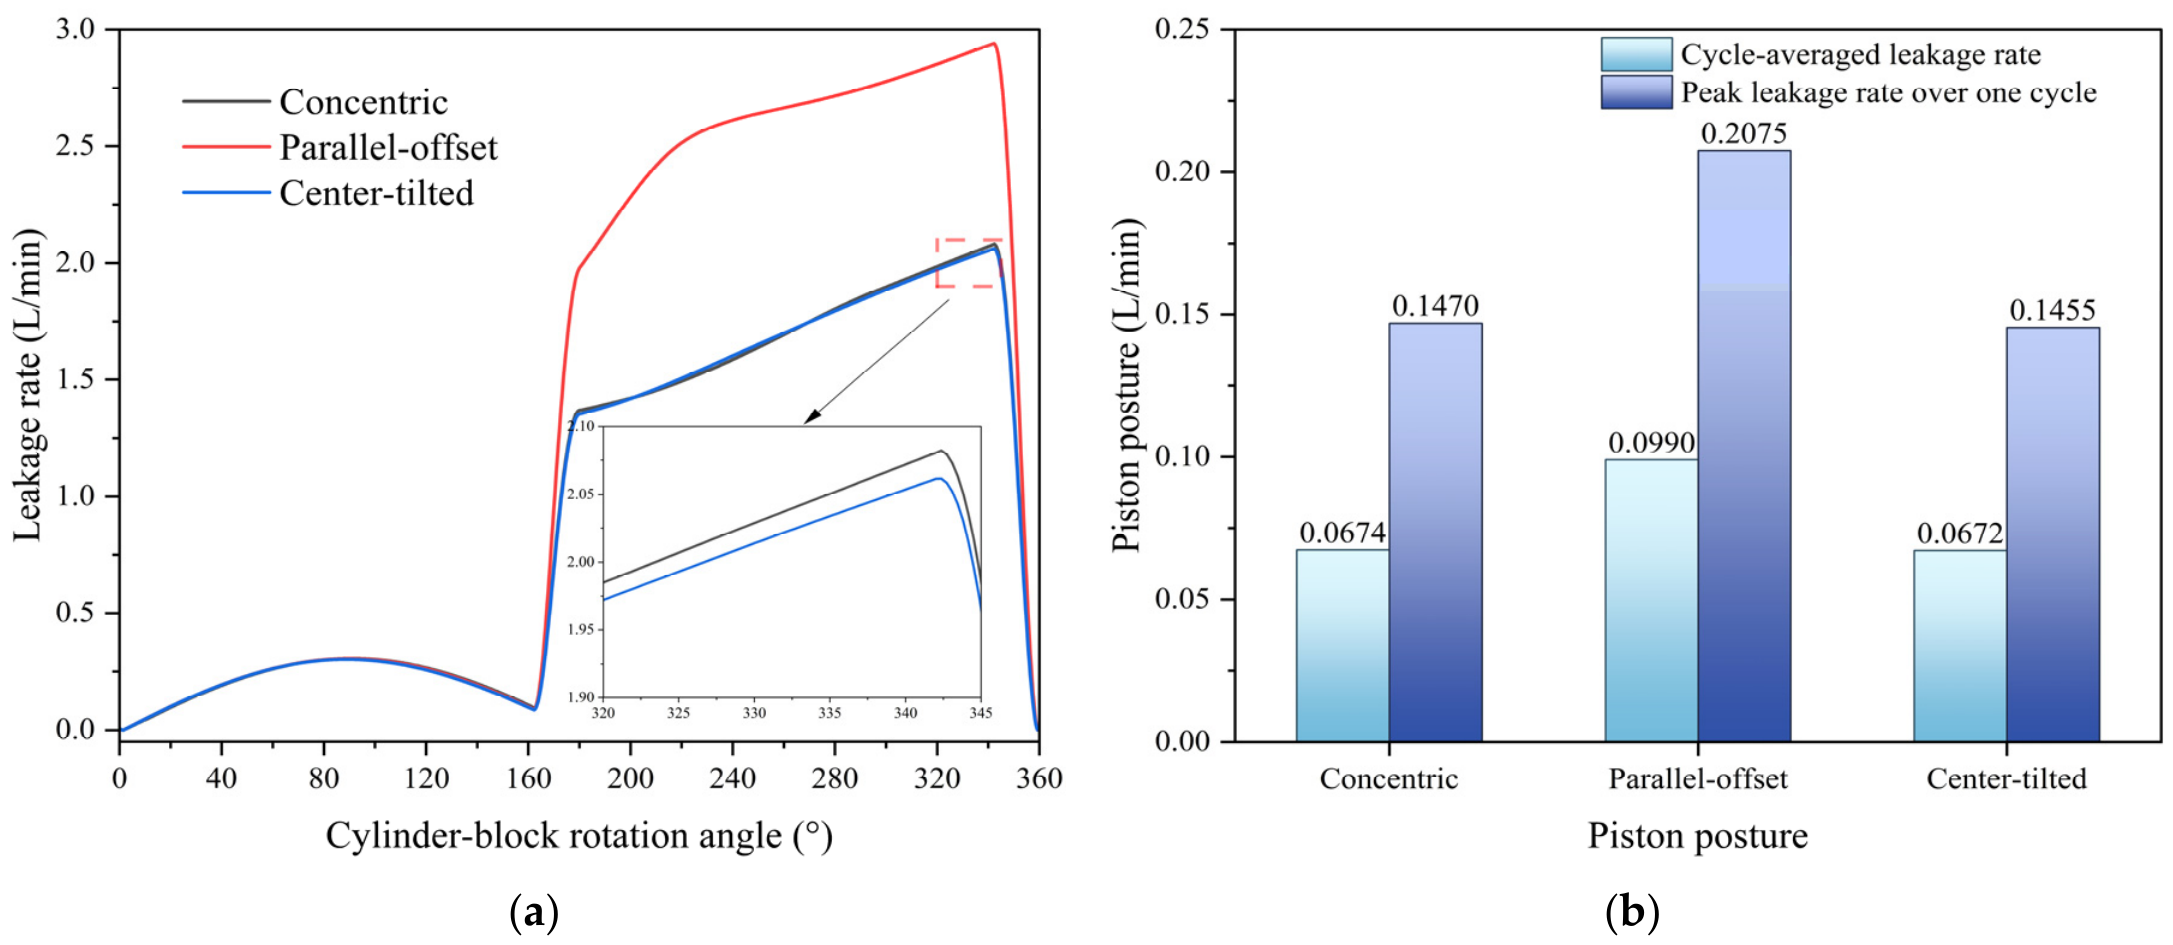
The effect of posture on the sealing performance was further evaluated from the outlet leakage flow rate. Figure 23 presents the leakage-flow histories over one operating cycle together with the cycle-averaged and peak leakage flow rates. The outlet mass flow rate is reported as its absolute value and therefore represents leakage magnitude only.
Figure 23.
(a) Leakage-flow histories over an operating cycle and (b) cycle-averaged and peak leakage flow rates.
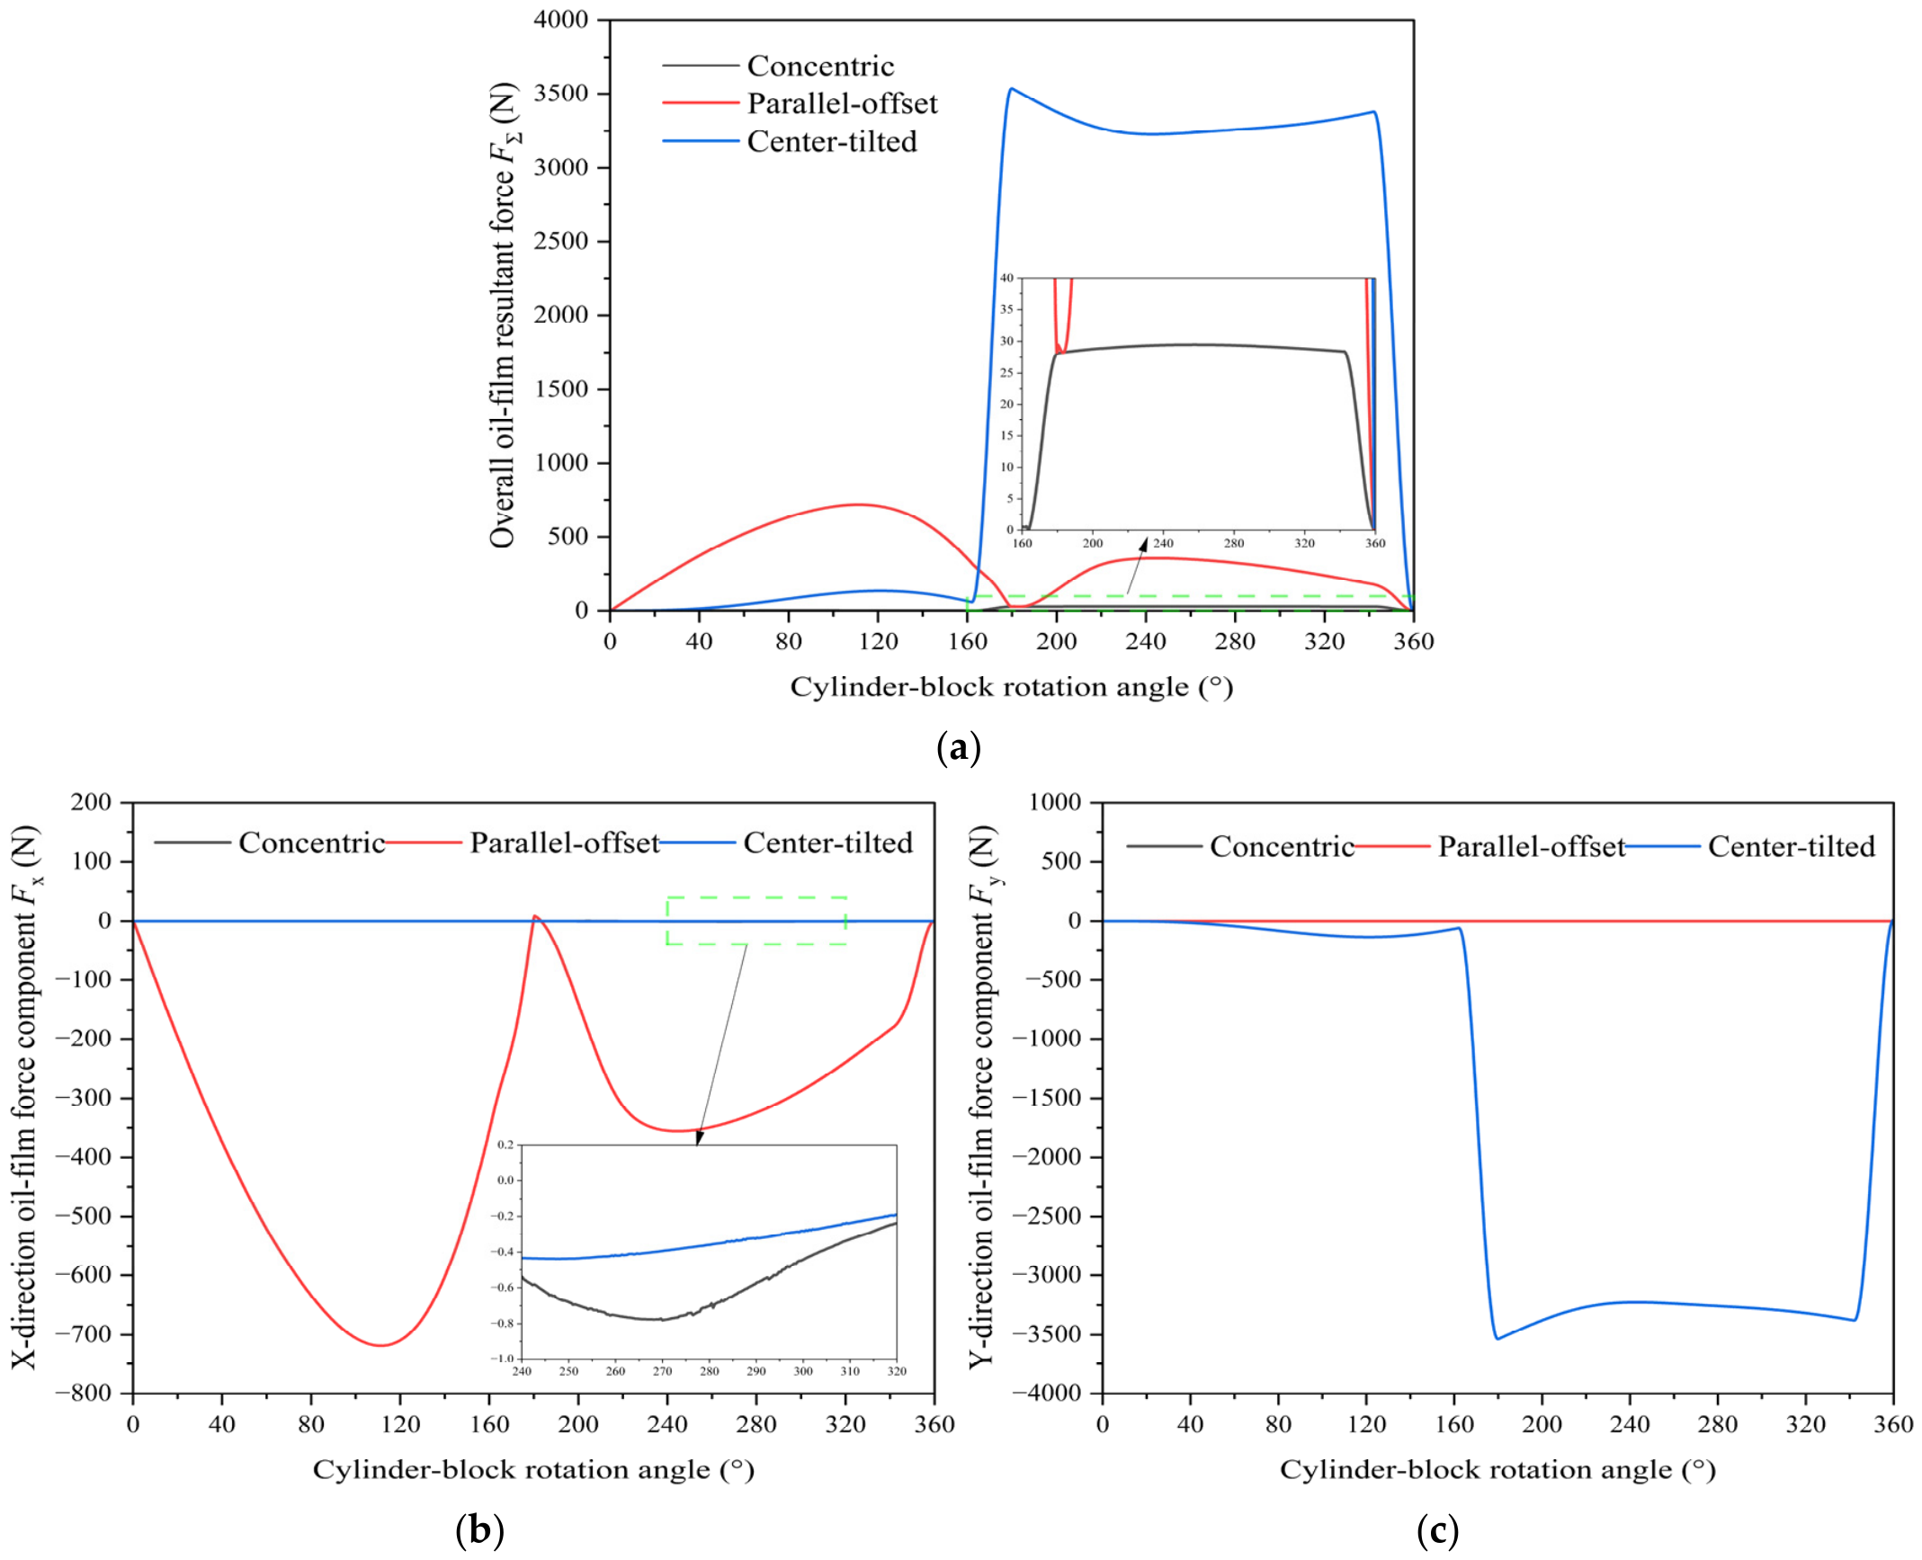
To compare the posture-induced load-carrying response, the overall oil-film resultant force and its radial components in the X-directions and Y-directions were evaluated over one operating cycle, as shown in Figure 24.
Figure 24.
(a) Overall resultant force, (b) X-direction force component, and (c) Y-direction force component.
As shown in Figure 24a, the concentric posture produces a small oil-film resultant force, with a maximum of 29.48 N, because the circumferential pressure distribution is nearly balanced. The parallel-offset posture increases the resultant force to 718.79 N at approximately 111°, mainly through an X-direction force component with a peak of −718.8 N. In contrast, the center-tilted posture produces the largest resultant force, reaching 3537.12 N during the high-pressure delivery stage. Its radial imbalance is dominated by the Y-direction force component, which reaches approximately −3537.0 N after 180°. Therefore, parallel offset primarily induces a transverse load associated with circumferential clearance asymmetry, whereas center tilt produces a much stronger high-pressure radial imbalance. These force responses identify potentially unfavorable load locations but do not directly represent material wear or service life.
5. One-Way Thermo–Fluid–Structure Coupling Response of the Piston–Cylinder Pair Under Different Postures
5.1. One-Way Thermo–Fluid–Structure Coupling Model and Structural Constraints
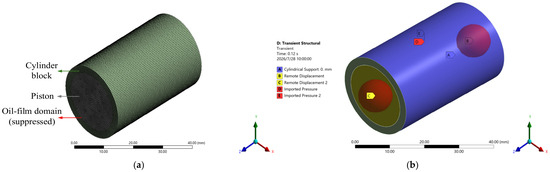
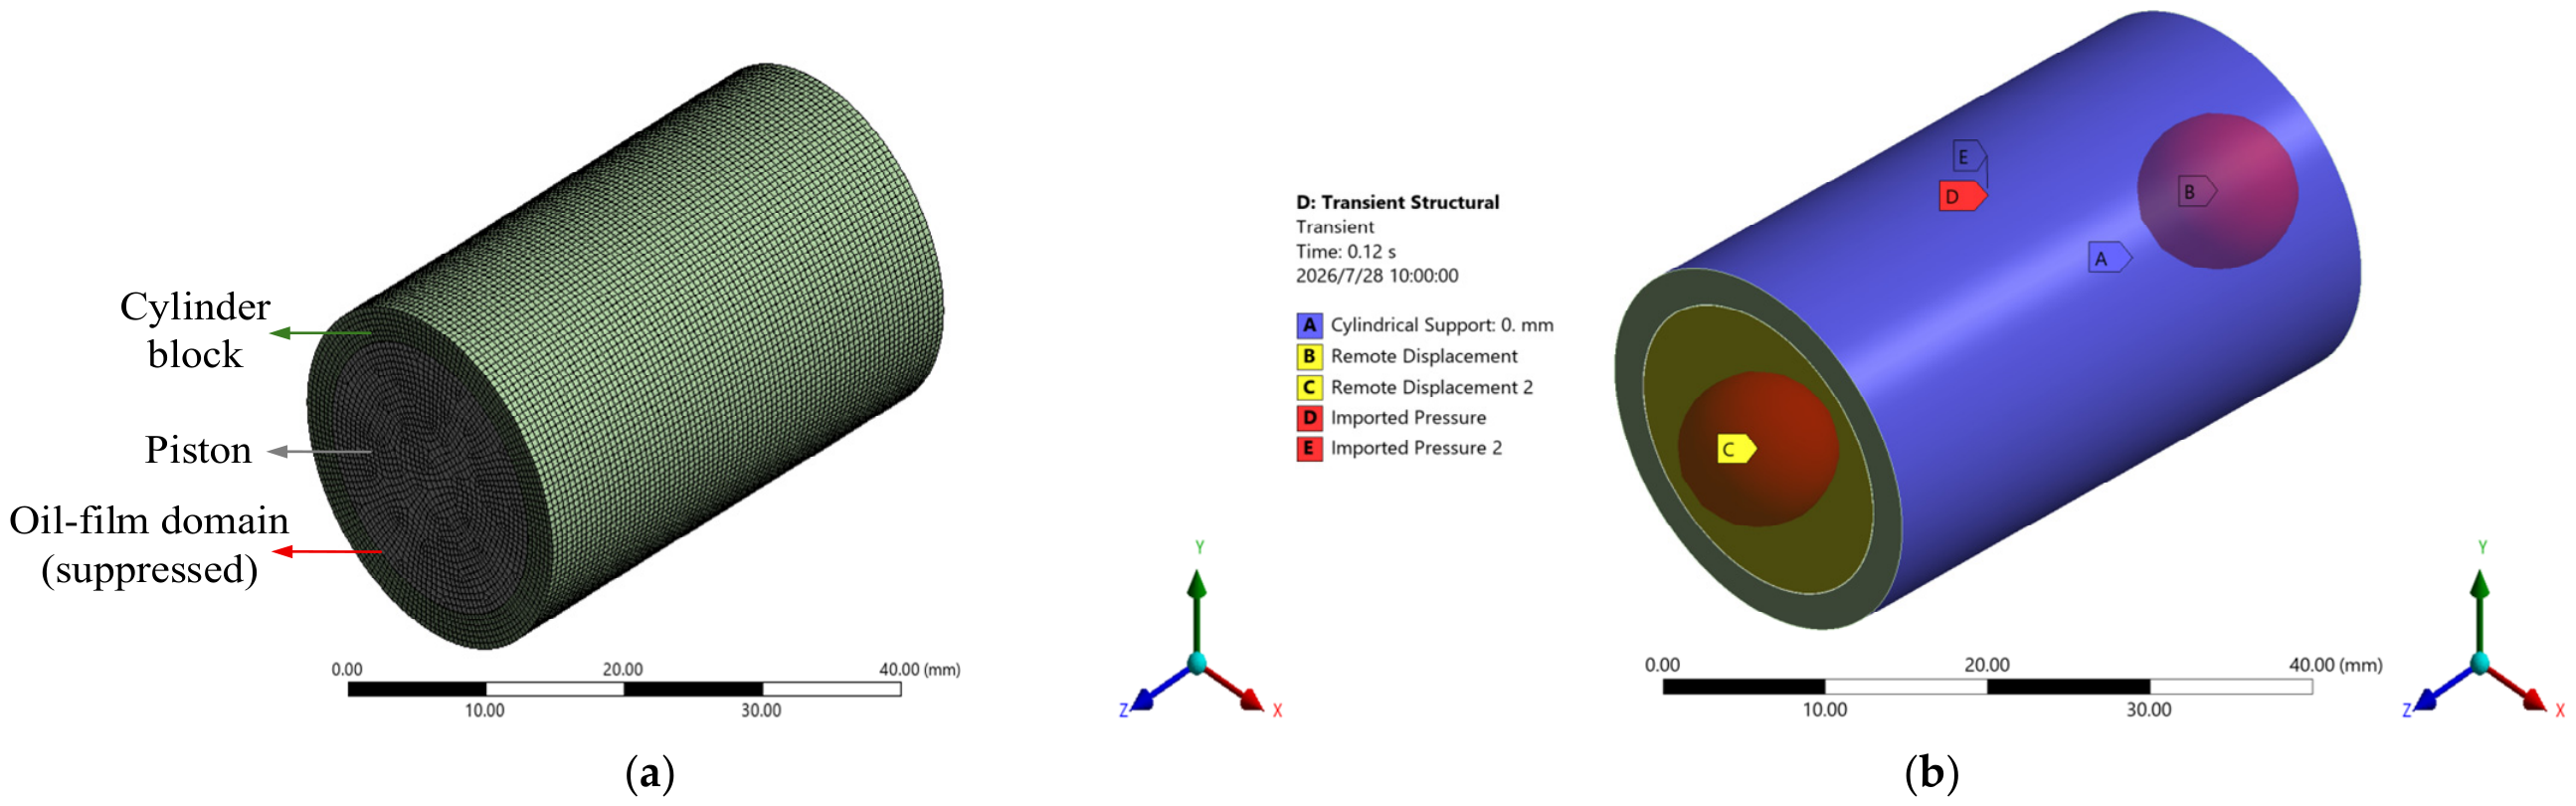
The structural model, load-transfer regions, and constraint conditions used in the one-way thermo–fluid–structure coupling are shown in Figure 25. The material parameters assigned to the piston and cylinder block are listed in Table 9.
Figure 25.
(a) Structural mesh and suppressed oil-film domain; (b) load-transfer regions and constraint conditions.
Table 9.
Material properties of the piston and cylinder block [29,30].
In the coupling process, the transient pressure and temperature fields obtained from Fluent were mapped onto the oil-film contact regions of the piston outer surface and the cylinder-bore inner surface. Since the structural deformation was not fed back to the fluid domain, a one-way coupling strategy was adopted. The oil-film domain was suppressed after load transfer, and the piston–cylinder structural model was meshed using the MultiZone method with a nominal element size of 0.5 mm. The cylinder-block outer surface was fixed to represent the assembly constraint, while remote constraints were applied at both piston ends to suppress rigid-body motion and allow axial thermoelastic expansion. For the three postures, the same concentric structural geometry was retained, and only the mapped oil-film pressure and temperature loads were changed. Thus, the calculated deformation and stress represent the incremental structural response induced by oil-film loading.
5.2. Thermoelastic Deformation and Equivalent Stress of the Piston–Cylinder Pair
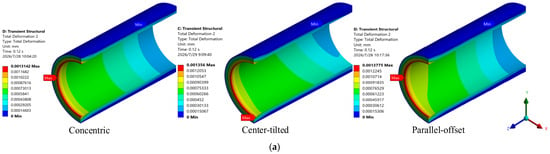
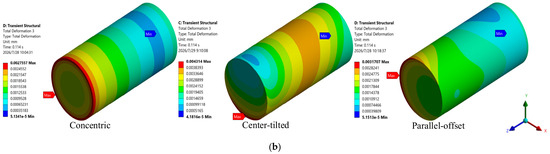
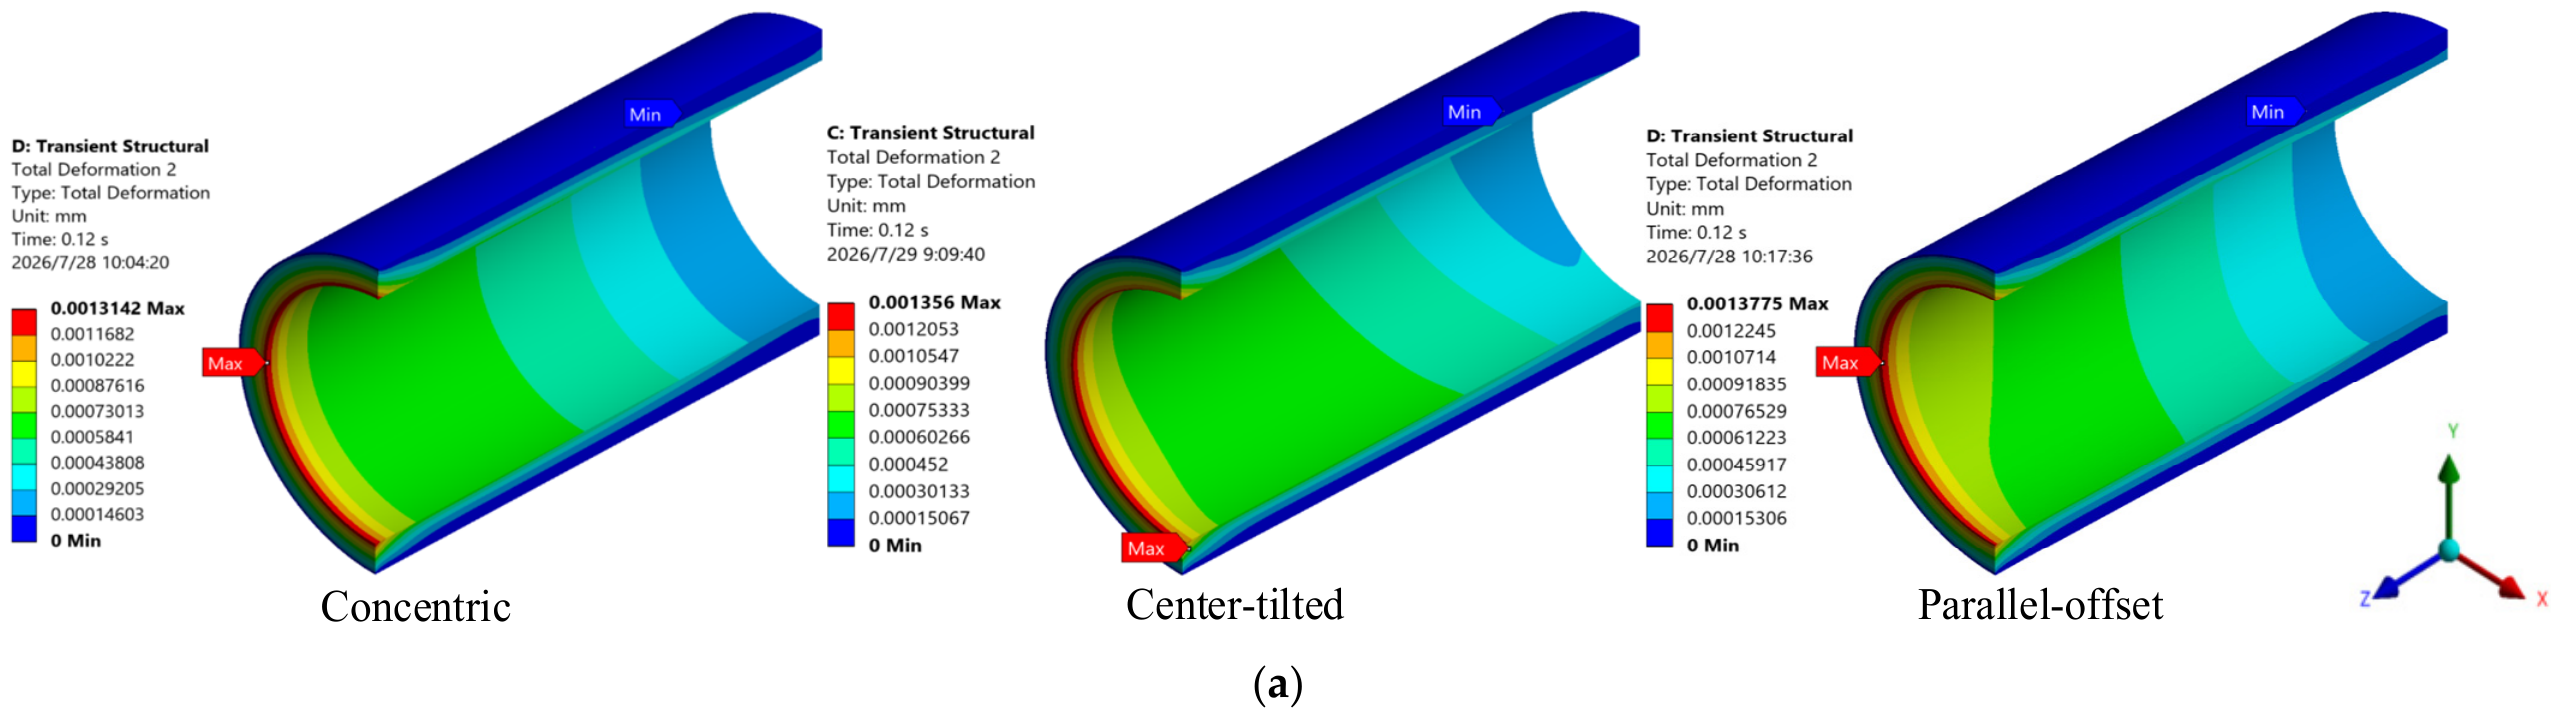
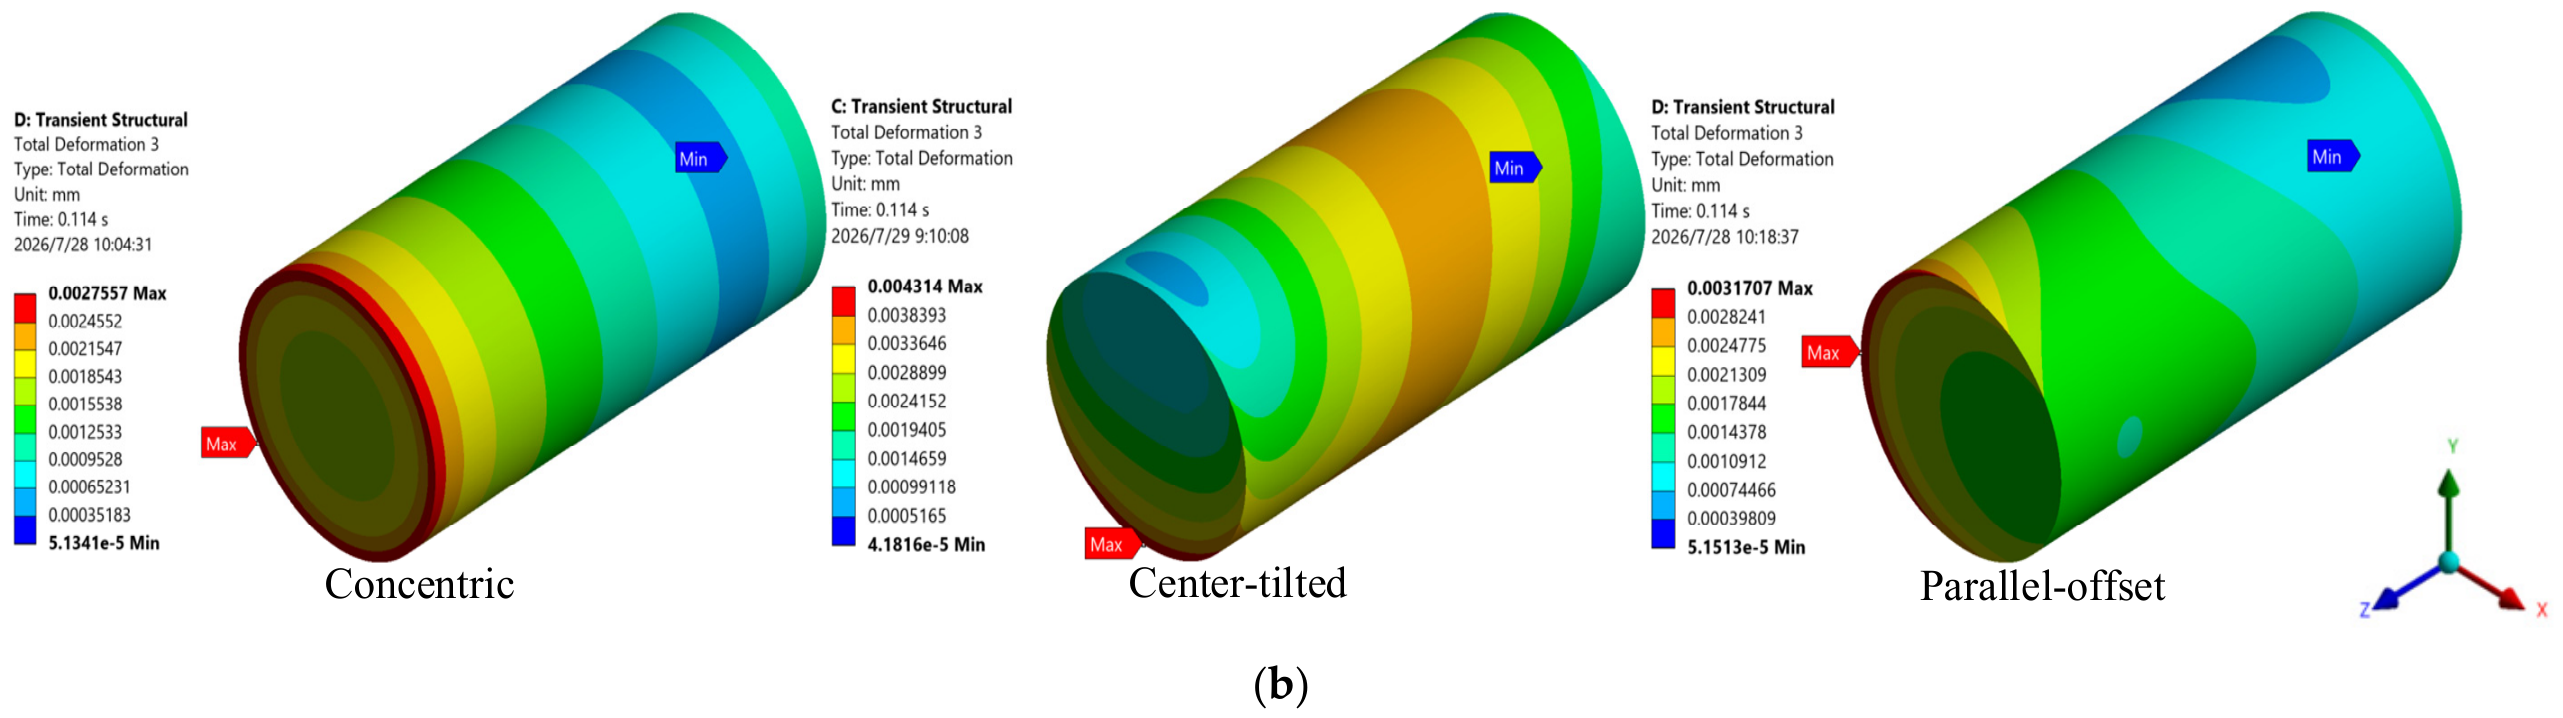
The total deformation distributions of the piston and cylinder block under the three oil-film loading postures are shown in Figure 26. For each posture, the instant with the maximum total deformation within one operating cycle was selected for comparison.
Figure 26.
(a) Cylinder block total deformation; (b) piston total deformation.
As shown in Figure 26a, the maximum deformation of the cylinder block is located on the oil-film-loaded inner wall near the end region and gradually decreases toward the constrained outer wall. The maximum cylinder-block deformations under the concentric, center-tilted, and parallel-offset postures are 1.31, 1.36, and 1.41 μm, respectively. Compared with the concentric posture, the center-tilted and parallel-offset postures increase the cylinder-block deformation by 3.7% and about 7.0%, respectively. This indicates that the outer cylindrical constraint limits the overall deformation of the cylinder block. As shown in Figure 26b, the piston deformation is more sensitive to posture variation. The maximum piston deformations under the concentric, center-tilted, and parallel-offset postures are 2.71, 4.31, and 3.17 μm, respectively. The center-tilted posture increases the piston deformation by 59.0% relative to the concentric case, while the parallel-offset posture increases it by 16.9%. The larger deformation under center tilt indicates that the axially varying oil-film load can induce a stronger bending-type structural response in the piston.
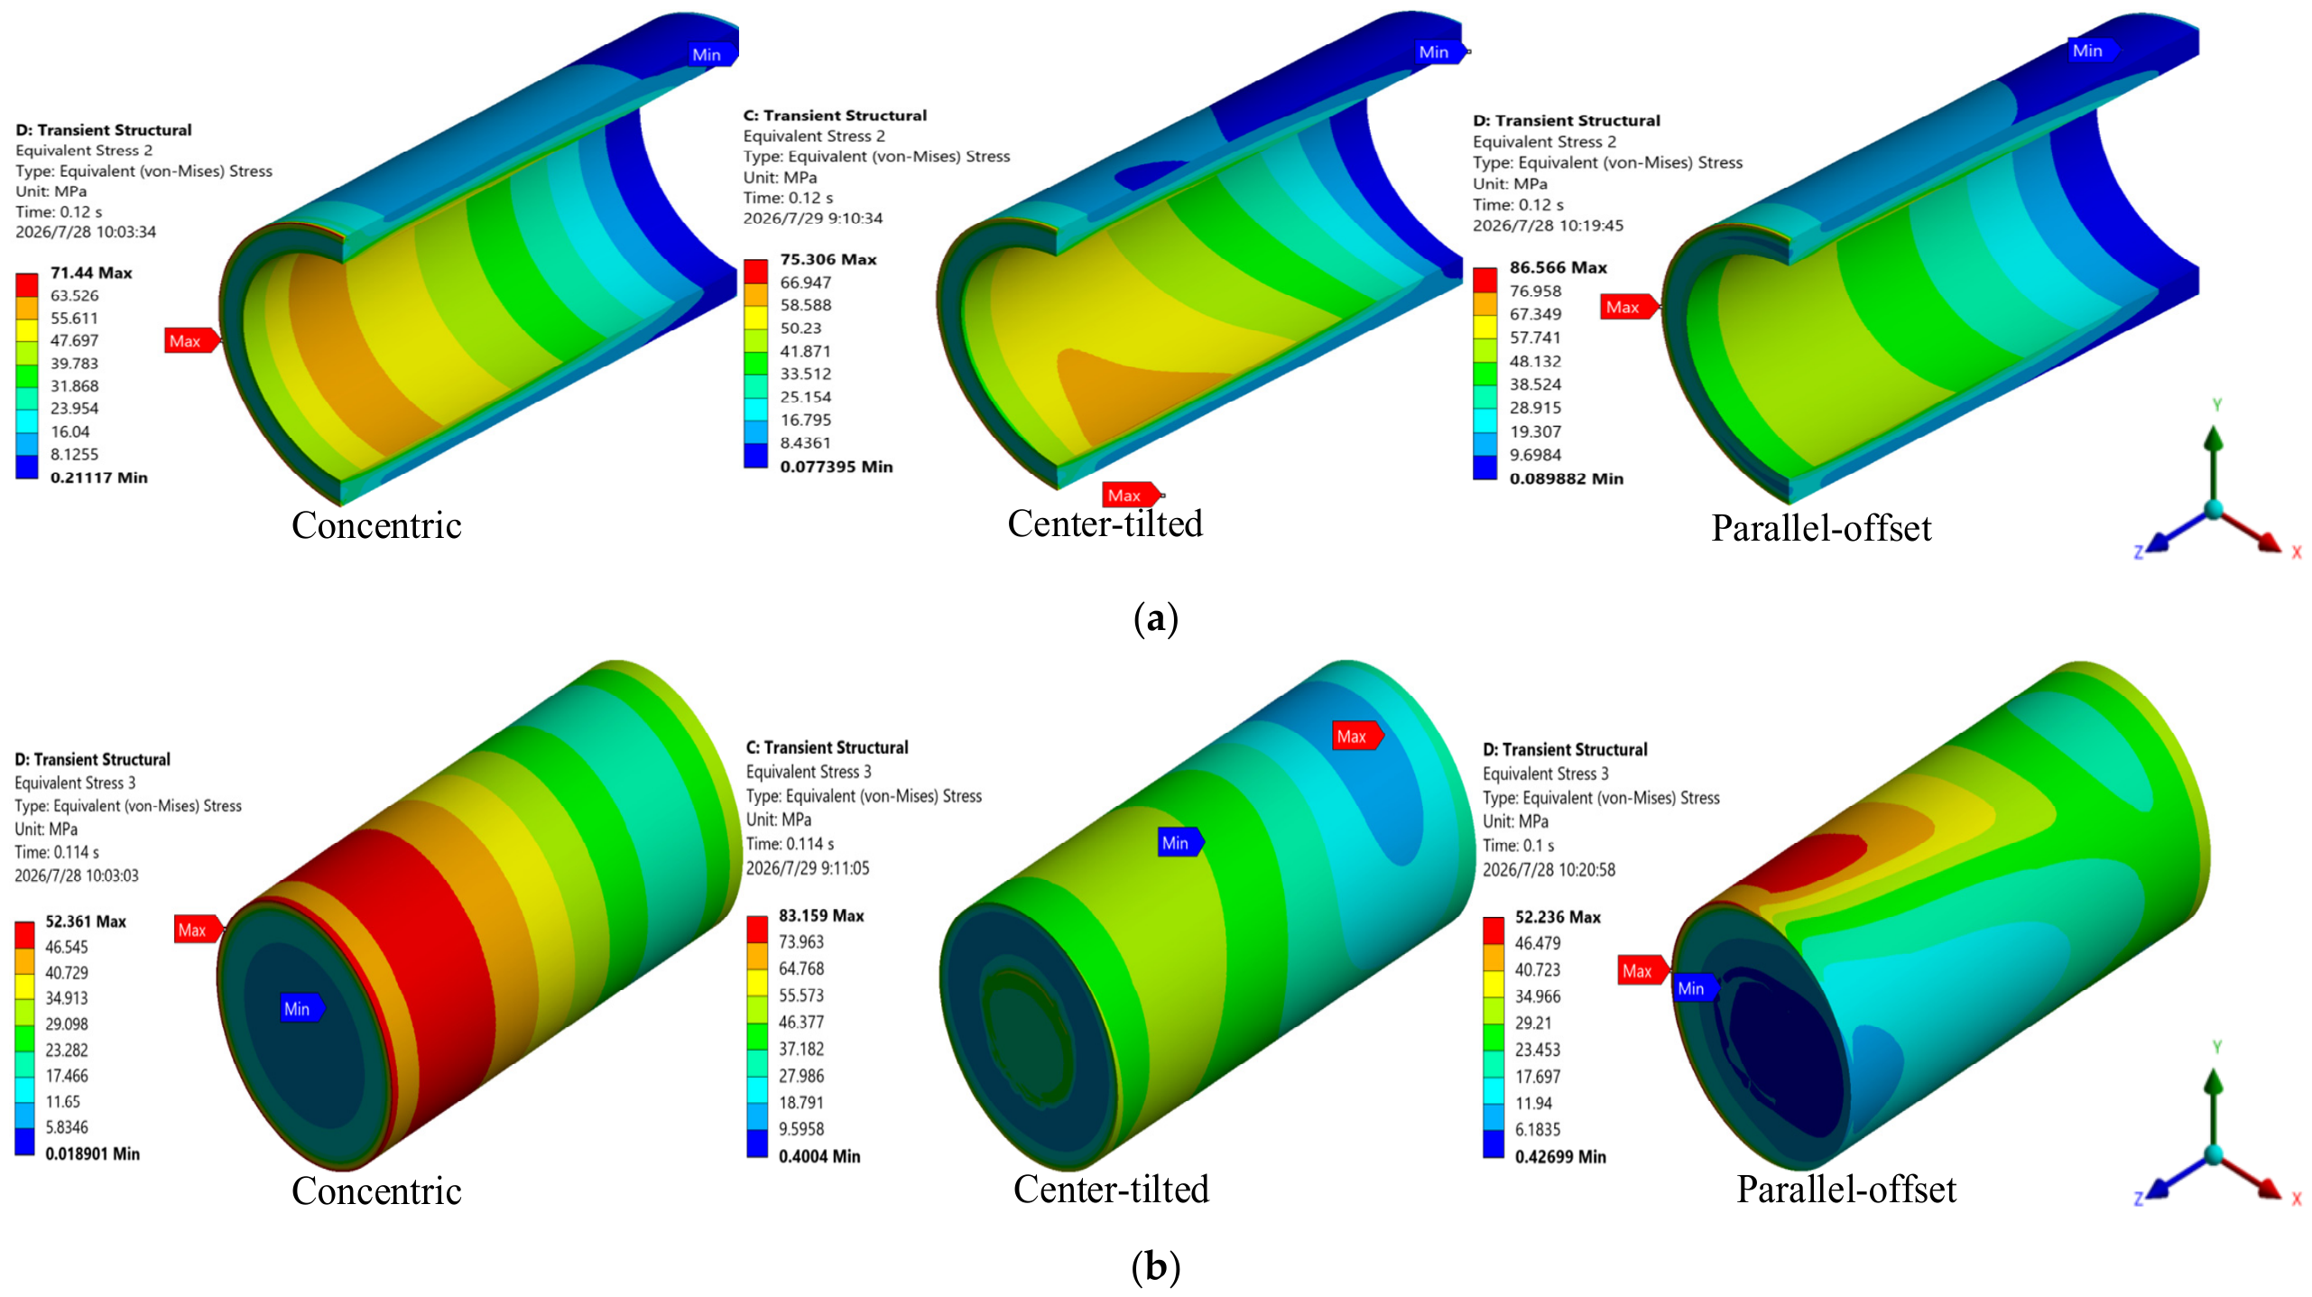
The equivalent-stress distributions under the three oil-film loading postures are shown in Figure 27. For the cylinder block, the stress is concentrated near the oil-film-loaded bore surface, whereas the outer support edge mainly reflects the effect of the boundary condition.
Figure 27.
(a) Cylinder-bore equivalent stress; (b) piston equivalent stress.
The stress peak at the constrained end faces and outer support edge is mainly a boundary-induced concentration and is therefore not used for comparison. Instead, the stress level on the oil-film-loaded bore surface is evaluated from the second contour band in the stress map, which better reflects the loading state of the working wall. As shown in Figure 27a, the wall stresses are 63.53, 67.51, and 76.96 MPa for the concentric, center-tilted, and parallel-offset postures, respectively. Parallel offset therefore increases the bore-wall stress by 21.1% relative to the concentric case, indicating a stronger local loading effect in the circumferentially non-uniform small-clearance region. For the piston, the corresponding peak equivalent stresses are 52.36, 83.16, and 52.27 MPa, as shown in Figure 27b. The center-tilted posture produces the highest piston stress, consistent with its stronger radial imbalance and bending-type response, whereas the parallel-offset posture mainly intensifies the cylinder-bore response.
5.3. Comprehensive Evaluation of Oil-Film and Structural Responses of the Piston–Cylinder Pair
By integrating the effects of load pressure, rotational speed, and posture, three dominant response pathways can be identified. Load pressure increases the axial pressure gradient, thereby intensifying leakage and viscous dissipation. Rotational speed alters wall entrainment, cycle duration, and lubricant renewal rate, causing leakage and shear to exhibit different trends. Non-concentric postures reconstruct the circumferential and axial clearances: parallel offset forms a continuous leakage path and a local narrow-gap, high-shear region, whereas central tilt produces a strong resultant radial force and a bending-dominated structural response. During actual operation, high load, low speed, and non-concentric posture may act in combination to amplify locally unfavorable responses.
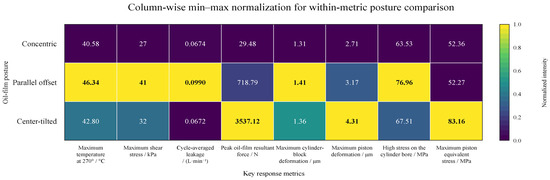
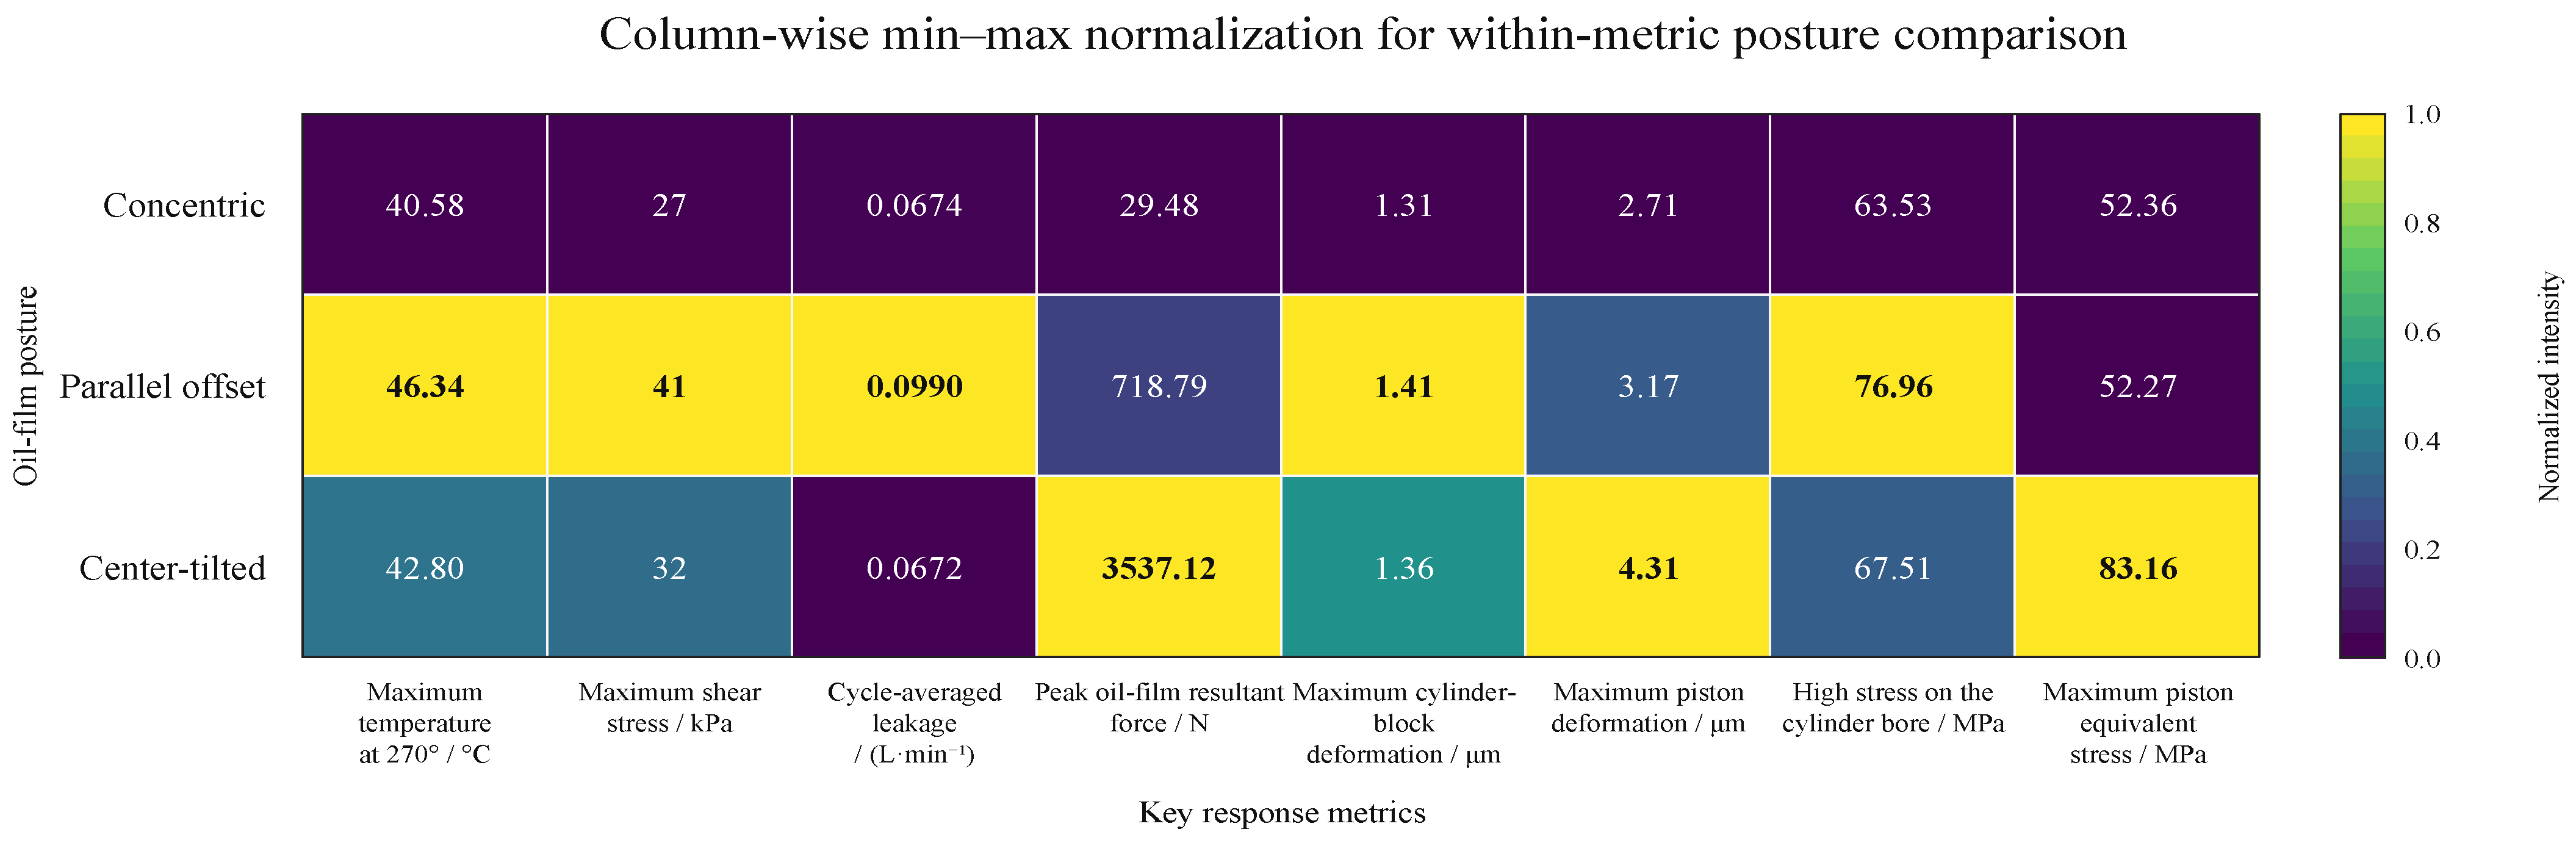
To compare the relative sensitivity of the three postures across response metrics with different dimensions, a posture–response matrix was constructed, and min–max normalization was independently applied to each response metric:
where xij is the original value of the j-th indicator for the i-th posture and zij is the corresponding normalized value.
The cells in Figure 28 retain the original calculated values, whereas the color intensity indicates only the relative magnitude of the three postures within the same indicator column. Colors across different indicators are not comparable in terms of absolute magnitude. This normalization introduces no weighting and does not represent wear probability or an overall performance score.
Figure 28.
Column-wise min–max normalized comparison of key thermo–fluid–structural response metrics for concentric, parallel-offset, and center-tilted piston postures.
As shown in Figure 28, the normalized indicator matrix shows that parallel offset yields the highest values for the peak temperature at 270°, maximum shear stress, mean leakage rate, maximum cylinder deformation, and high-stress band on the cylinder inner wall. This pattern suggests that its adverse effects are mainly associated with intensified local thermal and shear effects, through-leakage, and the structural response of the cylinder bore. In contrast, central tilt is most pronounced in the resultant oil-film force, maximum piston deformation, and piston equivalent stress, indicating that strong radial loading and the associated bending effect constitute the dominant structural risk for this posture.
From the perspective of potential wear mechanisms, the sensitive regions associated with parallel offset are concentrated on the circumferential narrow-gap side and its adjacent high-shear region. Central tilt, by contrast, may increase the tendency for local contact near the end region during the high-pressure discharge stage. Because the present model adopts one-way coupling and a common concentric baseline geometry, and does not account for deformation feedback, asperity contact, cavitation, or material removal, the results should be used to compare posture sensitivities and identify unfavorable load locations. They should not be interpreted directly as wear depth or service life.
6. Discussion
The principal contribution of this study is a controlled cross-scale framework linking pump-level pressure excitation to local oil-film and structural responses. Existing pump-dynamic, Reynolds-based lubrication, and thermoelastic models resolve separate parts of this problem. Here, one phase-resolved piston-chamber pressure history is transferred from AMESim to a three-dimensional transient oil-film model and then to a structural model. The contribution is therefore methodological integration and controlled posture comparison, rather than a new thin-film equation or a replacement for CASPAR.
Under this common excitation, load pressure and rotational speed acted through different mechanisms. Higher pressure increased the axial pressure gradient, leakage, and viscous dissipation. Increasing speed intensified wall entrainment and low-pressure shear, but shortened the cycle and accelerated hydraulic-oil renewal; cycle-averaged leakage consequently decreased by 8.93% from 1000 to 3000 r/min. Leakage reduction at higher speed should not be interpreted as a general reduction in tribological loading. Sealing clearance, permissible case-drain flow, cooling capacity, and operating speed should therefore be assessed together.
The parallel-offset and center-tilted cases were prescribed as representative non-concentric clearance topologies, rather than as predictions of the natural multi-degree-of-freedom piston trajectory. Parallel offset formed continuous narrow and wide channels, promoting through-flow leakage, local thermo-shear concentration, and cylinder-bore loading. Center tilt generated opposite clearance variations at the two ends, partly limiting net leakage while producing stronger radial imbalance and piston bending. Holding pressure history, eccentricity ratio, materials, and numerical settings constant made these mechanisms distinguishable. The results identify posture-sensitive response paths and adverse load locations, but do not determine the most probable operating posture, wear depth, or service life.
The numerical evidence supports the framework at defined levels. Analytical agreement verifies the piston-motion submodel, while pump-flow deviations of 1.48% and 2.87% at 0 and 20 MPa support pump-level mean-flow prediction. These comparisons do not directly validate the transient chamber-pressure waveform or local pressure, temperature, shear, deformation, and stress fields. Mesh refinement changed leakage and maximum temperature by less than 1%. The time-step assessment gave maximum deviations of 0.393% and 0.187% for leakage and temperature under constant pressure, and 0.292% and 0.108% under the transient boundary. These checks support the selected temporal and spatial resolution without constituting comprehensive uncertainty quantification.
Several choices preserved experimental consistency, causal interpretation, and tractable multi-cycle convergence. ISO VG 46 hydraulic oil was used throughout the experiment, AMESim model, and Fluent model; testing several oils would change multiple thermophysical properties simultaneously and obscure the pressure-, speed-, and posture-related comparisons. One-way coupling avoided repeated fluid–structure remeshing and permitted fine resmicrometer the micrometre-scale film, but deformation feedback remains unquantified because the maximum piston deformation reached 14.4% of the nominal radial clearance. A common linear-elastic solid geometry isolated differences caused by mapped loads. The single-phase laminar model focuses on the pressurized load-bearing film, so local low-pressure predictions remain less certain without cavitation data. Roughness, asperity contact, and material removal were excluded because credible implementation requires measured topography and calibrated contact and wear parameters; unverified submodels would increase computational cost and parameter uncertainty rather than reliability. These simplifications improve robustness and mechanism separation, not physical accuracy by themselves. The results should therefore be used as comparative hydrodynamic, thermal, and structural evidence for prescribed postures. Direct local validation is the next priority, followed by staged inclusion of deformation feedback and contact-related physics.
7. Conclusions
This study developed a cross-scale, one-way sequential AMESim–Fluent–Transient Structural framework for investigating the transient thermo–fluid–structure response of the piston–cylinder interface. A common pump-derived, phase-resolved pressure history was imposed on the local oil-film model, enabling controlled comparison of concentric, parallel-offset, and center-tilted postures under identical external excitation. The main conclusions are as follows:
- (1)
- The selected numerical resolution was supported by mesh- and time-step-sensitivity assessments. Refining the mesh from 1.792 × 10⁶ to 2.176 × 10⁶ cells changed the leakage and maximum temperature by less than 1%. Under both constant-pressure and transient-pressure conditions, the deviations caused by changing the time step around the adopted value of 4.0 × 10⁻⁵ s remained below 0.4% for leakage and 0.2% for maximum temperature.
- (2)
- Load pressure primarily governed the pressure-driven leakage and thermal response. Increasing the load pressure from 10 to 30 MPa raised the maximum oil-film temperature during the discharge half-cycle from 28.39 to 36.95 °C. At the end of the third operating cycle, the cycle-averaged leakage increased from 0.0215 to 0.0729 L/min and the maximum temperature increased from 32.32 to 46.21 °C. Increasing the rotational speed from 1000 to 3000 r/min reduced the cycle-averaged leakage by 8.93%, but intensified wall shear during the low-pressure suction stage.
- (3)
- The two prescribed non-concentric postures exhibited distinct response characteristics. At 500 r/min and 30 MPa, parallel offset produced a maximum temperature of 46.34 °C, a maximum wall shear stress of approximately 41 kPa, a mean leakage rate of 0.0990 L/min, and a cylinder-bore high-stress band of approximately 76.96 MPa. This posture was therefore more sensitive to through-flow leakage, local thermo-shear intensification, and cylinder-bore loading. In contrast, the center-tilted posture generated a peak resultant oil-film force of 3537.12 N, together with a maximum piston deformation of 4.31 μm and an equivalent stress of 83.16 MPa, indicating stronger radial imbalance and piston bending.
These results provide a controlled basis for comparing posture sensitivity and identifying unfavorable load regions in the piston–cylinder interface. Because the non-concentric postures were prescribed and deformation feedback, cavitation, surface roughness, asperity contact, and material removal were excluded, the results should not be interpreted as predictions of the natural piston posture, wear depth, or service life. Future work should progressively incorporate force-balanced multi-degree-of-freedom motion, two-way coupling, cavitation, and experimentally calibrated contact and wear models.
Author Contributions
Conceptualization, S.L. and J.L.; methodology, S.L. and J.L.; validation, H.Z.; investigation, S.L., J.L. and H.L.; writing—original draft preparation, S.L. and D.W.; project administration, Z.L. and H.Z. All authors have read and agreed to the published version of the manuscript.
Funding
This research was funded by Guangxi Natural Science Foundation Project (2026GXNSFHA00640009). National Natural Science Foundation of China (51765014).
Data Availability Statement
The simulation inputs and experimental data supporting this study are available from the corresponding author upon reasonable request.
Conflicts of Interest
The authors declare no conflicts of interest.
References
- Liu, S.; Zhao, H.; Wu, D.; Li, J.; Li, H.; Liu, Z. Research on the Influence of Piston Pair Wear on Pump Output Characteristics of Axial Piston Pump Under Multiple Working Conditions. Machines 2026, 14, 753. [Google Scholar] [CrossRef] [Scilit]
- Bergada, J.M.; Kumar, S.; Davies, D.L.; Watton, J. A Complete Analysis of Axial Piston Pump Leakage and Output Flow Ripples. Appl. Math. Model. 2012, 36, 1731–1751. [Google Scholar] [CrossRef] [Scilit]
- Edge, K.A.; Darling, J. The Pumping Dynamics of Swash Plate Piston Pumps. J. Dyn. Syst. Meas. Control 1989, 111, 307–312. [Google Scholar] [CrossRef] [Scilit]
- Yamaguchi, A. Motion of the Piston in Piston Pumps and Motors: The Case of Metallic Contact. JSME Int. J. Ser. III 1990, 33, 627–633. [Google Scholar] [CrossRef] [Scilit]
- Fang, Y.; Shirakashi, M. Mixed Lubrication Characteristics Between the Piston and Cylinder in Hydraulic Piston Pump-Motor. J. Tribol. 1995, 117, 80–85. [Google Scholar] [CrossRef] [Scilit]
- Wieczorek, U.; Ivantysynova, M. Computer Aided Optimization of Bearing and Sealing Gaps in Hydrostatic Machines-The Simulation Tool CASPAR. Int. J. Fluid Power 2002, 3, 7–20. [Google Scholar] [CrossRef] [Scilit]
- Pelosi, M.; Ivantysynova, M. A Geometric Multigrid Solver for the Piston-Cylinder Interface of Axial Piston Machines. Tribol. Trans. 2012, 55, 163–174. [Google Scholar] [CrossRef] [Scilit]
- Zhang, X.; Wu, H.; Chen, C.; Wang, D.; Li, S. Oil Film Lubrication State Analysis of Piston Pair in Piston Pump Based on Coupling Characteristics of the Fluid Thermal Structure. Eng. Fail. Anal. 2022, 140, 106521. [Google Scholar] [CrossRef] [Scilit]
- Haidak, G.; Wei, X.; Li, F.; Larbi, A.; Wang, D. Heat Effects Modelling on the Efficiency Loss of the Lubricating Interface Between Piston and Cylinder in Axial Piston Pumps. Tribol. Int. 2022, 175, 107846. [Google Scholar] [CrossRef] [Scilit]
- Zhao, C.; Dong, H.; Wei, X.; Wang, D.; Lu, X. Experimental Study on the Pressure Distribution of Piston/Cylinder Lubricating Interface Based on Time Domain Location Method. Measurement 2024, 231, 114595. [Google Scholar] [CrossRef] [Scilit]
- Lyu, F.; Xu, B.; Zhang, J. Simulative Analysis of Piston Posture and Piston/Cylinder Interface Leakage of EHA Pumps by the Influence of Rotating Speed. J. Mech. Eng. 2018, 54, 123–130. (In Chinese) [Google Scholar] [CrossRef] [Scilit]
- Lyu, F.; Zhang, J.; Sun, G.; Xu, B.; Pan, M.; Huang, X.; Xu, H. Research on Wear Prediction of Piston/Cylinder Pair in Axial Piston Pumps. Wear 2020, 456–457, 203338. [Google Scholar] [CrossRef] [Scilit]
- Lin, Y.; Wang, H.; Wang, H.; Tang, S.; Hao, H.; Huang, J. A Novel Wear Prediction Method and Wear Characteristic Analysis of Piston/Cylinder Pair in Axial Piston Pump. Wear 2024, 550–551, 205402. [Google Scholar] [CrossRef] [Scilit]
- Zhao, S.; Tang, H.; Ren, Y.; Wu, D.; Liu, Y. The Attitude Changes and Leakage Characteristics of Large-Scale Plunger Pairs in High-Pressure Plunger Pumps. Flow Meas. Instrum. 2025, 102, 102838. [Google Scholar] [CrossRef] [Scilit]
- Li, F.; Wang, D.; Lv, Q.; Haidak, G.; Zheng, S. Prediction on the Lubrication and Leakage Performance of the Piston-Cylinder Interface for Axial Piston Pumps. Proc. Inst. Mech. Eng. Part C 2019, 233, 5887–5896. [Google Scholar] [CrossRef] [Scilit]
- Wang, D.; Song, Y.; Tian, J.; Shiju, E.; Haidak, G. Research on the Fluid Film Lubrication Between the Piston-Cylinder Interface. AIP Adv. 2018, 8, 105330. [Google Scholar] [CrossRef] [Scilit]
- Manring, N.D.; Fales, R.C. Hydraulic Control Systems, 2nd ed.; John Wiley & Sons: Hoboken, NJ, USA, 2020. [Google Scholar] [CrossRef] [Scilit]
- Ma, X.; Wang, Q.J.; Lu, X.; Mehta, V.S. A Transient Hydrodynamic Lubrication Model for Piston/Cylinder Interface of Variable Length. Tribol. Int. 2018, 118, 227–239. [Google Scholar] [CrossRef] [Scilit]
- Pathak, A.; Sonkar, N.; Gupta, R.; Miglani, A.; Kankar, P.K. The Effect of Increasing Eccentricity and Leakage on the Performance of an Axial Piston Pump. Proc. Inst. Mech. Eng. Part C 2024, 238, 9909–9923. [Google Scholar] [CrossRef] [Scilit]
- Manring, N.D. Hydraulic Control Systems; John Wiley & Sons: Hoboken, NJ, USA, 2005; ISBN 978-0-471-69311-6. [Google Scholar]
- Mounayer, J.; Habchi, W. Exact Model Order Reduction for the Full-System Finite Element Solution of Thermal Elastohydrodynamic Lubrication Problems. Lubricants 2023, 11, 61. [Google Scholar] [CrossRef] [Scilit]
- Bair, S.; Michael, P. Modelling the Pressure and Temperature Dependence of Viscosity and Volume for Hydraulic Fluids. Int. J. Fluid Power 2010, 11, 37–42. [Google Scholar] [CrossRef] [Scilit]
- Du, Y.; Zhao, H.; Ji, H.; Wang, W.; Wang, H.; Xu, F. Research on Lubrication Mechanism of Plunger Pair Considering Viscosity Temperature and Pressure Effect. Phys. Fluids 2024, 36, 097119. [Google Scholar] [CrossRef] [Scilit]
- Song, Y.; Ma, J.; Zeng, S. A Numerical Study on Influence of Temperature on Lubricant Film Characteristics of the Piston/Cylinder Interface in Axial Piston Pumps. Energies 2018, 11, 1842. [Google Scholar] [CrossRef] [Scilit]
- Yan, K.; Huang, D. Lubricating Characteristics and Sealing Performance of Mixed TEHD Analysis of Piston-Cylinder Interface in the Piston Pump. Ind. Lubr. Tribol. 2023, 75, 789–798. [Google Scholar] [CrossRef] [Scilit]
- Zhang, J.; Shen, Y.; Lyu, F.; Huang, W.; Xu, B. Tolerance Design Guideline for Piston/Cylinder Interface of Electro-Hydrostatic Actuator Pumps Based on a Thermal-Fluid-Structure Model. Tribol. Int. 2024, 191, 109208. [Google Scholar] [CrossRef] [Scilit]
- Kumar, S.; Bergada, J.M. The Effect of Piston Grooves Performance in an Axial Piston Pumps via CFD Analysis. Int. J. Mech. Sci. 2013, 66, 168–179. [Google Scholar] [CrossRef] [Scilit]
- Xu, B.; Hu, M.; Zhang, J. Impact of Typical Steady-State and Transient Conditions on Flow Ripple and Its Test Accuracy for Axial Piston Pumps. Chin. J. Mech. Eng. 2015, 28, 1012–1022. [Google Scholar] [CrossRef] [Scilit]
- Chen, R.K.; Gu, J.; Han, L.Z.; Pan, J.S. Investigation of the Continuous Cooling Transformations in Rotor Steel 30CrNi4MoV. Met. Sci. Heat Treat. 2015, 57, 13–17. [Google Scholar] [CrossRef] [Scilit]
- Liang, C.; Zhou, J.; Wang, Y.; Peng, Z. Reduced Friction and Excellent Anti-Wear Performance of QBe2 Beryllium Bronze against 38CrMoAlA Steel in Pneumatic Downhole Motor under Grease Lubrication. Metals 2023, 13, 266. [Google Scholar] [CrossRef] [Scilit]

Disclaimer/Publisher’s Note: The statements, opinions and data contained in all publications are solely those of the individual author(s) and contributor(s) and not of MDPI and/or the editor(s). MDPI and/or the editor(s) disclaim responsibility for any injury to people or property resulting from any ideas, methods, instructions or products referred to in the content. |
© 2026 by the authors. Licensee MDPI, Basel, Switzerland. This article is an open access article distributed under the terms and conditions of the Creative Commons Attribution (CC BY) license.