


Abstract
Most existing friction torque models for ball screws mainly address two-point contact and are difficult to apply to four-point contact configurations preloaded by increasing ball diameter. This study develops a differentiated model based on the distinct kinematics of the two contact pairs in four-point contact: one is rolling-dominated with slight sliding, whereas the other is additionally generated by the enlarged ball diameter and is sliding-dominated. First, Hertz theory is used to determine the normal load at each contact point. Then, for the rolling-dominated pair, elastic hysteresis rolling friction, differential microslip friction, and elastohydrodynamic oil-film shear friction are considered; for the sliding-dominated pair, sliding friction and oil-film shear friction are included. By combining the Hamrock–Dowson film-thickness formula, Roelands pressure-viscosity relationship, and Eyring shear model, friction torque models for the two contact pairs under mixed lubrication are established and superposed to obtain the total torque, thereby relating ball diameter increment, rotational speed, and friction torque. Friction torque tests conducted on the 4010 ball screw showed that the MAPE between theoretical calculations and experimental results on the internal validation set was 8.55%. The model also reflects the characteristics of a significant increase in friction torque with rotational speed under low preload and its tendency to stabilize under high preload.
1. Introduction
Ball screws are core components for achieving high-precision linear transmission in CNC machine tools, industrial robots, and aerospace equipment, and their frictional characteristics directly affect positioning accuracy, operating efficiency, and service life. With the increasing requirements of high-end equipment, such as precision grinding machines, for the stiffness and accuracy retention of transmission components, preload achieved by increasing the ball diameter has become an important method for improving the stiffness of ball screws and eliminating backlash. This approach increases the number of contact points between the balls and the screw and nut raceways, thereby changing the contact state from conventional two-point contact to four-point contact [1]. Compared with the two-point contact state, four-point contact offers the advantages of a compact structure, high load-carrying stiffness, and high transmission accuracy. However, the increased number of contact points significantly increases frictional loss and transmission temperature rise. The fundamental contradiction between “high stiffness and high dynamic performance” and “high friction and high heat generation” is a key constraint in the design of high-performance ball screws. Therefore, establishing a friction torque calculation model that can reflect the motion characteristics and friction mechanisms of four-point contact is of great significance for preload design, cooling, and temperature rise control of ball screws.
In recent years, extensive studies have been carried out on the modeling and calculation of friction torque in ball screws. In 2003, NSK proposed a friction torque calculation formula considering the lead angle and preload [2], which is currently the main empirical formula used internationally; however, it does not account for the influence of factors such as the contact angle on friction torque. Zhou et al. [3] established a new friction torque calculation model based on the relationship between preload and preload torque by introducing the effects of the lead angle and contact angle into the calculation. Wei et al. [4,5] incorporated factors such as preload and lubrication into the friction torque calculation of ball screws and established a mathematical model of ball screw friction torque considering actual operating conditions. Kang Xianmin et al. [6] experimentally verified the relationship between rotational speed and elastohydrodynamic oil-film fluctuation, providing experimental support for analyzing the influence of the speed parameter in elastohydrodynamic lubrication models. Zhao Jiajia et al. [7] modified the effects of oil-film temperature fields and viscosity variations on friction torque based on thermal elastohydrodynamic lubrication theory and quantified the influence of thermal effects on each friction component. Although the above studies have made progress in friction mechanisms and lubrication models, their analyses of friction torque are based on the conventional two-point contact state and have not been extended to four-point contact. Zou Binyang et al. [8] investigated the influence of double-arc raceway profile errors on friction torque fluctuation by simulation; however, they did not conduct a differentiated analysis of the primary and secondary contact pairs and therefore cannot adequately reflect the actual motion characteristics under four-point contact. In summary, existing studies cannot accurately calculate the friction torque of four-point-contact ball screws preloaded by increasing the ball diameter, nor can they accurately characterize the fundamental differences between the additional and original contact pairs in terms of their motion states, friction mechanisms, and contributions to the total friction torque.
Based on the above literature analysis, to address the difficulty of accurately calculating friction torque under four-point contact, this study takes a four-point-contact ball screw preloaded by increasing the ball diameter as the research object and establishes an isothermal friction torque calculation model that differentiates the friction mechanisms according to the distinct motion states of the two contact pairs. One type of contact pair is dominated by rolling with slight sliding, whereas the other exhibits significant relative sliding owing to the increase in ball diameter. Considering factors such as elastohydrodynamic lubrication, elastic hysteresis friction, oil-film shear friction, and sliding friction, the friction torque contributions of the two types of contact pairs are analyzed and calculated separately. The coupled relationship among ball diameter increment, rotational speed, and total friction torque is then established, and friction torque experiments are conducted using a 4010 ball screw to evaluate the proposed model under the investigated conditions and provide a valuable reference for similar preloaded four-point-contact ball screw systems.
2. Friction Torque Calculation Model for the Four-Point-Contact Ball Screw
2.1. Normal Contact Load Between the Ball and Raceway
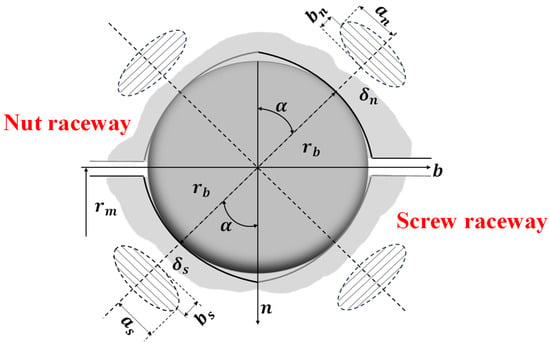
As shown in Figure 1, a single-nut ball screw preloaded by increasing the ball diameter is considered. By inserting balls larger than the raceway space, four contact points are formed between the balls and the raceways. A certain preload is generated owing to the elastic deformation of the balls, and the preload can be adjusted by changing the ball diameter interference.
Figure 1.
Schematic diagram of four-point contact between ball and raceway.
To ensure that the ball diameter interference enables the balls and raceways to enter a stable four-point contact state, the ineffective diameter increment caused by raceway machining errors, assembly errors, groove geometric deviations, initial clearance, and other factors must first be eliminated. When the ball diameter interference is , the ball just forms four-point contact with the screw and nut raceways. When the ball diameter interference is and no other errors exist, the effective normal contact deformation at the contact point, , is given by [9]:
The size of the contact zone between the ball and the raceway is much smaller than the curvature radii of the ball and the raceway. Therefore, point contact theory can be used to calculate the normal load and the contact ellipse parameters. According to Hertz contact theory, the deformation can be expressed as:
Therefore, the normal contact load Q is:
where is the sum of the principal curvatures in the contact region between the ball and the raceway; is the equivalent elastic modulus; k is the contact ellipse parameter; and are the complete elliptic integrals of the first and second kinds, respectively, which can be obtained from Equation (4):
can be determined from the elastic moduli and Poisson’s ratios of the screw shaft and nut:
where and are the Poisson’s ratios of the screw and nut, respectively, and are the elastic moduli of the screw and nut, respectively.
By combining Equations (3)–(5), the normal contact load between the ball and the raceway is obtained as:
The mean contact pressure and maximum contact pressure in the contact micro-region are expressed as:
where and are the semi-major and semi-minor axes of the raceway contact ellipse, respectively; the subscript j = s, n denotes the screw side and the nut side, respectively.
The equivalent axial preload force of the ball screw can be expressed as:
where is the lead angle; is the contact angle between the ball and the raceway; is the number of effective load-carrying balls in the ball screw, which can be expressed as:
where is the number of balls in a single circuit, and is the number of ball circulation circuits.
2.2. Kinematic Analysis
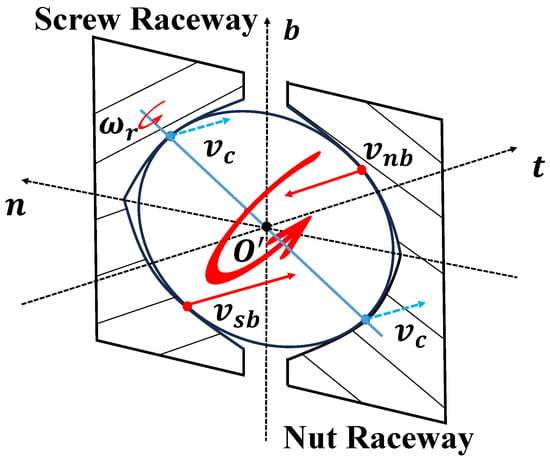
In a conventional two-point contact ball screw, the ball forms one load-carrying contact point with each of the screw and nut raceways under the action of the axial load. When the transmission direction of the ball screw is reversed, this pair of contact points switches to the opposite generatrix of the corresponding raceway as the ball undergoes a slight deflection within the raceway. For a ball screw preloaded by increasing the ball diameter, in addition to retaining the original load-carrying contact points, the ball also forms additional contacts with the opposite side of the raceway owing to the diameter interference, thereby producing a four-point contact structure. In this study, we make a theoretical assumption about the motion states of the two contact pairs. The original contact pair responsible for the primary motion and load transmission is defined as the primary contact pair, whose motion state is dominated by rolling with a small amount of sliding. The additional contact pair generated by the increase in ball diameter is defined as the secondary contact pair. Its contact points are approximately located near the spin axis of the ball, and the motion is mainly characterized by relative sliding; therefore, the ball-side velocity is approximated by the translational velocity of the ball center, as shown in Figure 2. For ease of analysis and to emphasize the difference between the two contact pairs, the terms primary contact pair and secondary contact pair are used consistently in the following sections.
Figure 2.
Schematic diagram of the motion states of balls in four-point contact.
The velocities of the ball at the screw side and nut side of the primary contact pair are given as follows [10]:
where is the angular velocity of the screw; is the orbital angular velocity of the ball; is the ball pitch-circle radius; is the ball radius; and , , and are the absolute velocity components of the ball spin angular velocity in the t, n, and b directions, respectively, which can be obtained as follows [11]:
where ; is the angle between the ball spin axis and the t-b plane, which can be approximately taken as ; and is the angle between the projection of the spin axis on the t-b plane and the b axis. This angle is very small and can be neglected.
The linear velocities on the screw and nut sides at the contact points between the ball and the raceway can be obtained as:
The entrainment velocity , relative sliding velocity , and slide-to-roll ratio in the contact micro-region between the ball and the raceway are then determined. The subscript m denotes the primary contact pair, whereas the secondary contact pair is denoted by c.
Because the secondary contact point is approximately located near the spin axis of the ball, the contribution of ball spin to the tangential velocity at this point is relatively small. Therefore, the ball-side velocity is taken as the translational velocity of the ball center:
The relative sliding velocity and entrainment velocity in the contact micro-region of the secondary contact pair are analyzed in the same manner as those of the primary contact pair.
2.3. Elastohydrodynamic Lubrication Film Thickness and Shear Stress
The contact micro-region between the ball and the raceway is characterized by high contact pressure and a small contact area; therefore, its lubrication state can be treated as typical point-contact elastohydrodynamic lubrication. By increasing the ball diameter to introduce preload, two additional load-bearing contact micro-regions are formed between the ball and the raceway. However, each contact micro-region remains a local elliptical point contact between the ball and the raceway, and its size is still much smaller than the curvature radius. Therefore, the point-contact elastohydrodynamic lubrication model and thin-film shear analysis are applicable to the four-point-contact condition investigated in this study.
The oil-film thickness is a key indicator for evaluating elastohydrodynamic lubrication performance. According to the Hamrock–Dowson formula [12], and considering the motion and contact parameters of the ball and raceway, the central film thickness can be obtained as:
The minimum film thickness can be expressed as [13]:
where is the composite radius of curvature in the normal plane of the contact point; U is the dimensionless speed parameter; G is the material parameter; W is the load parameter; and k is the ellipticity ratio, , with
where is the dynamic viscosity at atmospheric pressure; is the pressure-viscosity coefficient; and is the entrainment velocity.
When the significant increase in lubricant viscosity with pressure is considered, the viscosity can be described by the Roelands pressure-viscosity relationship [14]:
where the pressure-viscosity index Z can be expressed as [15]:
Under high-pressure thin-film shear conditions, the lubricant exhibits non-Newtonian shear behavior. Therefore, the Eyring shear model can be used to calculate the oil-film shear stress [16,17]:
where is the limiting shear stress of the lubricant, and v is the relative sliding velocity.
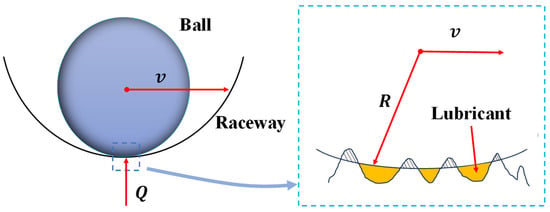
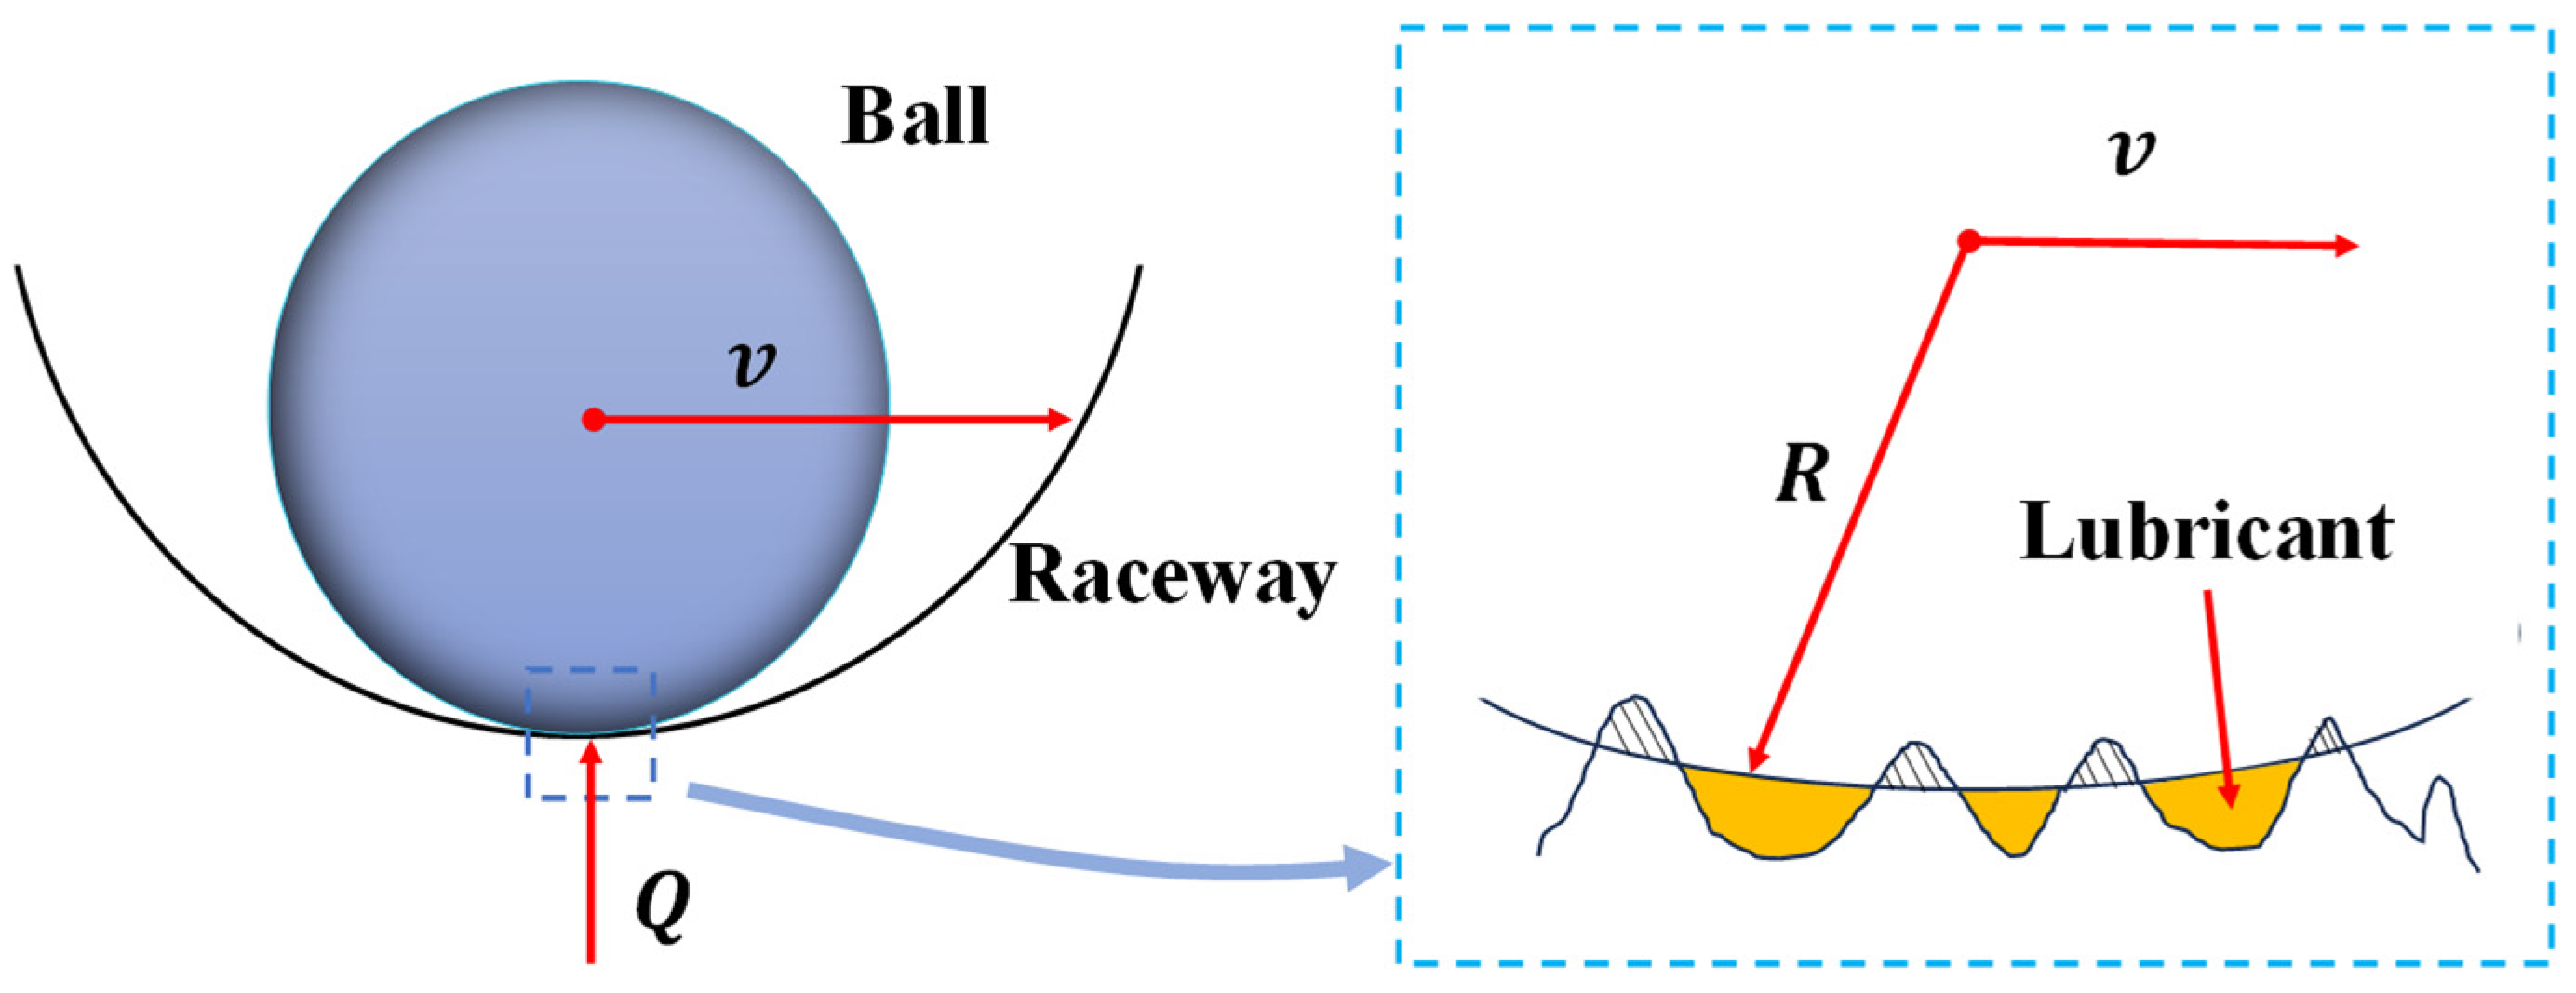
As shown in Figure 3, because the contact surfaces of both the raceway and the ball are rough, the contact micro-region can be divided into an asperity contact region and an elastohydrodynamic lubrication contact region [18]. In elastohydrodynamic lubrication analysis, the film thickness ratio is commonly used to identify the lubrication regime and can be expressed as:
where is the root-mean-square deviations of the rough surface profiles of the contact pair. When , the contact micro-region is in the boundary lubrication regime, in which the friction coefficient is mainly governed by asperity contact friction. When , the contact operates under mixed lubrication, and the friction coefficient consists of both asperity contact friction and oil-film shear friction. When , full-film elastohydrodynamic lubrication is achieved, and the friction coefficient is mainly governed by oil-film shear friction [13]. As the oil-film thickness increases, the proportion of asperity contact decreases and the oil-film shear effect becomes stronger. Accordingly, an oil-film shear contribution coefficient is introduced in this study:
where is the critical film thickness ratio, is the reference contact pressure, is the film-thickness-ratio sharing exponent, and is the pressure-sharing exponent. Therefore, the oil-film shear friction force in the contact region is given by:
Figure 3.
Distribution of contact zones between the oil film and surface asperities.
2.4. Calculation of the Friction Force of the Primary Contact Pair
The primary contact pair is the main load-carrying contact pair in the four-point contact structure. Its motion state is dominated by rolling with a small amount of sliding, which is similar to that of the contact pair in a conventional two-point contact ball screw. Therefore, its friction mechanisms are also relatively similar.
2.4.1. Calculation of Elastic Hysteresis Friction Force
When the ball moves along the nut and screw raceways, although the primary contact region is dominated by rolling, the contact materials frequently undergo cyclic loading deformation and unloading recovery under alternating compressive loads. For an ideal perfectly elastic material, the stress–strain processes on the inlet and outlet sides of the contact region are fully reversible, and the contact pressure distribution is symmetric about the contact center. In this case, elastic deformation and deformation recovery do not themselves cause energy loss. However, the actual materials of the ball screw exhibit partially irreversible plastic deformation, leading to elastic hysteresis. The material elements are gradually compressed and deformed as they enter the contact region and are gradually unloaded and recovered as they leave the contact region, while the loading and unloading curves do not completely coincide. The resulting strain energy loss is manifested as a resistance in the rolling direction, namely the elastic hysteresis rolling friction force [19].
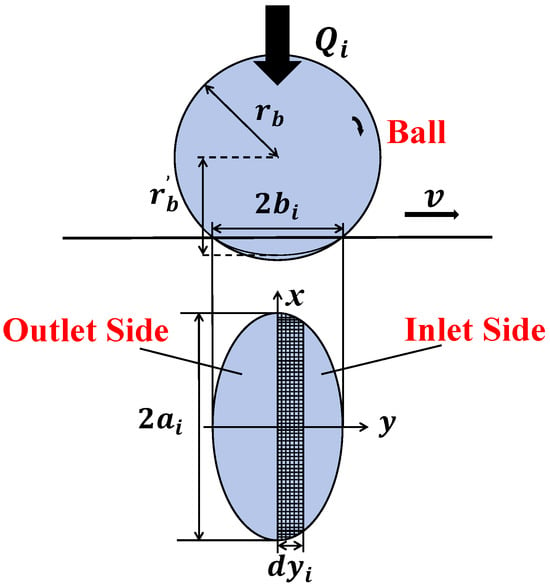
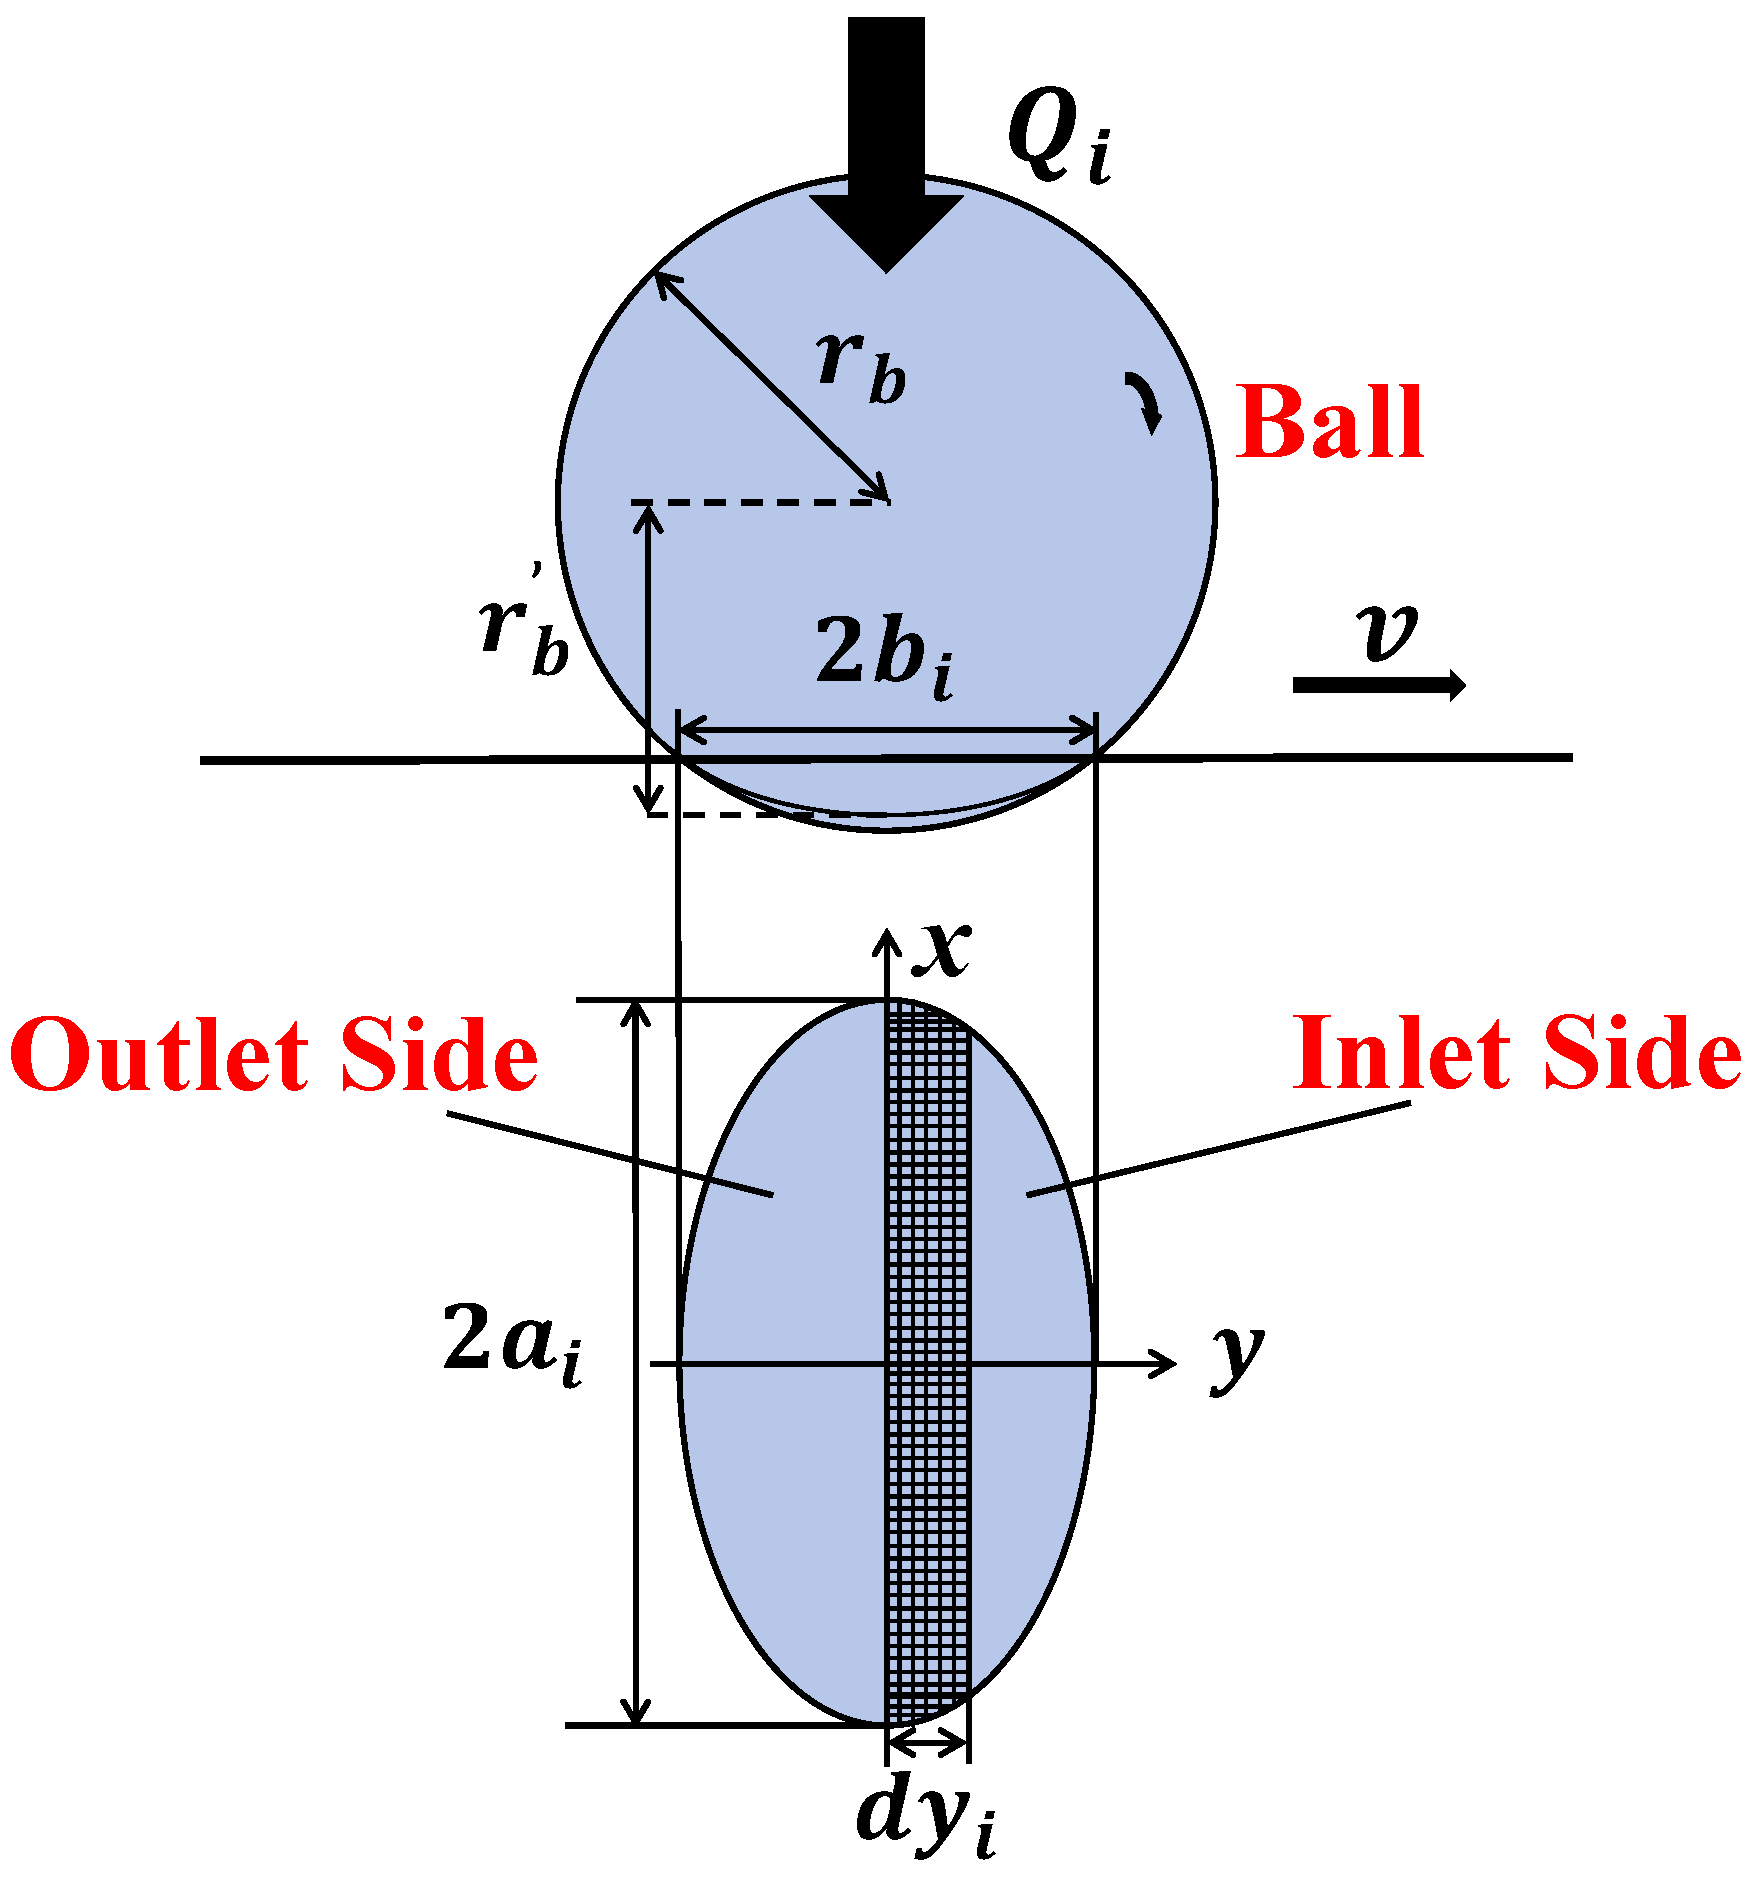
Figure 4 shows the Hertzian contact ellipse in the rolling direction between a single ball and the raceway under the normal contact force Q. The normal pressure distribution can be expressed as:
Figure 4.
Stress variation on the contact ellipse surface.
Equation (25) indicates that the pressure in the primary contact region is continuously distributed over the elliptical area, with the maximum pressure occurring at the center and zero pressure at the boundary. When the ball rolls along the raceway, the material at the leading edge of the contact region gradually enters a compressed state and undergoes deformation, whereas the material at the trailing edge gradually recovers. Owing to the hysteresis between the loading and unloading processes of the actual material, the equivalent center of action of the contact pressure undergoes a slight shift relative to the geometric contact center, thereby forming an equivalent rolling resistance moment that impedes the rolling motion of the ball. This moment can be expressed as:
where is the elastic hysteresis friction loss factor, taken as 0.0078 [20], and is the effective rolling radius of the ball after contact deformation. By substituting Equation (25) into Equation (26) and integrating over the contact elliptical area, the elastic hysteresis friction force is obtained as:
The above equation shows that the elastic hysteresis friction force is related to the normal load Q and the semi-minor axis b of the contact ellipse, but it is not directly related to rotational speed. Therefore, once the geometric dimensions and preload state are determined, this term mainly reflects the effects of preload and contact deformation on the rolling friction of the primary contact pair.
2.4.2. Calculation of Differential Microslip Friction Force
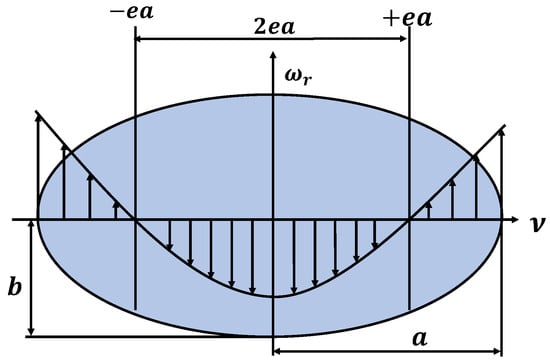
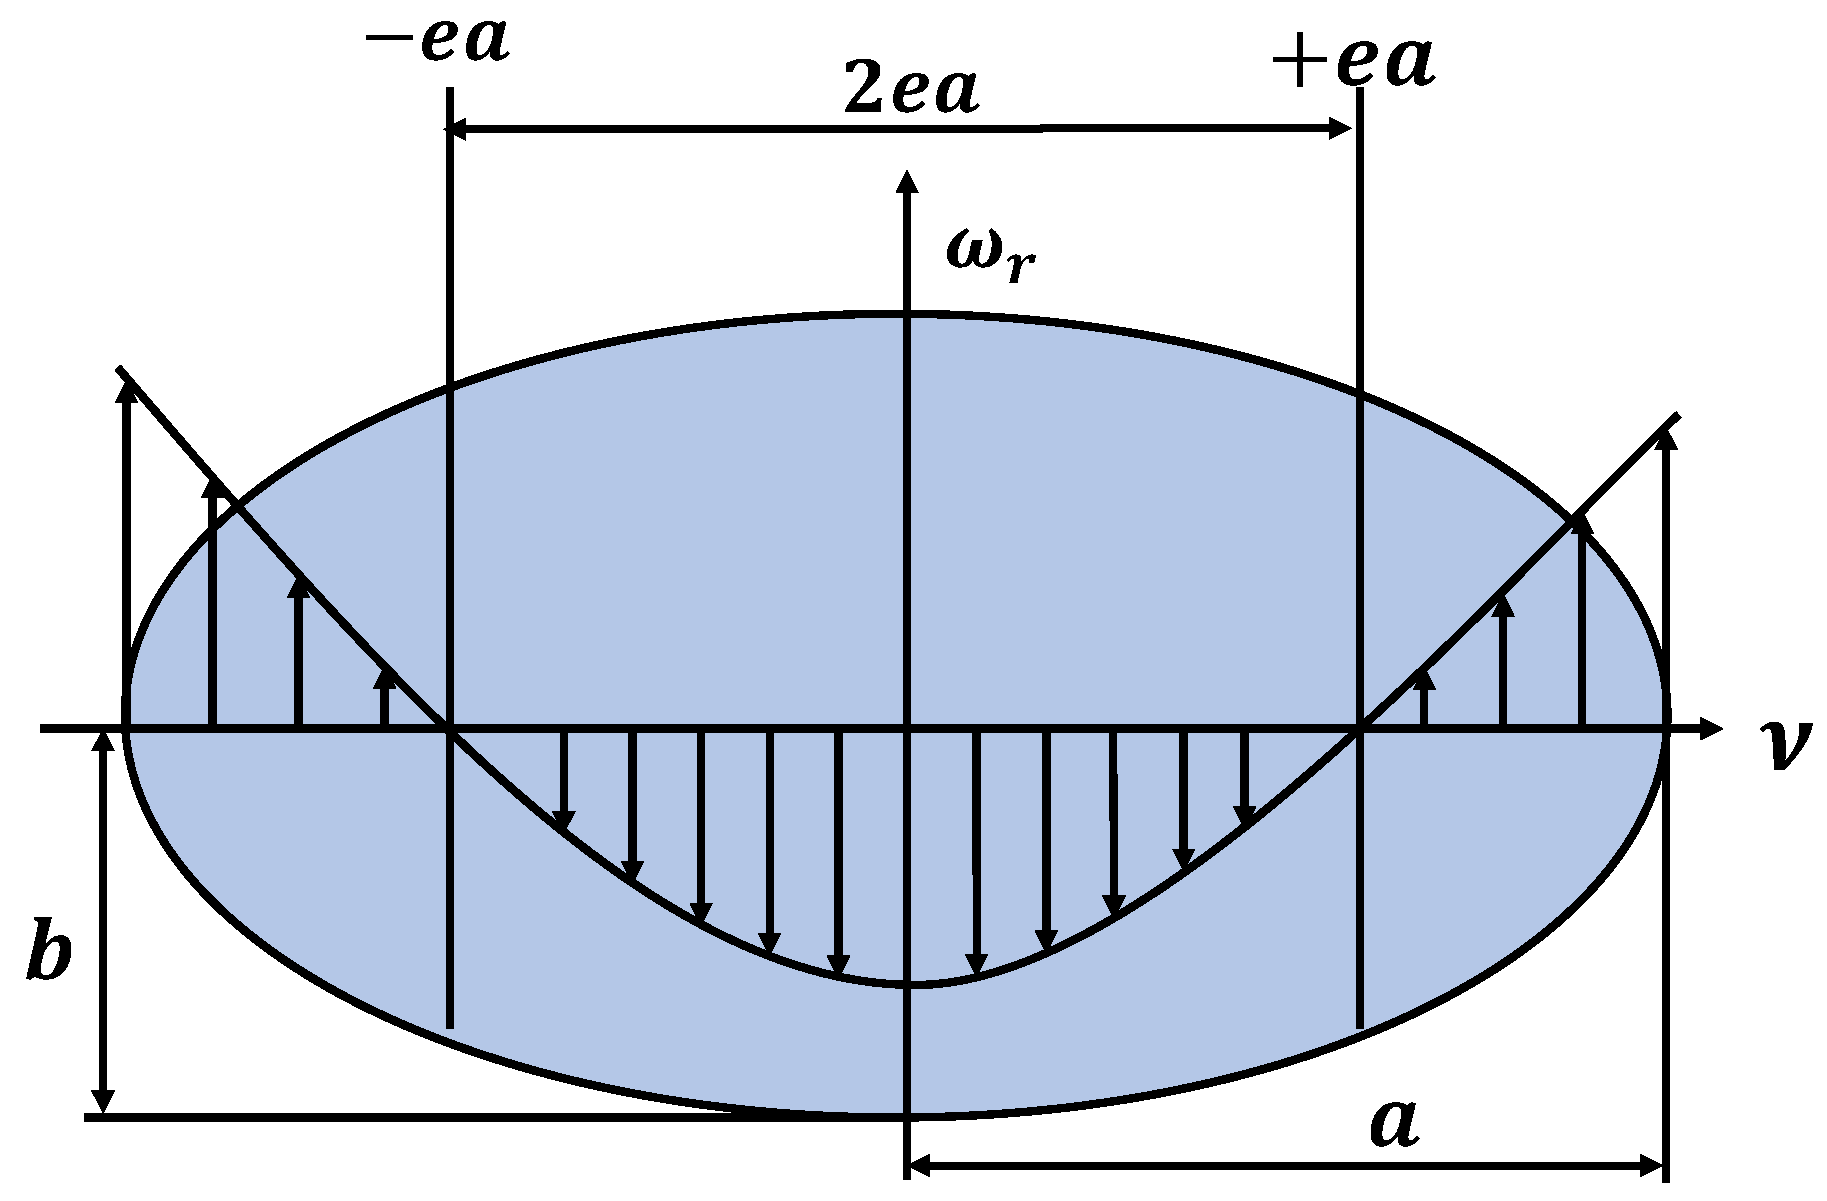
According to Hertz contact theory, during the operation of a ball screw, the contact region between the ball and the raceway is not an ideal point contact but a Hertzian elliptical contact region with a finite size. As shown in Figure 5, the velocities at different positions within the contact region are not completely identical. Along the rolling direction, pure rolling occurs only at on both sides of the spin axis, whereas local relative sliding of different magnitudes occurs in the remaining regions. This type of sliding is caused by the non-uniform velocity distribution within the rolling contact region and is therefore a differential sliding phenomenon under rolling contact.
Figure 5.
Differential microslip motion within the contact ellipse.
The normal pressure distribution within the contact ellipse is given by Equation (28). When a point in the contact region deviates from the pure rolling point, local relative sliding occurs at that point owing to the velocity difference between the ball surface and the raceway surface, thereby generating microslip shear stress, which can be expressed as:
where is the differential microslip friction coefficient, taken as 0.10 [7]. By integrating over the Hertzian contact elliptical area, the differential microslip friction force of a single ball can be obtained as:
where the position parameter e can be expressed as:
2.4.3. Calculation of the Total Friction Force of the Primary Contact Pair
According to Section 2.3, the oil-film shear friction force of the primary contact pair is:
In summary, the friction force of the primary contact pair consists of the elastic hysteresis friction force, differential microslip friction force, and oil-film shear friction force. Therefore, the total friction force of the primary contact pair can be expressed as:
2.5. Calculation of the Friction Force of the Secondary Contact Pair
The secondary contact pair is an additional contact pair formed under preload conditions achieved by increasing the ball diameter. Compared with the primary contact pair, the secondary contact point is not the main rolling load-carrying point, and its position is approximately located near the spin axis of the ball. Therefore, the contribution of ball spin to the tangential velocity at this point is extremely small. As a result, pronounced relative sliding exists between the ball and the raceway at the secondary contact point. Based on this motion characteristic, the friction force of the secondary contact pair is decomposed into the equivalent sliding friction force under lubricated contact conditions and the oil-film shear friction force.
The sliding friction force is described using a Coulomb-type expression under lubricated contact conditions:
where is the sliding friction coefficient, taken as 0.033 [19]. For the secondary contact pair, as the ball diameter increment increases, the normal compressive deformation becomes larger and the contact load Q increases accordingly [21]. Consequently, the real contact area involved in boundary shear and asperity contact at the interface increases, thereby increasing the sliding friction force.
According to Section 2.3, the oil-film shear friction force of the secondary contact pair is:
In summary, the friction force of the secondary contact pair consists of the sliding friction force and the oil-film shear friction force. Therefore, the total friction force of the secondary contact pair can be expressed as:
2.6. Calculation Method for the Total Friction Torque
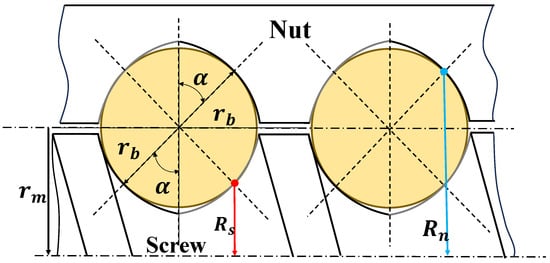
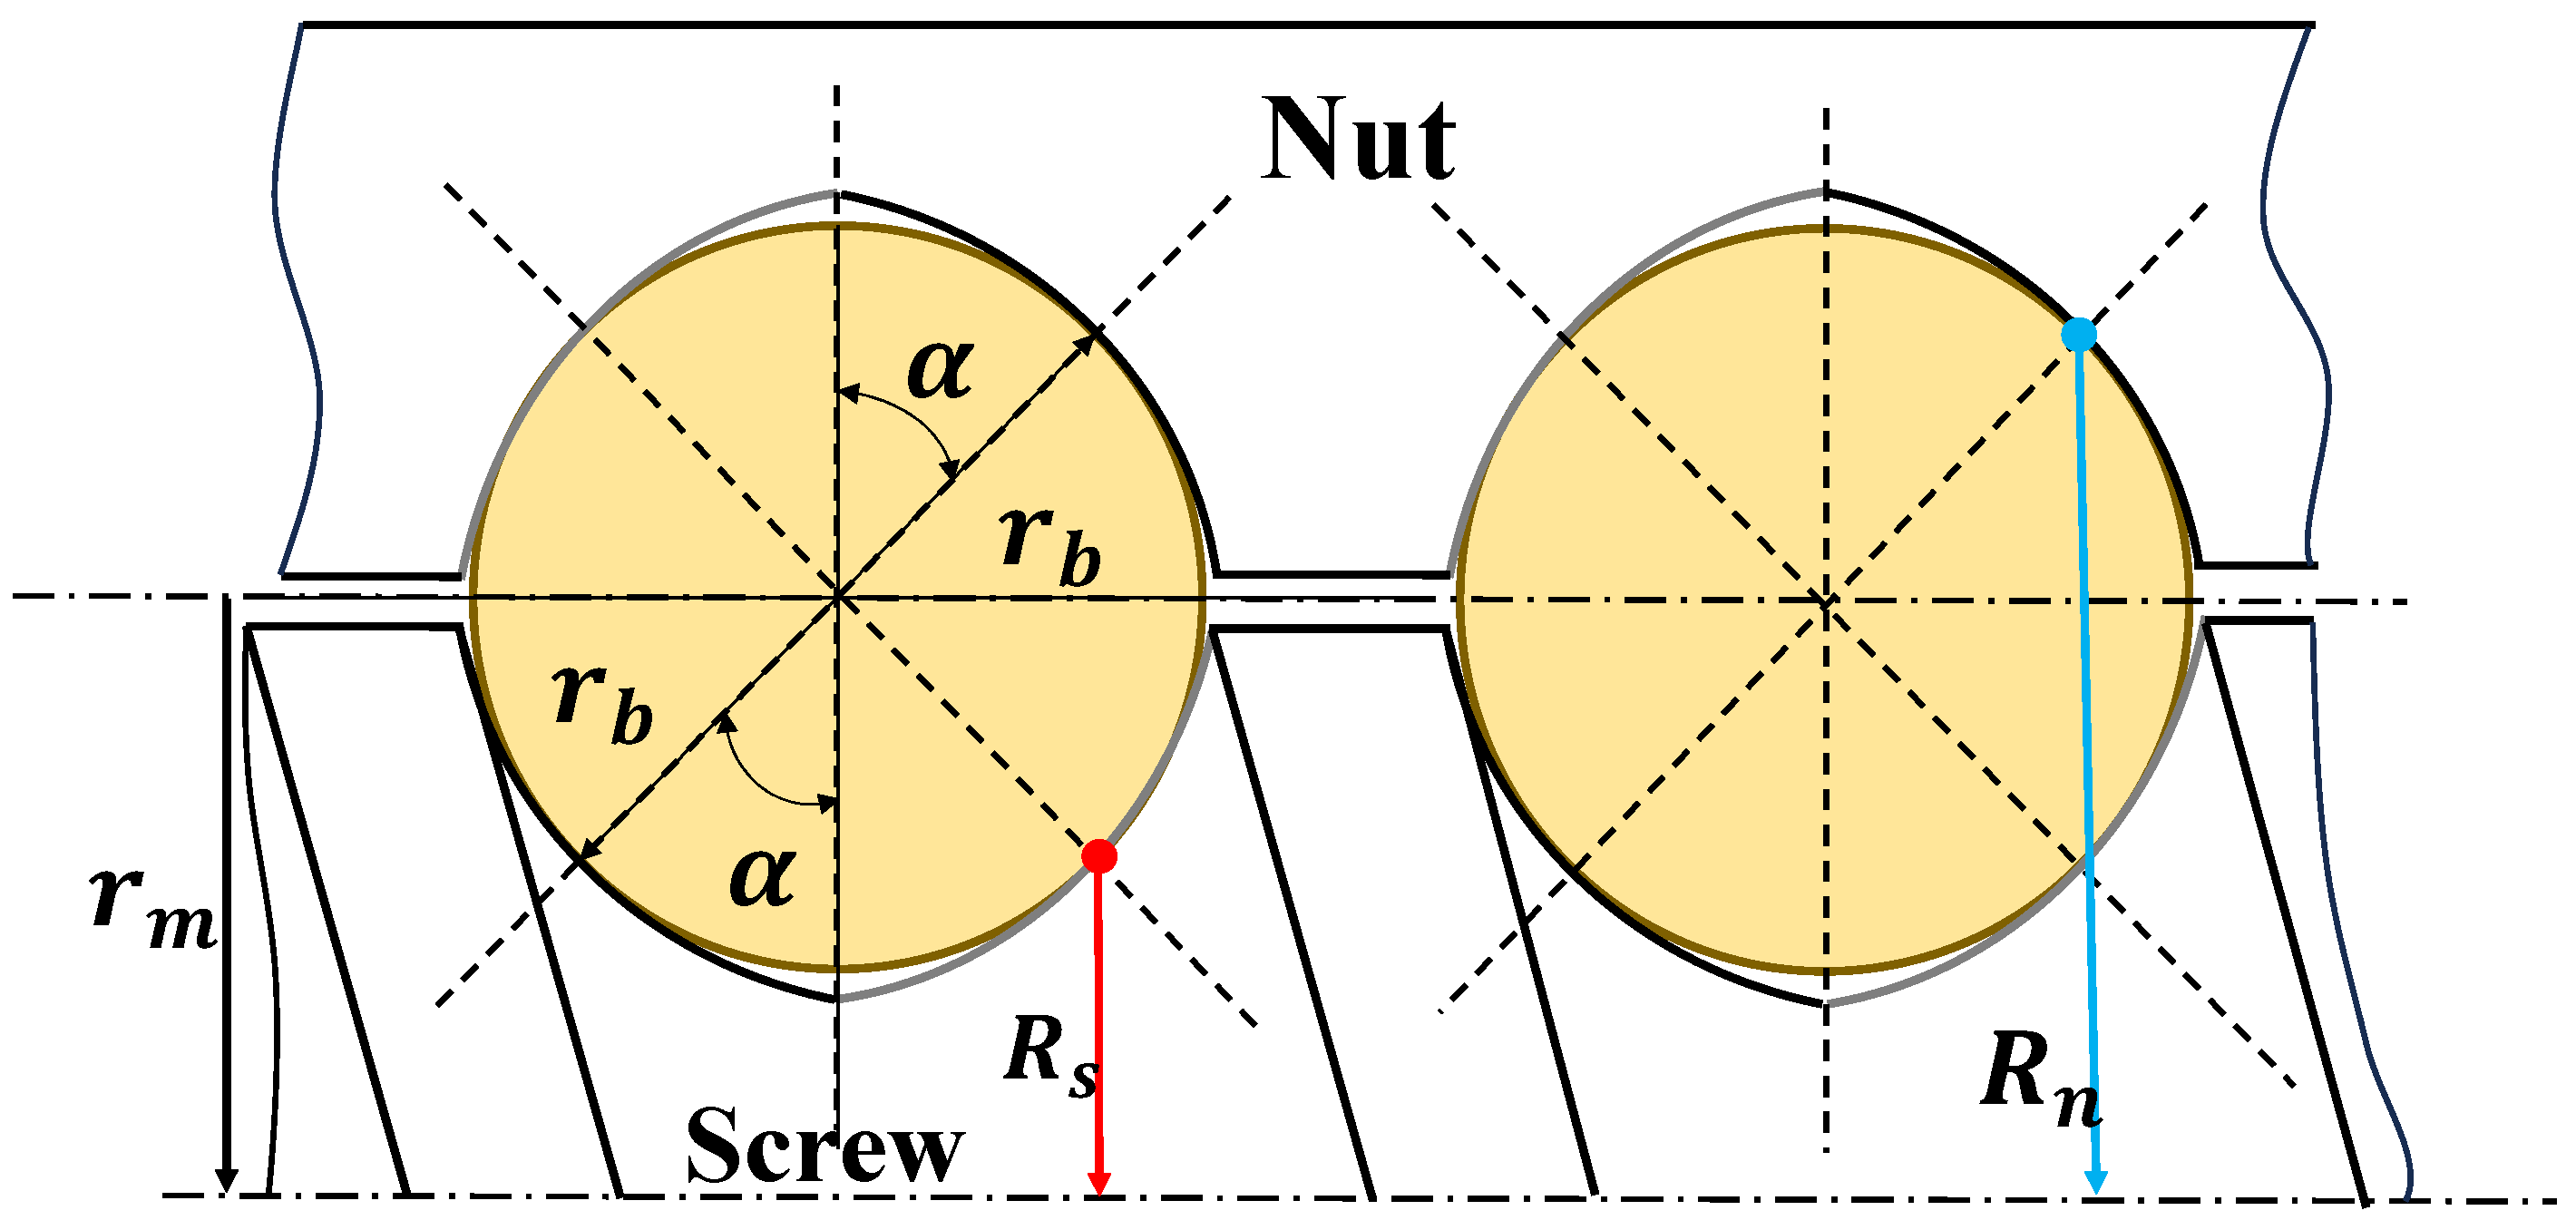
After the friction forces of the primary and secondary contact pairs are analyzed, the friction forces at each contact point are equivalently transformed to the screw axis direction, thereby establishing the total friction torque calculation model for the four-point contact ball screw. As shown in Figure 6, the equivalent moment arms from the screw-side and nut-side contact points to the screw axis are respectively given by:
Figure 6.
Schematic diagram of the equivalent torque of the friction arm.
Based on the above analysis of the elastic hysteresis friction force and oil-film shear friction force of the primary contact pair, the friction torque of the primary contact pair is:
Similarly, the friction force of the secondary contact pair consists of the sliding friction force and oil-film shear friction force, and the friction torque of the secondary contact pair is:
Therefore, the total friction torque of the four-point contact ball screw preloaded by increasing the ball diameter can be expressed as:
Table 1 summarizes the important parameters used in the calculations of the proposed model. Parameters such as surface roughness, the pressure–viscosity coefficient, limiting shear stress, and friction coefficients were determined based on literature data and material properties. The parameters , , , and in the oil-film shear contribution coefficient introduced in this study were fitted using the model-calibration experimental datasets. Given the significant differences in the preload forces corresponding to different ball diameter increments, experimental datasets for three ball diameter increments—representing low, medium, and high preload states within the test condition range—were selected as the model calibration set. During calibration, the functional form was kept constant, and only the aforementioned four parameters were fitted. The fitting criterion was to minimize the MAPE between the theoretical and experimental friction torques within the calibration dataset. The fitted parameters are shown in Table 1.
Table 1.
Summary of calculation parameters.
3. Friction Torque Experiment of the Four-Point-Contact Ball Screw
3.1. Friction Torque Measurement System
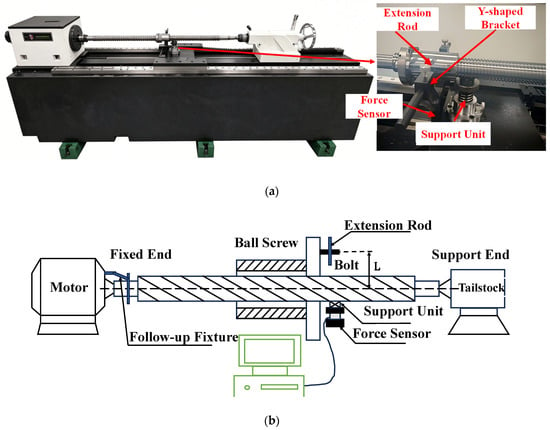
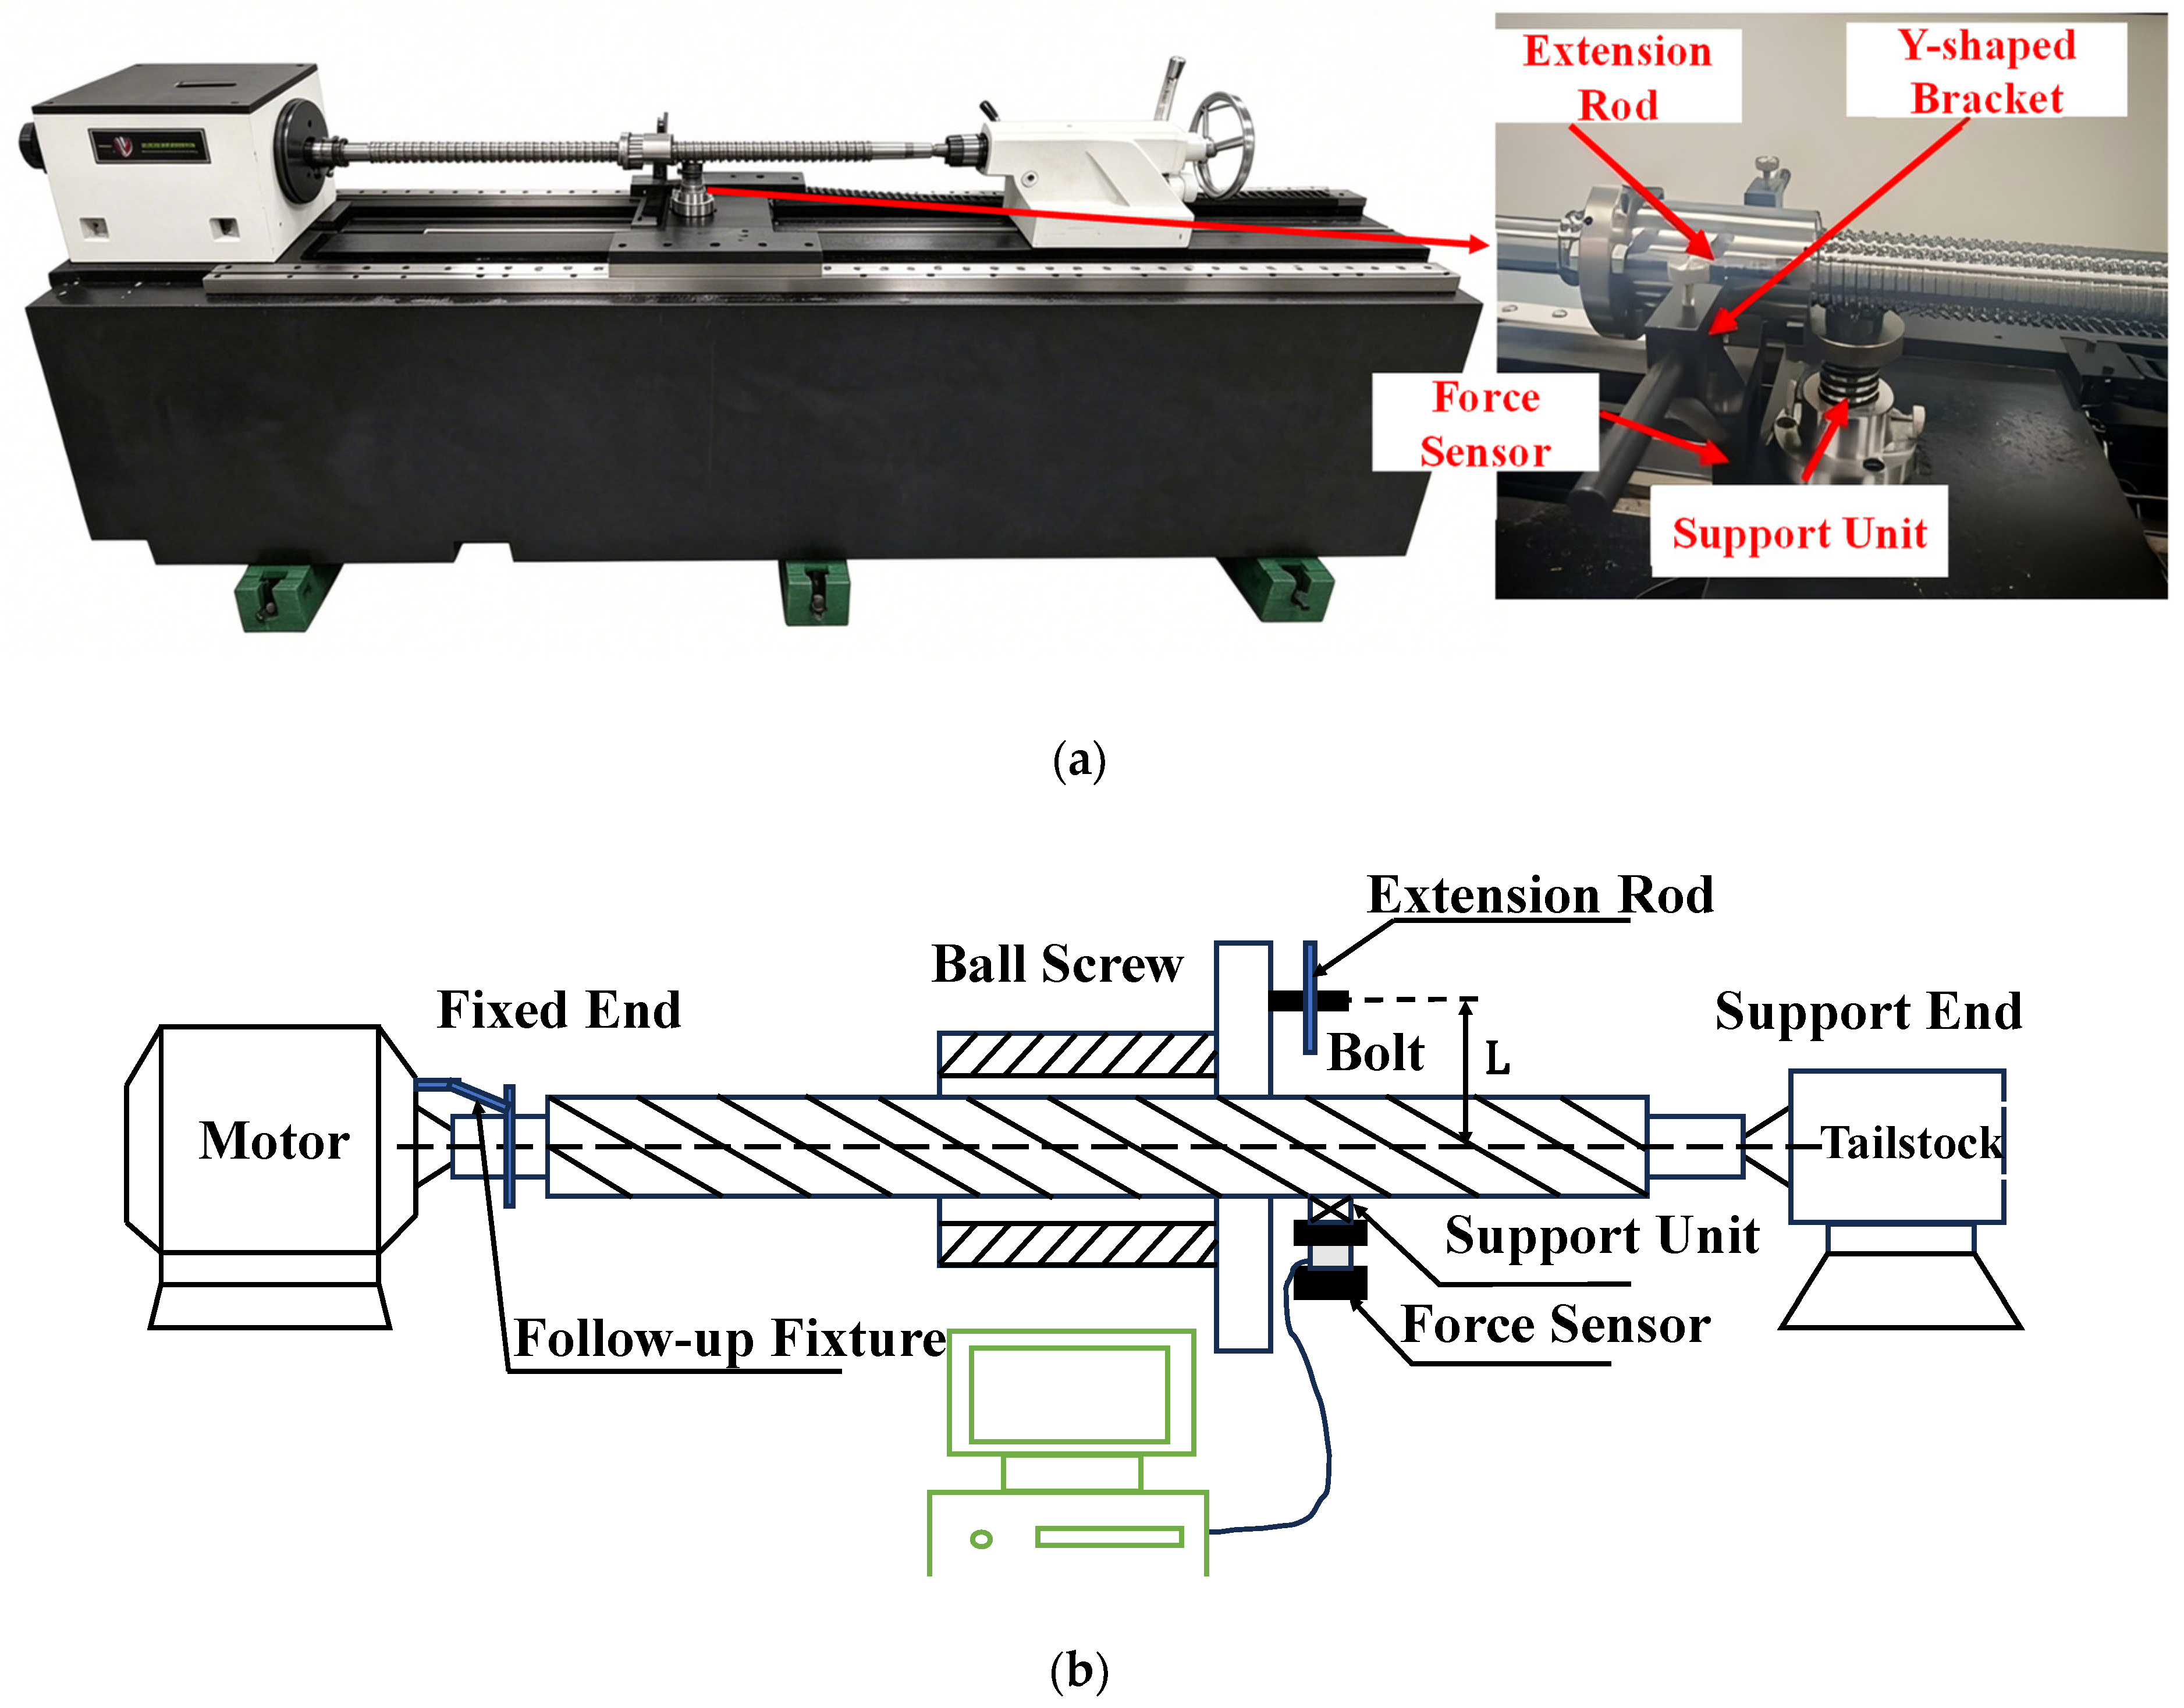
The experimental setup used for measuring the friction torque of the ball screw in this study is shown in Figure 7. One end of the ball screw is connected to a servo motor and fixed to the headstock support structure of the friction torque test bench, while the other end is supported by the tailstock center. A height-adjustable support unit is installed on the movable friction torque measurement platform. The top of the support unit is machined into a semi-cylindrical flange structure to engage with the raceway of the screw shaft, thereby ensuring stable loading conditions and accurate contact positioning during transmission. During the experiment, the servo motor drives the screw to rotate at a constant speed. The rotational motion of the nut is constrained because the bolt mounted on the pitch circle contacts the extension rod of the Y-shaped frame, and the nut consequently moves linearly in the axial direction. Under the constraint of the support unit, the worktable maintains a linear velocity exactly consistent with that of the nut. The preload torque of the ball screw is converted into the pressure exerted by the bolt on the extension rod when the rotational motion of the nut is constrained. The force is transmitted to the force sensor through the Y-shaped frame, and the value output by the sensor is multiplied by the perpendicular distance from the bolt center on the pitch circle to the screw axis, thereby accurately obtaining the no-load friction torque of the ball screw.
Figure 7.
Ball screw friction torque test rig. (a) Ball screw friction torque test system; (b) Schematic diagram of the test rig.
The sampling frequency of the data acquisition system in the friction torque test system was 1000 Hz. The lever arm length L used to calculate the friction torque was defined as the radius of the bolt-hole pitch circle on the flange surface of the ball screw nut. In this study, L = 41 mm. The force sensor used in the test rig was an HBM PW6D series single-point load cell, and its detailed specifications are listed in Table 2.
Table 2.
Specifications of the force sensor.
Before the friction torque tests, the force sensor was calibrated using standard weights. During calibration, the weights were placed vertically on the loading end of the sensor, and the force readings were checked for accuracy to verify the force-output relationship. After unloading, the sensor was reset to zero.
3.2. Experimental Method
The 4010 ball screw was selected as a representative test case for investigating the friction characteristics of a four-point-contact ball screw preloaded by increasing the ball diameter. The relevant parameters of the nut, screw, and balls are listed in Table 3. To ensure sufficient experimental data and to obtain the variation characteristics of friction torque under different preload states, the balls assembled in the experiment were based on the standard diameter of 6.350 mm. The ball diameter was increased by 1 μm for each replacement, with 20 replacements in total, until the diameter reached 6.370 mm. The test speed was increased from 10 r/min to 500 r/min. Oil lubrication was adopted, and Mobil VG100, a lubricant commonly used in ball screw testing, was selected. The lubricant parameters are listed in Table 4. The experiments were conducted in a temperature-controlled laboratory with the temperature maintained at 20 °C 1 °C. Strict temperature control was applied to minimize the influence of ambient temperature fluctuations on the testing process and results.
Table 3.
Parameter values of the 4010 ball screw.
Table 4.
Lubricant parameters.
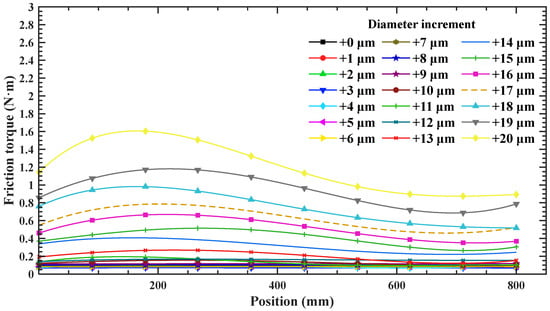
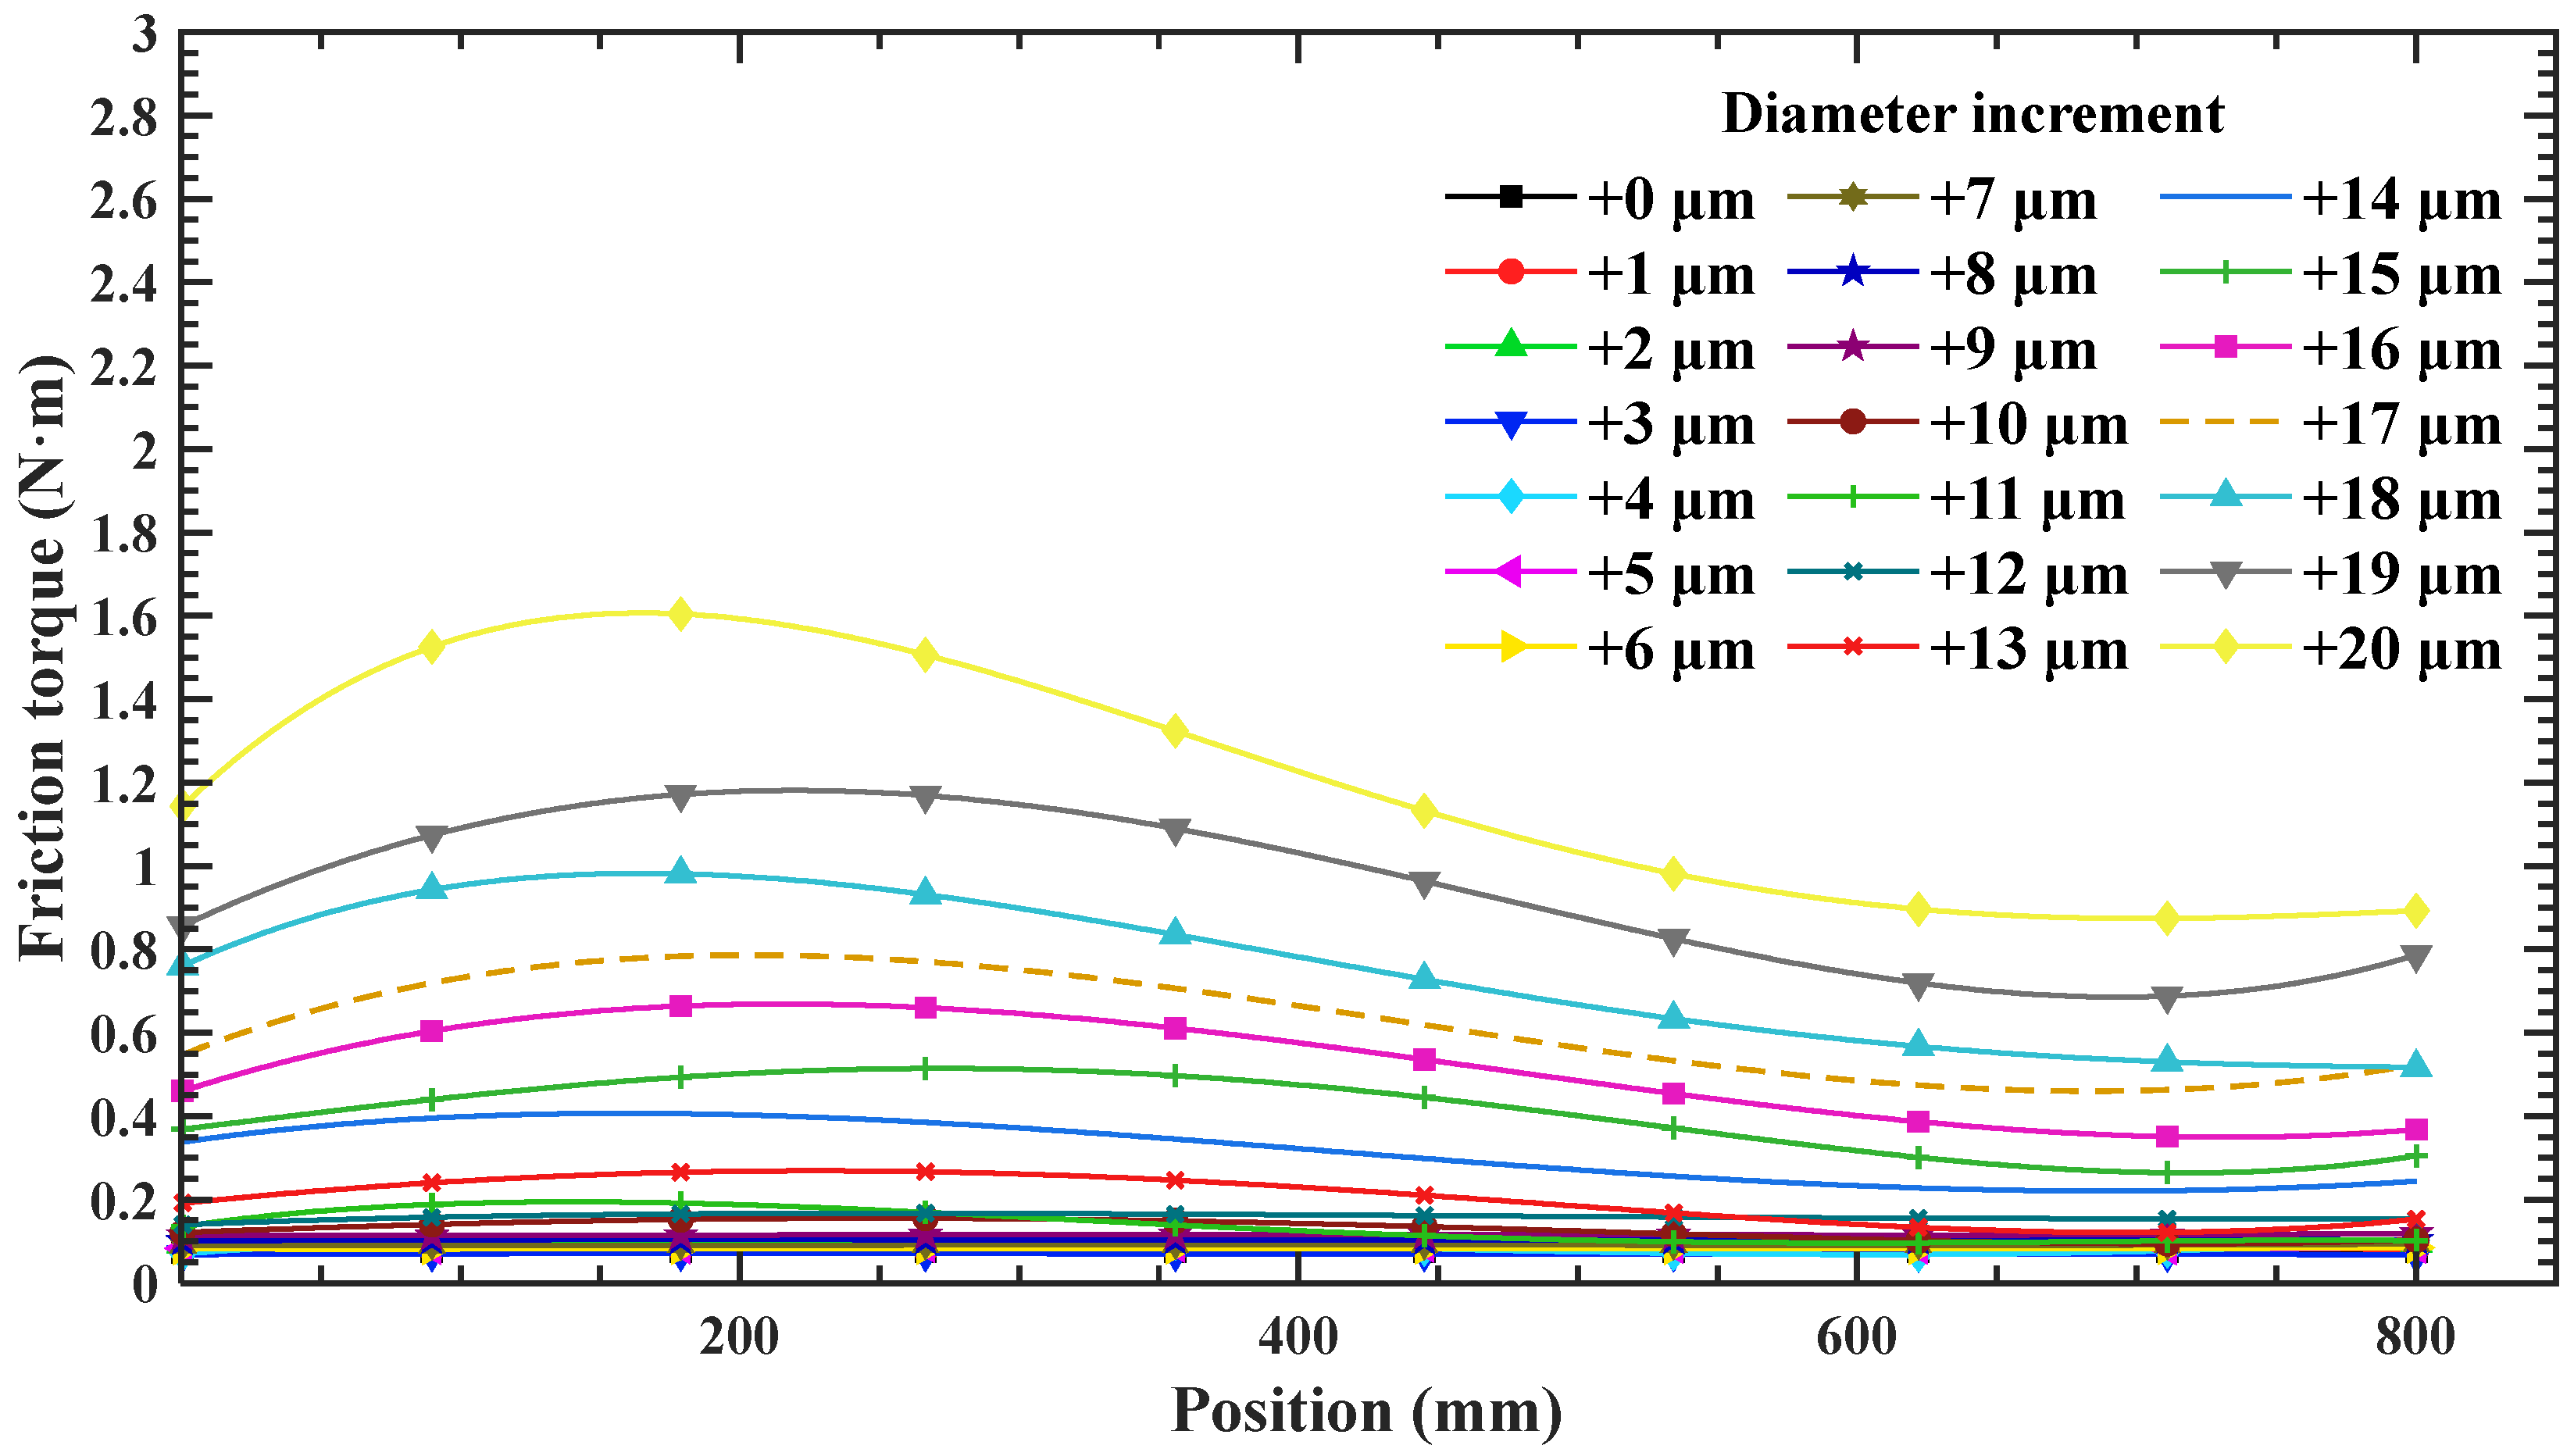
To preliminarily identify the onset of stable four-point contact, pre-tests were conducted using balls with different diameter increments at a rotational speed of 150 r/min to observe the overall variation in friction torque with ball diameter increment. In this study, the change in friction torque was used as an indirect engineering criterion. When a sudden increase in friction torque was observed at a certain ball diameter increment, it indicated that the increment had overcome the combined effects of raceway machining errors, assembly errors, groove geometric deviations, and initial clearance, and had passed beyond the ineffective-increment range. Therefore, this phenomenon was used as an indirect criterion indicating that the system had reached a stable four-point-contact state. The experimental results are shown in Figure 8.
Figure 8.
Preliminary friction torque test results (150 r/min).
The experimental results show that when the ball diameter increment increases from 0 μm to 10 μm, the friction torque fluctuates within a range of 0.1 N·m, while the mean friction torque remains almost unchanged and the curves exhibit an excessively high degree of overlap. This is because, within this range, ineffective diameter increments are caused by raceway machining and assembly errors, groove geometric deviations, initial clearance, and other factors, and the screw does not truly reach the four-point contact state. Therefore, to ensure data rigor, μm is set in Equation (1), and the subsequent experiments analyze only the friction torque within the ball diameter increment range of 11 μm to 20 μm. To further clarify the actual preload level corresponding to each ball diameter increment, the ball diameter increment is converted into the equivalent axial preload force based on the Hertz contact load and its axial projection relationship, as shown in Table 5.
Table 5.
Converted equivalent axial preload forces corresponding to different ball-diameter increments.
As shown in Table 5, the equivalent axial preload force increases significantly with the ball diameter increment. Within the tested range, as the ball diameter increment increases from 11 μm to 20 μm, the equivalent axial preload force increases from 0.17 kN to 5.46 kN.
The final experimental operating conditions are listed in Table 6. Ball diameter increments of 12, 16, and 20 μm were selected as the model calibration set mentioned in Section 2.3, while the remaining seven increments (11, 13, 14, 15, 17, 18, 19 μm) were used as an internal validation set to verify the prediction accuracy of the calculation model under the working conditions defined in this paper.
Table 6.
Test operating conditions.
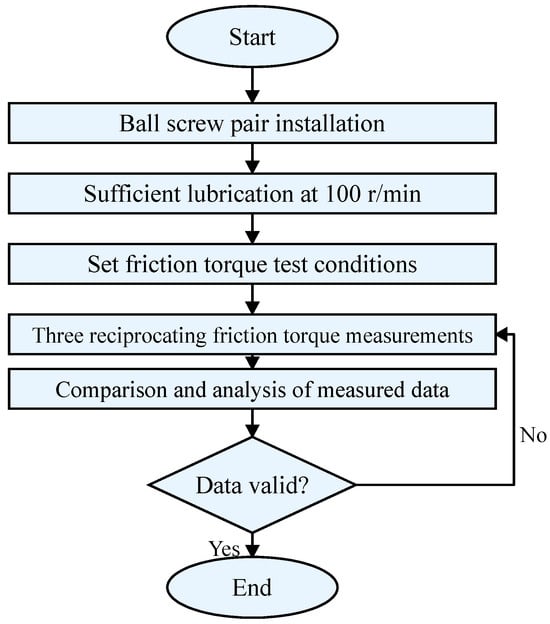
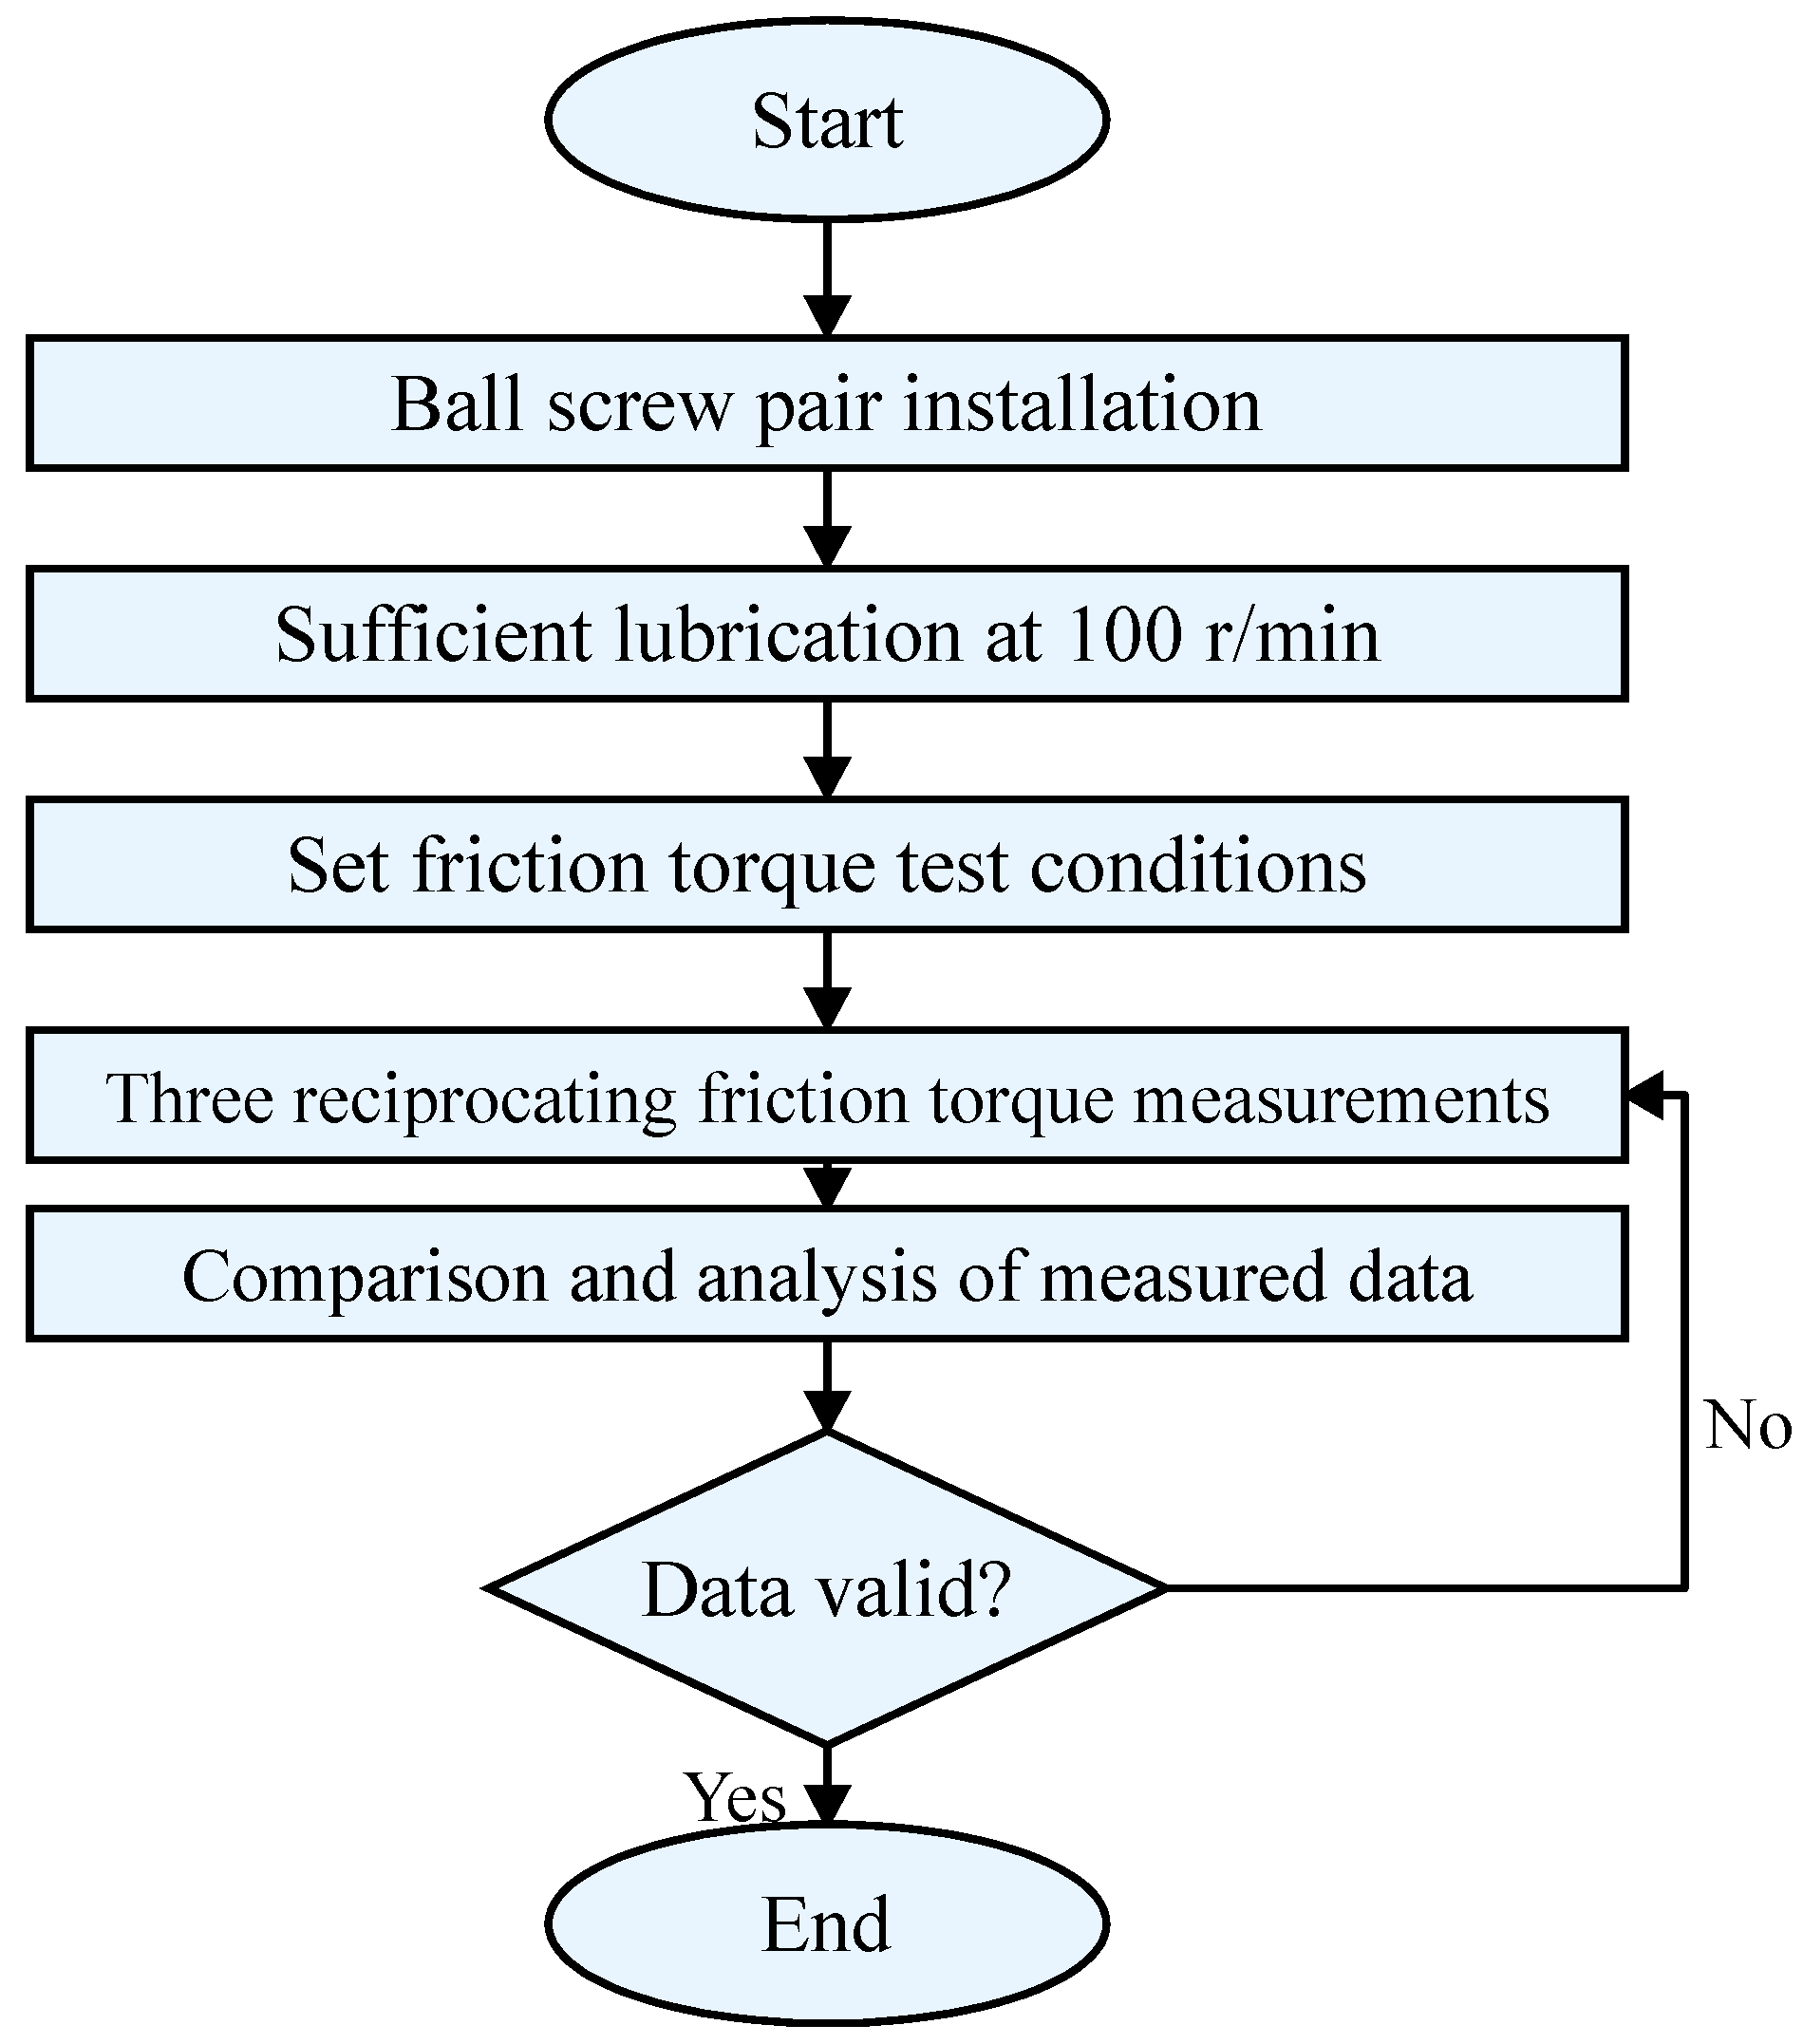
To minimize raceway wear during the experiment and ensure the accuracy of the measurement results, the balls were replaced and tested according to the principle of increasing diameter from the smallest to the largest during the assembly of balls with different specifications. After each ball replacement, the smooth and correct operation of the balls was ensured before proceeding to the next experimental step. The specific experimental procedure is shown in Figure 9. The 4010 ball screw used in this experiment has an effective stroke of 800 mm. Within the effective travel range, the variation in friction torque was measured and recorded accurately. For each operating condition, three replicate measurements were performed, and the consistency of the test data was evaluated using the sample standard deviation. In this study, a set of measurements was considered to have good repeatability if the sample standard deviation of the three results was less than 0.01 N·m. In that case, the arithmetic mean of the three measurements was taken as the final experimental value. When the sample standard deviation was equal to or greater than 0.01 N·m, the measurements were not directly averaged or accepted as the final result. The sensor zero, fixture installation, lubrication condition, and smooth operation of the ball screw were checked, and the test was repeated under the same operating condition. The arithmetic mean of the measurements was used as the final experimental value only when the sample standard deviation satisfied s < 0.01 N·m. All operating conditions retained in the final dataset met this criterion.
Figure 9.
Flow chart of the friction torque test.
The sample standard deviation is expressed as follows:
where is the friction torque measured in the i-th repeated test under the same operating condition, is the arithmetic mean of the three repeated measurements, and n is the number of repeated tests (n = 3 in this study). In this study, the sample standard deviations calculated from the three repeated measurements under all operating conditions ranged from 0.0014 to 0.0076 N·m, all of which were lower than the repeatability criterion of 0.01 N·m specified in this study. This confirms the good consistency of the repeated measurements under each operating condition and the reliability of the final experimental values.
4. Experimental Results and Analysis
4.1. Friction Torque Experimental Data
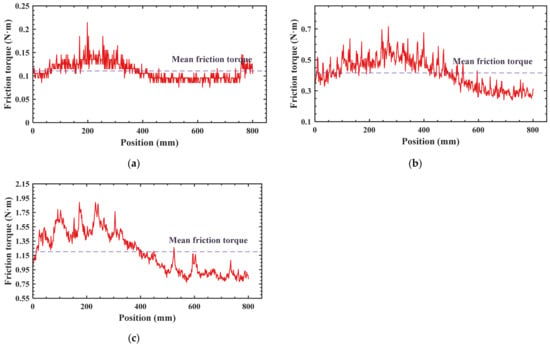
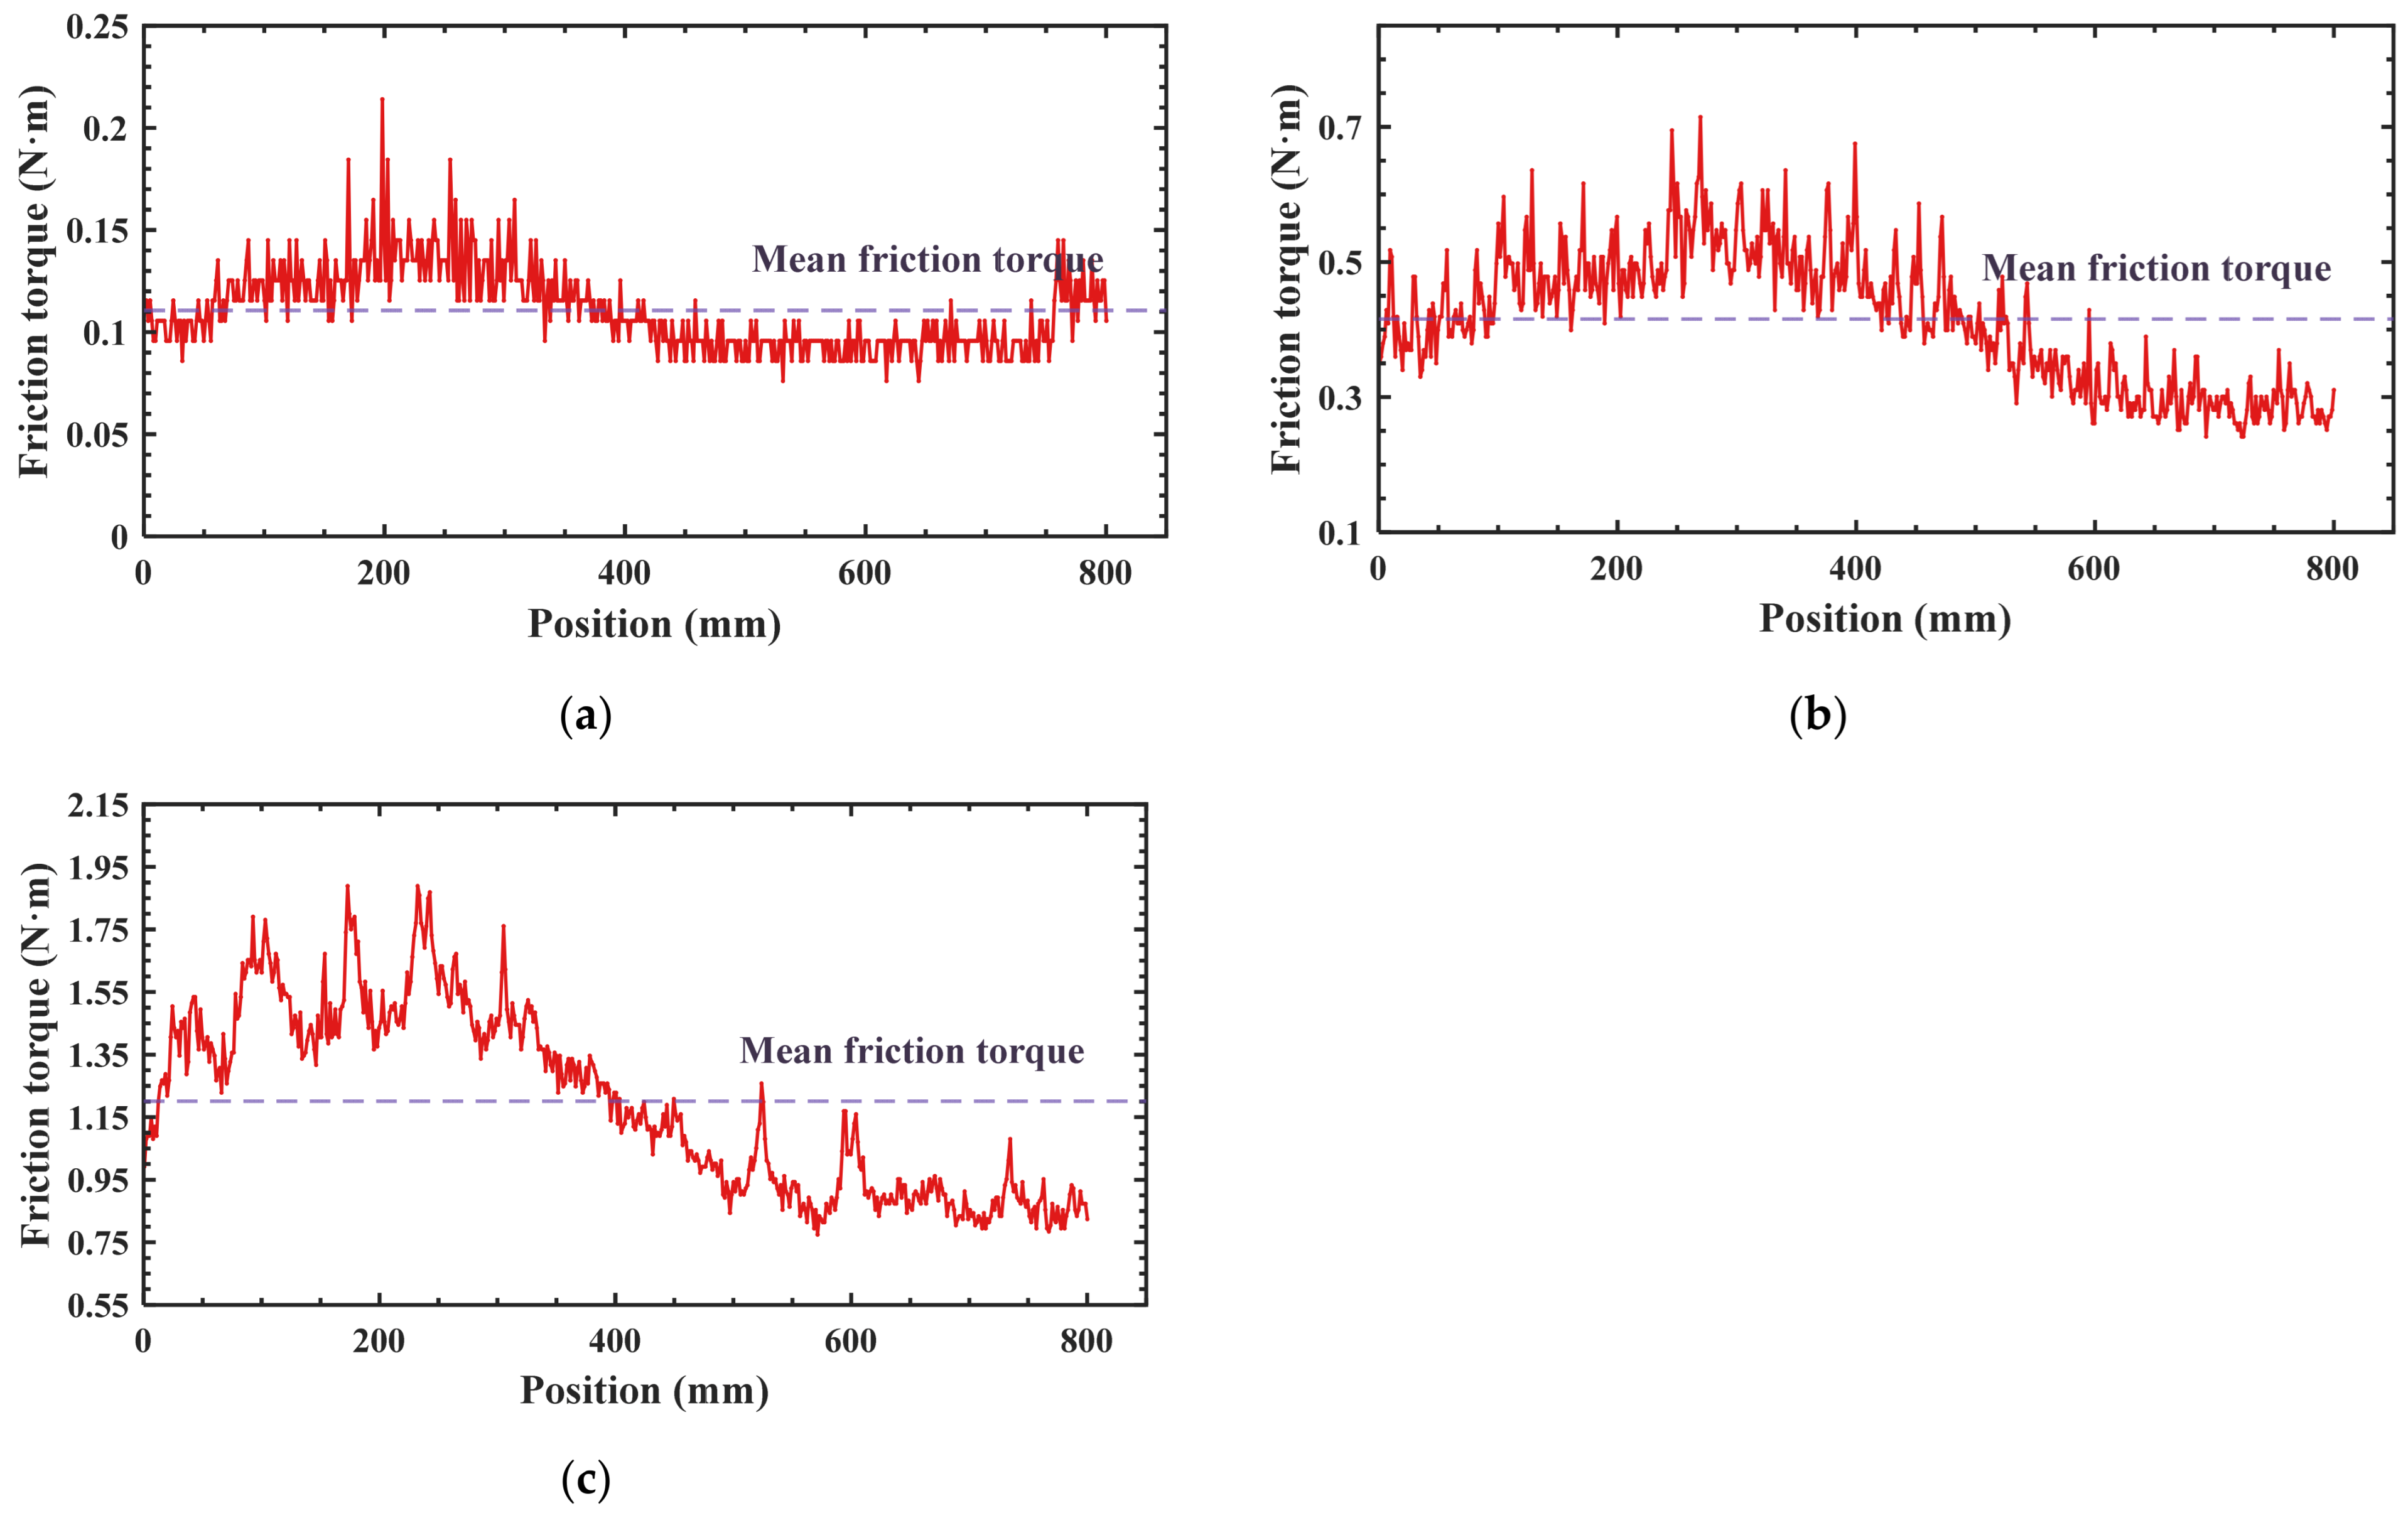
Figure 10 shows the mean values of the forward and reverse friction torque at each measurement position within the effective measurement stroke of 800 mm, as well as the overall mean friction torque, at a rotational speed of 50 r/min for ball diameter increments of 11 μm, 15 μm, and 20 μm. Owing to the inherent travel error of the ball screw, the measured friction torque varies at different positions under the same ball diameter increment. Therefore, in general, the friction torque of a ball screw is represented by the mean value of the friction torque in the forward and reverse strokes. The mean friction torque values corresponding to the three ball diameter increments in Figure 10 are 0.110 N·m, 0.416 N·m, and 1.201 N·m, respectively. It can be observed that the variation trends of friction torque with position are generally consistent under different ball diameter increments. Under the same ball diameter increment, the friction torque in the first half of the stroke is higher than the mean friction torque, whereas that in the second half of the stroke is lower than the mean friction torque. This phenomenon is attributed to the presence of a certain machining taper in the screw. In addition, as the ball diameter increment increases, the mean forward and reverse friction torque increases accordingly, and the friction torque curves become progressively clearer, indicating a reduction in fluctuation amplitude. This is because the increase in ball diameter produces a larger preload, which improves the overall stiffness of the ball screw and reduces friction-induced vibration.
Figure 10.
Friction torque test results for different ball diameter increments. (a) Test results at 11 μm diameter increment; (b) Test results at 15 μm diameter increment; (c) Test results at 20 μm diameter increment.
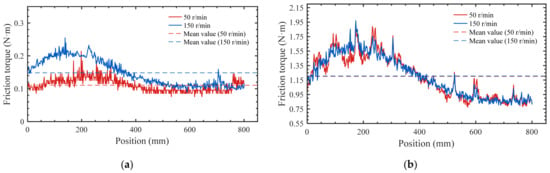
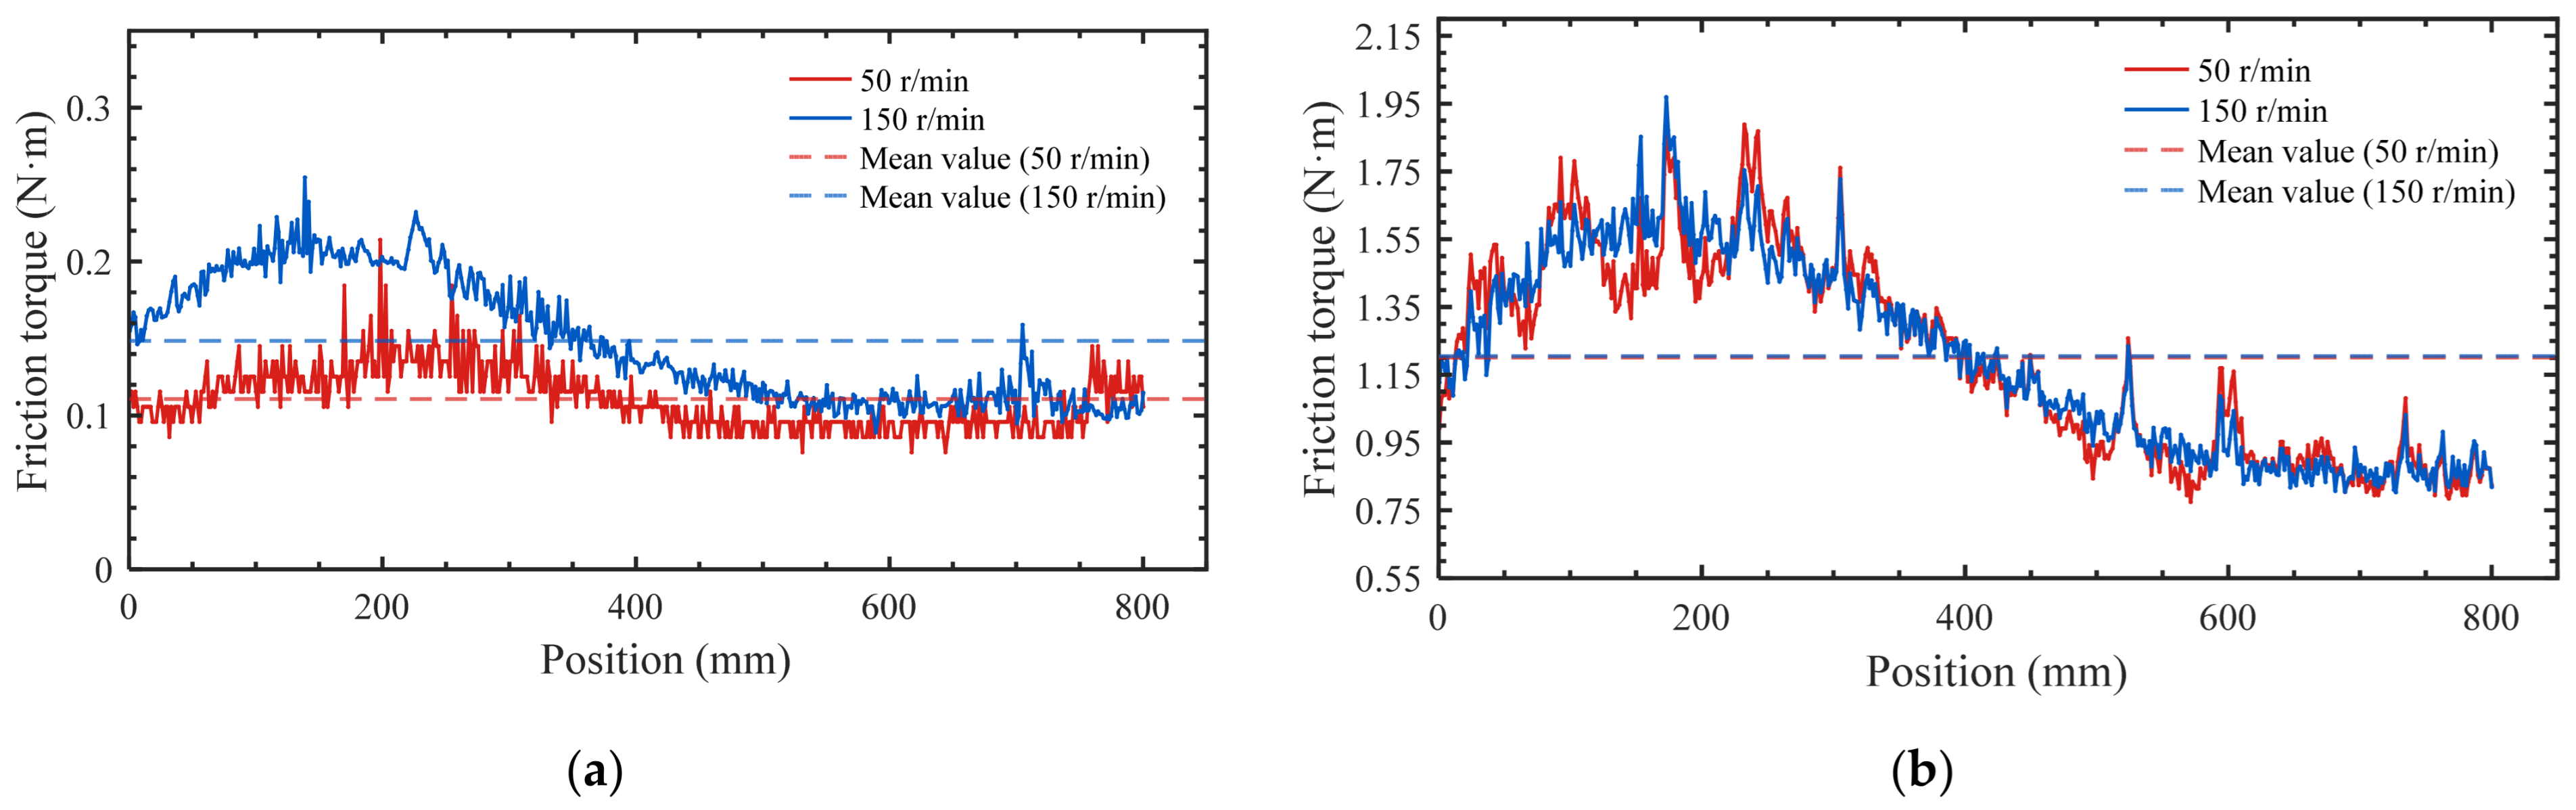
Figure 11 shows the mean forward and reverse friction torque and the mean friction torque within the effective measurement stroke of 800 mm at rotational speeds of 50 r/min and 150 r/min for ball diameter increments of 11 μm and 20 μm. As shown in the figure, when the ball diameter increment is 11 μm, corresponding to a low-preload condition, the mean friction torque increases from 0.110 N·m to 0.149 N·m as the rotational speed increases from 50 r/min to 150 r/min, and the overall forward and reverse friction torque curve shifts upward significantly. In contrast, under the high-preload condition with a ball diameter increment of 20 μm, the mean friction torque increases only from 1.201 N·m to 1.205 N·m, and the curves corresponding to the two rotational speeds exhibit a high degree of overlap. This indicates that the sensitivity of friction torque to rotational speed decreases under high preload and tends to become stable.
Figure 11.
Comparison of rotational speed sensitivity with different ball diameter increments. (a) Ball diameter increment of 11 μm; (b) Ball diameter increment of 20 μm.
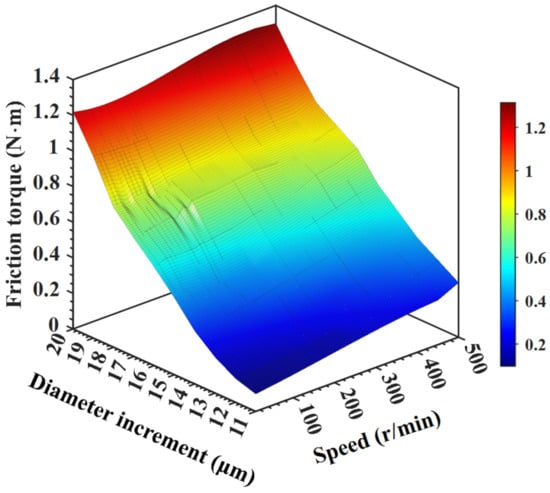
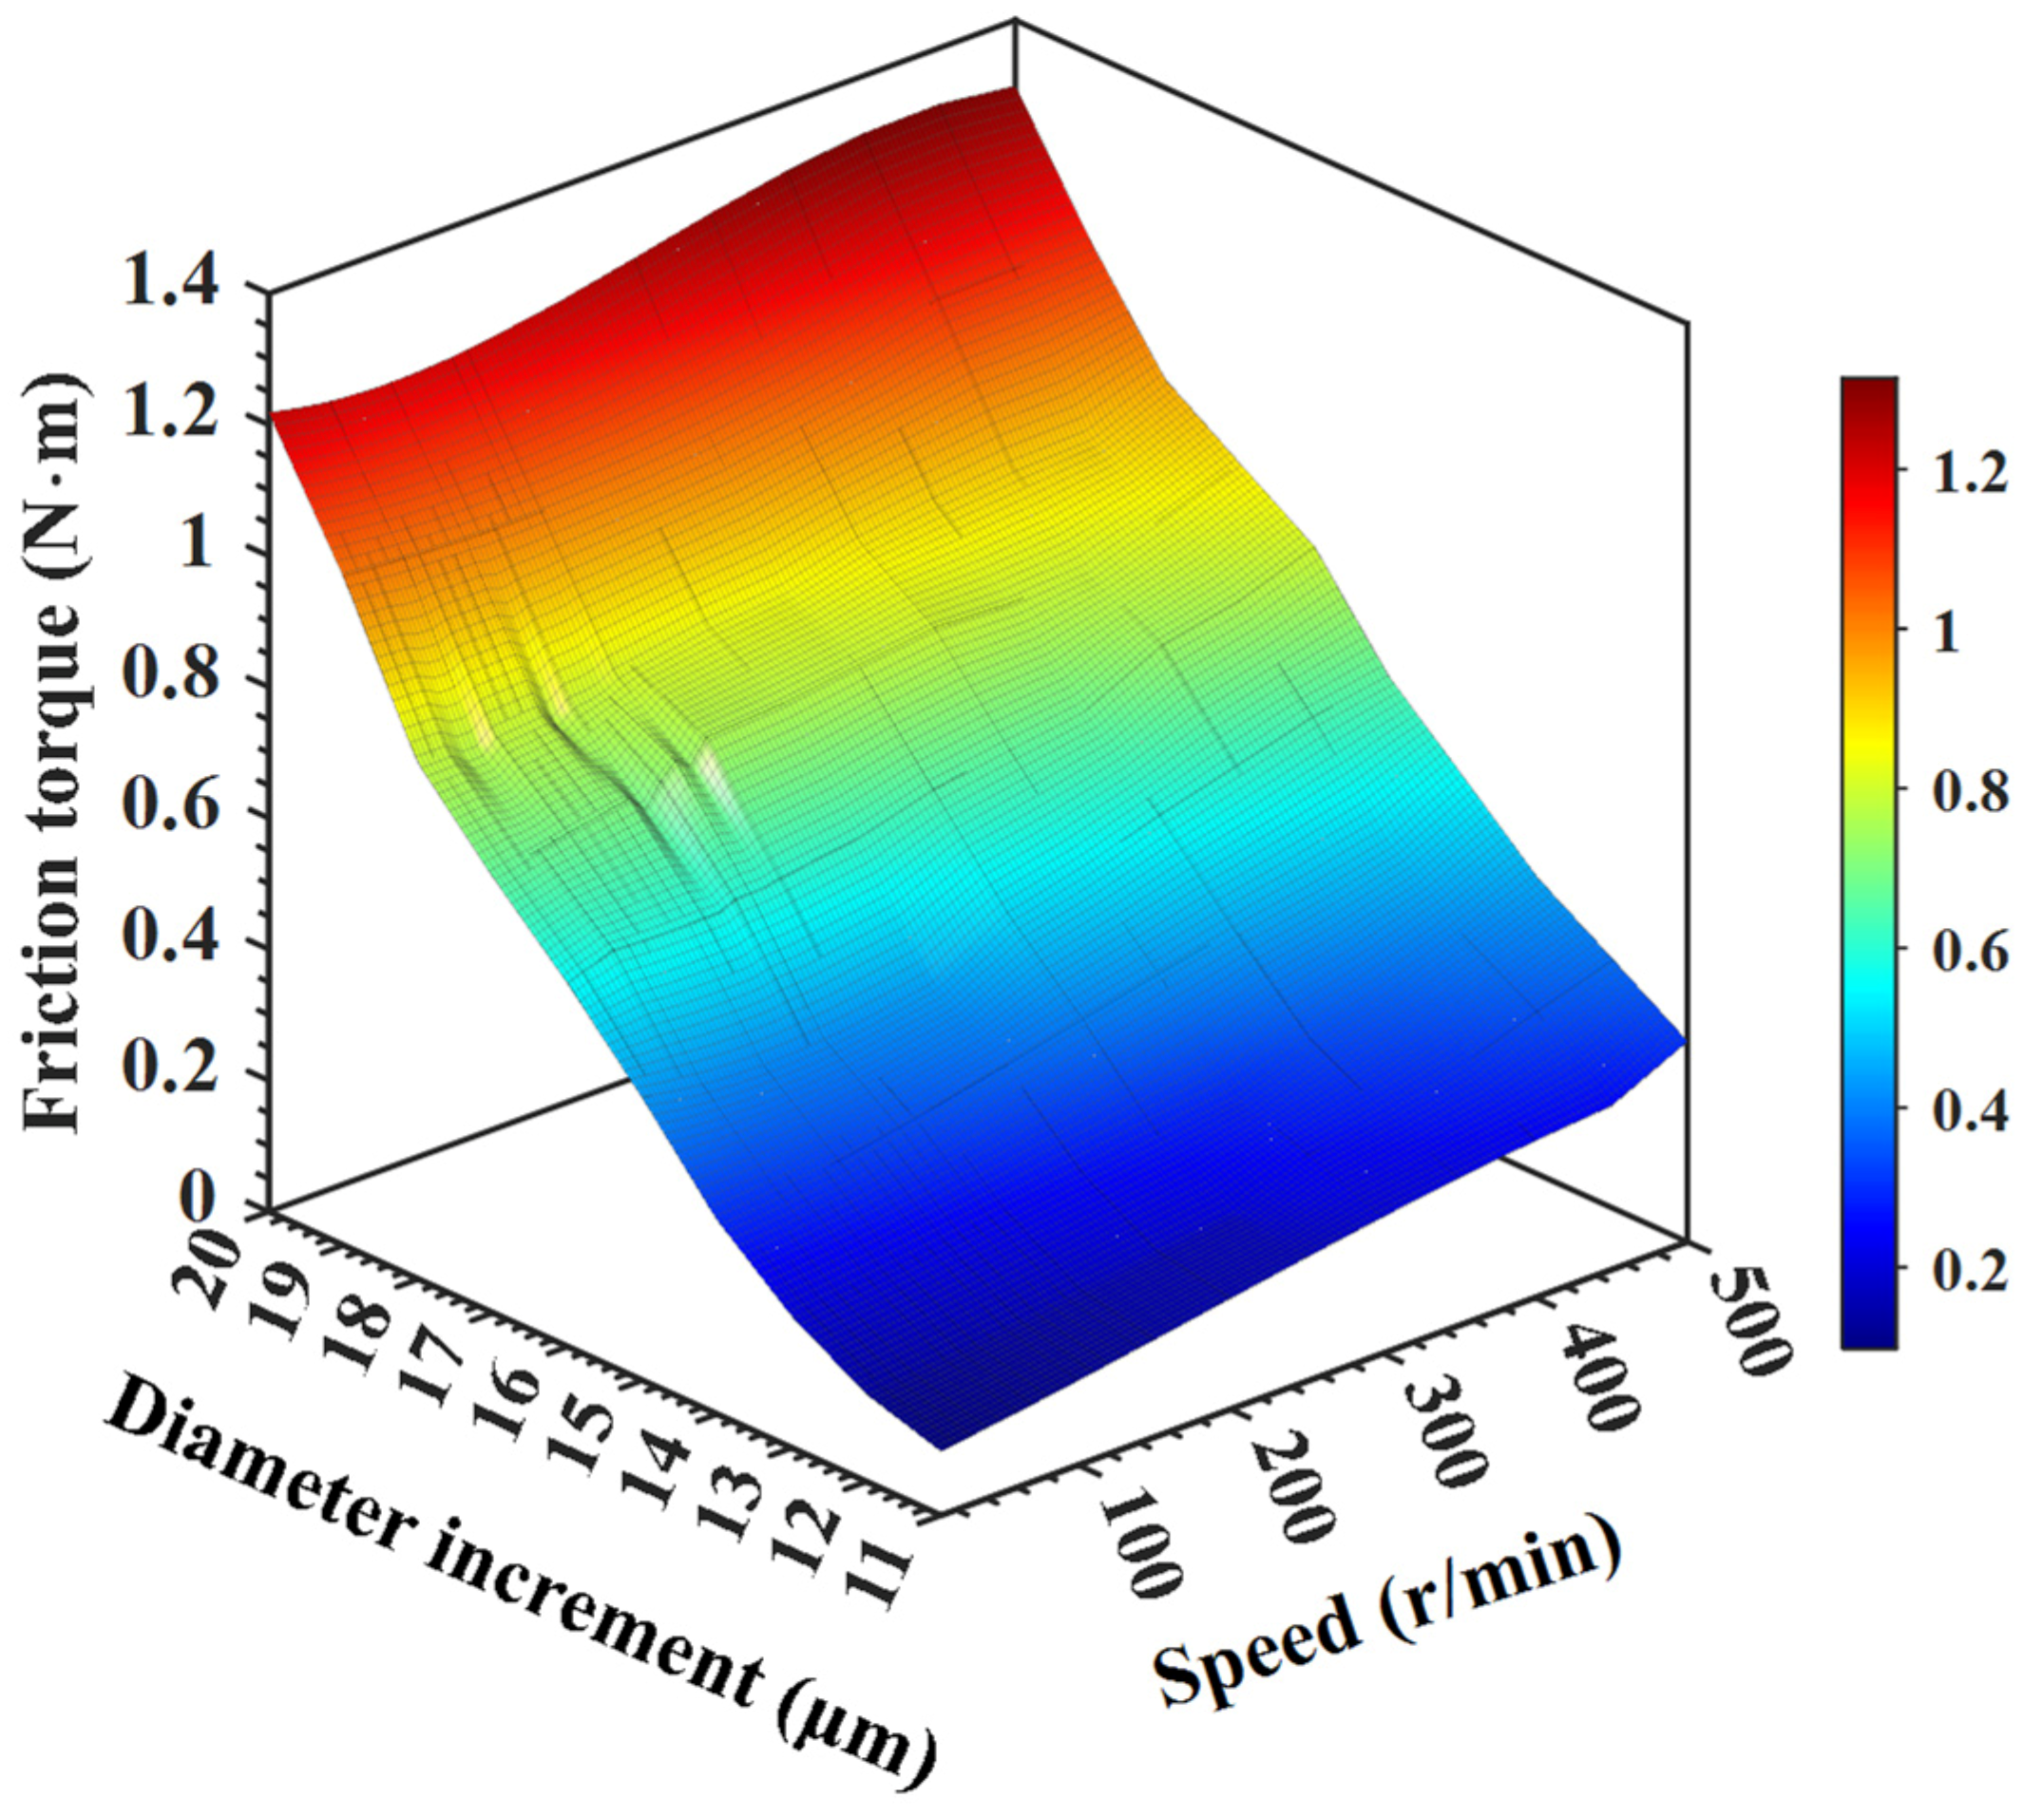
Figure 12 shows the overall measurement results of the friction torque of the four-point-contact ball screw. The comparison more clearly shows that, when the ball diameter increment is relatively small, the mean friction torque in the forward and reverse strokes increases significantly with increasing rotational speed. However, as the ball diameter increment increases, the influence of rotational speed on friction torque gradually decreases, causing the friction torque values under different rotational speeds to progressively approach a stable state. By analyzing the inclination direction of the surface, it can be found that, among the two parameters of ball diameter increment and rotational speed, the ball diameter increment plays a dominant role in affecting the friction torque of the ball screw. As the ball diameter increment increases, that is, as the internal preload rises, the friction torque increases rapidly, while an increase in rotational speed also leads to a certain increase in friction torque.
Figure 12.
Friction torque test results.
4.2. Comparison and Analysis of Experimental and Theoretical Results
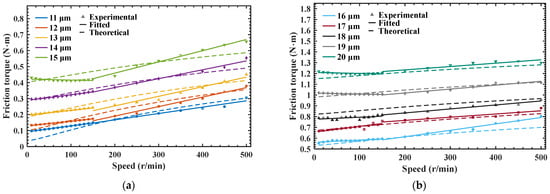
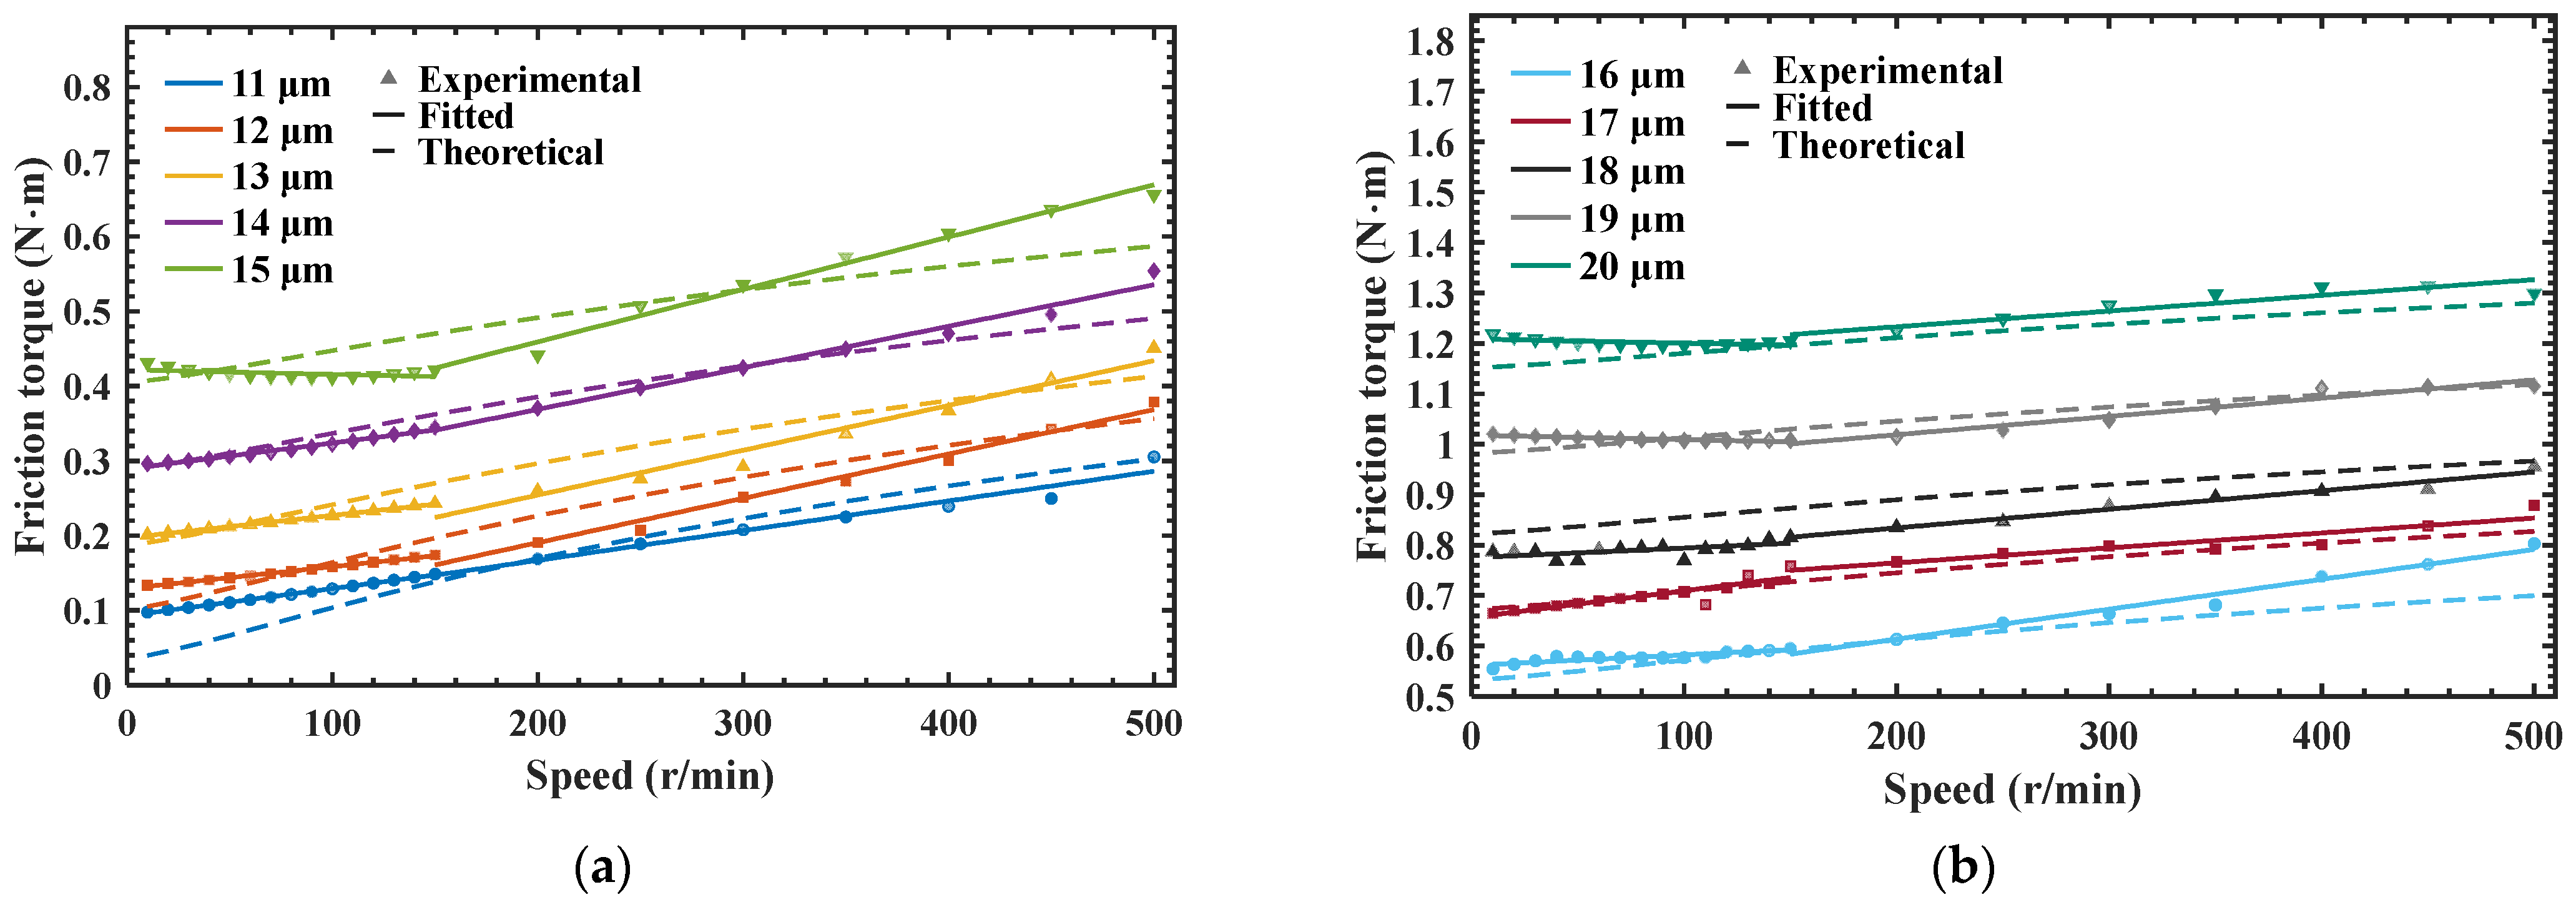
Figure 13 presents the experimental and theoretically calculated friction torque values of the tested screw when the ball diameter increment varies from 11 μm to 20 μm and the rotational speed varies from 10 r/min to 500 r/min. It can be seen from the figure that the fitted curves of the experimental results and the theoretical calculation curves exhibit generally consistent trends, showing good agreement. By comparing the curves in the two figures, it can be observed more intuitively that, when the ball diameter increment is small, the mean friction torque in the forward and reverse strokes gradually increases with increasing rotational speed. However, when the ball diameter increment is large, the sensitivity of friction torque to rotational speed gradually decreases, causing the friction torque to become more stable under different rotational speeds.
Figure 13.
Comparison of experimental and theoretical friction torque values. (a) 11 μm–15 μm; (b) 16 μm–20 μm.
This is because when the ball diameter increment is small, the contact load is relatively low, so the proportion of load-dependent friction is also low. As the rotational speed increases, the entrainment speed increases, thereby increasing the minimum oil-film thickness, improving the lubrication regime, and intensifying oil-film shear, which leads to a significant increase in speed-dependent oil-film shear friction. Therefore, under low-preload conditions, the marked increase in friction torque with speed is mainly attributed to the increase in oil-film shear friction. When the ball diameter increment increases, the contact load also increases, and the load-dependent sliding friction of the secondary contact pair accounts for a larger share of the total friction torque. Consequently, although higher speed still increases the oil-film thickness and oil-film shear friction, its relative effect on the total friction torque gradually weakens, making the friction torque more stable across different speeds. In addition, the negative exponent of the load term in the Hamrock–Dowson relation indicates that an increase in contact load causes a slight reduction in oil-film thickness.
To quantitatively evaluate the predictive accuracy of the theoretical model against the experimental friction torque, four error metrics are adopted, namely the mean absolute percentage error (MAPE), root mean square error (RMSE), maximum absolute error (MaxAE), and coefficient of determination (R2). These metrics were calculated based on the experimental and theoretical friction torque data corresponding to the different ball-diameter increments and rotational speeds shown in Figure 13.
The MAPE measures the average relative deviation between the predicted and experimental values, and is defined as:
where and are the theoretical and experimental friction torque for the -th operating point, respectively, and n is the number of data points in that group (For example, when one ball diameter increment is evaluated, n = 22). A smaller MAPE indicates higher prediction accuracy.
The RMSE reflects the overall dispersion of the prediction errors and is more sensitive to large deviations:
The MaxAE gives the upper bound of the prediction deviation under the most unfavourable condition:
The coefficient of determination R2 indicates how well the theoretical model explains the variability of the experimental data:
where is the mean of all experimental values. An R2 value close to unity signifies a high goodness of fit.
In addition to the above metrics, uncertainty intervals were calculated to reflect the variability inherent in the limited experimental dataset. Because the internal validation set consisted of seven fixed preload levels, with 22 paired observations at different rotational speeds under each preload level, a stratified paired bootstrap method was adopted. The seven preload levels were retained as separate strata, and the experimental–theoretical friction torque pairs were resampled with replacement within each stratum. Thus, each bootstrap sample contained 154 paired observations while preserving the original composition of the tested preload levels. For each resampled dataset, the four error metrics were recalculated. The 2.5th and 97.5th percentiles of the resulting bootstrap distributions were then taken as the lower and upper bounds of the 95% confidence intervals (CIs). This procedure provides a conditional assessment of the uncertainty in the error metrics over the tested preload levels.
To characterize the prediction accuracy of the proposed model and the predicted results corresponding to each ball-diameter increment, four error metrics were calculated for each ball-diameter increment and for the entire dataset. The corresponding results are summarized in Table 7, and the error metrics calculated for the internal validation set are listed in Table 8.
Table 7.
Summary of Error Statistics.
Table 8.
Error Statistics for the Internal Validation Set.
As shown in Table 7, among the seven ball diameter increments in the internal validation set, the error corresponding to the 11 μm increment is 26.94%, indicating a relatively large deviation. This is mainly because this condition is very close to the threshold for stable four-point contact. Under such a low-preload condition, the elastic deformation is extremely small; therefore, minor raceway form errors, assembly eccentricity, residual clearance, and ball diameter dispersion can significantly alter the actual load-sharing state.
It should be noted that negative coefficients of determination were obtained under the 18 μm and 19 μm conditions. For each fixed ball diameter increment, R2 reflects the ability of the model to reproduce the variation in friction torque with rotational speed. Under high-preload conditions, the measured friction torque varies within a relatively narrow range, and therefore the total variance of the experimental data is small. As a result, even relatively moderate errors in the predicted speed-dependent trend may make the residual error larger than the variance of the measured data, leading to negative R2 values. This indicates that the present model is not sufficiently accurate in predicting the subtle fluctuation of friction torque with rotational speed under high-preload conditions. However, the corresponding MAPEs are 9.98% and 3.51%, respectively, indicating that the model can still provide a reasonable estimate of the overall friction torque magnitude. Therefore, under these conditions, the model performs better in predicting the overall torque level than in reproducing subtle speed-dependent variations.
As the ball diameter increment increases, the prediction accuracy corresponding to each ball diameter increment is generally high, with all MAPE values below 10% except for the 11 μm increment, while the MAPE of the experimental datasets used for model calibration and parameter fitting is 3.97%. For the internal validation set, the MAPE is 8.55%, the MaxAE is 0.113 N·m, the RMSE is 0.042 N·m, and the coefficient of determination R2 is 0.981. These metrics provide a more comprehensive quantitative evaluation of model performance. The error analysis of the internal validation set indicates that, under the experimental conditions considered in this study, the proposed model possesses predictive capability for the friction torque of the tested 4010 ball screw and can also provide a reference for similar preloaded ball screws.
4.3. Comparison of Friction-Torque Contributions of the Primary and Secondary Contact Pairs
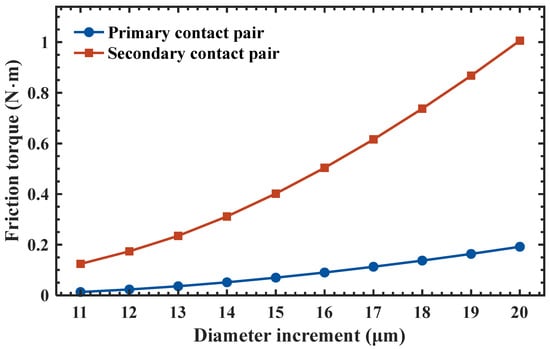
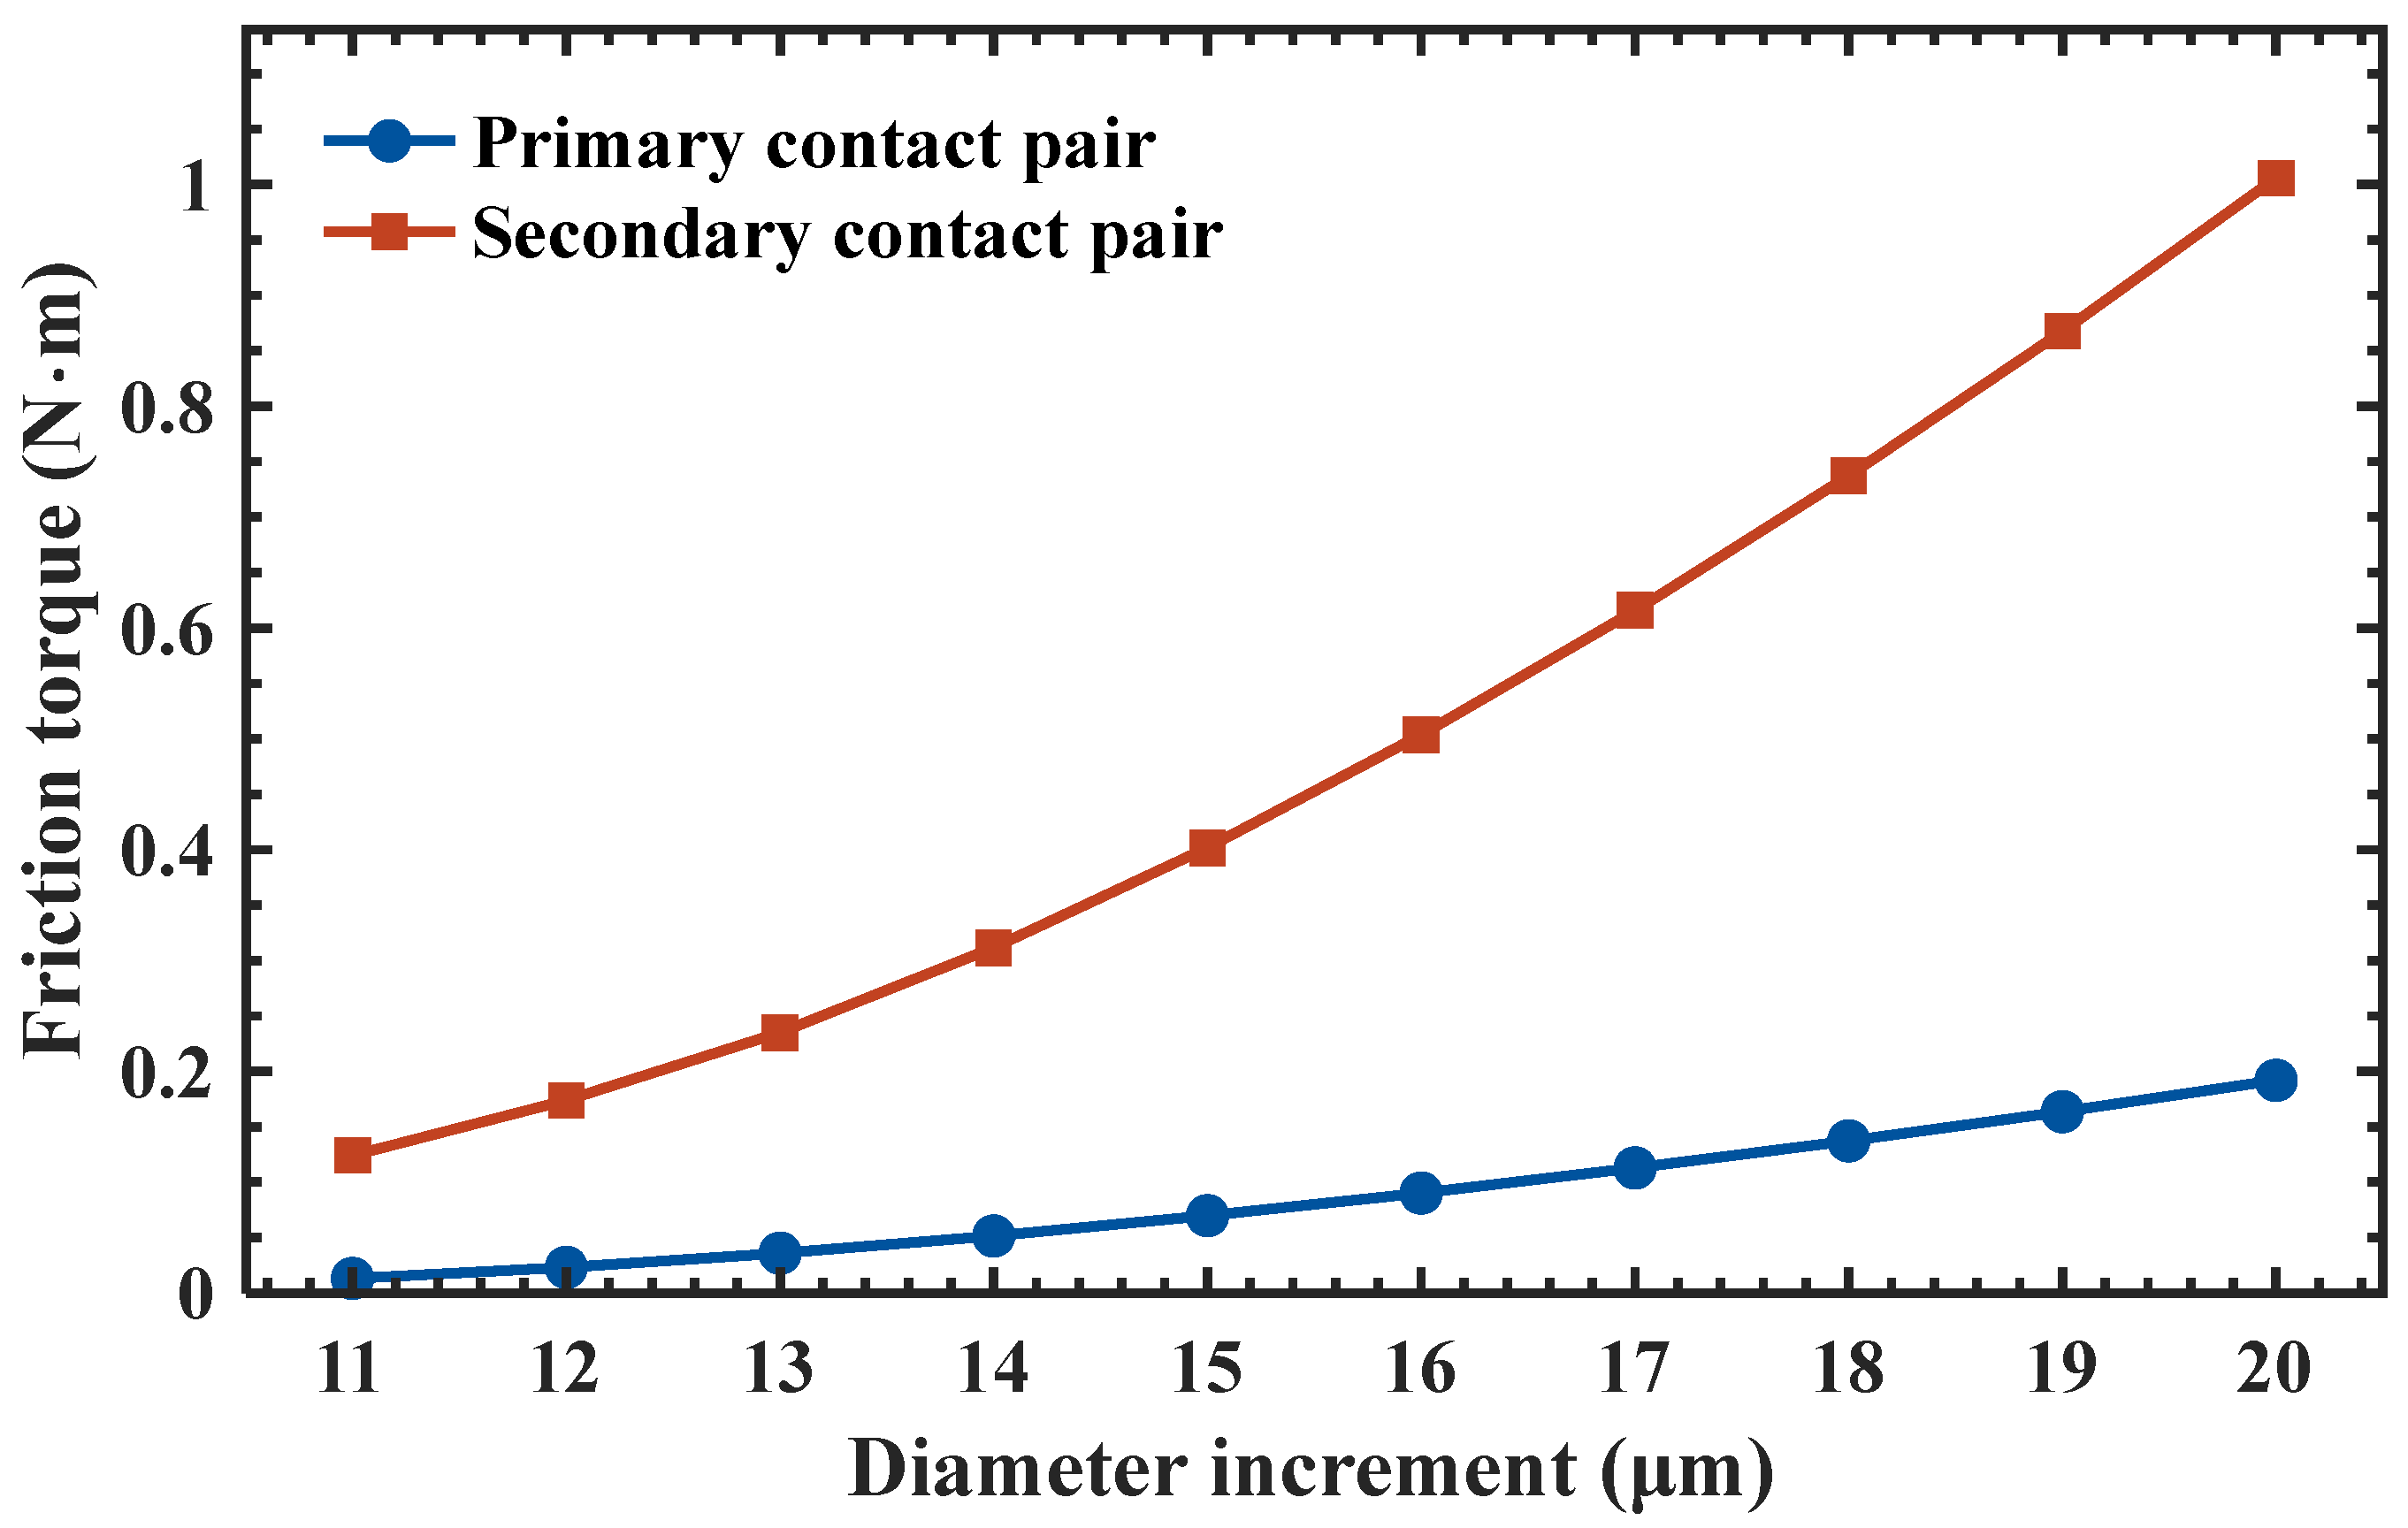
To further analyze the contributions of the primary and secondary contact pairs to the total friction torque under the four-point contact state, the friction torques of the primary and secondary contact pairs corresponding to each rotational speed under different ball diameter increments are calculated, and their mean values are compared. As shown in Figure 14, as the ball diameter increment increases from 11 μm to 20 μm, the friction torques of both the primary and secondary contact pairs show a gradually increasing trend.
Figure 14.
Contribution of primary and secondary contact pairs to friction torque.
In terms of its contribution to the total friction torque, the secondary contact pair consistently makes the dominant contribution. However, as the ball diameter increment increases, its proportion decreases from 90.40% at 11 μm to 83.99% at 20 μm, whereas the proportion of the friction torque of the primary contact pair increases from 9.60% to 16.01%. This is because, as the contact load increases, the contact ellipse area enlarges, causing the elastic hysteresis and differential microslip friction in the primary contact pair to increase in a strongly nonlinear manner, whereas the sliding friction in the secondary contact pair increases in a more nearly linear way. Meanwhile, as the contact load increases, the minimum oil-film thickness decreases slightly, the lubrication condition deteriorates, and the oil-film shear force becomes smaller; this effect is greater for the secondary contact pair than for the primary contact pair. As a result, the contribution of the primary contact pair to the total friction torque increases. However, under the four-point-contact preload condition, the secondary contact pair, dominated by relative sliding, remains the primary source of friction torque.
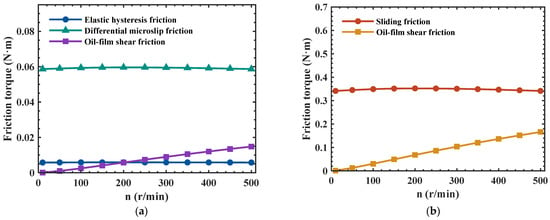
In addition, to analyze the contribution of each friction component in the primary and secondary contact pairs, the operating condition with a ball diameter increment of 15 μm was selected as an example, and the variation trends of the friction torque components in the primary and secondary contact pairs with rotational speed were compared, as shown in Figure 15.
Figure 15.
Variation in friction torque components with rotational speed at a ball diameter increment of 15 μm. (a) Primary contact pair; (b) Secondary contact pair.
As shown in Figure 15a, for the primary contact pair, the elastic hysteresis friction and differential microslip friction are mainly affected by the contact load and preload state. Therefore, for a fixed ball diameter increment, both remain essentially invariant with rotational speed. In contrast, the oil-film shear friction increases gradually with increasing rotational speed. This is because a higher rotational speed increases the entrainment velocity and microslip velocity in the contact region, thereby enhancing the oil-film shear effect. As shown in Figure 15b, for the secondary contact pair, the sliding friction torque remains dominant, whereas the oil-film shear friction torque increases markedly with rotational speed.
As the rotational speed increased from 10 r/min to 500 r/min, the contribution of the primary contact pair to the total friction torque decreased slightly from 15.84% to 13.50%. This is mainly because the oil-film shear friction in the secondary contact pair increases markedly with increasing rotational speed, thereby increasing the contribution of the secondary contact pair to the total friction torque. It further indicates that the main source of the increased total friction torque in the four-point-contact condition is the newly formed secondary contact pair.
5. Conclusions
In this study, a friction torque calculation model with differentiated friction-mechanism analysis is established to address the difficulty of applying existing ball screw friction torque models to four-point contact configurations preloaded by increasing the ball diameter. The model is developed based on the essential difference between the motion states of the two contact pairs. Friction torque experiments are conducted on a 4010 ball screw as a representative test case to evaluate the proposed model under the investigated conditions. The analytical and experimental results lead to the following conclusions:
- In the kinematic analysis, one of the two contact pairs is regarded as being dominated by rolling with a small amount of sliding, whereas the other is regarded as being dominated by relative sliding. Based on this kinematic assumption, the friction mechanisms are analyzed separately. The calculated results of the established friction torque model are in good agreement with the experimental results, which demonstrates the rationality of this theoretical assumption under the tested conditions.
- When the ball diameter interference is small, the friction torque increases markedly with increasing rotational speed. As the ball diameter interference increases, the influence of rotational speed gradually weakens, and the friction torque tends to stabilize. The proposed model effectively captures this trend. In addition, the model exhibits good predictive performance for the friction torque of the tested 4010 ball screw. After calibration under three preload conditions, the model achieved a MAPE of 8.55% for the seven datasets in the internal validation set, indicating good predictive performance for the tested 4010 ball screw under the operating conditions investigated in this study.
- In terms of the total friction torque contribution, as the ball diameter increment increases from 11 μm to 20 μm, the contribution ratio of the secondary contact pair decreases from 90.40% to 83.99%, while that of the primary contact pair increases from 9.60% to 16.01%. Nevertheless, the secondary contact pair, which is dominated by sliding friction, consistently contributes the majority of the friction torque. This indicates that the additional contact pair introduced by preloading via increasing the ball diameter is the primary source of the increase in friction torque.
It should be noted that this study still has several limitations. The model is based on an isothermal assumption and does not incorporate the effects of temperature on the relevant parameters. Some friction-related coefficients were directly adopted as fixed values from previous studies and were not further identified under different surface, pressure, speed, or lubrication conditions. In addition, the experimental validation was conducted only on a 4010 ball screw within the specified ranges of ball diameter increment and rotational speed. Moreover, both the calibration and validation data were obtained from the same 4010 ball screw and the same test setup; therefore, the validation performed in this study should be regarded as internal validation, and external validation using different ball screw specimens and test setups is still needed. Thus, the current validation results are applicable only to the tested 4010 ball screw. For other ball screws using the same preload method, the model mainly provides a theoretical reference, and further experiments are required to evaluate its broader generality.
Author Contributions
Methodology, Conceptualization, C.Z.; writing—original draft, B.M.; writing—review and editing, B.M.; investigation, J.X. and C.L.; Data curation, C.L.; software, M.J.; writing—review and supervision, H.F.; project administration, C.Z.; validation, H.F. All authors have read and agreed to the published version of the manuscript.
Funding
This research was funded by the National Science and Technology Major Projects of China (Grant No. 2024ZD0711801-01), the Science and Technology Major Project of Jiangsu Province (BG2024009), the National Natural Science Foundation of China (Grant No. 51905274), the Fundamental Research Funds for the Central Universities (Grant No. 30923011011), the Intelligent Manufacturing Longcheng Laboratory (Grant No. LK202407), and the Key R&D Projects in Lishui Economic Development Zone (Grant No. 2022KFQZDYF15).
Data Availability Statement
The data supporting the findings of this study are available from the corresponding author upon reasonable request.
Acknowledgments
During the preparation of this manuscript, the authors used DeepSeek (DeepSeek Assistant, version 2025) for the purposes of English language translation and text polishing. The authors have reviewed and edited the output and take full responsibility for the content of this publication.
Conflicts of Interest
The authors declare no conflicts of interest.
References
- Verl, A.; Frey, S.; Heinze, T. Double nut ball screw with improved operating characteristics. CIRP Ann. Manuf. Technol. 2014, 63, 361–364. [Google Scholar] [CrossRef] [Scilit]
- NSK. Precision Machine Components Catalogue; NSK Ltd.: Tokyo, Japan, 2003. [Google Scholar]
- Zhou, C.G.; Feng, H.T.; Chen, Z.T.; Ou, Y. Correlation between preload and no-load drag torque of ball screws. Int. J. Mach. Tools Manuf. 2016, 102, 35–40. [Google Scholar] [CrossRef] [Scilit]
- Wei, C.-C.; Lin, J.-F.; Horng, J.-H. Analysis of a ball screw with a preload and lubrication. Tribol. Int. 2009, 42, 1816–1831. [Google Scholar] [CrossRef] [Scilit]
- Wei, C.-C.; Lai, R.-S. Kinematical analyses and transmission efficiency of a preloaded ball screw operating at high rotational speeds. Mech. Mach. Theory 2011, 46, 880–898. [Google Scholar] [CrossRef] [Scilit]
- Kang, X.; Fu, W.; Wang, D.; Li, T.; Wang, S. Analysis and test of fluctuating friction torque in high-precision ball screw. China Mech. Eng. 2010, 21, 400–405. [Google Scholar]
- Zhao, J.; Song, X.; Jiang, H.; Lin, M.; Song, L. Modeling and analysis of friction torque of ball screw considering the thermal elastohydrodynamic lubrication. J. Mech. Eng. 2023, 59, 176–188. [Google Scholar] [CrossRef] [Scilit]
- Zou, B.; Chen, M.; Yang, L.; Chigan, M.; Lin, K.; Jing, M. Analysis of the influence of profile error of double arc ball screw’s raceway on frictional torque. Mod. Manuf. Eng. 2024, 8, 102–108. [Google Scholar] [CrossRef]
- Liu, D.; Zu, L.; Lin, W. Research on relationship between key machining dimensional error and preload torque of ball screw. Chin. J. Sci. Instrum. 2021, 42, 17–26. [Google Scholar]
- Wei, C.-C.; Lin, J.-F. Kinematic analysis of the ball screw mechanism considering variable contact angles and elastic deformations. J. Mech. Des. 2003, 125, 717–733. [Google Scholar] [CrossRef] [Scilit]
- Lin, M.C.; Ravani, B.; Velinsky, S.A. Kinematics of the ball screw mechanism. J. Mech. Des. 1994, 116, 849–855. [Google Scholar] [CrossRef] [Scilit]
- Hamrock, B.J.; Dowson, D. Isothermal elastohydrodynamic lubrication of point contacts: Part III—Fully flooded results. J. Lubr. Technol. 1977, 99, 264–276. [Google Scholar] [CrossRef] [Scilit]
- Zhang, Z.; Li, Z.; Cui, Z.; Song, X. Elastohydrodynamic lubrication analysis of precision ball screw. Mach. Des. Res. 2010, 26, 69–71+76. Available online: https://www.qk.sjtu.edu.cn/mdr/CN/abstract/abstract36213.shtml?utm (accessed on 19 September 2026).
- Li, L.; Wei, G.; Wang, J.; Lin, H.; Li, L.; Xie, M. Elastohydrodynamic lubrication analysis of main bearing with fractal rough surface. J. Harbin Inst. Technol. 2024, 56, 120–129+157. [Google Scholar] [CrossRef]
- Roelands, C.J.A.; Winer, W.O.; Wright, W.A. Correlational aspects of the viscosity-temperature-pressure relationship of lubricating oils. J. Lubr. Technol. 1971, 93, 209–210. [Google Scholar] [CrossRef] [Scilit]
- Sun, T.; Wang, M.; Gao, X.; Zhao, Y. Study on the friction mechanism of the ball screws based on the isothermal elastohydrodynamic lubrication theory. J. Beijing Univ. Technol. 2023, 49, 1–10. [Google Scholar] [CrossRef]
- Bair, S. Actual Eyring models for thixotropy and shear-thinning: Experimental validation and application to EHD. J. Tribol. 2004, 126, 728–732. [Google Scholar] [CrossRef] [Scilit]
- Hu, Y.-Z.; Wang, H.; Wang, W.-Z.; Zhu, D. A computer model of mixed lubrication in point contacts. Tribol. Int. 2001, 34, 65–73. [Google Scholar] [CrossRef] [Scilit]
- Ma, S.; Liu, G.; Tong, R. The frictional moment and transmission efficiency of planetary roller screw. J. Harbin Inst. Technol. 2013, 45, 74–79. [Google Scholar] [CrossRef]
- Oh, K.-J.; Cao, L.; Chung, S.-C. Explicit modeling and investigation of friction torques in double-nut ball screws for the precision design of ball screw feed drives. Tribol. Int. 2020, 141, 105841. [Google Scholar] [CrossRef] [Scilit]
- Zhang, Z.; Zhou, P.; Zuo, P.; Li, Y. Study of negative axial clearance affected friction torque of four contact-point slewing ball bearing. Mach. Tool Hydraul. 2018, 46, 56–58. [Google Scholar] [CrossRef]

Disclaimer/Publisher’s Note: The statements, opinions and data contained in all publications are solely those of the individual author(s) and contributor(s) and not of MDPI and/or the editor(s). MDPI and/or the editor(s) disclaim responsibility for any injury to people or property resulting from any ideas, methods, instructions or products referred to in the content. |
© 2026 by the authors. Licensee MDPI, Basel, Switzerland. This article is an open access article distributed under the terms and conditions of the Creative Commons Attribution (CC BY) license.