


Abstract
Under intermittent source-side excitation, electric-drive systems can maintain mechanical operation, so nominal energization parameters do not directly represent the interfacial electrical state. GCr15 ball-on-disk tests compared dry and polyalphaolefin (PAO 40)-lubricated conditions at 6 N under 5 V, 1 Hz switching. Tests covered nominal duty cycles from D = 0 to 1.00, where D is the ratio of the voltage on-time to the voltage period. Equal-on-time friction tests compared periodic D = 0.50, on→off and off→on. Wear was compared among periodic D = 0.50, off→on, and continuous direct current (DC). Friction increased overall with D. Longer on-time prolonged concurrent microcontact Joule heating and mechanical friction. Dry-sliding wear volume varied non-monotonically, peaking at D = 0.50 with changes in surface-layer removal and O-containing debris retention. Under PAO 40 boundary/mixed lubrication, wear-track width and volume increased monotonically with electrical-heating-related changes in oil film support and separation, microcontact, plowing, and plastic deformation. Equal-on-time friction histories differed. Periodic D = 0.50 and off→on produced similar wear volumes but different morphologies. Dry off→on and continuous DC wear volumes were close. Wear depended on timing and interface state at energization. Interface evolution altered contact resistance and voltage division, feeding back on wear. These findings support energization-parameter and bearing wear risk assessment under intermittent source-side excitation.
1. Introduction
Converter-driven motors are widely used in traction systems for electric and hybrid vehicles, industrial servos, robotics, automation equipment, and related fields [1,2,3,4]. During some operating stages of these rotating electric-drive systems, mechanical contact remains continuous while drive-state transitions or changes in the external circuit can switch the source-side electrical excitation from continuous to intermittent. The mechanical and electrical processes need not be synchronized [4]. Bearing-current and electrical damage problems associated with these systems have received extensive attention [5,6,7,8]. Converter-generated common-mode voltage and parasitic coupling produce a shaft voltage between the shaft and housing. When the bearing forms part of the conduction path, this shaft voltage can drive current through the bearing contact region [1,6]. Grounding arrangements and external-circuit parameters also affect the conduction paths of bearing currents [6]. Bearing current can cause localized melting, erosion, pits, and fluting on raceway and rolling-element surfaces. It also accelerates lubricant degradation, increases vibration and noise, and ultimately leads to premature bearing failure [5,7,8]. Because the electrical properties of the lubricant film affect bearing-current formation, lubricant performance needs to be evaluated under current-carrying tribological conditions [9].
Previous studies have examined bearing electrical damage in terms of damage morphology and electrical conduction through lubricant films. Prashad [10] observed pits formed by spark erosion on rolling-bearing raceway surfaces. Noguchi et al. [11] measured the critical direct-current (DC) voltage for electrical erosion in grease-lubricated miniature bearings. Their results indicated that the electrical state of the lubricant film affects bearing-current formation. Guo et al. [12] investigated discharge behavior in electric-vehicle motor bearings using a single-point ball-on-disk contact. They found that the discharge location was related to the minimum lubricant film thickness. They also found that the energy of an individual discharge affected the severity of pitting damage. When a lubricant film separates the two surfaces, film charging and dielectric breakdown are important processes in the formation of electrical discharge machining (EDM)-type damage. Under boundary or mixed lubrication, the two surfaces are not completely separated by the lubricant film, and current can also pass through metallic asperity contacts. Xie et al. [13] and Chiou et al. [14] found that weak currents or DC electric fields altered surface damage in contacting solids. The specific morphology depended on lubricant properties and the electrically conductive state of the oil film. In a diamond-like carbon (DLC)/polyalphaolefin (PAO) solid–liquid composite lubrication system, Ding et al. [15] observed two features: linear ridges and spot-like ablation. The former was associated with Joule heating, whereas the latter was caused by oil film breakdown and arc discharge. These findings indicated that the form of electrical damage depends on lubrication state, voltage, and circuit current.
Beyond discharge damage, externally applied electrical excitation also changes the friction, material transfer, and surface chemical state of current-carrying contacts. Song et al. [16] examined the effect of shaft voltage on electrical damage to GCr15 bearing steel. From an interfacial tribochemistry perspective, Spikes [17] reviewed the effects of applied electrical potential on friction and wear in lubricated contacts. Tajedini et al. [18] found that electric current altered friction and wear in grease-lubricated contacts. Peng et al. [19] further reported that current polarity affected material transfer and surface oxidation in bearing steel. Li et al. [20] studied the relationships among lubrication state, resistance and capacitance responses, and electrical erosion under an alternating current (AC) electric field. Taken together, these studies indicate that friction and wear under electrical excitation depend not only on voltage or current magnitude but also on material, lubrication state, and current direction.
Motor shaft voltage usually appears as high-frequency pulses associated with converter switching. Whether current passes through a bearing also depends on rotational speed, load, lubricant film, and surface condition [5,6]. Under this type of excitation, Guo et al. [12] used 12.5 kHz pulses to study discharge in an elastohydrodynamically lubricated single-point contact. In a 10 kHz low-speed full-bearing test, Li et al. [21] set the power supply to 5–240 V. They found that the measured peak voltage across the bearing was approximately 0.1–12 V. Subsequently, Li et al. [22] found that changing the current direction under 20 kHz unipolar pulses shifted the EDM-type damage region between the inner and outer raceways. For reciprocating contact, Kreivaitis et al. [23] used electrical contact resistance to characterize changes in lubrication state under applied voltage. These studies respectively revealed discharge damage under high-frequency pulses and changes in lubrication state during continuously energized reciprocating contacts. However, the effect of nominal duty cycle on friction and wear remains insufficiently studied under continuous mechanical reciprocation with low-frequency source voltage switching. At a nominal duty cycle of 0.50, periodic switching distributes the on-time throughout the test. With the same nominal total on-time, on→off applies continuous voltage only during the first half of the test, whereas off→on applies it only during the second half. The frictional responses of the three protocols and the wear difference between delayed energization and periodic switching remain to be compared.
To address these issues, this study examined the effects of nominal duty cycle and energization timing on the reciprocating friction and wear of GCr15 bearing steel under dry sliding and PAO 40 lubrication. Electrical measurements, wear-track geometry, surface morphology, and elemental distributions were combined to relate interfacial evolution to the electrical response. The results provide an experimental reference for evaluating current-carrying contacts and bearing wear risks in industrial electric-drive systems under continuous mechanical operation and intermittent source-side electrical excitation.
2. Materials and Methods
2.1. Test Apparatus and Test Specimens
Reciprocating current-carrying friction and wear tests under source-side electrical excitation were conducted using an HSR-2M high-speed reciprocating tribometer (Lanzhou Zhongke Kaihua Technology Development Co., Ltd., Lanzhou, China). The test system comprised a reciprocating friction unit, a source-side constant-voltage switched power supply unit, a current-limiting protection circuit, and an electrical-signal acquisition unit. The steel ball was mounted in an insulating chuck, and the steel disk was secured with an insulating fixture. The dry-sliding and PAO 40 (Tiancheng Meijia Lubricating Oil Co., Ltd., Beijing, China)—lubricated tests used the same mechanical configurations.
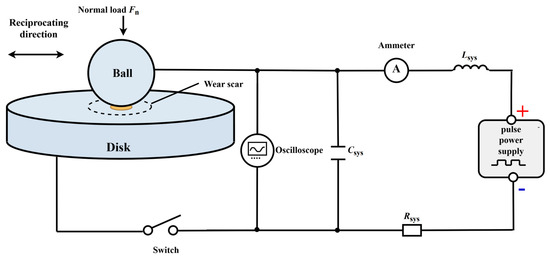
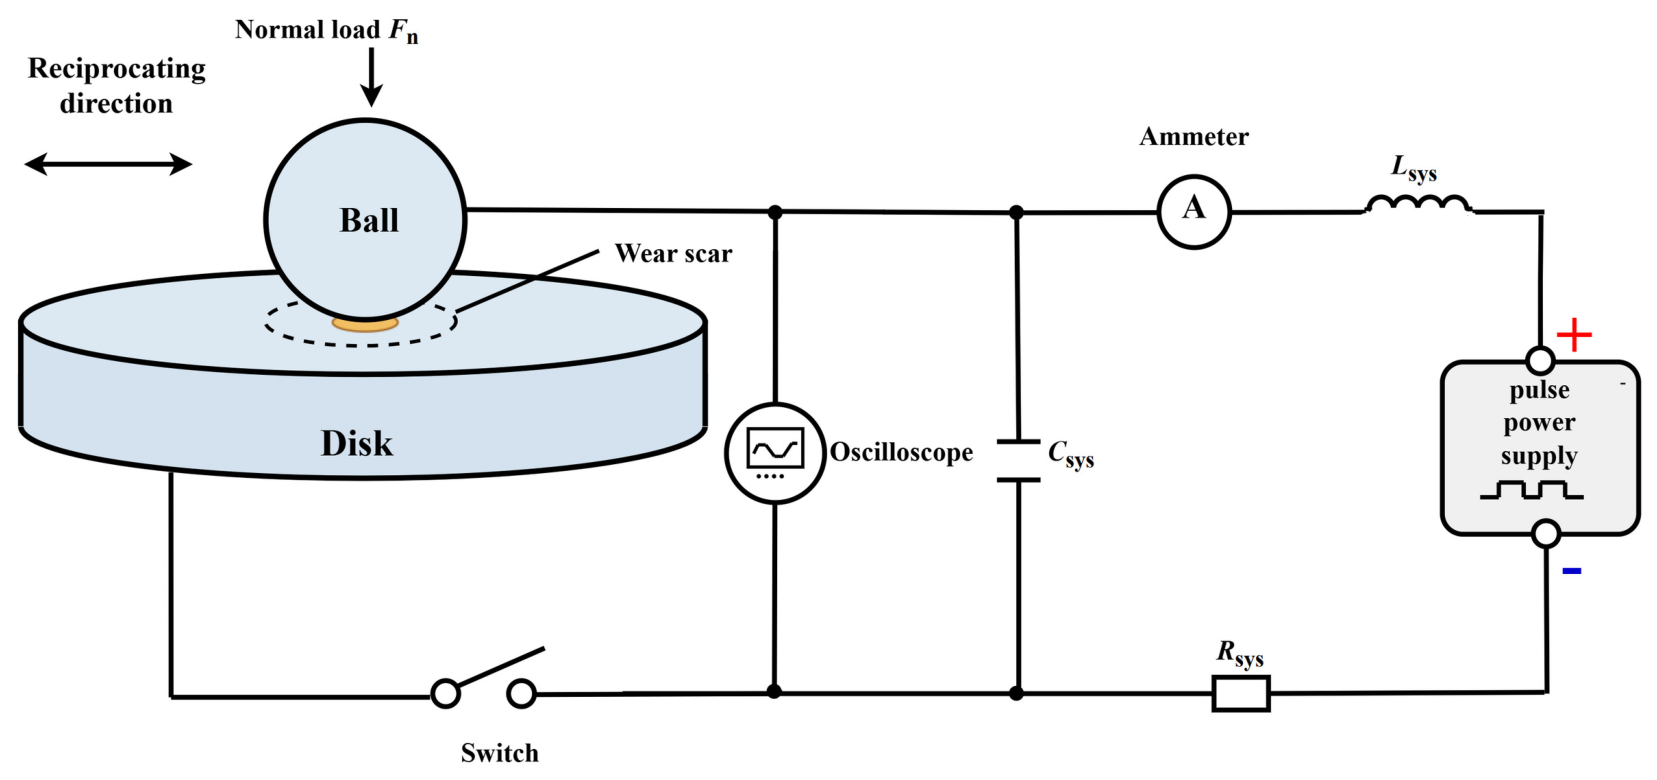
As shown in Figure 1, a laboratory-built power supply module generated a unipolar switched voltage with adjustable amplitude, frequency, and duty cycle. The steel ball was connected to the positive terminal of the power supply, and the steel disk was connected to the negative terminal. The power supply module incorporated fixed components, including a switch, an inductor, and a capacitor, while the external series circuit provided both current-limiting protection and voltage division. Rsys denotes the equivalent resistance of the fixed external series circuit. Lsys and Csys denote the fixed inductive and capacitive components in the power supply system, respectively. A digital oscilloscope was connected in parallel across the ball–disk contact pair to sample the contact-pair voltage at 100 kHz. The circuit connections, component parameters, and measurement locations were kept constant under all test conditions.
Figure 1.
Schematic of the power supply and measurement circuit for GCr15 ball-on-disk reciprocating current-carrying friction tests under a low-frequency switched voltage.
The ball–disk contact pair consisted of a GCr15 bearing-steel ball (Hanshuo, China) and a GCr15 bearing-steel disk (Feiyue Precision, Suzhou, China). The ball diameter was 6 mm, and the disk was 24 mm in diameter and 7.88 mm thick. Both the ball and the disk had a nominal Rockwell C hardness of 63 HRC and a nominal initial surface roughness of Ra ≤ 0.012 μm. The lubricant was PAO 40, an electrically insulating polyalphaolefin base oil with a kinematic viscosity of 390.21 mm2/s at 40 °C.
2.2. Test Procedure and Loading Parameters
In each test, a new GCr15 steel ball with the same material and specifications and an unworn region of the disk was used. Before each test, the steel ball and steel disk were ultrasonically cleaned for 10 min before mounting. After mounting, the exposed surface of the steel ball was gently wiped with nonwoven wipes moistened sequentially with petroleum ether and absolute ethanol and was allowed to dry before testing. For each PAO 40-lubricated test, 0.2 mL of lubricant was added dropwise to the steel disk surface before testing. The 6 N load was selected to reduce the relative contribution of mechanically induced wear while maintaining an initial maximum Hertzian contact pressure of approximately 1.2 GPa, comparable to that reported in Ref. [23]. A frequency of 5 Hz and a stroke of 6 mm were selected within the stable operating range of the tribometer to provide stable reciprocating motion and a sufficiently long sliding path for evaluating the central portion away from the stroke reversals. The same reciprocating frequency and stroke have also been used in a related PAO-lubricated ball-on-flat tribological study [24]. The load, frequency, and stroke were kept constant in all tests. The dry-sliding and PAO 40-lubricated tests lasted 10 and 30 min, respectively. Preliminary PAO 40 tests showed that 10 min produced only slight wear, insufficient for reliable wear-volume measurement; therefore, the duration was extended to 30 min. A longer test duration has also been used in a related PAO-lubricated reciprocating wear study [24]. The tests were conducted at 23 °C and a relative humidity of 60–75%. Because the test durations differed between the two lubrication states, the amount of wear was compared only within the same lubrication state.
The source-side on-state voltage was 5 V and the switching frequency was 1 Hz. The nominal duty cycle, D, was defined as the ratio of the on-time, Ton, within one voltage period to that period, T:
The tests comprised a duty-cycle series and an energization-timing series. The duty-cycle series used D = 0, 0.25, 0.50, 0.75, and 1.00. The conditions D = 0 and 1.00 denoted de-energization throughout the test and continuous 5 V DC, respectively. Under the remaining conditions, a 1 Hz periodically switched voltage was applied throughout the friction test. The energization-timing series comprised the periodically switched condition at D = 0.50, off→on and on→off. Under off→on, the system was de-energized during the first half and continuously energized at 5 V DC during the second half. Under on→off, the system was continuously energized at 5 V DC during the first half and de-energized during the second half. The three conditions had the same nominal total on-time and were used to compare the evolution of the coefficient of friction. The wear analysis compared only off→on, the periodically switched condition at D = 0.50, and D = 1.00 to examine differences in wear after delayed continuous energization.
In the tests, the 1 Hz voltage period was T = 1.0 s, and the 5 Hz mechanical reciprocation period was Tr = 0.20 s. The on-time was Ton = D·T. Expressed in terms of the reciprocation period, each on-interval at D = 0.25, 0.50, and 0.75 spanned 1.25, 2.50, and 3.75 reciprocation periods, respectively. Voltage switching was not triggered by a reciprocating position signal, and the initial phase was not used as a test control parameter. The duty-cycle series was used to compare the overall friction and wear results at different source-side on-time ratios.
The test protocols are summarized in Table 1.
Table 1.
Energization protocols and test durations (min) for the duty-cycle and energization-sequence series.
2.3. Signal Processing and Surface Characterization
The contact-pair voltage, apparent electrical contact resistance, and coefficient of friction were acquired under the corresponding test conditions using the measurement procedures described below. The test machine recorded the tangential friction force, Ft, to calculate the coefficient of friction, μ. The relationship was μ = Ft/FN, where FN is the normal load. For the duty-cycle series, curves of the coefficient of friction against reciprocating cycle number were used to examine running-in and subsequent changes. The mean coefficient of friction over the final 50% of cycles in each test was used to compare friction levels at different D values. For the energization-timing series, changes in the complete curves before and after state switching were compared.
Before the tests, a multimeter was used to measure the equivalent resistance of the fixed external series circuit, Rsys = 1.48 Ω. In the continuous DC tests, the system recorded the source voltage, Us, and the circuit current, I, once per second. The total circuit resistance was calculated as Us/I, and Rsys was then subtracted to obtain the apparent electrical contact resistance, Rapp, of the ball–disk contact pair. Rapp reflects the electrical conduction state of the entire contact pair and is jointly affected by metallic contact, surface coverings, and the lubricant film:
After 120 s of sliding under switched source voltage conditions, a digital oscilloscope sampled the contact-pair voltage, Uc(t), at 100 kHz. The on-state voltage plateaus and fluctuations were compared under different duty cycles and lubrication conditions. Before reciprocating motion began, the on-state voltage across the contact pair, Uc,0, was recorded under a 6 N load with the ball and disk stationary. The initial static contact resistance, Rc,0, was calculated from the series voltage-division relationship:
In the equations, Us is the source on-state voltage, and I is the circuit current measured under continuous DC. Rsys is the equivalent resistance of the fixed external series circuit, and Rapp is the apparent electrical contact resistance of the ball–disk contact pair. Uc,0 and Rc,0 are, respectively, the on-state voltage across the contact pair and the initial static contact resistance under static loading at 6 N.
A white-light interferometer (Bruker Nano Surfaces and Metrology, Tucson, AZ, USA) was used to measure the two-dimensional cross sections and three-dimensional morphology of the wear tracks and to calculate the wear-track width and wear volume. After each tribological test, the disk wear tracks were gently wiped with nonwoven wipes moistened sequentially with petroleum ether and absolute ethanol before white-light interferometry. No ultrasonic cleaning, brushing, or abrasive scrubbing was applied to the worn surfaces after testing. A Hitachi SU8100 field-emission scanning electron microscope (SEM) (Hitachi High-Technologies Corporation, Tokyo, Japan) equipped for energy-dispersive X-ray spectroscopy (EDS) was used to observe the morphology and elemental distributions of the disk wear tracks. Ball-side SEM/EDS characterization was not included because secure mounting of the 6 mm spherical ball and reproducible positioning of the wear scar could not be achieved with the available specimen holder. Similar plate-side SEM/EDS characterization has also been used in an electrified reciprocating ball-on-plate tribotest to characterize the worn-surface morphology and elemental composition [23].
3. Results and Discussion
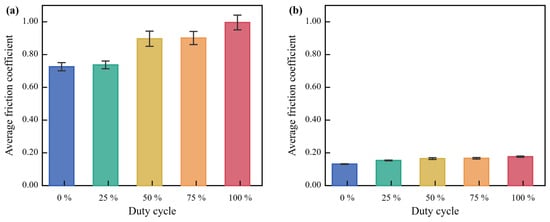
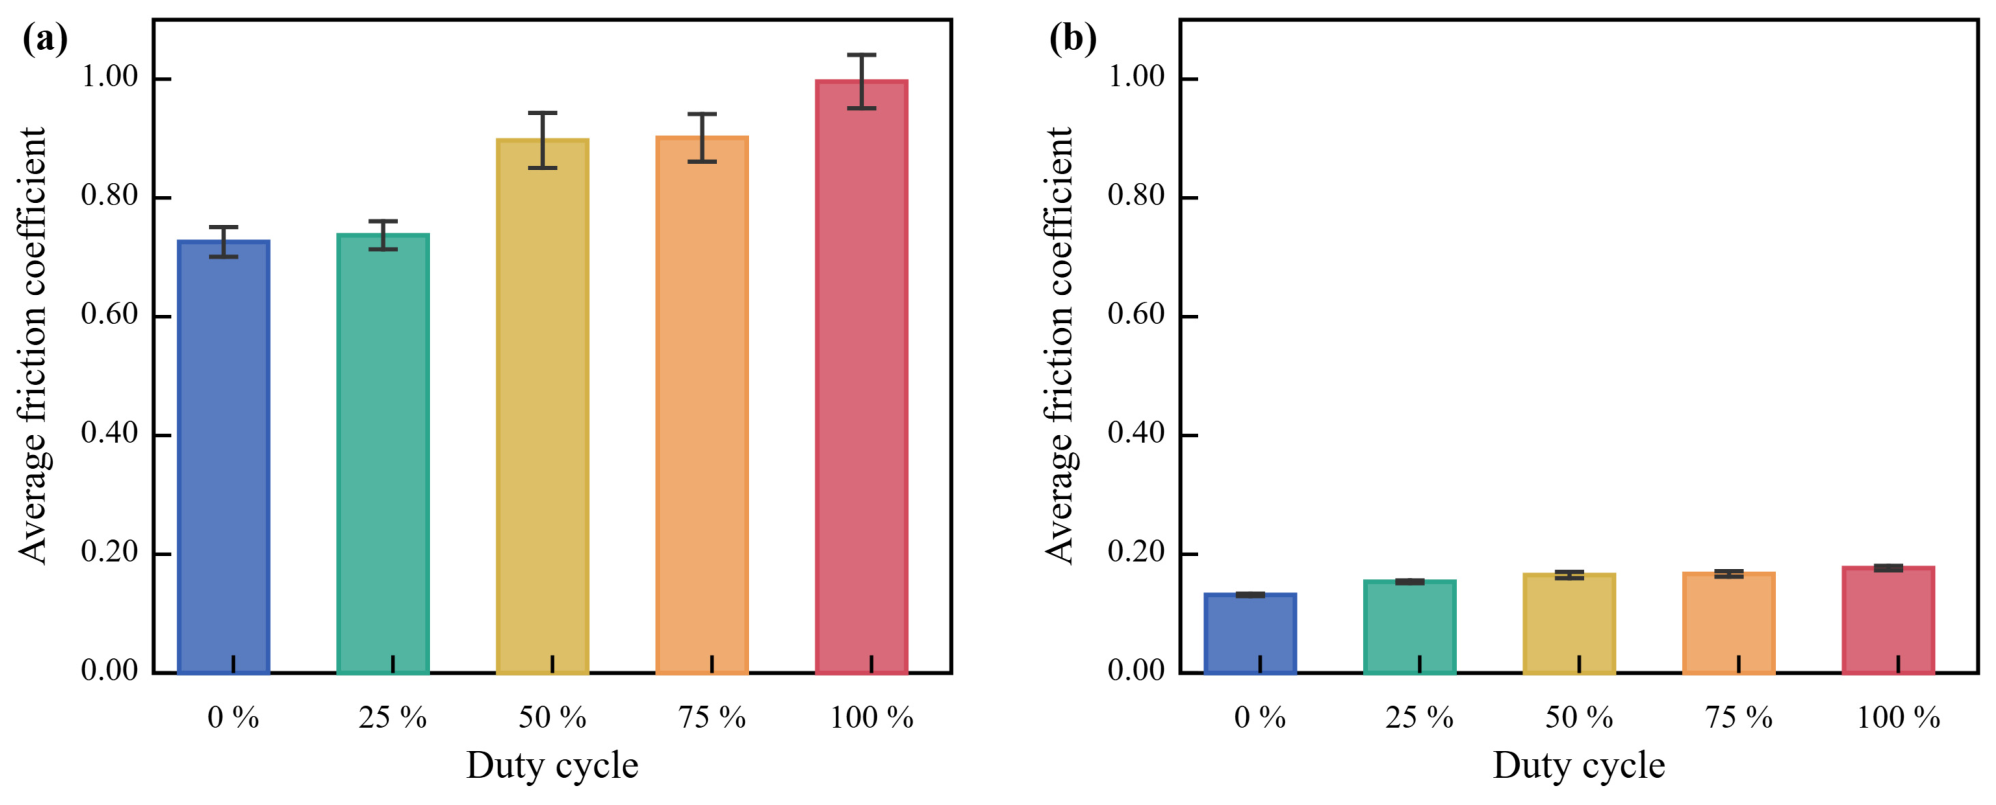
Five independent tests were conducted under each condition, and their overall trends were consistent. Figure 2, Figure 3 and Figure 4 present one set of representative curves. The coefficient of friction, wear-track width, and wear volume are reported as the mean ± standard error of the mean (SE, n = 5). The error bars in Figure 5 represent SE. Representative wear tracks were selected for inclusion in the surface-characterization images.
Figure 2.
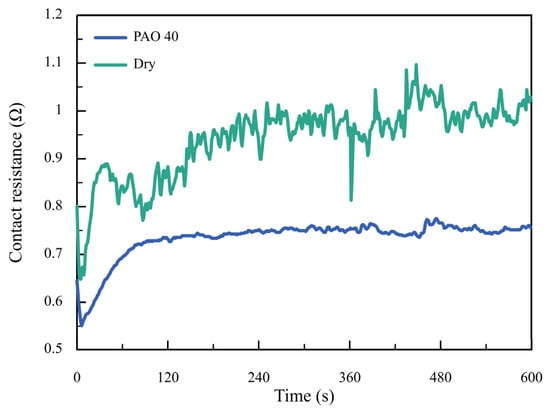
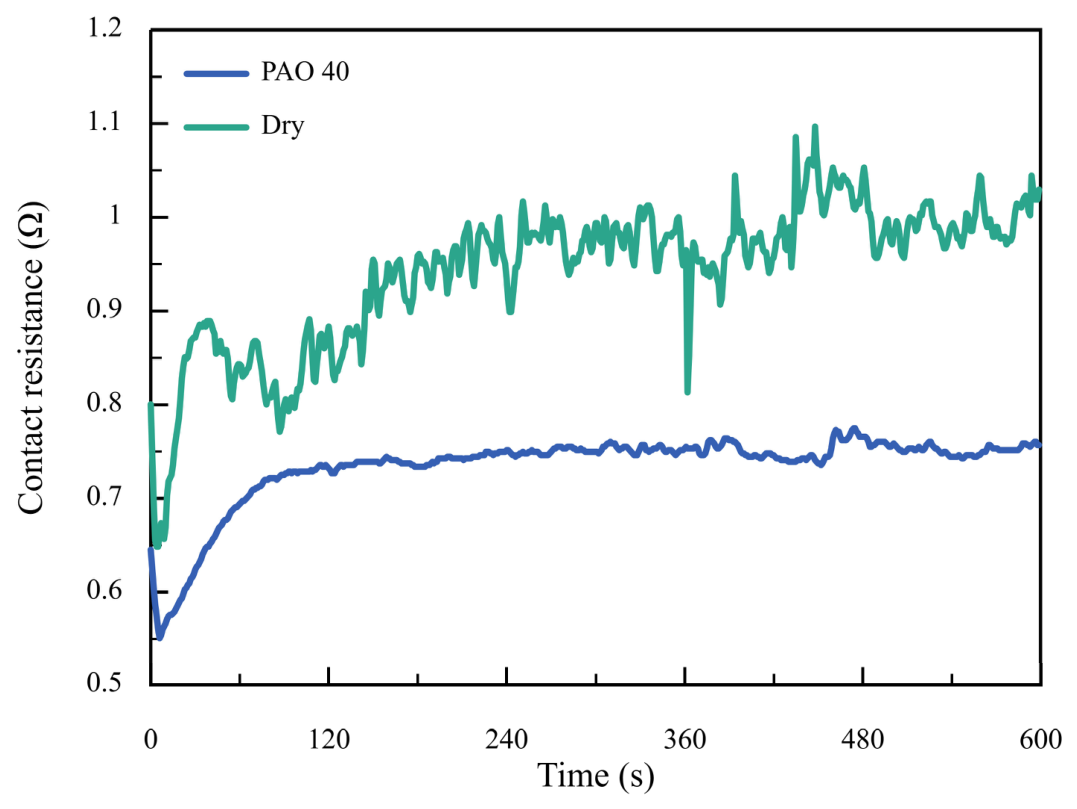
Apparent electrical contact resistance of the ball–disk contact pair during the first 600 s under continuous direct current (DC) for dry sliding and polyalphaolefin (PAO 40) lubrication.
Figure 3.
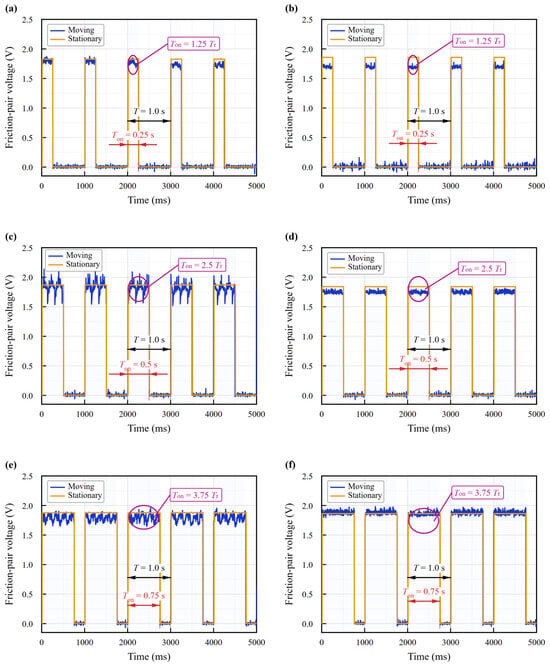
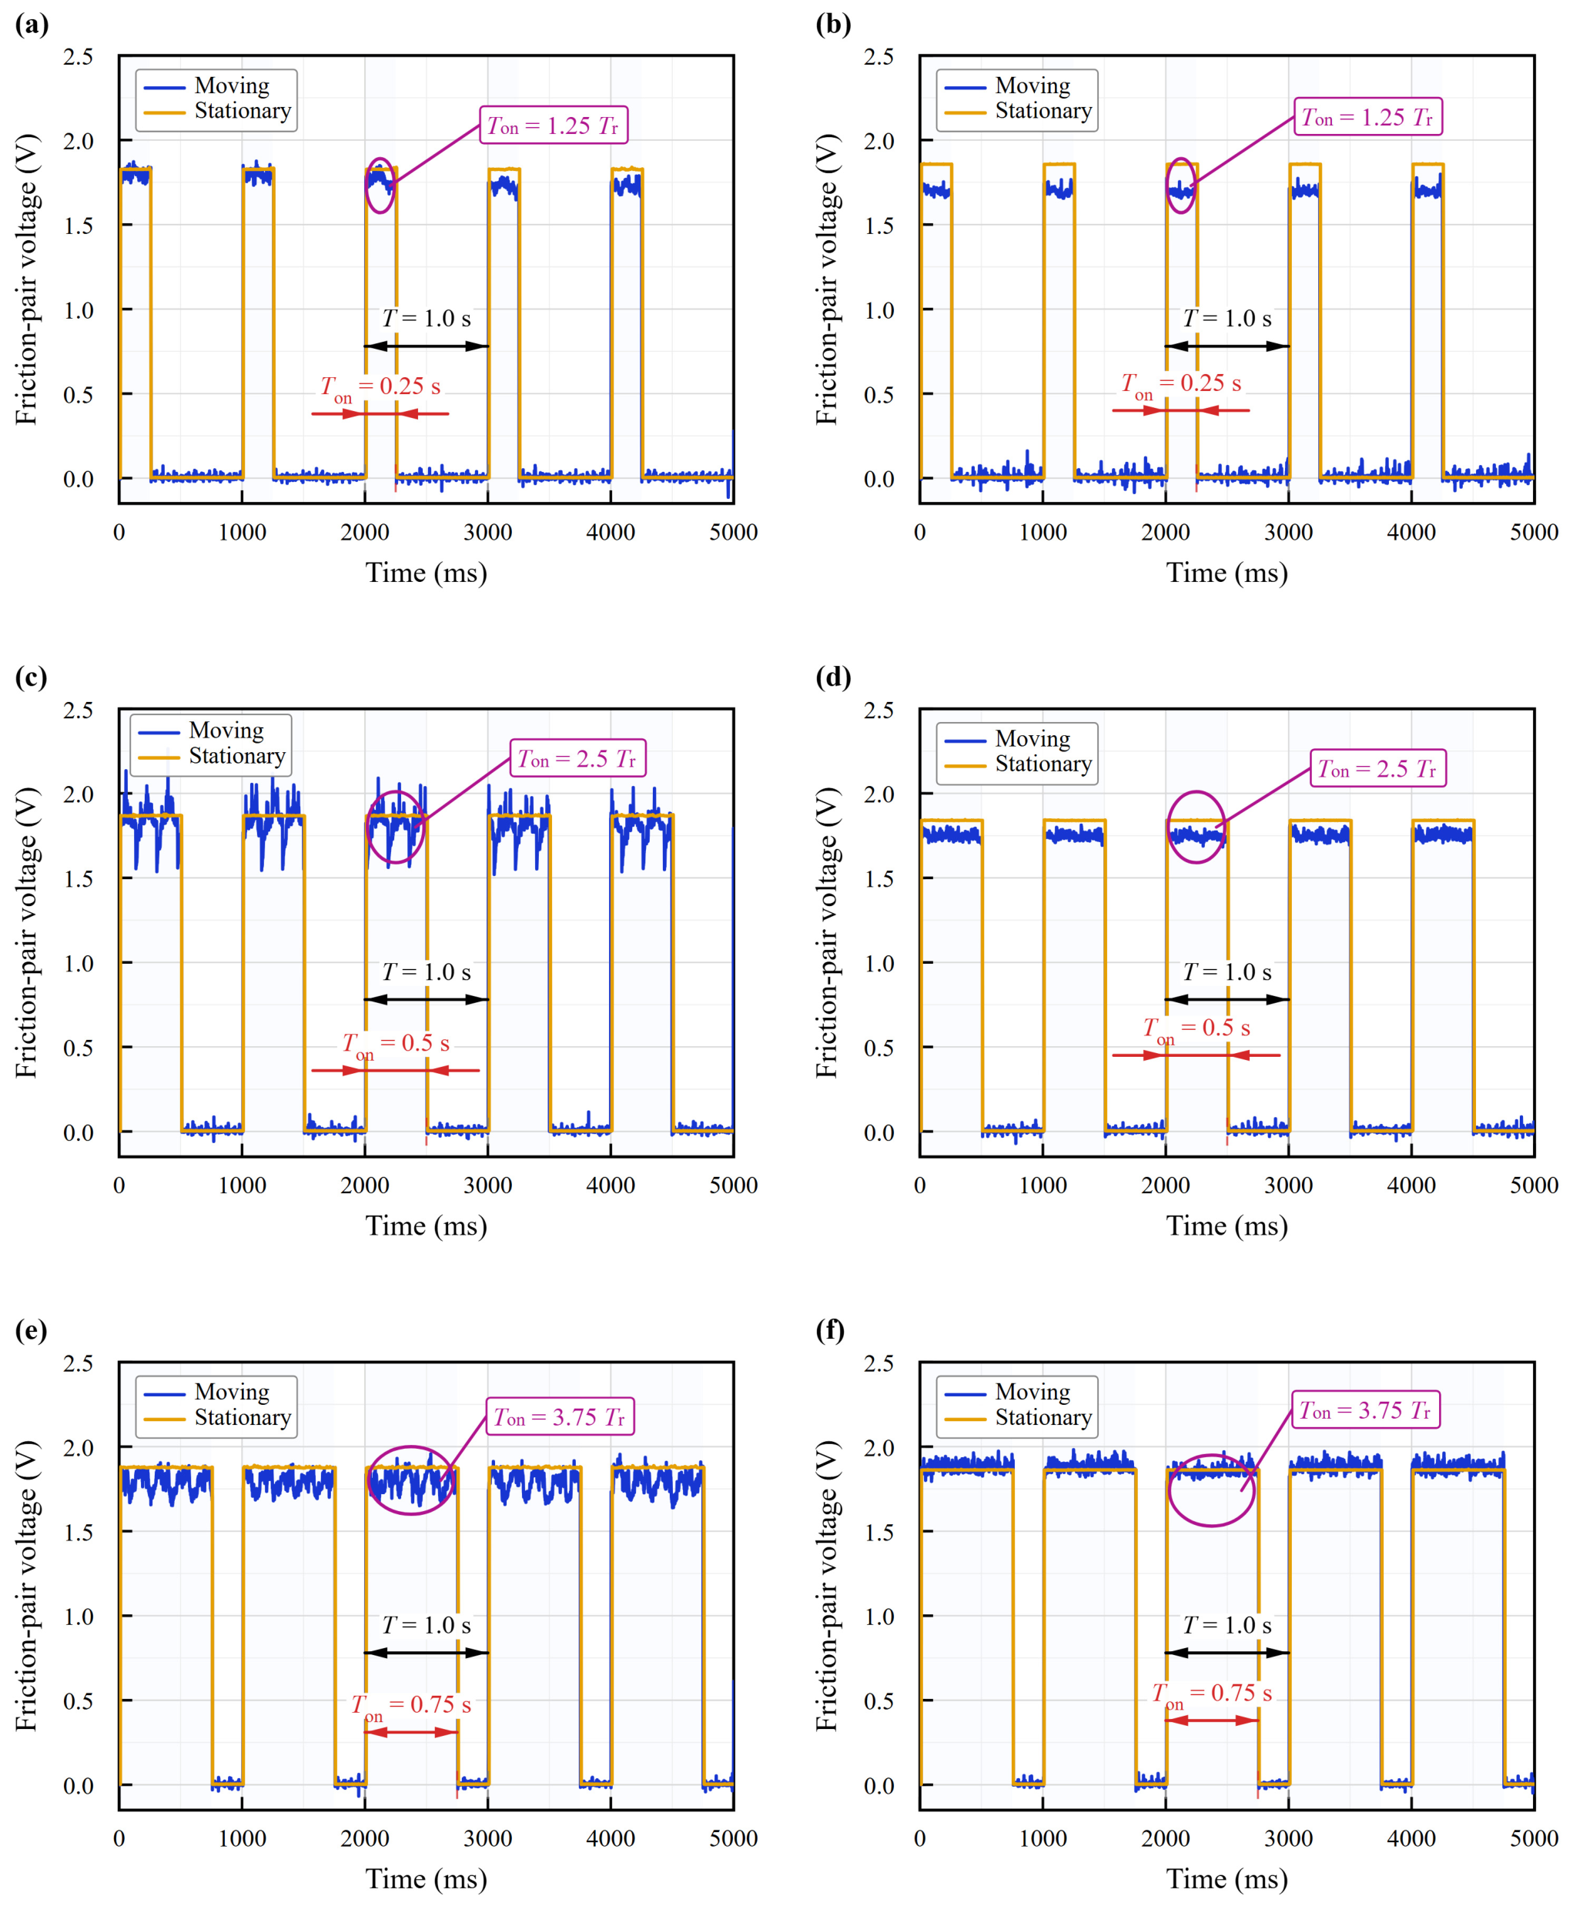
Representative contact-pair voltage waveforms under static loading and reciprocating motion: (a,b) D = 0.25, (c,d) D = 0.50, and (e,f) D = 0.75; the left and right columns correspond to dry sliding and PAO 40 lubrication, respectively.
Figure 4.
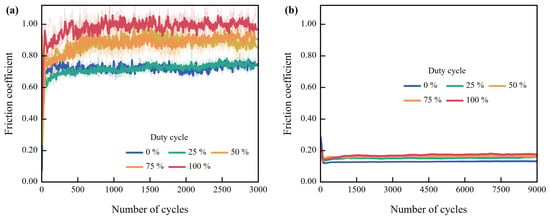
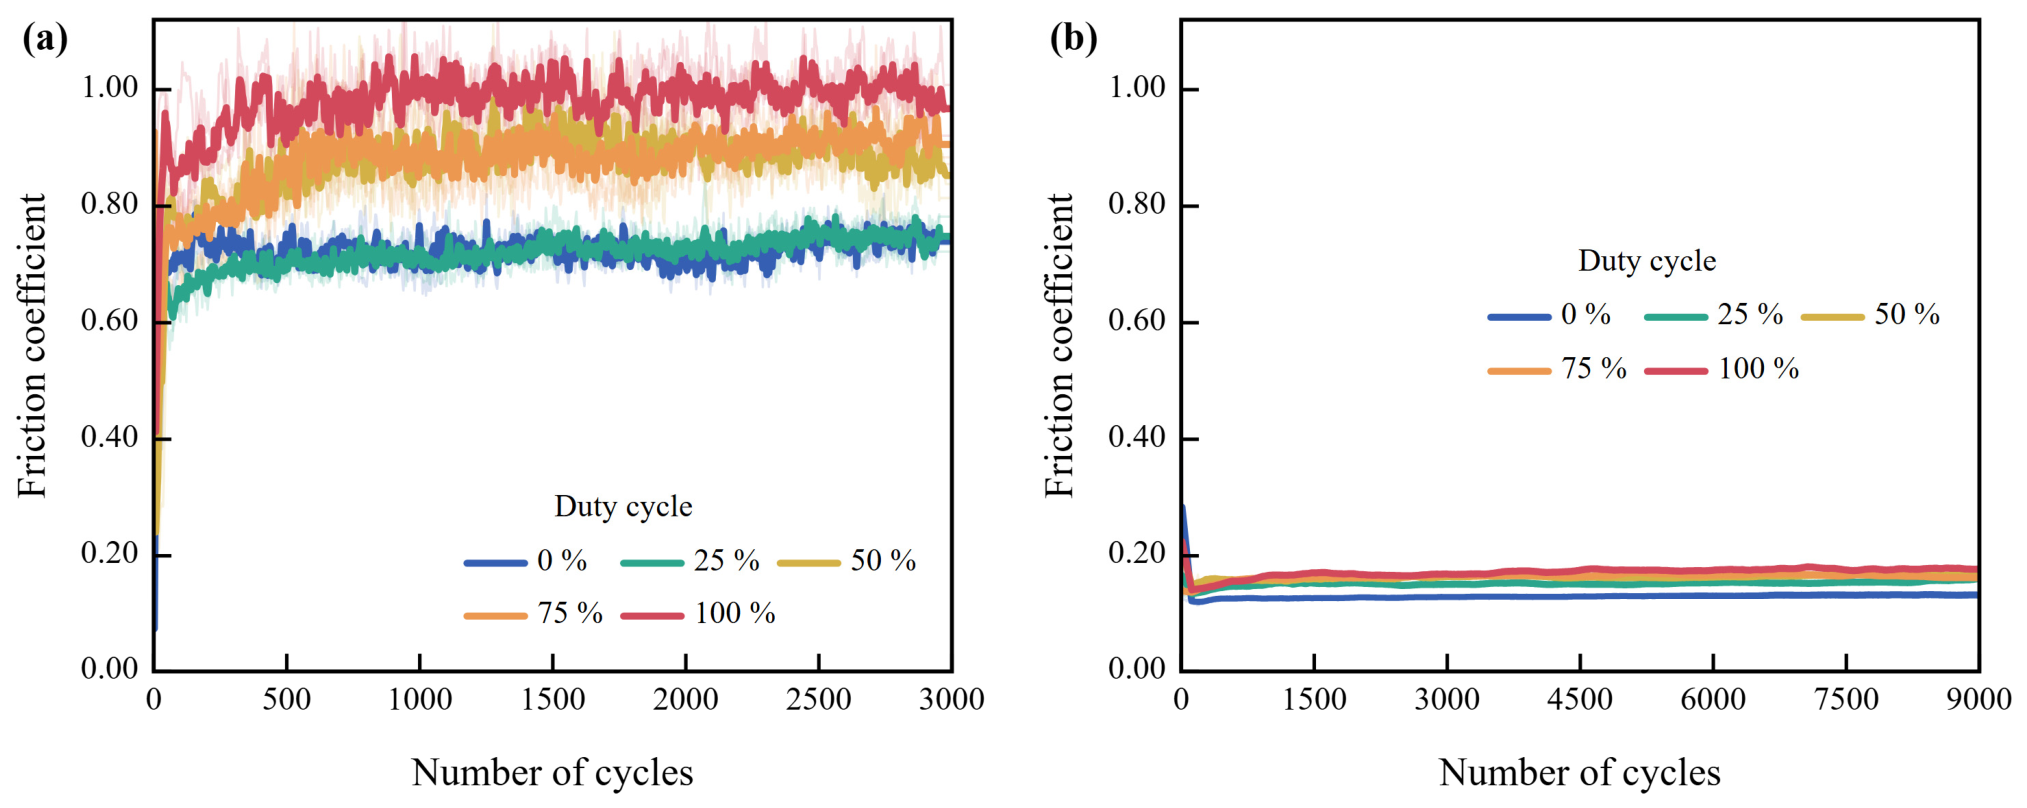
Coefficient of friction versus reciprocating cycles at different nominal duty cycles: (a) dry sliding and (b) PAO 40 lubrication.
Figure 5.
Mean coefficient of friction over the final 50% of cycles in each test at different nominal duty cycles: (a) dry sliding and (b) PAO 40 lubrication.
3.1. Contact Resistance and Contact-Pair Voltage
Figure 2 shows the apparent electrical contact resistance (Rapp) of the ball–disk contact pair during the first 600 s under continuous DC. The data were obtained under a load of 6 N for dry sliding and PAO 40 lubrication. After sliding began, Rapp under dry sliding initially decreased rapidly and then increased again, accompanied by large fluctuations. Under PAO 40 lubrication, Rapp initially decreased slightly and then gradually increased again. After a relatively stable stage was reached, Rapp was generally higher under dry sliding and exhibited several abrupt increases and decreases. Under PAO 40 lubrication, Rapp was lower and the curve was more stable. During running-in, the real contact areas, wear debris, and surface coverings changed continuously, and conductive paths were consequently established, disrupted, and reorganized. Therefore, Rapp can reflect changes in the contact state [23]. Figure 2 reflects the equivalent conduction state of the entire ball–disk contact pair. PAO 40 is an electrically insulating base oil. However, under a boundary/mixed lubrication regime, metallic asperity contacts not completely separated by the oil film can still form conductive paths. Current can also alter the oil film thickness and contact resistance [23,25]. The lower and more stable Rapp under PAO 40 lubrication indicated that relatively stable conductive microcontacts remained in the contact region. The broad fluctuations under dry sliding corresponded to frequent changes in the conductive paths. In particular, the brief resistance decrease at approximately 360 s under dry sliding, followed by recovery, indicated a temporary increase in electrical conductance. This may result from debris redistribution or local rupture of surface coverings, temporarily enhancing conduction through metallic microcontacts. Subsequent reorganization of the conductive paths could account for the resistance recovery and fluctuations, consistent with the contact-state-dependent ECR variations reported in Ref. [23].
Figure 3 compares 5 consecutive cycles of the voltage waveform (Uc(t)) across the ball–disk contact pair. The waveforms were acquired under a 5 V, 1 Hz periodically switched voltage during static loading at 6 N and after 120 s of reciprocating motion. The nominal duty cycles were D = 0.25, 0.50, and 0.75. The left and right columns correspond to dry sliding and PAO 40 lubrication, respectively. The stationary waveforms were acquired under a load of 6 N before reciprocating motion began, whereas the moving waveforms were acquired after 120 s of sliding. T and Tr denote the voltage period and mechanical reciprocation period, respectively. The stationary waveforms in Figure 3 show an on-state contact-pair voltage (Uc,0) of approximately 1.85 V for all 3 nominal duty cycles. Differences between dry sliding and PAO 40 lubrication were small. The calculation used the 5 V source voltage and the 1.48 Ω equivalent resistance of the fixed external series circuit. The resulting initial static contact resistance (Rc,0) was approximately 0.87 Ω. Together, these values indicate similar initial electrical states among the test groups, with only part of the source voltage appearing across the contact pair. After 120 s of reciprocating motion, the on-state voltage shifted relative to the stationary value. Under dry sliding, the voltages were approximately 1.76, 1.81, and 1.79 V at D = 0.25, 0.50, and 0.75, respectively. Under PAO 40 lubrication, the corresponding voltages were approximately 1.69, 1.75, and 1.88 V. At D = 0.25 and 0.50, the voltages under PAO 40 lubrication were lower than those under dry sliding. At D = 0.75, the order was reversed. Because the source voltage and external circuit were the same, these differences mainly arose from the contact states formed during motion. Determining whether these voltage responses involved oil film separation or breakdown also requires consideration of the waveform characteristics and wear-track morphology. Elastohydrodynamic lubricated contacts can exhibit a capacitive response resulting from oil film separation [26]. A continuous oil film can provide sufficient separation between the two surfaces [27]. When the electric field in the oil film reaches its dielectric strength, breakdown and discharge may occur [12,20]. Noguchi et al. [11] reported that a DC voltage of 1.3–1.5 V was required for current to pass through the lubricant film in grease-lubricated miniature bearings. Accordingly, the absolute contact-pair voltage alone is insufficient to determine whether discharge occurred.
The on-state voltage plateau in the moving waveforms under PAO 40 lubrication remained between 1.69 and 1.88 V. No voltage transient characterized by a rapid decrease after oil film charging was observed. SEM images of the wear tracks also showed no dense circular pits or melting-resolidification features. Together with the lower and more stable Rapp in Figure 2, these electrical and morphological observations are consistent with a boundary/mixed lubrication regime. These observations indicate that current was carried mainly through metallic microcontacts that were not completely separated by the oil film. The external series circuit also contributed to voltage division, making the actual voltage across the contact pair lower than the source voltage. In each 1 s period, the on-times were approximately 0.25, 0.50, and 0.75 s at D = 0.25, 0.50, and 0.75, respectively. These intervals corresponded to 1.25, 2.50, and 3.75 reciprocation cycles, respectively. As the on-time increased, the waveform contained more reciprocation-related fluctuations. The voltage plateau fluctuated more noticeably under dry sliding but was more stable under PAO 40 lubrication. This difference indicates that changes in contact caused by steel-ball motion were reflected in the contact-pair voltage.
Figure 2 and Figure 3 show more pronounced resistance and voltage fluctuations at the dry-sliding interface. By comparison, the electrical response of the PAO 40-lubricated interface was more stable. The nominal duty cycle specifies the source-side on-time. The actual voltage across the contact pair varies with the external circuit and the interfacial conduction state. It is therefore not a direct replica of the 5 V source voltage waveform.
3.2. Friction Under Different Nominal Duty Cycles
Figure 4 shows the variation in the coefficient of friction with the number of reciprocating cycles at different nominal duty cycles. For each condition, Figure 4 presents one representative raw-data curve (light thin line) and its 10-point moving-average curve (thick solid line). The moving average was used only to show the trend. The mean coefficients of friction and their standard errors were calculated from the raw data. After rapid running-in, the dry-sliding curves reached a relatively high friction level and exhibited pronounced fluctuations. Figure 4a,b show the coefficient-of-friction curves under dry sliding and PAO 40 lubrication, respectively. Under dry sliding, the coefficients of friction at D = 0 and D = 0.25 were close. Those at D = 0.50 and D = 0.75 were higher, while the coefficient of friction was highest under continuous DC, showing a stepwise increase. The curves under PAO 40 lubrication decreased rapidly at the beginning and then slowly approached stable levels. From the running-in stage onward, the curve at D = 0.25 remained above that at D = 0. The curves for D = 0.50–1.00 were relatively close.
Figure 5 shows the mean coefficient of friction over the final 50% of cycles in each test. Figure 5a,b further show that the mean coefficient of friction increased overall with D under both lubrication conditions, with a greater increase under dry sliding. Under PAO 40 lubrication, the mean coefficient of friction increased from 0.132 at D = 0 to 0.177 at D = 1.00. The values at D = 0.50 and D = 0.75 were both approximately 0.17. Both the friction level and curve fluctuations under PAO 40 lubrication were lower than those under dry sliding. However, the coefficient of friction under the energized conditions remained higher than that under the off condition.
3.3. Friction Response Under the Same Nominal Total On-Time
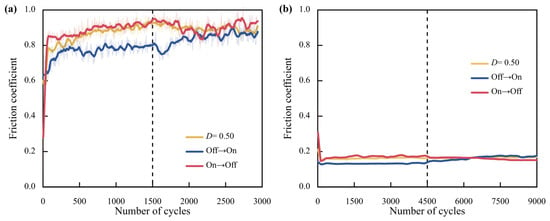
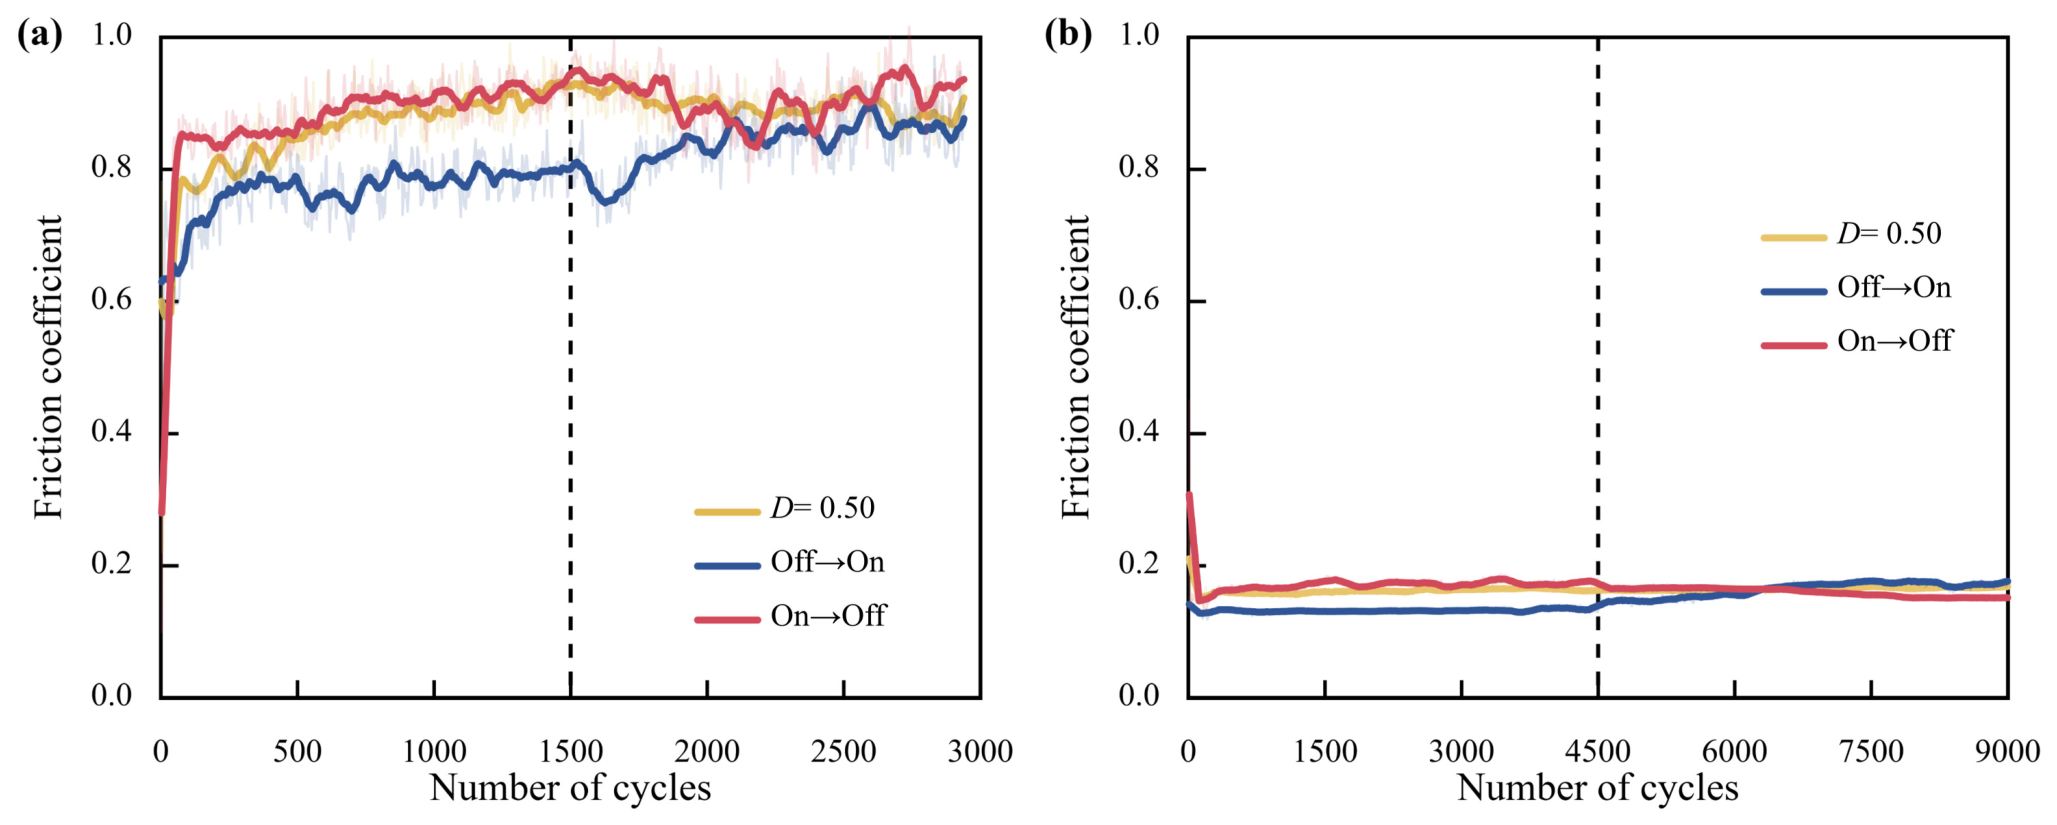
Figure 6 compares the coefficients of friction under periodic D = 0.50, off→on and on→off for dry sliding and PAO 40 lubrication, respectively. Periodic D = 0.50 maintained 1 Hz switching throughout the test. The off→on condition was de-energized during the first half and continuously energized with DC during the second half. The sequence was reversed for on→off, and the dashed line marks the switching point. All three conditions had a nominal total on-time of 50% of the test duration.
Figure 6.
Coefficient-of-friction evolution for periodic D = 0.50, off→on and on→off at the same nominal total on-time: (a) dry sliding and (b) PAO 40 lubrication.
In the dry-sliding tests (Figure 6a), the coefficient of friction for off→on was lower during the first half than it was under periodic switching at D = 0.50. It was also lower than under on→off. The coefficient of friction under off→on increased gradually after continuous DC was applied. Under on→off, the coefficient of friction remained high after continuous DC was switched off at the test midpoint and exhibited relatively large fluctuations. Under PAO 40 lubrication (Figure 6b), the differences among the three curves were smaller. Under off→on, however, the coefficient of friction also increased gradually after continuous DC was applied. Under on→off, it decreased slowly after continuous DC was switched off. After the electrical state was switched under off→on or on→off, the coefficient of friction did not change immediately but continued to evolve slowly. Comparable gradual responses have been reported in potential-switching experiments [28] and boundary-film feedback-control studies [29]. This suggests that friction after switching remains affected by the interfacial state established before switching.
3.4. Wear Statistics, Wear-Track Morphology, and Elemental Distributions
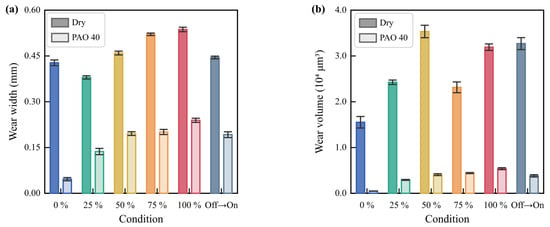
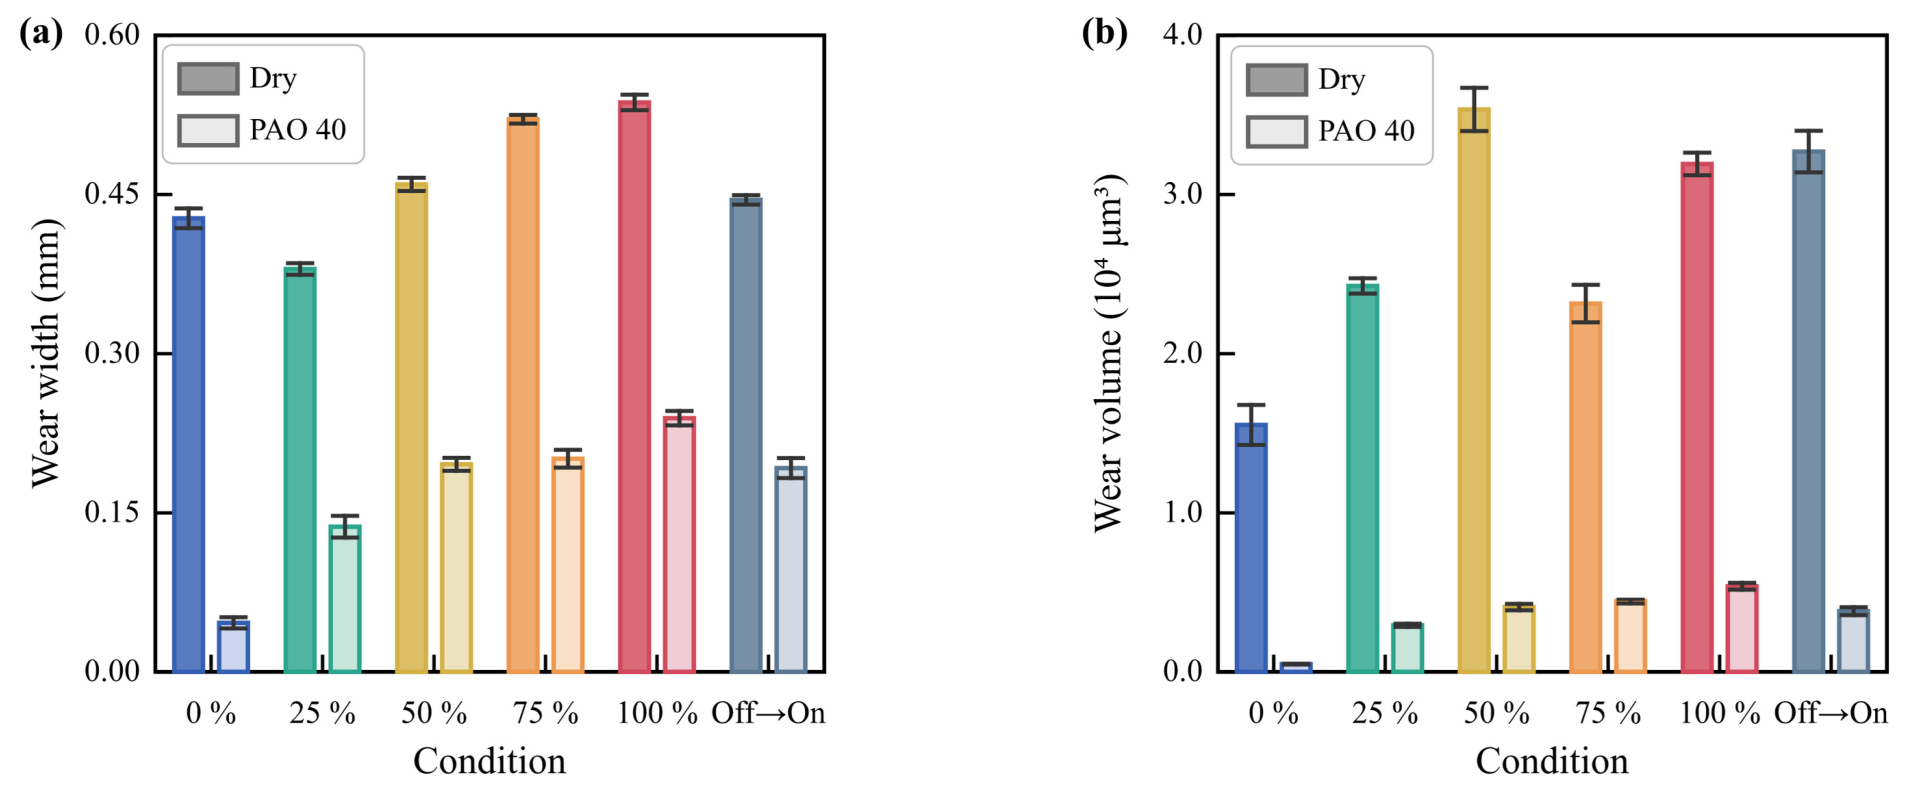
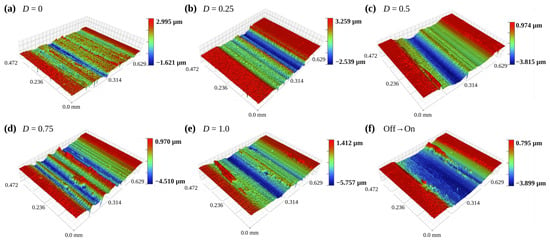
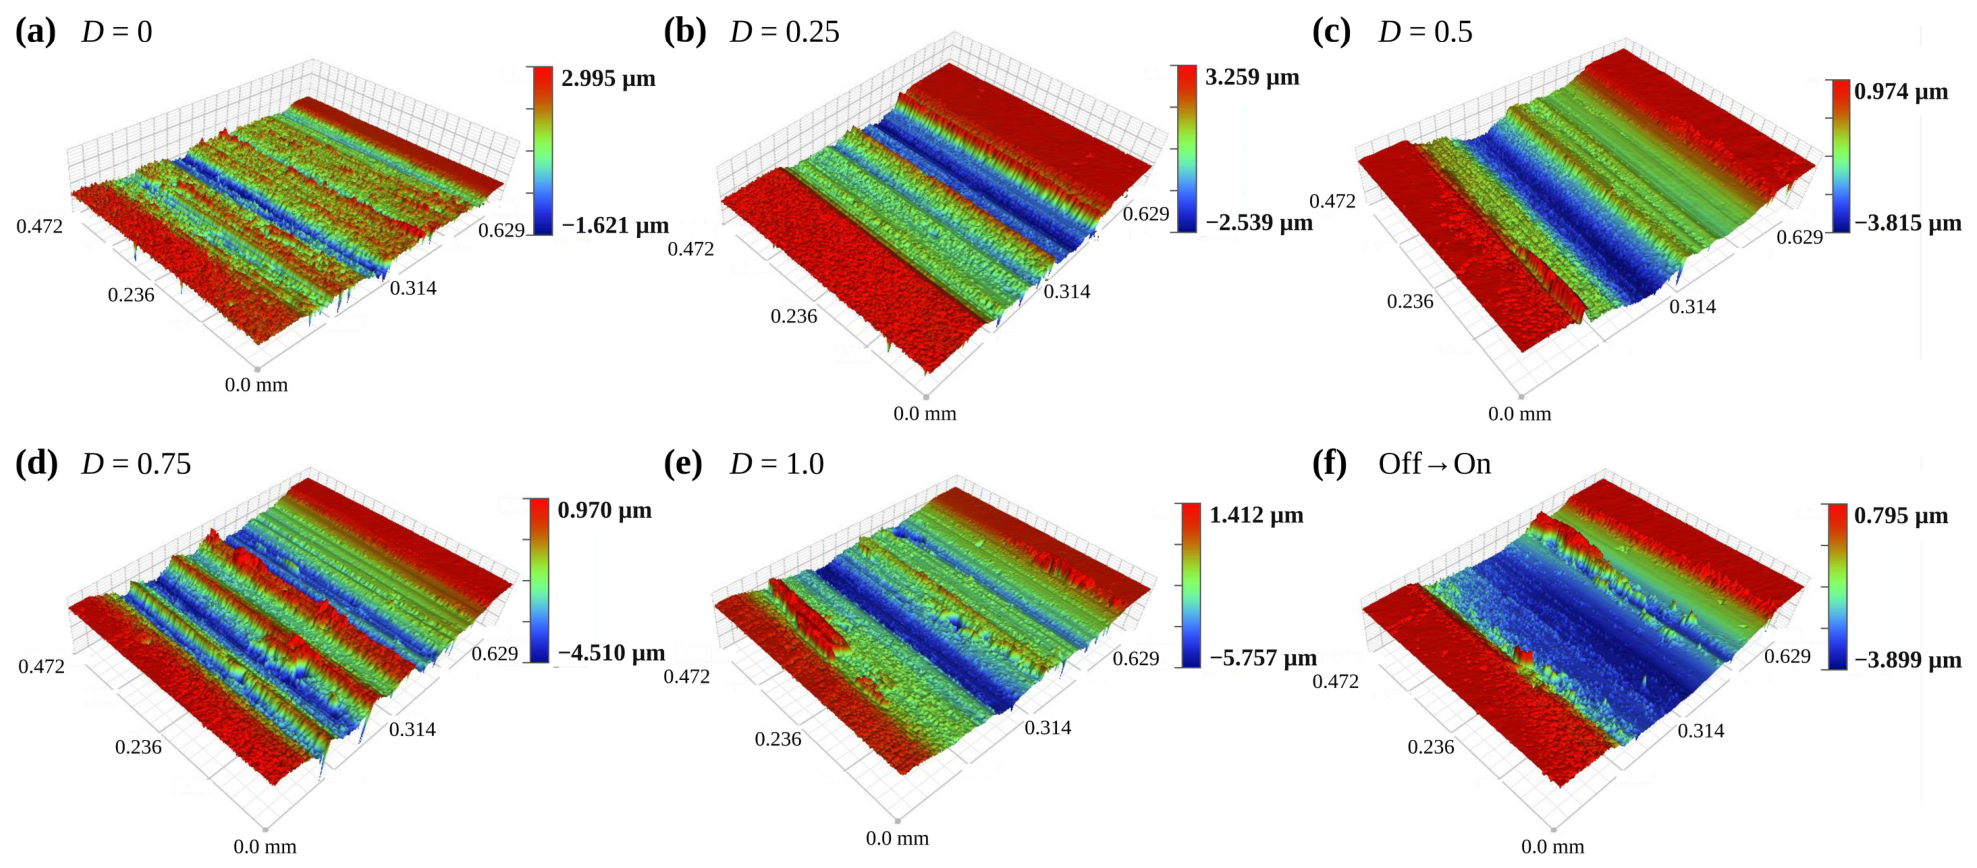
Figure 7 presents the wear-track width and wear volume at different nominal duty cycles and under off→on. Representative two-dimensional profiles and three-dimensional morphologies for the same test conditions are presented in Figure 8 and Figure 9 for dry sliding. Under dry sliding, the wear-track width decreased from 0.4276 mm at D = 0 to 0.3798 mm at D = 0.25. It then increased overall, reaching 0.5367 mm at D = 1.00. The wear volume increased from 1.5525 × 104 μm3 at D = 0 to 3.5342 × 104 μm3 at D = 0.50. It decreased to 2.3148 × 104 μm3 at D = 0.75 and increased again to 3.1918 × 104 μm3 under continuous DC. At D = 0.25, however, the wear-track width was lower than at D = 0, whereas the wear volume was higher. The two metrics therefore did not vary in parallel. From D = 0.50 to D = 0.75, the wear track continued to widen while the wear volume decreased. This contrast indicates that the wear changed in width, depth, and distribution along the track. Accordingly, under dry sliding, the wear-track width and wear volume reached their maximum values at different nominal duty cycles. Under PAO 40 lubrication, the wear-track width increased monotonically from 0.0457 mm at D = 0 to 0.2392 mm at D = 1.00. The wear volume likewise increased monotonically from 0.0479 × 104 μm3 to 0.5391 × 104 μm3. Both metrics changed in the same direction, clearly differing from the non-monotonic response under dry sliding. The different wear trends under dry sliding and PAO 40 lubrication indicate that the lubrication state altered how material loss accumulated as the nominal on-time increased.
Figure 7.
Wear statistics for the duty-cycle series and the off→on condition: (a) wear-track width and (b) wear volume. Bars show mean values and error bars indicate SE (n = 5).
Figure 8.
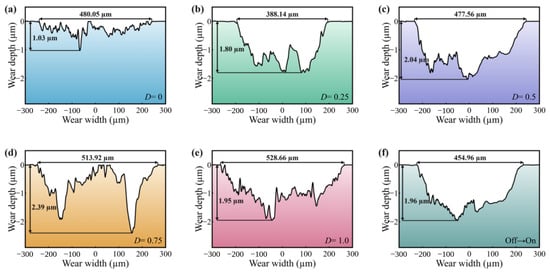
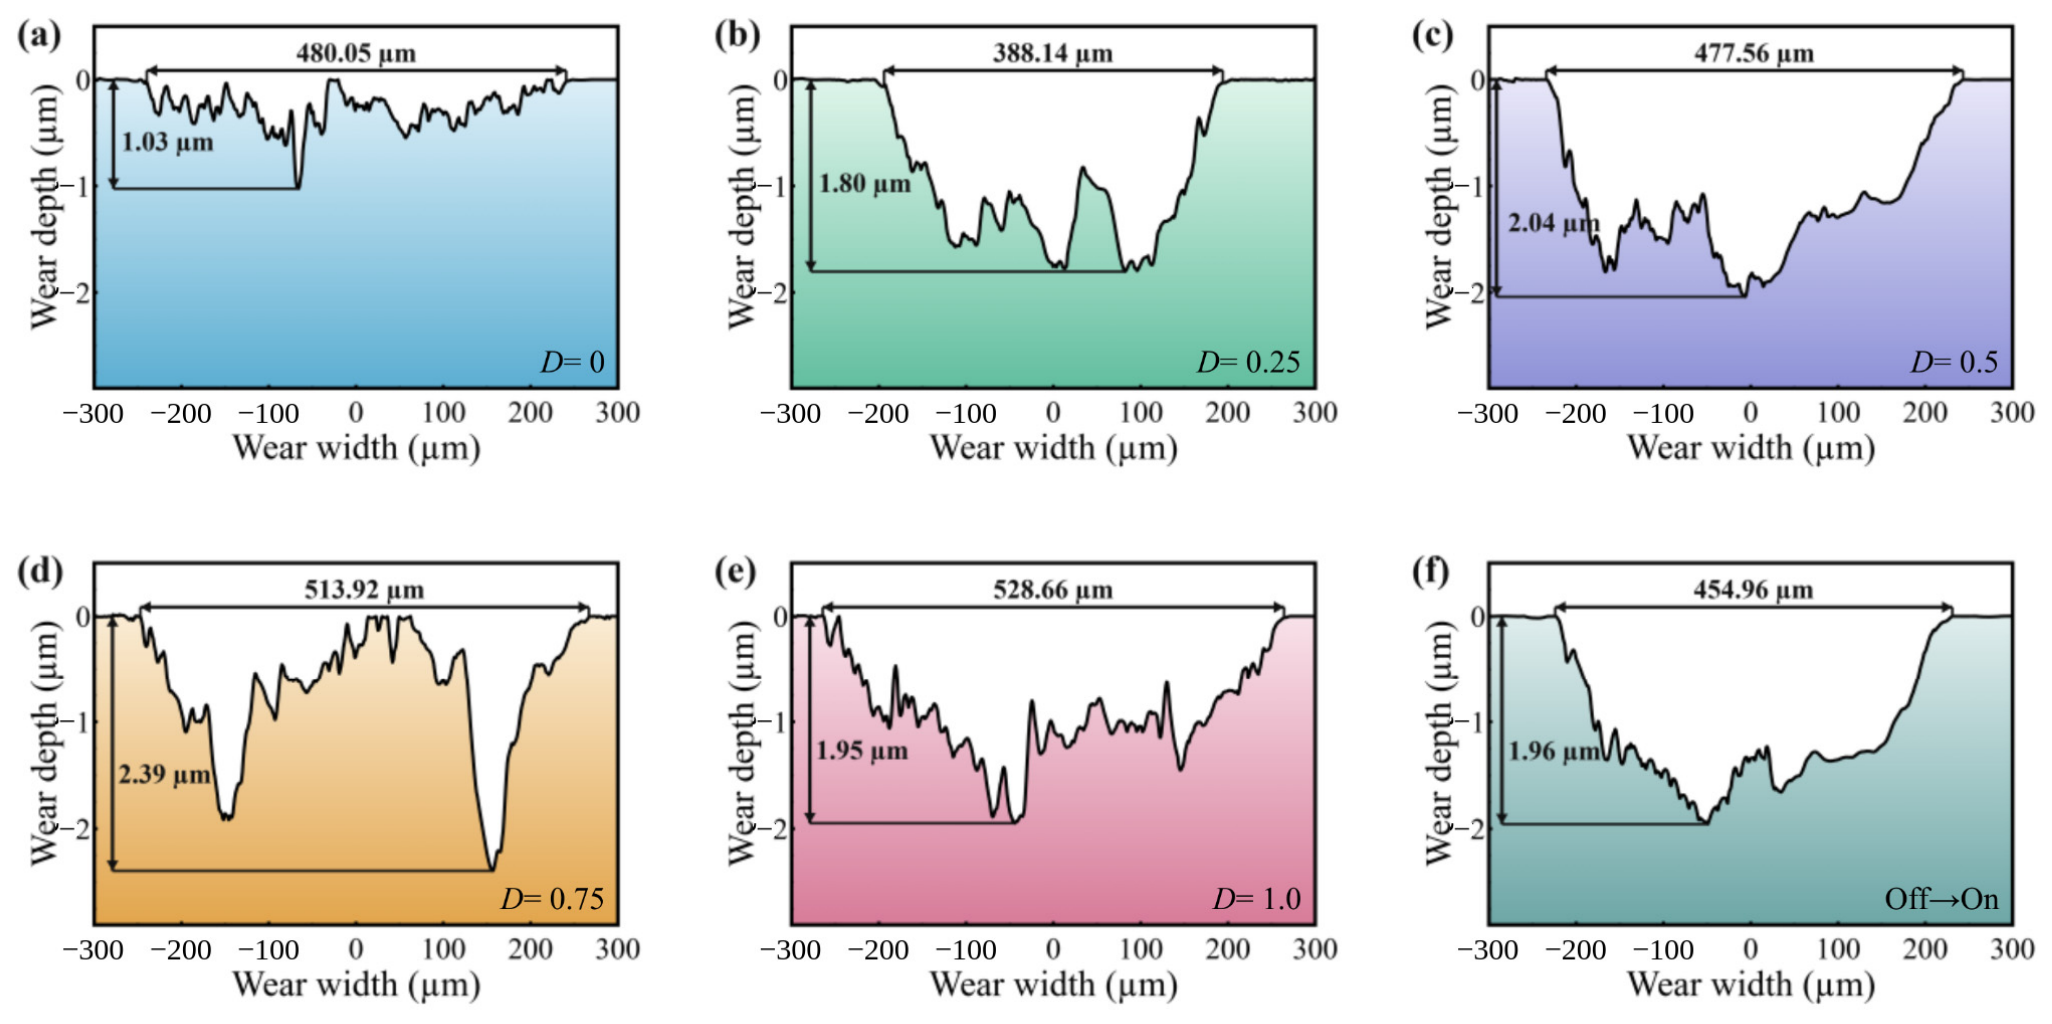
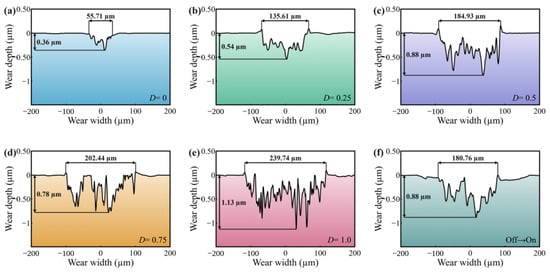
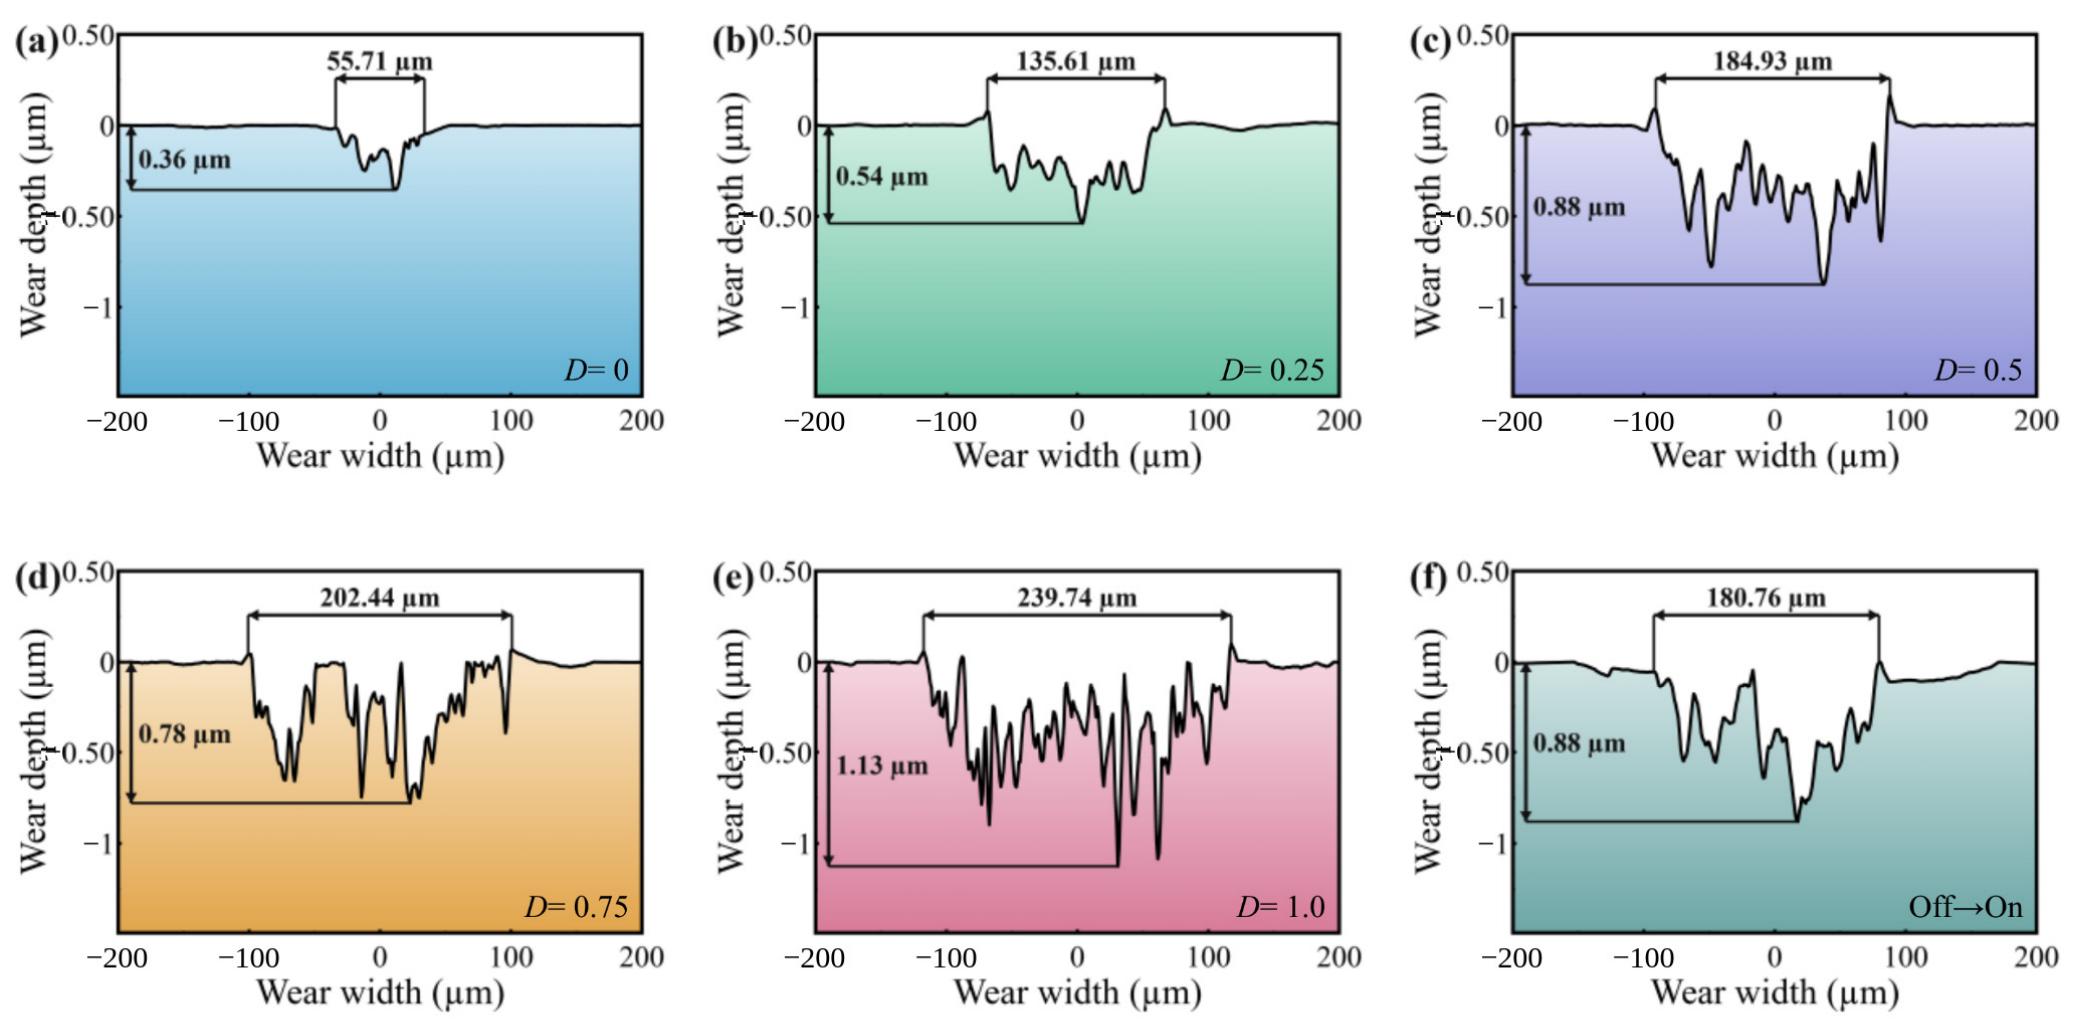
Representative two-dimensional profiles of dry-sliding wear tracks: (a) D = 0; (b) D = 0.25; (c) D = 0.50; (d) D = 0.75; (e) D = 1.00; (f) off→on.
Figure 9.
Representative three-dimensional white-light interferometric morphologies of dry-sliding wear tracks: (a) D = 0; (b) D = 0.25; (c) D = 0.50; (d) D = 0.75; (e) D = 1.00; (f) off→on. Each subfigure uses its own height range, as indicated by the color bar.
Figure 8 and Figure 9 show, respectively, the two-dimensional profiles and three-dimensional white-light interferometric morphologies at the centers of dry-sliding wear tracks in the duty-cycle series and under the off→on condition.
The two-dimensional profiles in Figure 8a–f show irregular depressions in all dry-sliding wear tracks. Material removal was nonuniform across the track width. Within the duty-cycle series, the transverse extent of the wear tracks increased overall with D, whereas the local depth did not change in parallel. The off→on profile also exhibited irregular undulations. At D = 0.75, the representative profile reached a maximum local depth of approximately 2.39 μm, compared with approximately 2.04 μm at D = 0.50, despite its lower wear volume.
The three-dimensional morphologies in Figure 9a–f further show that the D = 0.75 wear track mainly contained several relatively narrow, deep grooves and local depressions. By comparison, D = 0.50 produced a wider and more continuous low-lying region. These observations indicate that greater local depth does not necessarily correspond to greater total wear. They also help explain why wear-track width, local depth, and wear volume did not reach their maximum values at the same duty cycle.
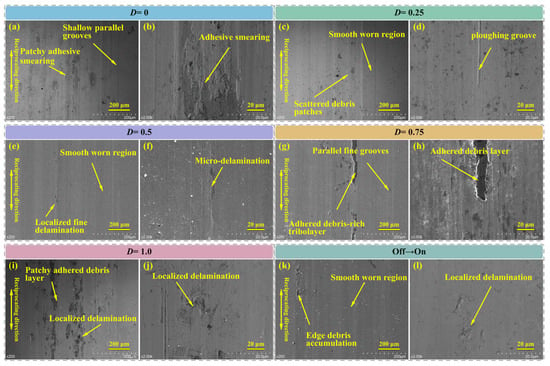
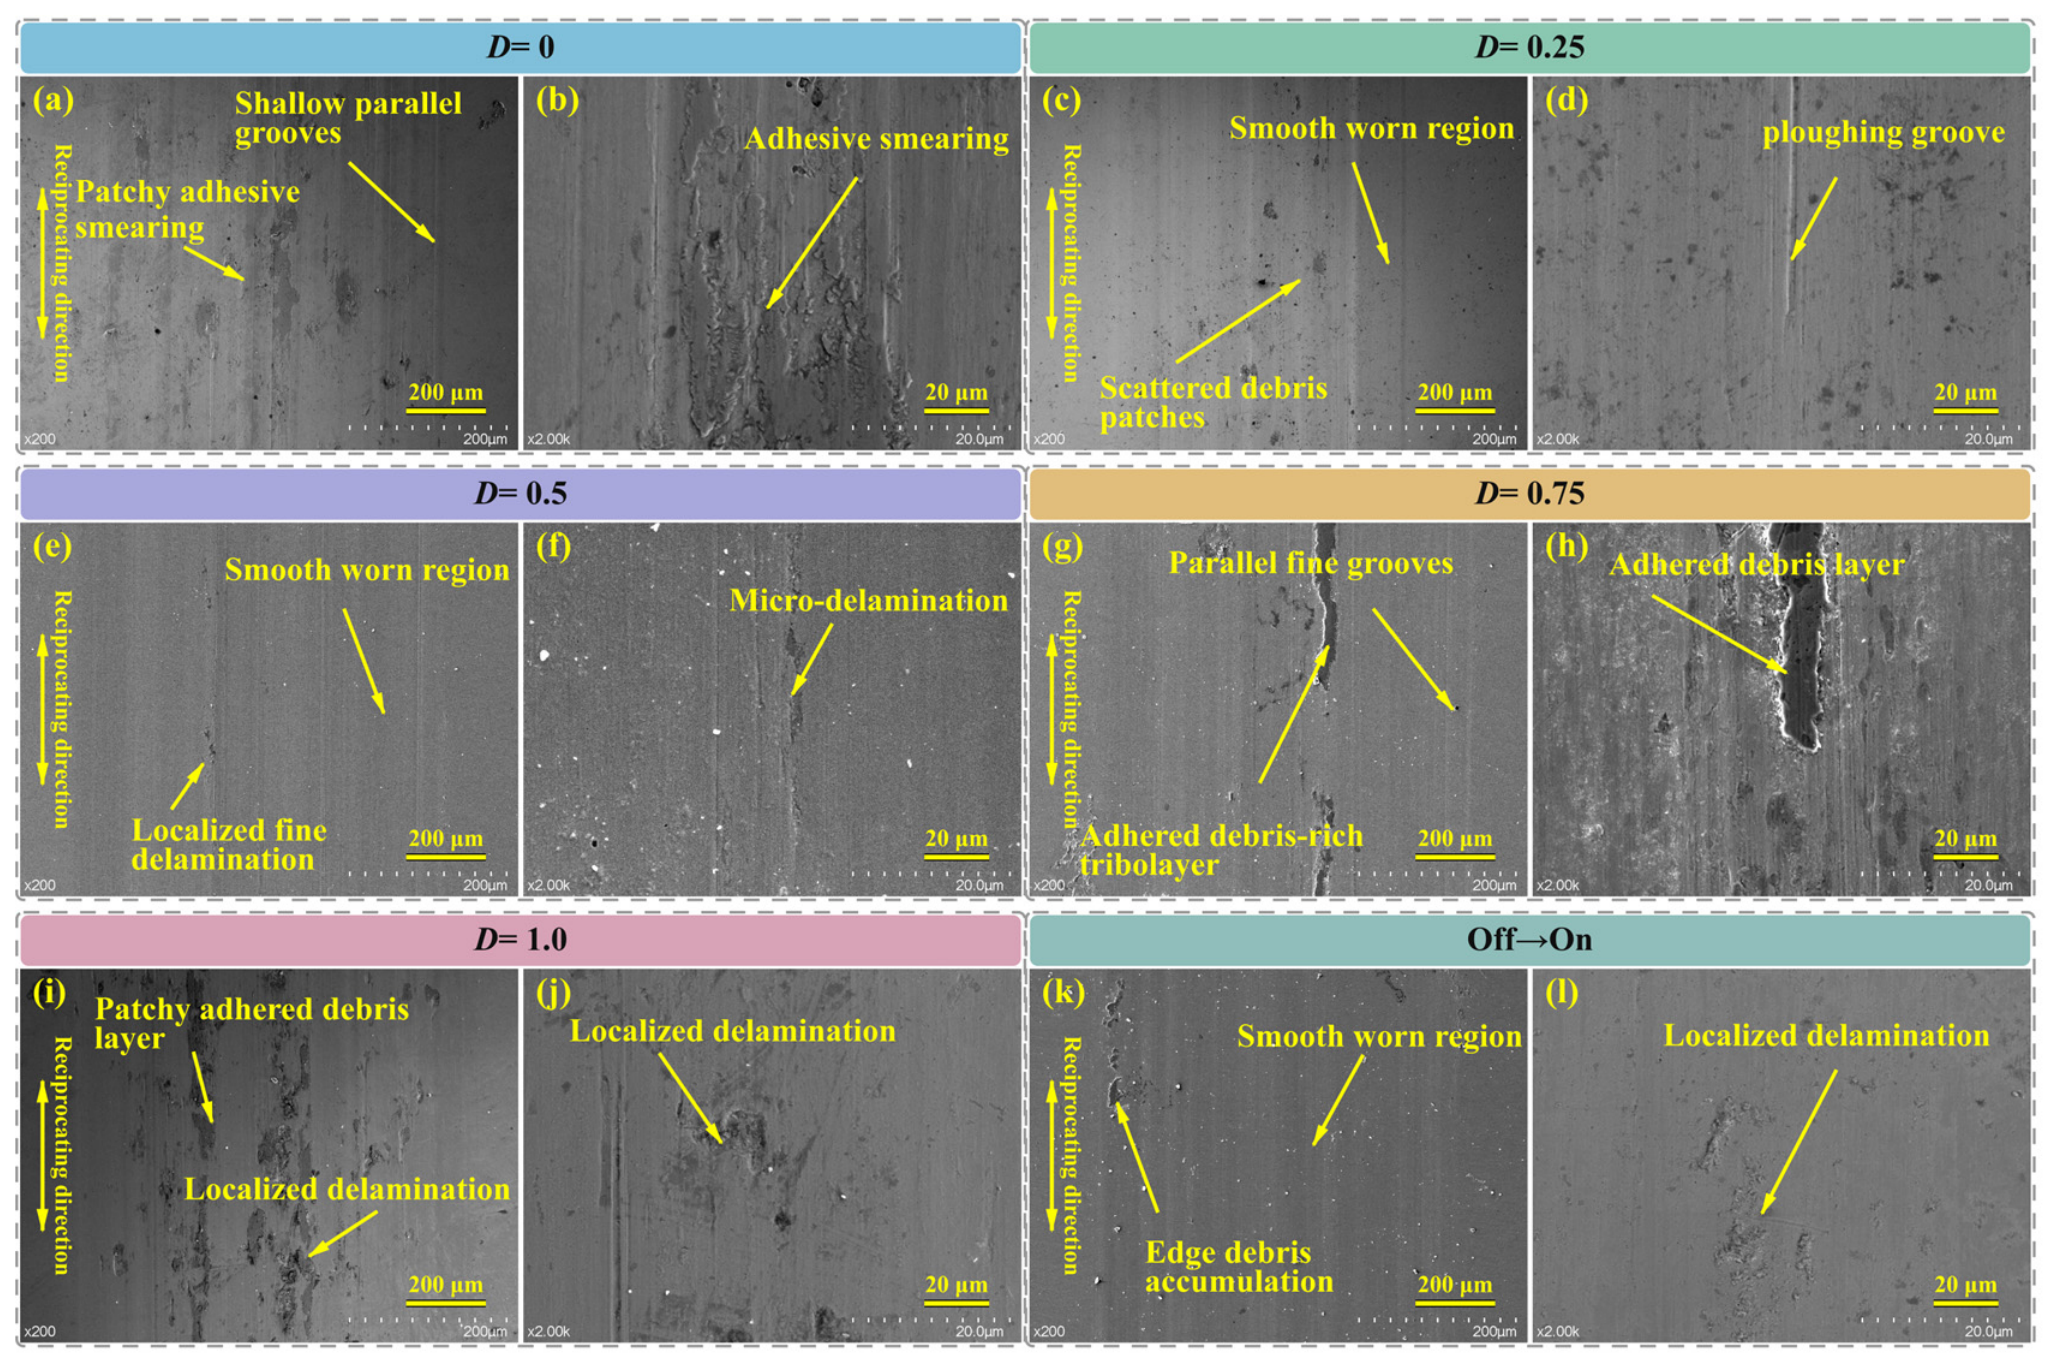
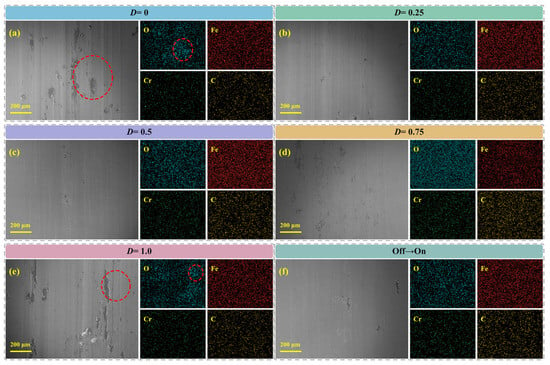
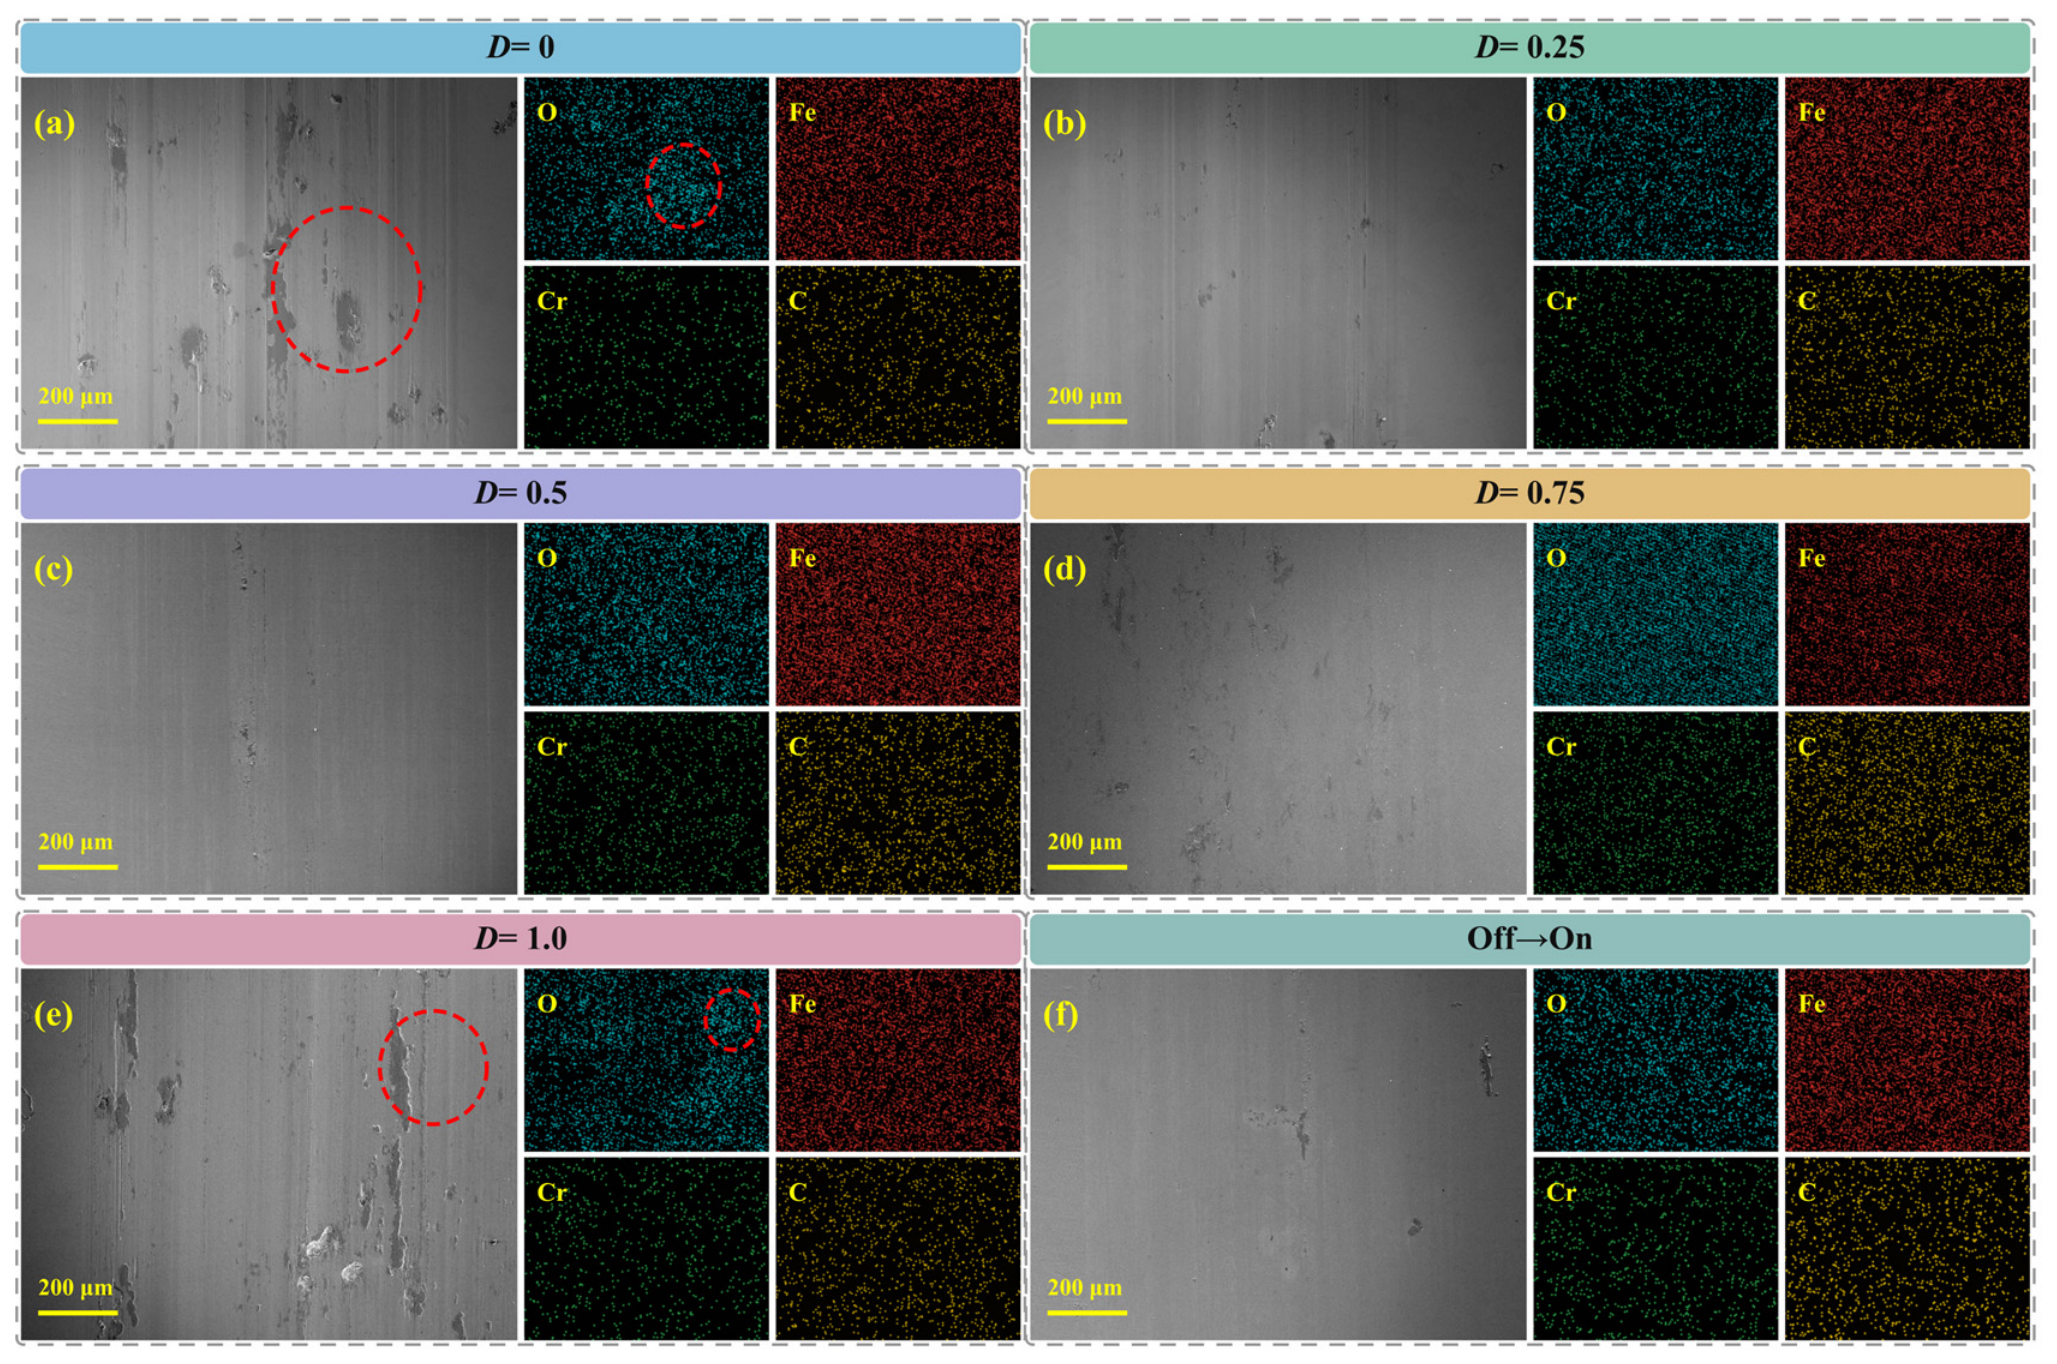
Figure 10 and Figure 11 show the corresponding SEM morphologies and EDS elemental distributions. Figure 10a,b show that the D = 0 wear track was dominated by shallow parallel grooves and patchy smeared areas. These features indicate the coexistence of plowing and local adhesion. At D = 0.25 (Figure 10c,d), a relatively smooth worn area, scattered debris, and local plowing grooves were observed. At D = 0.50 (Figure 10e,f), the surface was relatively smooth and showed only a small amount of fine-scale detachment. However, this condition had the greatest wear volume. This contrast indicates that post-test surface smoothness did not directly correspond to cumulative material loss. At D = 0.75 (Figure 10g,h), parallel fine grooves and adhered debris-rich regions were observed. At D = 1.00 (Figure 10i,j), patchy adhered debris and localized delamination were evident. The wear was characterized by plowing, adhesive transfer, and shear removal of the surface layer. The worn area under the off→on condition (Figure 10k,l) was relatively smooth, but edge accumulation of debris and localized detachment were visible.
Figure 10.
SEM morphologies of dry-sliding wear tracks: (a,b) D = 0; (c,d) D = 0.25; (e,f) D = 0.50; (g,h) D = 0.75; (i,j) D = 1.00; (k,l) off→on.
Figure 11.
SEM images and EDS elemental maps of relatively large central regions of dry-sliding wear tracks: (a) D = 0; (b) D = 0.25; (c) D = 0.50; (d) D = 0.75; (e) D = 1.00; (f) off→on (Red dashed circles indicate local O-enriched regions).
Figure 11 shows elemental maps of Fe, Cr, O, and C. The red dashed circles mark local O-enriched regions. At D = 0 and 1.00, the patchy adhered regions spatially corresponded to stronger O signals. This correspondence indicates that more O-containing material was retained in these regions. At D = 0.50, the surface was more uniform and the O signal was weaker overall. Fe and Cr, both elements of the GCr15 substrate, were distributed under all conditions. O and C varied more markedly among the conditions. These semi-quantitative results were used to compare the retention of O-containing and C-containing materials in the wear tracks.
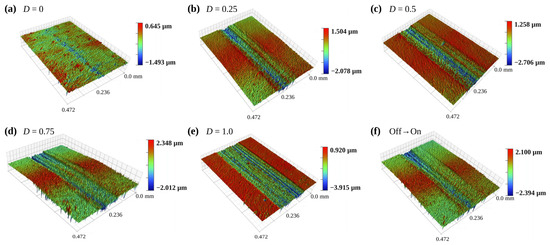
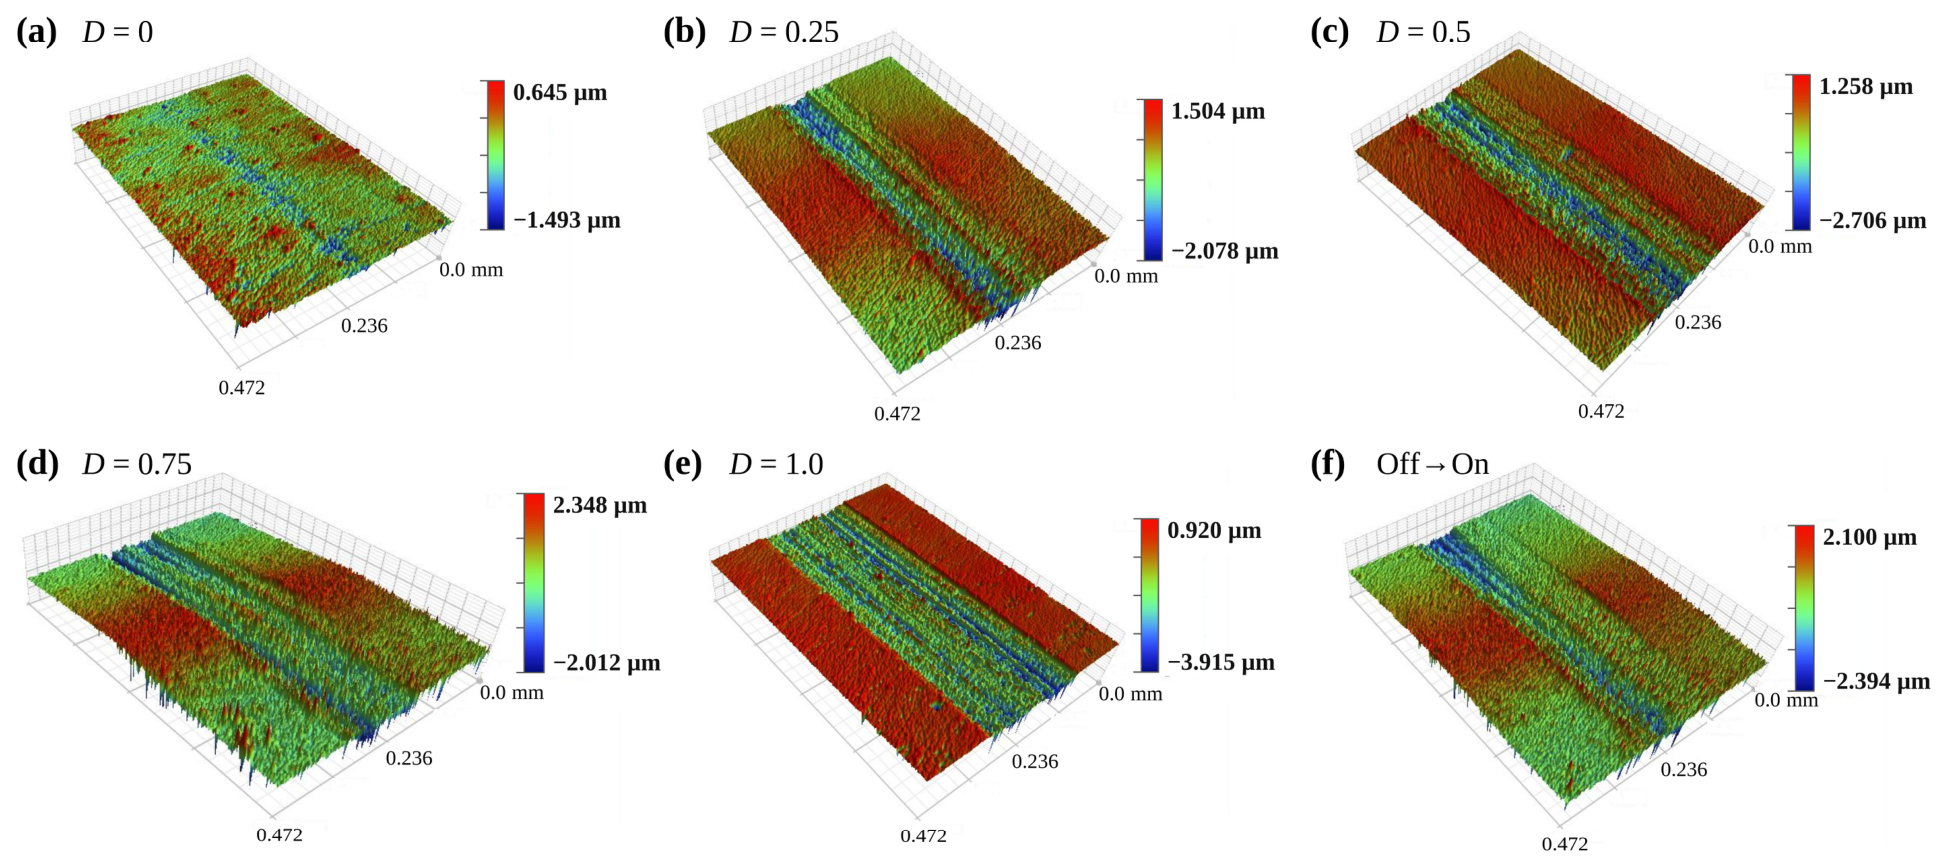
Figure 12 and Figure 13 show, respectively, the two-dimensional profiles and three-dimensional white-light interferometric morphologies at the centers of PAO 40-lubricated wear tracks in the duty-cycle series and under the off→on condition. Within the duty-cycle series, the PAO 40-lubricated wear tracks became wider overall as the duty cycle increased. The local depth varied with condition. The profile at D = 1.00 was relatively deep, whereas the wear track at D = 0 was narrow and shallow. Within the duty-cycle series, continuous grooves, local deep depressions, and edge pile-up gradually appeared as the on-time increased. The continuous grooves indicate repeated plowing by asperities or wear debris along the reciprocating direction. The edge pile-up reflects transverse plastic flow of the surface-layer material. These morphological changes were consistent with the monotonic increases in wear-track width and wear volume with D.
Figure 12.
Representative two-dimensional profiles of PAO 40-lubricated wear tracks: (a) D = 0; (b) D = 0.25; (c) D = 0.50; (d) D = 0.75; (e) D = 1.00; (f) off→on.
Figure 13.
Representative three-dimensional white-light interferometric morphologies of PAO 40-lubricated wear tracks: (a) D = 0; (b) D = 0.25; (c) D = 0.50; (d) D = 0.75; (e) D = 1.00; (f) off→on. Each subfigure uses its own height range, as indicated by the color bar.
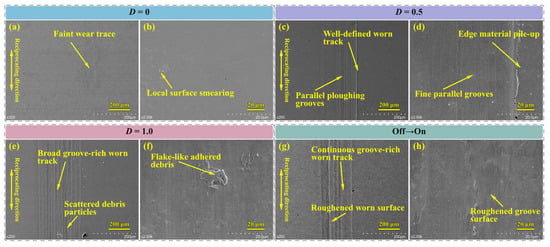
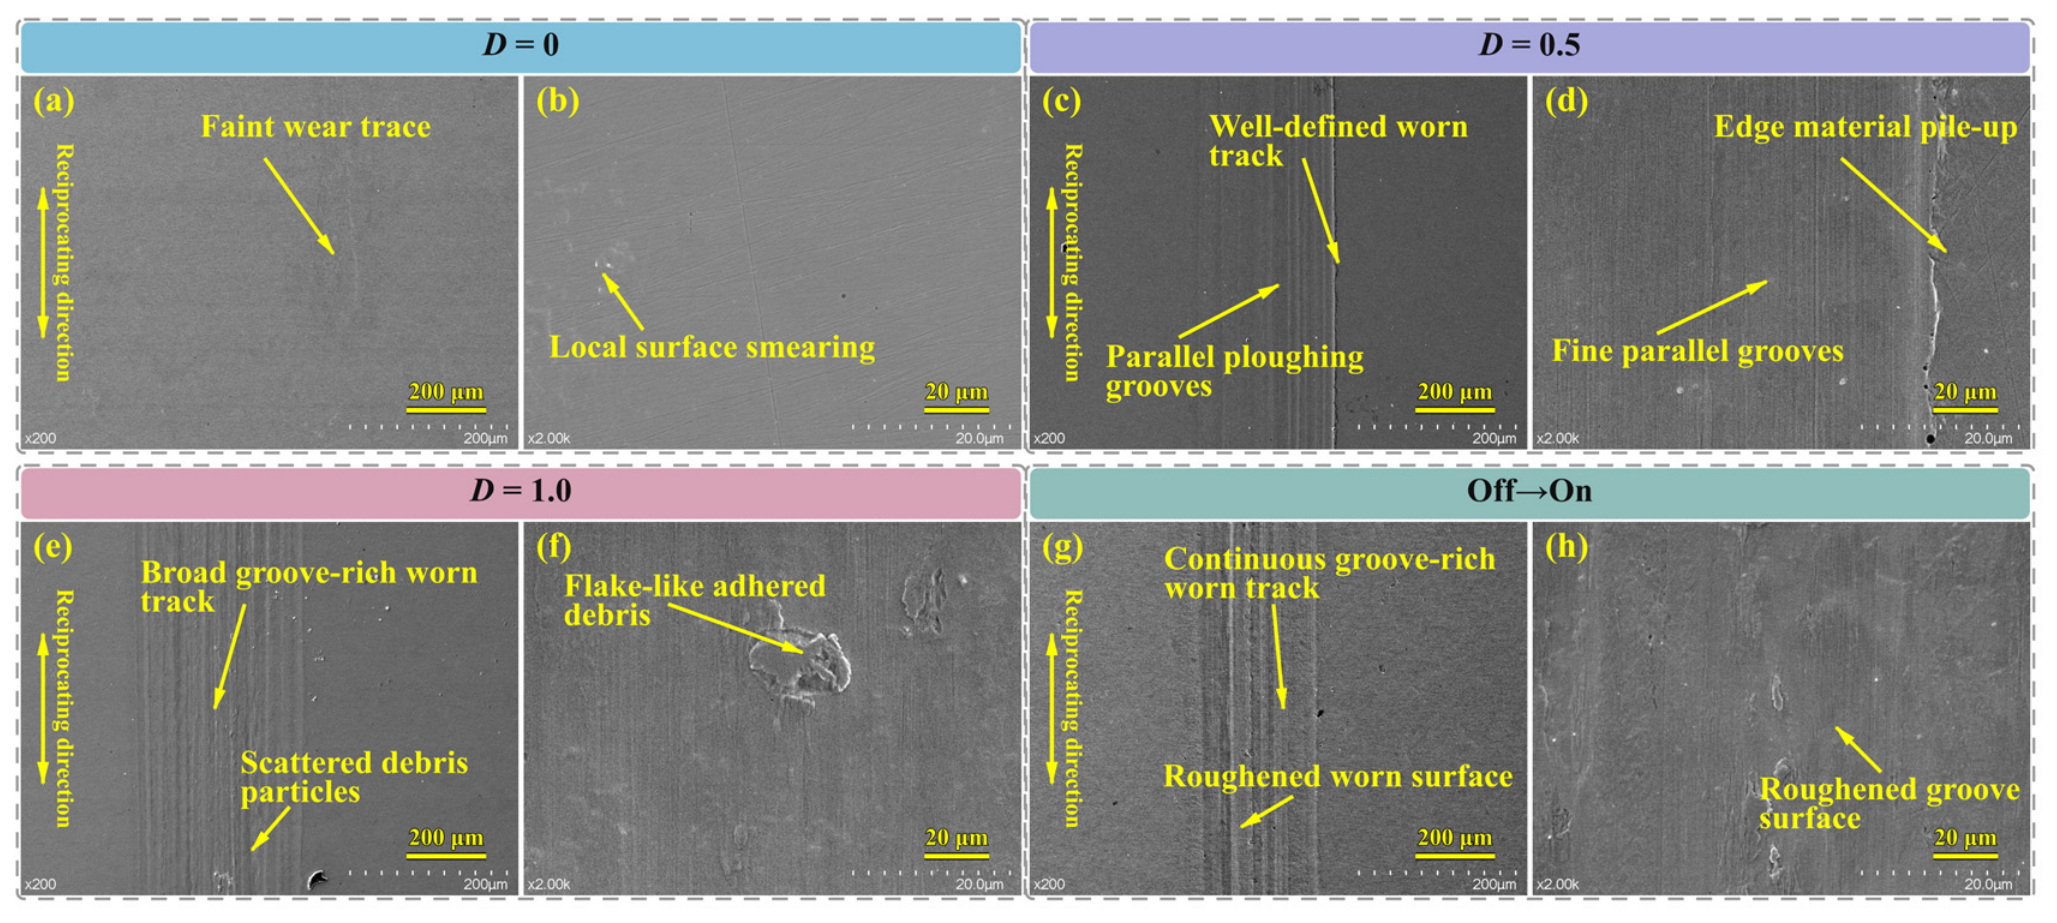
Figure 14 shows SEM characterization of the PAO 40-lubricated wear tracks for D = 0, 0.50, 1.00, and the off→on condition. At D = 0 (Figure 14a,b), only a relatively narrow wear track and slight smearing formed. At D = 0.50 (Figure 14c,d), dense parallel plowing grooves and edge pile-up appeared. At D = 1.00 (Figure 14e,f), a wider grooved region formed, together with particulate and flake-like adhered material. These features reflect reciprocating plowing, surface-layer plastic flow, and local adhesion. They were also consistent with the increase in wear with D shown in Figure 7. Under the off→on condition (Figure 14g,h), continuous grooves and relatively rough regions were visible. Its final morphology differed from the dense plowing grooves and edge pile-up under the periodic D = 0.50 condition. In particular, the parallel grooves in Figure 14c,g indicate an abrasive wear contribution associated with repeated plowing. Under boundary/mixed lubrication, metallic asperity interactions can persist [23], while wear debris can participate in third-body circulation and alter material removal [30]. Therefore, plowing by asperities and/or wear debris provides a plausible explanation for the observed parallel grooves.
Figure 14.
SEM morphologies of PAO 40-lubricated wear tracks: (a,b) D = 0; (c,d) D = 0.50; (e,f) D = 1.00; (g,h) off→on.
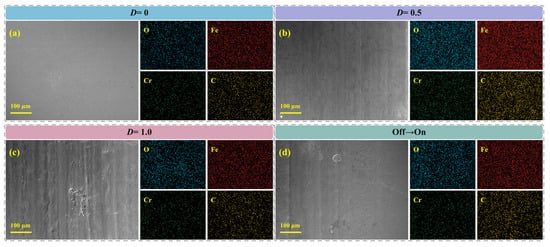
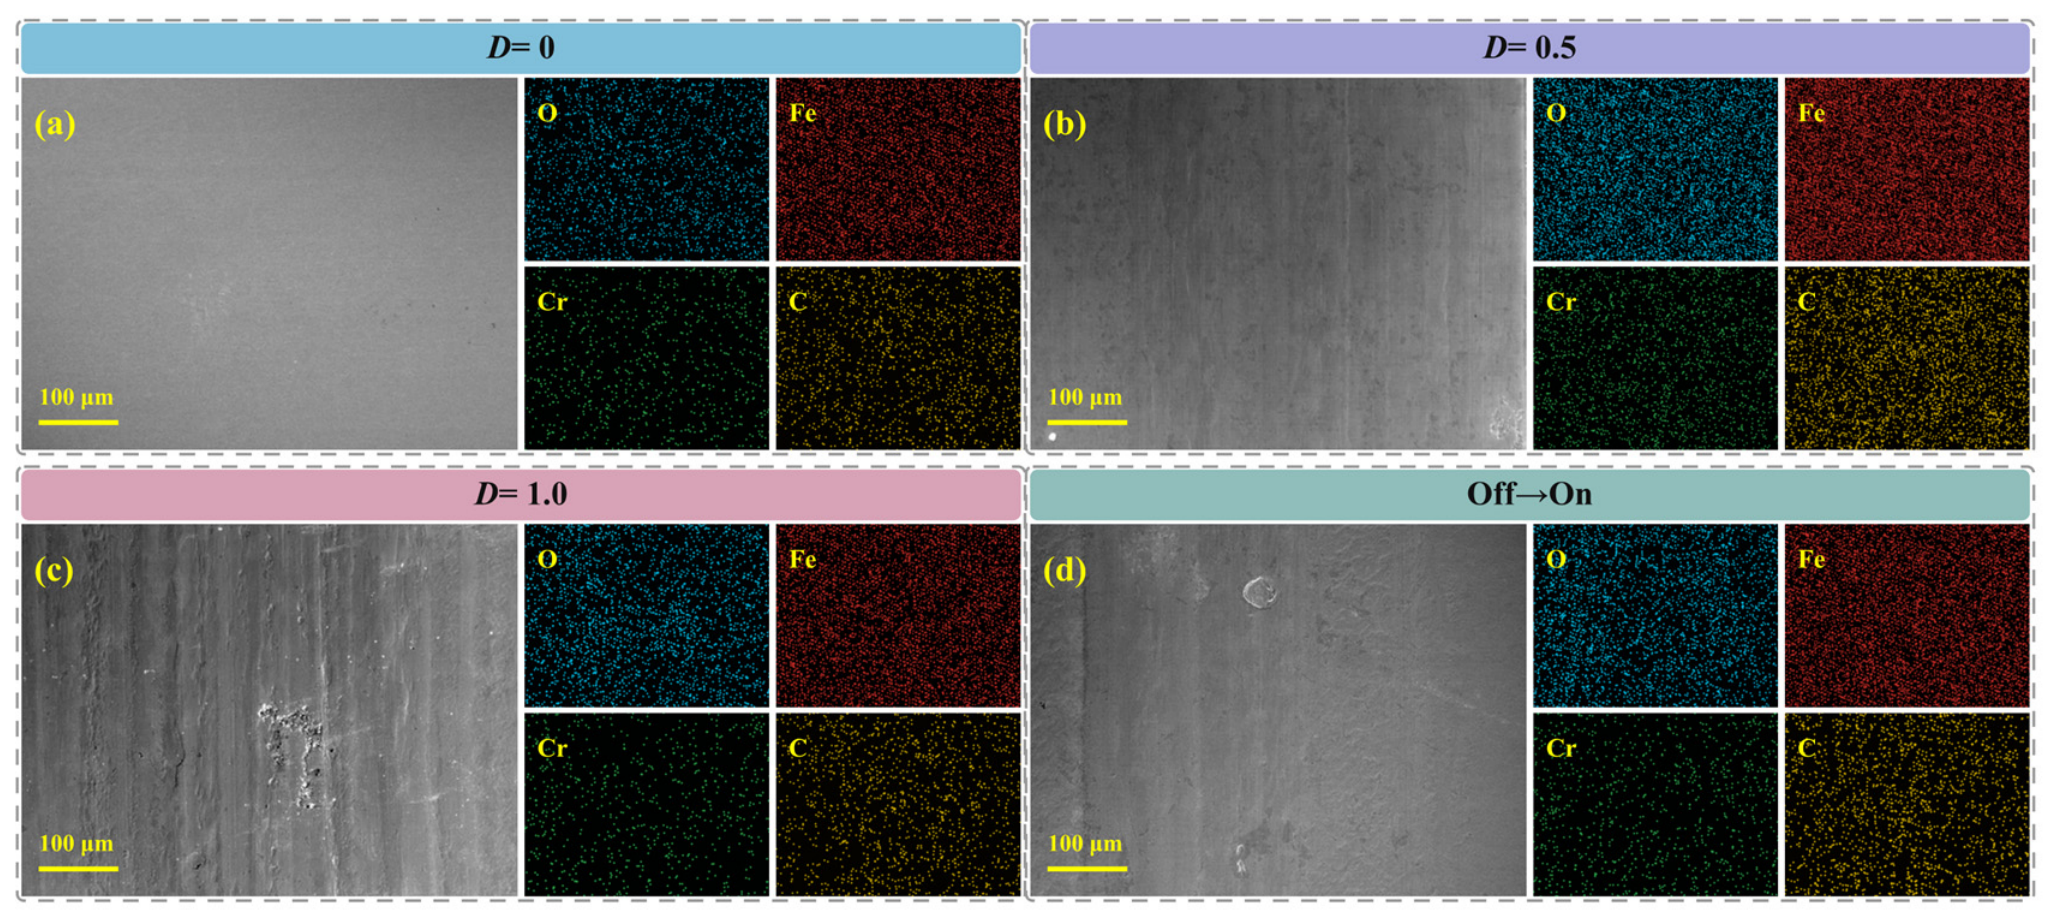
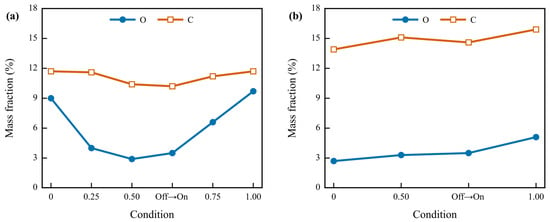
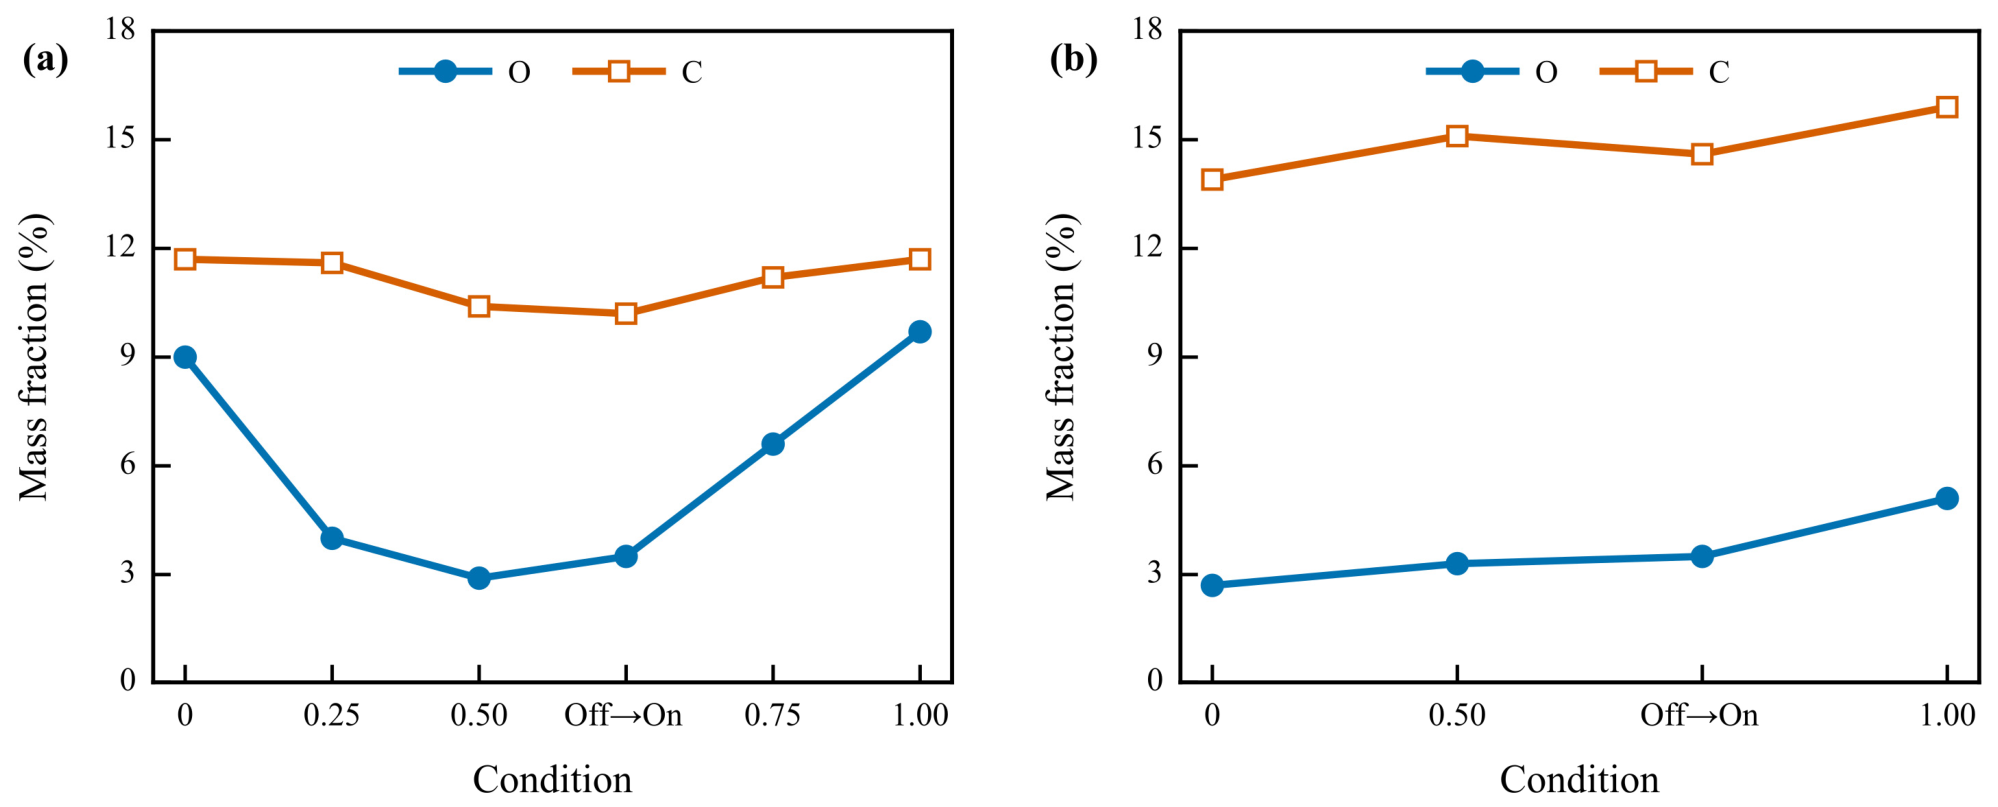
Figure 15 presents SEM images and elemental maps of O, Fe, Cr, and C at the centers of the PAO 40-lubricated wear tracks under the selected conditions. Figure 16a,b further provide semi-quantitative comparisons of O and C signals from the EDS mapping regions under dry sliding and PAO 40 lubrication, respectively. Under dry sliding, the semi-quantitative O mass fraction in the EDS mapping region was 9.0% at D = 0. It decreased to 4.0% and 2.9% at D = 0.25 and 0.50, respectively. It then increased to 6.6% and 9.7% at D = 0.75 and 1.00, respectively. The C mass fraction varied from 10.2% to 11.7%. In conjunction with Figure 7b, Figure 10 and Figure 16a, D = 0.50 showed the greatest wear volume, a relatively smooth surface, and the lowest mapped-region O mass fraction. This combination was consistent with the interpretation of enhanced material removal and lower retention of O-containing adhered material. At D = 0.75 and 1.00, the mapped-region O mass fraction increased again. These conditions also showed more grooves, adhered debris, and localized detachment. The O mass fraction in the EDS mapping region reflects the regionally averaged retention of O-containing material at the end of the test. It does not correspond one-to-one with cumulative wear amount. The PAO 40 conditions included D = 0, D = 0.50, D = 1.00, and off→on. The values were used to compare changes in the same element within the same lubrication state. For D = 0, 0.50, and 1.00, the semi-quantitative O mass fractions in the EDS mapping region were 2.7%, 3.3%, and 5.1%, respectively. The corresponding C mass fractions were 13.9%, 15.1%, and 15.9%, respectively. The C signal may include contributions from both PAO residues and C-containing adhered material. It reflects the overall retention of C-containing material at the center of the wear track. Under PAO 40 lubrication, the O signal increased sequentially across the selected D conditions. This trend was consistent with the increases in wear-track width and wear volume shown in Figure 7 and with the greater prevalence of grooves and adhered material in Figure 14. By contrast, the O signal under dry sliding first decreased and then increased. This difference indicates that the formation and retention processes of O-containing material differed between the two lubrication states.
Figure 15.
SEM images and EDS elemental maps of relatively large central regions of PAO 40-lubricated wear tracks: (a) D = 0; (b) D = 0.50; (c) D = 1.00; (d) off→on.
Figure 16.
Semi-quantitative O and C signals from the central EDS mapping regions: (a) dry sliding and (b) PAO 40 lubrication.
3.5. Wear Characteristics Under Periodic Switching, Delayed Energization, and Continuous DC
Figure 7b shows that periodic switching at D = 0.50 and off→on had the same nominal total on-time. Under dry sliding, their wear volumes were 3.5342 × 104 μm3 and 3.2695 × 104 μm3, respectively. Under PAO 40 lubrication, their wear volumes were 0.4027 × 104 μm3 and 0.3772 × 104 μm3, respectively. Under both lubrication states, the wear volumes under periodic switching and off→on were close. In the dry-sliding tests, the off→on protocol had only half the nominal source-side on-time of continuous DC. Nevertheless, its wear volume of 3.2695 × 104 μm3 was still close to that under continuous DC (3.1918 × 104 μm3). These two sets of comparisons indicate that wear volume is not simply proportional to nominal total on-time.
Figure 8, Figure 9, Figure 10 and Figure 11 show that, under dry sliding, periodic switching at D = 0.50 produced a relatively uniform surface. The off→on condition showed edge accumulation of debris and localized detachment. Continuous DC at D = 1.00 produced a wider wear track, patchy adhered material, and localized detachment. Figure 12, Figure 13, Figure 14, Figure 15 and Figure 16 show that, under PAO 40 lubrication, periodic switching at D = 0.50 exhibited fine, dense plowing grooves and edge pile-up. The off→on condition formed more continuous and relatively rough grooves. Continuous DC at D = 1.00 had the widest grooved region, accompanied by particulate and flake-like adhered material. The semi-quantitative elemental results show that the region-averaged elemental contents under periodic switching at D = 0.50 and off→on were close. Under dry sliding, their O contents were 2.9% and 3.5%, respectively, while their C contents were 10.4% and 10.2%, respectively. Under PAO 40 lubrication, their O contents were 3.3% and 3.5%, respectively, while their C contents were 15.1% and 14.6%, respectively. Although their wear volumes and region-averaged elemental contents were close, their wear-track geometries and local damage differed. These wear-volume, elemental-content, and morphology comparisons indicate that periodic switching and delayed energization can still produce different damage distributions with the same nominal total on-time.
3.6. Discussion
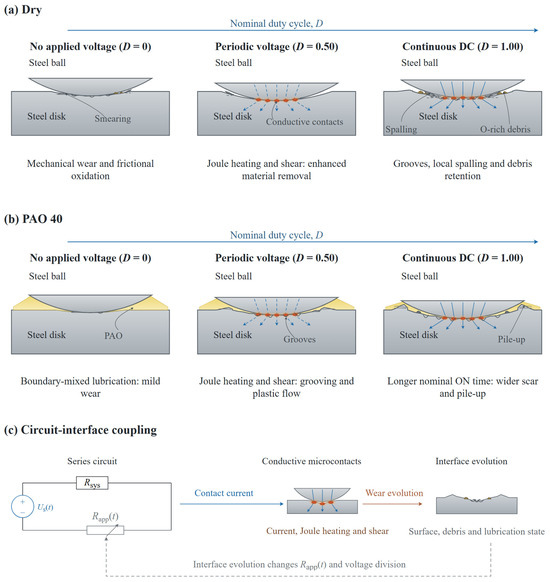
The voltage waveforms in Figure 3 and the PAO 40 wear tracks shown in Figure 14 and Figure 15 displayed no typical features of oil film breakdown and discharge. No typical melting-resolidification pits were observed in the dry-sliding wear tracks in Figure 10 and Figure 11. Combined with the apparent electrical contact resistance response in Figure 2, these observations indicate that electrical effects in the present tests participated in interfacial evolution mainly through conductive microcontacts. Previous current-carrying tribology studies have shown that current-induced Joule heating can act together with mechanical shear, tribo-oxidation, and material transfer to affect worn surfaces [15,19]. Accordingly, Figure 17 summarizes the wear behavior and its causes under different energization conditions. It covers dry sliding, PAO 40 boundary/mixed lubrication, and the interaction between interfacial state and electrical response.
Figure 17.
Schematic of friction and wear mechanisms under different energization conditions: (a) selected states in the nominal duty-cycle series under dry sliding; (b) evolution of the PAO 40-lubricated contact under boundary/mixed lubrication; and (c) interaction between interfacial evolution and electrical response.
Under dry sliding, the mean coefficient of friction increased stepwise with D but did not correspond simply to the wear volume (Figure 5a and Figure 7b). The coefficient of friction reflects the mean tangential resistance over a period of time, whereas wear volume is determined jointly by material removal and debris retention. As D increased, the nominal duration for which local Joule heating at conductive microcontacts and mechanical shear acted together increased. However, the relative contributions of material removal, surface-layer fracture, and debris retention did not vary in parallel. Figure 17a summarizes representative dry-sliding states at D = 0, D = 0.50, and D = 1.00. At D = 0, wear was characterized mainly by mechanical plowing, adhesion, and tribo-oxidation. At D = 0.25, the wear track narrowed while the wear volume increased, concentrating material removal within a narrower track. At D = 0.50, microcontact Joule heating acted repeatedly during energized intervals, while mechanical shear acted throughout the cycle. Together, these processes may have promoted shear removal from plastically deformed and adhered regions. Figure 7b, Figure 10 and Figure 16a show that this condition produced the highest wear volume, a relatively smooth surface, and the lowest O content. These observations support the interpretation of enhanced material removal and lower retention of O-containing adhered material. When D increased to 0.75, the grooves, adhered debris, and O content in Figure 10, Figure 11 and Figure 16a increased again. More O-containing material and wear debris were retained within the wear track. Retained debris can participate in third-body circulation and alter real contact and material removal [30]. This may partly explain why the wear track continued to widen while the wear volume remained below that at D = 0.50. Under continuous DC, Joule heating, adhesive transfer, tribo-oxidation, and mechanical shear acted throughout the test. The surface layer may have formed and fractured repeatedly, eventually producing a wider wear track, localized detachment, and another increase in wear volume. Therefore, the relative changes in material removal, surface-layer fracture, and debris retention can explain the non-monotonic wear-volume response in Figure 7b.
The response of the PAO 40-lubricated contact differed from that under dry sliding. The lower and more stable Rapp in Figure 2 indicates that conductive paths remained at the lubricated interface. During reciprocating motion, the steel-ball speed falls to zero at the reversal points and is higher near the stroke center. The contact state therefore varies between boundary and mixed lubrication along the stroke [23]. Together with the lower coefficient of friction and the wear-track features, this indicates that the PAO 40 contact in the present tests was generally in a boundary/mixed lubrication regime. Previous studies have shown that externally applied electrical excitation can alter the contact resistance and friction response of lubricated contacts [23]. Film thickness under boundary/mixed lubrication also varies with current [25]. Based on Figure 7b and the final interfacial features in Figure 12, Figure 13, Figure 14, Figure 15 and Figure 16, Figure 17b summarizes the main changes at D = 0, D = 0.50, and D = 1.00. At D = 0, the lubricant film carried part of the load and reduced direct metal contact. At D = 0.50, current passed through metallic microcontacts that were not completely separated by the lubricant film. Local Joule heating and mechanical shear acted repeatedly, and the relative roles of film load carrying and metallic microcontacts may also have changed. Grooves and plastic flow gradually accumulated. Under continuous DC, these effects persisted throughout the test and exerted a more sustained influence on the lubricant film state and conductive microcontacts. The wear track widened further, and edge pile-up and localized adhesion became more pronounced. Although PAO 40 mitigated severe adhesion, it could not completely separate the metallic microcontacts. Damage therefore continued to accumulate as D increased. This can explain why the coefficients of friction were relatively close at higher D, whereas wear-track width and wear volume continued to increase monotonically.
Energization timing further changed the stage of interfacial evolution at which the electrical action was applied. Figure 6 shows that periodic switching at D = 0.50, both on→off and off→on, had the same nominal total on-time but different coefficient-of-friction evolutions. Periodic switching at D = 0.50 distributed the on-state intervals throughout the test. Under on→off, continuous DC was applied to the initial surface during the first half of the test. Under off→on, continuous DC was applied only after off-state sliding during the first half. Both the on→off and off→on conditions showed gradual trends after the electrical state switched at the test midpoint. As shown in Figure 6, the coefficient of friction increased gradually after voltage was applied under off→on in both lubrication states. This increase is consistent with electrical heating and mechanical shear acting on the interface formed during the preceding de-energized sliding. Dynamic-potential studies have shown that friction has a finite response time to potential switching [28]. The boundary-film state can also interact with electrical contact resistance and applied potential through a feedback process [29]. This indicates that the coefficient of friction depends not only on the current electrical state but also on the interfacial state established before switching. Periodic switching at D = 0.50 and off→on had the same nominal total on-time, and their wear volumes in Figure 7b were relatively close. However, their wear-track geometries and local damage differed in Figure 8, Figure 9, Figure 10, Figure 11, Figure 12, Figure 13, Figure 14 and Figure 15. For off→on in the dry-sliding tests, continuous DC was applied only during the second half, yet the final wear volume remained close to that under continuous DC throughout the test. Final material loss therefore cannot be determined from nominal total on-time alone. It is also related to energization timing and the interfacial state at the time of voltage application.
As shown in Figure 17c, the source-side voltage, Us(t), is divided across the fixed series resistance of the system, Rsys, and the interface-dependent apparent electrical contact resistance, Rapp(t). The actual contact-pair voltage, Uc(t), is the voltage across Rapp(t). Current passes through conductive microcontacts, while local Joule heating and mechanical shear act together at the surface. The resulting wear track, wear debris, and lubrication state in turn alter the conductive paths, Rapp(t), and the actual voltage division across the contact pair. The feedback arrows in the figure indicate that, after the interfacial state changes, the local electrothermal and mechanical effects in the next stage also change accordingly. The electrical responses in Figure 2 and Figure 3, together with the final interfacial differences in Figure 10, Figure 11, Figure 12, Figure 13, Figure 14, Figure 15 and Figure 16, jointly support this feedback interpretation.
4. Conclusions
This study investigated how nominal energization parameters relate to the actual electrical state at the frictional interface in electric-drive equipment where mechanical operation continues while source-side electrical excitation changes intermittently. GCr15 ball-on-disk reciprocating sliding tests were conducted under dry sliding and PAO 40 lubrication. The effects of nominal duty cycle on friction and wear were examined using a 5 V, 1 Hz low-frequency periodically switched voltage. The evolution of the coefficient of friction was compared across three conditions with the same nominal total on-time: periodic switching, the first-half-on condition (on→off), and the second-half-on condition (off→on). Wear characteristics were compared among periodic switching, off→on, and continuous DC. The relationships among nominal on-time, interfacial state, and actual electrical response were analyzed by combining the contact-pair voltage, apparent electrical contact resistance, wear-track morphology, and elemental distributions. The main conclusions are as follows:
- (1)
- As the nominal duty cycle, D, increased, the mean coefficients of friction under dry sliding and PAO 40 lubrication both increased overall, but their wear behaviors differed. Under dry sliding, the wear-track width increased overall, whereas the wear volume first increased, then decreased, and then increased again, reaching its maximum at D = 0.50. Under the PAO 40 boundary/mixed lubrication regime, both the wear-track width and wear volume increased monotonically with D.
- (2)
- Increasing D extended the duration of the combined action of Joule heating at conductive microcontacts and mechanical friction. Under dry sliding, the D = 0.50 condition simultaneously exhibited a relatively large wear volume, a relatively smooth surface, and a relatively low O content. These observations were consistent with more complete surface-layer removal and less retention of O-containing wear debris. As the duty cycle increased further, grooves, adhered debris, and O-containing material increased again. The relative changes in surface-layer removal and debris retention accounted for the non-monotonic response of dry-sliding wear volume. The boundary film formed by PAO 40 reduced friction and severe adhesion but did not completely separate the conductive microcontacts. As the on-time increased, local electrical heating and mechanical shear continued to act, and grooves and plastic deformation gradually accumulated. Consequently, wear increased with D.
- (3)
- Under the same nominal total on-time, the evolution of the coefficient of friction differed among periodic switching (D = 0.50), on→off and off→on. Periodic switching and off→on produced close wear volumes but different final wear-track morphologies. Under dry sliding, periodic switching at D = 0.50 produced a more uniform wear track, whereas off→on showed edge accumulation of debris and localized detachment. Under PAO 40 lubrication, periodic switching at D = 0.50 exhibited fine, dense plowing grooves, whereas off→on exhibited relatively continuous rough grooves. Under dry sliding, the wear volume for off→on was also close to that under continuous DC. These results show that wear depends not only on cumulative on-time but also on the stage at which energization occurs and the interfacial state that had already formed before energization.
- (4)
- The fixed series resistance of the system and the continuously evolving interfacial impedance jointly determined the actual voltage across the contact pair. Changes in wear-track morphology, debris, and lubrication state altered the apparent electrical contact resistance and voltage division. The resulting electrical response participated in subsequent wear, forming a feedback relationship. For electric-drive equipment in which mechanical operation continues while source-side electrical excitation changes intermittently, bearing wear risk assessment should simultaneously consider nominal duty cycle, energization timing, lubrication state, and actual voltage across the bearing.
Author Contributions
Investigation and writing—original draft preparation, W.L.; methodology, J.W.; writing—review and editing, X.W., H.D. and J.W.; resources, J.Z., C.S., T.W., B.L. and Y.L.; supervision, J.W. All authors have read and agreed to the published version of the manuscript.
Funding
The study was supported by a funding provided by Zhongshan Hecheng Lubrication Materials Co., Ltd. through an industrial research cooperation project.
Data Availability Statement
The data presented in this study are available from the corresponding author upon reasonable request.
Acknowledgments
The authors thank Chongjun Wu for the help in the measurement using white light interferometer.
Conflicts of Interest
Authors T.W., B.L. and Y.L. were employed by Zhongshan Hecheng Lubrication Materials Co., Ltd. The remaining authors declare that the research was conducted in the absence of any commercial or financial relationships that could be construed as a potential conflict of interest.
References
- Busse, D.F.; Erdman, J.M.; Kerkman, R.J.; Schlegel, D.W.; Skibinski, G.L. The effects of PWM voltage source inverters on the mechanical performance of rolling bearings. IEEE Trans. Ind. Appl. 1997, 33, 567–576. [Google Scholar] [CrossRef] [Scilit]
- Lorenz, R.D. Robotics and automation applications of drives and converters. Proc. IEEE 2001, 89, 951–962. [Google Scholar] [CrossRef] [PubMed]
- Cheng, M.; Zhou, J.W.; Qian, W.; Wang, B.; Zhao, C.; Han, P. Advanced electrical motors and control strategies for high-quality servo systems: A comprehensive review. Chin. J. Electr. Eng. 2024, 10, 63–85. [Google Scholar] [CrossRef] [Scilit]
- Hadden, T.; Jiang, J.W.; Bilgin, B.; Yang, Y.; Sathyan, A.; Dadkhah, H.; Emadi, A. A review of shaft voltages and bearing currents in EV and HEV motors. In Proceedings of the IECON 2016, 42nd Annual Conference of the IEEE Industrial Electronics Society; IEEE: New York, NY, USA, 2016; pp. 1578–1583. [Google Scholar] [CrossRef] [Scilit]
- He, F.; Xie, G.; Luo, J. Electrical bearing failures in electric vehicles. Friction 2020, 8, 4–28. [Google Scholar] [CrossRef] [Scilit]
- Tawfiq, K.B.; Güleç, M.; Sergeant, P. Bearing current and shaft voltage in electrical machines: A comprehensive research review. Machines 2023, 11, 550. [Google Scholar] [CrossRef] [Scilit]
- Schneider, V.; Behrendt, C.; Höltje, P.; Cornel, D.; Becker-Dombrowsky, F.M.; Puchtler, S.; Gutiérrez Guzmán, F.; Ponick, B.; Jacobs, G.; Kirchner, E. Electrical bearing damage, a problem in the nano- and macro-range. Lubricants 2022, 10, 194. [Google Scholar] [CrossRef] [Scilit]
- Chi, L.Q.; Zhang, D.H.; Zhao, J.Q.; Ren, Z.Y.; Chen, D.Z. Review of electrical erosion damage mechanisms and mitigation measures for bearings in rotating electrical machines. Trans. China Electrotech. Soc. 2024, 39, 6409–6430. (In Chinese) [Google Scholar] [CrossRef]
- Aguilar-Rosas, O.A.; Farfan-Cabrera, L.I.; Erdemir, A.; Cao-Romero-Gallegos, J.A. Electrified four-ball testing: A potential alternative for assessing lubricants (E-fluids) for electric vehicles. Wear 2023, 522, 204676. [Google Scholar] [CrossRef] [Scilit]
- Prashad, H. Appearance of craters on track surface of rolling element bearings by spark erosion. Tribol. Int. 2001, 34, 39–47. [Google Scholar] [CrossRef] [Scilit]
- Noguchi, S.; Kakinuma, S.; Kanada, T. Measurement of direct current voltage causing electrical pitting. J. Adv. Mech. Des. Syst. Manuf. 2010, 4, 1084–1094. [Google Scholar] [CrossRef] [Scilit]
- Guo, L.; Mol, H.; Nijdam, T.; de Vries, L.; Bongaerts, J. Study on the electric discharge behavior of a single contact in EV motor bearings. Tribol. Int. 2023, 187, 108743. [Google Scholar] [CrossRef] [Scilit]
- Xie, G.; Luo, J.; Guo, D.; Liu, S.; Li, G. Damages on the lubricated surfaces in bearings under the influence of weak electrical currents. Sci. China Technol. Sci. 2013, 56, 2979–2987. [Google Scholar] [CrossRef] [Scilit]
- Chiou, Y.C.; Lee, R.T.; Lin, S.M. Formation mechanism of electrical damage on sliding lubricated contacts for steel pair under DC electric field. Wear 2009, 266, 110–118. [Google Scholar] [CrossRef] [Scilit]
- Ding, Q.; Tang, J.Z.; Zhang, S.W.; Li, H.K.; Hu, L.T. The tribological behavior of PAO lubricated DLC contacts under DC electric field. Tribology 2017, 37, 707–716. (In Chinese) [Google Scholar] [CrossRef]
- Song, C.; Ren, Y.; Huang, Q.; Zhang, Y.; Li, Y.; Cheng, J.; Pang, X.; Zhang, Y. Effect of shaft voltage on electric damage of GCr15 bearing material. Tribol. Int. 2024, 200, 110139. [Google Scholar] [CrossRef] [Scilit]
- Spikes, H.A. Triboelectrochemistry: Influence of applied electrical potentials on friction and wear of lubricated contacts. Tribol. Lett. 2020, 68, 90. [Google Scholar] [CrossRef] [Scilit]
- Tajedini, M.; Bahrami, R.; Azhdari, R.; Sue, H.J.; Liang, H. Influence of electric current on tribological performance of grease-lubricated steels. Tribol. Int. 2024, 200, 110121. [Google Scholar] [CrossRef] [Scilit]
- Peng, Z.; Nassif, A.; Georgi, F.; Montmitonnet, P.; Lahouij, I. Electric polarity: A key factor in lubricated wear of bearing steel. Tribol. Int. 2025, 209, 110748. [Google Scholar] [CrossRef] [Scilit]
- Li, Z.; Guo, F.; Jing, Z.; Li, B.; Zhang, L.; Wang, X. Study on grease lubrication and electric erosion characteristics in AC electric fields. Lubricants 2024, 12, 79. [Google Scholar] [CrossRef] [Scilit]
- Li, Z.; Cai, R.; Nie, X. Experimental study: Bearing degradation caused by electrical currents and voltages at low speeds. Lubricants 2025, 13, 175. [Google Scholar] [CrossRef] [Scilit]
- Li, Z.; Cai, R.; Zhang, T.; Nie, X. Polarity-dependent EDM-type degradation in rolling bearings under low-speed unipolar excitation. Materials 2026, 19, 2248. [Google Scholar] [CrossRef] [Scilit] [PubMed]
- Kreivaitis, R.; Andriušis, A.; Treinytė, J.; Kupčinskas, A.; Jankauskas, V. Investigation of the lubricating conditions in a reciprocating sliding tribotest with applied electric voltage. Lubricants 2024, 12, 104. [Google Scholar] [CrossRef] [Scilit]
- Sun, H.; Zhou, S.; Shao, L.; Luan, J.; Wan, Y.; Wang, C. Low Friction Achieved on Plasma Electrolytic Oxidized TC4 Alloy in the Presence of PAO Base Oil Containing MoDTC. Lubricants 2023, 11, 4. [Google Scholar] [CrossRef] [Scilit]
- Cao-Romero-Gallegos, J.A.; Taghizadeh, S.; Aguilar-Rosas, O.A.; Dwyer-Joyce, R.S.; Farfan-Cabrera, L.I. The effect of electrical current on lubricant film thickness in boundary and mixed lubrication contacts measured with ultrasound. Friction 2024, 12, 1882–1896. [Google Scholar] [CrossRef] [Scilit]
- Glovnea, R.; Furtuna, M.; Nagata, Y.; Sugimura, J. Electrical methods for the evaluation of lubrication in elastohydrodynamic contacts. Tribol. Online 2012, 7, 46–53. [Google Scholar] [CrossRef] [Scilit]
- Crook, A.W. The lubrication of rollers. Philos. Trans. R. Soc. Lond. Ser. A Math. Phys. Sci. 1958, 250, 387–409. [Google Scholar] [CrossRef] [Scilit]
- He, S.Q.; Meng, Y.G.; Tian, Y.; Zuo, Y.H. Response characteristics of the potential-controlled friction of ZrO2/stainless steel tribopairs in sodium dodecyl sulfate aqueous solutions. Tribol. Lett. 2010, 38, 169–178. [Google Scholar] [CrossRef] [Scilit]
- Liu, C.X.; Li, X.S.; Li, X.X.; Li, W.Z.; Tian, Y.; Meng, Y.G. On-line feedback control of sliding friction of metals lubricated by adsorbed boundary SDS films. Lubricants 2022, 10, 148. [Google Scholar] [CrossRef] [Scilit]
- Godet, M. The third-body approach: A mechanical view of wear. Wear 1984, 100, 437–452. [Google Scholar] [CrossRef] [Scilit]

Disclaimer/Publisher’s Note: The statements, opinions and data contained in all publications are solely those of the individual author(s) and contributor(s) and not of MDPI and/or the editor(s). MDPI and/or the editor(s) disclaim responsibility for any injury to people or property resulting from any ideas, methods, instructions or products referred to in the content. |
© 2026 by the authors. Licensee MDPI, Basel, Switzerland. This article is an open access article distributed under the terms and conditions of the Creative Commons Attribution (CC BY) license.