


Abstract
Most existing reviews treat endoplasmic reticulum (ER) stress as one mechanism among several in leptin resistance. This review advances a different claim: ER proteostasis may act as a central convergence node, translating metabolic, inflammatory, developmental, and nutrient-derived signals into a shared effector signature. In common obesity, leptin responsiveness is blunted despite hyperleptinaemia—the principal obstacle to leptin-based therapy. Leptin resistance is examined at the intersection of intracellular signalling networks (JAK2/STAT3, PI3K/Akt, MAPK, AMPK, mTOR, FoxO1, SOCS3, and PTP1B), hypothalamic ER stress, and the unfolded protein response (UPR). This narrative synthesis incorporates 22 primary studies, with PRISMA 2020 principles used to document study selection transparently. The ER shapes leptin signalling at three levels: receptor biogenesis (SEL1L–HRD1 ERAD), receptor bioavailability (CHOP-mediated soluble receptor), and post-receptor inhibition (SOCS3/PTP1B). Distinct stressors converge on a narrow effector set (CHOP, SOCS3, and PTP1B) whose direction of effect is context-dependent, and receptor quality control can operate without activation of the PERK arm, indicating that the ER’s role is not confined to the canonical stress response. The framework yields three testable hypotheses with an explicit falsification criterion and proposes that leptin resistance comprises phenotypically distinct subtypes. The evidence base is entirely preclinical (17 rodent in vivo; 5 in vitro studies); translation to humans remains untested.
1. Introduction
The signal linking adipose mass to feeding behaviour was predicted by Coleman’s parabiosis experiments [1] and identified molecularly with the cloning of the obese (ob) gene [2]. That recombinant leptin reduces food intake [3,4], that the receptor was subsequently cloned [5], and that loss-of-function mutations in the leptin gene cause early-onset obesity reversible by replacement therapy [6,7] together established the hormone’s role in energy balance. Leptin acts by binding LepRb on POMC and AgRP neurons of the arcuate nucleus, thereby suppressing food intake [8,9].
What is seen in common obesity is hyperleptinaemia rather than leptin deficiency: affected individuals fail to mount the expected anorexigenic response to leptin. This state, termed leptin resistance, distinguishes rare type 1 (leptin-deficient) obesity from the far more common type 2 (leptin-resistant) form [8]. Roughly one in eight people worldwide now lives with obesity, and the prevalence is projected to keep rising through 2050 [10,11]. Leptin resistance is both the principal barrier to the therapeutic use of leptin [12,13,14] and a contributor to cardiometabolic complications [9].
This review conceptualises ER proteostasis as a candidate regulatory hub at which metabolic, inflammatory, developmental, and nutritional inputs intersect and are routed towards a leptin-resistant phenotype. The framework rests on three testable hypotheses—input independence, node primacy, and the proteostasis–stress distinction—and further argues that leptin resistance may comprise several phenotypes differing in their dominant mechanism. The mechanisms are presented not as an established model but as an explicitly falsifiable framework.
2. Materials and Methods
2.1. Literature Search Strategy
This is a narrative review. The reporting principles of the PRISMA 2020 statement [15] were applied not to conduct a systematic review but to document study selection transparently. Searches of PubMed/MEDLINE and Scopus were completed on 19 July 2026. Records were screened independently by two authors, first on title and abstract and then at full text, and disagreements were resolved by discussion. Citation tracking of the reference lists of the included studies was not carried out, so the evidence base is limited to what the two database searches retrieved; this is noted among the limitations in Section 11.2. The design should be named precisely because the reporting conventions used here are those of a systematic review while the design is not one. No protocol was registered in advance, the search was confined to two databases, no meta-analysis was undertaken, and the synthesis is interpretive rather than quantitative. What the PRISMA conventions provide is an auditable account of how the twenty-two studies were arrived at, not a claim to the status of a systematic review.
The following search string was applied identically to both databases:
(“leptin resistance” OR “leptin signaling”) AND (JAK2 OR STAT3 OR PI3K OR Akt OR MAPK OR ERK OR AMPK OR mTOR OR FoxO1 OR SOCS3 OR PTP1B OR “ER stress” OR “endoplasmic reticulum stress” OR “unfolded protein response” OR UPR OR PERK OR IRE1 OR ATF6 OR CHOP OR XBP1).
Only studies published on or after 1 January 2015 were eligible for the core evidence table. The boundary was chosen deliberately rather than for convenience. That ER stress can cause hypothalamic leptin resistance was established before this date, principally by Hosoi et al. [16] and Ozcan et al. [17], and the present review does not set out to re-establish it; the question asked here is whether the evidence accumulated since then supports the stronger proposition that ER proteostasis functions as a convergence node. Confining the tabulated evidence to the more recent literature keeps the synthesis on that question and avoids counting the foundational studies twice, once as the premise of the framework and again as evidence for it. The restriction applies to the evidence table alone. Pre-2015 studies bearing directly on the question are appraised separately in Section 2.2 and in Table S1, and they are cited throughout the text wherever they bear on the argument; this includes Williams et al. [18], whose demonstration of Xbp1s function in POMC neurons is described in Section 6.1 as a foundation of the framework and is therefore discussed rather than tabulated. Two consequences follow and are stated here rather than left implicit: the evidence table is not a complete census of experimental work on this question, and no claim about the relative frequency or consistency of findings is made on the basis of its contents. Studies were included if they reported original research, addressed leptin resistance or leptin signal transduction as a primary topic, linked at least one ER stress or UPR component (PERK, IRE1α, ATF6, CHOP, XBP1, GRP78/BiP, eIF2α, and ERAD) mechanistically to leptin signalling, and were available in English as full text. Studies treating leptin only superficially were excluded, as were records without abstracts, conference proceedings, case reports, and retracted publications.
Of 421 records retrieved (PubMed/MEDLINE, n = 244; Scopus, n = 177), 83 duplicates were removed. Of the 338 unique records, 58 were excluded at title and abstract screening and a further 258 at full-text assessment (target mechanism not the primary focus, n = 189; signalling studies with no ER stress component, n = 54; reviews, n = 15). Twenty-two studies entered the synthesis and the evidence table, and the seventeen animal studies were assessed with SYRCLE’s risk of bias tool [19], as described in Section 2.3 (Figure 1; Table 1; Tables S2 and S3).
Figure 1.
Study selection flow chart (PRISMA 2020 format). Flow of study selection for the core evidence base; the diagram follows the PRISMA 2020 format.
Table 1.
Summary of the 22 primary studies addressing the relationship between ER stress and intracellular signal transduction in leptin resistance (in descending order of publication year). The set contains no human studies and no randomised controlled trials (animal in vivo n = 17; laboratory studies only n = 5). The study design category column is colour-coded by model system: yellow = animal study, red = laboratory (in vitro) study; because no human study is included, the green category is unrepresented. The effectors column states which of the three proposed effectors each study actually measured and whether it changed: ↑ significantly increased, ↓ significantly decreased, = measured without a significant change, ✓ measured, with the direction reported only within a particular comparison, – not measured. CHOP was measured in twelve of the twenty-two studies, SOCS3 in eight, and PTP1B in five; two studies measured all three. The model column names the tissue or cell type in which the reported outcomes were measured, so that findings in hypothalamic neurons can be distinguished from those in non-neuronal cells of the central nervous system and in peripheral tissues. That column describes how each study was designed and is not an assessment of its quality; risk of bias was assessed separately with SYRCLE’s tool (Section 2.3) and is reported in Tables S2 and S3. Each key finding states the direction of the reported effect, together with any feature of the study’s own reporting that limits what may be concluded from it.
During the preparation of this manuscript, a large language model (Claude, Anthropic; model claude-opus-5) was used solely for language editing and academic style refinement of the English text. No scientific content, data, interpretations, or conclusions were generated by the tool. The corresponding author reviewed and approved all language-related edits and takes full responsibility for the content of the manuscript.
2.2. Appraisal of Foundational Pre-2015 Evidence
Four studies published before the eligibility window are appraised separately because the framework developed here depends on them. Hosoi et al. [16] showed that pharmacologically induced ER stress blocks leptin-induced STAT3 phosphorylation, that the effect is mediated by PTP1B and not by SOCS3, and that a chemical chaperone reverses it. Ozcan et al. [17] established in vivo that diet-induced obesity produces hypothalamic ER stress, that chemical chaperones restore leptin sensitivity, and that reduced ER folding capacity increases susceptibility to leptin resistance. Schneeberger et al. [42] showed that deletion of Mfn2 in POMC neurons reduces mitochondria–ER contacts; impairs POMC processing; and produces ER stress, leptin resistance, and obesity that pharmacological relief of ER stress reverses. Williams et al. [18] showed that Xbp1s in POMC neurons improves leptin sensitivity and glucose homeostasis. Table S1 sets out their models, findings, and the role each plays in the present argument, and they are discussed in Section 6.1 and Section 9.2 where they bear on it. Their absence from Table 1 is a reporting convention adopted for the reason given in Section 2.1; by design and by strength of inference, they are among the most informative studies in this field, and any appraisal of the framework should weigh them alongside the tabulated evidence.
2.3. Risk of Bias Assessment
The seventeen animal studies in the core evidence base were assessed against the ten items of SYRCLE’s risk of bias tool [19]. Each item was judged as low, high, or unclear risk from the full text of the primary report, including Supplementary Materials where available. Two conventions were applied so that the judgements are reproducible. First, item 1 was judged unclear wherever a report states that animals were allocated randomly without describing how the allocation sequence was generated; high risk was reserved for a described non-random method, which no report used. Second, where blinding or outcome assessment differed between outcomes, the judgement was made on the primary molecular outcome, that is, the measure of leptin signalling or ER stress on which this review draws. Item-level judgements for every study are reported in Table S2, and the basis for each judgement that departs from unclear is set out in Table S3. The five laboratory-only studies were not assessed because SYRCLE applies to animal experiments. The assessment is used in Section 11.2 to qualify the strength of the conclusions; it was not used to weight, rank, or exclude studies.
3. Leptin Physiology
Leptin is a 167-amino-acid polypeptide encoded by the ob gene and produced mainly by mature adipocytes of white adipose tissue; circulating concentrations correlate strongly with total fat mass [2,8]. Of the receptor isoforms, only LepRb carries a full-length intracellular domain and can therefore transmit JAK2/STAT3 signalling; it is densely expressed in POMC and AgRP neurons. The soluble isoform sOb-R determines the size of the free leptin pool [5,31,43]. Because canonical leptin physiology has been reviewed extensively elsewhere [8,9], only three features that intersect with the ER are emphasised here.
First, the functional competence of the receptor depends not only on its expression level but also on correct folding within the ER. Newly synthesised LepRb is prone to misfolding and is a substrate of the SEL1L–HRD1 ERAD complex, and loss of SEL1L in POMC neurons attenuates leptin signalling; notably, retention of the receptor within the ER occurs without activation of the PERK arm; BiP and spliced XBP1 were moderately elevated in that model, so the absence of PERK signalling should not be read as the absence of the entire ER stress response (Section 9.1) [24]. Second, receptor expression can fall under pathological conditions: in a model of congenital hypothyroidism, hypothalamic OB-R expression decreased by 45–63%, pSTAT3 by 51–56% and pERK by 48–50%, while SOCS3 rose [33]. Third, leptin resistance is not exclusively a central phenomenon: mice fed a high-fat diet develop local ER stress and leptin resistance within adipose tissue, and α-melanocyte-stimulating hormone (αMSH) reverses this picture by lowering GRP78 and CHOP [35].
4. Canonical Leptin Signalling
Binding of leptin to LepRb activates JAK2, which phosphorylates tyrosine residues on the cytoplasmic tail of the receptor and thereby creates docking sites for partially dissociable parallel arms (Figure 2).
Figure 2.
Leptin signal transduction under physiological conditions. Parallel signalling arms emerging from the leptin–LepRb–JAK2 axis and their net effect on hypothalamic POMC/AgRP neurons. Arrows indicate the direction of signal transmission; ↑, increase; ↓, decrease; the dashed line represents the blood–brain barrier.
The JAK2/STAT3 pathway, one of the principal mediators of leptin’s anorexigenic effects, is frequently used as a readout of leptin resistance. Yet, stimuli as different as selenoprotein M deficiency, homocysteine, 4-HNE, and glucose deprivation all lower pSTAT3, which shows that the marker is sensitive but not mechanism-specific. In diet-induced obese mice, moreover, STAT3 DNA-binding activity increases, and pharmacological reduction in pSTAT3 facilitates leptin-dependent POMC expression [44]—evidence that reduced pSTAT3 does not correspond to leptin resistance under all conditions.
PI3K/Akt is among the principal pathways at which leptin and insulin signalling intersect within the hypothalamus: mice carrying a kinase-domain mutation in PI3K-C2α develop leptin resistance, age-dependent insulin resistance, and obesity together [45]. Perinatal nutritional interventions have also been reported to alter hypothalamic IRS1 and AMPK phosphorylation and thereby to affect leptin signalling permanently [46].
Evidence for a role of the MAPK/ERK arm in leptin resistance is limited and largely observational [33]. Hypothalamic AMPK is suppressed by leptin; in a glucose-deprivation model, flurbiprofen reversed the suppression of pSTAT3 without altering UPR activation, which suggests that UPR activation alone may not fully account for leptin resistance [37].
mTOR is linked to ER proteostasis through its role as a negative regulator of autophagy, but the supporting studies are confined to cardiac and hepatic tissue [47,48,49]. FoxO1, for its part, competes with STAT3 at the POMC promoter and so shapes the transcriptional balance [44,50], raising the possibility that leptin resistance also reflects a shift in the balance between opposing transcriptional regulators. No primary study has examined the relationship between PI3K/Akt, mTOR, or FoxO1 and ER stress directly in the context of leptin resistance; these links remain inferential (Table 2).
Table 2.
Knowledge gaps and proposed research approaches. The principal gaps identified by this review and the methodological approach required for each.
5. Molecular Basis of Leptin Resistance
For leptin to exert its central effects, it must cross from the circulation into the brain, and the saturable nature of this transport may create an early bottleneck under hyperleptinaemic conditions [12]. Tanycytes surrounding the mediobasal hypothalamus have been shown to form an ERK-dependent gate for leptin, and this mechanism is disrupted in diet-induced obesity [51].
Upstream of this step lies the soluble receptor (sOb-R), which regulates the free leptin pool. Pharmacological and genetic modulation of hepatic CB1R alters sOb-R levels and hepatic leptin resistance, and CHOP binds the Lepr promoter and drives sOb-R expression [31]. The genetic evidence in that study requires careful reading: in globally CHOP-deficient mice, basal hepatic sOb-R was reduced, lean CHOP-null mice failed to raise the hepatic pSTAT3/STAT3 ratio in response to exogenous leptin, and peripheral CB1R blockade no longer restored circulating sOb-R. Deleting CHOP therefore reduced, rather than improved, hepatic leptin responsiveness. Two features limit how far this observation can be generalised: the model is a constitutive, whole-body null in which basal hepatic endocannabinoid tone is already markedly elevated, so a developmental or compensatory phenotype cannot be separated from the acute signalling role of CHOP, and the hypothalamus was not examined. Read in this way, the study identifies a basal transcriptional function of CHOP in setting hepatic sOb-R production, distinct from the stress-induced hypothalamic function discussed in the Section Context-Dependence of the Shared Effectors. ER stress can therefore interfere with leptin signalling through the circulating leptin pool, before the target cell is reached at all.
Impairment at the level of the receptor can arise in two ways. Direct evidence for reduced receptor expression comes from the congenital hypothyroidism model [33]. The more fundamental mechanism concerns receptor folding and maturation: LepRb has been identified as a substrate of the SEL1L–HRD1 ERAD complex, and loss of SEL1L in POMC neurons leads to accumulation of the receptor within the ER and to leptin resistance [24]. That this effect arises without activation of the PERK arm (Section 9.1) suggests that the ER acts as a basal regulator of receptor biogenesis and quality control, and it constitutes the strongest support for the framework proposed here.
SOCS3 is among the principal negative-feedback regulators of leptin signalling: induced by STAT3, it binds Tyr985 of LepRb and suppresses JAK2 activity [52]. Sustained activation of this loop may contribute to leptin resistance, and elevated SOCS3 has been demonstrated in the hypothalamus in congenital hypothyroidism [33] and in adipose tissue under high-fat feeding [35]. The cafeteria-diet model runs in the opposite direction: hypothalamic Socs3 expression was lower than in control rats and rose with an intervention that improved hypothalamic leptin signalling [36], and this study is therefore not evidence of elevated SOCS3 in resistance (Section Context-Dependence of the Shared Effectors). In the only study to address the relationship with ER stress directly, CHOP and XBP1, both elevated in the pancreatic islets of ob/ob mice, approached lean control levels after phenylbutyric acid (PBA); SOCS3, by contrast, was higher in leptin-stimulated islets from PBA-treated animals than in untreated ob/ob islets, and the PBA-treated group no longer differed from lean controls either with or without leptin [27]. The direction of this change deserves emphasis, since at first sight, it appears to contradict the role assigned to SOCS3 here. SOCS3 is a STAT3-induced negative-feedback gene, so its induction by leptin is a readout of an intact signalling pathway rather than of a blocked one; in untreated ob/ob islets, leptin failed to induce it, and PBA restored the lean-like inducible response. The finding is therefore consistent with relief of ER stress restoring leptin responsiveness, and it illustrates a distinction applied throughout this review: an acute, ligand-driven rise in SOCS3 reflects physiological feedback, whereas a chronically elevated basal level in the unstimulated state is the pattern associated with resistance. The evidence is nonetheless confined to a single tissue in a leptin-deficient rather than leptin-resistant model.
PTP1B is a tyrosine phosphatase that terminates leptin signalling by dephosphorylating JAK2 and is localised to the ER membrane—a position that makes it one of the most direct links between ER proteostasis and leptin signalling. In a model of chronic sleep fragmentation, increased food intake was accompanied by hypothalamic UPR activation, unchanged ObR expression, and reduced STAT3 phosphorylation; the picture was attributed to PTP1B, and both TUDCA and CHOP haploinsufficiency were protective [41]. PTP1B has also been shown to be modifiable by diet [23,36].
These four mechanisms do not rest on evidence of equal strength. The strongest causal findings come from receptor quality control and from mechanisms upstream of the UPR, where conditional genetic models link molecular changes to physiological endpoints [24,38,41]. Much of the evidence for SOCS3 and PTP1B, by contrast, is correlative: hypothalamic SOCS3 knockdown experiments are lacking [33], the ER stress–PTP1B relationship has not been tested with neuron-specific deletion, and the effect of PBA on SOCS3 is better explained by restoration of inducible feedback than by inhibition, which is itself a reason for caution in treating SOCS3 as a uniform marker of resistance (Section Context-Dependence of the Shared Effectors) [27]. No mechanism, including tanycyte-mediated transport, is supported by human data [51].
6. Endoplasmic Reticulum Stress
6.1. UPR Activation
This review distinguishes ER proteostasis, ER stress, and the UPR. ER proteostasis denotes the basal capacity of the ER to sustain protein folding, quality control, and degradation; ER stress denotes the point at which the unfolded protein load exceeds that capacity; and the UPR denotes the cellular programme that responds through the PERK–eIF2α–ATF4, IRE1α–XBP1, and ATF6 arms—initially adaptive but capable of impairing leptin signalling once it becomes chronic. The distinction matters because retention of LepRb following loss of ERAD can produce leptin resistance without activation of the PERK arm, showing that disrupted proteostasis can affect signalling without the stress response accounting for it [24]; the precise form of this claim is given in Section 9.1. Because the term ER proteostasis is used here in a specific sense, its components are set out explicitly in Table S4. Three layers are distinguished. The first is basal protein quality control: the folding capacity of the ER, the SEL1L–HRD1 ERAD complex, and the substrates it handles, among them LepRb itself; these operate continuously and are not switched on by stress. The second is stress sensing and the UPR: the PERK–eIF2α–ATF4, IRE1α–XBP1, and ATF6 arms together with their transcriptional outputs, of which CHOP is the one that recurs throughout this review. The third is the set of signalling effectors on which the first two layers are proposed to converge: CHOP, SOCS3, and PTP1B, of which only PTP1B is itself ER-resident, anchored to the cytosolic face of the ER membrane, which is what makes it the most direct physical link between the organelle and the termination of leptin signalling.
Two consequences of this classification should be stated plainly. First, GRP78/BiP, CHOP, and spliced XBP1 are read throughout this review as markers of UPR activation rather than as components of the basal quality-control machinery, so a study reporting them has measured the second layer and not the first. Second, the evidence assembled in this review is distributed very unevenly across the three layers: almost every included study measures the UPR layer, whereas the basal proteostasis layer, which is the most original element of the framework, rests on a single study [24]. The expression ER proteostasis node therefore denotes the union of these layers as a proposed functional unit and not a third entity distinct from them, and the proposition that the first layer belongs within the node is at present supported by one experiment.
Findings that all three UPR arms are activated together in the context of leptin resistance are consistent across models: sleep fragmentation [41], diet-induced obese rats [23], activation reversible by phenethyl isothiocyanate [21], and increased hypothalamic ER stress gene expression in neonates in a maternal obesity model [32]. The foundation of this framework is the study establishing the role of the IRE1α–XBP1 pathway in POMC neurons [18]. That study belongs to a small group of earlier reports on which the present argument rests: pharmacologically induced ER stress blocks leptin-induced STAT3 phosphorylation, an effect transmitted by PTP1B rather than SOCS3 and reversed by a chemical chaperone [16]; diet-induced obesity produces hypothalamic ER stress that chemical chaperones reverse, with reduced ER folding capacity increasing susceptibility [17]; and loss of Mfn2 in POMC neurons couples disrupted mitochondria–ER contacts to ER stress and leptin resistance [42]. These four studies fall outside the eligibility window of the evidence table and are appraised separately in Section 2.2 and Table S1.
Regulators upstream of the UPR indicate that the mechanism can be situated within a broader proteostasis network: deletion of TAK1 (MAP3K7) increases SREBP-mediated lipogenesis and ER capacity and thereby prevents ER-stress-driven leptin resistance and hyperphagic obesity under a high-fat diet [38].
6.1.1. Lipid Overload
Western-type diets rich in saturated fat are thought to trigger the UPR by altering ER membrane composition and protein-folding capacity. In apolipoprotein E-deficient mice, a Western diet raised markers of ER stress, whereas diallyl disulfide lowered these markers together with hypercholesterolaemia [25]; indole-3-carbinol has been reported to reduce plasma leptin and thereby to attenuate ER-stress-associated hyperleptinaemia [20].
These findings appear at first sight to conflict with the TAK1 study: in ApoE−/− models, reducing lipid load was associated with improvement in ER stress markers, whereas in TAK1 deletion, the increase in lipogenesis was interpreted as an expansion of ER capacity [38]. The discrepancy suggests that what matters is less the absolute lipid load than the balance between that load and the processing capacity of the ER—an interpretation that has not been tested directly.
6.1.2. Oxidative ER Stress
Because the ER lumen is an oxidising environment, shifts in redox balance can affect protein-folding capacity. The lipid peroxidation product 4-HNE has been reported to reduce leptin-stimulated STAT3 phosphorylation in a dose-dependent manner through the eIF2α–CHOP pathway; global tyrosine phosphorylation was unaffected, suggesting relative selectivity for leptin signalling [34]. Dehydroascorbic acid similarly raised GRP78, CHOP, and spliced XBP1 while lowering pSTAT3 [39], and redox disturbance was shown to affect leptin signalling in selenoprotein M deficiency as well [29].
6.1.3. Nutrient-Derived ER Stress
Nutrient excess is not the only relevant input; nutrient deprivation and specific metabolites also affect ER stress and leptin signalling. Glucose deprivation activates the UPR by increasing GRP78 and CHOP expression while reducing pSTAT3 and pSTAT5 [37], and elevated homocysteine selectively suppresses STAT3 activity [26]. From a developmental perspective, protein restriction combined with a high-fat diet has been associated with hypothalamic leptin resistance, a response attenuated by taurine supplementation [40].
Findings that several UPR arms are activated together across independent models are consistent, and CNS-specific Tak1 deletion offers causal support [38]; the load-versus-capacity interpretation, by contrast, is an inference drawn from the available data.
6.2. Molecular Convergence of Distinct Stressors on Leptin Resistance Effectors
One of the patterns that stands out in this review is that stressors as varied as sleep fragmentation, homocysteine, 4-HNE, glucose deprivation, Western-type diet, and maternal obesity all appear to act through a limited set of shared effectors—SOCS3, PTP1B, and CHOP. Of these, CHOP is the strongest candidate integrating mechanism: CHOP haploinsufficiency protects against hypothalamic leptin resistance [41], CHOP participates directly in regulation of the sOb-R promoter [31], and the effects of 4-HNE are mediated through the eIF2α–CHOP axis [34]. The term “shared effector” should nevertheless be understood as referring to the identity of the molecules involved rather than to a uniform direction of change: as the Section Context-Dependence of the Shared Effectors sets out, the sign of the effect depends on the tissue examined, on the stimulation state at the time of measurement, and on the genetic design used.
The localisation of PTP1B to the ER membrane provides a structural basis for considering SOCS3, PTP1B, and ER-stress-dependent effectors within a common proteostatic context. That αMSH lowers GRP78 and CHOP while suppressing SOCS3 and raising pSTAT3 further suggests that these mechanisms interact within a connected regulatory network rather than operating as independent processes [35]. The therapeutic hypothesis that follows is that modulating the mechanisms at which stressors converge might achieve broader efficacy than targeting each stressor separately; this approach has not yet been tested directly.
This shared pattern suggests that particular regulatory mechanisms may be common to distinct pathophysiological inputs. For CHOP, genetic findings support a causal role; for SOCS3 and PTP1B, the evidence is weaker. Because the stressors have not been assessed within the same model under comparable conditions, it remains difficult to determine whether the observed convergence is a general biological property or an apparent pattern arising from similarities between models (Table 3). Molecular convergence is therefore a hypothesis requiring direct comparative testing.
Table 3.
Testable hypotheses of the proposed framework. Each row gives a hypothesis, the outcome expected if it holds, an experimental design capable of testing it, the finding that would falsify it, and the extent to which it has been tested. The final column is excluded from the colour coding because it reports the state of testing rather than the model system from which the evidence derives.
6.3. A Possible ER Stress-Mediated Link Between Leptin and Insulin Resistance
The metabolic consequences of ER stress may not be confined to leptin signalling; similar mechanisms may also contribute to insulin resistance, placing the two disorders on a shared cellular footing. The facts that loss of SEL1L in POMC neurons is associated with hepatic steatosis, glucose intolerance, and insulin resistance, as well as leptin resistance [24] and that TUDCA improved findings related to both forms of resistance in a maternal obesity model [32] lend support to this possibility. A plausible molecular basis is that PTP1B dephosphorylates both JAK2 and the insulin receptor and that PI3K/Akt is a signalling component shared by the two hormones. No direct human evidence shows that correcting ER proteostasis improves both forms of resistance together. Table 4 compares the mechanisms discussed in Section 5 and Section 6 by the UPR arm affected, the point at which each acts, and the strength of the evidence supporting it.
Table 4.
Comparison of molecular mechanisms. Comparison of the mechanisms leading to leptin resistance by UPR arm affected, point of intervention, and level of evidence. The evidence column is colour-coded by the model system in which each mechanism was demonstrated: yellow = animal study, red = laboratory (in vitro) study.
6.4. The Causality Problem: Separating Direct Effects from Weight Loss
Most of the intervention studies summarised here share a common interpretive difficulty: nearly all report reductions in body weight and/or adiposity alongside the intervention (Table 5). Because weight loss by itself reduces hypothalamic ER stress and leptin resistance, it cannot be determined whether the observed improvement reflects a direct effect of the intervention or the accompanying weight loss.
Table 5.
Molecular target–dietary/pharmacological modulator–level of evidence. Molecular targets identified in leptin resistance and their corresponding dietary or pharmacological modulators. The evidence column indicates the model system in which each pairing was demonstrated and is colour-coded accordingly: green = human data, yellow = animal study, red = laboratory (in vitro) study.
The only study whose design overcomes this difficulty is the Roux-en-Y gastric bypass (RYGB) study of Chen et al. [28], which used a weight-matched caloric restriction control and showed that improvements in hypothalamic ER stress and leptin sensitivity were specific to RYGB. It is thus the sole direct basis for the claim that reducing ER stress can restore leptin sensitivity independently of weight loss, and it awaits independent replication; wider adoption of weight-matched controls in this field is needed.
A second difficulty concerns the target specificity of chemical chaperones: beyond reducing ER stress, PBA and TUDCA act on numerous targets, including histone deacetylase inhibition and bile acid signalling. Findings obtained with these agents therefore provide supportive but limited evidence, whereas findings based on CHOP genetics constitute a firmer basis.
Third, findings obtained solely in vitro warrant additional caution: four of these studies used SH-SY5Y neuroblastoma cells transfected to overexpress Ob-Rb, a tumour line that does not carry hypothalamic neuronal identity, and both receptor density and stressor concentrations lie outside the physiological range. Such studies are valuable for generating hypotheses but are not sufficient for inference about leptin resistance in vivo.
7. Intercellular Interactions
Leptin resistance is less a cell-autonomous event within an isolated neuron than the product of continuous interaction among hypothalamic neurons, microglia, astrocytes, and peripheral tissues. The low-grade inflammatory response that overnutrition induces in the hypothalamus is accompanied by ER stress induction and defective autophagy, and the process is mediated through interaction with non-neuronal cells [23,28]. A comparable relationship has been described at the level of sympathetic output: silencing Sirt1 or FoxO1 in the arcuate nucleus reduces leptin-mediated inflammation and sympathetic nerve activity [50].
The strongest evidence that this interaction can be reversed comes from bariatric surgery: RYGB improved hypothalamic gliosis, inflammatory signalling, and ER stress in diet-induced obese rats; the improvement was associated with increased central leptin responsiveness; and it was not observed in the weight-matched control [28] (Section 6.4).
Autophagy represents a further node in this network: a berberine-containing herbal preparation attenuated hypothalamic ER stress and leptin resistance through modulation of autophagy, with the findings confirmed in both microglial and neuronal cell models [23]. In the periphery, αMSH attenuates ER-stress-induced leptin resistance in adipose tissue, whereas ER stress induced by tunicamycin or thapsigargin reduces leptin sensitivity [35]—pointing to a link between central melanocortin signalling and peripheral adipose expansion that operates through ER stress.
Tissue and Cell-Type Specificity of the Evidence
The framework proposed here is formulated for the hypothalamus, but the evidence supporting it is not drawn from the hypothalamus alone, and the distinction matters because the same molecules do not behave identically across tissues. Of the twenty-two studies in the core evidence base, twelve measured outcomes in the hypothalamus, five in peripheral tissues alone (two in liver and aorta [20,25], one in adipose tissue [35], one in pancreatic islet [27], and one in liver [31]), and five in neuronal cell lines that do not carry hypothalamic identity. The model column of Table 1 names the tissue in each case.
Within the hypothalamic group, a second distinction is needed between neurons and the non-neuronal cells around them. Two studies attribute their effect to microglia rather than to neurons: the improvement in hypothalamic ER stress after gastric bypass was transferred through a circulating factor acting on microglia, which then altered POMC neurons [28], and the autophagy-dependent effect of a herbal preparation was reproduced in microglial and neuronal lines separately [23]. A measurement made in hypothalamic homogenates cannot distinguish these cell populations, and most of the included studies report homogenates.
Two conclusions follow. The claim that ER stress impairs leptin signalling is best supported in hypothalamic tissue, but the direction of the effect of individual components has been established partly in peripheral tissues, where it differs: CHOP is inhibitory in the hypothalamus and required for basal sOb-R production in the liver (Section Context-Dependence of the Shared Effectors), and the adipose and islet studies describe ER stress acting on leptin production and local responsiveness rather than on central signalling. This is the concrete reason for the single-cell and spatial approaches proposed in Section 11.4: the resolution of the measurements in the included studies is lower than the resolution the framework requires.
8. Developmental Programming and Epigenetic Regulation
Evidence that leptin resistance can be permanently programmed by early-life conditions continues to accumulate.
8.1. Developmental Programming
Maternal obesity has been reported to disrupt the development of melanocortin circuits in offspring, producing neonatal hyperleptinaemia and leptin resistance; to upregulate ER-stress-related genes in the hypothalamus; and to be corrected—in both its metabolic and its neurodevelopmental components—by neonatal TUDCA [32]. That an intervention delivered within a critical developmental window can alter an otherwise persistent phenotype points to a causal role for early-life ER stress.
Programming has been shown to begin at the level of the placenta: maternal obesity activates placental insulin/IGF-I/mTOR and leptin pathways [59], and placental dysfunction is associated with increased SOCS3 and PTPN2 expression [60]. The same axis operates postnatally, where perinatal diet composition and gestational thyroid hormone insufficiency produce persistent and partly sex-specific hypothalamic leptin signalling defects in adulthood [33,40,46].
The most direct evidence that this programming is reversible comes from silencing maternal SOCS3: a Socs3-shRNA lentivirus administered in early gestation to obese dams attenuated postnatal obesity in the offspring [55]. This suggests that increased hypothalamic SOCS3 is not merely a marker of early-life programming but also a mediator of it.
8.2. Epigenetic and Post-Translational Mediators
The first layer of epigenetic regulation comprises histone modification and the acetylation balance. Hypothalamic leptin action has been shown to be mediated by histone deacetylase 5 (HDAC5), which shapes the transcriptional output of leptin signalling at the chromatin level [61]. In parallel, hypothalamic expression of the nuclear receptor Nur77 falls in obese mice, leptin fails to reduce body weight in Nur77 knockout animals, and Nur77 recruits p300 and dissociates HDAC1, thereby increasing STAT3 acetylation and transcriptional activity [62].
The second layer has been defined at the level of DNA methylation and non-coding RNAs, and it includes human data: adiposity-associated DNA methylation signatures in adolescents have been related to leptin concentrations and perinatal factors [63], and circulating microRNAs in children with obesity have been associated with leptin resistance [64]. Experimentally, a maternal high-fat diet impairs leptin signalling in the neonatal hypothalamus and upregulates the type-1 cannabinoid receptor through sex-specific epigenetic changes [65].
The two layers do not rest on evidence of equal strength. Findings on developmental programming carry relatively strong causal support because they are reversible by intervention within a critical window [32,55], whereas the DNA methylation and microRNA findings are cross-sectional and correlational. More importantly, no direct mechanistic link between ER stress and epigenetic marks has been demonstrated; the fact that these two lines of evidence remain unintegrated is the most conspicuous gap in the framework proposed here.
9. A Unified Mechanistic Model and the Proposed Conceptual Framework
9.1. Integrating the Findings into a Single Mechanistic Model
The findings summarised in this review can be read not as a series of independent observations but as a single mechanistic route (Figure 3). In the proposed model, stressors that appear unrelated—lipid overload, oxidative products, nutrient-derived stressors, maternal obesity, and sleep fragmentation—converge on hypothalamic ER stress; ER stress activates all three arms of the UPR; and that activation converges on a narrow set of effectors (CHOP, SOCS3, and PTP1B). These effectors can be argued to suppress LepRb–JAK2–STAT3 signalling and so to produce leptin resistance, which in turn drives hyperphagia and increased adiposity, feeds back onto ER stress, and closes a self-reinforcing loop. No single study has demonstrated the route in its entirety. The model also keeps the two arms separate by design: what is shown on the left of Figure 3 concerns receptor maturation and surface availability, and no evidence connects it to the CHOP–SOCS3–PTP1B node.
Figure 3.
ER stress-mediated leptin resistance: a unified mechanistic model. Two mechanistically distinct arms are shown. In the ER stress-dependent arm (solid arrows), unrelated stressors converge on hypothalamic ER stress, which activates all three UPR branches and recruits a narrow effector set (CHOP, SOCS3, and PTP1B); the direction of effect within that set is tissue- and context-dependent (Section Context-Dependence of the Shared Effectors). In the proteostatic (ERAD) arm, labelled in the figure as the PERK-independent receptor quality-control arm (dashed arrows), which proceeds without activation of the PERK arm rather than in the absence of the entire ER stress response—BiP and spliced XBP1 are moderately elevated under high-fat feeding (Section 9.1)—loss of SEL1L–HRD1 ERAD causes LepRb misfolding and retention within the ER and so reduces the receptor available at the cell surface [24]; this arm acts directly on LepRb–JAK2–STAT3 signalling and does not pass through the effector set. The red loop denotes the self-reinforcing cycle in which leptin resistance, hyperphagia, and increased adiposity feed back onto hypothalamic ER stress. DHAA, dehydroascorbic acid; 4-HNE, 4-hydroxynonenal. No single study has demonstrated the complete route.
A second arm runs parallel to this route: LepRb quality control mediated by the SEL1L–HRD1 ERAD system, which operates without activation of the PERK arm [24]. Mao et al. showed that loss of SEL1L in POMC neurons causes the receptor to be retained within the ER and attenuates leptin signalling without detectable activation of the PERK arm; CHOP, SOCS3, and PTP1B were not examined in that study, and no work has tested whether this arm engages them. It is therefore represented in Figure 3 as acting directly on LepRb–JAK2–STAT3 signalling, bypassing the effector node. On this view, the ER can shape leptin signalling through both its stress response and its basal proteostatic function, by two routes that remain mechanistically distinct and should not be collapsed into one another. The independence from ER stress should be stated precisely rather than absolutely: in SEL1L-deficient POMC neurons, the receptor was retained without detectable activation of the PERK arm, while BiP and spliced XBP1 were moderately elevated under high-fat feeding [24]. What that study supports is therefore that receptor retention and the loss of leptin signalling occur without PERK activation, not that the ER stress response is wholly absent.
9.2. ER Proteostasis as a Convergence Node
On this basis, the following testable framework is proposed:
Endoplasmic reticulum proteostasis may function as a central convergence node that translates metabolic, inflammatory, developmental, and nutrient-derived signals into leptin resistance.
What distinguishes the framework is that it positions the ER not as one step in a chain leading to leptin resistance but as a proposed regulatory hub converting different classes of input into a common output. Three hypotheses follow, each corresponding to a directly testable experimental design.
The first is that the effector signature is independent of the input: whatever the stressor, a similar effector pattern encompassing CHOP, SOCS3, and PTP1B would be expected. The available data neither support nor refute this expectation with any precision: only two of the twenty-two studies measured all three effectors, several measured none of them, and two of the measurements that were made run against the predicted direction (Section Context-Dependence of the Shared Effectors). No study has tested different stressors within the same model under comparable conditions.
The second is that intervening at the shared effector node will prove more effective than targeting upstream stressors individually. Work on chemical chaperones and CHOP genetics offers partial support, but no study has compared node-level intervention with upstream intervention within a single model.
The third is that disrupted ER proteostasis can produce leptin resistance without activation of the PERK arm and without UPR activation sufficient to account for the signalling defect. The SEL1L–HRD1 ERAD finding of Mao et al. [24] is the only direct evidence supporting this hypothesis and represents the most original aspect of the framework, although the support is partial rather than complete, since receptor retention occurred without PERK activation while BiP and spliced XBP1 were moderately elevated (Section 9.1); were it confirmed, it would follow that studies measuring only UPR markers are missing part of the leptin resistance phenotype. Whether this arm ultimately converges on the same effectors is an open question rather than an assumption of the model, and Figure 3 represents it as unconnected to them for that reason.
The framework requires the ER stress and ER proteostasis literature to be brought together, and it carries an explicit falsification criterion: a demonstration that different stressors produce markedly different effector signatures would invalidate it.
Table 3 lists these three hypotheses, together with two further hypotheses concerning the load-to-capacity ratio and translatability to humans, in terms of the expected outcome, the proposed experimental design, the falsifying finding, and the current state of testing.
10. Clinical Implications
Details about the molecular mechanism acquire clinical meaning only to the extent that they can be translated into patient care. Figure 4 sets out the therapeutic approaches considered in this section by level of intervention, together with the nature of the evidence available for each.
Figure 4.
Therapeutic targets and levels of evidence. Therapeutic approaches by level of intervention and the nature of the evidence available for each. Receptor quality control (SEL1L–HRD1 ERAD) is shown as a category separate from interventions directed at the UPR effectors (CHOP, SOCS3, and PTP1B) because ERAD is a basal proteostatic mechanism rather than a stress-signalling pathway (Section Context-Dependence of the Shared Effectors and Section 9.1).
10.1. Clinical Outcomes of Leptin Replacement Therapy
Recombinant leptin has been tested in common obesity in several randomised, placebo-controlled trials, and the results have been consistently modest (Table 6). The largest, reported by Zelissen et al. [66], randomised 284 overweight and obese adults, after a three-week diet lead-in, to placebo or to 10 mg of recombinant methionyl human leptin given each morning, each night, or twice daily for twelve weeks; weight loss of 2.6 to 3.4 kg did not differ between the arms, and no schedule was superior to any other. In the earlier dose-escalation study of Heymsfield et al. [67], 54 lean and 73 obese participants received daily subcutaneous leptin (0.01–0.30 mg/kg/day). The two cohorts were not studied in parallel: lean participants were treated for four weeks on a weight-maintaining diet, and only the obese participants continued into the 24-week phase alongside a 500 kcal/day energy deficit. A significant dose–response relationship for weight loss was reported in the obese cohort, with the largest mean loss at the highest dose of 0.30 mg/kg/day (p = 0.01 across doses among the 47 obese participants who completed 24 weeks), although comparisons between individual dose groups did not reach significance. The size of that effect depends on the analysis applied: mean weight change at 0.30 mg/kg/day was −7.1 (8.5) kg against −1.3 (4.9) kg on placebo among completers (n = 8 and n = 12), but −3.3 (6.7) kg against −1.0 (3.8) kg when the last observation was carried forward (n = 18 and n = 20), so that the placebo-adjusted difference at the highest dose falls from about 5.8 kg, roughly 6% of baseline body weight, to about 2.3 kg, roughly 2.5%. Pegylated leptin was tested in the same period: weekly PEG-OB produced no difference from placebo in obese men [68], and when combined with a very-low-energy diet (2.1 MJ/day), it produced significantly greater weight loss than placebo during treatment (p < 0.03), followed by faster and larger regain once treatment stopped [69]. Two trials in type 2 diabetes, in which leptin might plausibly have acted on glycaemia rather than on weight, were also negative for body weight: fourteen days of recombinant leptin at 30 or 80 mg per day changed neither body weight nor body composition nor insulin action in eighteen participants [70], and sixteen weeks of metreleptin in seventy-one participants left body weight unchanged while reducing HbA1c only marginally, from 8.01% to 7.96% [71]. The hormone has also been given to people in whom it might be expected to work better: in 27 women studied at least eighteen months after Roux-en-Y gastric bypass, when circulating leptin is low, metreleptin twice daily for sixteen weeks changed neither body weight, fat mass, nor resting energy expenditure [72].
Table 6.
Randomised trials of leptin in common obesity. Randomised, placebo-controlled trials of recombinant or pegylated leptin in people with overweight or obesity who are not leptin-deficient, in order of publication. Trials in congenital leptin deficiency and lipodystrophy are not included because leptin is replacement therapy in those conditions. The weight outcome column reports the comparison with placebo rather than the within-group change, since all of these trials were conducted alongside an energy-restricted diet or after weight loss.
Two conclusions follow from this body of work, and they should be kept apart. The first is that the clinical benefit of raising circulating leptin in common obesity is limited; inconsistent across doses, schedules, formulations, and degrees of preceding weight loss; and not reliably sustained after treatment ends. The qualification is deliberate because the evidence is not uniformly null: Heymsfield et al. [67] reported a significant dose–response relationship for weight loss in the obese cohort, which indicates that exogenous leptin can exert a measurable pharmacological effect on body weight and that a blanket statement of no effect would overstate what these trials show. Three features of that study nevertheless limit how far the finding can be taken. It was a dose-escalation design in which comparisons between individual dose groups did not reach significance, so the trend rests on the ordering of group means rather than on any demonstrated separation between doses; the dose groups were small and the between-individual variance in weight change wide, so the mean loss at the highest dose reflects a subset of responders rather than a consistent response; and attrition over the 24 weeks was considerable, which leaves the completer-based estimate open to bias: carrying the last observation forward reduces the mean loss at the highest dose from 7.1 to 3.3 kg and the placebo-adjusted difference from about 5.8 to about 2.3 kg. Read together with the larger and longer trials that followed [66,68,69,70,71,72], in which the only separation from placebo was the additional weight loss observed during PEG-OB treatment (p < 0.03), itself followed by greater regain after treatment ended [69], the body of work indicates a benefit that was limited; inconsistent across doses, schedules, and formulations; and not reliably sustained, rather than an effect of therapeutic magnitude. It does not support leptin administration as a treatment for common obesity. The second does not follow from these trials at all. That limited and inconsistent benefit is consistent with the framework proposed here, in which resistance is generated at the receptor, post-receptor, and bioavailability levels at once, so that adding ligand corrects none of them, but it is equally consistent with saturable transport of leptin into the brain [12], with the pharmacokinetics of the preparations used, and with the enrolment of unstratified populations in which any mechanism-specific subgroup would be diluted (Section 10.5). The second of these alternatives is not hypothetical: in the metreleptin trial in type 2 diabetes, total leptin, leptin-binding protein, and anti-leptin antibodies all rose during treatment, so that free leptin remained limited despite administration [71], which is a bioavailability-level explanation of the kind described in Section 5 and is independent of any hypothalamic mechanism. A trial of a ligand, whether negative or weakly positive, identifies neither the step at which the pathway fails nor the mechanism responsible, so these results cannot be read as support for an ER origin of leptin resistance, and they are not treated as such here. What they do establish is the clinical premise from which this review proceeds: in common obesity, the aim is not to administer leptin but to repair the response to it. States of genuine deficiency, such as congenital leptin deficiency and lipodystrophy, fall outside this assessment.
10.2. Human Data on Chemical Chaperones
Chemical chaperones have been tested in humans, but leptin endpoints were not assessed. Kars et al. [53] gave TUDCA (1750 mg/day) or placebo to 20 participants with obesity for four weeks and reported an approximately 30% increase in hepatic and muscle insulin sensitivity in the TUDCA arm. Xiao et al. [54] showed that two weeks of oral sodium phenylbutyrate (7.5 g/day) partly attenuated lipid infusion-induced insulin resistance.
These two trials point in two directions at once. Interventions targeting ER stress are feasible in humans, are tolerated, and can produce measurable metabolic benefit, and the interest is extending to other metabolic diseases [73,74]. Against this, both trials measured only insulin endpoints, the samples were small (n = 20 and n = 8), and the exposures were brief; the assumption that chemical chaperones correct leptin resistance in humans therefore remains untested and represents the most concrete gap in the field.
10.3. PTP1B as a Therapeutic Target
PTP1B is the member of the proposed effector node that appears most amenable to drug development [75]. The aminosterol trodusquemine was reported to suppress appetite and produce fat-specific weight loss in diet-induced obese mice [76] and was well tolerated in phase 1 trials, yet the development programme for the obesity indication was not pursued.
The reason is not inefficacy alone but the structural nature of the target: the catalytic site of PTP1B is highly polar and charged, molecules that bind it remain too polar to cross the cell membrane, and structural similarity to other members of the phosphatase family creates a selectivity problem. Current work has therefore turned to allosteric and natural product-derived inhibitors [56]. Correctly identifying an effector node, in other words, does not make that node druggable.
10.4. Bariatric Surgery and Incretin-Based Therapies
The mechanism of bariatric surgery bears directly on the proposed framework (Section 6.4 and Section 7): that RYGB improves hypothalamic ER stress and inflammation, that this is associated with increased central leptin sensitivity, and that it is not seen in a weight-matched control [28] offer a mechanistic explanation for why surgically induced weight loss is more durable than equivalent loss achieved by diet.
GLP-1 receptor agonists raise a different question: liraglutide has been reported to attenuate the fall in free plasma leptin during maintenance of weight loss [77]. Since weight loss normally lowers free leptin and thereby facilitates weight regain, this effect may contribute to the drug’s efficacy. The study did not, however, assess sensitivity, and the effect of GLP-1 receptor agonists on hypothalamic ER stress has not been examined in humans. Table 7 summarises the interventions that target this axis, together with the current state of human data for each.
Table 7.
Therapeutic interventions and the state of human data. Interventions targeting the ER stress–leptin resistance axis; the human data column indicates the current limit of clinical translation. The column is colour-coded by the model system in which the intervention was evaluated: green = human data, yellow = animal study.
10.5. Molecular Heterogeneity of Leptin Resistance and a Phenotyping Framework
One of the most direct clinical implications of this review is that leptin resistance is not a single entity: the findings in Section 5 and Section 6 show that it can arise at different molecular levels and that a set of phenotypes distinguished by dominant mechanism exists.
Table 8 proposes a phenotyping framework on this basis, linking five questions: which patient, which dominant mechanism, which biomarker, which intervention, and which primary endpoint. Because an intervention effective in only one subgroup will appear ineffective overall in an unstratified trial, establishing this chain is a precondition for making the axis clinically testable. The history of the leptin field illustrates the risk: recombinant leptin produced only limited and inconsistent weight loss in an unselected obese population [67] but was markedly effective in the leptin-deficient phenotype [7].
Table 8.
Proposed leptin resistance phenotypes and the chain of clinical testing. The chain: patient–dominant mechanism–candidate biomarker–intervention–primary endpoint. The phenotypes are derived from animal and laboratory studies; none has been confirmed in humans. The final column is colour-coded by the model system on which the phenotype rests: green = human data, yellow = animal study. The biomarkers and the predicted responses in this table are hypothetical. No phenotype listed here has been identified in a human population, no biomarker has been validated for this purpose, and no predicted response has been tested in a trial. The final column states the kind of study each row is extrapolated from and should be read as the basis of the proposal rather than as a level of support; rows resting on human observational data are distinguished there from those extrapolated from animal or cell models.
The status of this framework should be stated plainly: none of the proposed phenotypes has been confirmed in humans. The classification is a hypothesis-generating structure derived from animal and laboratory findings, and the biomarkers listed are candidates. Its purpose is not to offer a clinical algorithm but to define a testable stratification hypothesis.
The weakest link in the framework is measurement: hypothalamic ER stress cannot be measured directly in humans, so distinguishing an ER-dominant phenotype depends on unvalidated indirect markers. The second weak link is the endpoint, since no standard method exists for measuring leptin sensitivity in a clinical setting. Until both gaps are addressed, the pairings in Table 8 cannot be tested (Table 2).
10.6. Determinants of Individual Response Variability
The framework assumes that individuals do not respond identically to the same metabolic load—the founding premise of the personalised nutrition literature [78], which has empirical support [79]. A plausible molecular counterpart is that, where ER folding capacity differs between individuals, the same dietary lipid load will generate different degrees of ER stress [38] (Section 6.1.1); this inference remains conceptual.
The first source of variability is genotype. The most direct human evidence comes from the LEPR Q223R (rs1137101) variant, which reduces leptin binding and predicts annual weight gain in childhood obesity [80]. Rare variants illustrate the same principle at the level of proteostasis: the Cys604Ser variant of LepRb is prone to misfolding and is processed as an ERAD substrate [24]. Because no study has shown that a genotype-tailored intervention alters outcome, the evidence remains at the level of a hypothesis [81].
The second source is developmental windows; the determinant of response variability with the strongest evidence base is early-life exposure (Section 8). Its clinical implication is twofold: the timing of an intervention may determine its efficacy, and sex should be treated as an independent response modifier [32,46,55,65].
The third source is diet-derived modulators, and it is notable that most of the compounds found effective along this axis are dietary in origin: phenethyl isothiocyanate, indole-3-carbinol, diallyl disulfide, proanthocyanidins, biochanin A, berberine, taurine, and a Rubisco-derived plant peptide [20,21,23,25,30,36,40,57] (Table 5). Three caveats apply: the studies were conducted almost entirely in animal models and at doses above the range attainable through diet; most reported concurrent weight loss, so direct effects cannot be separated (Section 6.4); and differences in bioavailability and microbiota-mediated metabolism may alter efficacy [58].
10.7. Implications for Clinical Practice
As far as the current evidence allows, the clinical implications can be grouped under four points.
The first concerns the interpretation of hyperleptinaemia: a high leptin concentration in a patient with obesity reflects a defective response rather than an excess of hormone, and leptin measurement does not currently function as a decision tool in routine practice.
The second concerns diet composition: although most of the compounds of interest are dietary in origin, the findings remain at the level of animal models and do not support supplementation. They provide mechanistic support only for existing advice to reduce saturated fat and excess caloric load.
The third concerns the nature of weight loss: surgical data suggest that the same amount of weight loss may have different effects on the central leptin response depending on how it is achieved, so that the method as well as the magnitude of loss deserves attention.
The fourth concerns the prospect of phenotype-based stratification: adiposity-associated DNA methylation signatures and circulating microRNAs [63,64] may represent measurable molecular correlates of individual differences in response. These findings are correlational and unvalidated, however, and provide no basis for any clinical decision at present.
The clinical value of this review lies not in offering a treatment recommendation but in explaining mechanistically why current treatments do and do not work, and in defining a concrete research question ready for testing: can agents targeting ER proteostasis restore leptin sensitivity in humans?
11. Conclusions
This review has examined leptin resistance at the intersection of intracellular signalling networks and endoplasmic reticulum stress, synthesising 22 core primary studies together with the supporting literature. The aim was not to restate known mechanisms but to unify them under a single testable framework and to explicitly set out the points at which that framework could be falsified.
11.1. Principal Conclusions of the Synthesis
Three principal conclusions emerge. First, the ER appears to shape leptin signalling at the levels of receptor biogenesis, receptor bioavailability, and post-receptor inhibition; that the first of these layers operates without PERK activation and rests on a conditional genetic design makes it the best-supported claim in this review, although it rests on a single study whose risk-of-bias profile is set out in Section 11.2. Second, distinct stressors appear to recruit a narrow set of effectors, although convergence refers to the identity of these molecules rather than to a uniform direction of change: CHOP acts as a stress-induced inhibitor in the hypothalamus yet sustains basal sOb-R production in the liver, and leptin-induced SOCS3 marks intact feedback whereas a chronically raised basal level accompanies resistance. The causal role of CHOP is supported by genetic evidence, while the evidence for SOCS3 and PTP1B remains correlative. Third, this node appears pharmacologically accessible in experimental models, yet direct effects have been separated from weight-loss-dependent effects in only one weight-matched study [28].
11.2. Limitations of the Evidence Base
All of these conclusions must be read against a substantial constraint: seventeen of the twenty-two studies in the core evidence base rest on rodent in vivo models and five on cell culture alone, and no study has been conducted in human participants. Studies using the human-derived SH-SY5Y line provide data from a human cell line, not human data.
A second constraint concerns the internal validity of those studies. Applying SYRCLE’s tool to the seventeen animal studies produced 136 of 170 item-level judgements of unclear risk, 26 of high risk and 8 of low risk (Tables S2 and S3). No study described the method by which an allocation sequence was generated, reported allocation concealment, or reported random housing; only one study made an explicit statement about blinding, and that statement was that the investigators were not blinded [24]. The high-risk judgements cluster in two items. The first is incomplete outcome data, where eight studies report group sizes that fall between allocation and analysis without explanation or that differ between the methods and the results. The second is other sources of bias, where twelve studies carry a concern specific to the design, most often an analysis unit that does not correspond to the unit of allocation. These findings do not show that the reported effects are false. They show that, for most items in most studies, risk of bias cannot be determined from what has been published, which is a different and more constraining position than a study judged to be at low or high risk.
The point applies with most force to the findings on which this review leans hardest. The SEL1L–HRD1 result that supports the proteostasis–stress distinction comes from a study whose authors state that the investigators were not blinded and in which some comparisons rest on one or two animals per group [24]. The CHOP haploinsufficiency result that provides the causal evidence for the effector node comes from a study whose group sizes differ between the methods and the results and whose genetic model is described inconsistently [41]. The SOCS3 finding discussed in the section Context-Dependence of the Shared Effectors comes from a study in which islets from two animals were pooled per sample and protein samples were pooled again before immunoblotting, so it carries no biological replication and no estimate of between-animal variance [27]. Each remains the best available evidence for the claim it supports, and none should be treated as settled.
Together, these constraints determine which claims the evidence supports. Animal models support the proposition that ER stress can impair hypothalamic leptin signalling and that the impairment is reversible, and they do so consistently across unrelated models and interventions, but the proposition cannot be called strongly supported because the studies that establish it are, with few exceptions, not reported in enough detail to exclude selection, performance, and detection bias. Consistency across studies whose internal validity is largely unverifiable is weaker evidence than consistency across studies that have been shown to be at low risk of bias. The same evidence base does not support the proposition that targeting ER proteostasis should be used as an obesity treatment in humans; such a proposal is at best a hypothesis worth testing.
The distinction deserves emphasis because the history of the leptin field is itself instructive: recombinant leptin was markedly effective in rodent models yet failed in common human obesity, and there is no basis for assuming that strategies targeting ER stress will avoid a comparable discontinuity.
A further limitation concerns the construction of the evidence base itself. Studies were eligible only if they linked an ER stress or UPR component to leptin signalling, so the search was designed to retrieve evidence of ER involvement and could not retrieve evidence that some other mechanism predominates. The synthesis can therefore show that ER-related mechanisms are reported across a wide range of inputs; it cannot establish that they matter more than the inflammatory, transport-level, or transcriptional mechanisms examined in studies this search did not sample. Node primacy (Hypothesis 2, Table 3) is stated as a hypothesis for precisely this reason, and testing it requires head-to-head comparison within a single model rather than a larger review.
Further limitations are as follows: (i) the great majority of studies used male animals, and sex differences have not been examined systematically, with El-Sehrawy et al. [22] being an exception; (ii) phytochemical doses exceed the range attainable through diet in humans; (iii) effect sizes vary widely across models; (iv) study durations are generally limited to 6–12 weeks; (v) although leptin resistance manifests with different molecular signatures in different tissues, most studies treat it as a single entity; (vi) the search was confined to two databases and did not include citation tracking of the reference lists of the included studies, so relevant reports indexed elsewhere may have been missed; and (vii) the five laboratory-only studies all originate from a single research group, so the in vitro evidence is less independent than the number of reports suggests, and the recurrence of the same markers across them partly reflects a shared methodological tradition.
11.3. Research Gaps
The principal research gaps and the methodological approaches required to address them are summarised in Table 2; the most important is the absence of a randomised controlled trial testing whether an intervention targeting ER stress restores leptin sensitivity in humans.
11.4. Methodological Requirements and Future Directions
Closing these gaps will require several methodological advances: single-cell and spatial transcriptomics could resolve the cell-type-specific UPR activation that tissue homogenates obscure; human iPSC-derived hypothalamic organoids could overcome the limitations of the SH-SY5Y line; multi-omic integration could be used to identify circulating biomarkers; and computational drug discovery could contribute to the design of selective PTP1B and UPR modulators [56].
How the response varies between individuals, meanwhile, is unknown. Studies stratified by genotype, epigenetic profile, microbiota composition, and baseline metabolic state offer the most realistic route to testing these compounds in humans, but this is a research programme that first requires phenotyping tools to be developed.
The field should also adopt two design standards: the use of weight-matched control groups in intervention studies, and the inclusion of both sexes.
11.5. Concluding Assessment
In rodent models, the endoplasmic reticulum appears to act at more than one level of leptin resistance rather than at a single point in a linear chain, and this multi-layered role—extending from receptor quality control to induction of negative regulators—is supported by conditional genetic designs. It does not follow that the ER is the regulatory centre of leptin resistance. The evidence assembled here cannot establish that ER-related mechanisms matter more than the inflammatory, transport-level, or transcriptional mechanisms examined in studies this search was not designed to sample (Section 11.2), and node primacy is retained for that reason as a hypothesis awaiting head-to-head comparison within a single model (Hypothesis 2, Table 3). The endoplasmic reticulum is therefore advanced here as a candidate convergence node, and recasting that observation as a convergence-node framework remains at the level of a hypothesis.
The most important consequence of this multi-layered organisation is that leptin resistance is not a uniform disorder; the phenotypes arising at different levels (Table 8) offer a molecular basis for explaining why the same intervention produces different outcomes in different individuals. Resolving the molecular heterogeneity of leptin resistance may be necessary before interventions aimed at restoring leptin sensitivity can be tested in the appropriate patient subgroups.
The conditional phrasing is deliberate: the evidence base consists largely of animal and cell culture studies, and in humans, neither can leptin resistance phenotypes be distinguished nor can hypothalamic ER stress be measured. The stratification proposed here is therefore not a clinical strategy but a mechanistically justified research programme.
The priority for the field is not to generate further rodent studies but to take three concrete steps: (i) developing and validating circulating biomarkers capable of distinguishing leptin resistance phenotypes in humans; (ii) testing agents already administered in humans, such as TUDCA and 4-PBA, in weight-matched trials with leptin sensitivity as the primary endpoint; and (iii) designing studies in which interventions are stratified by genotype, epigenetic profile, and microbiota composition.
Supplementary Materials
The following supporting information can be downloaded at https://www.mdpi.com/article/10.3390/life16111818/s1, Table S1: Foundational pre-2015 studies appraised separately from the core evidence base; Table S2: Item-level SYRCLE risk of bias judgements for the seventeen animal studies; Table S3: Basis for each risk of bias judgement other than unclear; Table S4: Components of ER proteostasis as defined in this review.
Author Contributions
Conceptualization, Ş.A.; methodology, Ş.A.; writing—original draft preparation, Ş.A.; writing—review and editing, Ş.A., N.Y. and H.T.B.; visualization, Ş.A.; supervision, H.T.B. All authors have read and agreed to the published version of the manuscript.
Funding
This research received no external funding.
Institutional Review Board Statement
Not applicable. This study is a narrative review of published research and did not involve human participants, animals, or new data collection.
Informed Consent Statement
Not applicable.
Data Availability Statement
No new data were created or analyzed in this study. Data sharing is not applicable to this article. All studies synthesised are published and are listed in the reference list; the search strategy and selection criteria are reported in full in Section 2.
Conflicts of Interest
The authors declare no conflicts of interest.
References
- Coleman, D.L. Effects of parabiosis of obese with diabetes and normal mice. Diabetologia 1973, 9, 294–298. [Google Scholar] [CrossRef] [Scilit]
- Zhang, Y.; Proenca, R.; Maffei, M.; Barone, M.; Leopold, L.; Friedman, J.M. Positional cloning of the mouse obese gene and its human homologue. Nature 1994, 372, 425–432. [Google Scholar] [CrossRef] [Scilit]
- Halaas, J.L.; Gajiwala, K.S.; Maffei, M.; Cohen, S.L.; Chait, B.T.; Rabinowitz, D.; Lallone, R.L.; Burley, S.K.; Friedman, J.M. Weight-reducing effects of the plasma protein encoded by the obese gene. Science 1995, 269, 543–546. [Google Scholar] [CrossRef] [Scilit]
- Pelleymounter, M.A.; Cullen, M.J.; Baker, M.B.; Hecht, R.; Winters, D.; Boone, T.; Collins, F. Effects of the obese gene product on body weight regulation in ob/ob mice. Science 1995, 269, 540–543. [Google Scholar] [CrossRef] [Scilit]
- Tartaglia, L.A.; Dembski, M.; Weng, X.; Deng, N.; Culpepper, J.; Devos, R.; Richards, G.J.; Campfield, L.A.; Clark, F.T.; Deeds, J.; et al. Identification and expression cloning of a leptin receptor, OB-R. Cell 1995, 83, 1263–1271. [Google Scholar] [CrossRef] [Scilit]
- Montague, C.T.; Farooqi, I.S.; Whitehead, J.P.; Soos, M.A.; Rau, H.; Wareham, N.J.; Sewter, C.P.; Digby, J.E.; Mohammed, S.N.; Hurst, J.A.; et al. Congenital leptin deficiency is associated with severe early-onset obesity in humans. Nature 1997, 387, 903–908. [Google Scholar] [CrossRef] [Scilit]
- Farooqi, I.S.; Jebb, S.A.; Langmack, G.; Lawrence, E.; Cheetham, C.H.; Prentice, A.M.; Hughes, I.A.; McCamish, M.A.; O’Rahilly, S. Effects of recombinant leptin therapy in a child with congenital leptin deficiency. N. Engl. J. Med. 1999, 341, 879–884. [Google Scholar] [CrossRef] [Scilit]
- Friedman, J.M. Leptin and the endocrine control of energy balance. Nat. Metab. 2019, 1, 754–764. [Google Scholar] [CrossRef] [Scilit]
- Obradovic, M.; Sudar-Milovanovic, E.; Soskic, S.; Essack, M.; Arya, S.; Stewart, A.J.; Gojobori, T.; Isenovic, E.R. Leptin and obesity: Role and clinical implication. Front. Endocrinol. 2021, 12, 585887. [Google Scholar] [CrossRef] [Scilit]
- World Health Organization. Obesity and Overweight. Available online: https://www.who.int/news-room/fact-sheets/detail/obesity-and-overweight (accessed on 19 July 2026).
- GBD 2021 Adult BMI Collaborators. Global, regional, and national prevalence of adult overweight and obesity, 1990–2021, with forecasts to 2050: A forecasting study for the Global Burden of Disease Study 2021. Lancet 2025, 405, 813–838. [Google Scholar] [CrossRef] [Scilit]
- Myers, M.G.; Leibel, R.L.; Seeley, R.J.; Schwartz, M.W. Obesity and leptin resistance: Distinguishing cause from effect. Trends Endocrinol. Metab. 2010, 21, 643–651. [Google Scholar] [CrossRef] [Scilit]
- Izquierdo, A.G.; Crujeiras, A.B.; Casanueva, F.F.; Carreira, M.C. Leptin, obesity, and leptin resistance: Where are we 25 years later? Nutrients 2019, 11, 2704. [Google Scholar] [CrossRef] [Scilit]
- Hu, W.; Zhu, H.; Gong, F. Leptin and leptin resistance in obesity: Current evidence, mechanisms and future directions. Endocr. Connect. 2025, 14, e250521. [Google Scholar] [CrossRef] [Scilit]
- Page, M.J.; McKenzie, J.E.; Bossuyt, P.M.; Boutron, I.; Hoffmann, T.C.; Mulrow, C.D.; Shamseer, L.; Tetzlaff, J.M.; Akl, E.A.; Brennan, S.E.; et al. The PRISMA 2020 statement: An updated guideline for reporting systematic reviews. BMJ 2021, 372, n71. [Google Scholar] [CrossRef] [Scilit]
- Hosoi, T.; Sasaki, M.; Miyahara, T.; Hashimoto, C.; Matsuo, S.; Yoshii, M.; Ozawa, K. Endoplasmic reticulum stress induces leptin resistance. Mol. Pharmacol. 2008, 74, 1610–1619. [Google Scholar] [CrossRef] [Scilit]
- Ozcan, L.; Ergin, A.S.; Lu, A.; Chung, J.; Sarkar, S.; Nie, D.; Myers, M.G., Jr.; Ozcan, U. Endoplasmic reticulum stress plays a central role in development of leptin resistance. Cell Metab. 2009, 9, 35–51. [Google Scholar] [CrossRef] [Scilit]
- Williams, K.W.; Liu, T.; Kong, X.; Fukuda, M.; Deng, Y.; Berglund, E.D.; Deng, Z.; Gao, Y.; Liu, T.; Sohn, J.W.; et al. Xbp1s in Pomc neurons connects ER stress with energy balance and glucose homeostasis. Cell Metab. 2014, 20, 471–482. [Google Scholar] [CrossRef] [Scilit]
- Hooijmans, C.R.; Rovers, M.M.; de Vries, R.B.M.; Leenaars, M.; Ritskes-Hoitinga, M.; Langendam, M.W. SYRCLE’s risk of bias tool for animal studies. BMC Med. Res. Methodol. 2014, 14, 43. [Google Scholar] [CrossRef] [Scilit]
- Kim, H.J. Indole-3-carbinol ameliorates ER stress-mediated hyperleptinemia in western diet-fed apoE−/− mice. Food Nutr. Res. 2026, 70, 12263. [Google Scholar] [CrossRef] [Scilit]
- Xu, J.; Ma, C.; Zhang, L.; Gao, H.; Huang, Q.; Deng, Q.; Xiang, X.; Li, W.; Huang, F. Phenethyl isothiocyanate ameliorates high-fat diet-induced obesity by antagonizing hypothalamic leptin resistance. Phytomedicine 2026, 156, 158234. [Google Scholar] [CrossRef] [Scilit]
- El-Sehrawy, A.A.M.A.; Amirhosseinjaberi; Zandi, E.; Yazdi, F.; Rafiei, S.; Sapaev, I.B.; Karkon Shayan, S.; Ali Khiavi, P.; Salajegheh, P.; Shadi, M.; et al. Selective ERα attenuates hypothalamic ER stress and regulates energy homeostasis in ovariectomized mice fed with high-fat diet. J. Biochem. Mol. Toxicol. 2025, 39, e70446. [Google Scholar] [CrossRef] [Scilit]
- Hua, T.; Wu, Q.; Huang, Z.; Cai, J. Fufang Zhenzhu Tiaozhi capsule alleviates hypothalamic endoplasmic reticulum stress and leptin resistance through autophagy modulation in DIO rats. J. Ethnopharmacol. 2025, 351, 120056. [Google Scholar] [CrossRef] [Scilit]
- Mao, H.; Kim, G.H.; Pan, L.; Qi, L. Regulation of leptin signaling and diet-induced obesity by SEL1L-HRD1 ER-associated degradation in POMC expressing neurons. Nat. Commun. 2024, 15, 8435. [Google Scholar] [CrossRef] [Scilit]
- Kim, H.J.; Kim, M. Diallyl disulfide alleviates hypercholesterolemia induced by a western diet by suppressing endoplasmic reticulum stress in apolipoprotein E-deficient mice. BMC Complement. Med. Ther. 2023, 23, 141. [Google Scholar] [CrossRef] [Scilit]
- Preninka, A.I.; Kuriya, K.; Yazawa, K.; Yoshii, M.; Yanase, Y.; Jockers, R.; Dam, J.; Hosoi, T.; Ozawa, K. Homocysteine causes neuronal leptin resistance and endoplasmic reticulum stress. PLoS ONE 2022, 17, e0278965. [Google Scholar] [CrossRef] [Scilit]
- Baba, B.; Caliskan, M.; Boyuk, G.; Hacisevki, A. Chemical chaperone PBA attenuates ER stress and upregulates SOCS3 expression as a regulator of leptin signaling. Biochemistry 2021, 86, 480–488. [Google Scholar] [CrossRef] [Scilit]
- Chen, J.; Haase, N.; Haange, S.B.; Sucher, R.; Münzker, J.; Jäger, E.; Schischke, K.; Seyfried, F.; von Bergen, M.; Hankir, M.K.; et al. Roux-en-Y gastric bypass contributes to weight loss-independent improvement in hypothalamic inflammation and leptin sensitivity through gut-microglia-neuron-crosstalk. Mol. Metab. 2021, 48, 101214. [Google Scholar] [CrossRef] [Scilit]
- Gong, T.; Hashimoto, A.C.; Sasuclark, A.R.; Khadka, V.S.; Gurary, A.; Pitts, M.W. Selenoprotein M promotes hypothalamic leptin signaling and thioredoxin antioxidant activity. Antioxid. Redox Signal. 2021, 35, 775–787. [Google Scholar] [CrossRef] [Scilit]
- Horiuchi, K.; Tsuchio, K.; Matsushima, G.; Thon, M.; Hosoi, T.; Ozawa, K. The possible role of biochanin A in ameliorating endoplasmic reticulum stress-induced leptin resistance. Neuroreport 2021, 32, 983–987. [Google Scholar] [CrossRef] [Scilit]
- Drori, A.; Gammal, A.; Azar, S.; Hinden, L.; Hadar, R.; Wesley, D.; Nemirovski, A.; Szanda, G.; Salton, M.; Tirosh, B.; et al. CB1R regulates soluble leptin receptor levels via CHOP, contributing to hepatic leptin resistance. eLife 2020, 9, e60771. [Google Scholar] [CrossRef] [Scilit]
- Park, S.; Jang, A.; Bouret, S.G. Maternal obesity-induced endoplasmic reticulum stress causes metabolic alterations and abnormal hypothalamic development in the offspring. PLoS Biol. 2020, 18, e3000296. [Google Scholar] [CrossRef] [Scilit]
- Aiceles, V.; Gombar, F.; Cavalcante, F.; Ramos, C. Congenital hypothyroidism is associated with impairment of the leptin signaling pathway in the hypothalamus in male Wistar animals in adult life. Horm. Metab. Res. 2019, 51, 330–335. [Google Scholar] [CrossRef] [Scilit]
- Hosoi, T.; Kuwamura, A.; Thon, M.; Tsuchio, K.; Abd El-Hafeez, A.A.; Ozawa, K. Possible involvement of 4-hydroxy-2-nonenal in the pathogenesis of leptin resistance in obesity. Am. J. Physiol. Cell Physiol. 2019, 316, C641–C648. [Google Scholar] [CrossRef] [Scilit]
- Gan, L.; Liu, Z.; Wu, T.; Feng, F.; Sun, C. αMSH promotes preadipocyte proliferation by alleviating ER stress-induced leptin resistance and by activating Notch1 signal in mice. Biochim. Biophys. Acta Mol. Basis Dis. 2017, 1863, 231–238. [Google Scholar] [CrossRef] [Scilit]
- Ibars, M.; Ardid-Ruiz, A.; Suárez, M.; Muguerza, B.; Bladé, C.; Aragonès, G. Proanthocyanidins potentiate hypothalamic leptin/STAT3 signalling and Pomc gene expression in rats with diet-induced obesity. Int. J. Obes. 2017, 41, 129–136. [Google Scholar] [CrossRef] [Scilit]
- Hosoi, T.; Suyama, Y.; Kayano, T.; Ozawa, K. Flurbiprofen ameliorates glucose deprivation-induced leptin resistance. Front. Pharmacol. 2016, 7, 354. [Google Scholar] [CrossRef] [Scilit]
- Sai, K.; Morioka, S.; Takaesu, G.; Muthusamy, N.; Ghashghaei, H.T.; Hanafusa, H.; Matsumoto, K.; Ninomiya-Tsuji, J. TAK1 determines susceptibility to endoplasmic reticulum stress and leptin resistance in the hypothalamus. J. Cell Sci. 2016, 129, 1855–1865. [Google Scholar] [CrossRef] [Scilit]
- Thon, M.; Hosoi, T.; Ozawa, K. Dehydroascorbic acid-induced endoplasmic reticulum stress and leptin resistance in neuronal cells. Biochem. Biophys. Res. Commun. 2016, 478, 716–720. [Google Scholar] [CrossRef] [Scilit]
- Camargo, R.L.; Batista, T.M.; Ribeiro, R.A.; Branco, R.C.S.; Da Silva, P.M.R.; Izumi, C.; Araujo, T.R.; Greene, L.J.; Boschero, A.C.; Carneiro, E.M. Taurine supplementation preserves hypothalamic leptin action in normal and protein-restricted mice fed on a high-fat diet. Amino Acids 2015, 47, 2419–2435. [Google Scholar] [CrossRef] [Scilit]
- Hakim, F.; Wang, Y.; Carreras, A.; Hirotsu, C.; Zhang, J.; Peris, E.; Gozal, D. Chronic sleep fragmentation during the sleep period induces hypothalamic endoplasmic reticulum stress and PTP1b-mediated leptin resistance in male mice. Sleep 2015, 38, 31–40. [Google Scholar] [CrossRef] [Scilit]
- Schneeberger, M.; Dietrich, M.O.; Sebastián, D.; Imbernón, M.; Castaño, C.; Garcia, A.; Esteban, Y.; Gonzalez-Franquesa, A.; Castrillón Rodríguez, I.; Bortolozzi, A.; et al. Mitofusin 2 in POMC neurons connects ER stress with leptin resistance and energy imbalance. Cell 2013, 155, 172–187. [Google Scholar] [CrossRef] [Scilit]
- Saxton, R.A.; Caveney, N.A.; Moya-Garzon, M.D.; Householder, K.D.; Rodriguez, G.E.; Burdsall, K.A.; Long, J.Z.; Garcia, K.C. Structural insights into the mechanism of leptin receptor activation. Nat. Commun. 2023, 14, 1797. [Google Scholar] [CrossRef] [Scilit]
- Xu, L.; Li, H.; Zhou, G.; Lu, W.; Yang, R.; Liu, H.; Yang, G. DNA-binding activity of STAT3 increased in hypothalamus of DIO mice; the reduction of STAT3 phosphorylation may facilitate leptin signaling. Biochem. Biophys. Res. Commun. 2018, 505, 229–235. [Google Scholar] [CrossRef] [Scilit]
- Alliouachene, S.; Bilanges, B.; Chaussade, C.; Pearce, W.; Foukas, L.C.; Scudamore, C.L.; Moniz, L.S.; Vanhaesebroeck, B. Inactivation of class II PI3K-C2α induces leptin resistance, age-dependent insulin resistance and obesity in male mice. Diabetologia 2016, 59, 1503–1512. [Google Scholar] [CrossRef] [Scilit]
- Rivera, P.; Ramírez-López, M.T.; Vargas, A.; Decara, J.; Vázquez, M.; Arco, R.; Gómez de Heras, R.; Argente, J.; Rodríguez de Fonseca, F.; Chowen, J.A.; et al. Perinatal free-choice of a high-calorie low-protein diet affects leptin signaling through IRS1 and AMPK dephosphorylation in the hypothalami of female rat offspring in adulthood. Acta Physiol. 2019, 226, e13244. [Google Scholar] [CrossRef] [Scilit]
- Rubio, B.; Mora, C.; Pintado, C.; Mazuecos, L.; Fernández, A.; López, V.; Andrés, A.; Gallardo, N. The nutrient sensing pathways FoxO1/3 and mTOR in the heart are coordinately regulated by central leptin through PPARβ/δ: Implications in cardiac remodeling. Metabolism 2021, 115, 154453. [Google Scholar] [CrossRef] [Scilit]
- Gogiraju, R.; Hubert, A.; Fahrer, J.; Straub, B.K.; Brandt, M.; Wenzel, P.; Münzel, T.; Konstantinides, S.; Hasenfuss, G.; Schäfer, K. Endothelial leptin receptor deletion promotes cardiac autophagy and angiogenesis following pressure overload by suppressing Akt/mTOR signaling. Circ. Heart Fail. 2019, 12, e005622. [Google Scholar] [CrossRef] [Scilit]
- An, X.; Liu, J.; Li, Y.; Dou, Z.; Li, N.; Suo, Y.; Ma, Y.; Sun, M.; Tian, Z.; Xu, L. Chemerin/CMKLR1 ameliorates nonalcoholic steatohepatitis by promoting autophagy and alleviating oxidative stress through the JAK2-STAT3 pathway. Peptides 2021, 135, 170422. [Google Scholar] [CrossRef] [Scilit]
- Liu, X.; Zheng, H. Modulation of Sirt1 and FoxO1 on hypothalamic leptin-mediated sympathetic activation and inflammation in diet-induced obese rats. J. Am. Heart Assoc. 2021, 10, e020667. [Google Scholar] [CrossRef] [Scilit]
- Balland, E.; Dam, J.; Langlet, F.; Caron, E.; Steculorum, S.; Messina, A.; Rasika, S.; Falluel-Morel, A.; Anouar, Y.; Dehouck, B.; et al. Hypothalamic tanycytes are an ERK-gated conduit for leptin into the brain. Cell Metab. 2014, 19, 293–301. [Google Scholar] [CrossRef] [Scilit]
- Bjørbaek, C.; Elmquist, J.K.; Frantz, J.D.; Shoelson, S.E.; Flier, J.S. Identification of SOCS-3 as a potential mediator of central leptin resistance. Mol. Cell 1998, 1, 619–625. [Google Scholar] [CrossRef] [Scilit]
- Kars, M.; Yang, L.; Gregor, M.F.; Mohammed, B.S.; Pietka, T.A.; Finck, B.N.; Patterson, B.W.; Horton, J.D.; Mittendorfer, B.; Hotamisligil, G.S.; et al. Tauroursodeoxycholic acid may improve liver and muscle but not adipose tissue insulin sensitivity in obese men and women. Diabetes 2010, 59, 1899–1905. [Google Scholar] [CrossRef] [Scilit]
- Xiao, C.; Giacca, A.; Lewis, G.F. Sodium phenylbutyrate, a drug with known capacity to reduce endoplasmic reticulum stress, partially alleviates lipid-induced insulin resistance and beta-cell dysfunction in humans. Diabetes 2011, 60, 918–924. [Google Scholar] [CrossRef] [Scilit]
- Zhu, F.; Zhang, D.; Shen, F.; Xu, K.; Huang, X.; Liu, J.; Zhang, J.; Teng, Y. Maternal Socs3 knockdown attenuates postnatal obesity caused by an early life environment of maternal obesity and intrauterine overnutrition in progeny mice. IUBMB Life 2021, 73, 1210–1221. [Google Scholar] [CrossRef] [Scilit]
- Kim, J.H.; Lee, S.S.; Lee, S.H.; Bang, K.H.; Yu, J.; Kim, Y.G.; Kim, S.Y.; Lee, I.S.; Yoo, Y.C. Cannabisin A and B from hemp seed hulls improve glucose homeostasis by re-engaging insulin, leptin, and AMPK pathways via selective PTP1B inhibition. Phytomedicine 2026, 154, 158054. [Google Scholar] [CrossRef] [Scilit]
- Kaneko, K.; Takekuma, Y.; Goto, T.; Ohinata, K. An orally active plant Rubisco-derived peptide increases neuronal leptin responsiveness. Sci. Rep. 2022, 12, 8599. [Google Scholar] [CrossRef] [Scilit]
- Anachad, O.; Taouil, A.; Taha, W.; Bennis, F.; Chegdani, F. The implication of short-chain fatty acids in obesity and diabetes. Microbiol. Insights 2023, 16, 11786361231162720. [Google Scholar] [CrossRef] [Scilit]
- Rosario, F.J.; Powell, T.L.; Jansson, T. Activation of placental insulin and mTOR signaling in a mouse model of maternal obesity associated with fetal overgrowth. Am. J. Physiol. Regul. Integr. Comp. Physiol. 2016, 310, R87–R93. [Google Scholar] [CrossRef] [Scilit]
- Walewska, E.; Makowczenko, K.G.; Witek, K.; Laniecka, E.; Molcan, T.; Alvarez-Sanchez, A.; Kelsey, G.; Perez-Garcia, V.; Galvão, A.M. Fetal growth restriction and placental defects in obese mice are associated with impaired decidualisation: The role of increased leptin signalling modulators SOCS3 and PTPN2. Cell. Mol. Life Sci. 2024, 81, 329. [Google Scholar] [CrossRef] [Scilit]
- Kabra, D.G.; Pfuhlmann, K.; Garcia-Caceres, C.; Schriever, S.C.; Casquero Garcia, V.; Kebede, A.F.; Fuente-Martin, E.; Trivedi, C.; Heppner, K.; Uhlenhaut, N.H.; et al. Hypothalamic leptin action is mediated by histone deacetylase 5. Nat. Commun. 2016, 7, 10782. [Google Scholar] [CrossRef] [Scilit]
- Chen, Y.; Wu, R.; Chen, H.Z.; Xiao, Q.; Wang, W.J.; He, J.P.; Li, X.X.; Yu, X.W.; Li, L.; Wang, P.; et al. Enhancement of hypothalamic STAT3 acetylation by nuclear receptor Nur77 dictates leptin sensitivity. Diabetes 2015, 64, 2069–2081. [Google Scholar] [CrossRef] [Scilit]
- Huang, R.C.; Melton, P.E.; Burton, M.A.; Beilin, L.J.; Clarke-Harris, R.; Cook, E.; Godfrey, K.M.; Burdge, G.C.; Mori, T.A.; Anderson, D.; et al. Adiposity associated DNA methylation signatures in adolescents are related to leptin and perinatal factors. Epigenetics 2022, 17, 819–836. [Google Scholar] [CrossRef] [Scilit]
- Altinkilic, E.M.; Bayrakdar, S.; Seymen Karabulut, G.; Haliloglu, B.; Attar, R. The role of circulating miRNAs in leptin resistance in obese children. J. Pediatr. Endocrinol. Metab. 2022, 35, 761–766. [Google Scholar] [CrossRef] [Scilit]
- Almeida, M.M.; Dias-Rocha, C.P.; Reis-Gomes, C.F.; Wang, H.; Atella, G.C.; Cordeiro, A.; Pazos-Moura, C.C.; Joss-Moore, L.; Trevenzoli, I.H. Maternal high-fat diet impairs leptin signaling and up-regulates type-1 cannabinoid receptor with sex-specific epigenetic changes in the hypothalamus of newborn rats. Psychoneuroendocrinology 2019, 103, 306–315. [Google Scholar] [CrossRef] [Scilit]
- Zelissen, P.M.J.; Stenlof, K.; Lean, M.E.J.; Fogteloo, J.; Keulen, E.T.P.; Wilding, J.; Finer, N.; Rossner, S.; Lawrence, E.; Fletcher, C.; et al. Effect of three treatment schedules of recombinant methionyl human leptin on body weight in obese adults: A randomized, placebo-controlled trial. Diabetes Obes. Metab. 2005, 7, 755–761. [Google Scholar] [CrossRef] [Scilit]
- Heymsfield, S.B.; Greenberg, A.S.; Fujioka, K.; Dixon, R.M.; Kushner, R.; Hunt, T.; Lubina, J.A.; Patane, J.; Self, B.; Hunt, P.; et al. Recombinant leptin for weight loss in obese and lean adults: A randomized, controlled, dose-escalation trial. JAMA 1999, 282, 1568–1575. [Google Scholar] [CrossRef] [Scilit]
- Hukshorn, C.J.; Saris, W.H.M.; Westerterp-Plantenga, M.S.; Farid, A.R.; Smith, F.J.; Campfield, L.A. Weekly subcutaneous pegylated recombinant native human leptin (PEG-OB) administration in obese men. J. Clin. Endocrinol. Metab. 2000, 85, 4003–4009. [Google Scholar] [CrossRef] [Scilit][Green Version]
- Lejeune, M.P.G.M.; Hukshorn, C.J.; Saris, W.H.M.; Westerterp-Plantenga, M.S. Effect of dietary restraint during and following pegylated recombinant leptin (PEG-OB) treatment of overweight men. Int. J. Obes. 2003, 27, 1494–1499. [Google Scholar] [CrossRef] [Scilit][Green Version]
- Mittendorfer, B.; Horowitz, J.F.; DePaoli, A.M.; McCamish, M.A.; Patterson, B.W.; Klein, S. Recombinant human leptin treatment does not improve insulin action in obese subjects with type 2 diabetes. Diabetes 2011, 60, 1474–1477. [Google Scholar] [CrossRef] [Scilit]
- Moon, H.S.; Matarese, G.; Brennan, A.M.; Chamberland, J.P.; Liu, X.; Fiorenza, C.G.; Mylvaganam, G.H.; Abanni, L.; Carbone, F.; Williams, C.J.; et al. Efficacy of metreleptin in obese patients with type 2 diabetes: Cellular and molecular pathways underlying leptin tolerance. Diabetes 2011, 60, 1647–1656. [Google Scholar] [CrossRef] [Scilit]
- Korner, J.; Conroy, R.; Febres, G.; McMahon, D.J.; Conwell, I.; Karmally, W.; Aronne, L.J. Randomized double-blind placebo-controlled study of leptin administration after gastric bypass. Obesity 2013, 21, 951–956. [Google Scholar] [CrossRef] [Scilit]
- Congur, I.; Mingrone, G.; Guan, K. Targeting endoplasmic reticulum stress as a potential therapeutic strategy for diabetic cardiomyopathy. Metabolism 2025, 162, 156062. [Google Scholar] [CrossRef] [Scilit]
- Pena-Leon, V.; Perez-Lois, R.; Villalon, M.; Prida, E.; Munoz-Moreno, D.; Ferno, J.; Quinones, M.; Al-Massadi, O.; Seoane, L.M. Novel mechanisms involved in leptin sensitization in obesity. Biochem. Pharmacol. 2024, 223, 116129. [Google Scholar] [CrossRef] [Scilit]
- Bence, K.K.; Delibegovic, M.; Xue, B.; Gorgun, C.Z.; Hotamisligil, G.S.; Neel, B.G.; Kahn, B.B. Neuronal PTP1B regulates body weight, adiposity and leptin action. Nat. Med. 2006, 12, 917–924. [Google Scholar] [CrossRef] [Scilit]
- Lantz, K.A.; Hart, S.G.E.; Planey, S.L.; Roitman, M.F.; Ruiz-White, I.A.; Wolfe, H.R.; McLane, M.P. Inhibition of PTP1B by trodusquemine (MSI-1436) causes fat-specific weight loss in diet-induced obese mice. Obesity 2010, 18, 1516–1523. [Google Scholar] [CrossRef] [Scilit]
- Iepsen, E.W.; Lundgren, J.; Dirksen, C.; Jensen, J.E.B.; Pedersen, O.; Hansen, T.; Madsbad, S.; Holst, J.J.; Torekov, S.S. Treatment with a GLP-1 receptor agonist diminishes the decrease in free plasma leptin during maintenance of weight loss. Int. J. Obes. 2015, 39, 834–841. [Google Scholar] [CrossRef] [Scilit]
- de Toro-Martín, J.; Arsenault, B.J.; Despres, J.P.; Vohl, M.C. Precision nutrition: A review of personalized nutritional approaches for the prevention and management of metabolic syndrome. Nutrients 2017, 9, 913. [Google Scholar] [CrossRef] [Scilit]
- Zeevi, D.; Korem, T.; Zmora, N.; Israeli, D.; Rothschild, D.; Weinberger, A.; Ben-Yacov, O.; Lador, D.; Avnit-Sagi, T.; Lotan-Pompan, M.; et al. Personalized nutrition by prediction of glycemic responses. Cell 2015, 163, 1079–1094. [Google Scholar] [CrossRef] [Scilit]
- Marcos-Pasero, H.; Aguilar-Aguilar, E.; Colmenarejo, G.; Ramirez de Molina, A.; Reglero, G.; Loria-Kohen, V. The Q223R polymorphism of the leptin receptor gene as a predictor of weight gain in childhood obesity and the identification of possible factors involved. Genes 2020, 11, 560. [Google Scholar] [CrossRef] [Scilit]
- Wang, L.; Liu, Y.; Stratigopoulos, G.; Panigrahi, S.; Sui, L.; Zhang, Y.; Leduc, C.A.; Glover, H.J.; De Rosa, M.C.; Burnett, L.C.; et al. Bardet-Biedl syndrome proteins regulate intracellular signaling and neuronal function in patient-specific iPSC-derived neurons. J. Clin. Investig. 2021, 131, e146287. [Google Scholar] [CrossRef] [Scilit]
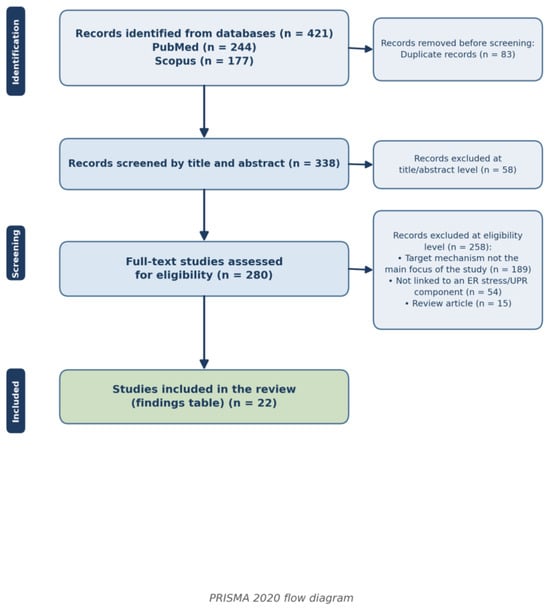
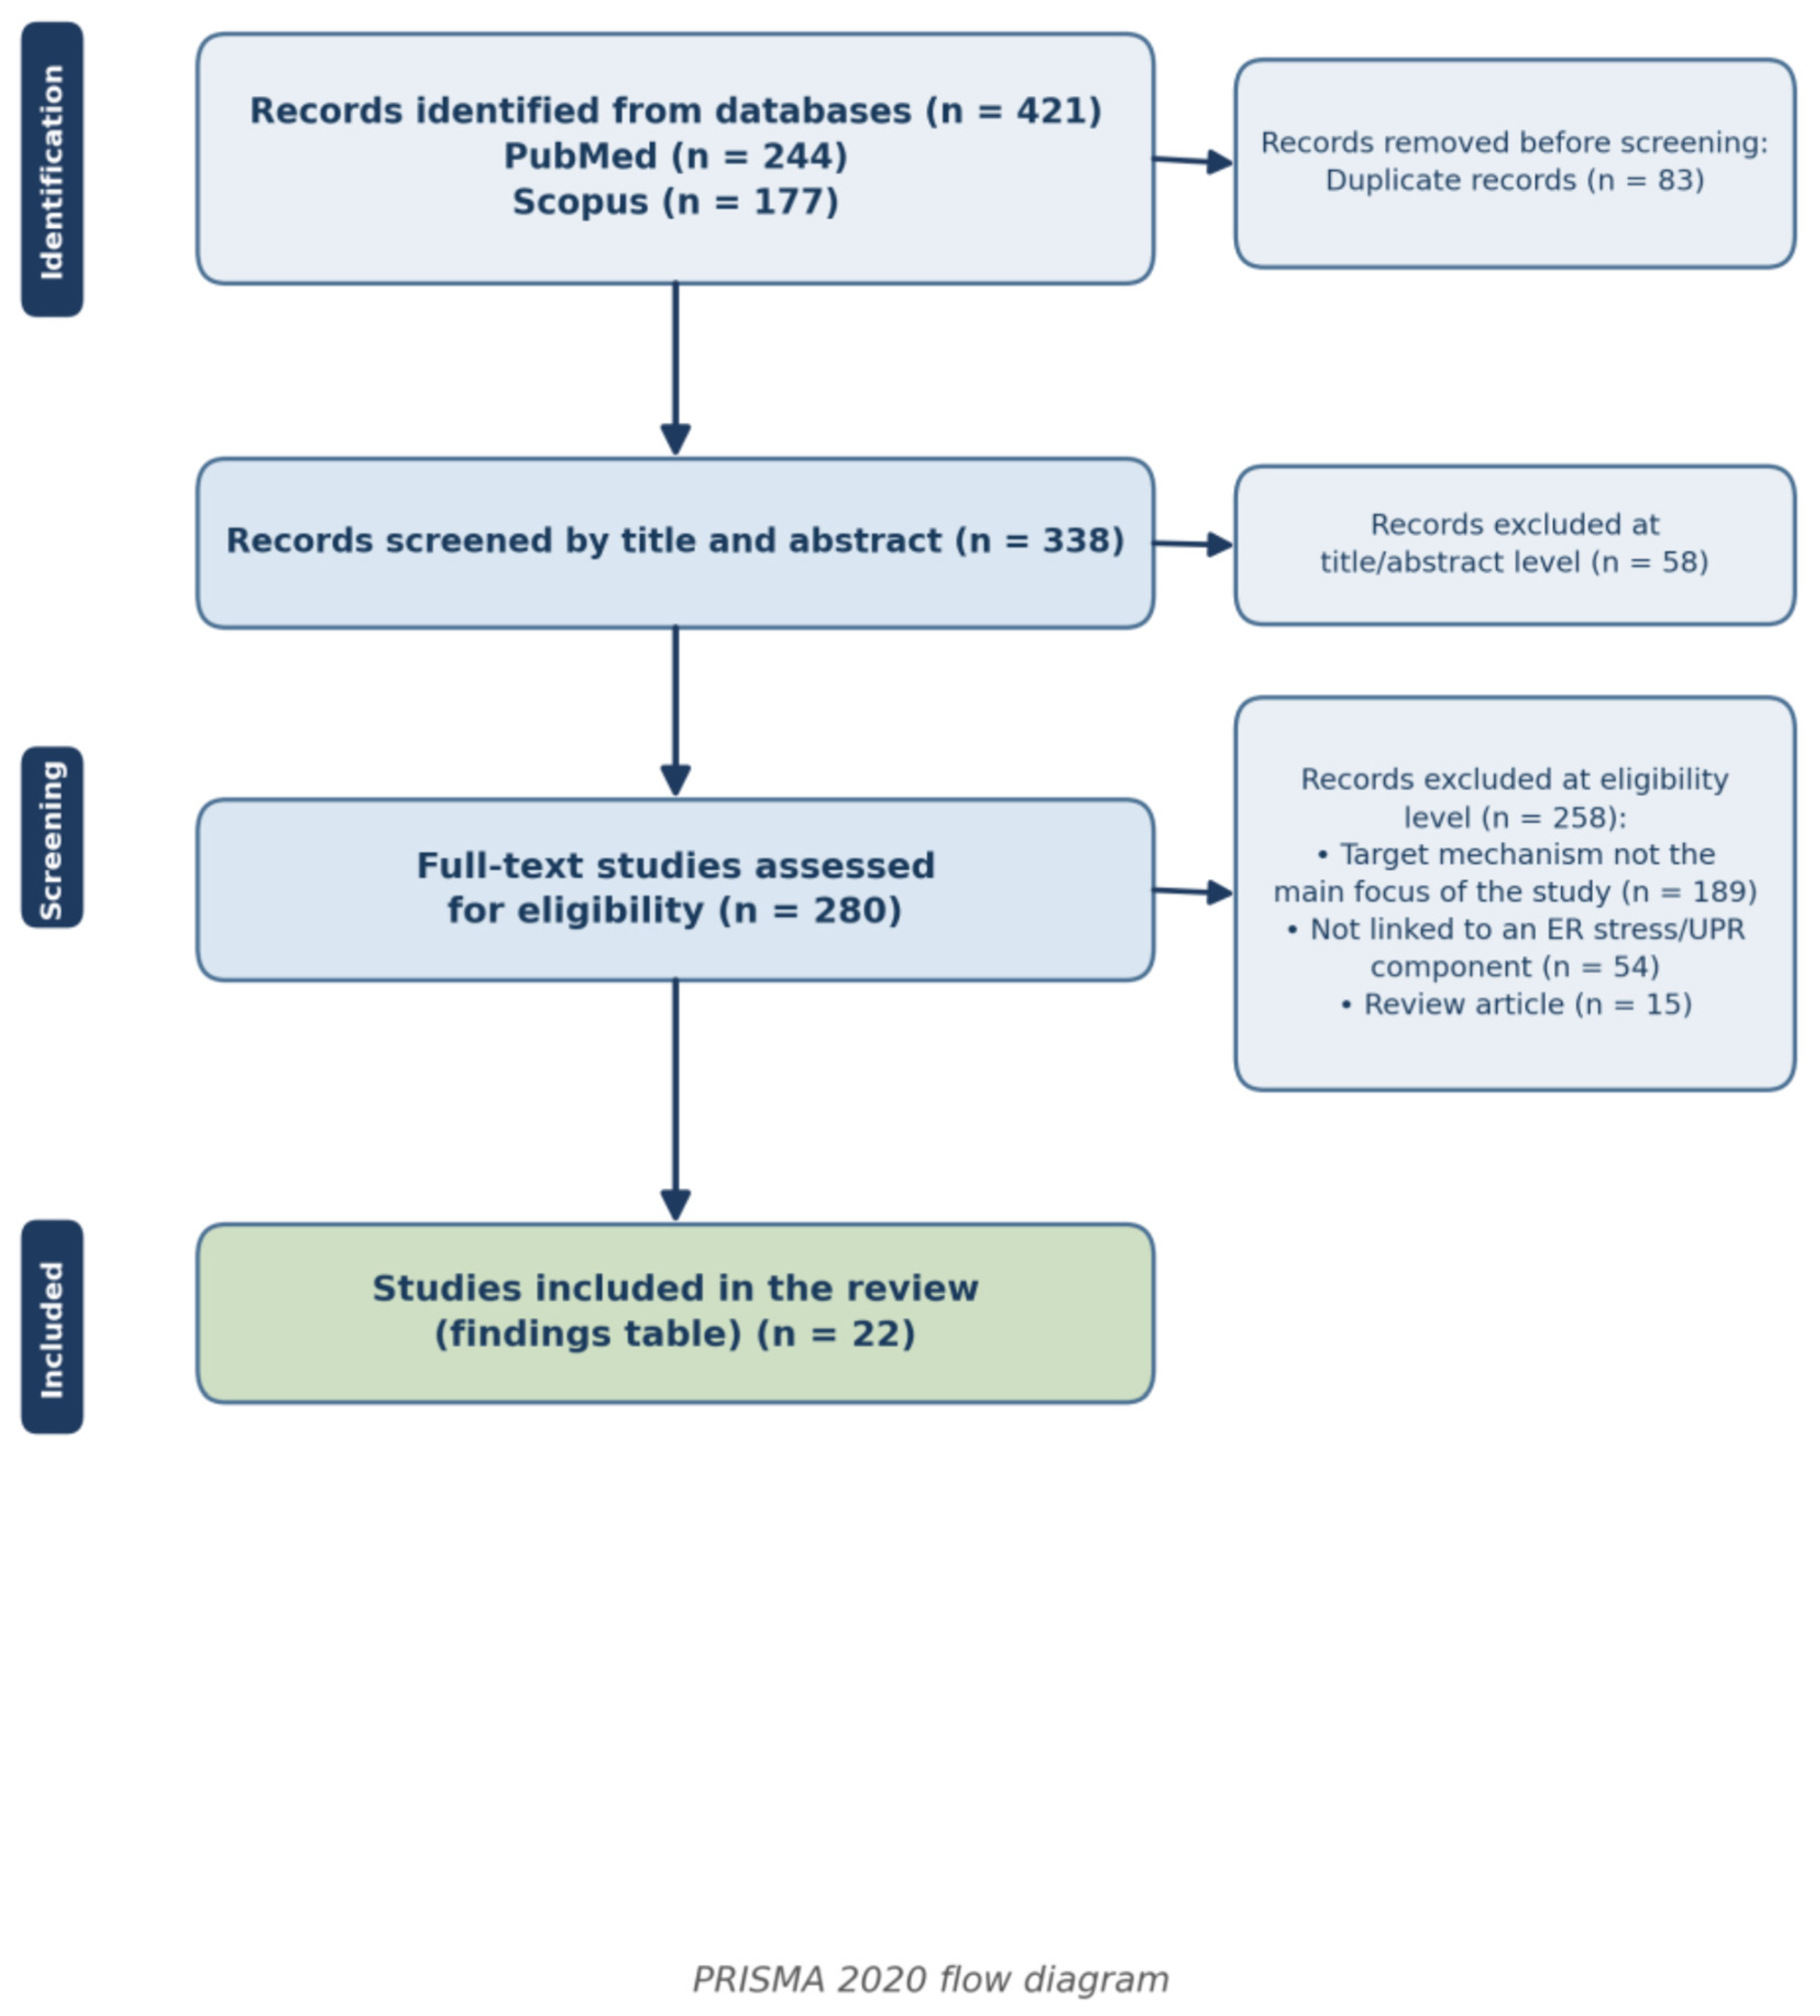
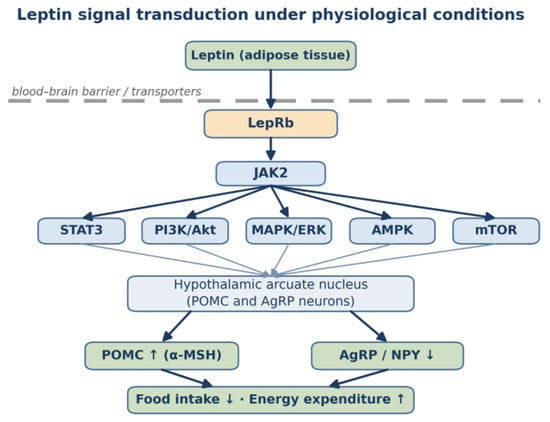
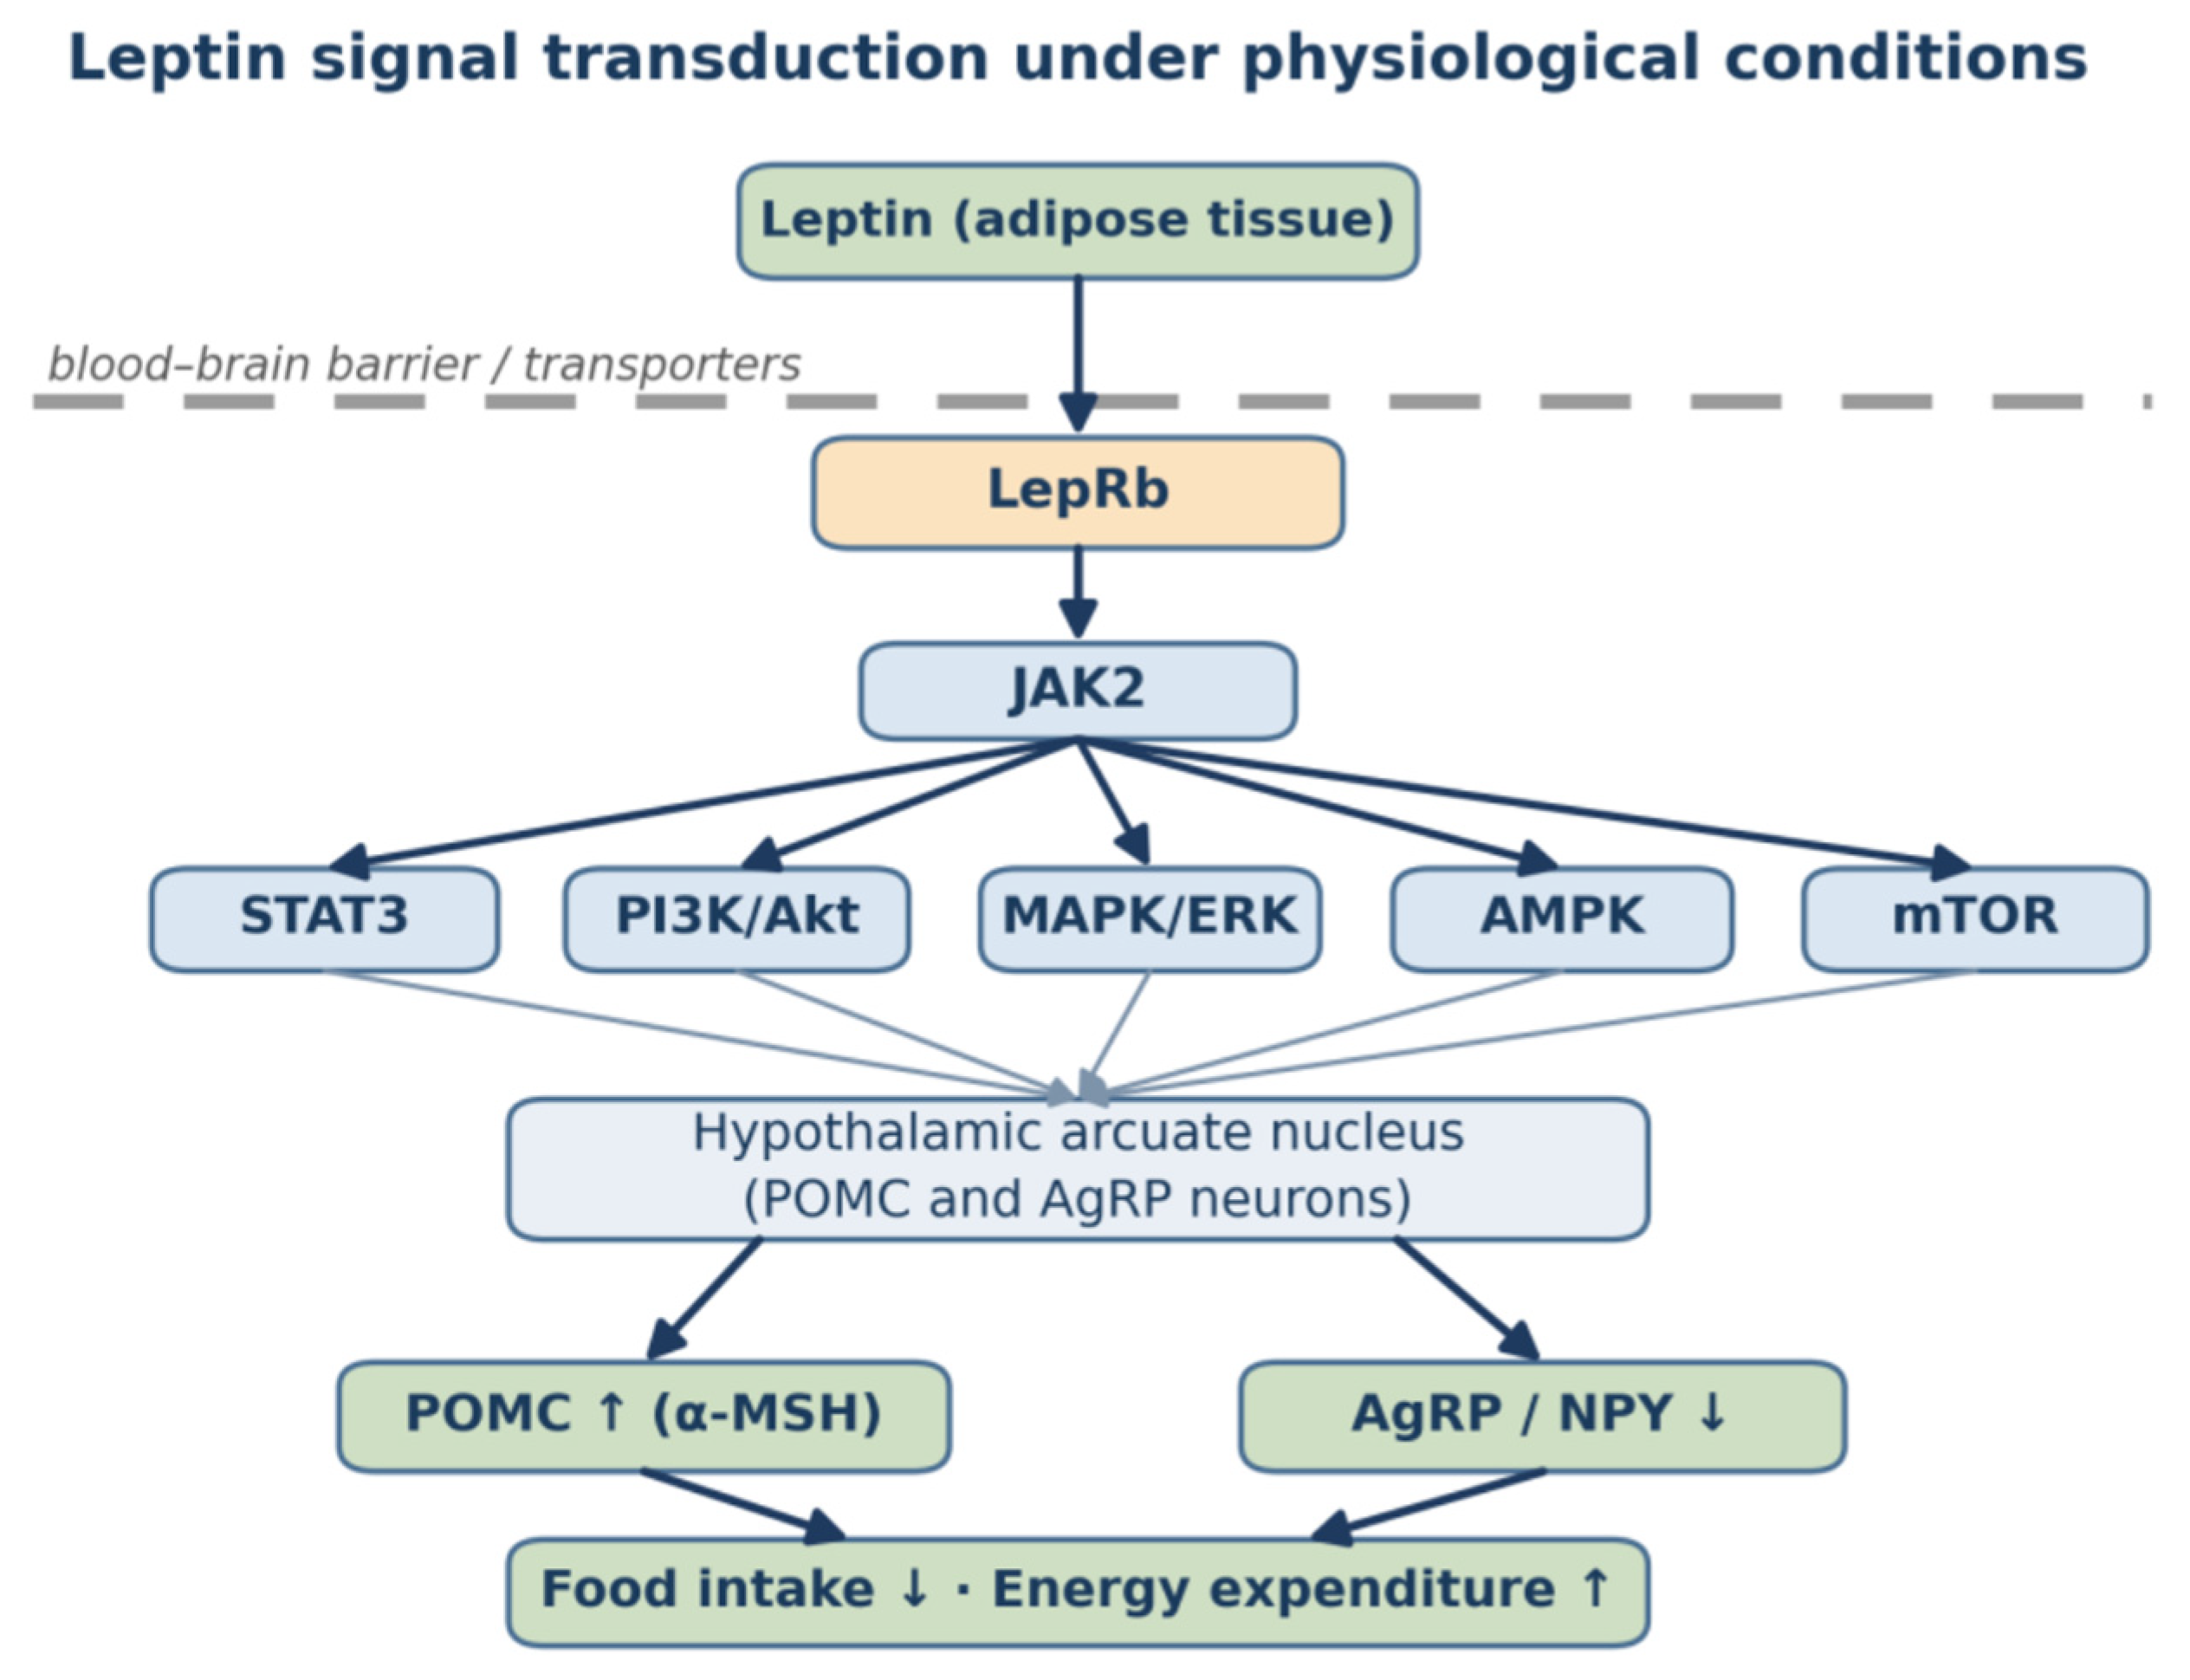
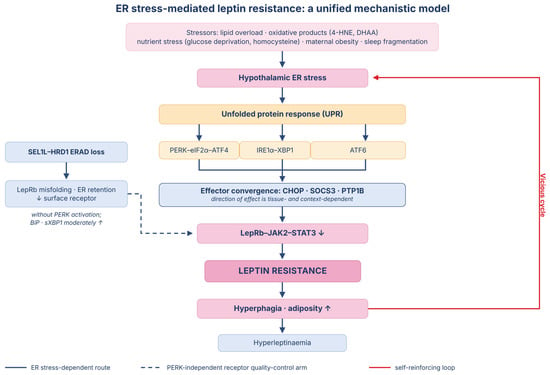
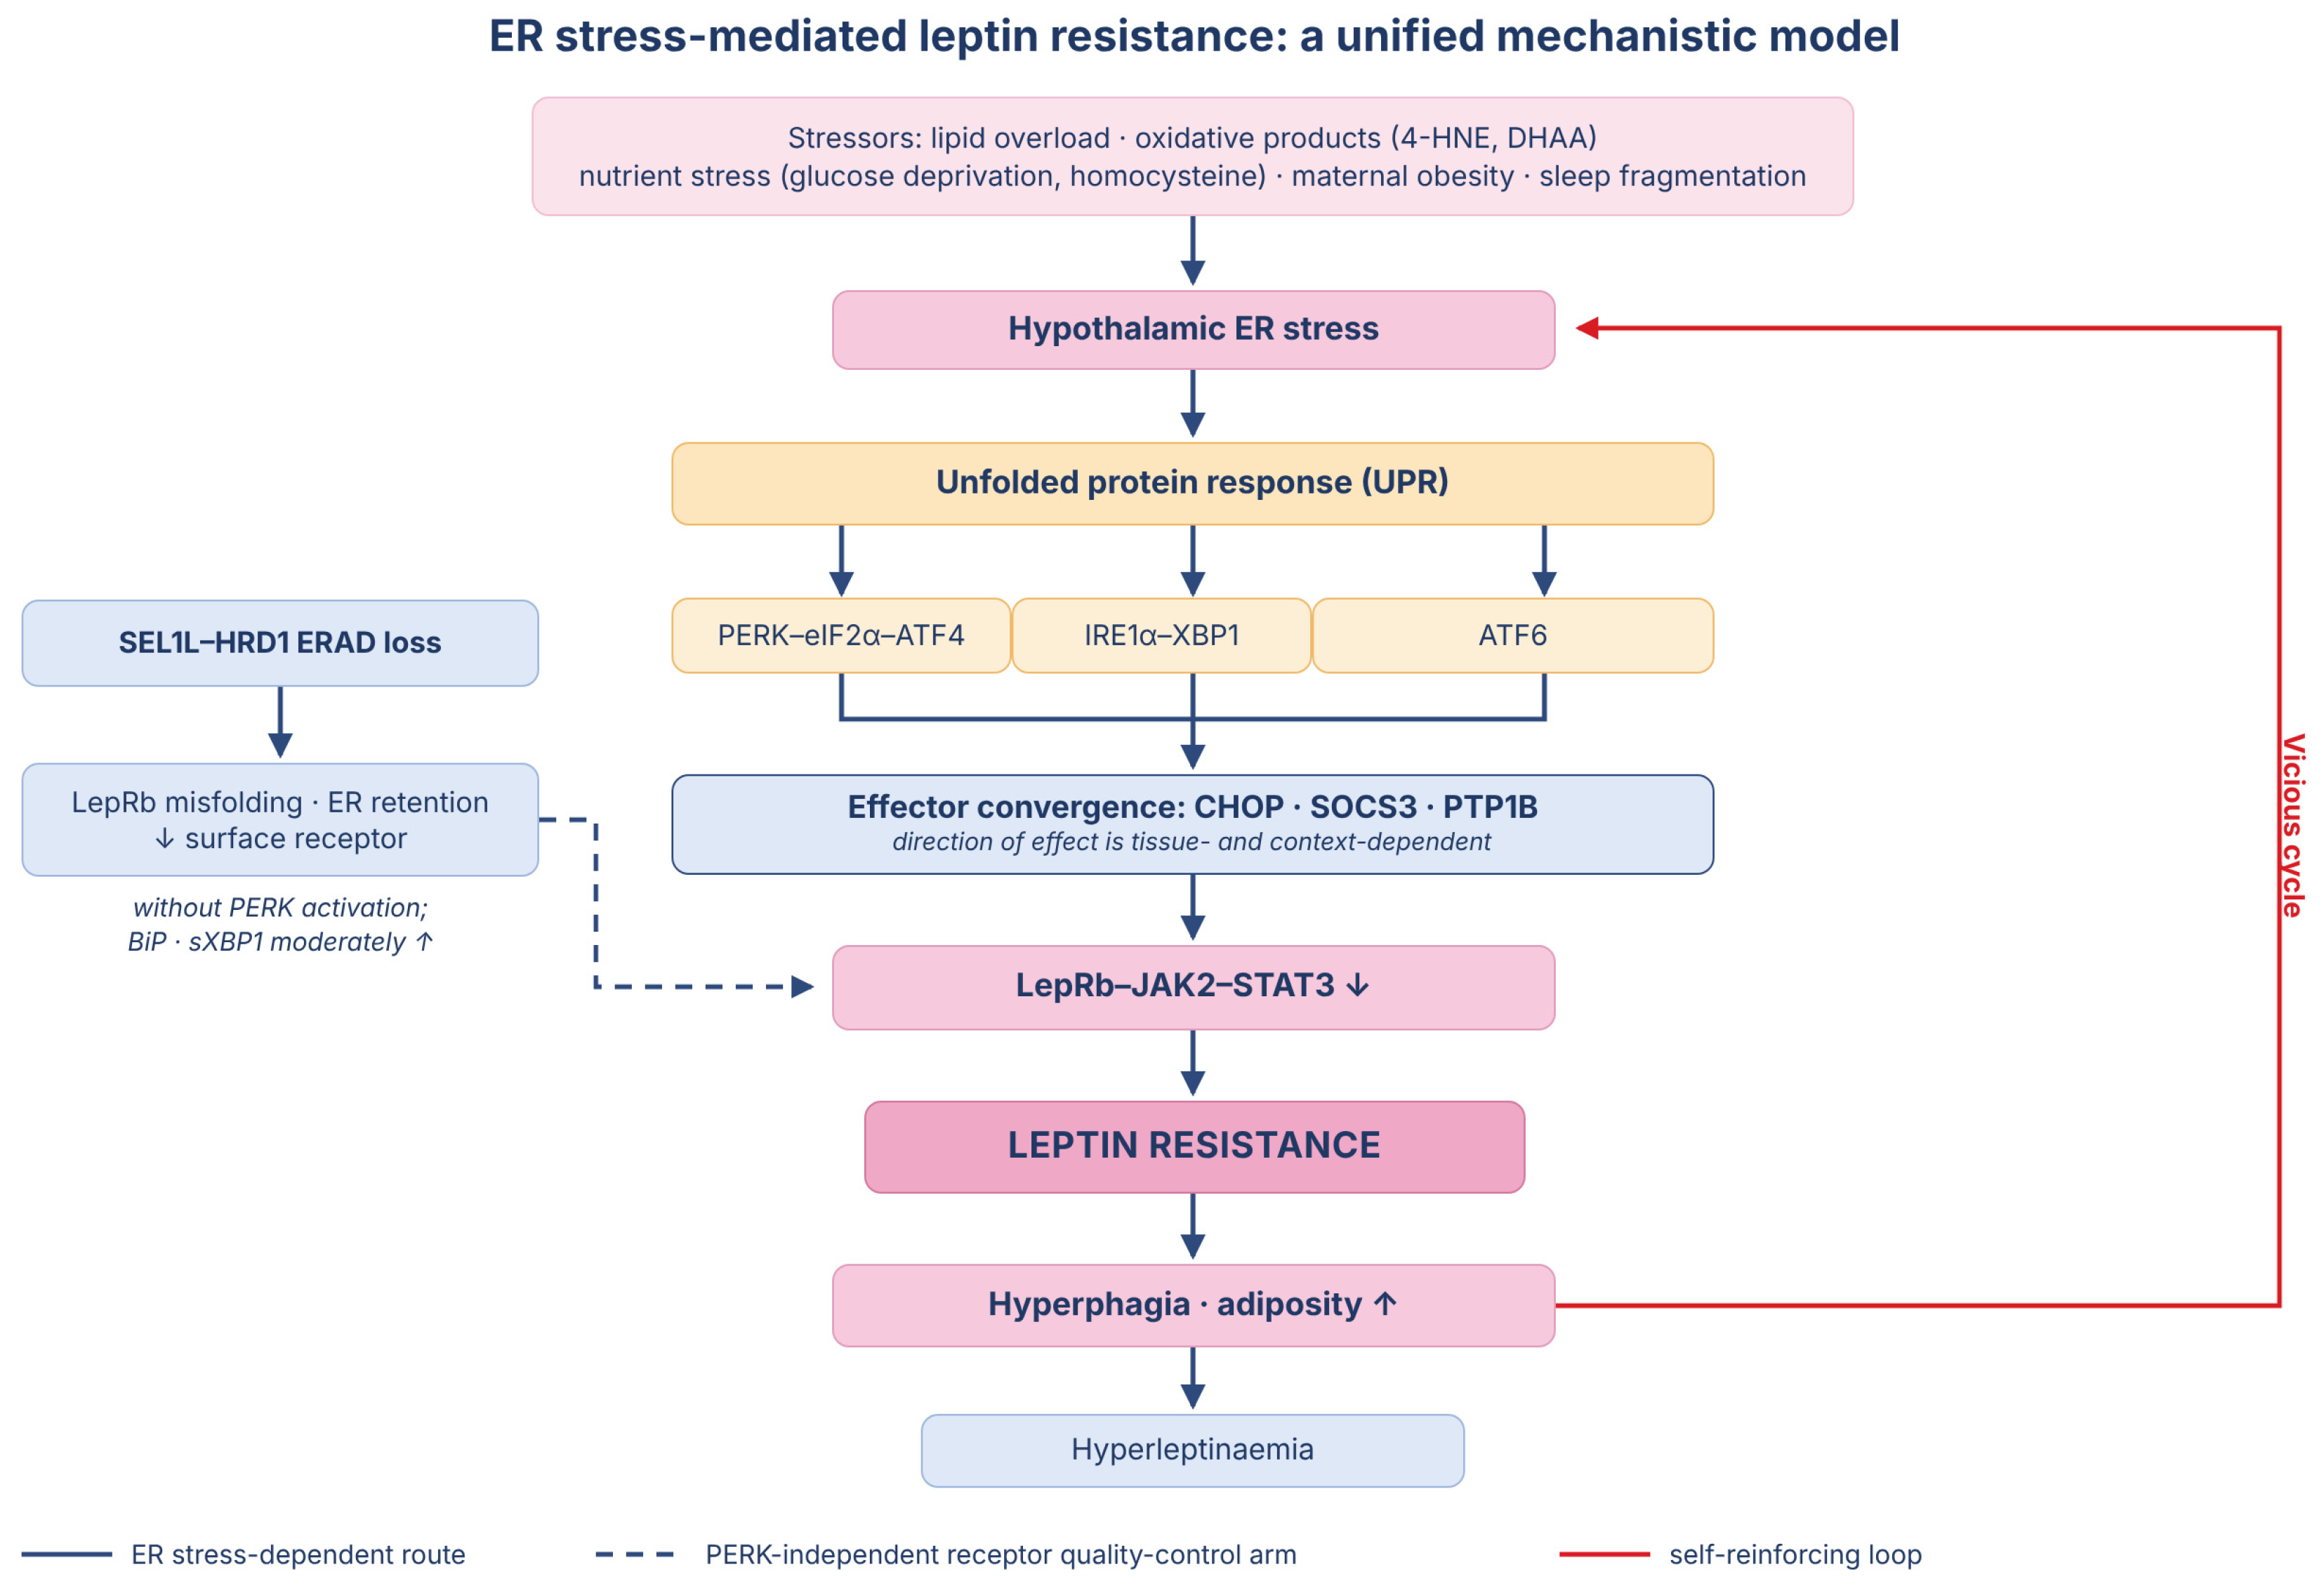
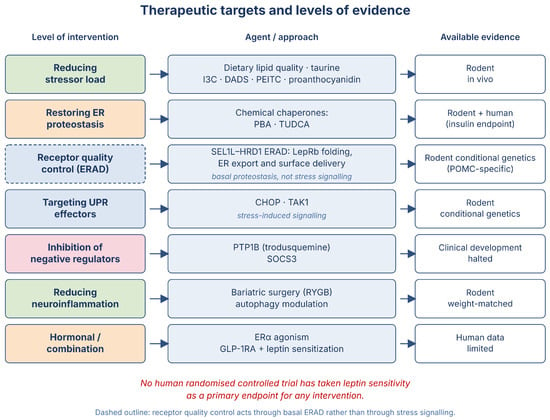
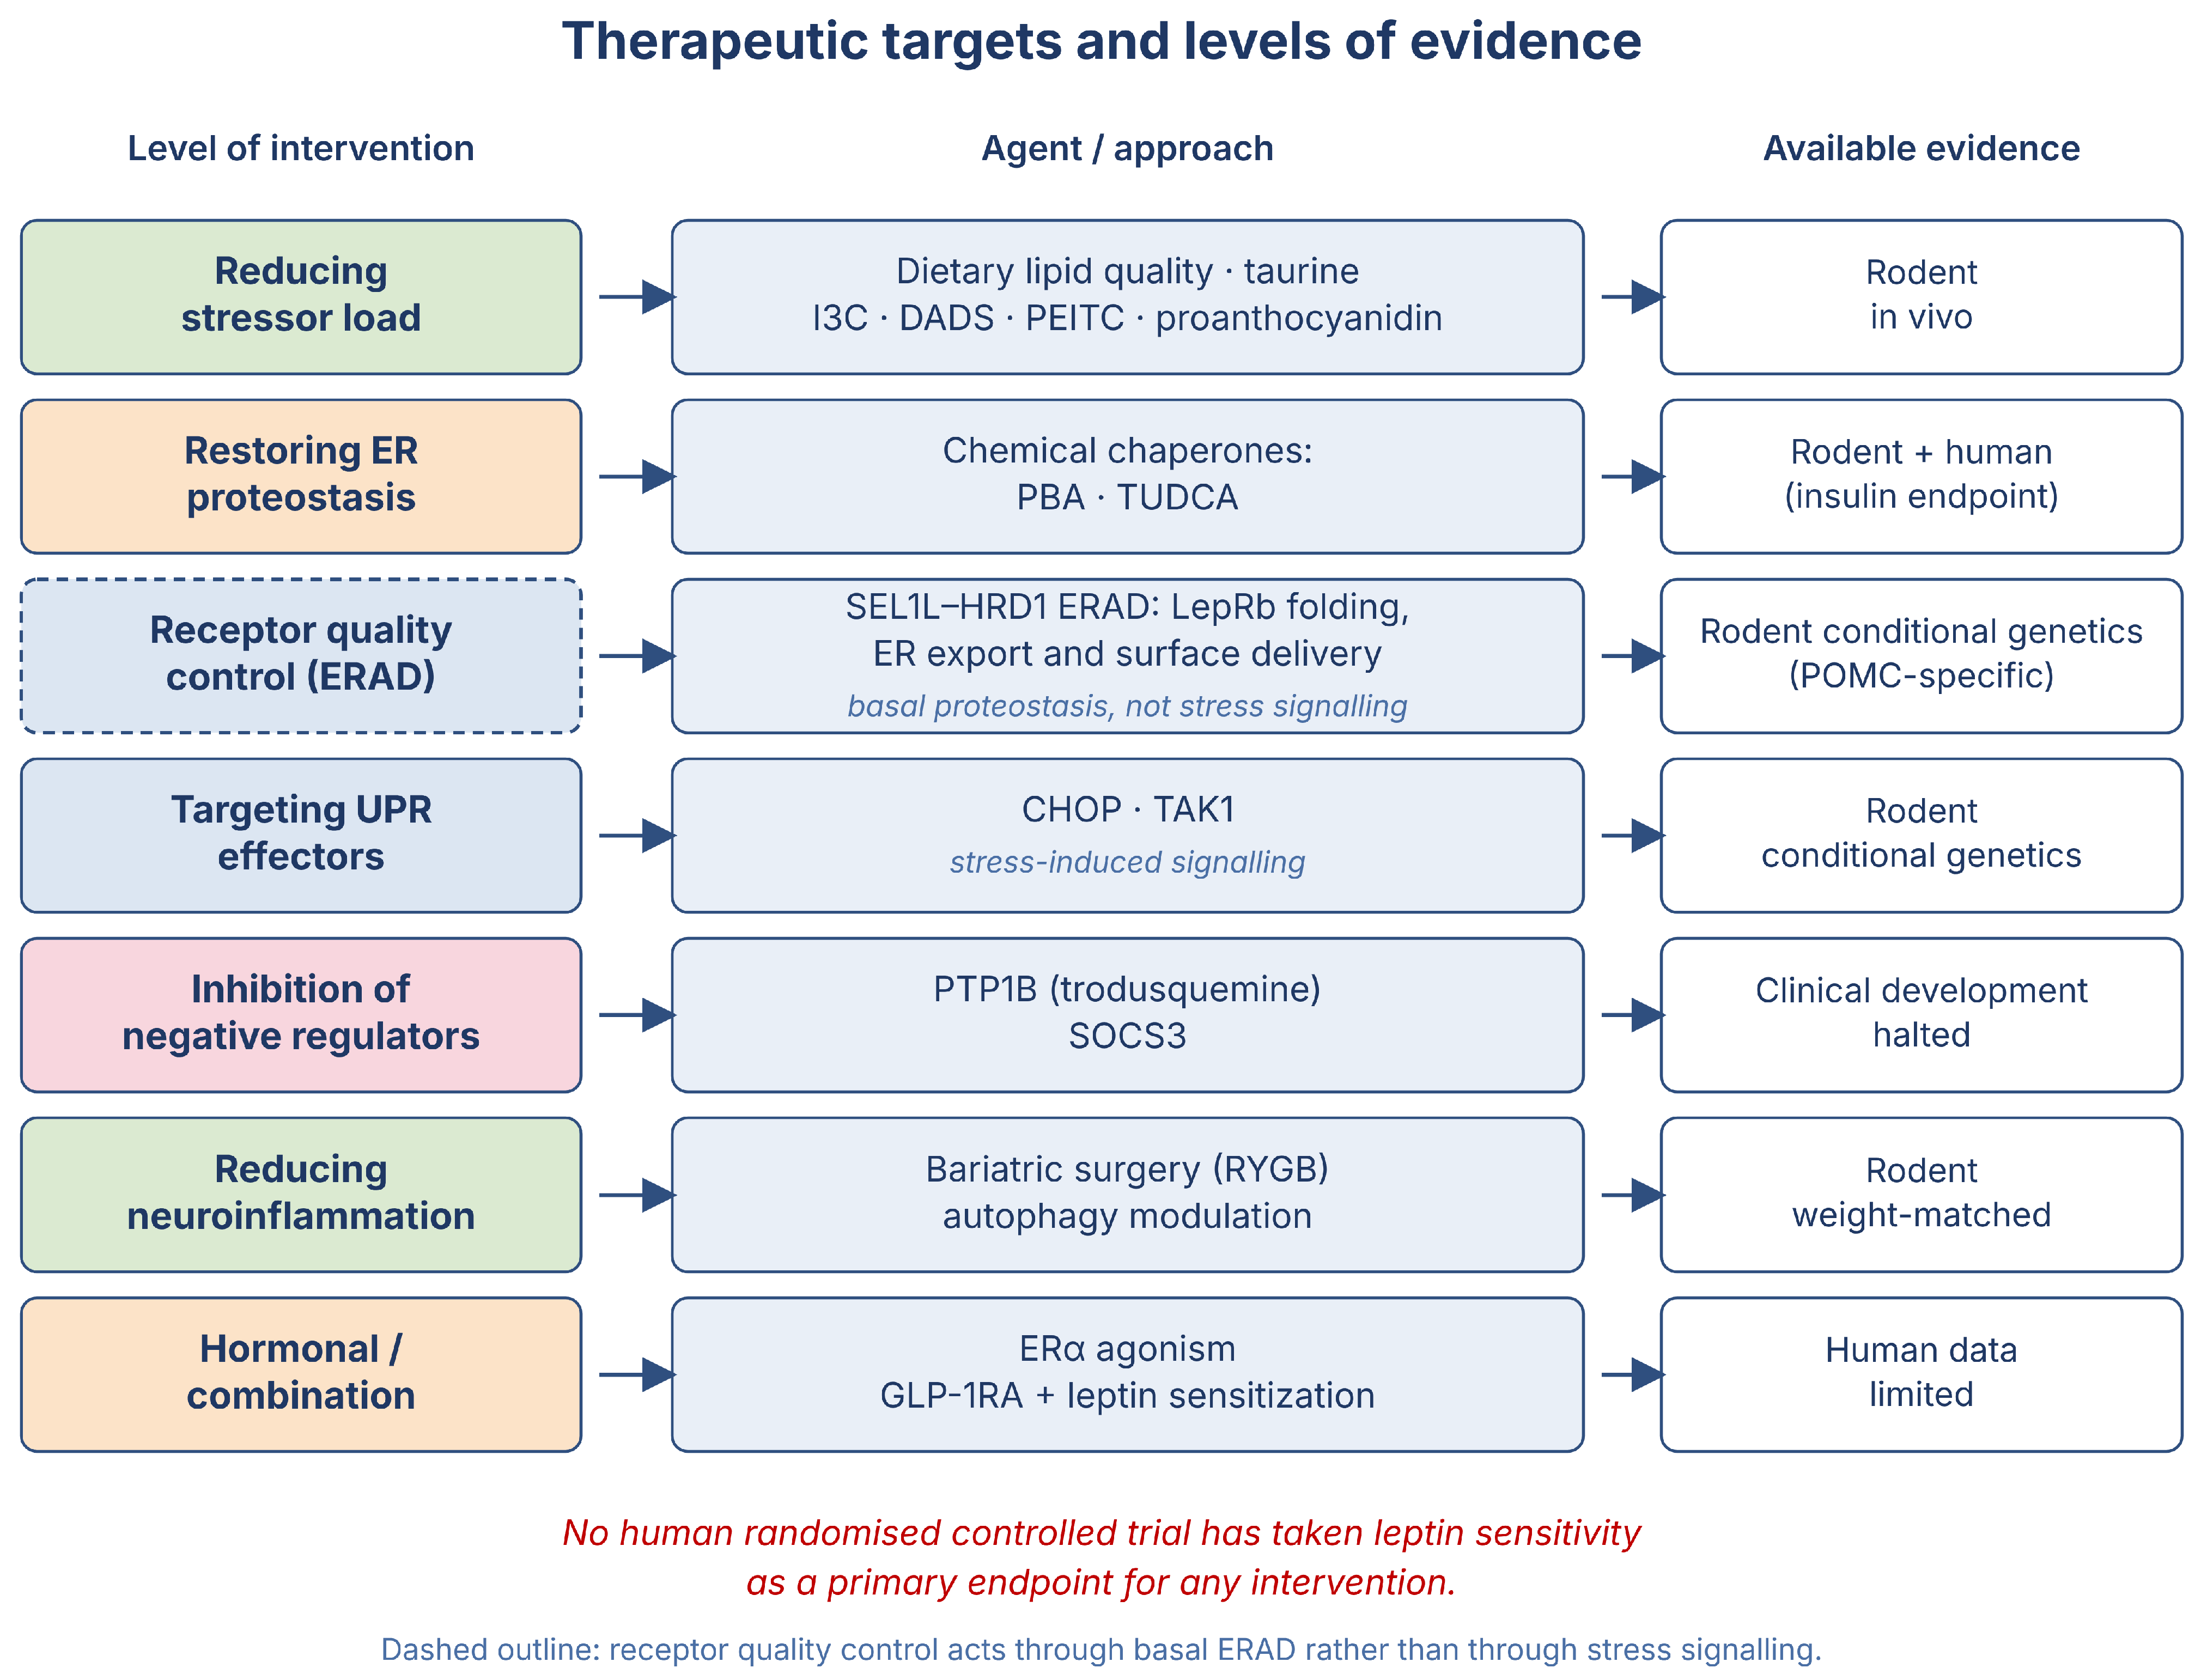

Disclaimer/Publisher’s Note: The statements, opinions and data contained in all publications are solely those of the individual author(s) and contributor(s) and not of MDPI and/or the editor(s). MDPI and/or the editor(s) disclaim responsibility for any injury to people or property resulting from any ideas, methods, instructions or products referred to in the content. |
© 2026 by the authors. Licensee MDPI, Basel, Switzerland. This article is an open access article distributed under the terms and conditions of the Creative Commons Attribution (CC BY) license.