


Abstract
Uneven straw conveying and unstable throwing can reduce the operational performance of rice combine harvesters. To address these problems, an integrated straw conveying and throwing device combining guided conveying with pneumatic throwing was developed. The brachistochrone principle was introduced into the curved-surface design of the diversion plate as a geometry-guided approach to provide a continuous transition between the straw-falling region and the conveying inlet. Based on the motion characteristics of straw in the diversion and throwing regions, a coordinated feeding–acceleration–throwing process was established. The effects of diversion plate angle, blade rotational speed, and blade installation angle on throwing distance and distribution stability were investigated. A computational fluid dynamics model based on the mixture multiphase approach was used to characterize the macroscopic gas–solid flow field and compare airflow organization under different blade installation angles. A Box–Behnken response surface design was subsequently employed to establish regression models for throwing distance and the coefficient of variation in straw distribution, followed by multi-response numerical optimization. The optimal parameter combination consisted of a blade rotational speed of 2500 r/min, a diversion plate angle of 1.25 rad, and a backward blade installation angle of 15°. Under these conditions, the predicted throwing distance and coefficient of variation were 7.89 m and 14.6%, respectively. Validation tests produced throwing distances of 6.94–8.21 m and coefficients of variation of approximately 13%, showing good agreement with the predicted performance. The developed device and optimization results provide a basis for improving the conveying continuity and throwing uniformity of straw-handling systems in combine harvesters.
1. Introduction
Rice straw is an important agricultural by-product with great potential for resource utilization. Its crude protein content in dry matter is approximately 5–7%, making it suitable as an unconventional feed resource [1]. With the rapid development of rice mechanized harvesting, efficient straw handling and utilization have become important research topics in agricultural engineering [2,3]. However, traditional pickup baling methods suffer from straw contamination, long operation chains, and high operational costs [4]. Although synchronous baling during harvesting can reduce intermediate processes, it still faces problems such as high-power consumption, complex structural integration, and mismatched operating efficiency [5,6]. Therefore, achieving synchronous straw conveying and efficient throwing without reducing harvesting efficiency is a key approach for promoting straw resource utilization [7].
The straw conveying and throwing device is a key functional component of a combine harvester, and its performance directly influences straw distribution uniformity, operational efficiency, and the quality of subsequent field operations. Previous studies have primarily focused on structural design and control methods. Impeller-type and scraper-type mechanisms have been developed to achieve directional material conveying and controlled spatial distribution [8]. Automatic control systems have also been introduced to regulate the straw discharge rate and improve distribution uniformity [9]. In addition, high-speed photography and numerical simulation have been used to characterize straw motion during pneumatic conveying [10]. Keppler and Bablena found that cycloidal lamellae reduced particle-displacement non-uniformity by up to approximately 30% compared with straight lamellae, although their applicability to flexible and irregular rice straw remains unverified [11]. Wang et al. established an experimental platform to evaluate straw throwing uniformity. However, the impeller rotational speed was maintained at a constant level under different operating conditions, which reduced the adaptability of the device to variations in material feeding [12]. With the development of computational fluid dynamics (CFD), numerical simulation has become an important tool for investigating gas–solid two-phase flow in agricultural machinery. It enables the analysis of airflow distribution, material transport, and fluid–structure interactions within conveying and throwing devices [13,14,15]. The Mixture model is a simplified Eulerian multiphase approach in which the phases are treated as interpenetrating continua. The macroscopic flow characteristics are obtained by solving the mixture continuity equation, momentum equation, and phase volume-fraction equations, while the relative motion between phases is represented through a slip-velocity formulation [16]. In the Eulerian-Eulerian model, both the gas and solid phases are treated as continuous media, and separate conservation equations are solved for each phase, with interphase momentum exchange introduced through interaction-force terms [17]. By contrast, the Eulerian-Lagrangian discrete phase model treats the gas phase as a continuum and tracks the trajectories of individual particles in a Lagrangian framework [18]. Zhai et al. applied the Mixture model to simulate three-dimensional gas–solid two-phase flow in a vane-type impeller blower for straw conveying. They investigated the effects of blade number, impeller rotational speed, feeding velocity, and inlet solid volume fraction, and validated the predicted material velocity at the discharge pipe using high-speed camera measurements [19]. Shang et al. further demonstrated that an algebraic-slip Mixture model can describe the relative motion and momentum exchange between the gas and dispersed solid phases in dilute gas–solid flows [20]. Fang et al. summarized the application of continuum-based gas–solid flow models to agricultural throwing devices and reported that the predicted conveying characteristics agreed with experimental observations [21]. Collectively, these studies support the use of the Mixture model for device-scale evaluation of macroscopic airflow organization and bulk material conveying performance.
However, conventional diversion structures are generally designed using empirical straight or circular-arc geometries, and the influence of guiding-surface geometry on straw sliding path and residence time has received limited attention. In this study, the brachistochrone principle was introduced into the curved-surface design of the diversion plate to regulate the straw sliding trajectory and transport time, distinguishing the proposed geometry-guided design from conventional diversion structures. To address these gaps, an integrated straw conveying and throwing device was developed. CFD was used to characterize the macroscopic gas–solid flow field under different blade configurations, and a Box–Behnken design was employed to quantify the effects of blade rotational speed, diversion plate angle, and blade installation angle on throwing distance and straw distribution uniformity. Validation experiments were then conducted to evaluate the reliability of the numerical model and the optimized parameter combination.
2. Materials and Methods
2.1. Structure and Working Principle of the Conveying-Throwing Device
2.1.1. Device Structure
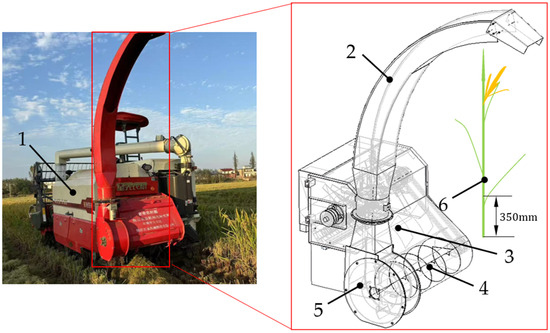
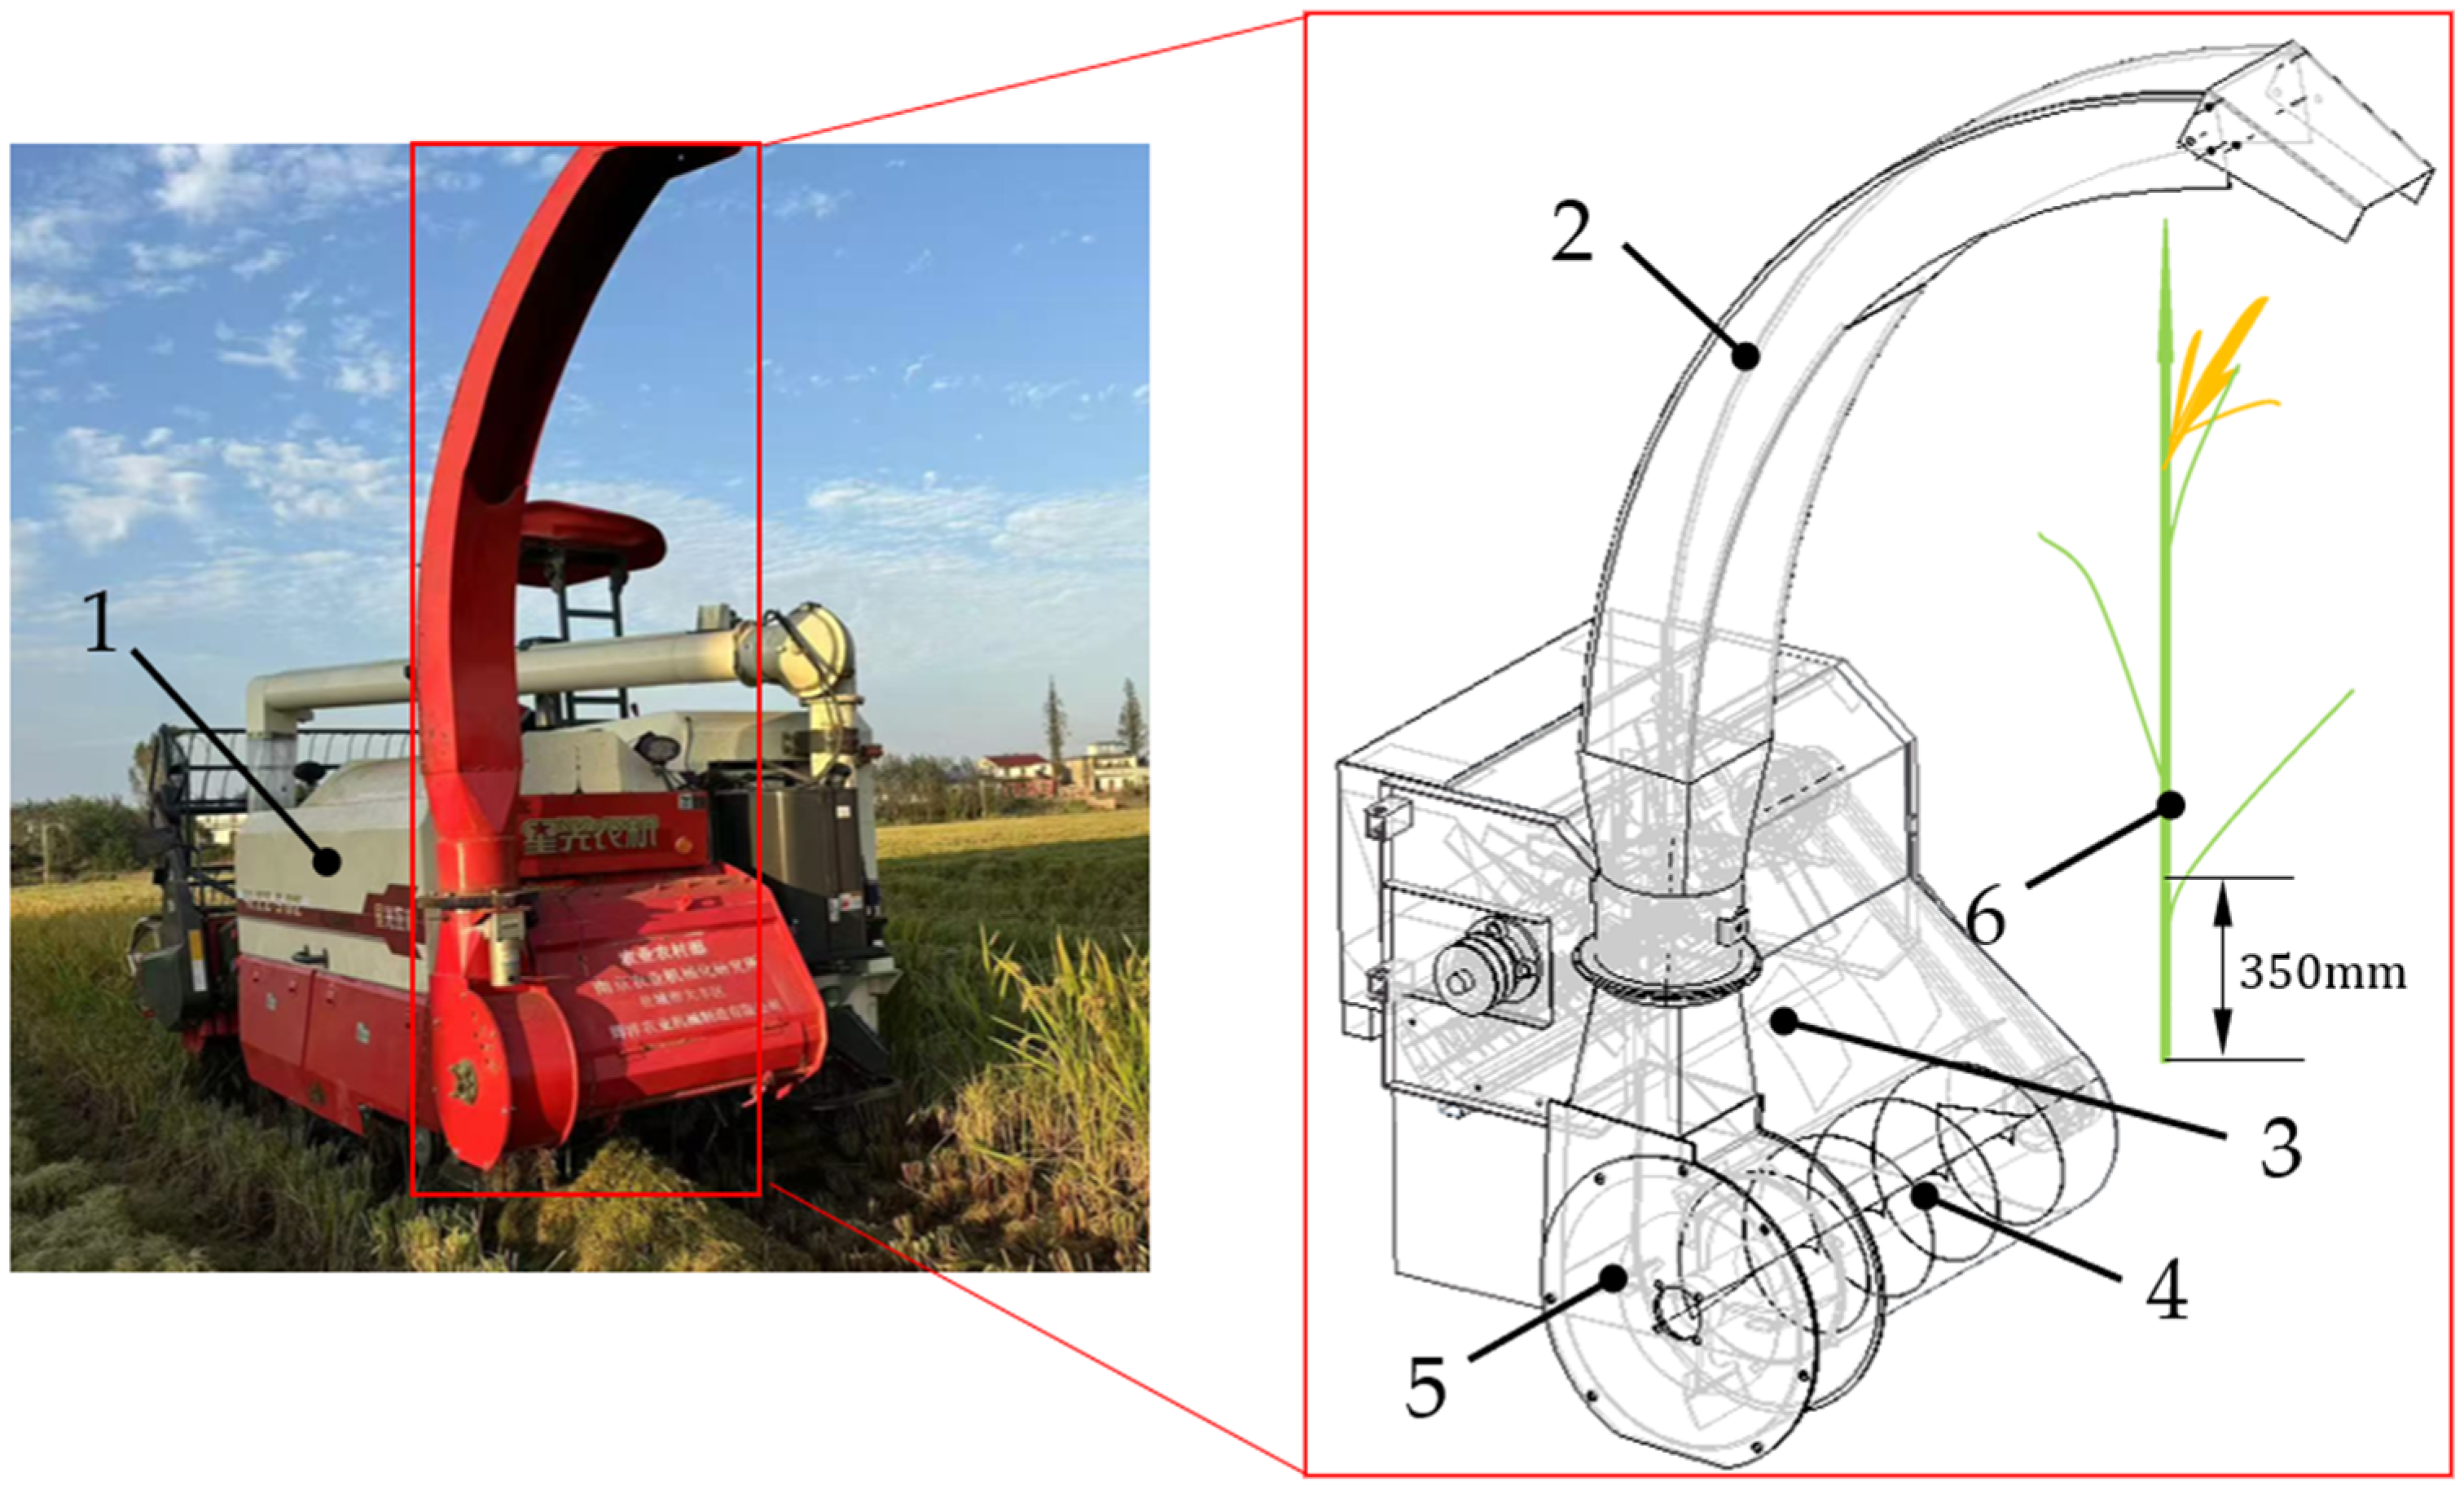
The rice straw conveying and throwing device for a combine harvester (hereinafter referred to as the conveying-throwing device, NRIAM, Nanjing, China) mainly consists of a conveying unit and a throwing unit, as shown in Figure 1. The conveying unit includes a diversion plate, a screw auger, and a housing. It is used for straw guiding, distribution, and axial conveying. The throwing unit is arranged on the side of the device and mainly consists of throwing blades and a throwing cylinder. It is responsible for straw acceleration and directional throwing. In terms of spatial layout, the axis of the screw auger is perpendicular to the forward traveling direction of the harvester. Under the action of the diversion plate, straw is uniformly distributed and conveyed axially to the end of the auger. The throwing blades are coaxially arranged behind the auger, allowing the material to continuously and stably enter the throwing region. This configuration enables efficient straw conveying and uniform throwing. All functional components are connected through the housing, forming a continuous and smooth material flow channel. The main technical parameters of the conveying-throwing device are listed in Table 1.
Figure 1.
Overall structure of the conveying and throwing device. 1—Combine harvester; 2—Throwing cylinder; 3—Deflector plate; 4—Conveying auger; 5—Blade; 6—Straw.
Table 1.
Main technical parameters of the conveying–throwing device.
2.1.2. Working Principle
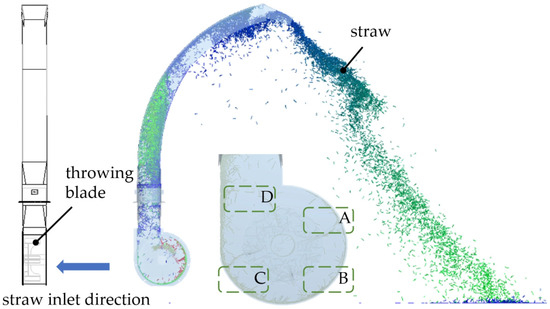
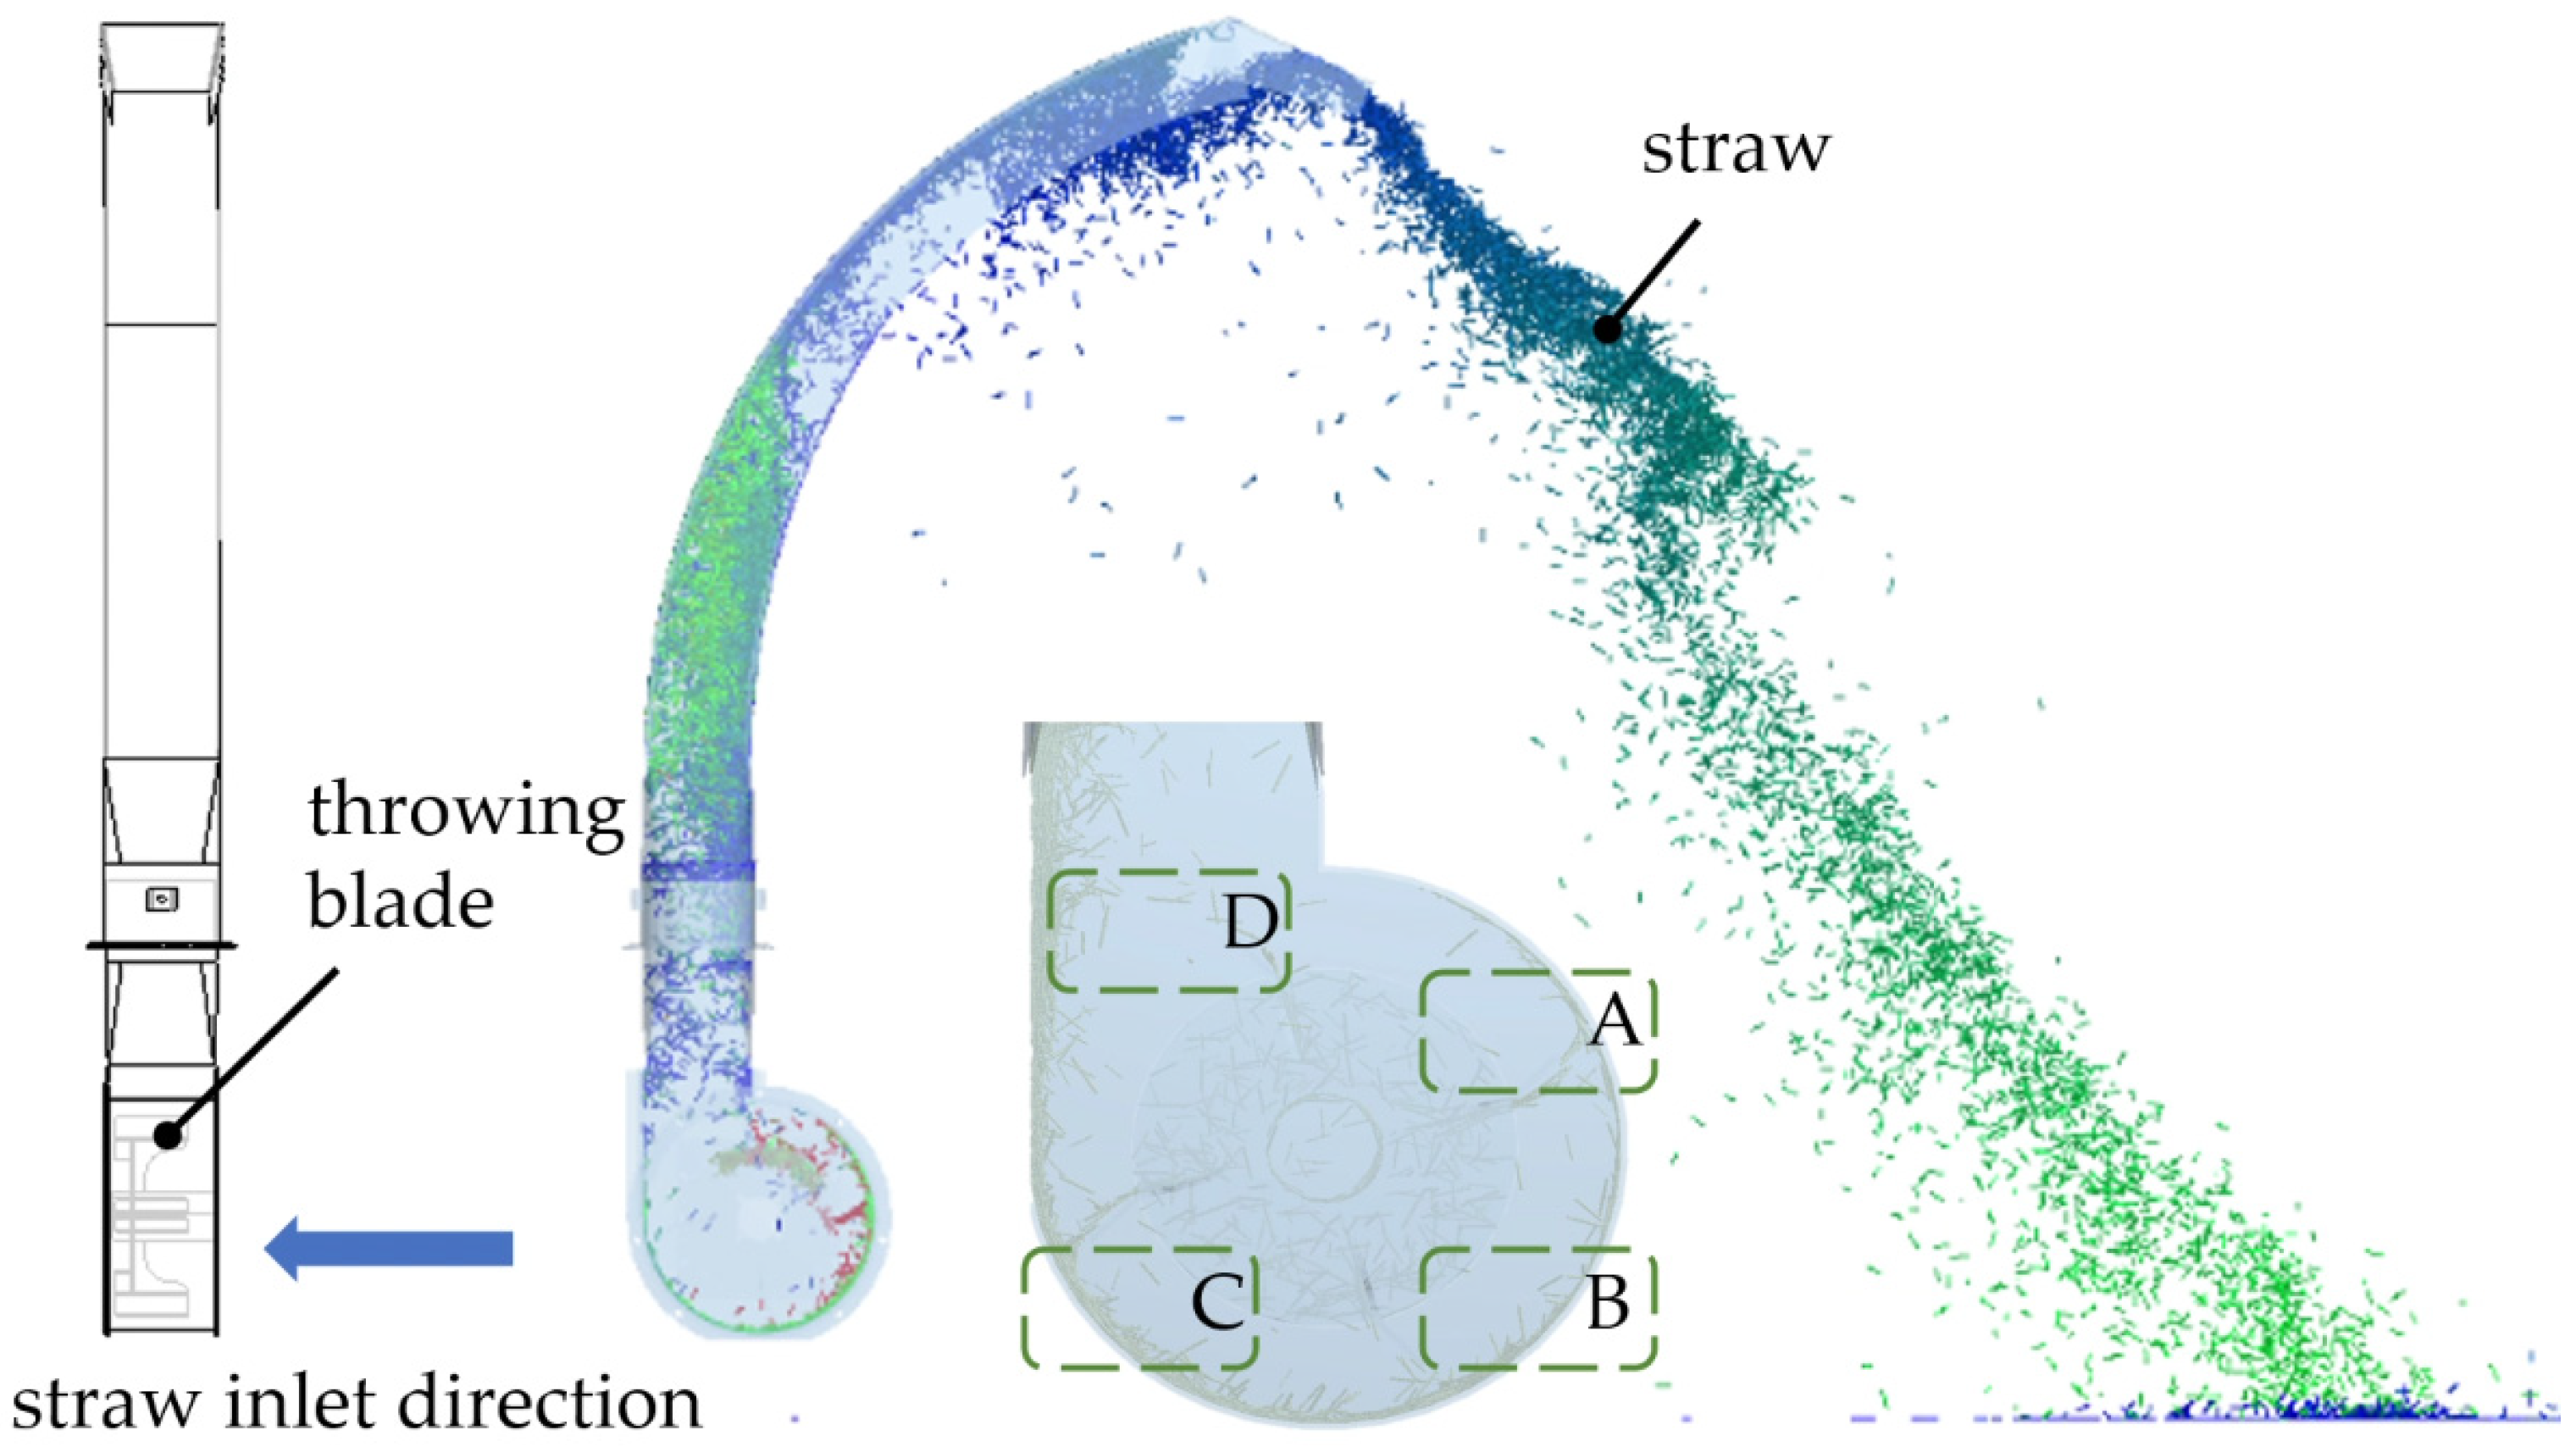
During operation, straw is conveyed to the end of the auger and then enters the throwing region. Under the action of high-speed rotating blades, the straw is accelerated and guided into the throwing pipe. Meanwhile, blade rotation induces an airflow field. Under the coupled effects of mechanical force and airflow, the straw moves along the upper inner wall of the pipe and is finally discharged through the throwing cylinder, achieving continuous and stable directional throwing, as shown in Figure 2. The straw throwing process mainly consists of three stages. First is the impact acceleration stage, during which the straw rapidly obtains a high circumferential velocity under blade action. Second is the wall-attached spiral conveying stage. Under the combined effects of centrifugal force and housing constraint, the straw moves along the inner wall of the volute (regions A, B, and C) and forms a spiral acceleration motion. Finally, during the tangential throwing stage, the straw is discharged at a high tangential velocity, while part of the material is thrown along the combined direction of tangential and axial velocities (region D).
Figure 2.
Working process of the conveying–throwing device.
2.2. Determination of Experimental Factors
2.2.1. Analysis of the Effect of Diversion Plate Angle
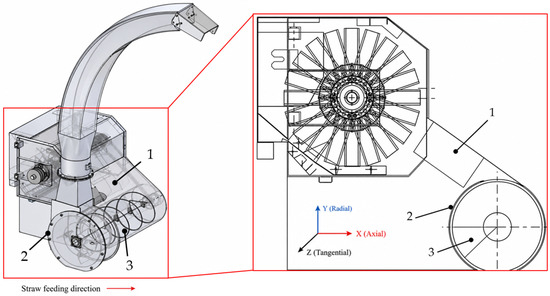
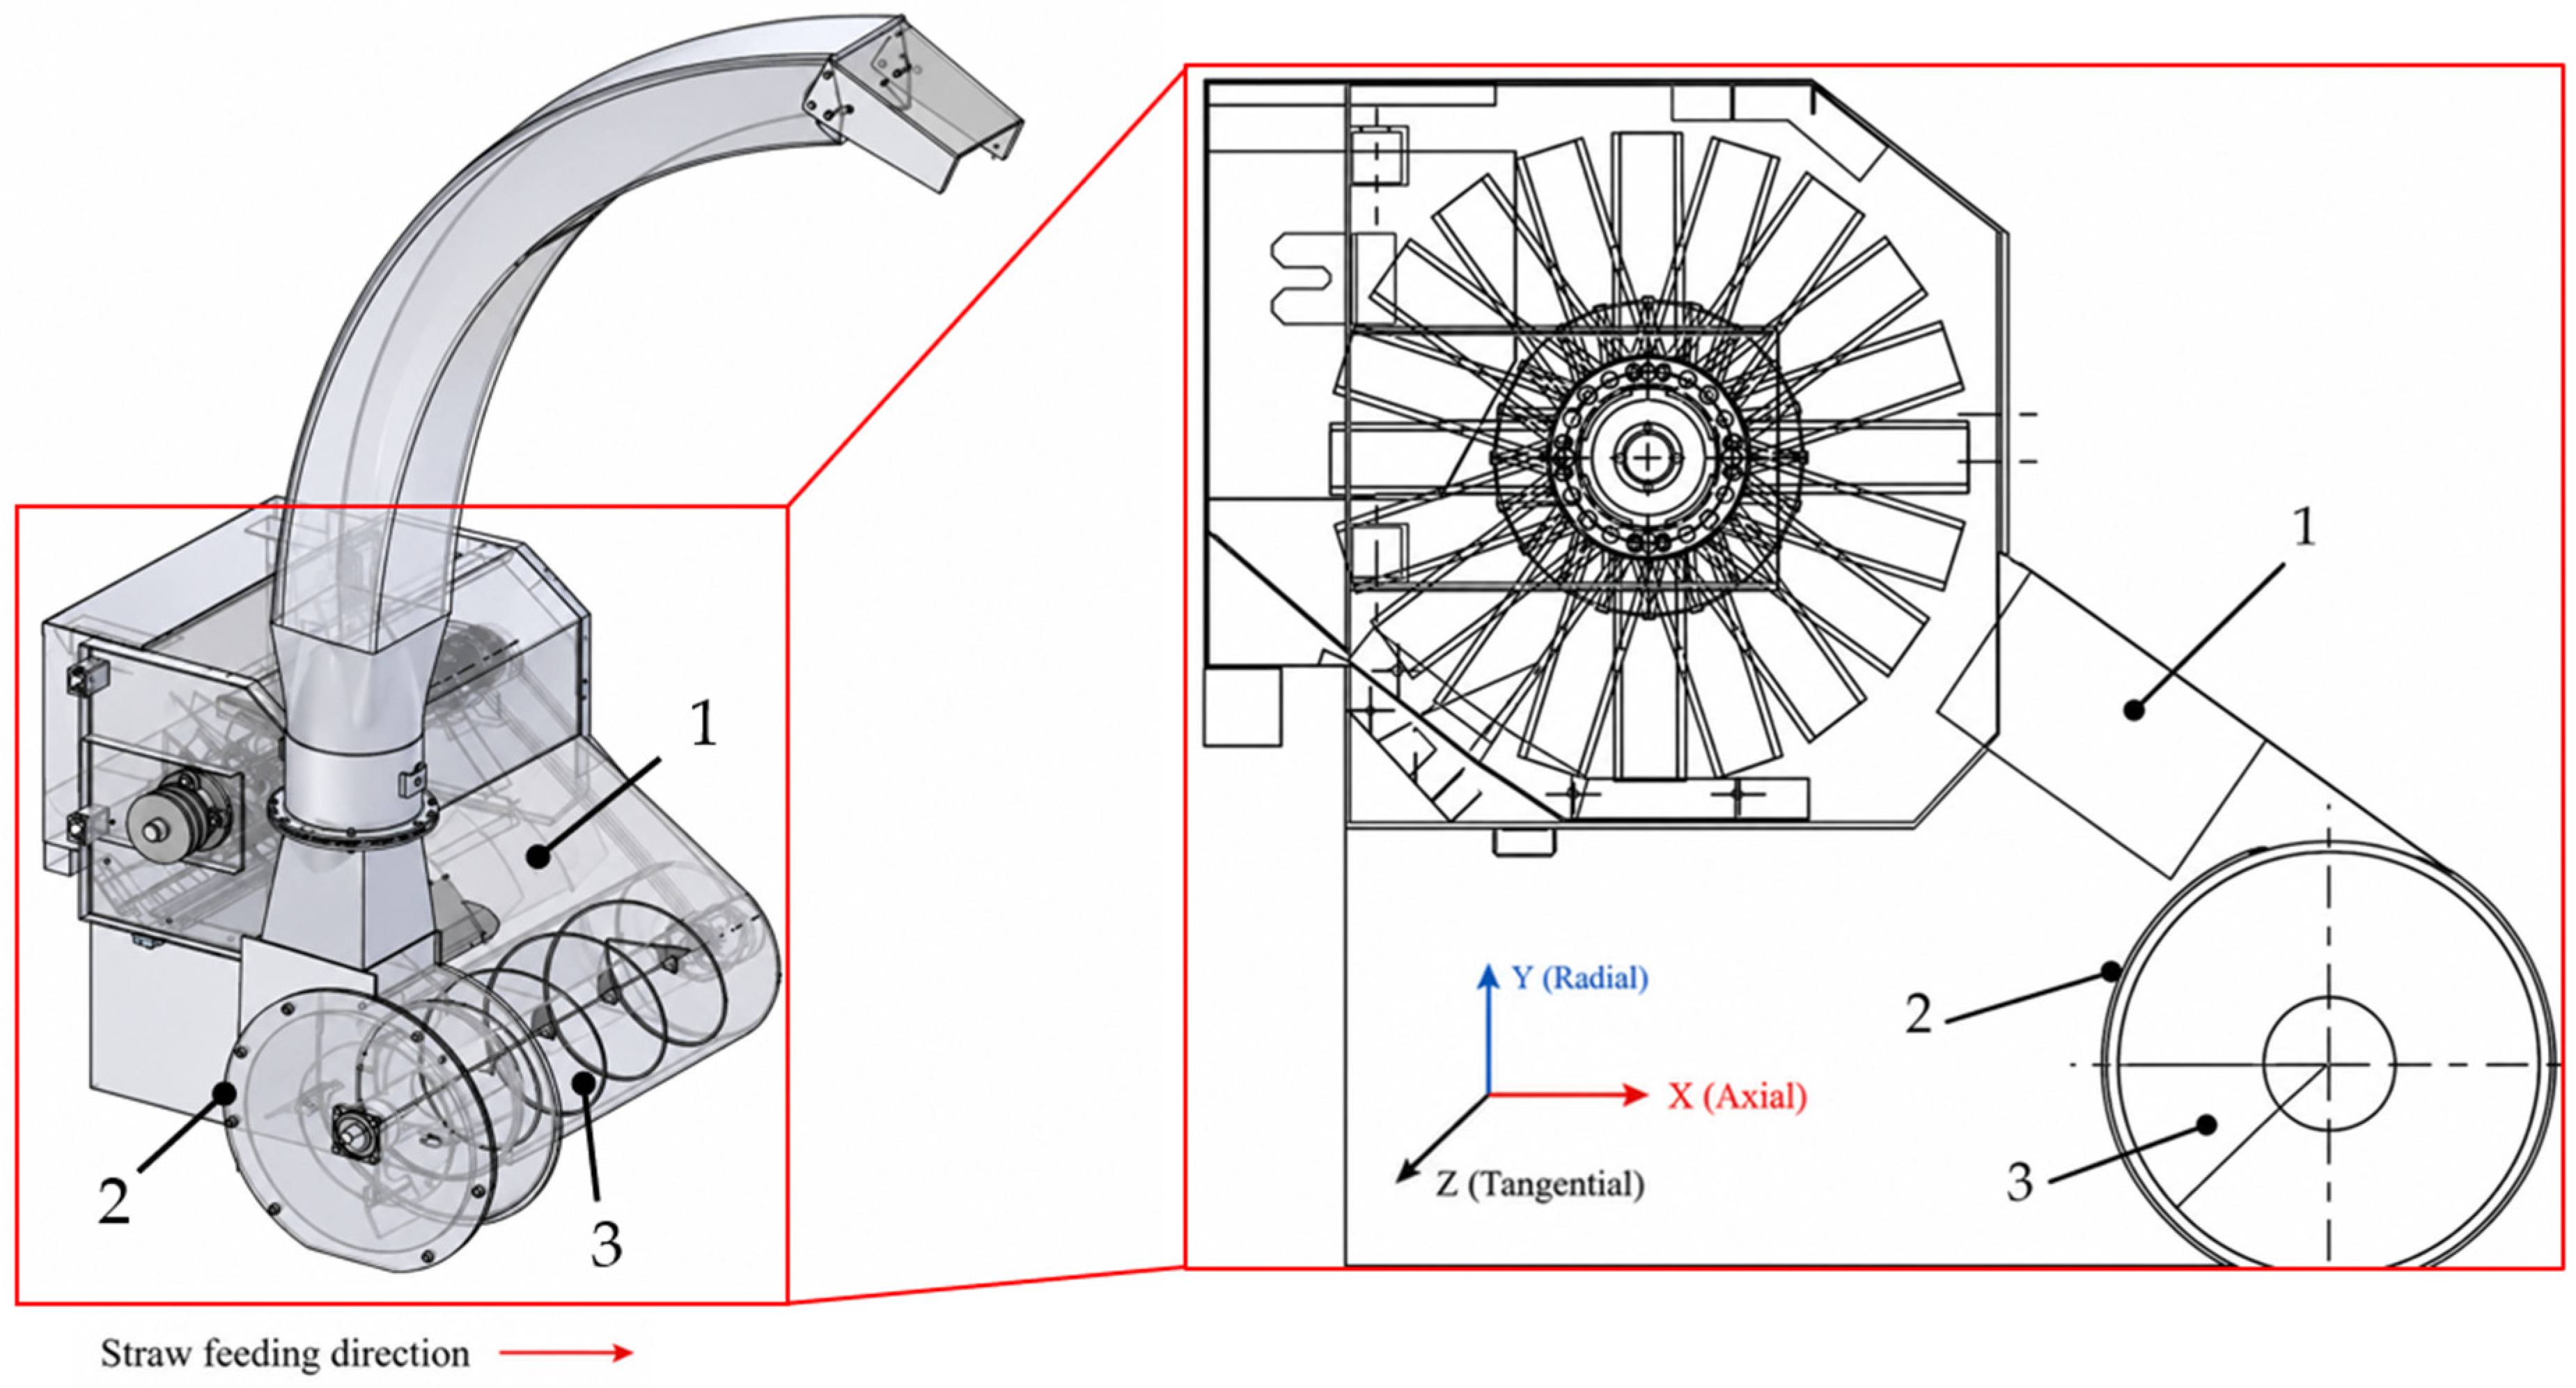
After crushing, straw is thrown under the combined effects of gravity and aerodynamic force. The material undergoes multiple collisions inside the housing before entering the auger housing and being conveyed to the throwing region. The housing mainly functions as a flow-guiding structure. However, due to differences in the initial throwing state, straw distribution along the axial direction is often uneven, which may lead to local accumulation or insufficient feeding. By introducing a diversion plate, as shown in Figure 3, the collision path and motion direction of straw can be regulated. This process enables material redistribution and residence time adjustment, allowing the straw to become more uniformly distributed before entering the auger. As a result, the axial concentration gradient is reduced and conveying stability is improved. Furthermore, the straw conveying rate is jointly determined by the sliding time of individual particles and the number of straw particles colliding with the diversion plate per unit time. The sliding time can be expressed as:
where S(θ) is the total arc length of the diversion plate curve, which increases with the increase in diversion plate angle θ. Therefore, the diversion plate angle regulates the straw conveying rate by changing the sliding path length and sliding time.
Figure 3.
Configuration of the diversion plate. 1—Diversion plate; 2—Screw conveyor housing; 3—Screw conveyor.
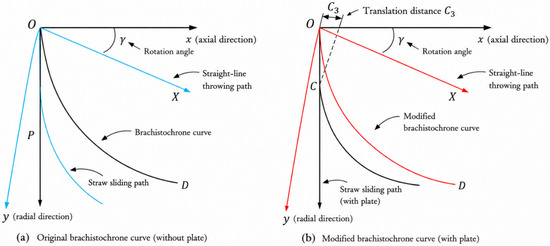
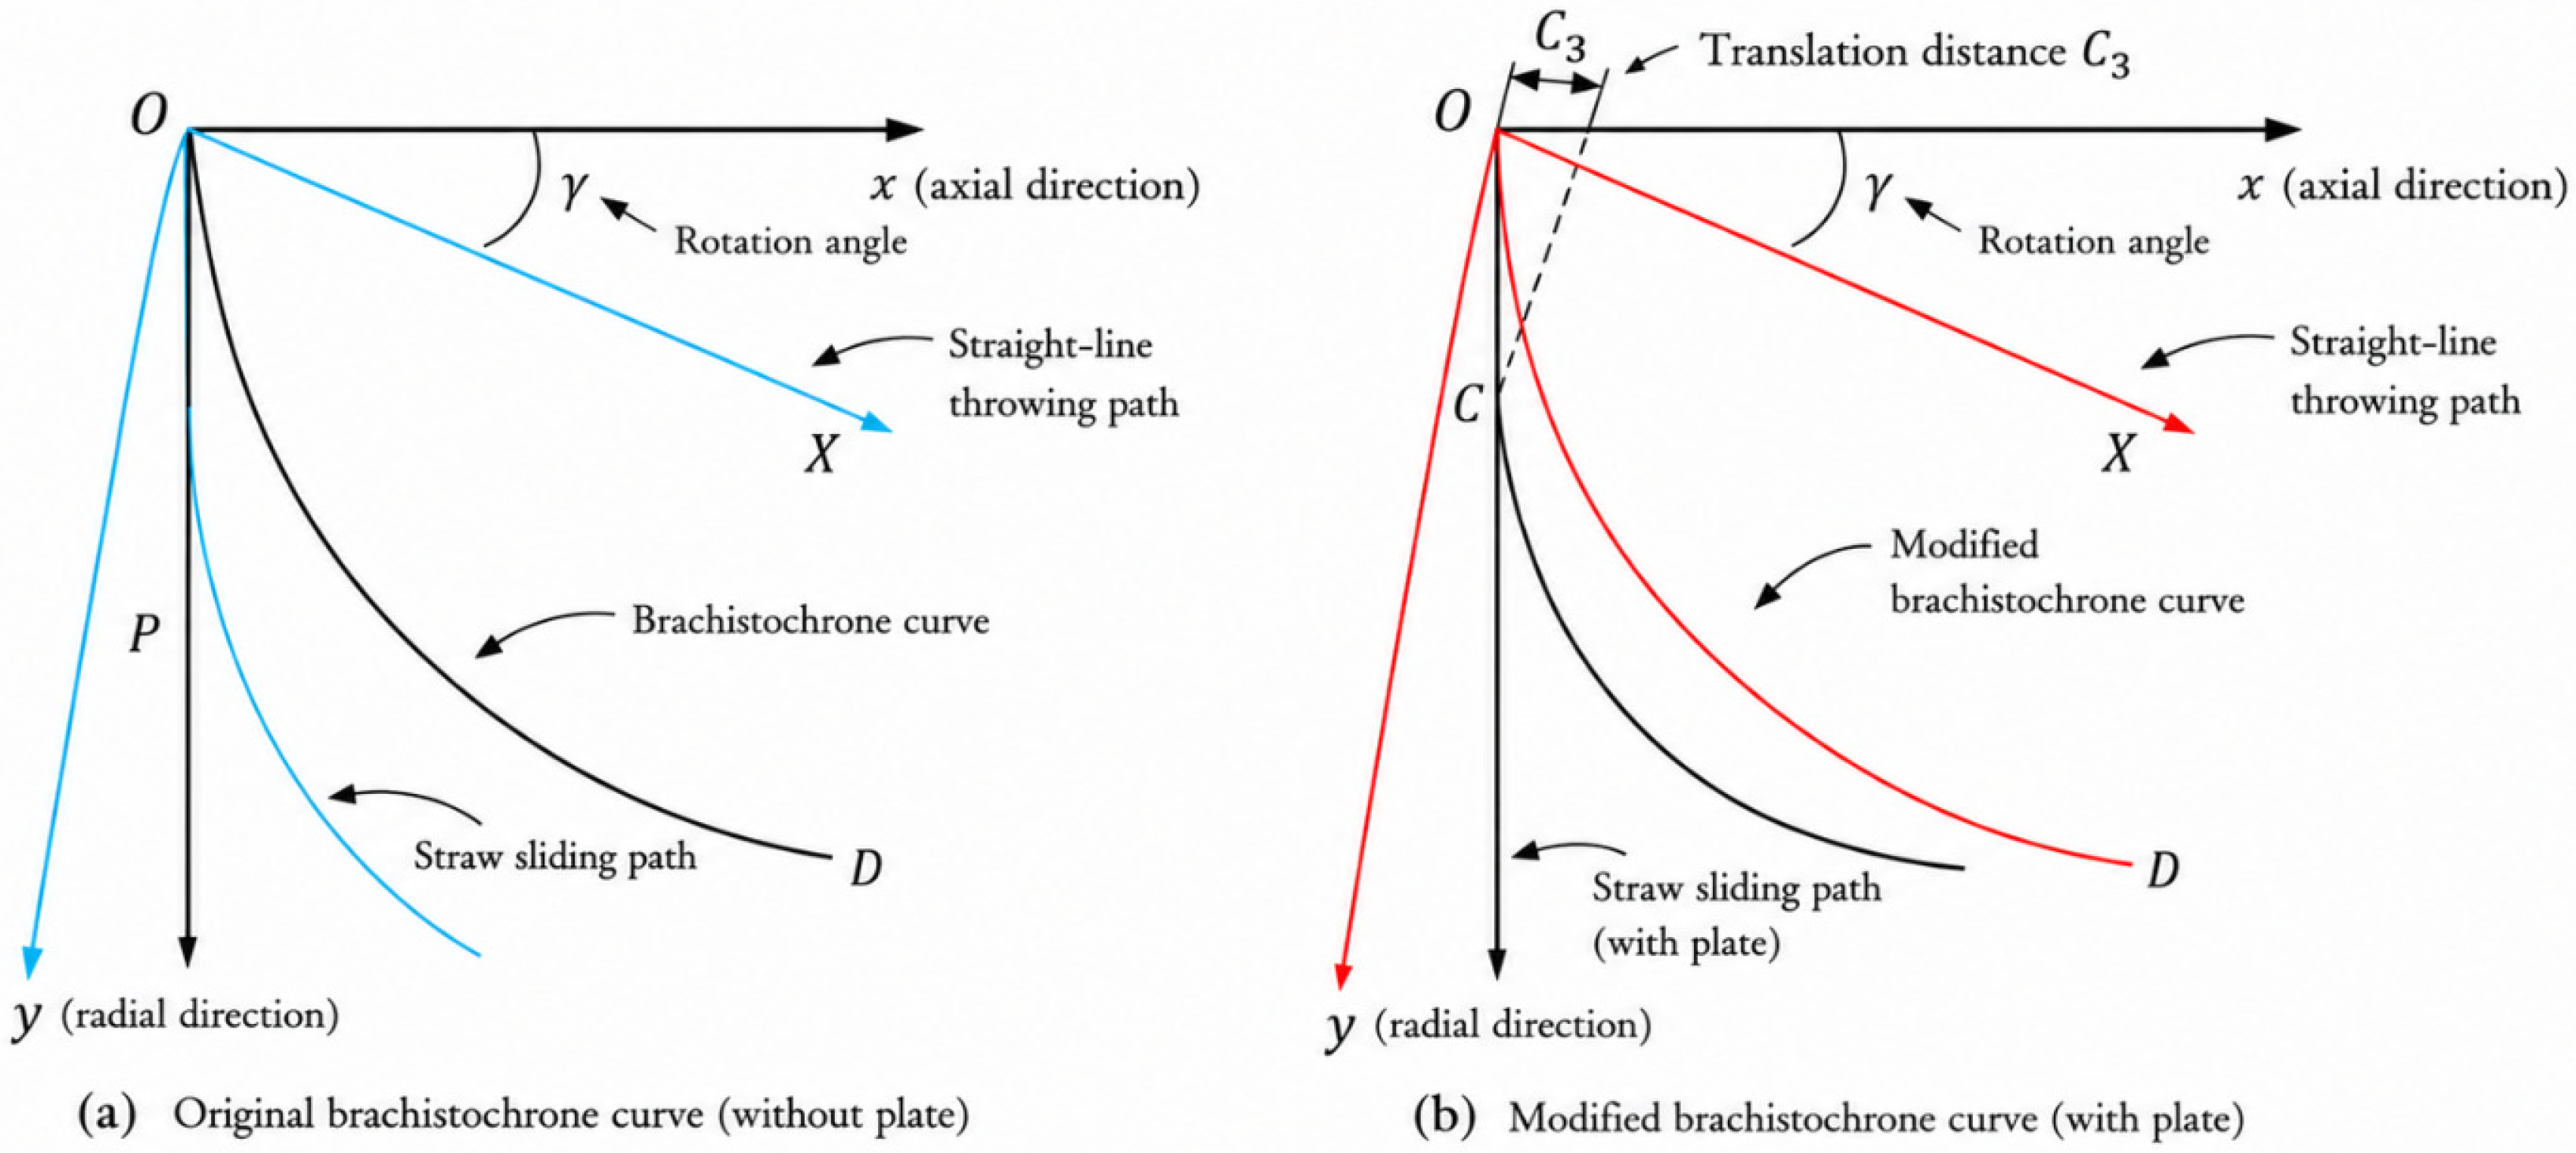
Previous studies have shown that brachistochrone-based guiding surfaces can improve particle-flow continuity and motion uniformity [22]. Accordingly, the diversion-plate surface was designed using the brachistochrone principle as a geometric reference rather than as a proven optimal structure. As shown in Figure 4, Oxy and Ox′y′ represent the original and rotated coordinate systems, respectively, while C3 denotes the translation distance along the X-axis. The resulting curve was used to smooth the transition between the straw-falling region and the conveying inlet and to regulate the straw sliding path and residence time. Considering the spatial arrangement of the diversion plate and frictional effects, the standard cycloid was modified through rotation and translation, and the parametric equation of the diversion plate curve was obtained as follows:
where C1 and C2 are scaling coefficients used to adjust the geometric dimensions of the curve in the axial and radial directions, respectively.
Figure 4.
Brachistochrone curve considering friction.
During the sliding process along the curved surface of the diversion plate, the straw velocity can be expressed as [23,24]:
where v is the straw velocity at any point during the guiding process (m/s); S is the arc length of the diversion plate curve (m); t is time (s); and y′ is the first derivative of the diversion plate curve equation. From the above equation, the following expression can be obtained:
where μ is the kinetic friction coefficient between the diversion plate and straw, and (x, y) represents the position coordinates of the straw in the Oxy coordinate system (mm).
Considering the spatial arrangement of the diversion plate and the frictional interaction between straw and the plate surface, the standard cycloid was modified through rotation and translation to obtain a parametric curve suitable for the diversion structure. The rotation angle γ and friction coefficient μ satisfy the following relationship:
Finally, the diversion plate curve can be expressed as:
Based on the analysis of the spatial constraints of the diversion plate structure and the straw conveying characteristics, the diversion plate angle θ mainly affects the feeding rhythm and spatial distribution of straw entering the auger region by changing the sliding path and residence time of straw on the diversion plate. Considering the structural interference of the helical blades and the parameter range reported in the literature [25], the final range of the diversion plate angle θ was determined to be 1.01–1.49 rad.
2.2.2. Analysis of the Effects of Blade Rotational Speed and Blade Installation Angle
After being discharged from the blades, the straw passes through the volute, straight pipe, and curved pipe before reaching the outlet region. Neglecting secondary collision effects, the simplified dynamic equation of straw motion along the wall surface can be expressed as:
where v is the instantaneous velocity of straw moving along the wall surface, α(s) is the pipe installation angle, R(s) is the curvature radius of the pipe, and f is the friction coefficient.
Equation (7) indicates that straw motion along the wall surface is jointly affected by the gravitational component, frictional resistance, and centrifugal effect induced by pipe curvature. Among these factors, velocity v and curvature radius R(s) are the key parameters influencing straw motion behavior. The pipe installation angle α(s) is determined by the geometric structure of the throwing cylinder, while the blade installation angle does not directly alter the pipe geometry. Instead, it mainly affects the initial velocity magnitude and direction of straw entering the throwing region, thereby influencing the subsequent wall-attached conveying process. Specifically, blade rotational speed (2000–3000 r/min) mainly determines the initial kinetic energy input and centrifugal acceleration intensity of straw particles. Blade installation angles (−15°, 0°, and 15°) alter the velocity direction and axial velocity component of straw leaving the blades, thereby affecting the wall-attached motion state and conveying trajectory inside the pipe. The combined effects of these factors further influence the velocity evolution, motion stability, and throwing distance of straw within the throwing pipe. Therefore, they are considered key structural and operating parameters affecting throwing performance.
2.2.3. Factor Level Coding
Blade rotational speed (A), diversion plate angle (B), and blade installation angle (C) were selected as the principal controllable factors because they directly affect airflow organization, straw guidance, and throwing performance. Throwing distance and the coefficient of variation in straw distribution were used as response variables. Other material and operating conditions were kept constant to isolate the effects of the selected factors. The factor ranges were determined from structural constraints and preliminary tests, and a three-level coded design was adopted, as shown in Table 2.
Table 2.
Experimental factors and levels.
2.3. Simulation Design of the Throwing Process
2.3.1. Mathematical Model and Computational Method
To investigate the gas–solid two-phase flow characteristics and straw motion behavior inside the device, a three-dimensional numerical model under different blade installation angles was established using computational fluid dynamics (CFD). The gas–solid two-phase flow was described using the Mixture multiphase flow model. The governing equations included the continuity equation, momentum equation, and phase volume fraction equations of the mixture phase [26]. The continuity equation of the mixture phase can be expressed as:
The mixture density is defined as:
The mass-averaged velocity can be expressed as:
Considering the additional momentum term induced by the relative motion between phases, the momentum equation of the mixture phase can be expressed as:
where vdr,k is the drift velocity of phase k relative to the mixture phase, and μm is the equivalent dynamic viscosity of the mixture phase.
In addition, the volume fraction of each phase satisfies the conservation equation:
The computational domain included the feeding plane, impeller region, volute region, and outlet pipe. An unstructured mesh was adopted for domain discretization, and local mesh refinement was applied to the blade surfaces and rotor-stator interaction regions. The total number of mesh elements was approximately 1.52 million. The inlet boundary was defined as a pressure inlet, with the inlet pressure specified according to the actual operating conditions, while the outlet boundary was specified as a pressure outlet. A no–slip boundary condition was applied to all wall surfaces. Numerical simulations were performed using the pressure-based SIMPLEC algorithm. The momentum and transport equations were discretized using a second-order upwind scheme. The standard k–ε turbulence model was employed, and standard wall functions were used for near–wall treatment.
2.3.2. Computational Domain Construction and Mesh Generation
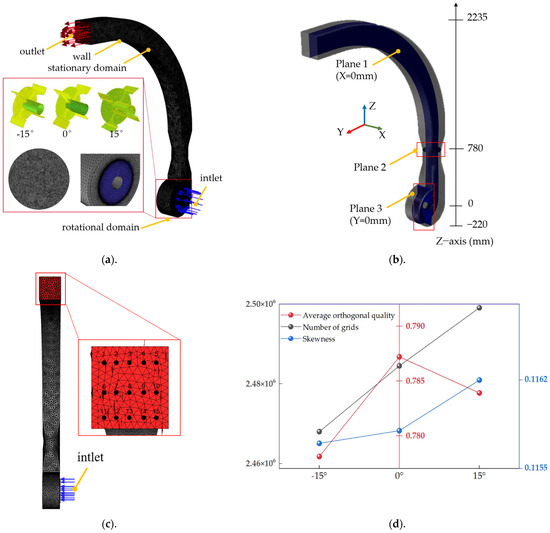
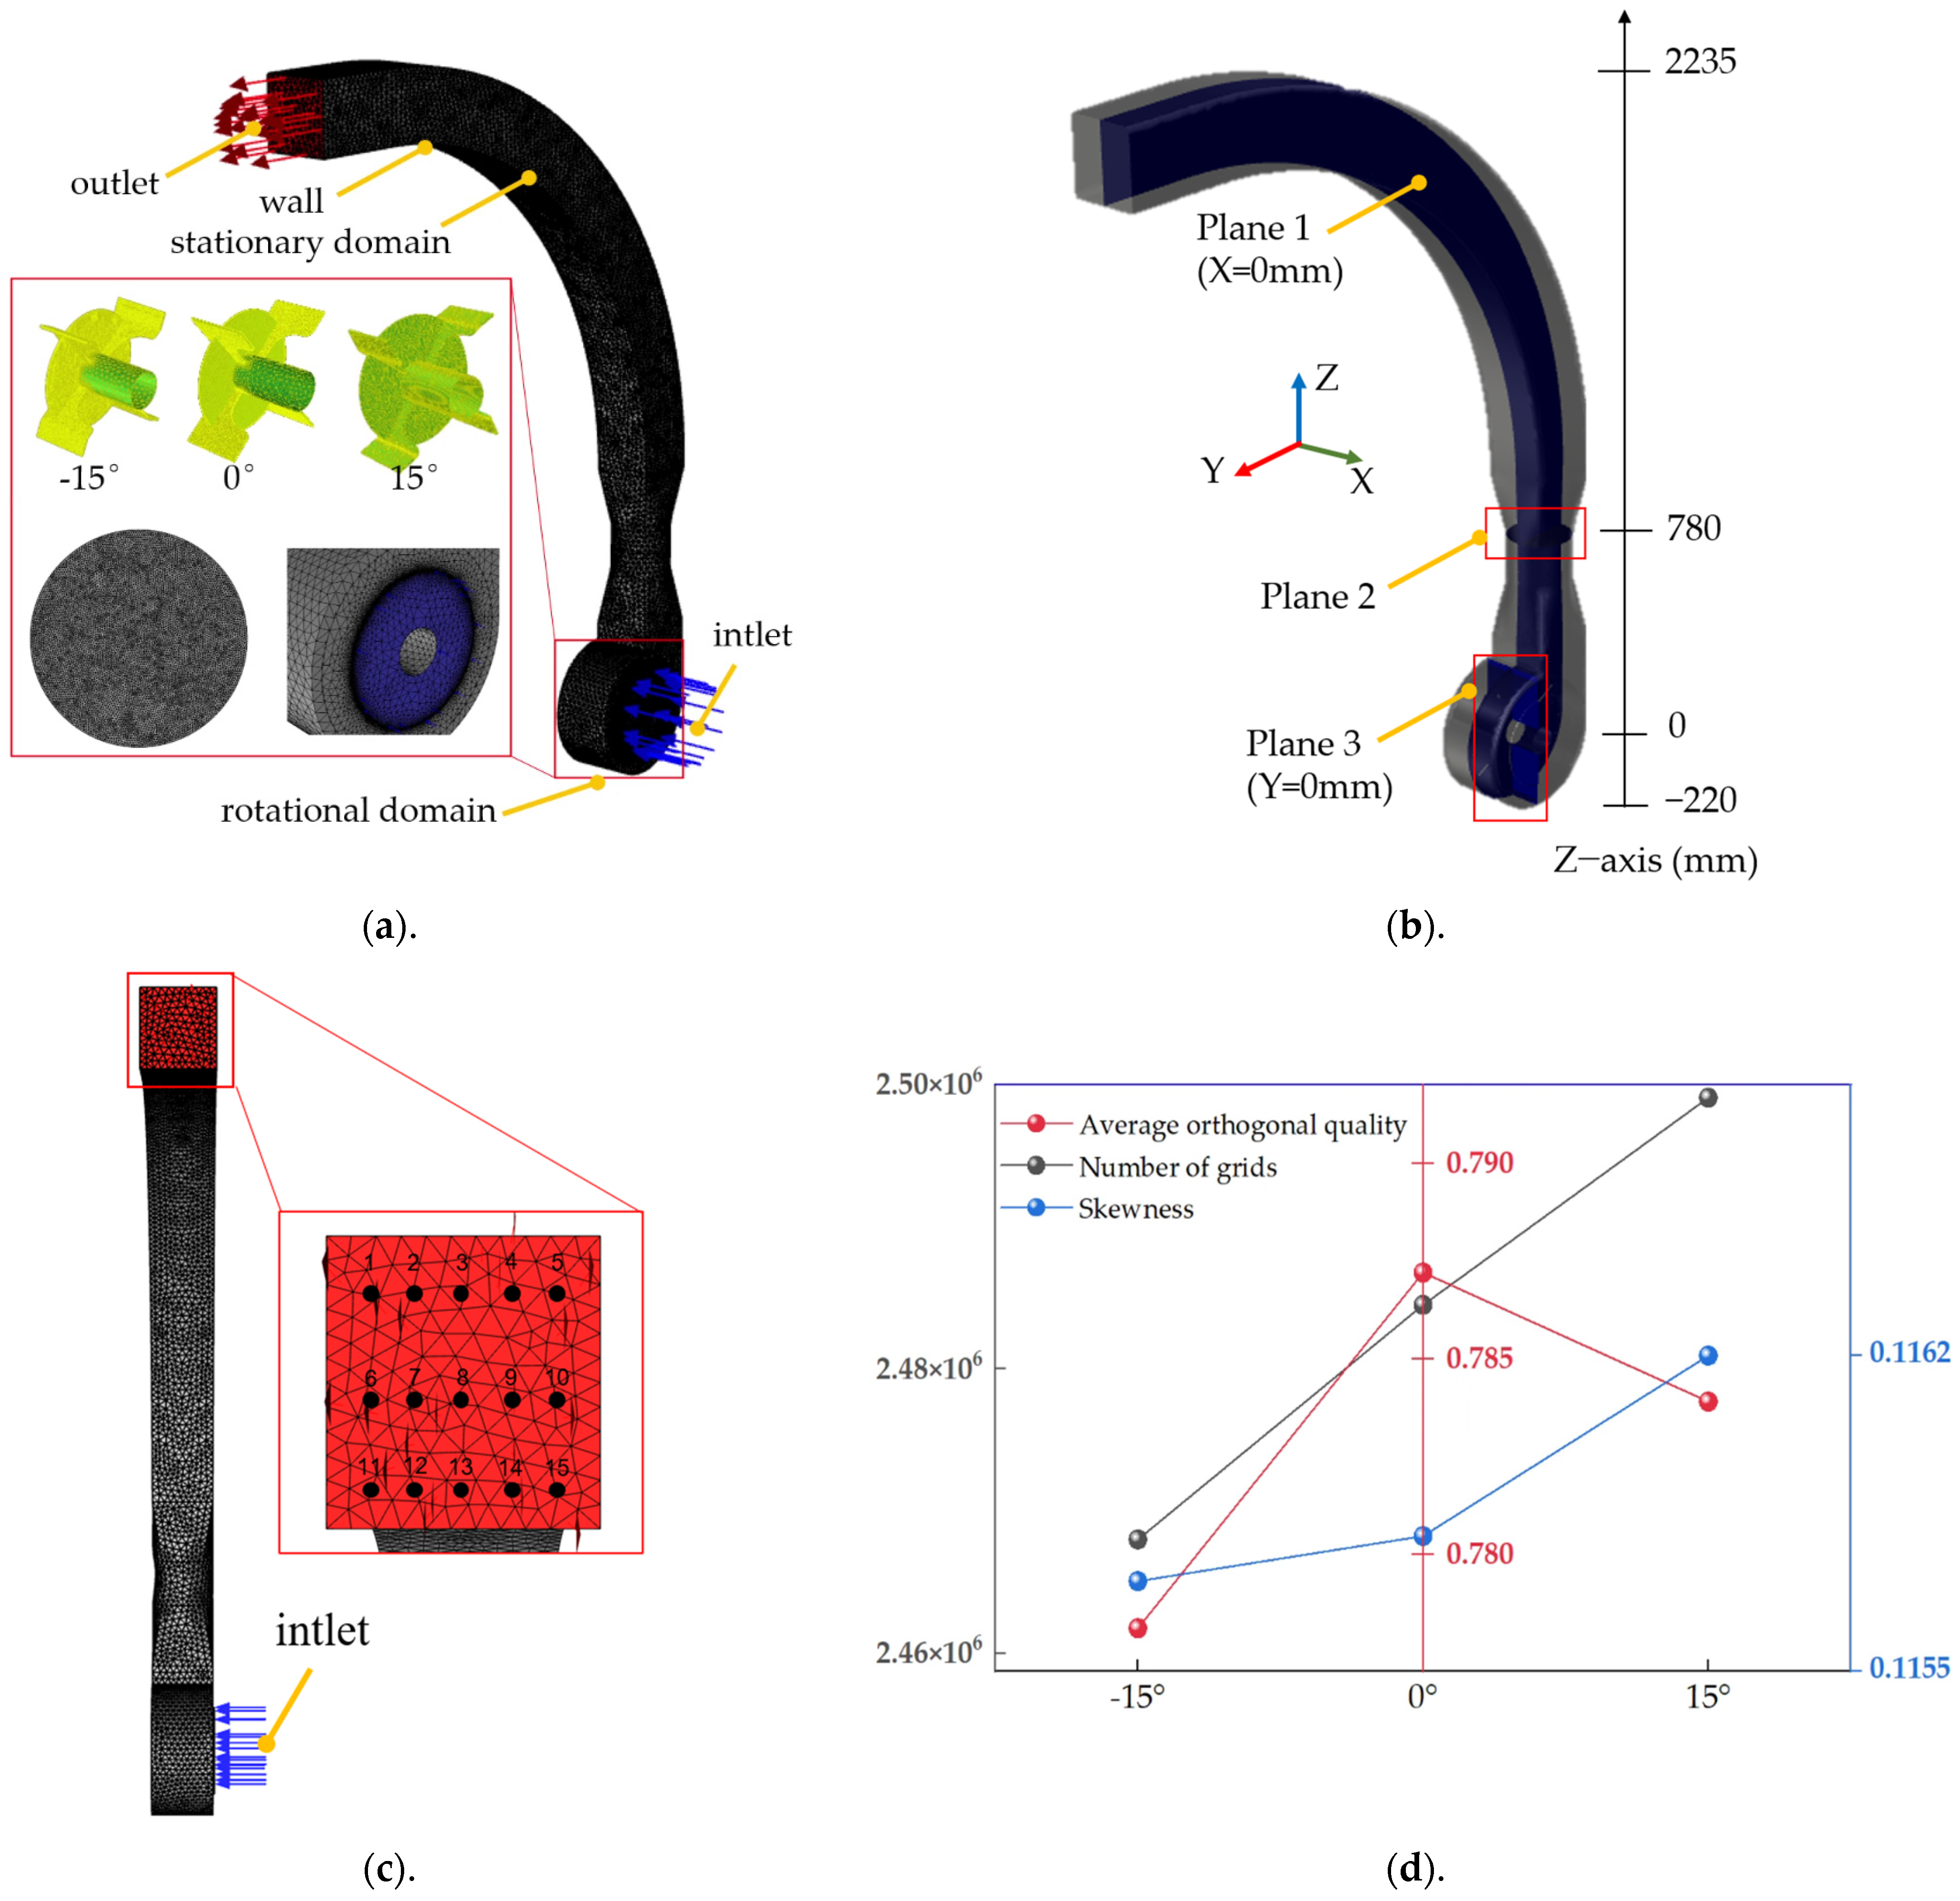
A sliding-mesh method was used to simulate blade rotation, as shown in Figure 5a. The blade and hub region was defined as the rotating domain at 2000–3000 r/min, whereas the feeding section, volute, and throwing pipe were treated as stationary domains and coupled through interfaces. The inlet and outlet were specified as atmospheric-pressure boundaries, the inlet straw volume fraction was set to 0.1275, and no-slip wall conditions with standard wall functions were applied. Minor structural details were removed while retaining the principal flow passages and effective blade surfaces. The computational domain was discretized using locally refined tetrahedral meshes. Three monitoring planes were arranged to characterize the flow evolution in the blade, contraction, and axial sections, as shown in Figure 5b, while 15 outlet monitoring points were used to quantify the upper, middle, and lower velocity distributions, as shown in Figure 5c. Identical meshing criteria were applied to the −15°, 0°, and 15° blade configurations. As shown in Figure 5d, the corresponding meshes contained approximately 2.47 × 10⁶, 2.49 × 10⁶, and 2.50 × 10⁶ elements, with average orthogonal qualities of approximately 0.779, 0.787, and 0.784 and average skewness values of 0.1156, 0.1157, and 0.1162, respectively. The small variations in mesh number and quality indicate consistent spatial resolution among the three configurations and reduce mesh-related uncertainty in the comparative analysis [27]. The Mixture model was adopted to evaluate macroscopic airflow organization, phase distribution, and bulk straw-conveying behavior at the device scale. This continuum-based treatment is computationally efficient for comparing multiple structural and operating conditions; however, it does not explicitly resolve the deformation, collision, or entanglement of individual fibrous straw particles. Therefore, the CFD results were interpreted primarily as comparative predictions of macroscopic gas–solid flow characteristics and were subsequently assessed through quantitative monitoring-point analysis and repeated experimental validation.
Figure 5.
Computational domain, mesh generation, flow-field monitoring arrangement, and mesh statistics: (a)—computational domain and mesh division; (b)—locations of the monitoring planes; (c)—arrangement of the outlet monitoring points; and (d)—mesh statistics for the three blade-angle configurations.
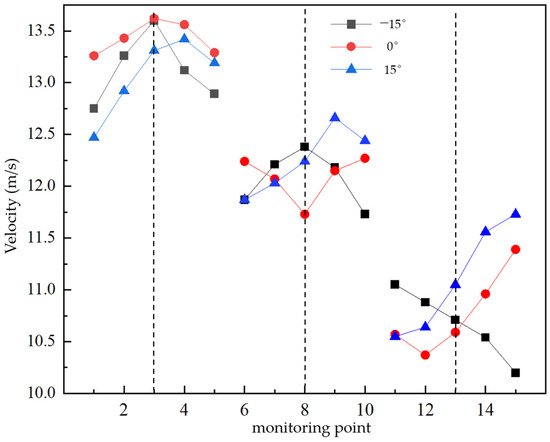
To analyze the flow characteristics inside the computational domain, three representative cross–planes were selected for flow field analysis, as shown in Figure 5b. Plane 1 passed through the throwing blade region and was parallel to the inlet plane. It was used to characterize the local flow field distribution induced by blade rotation. Plane 2 was located in the contraction region of the throwing cylinder and was used to analyze the flow acceleration process and flow field evolution. Plane 3 passed through the blade rotational axis and was perpendicular to the ground, which was used to reveal the overall internal flow structure and flow field symmetry of the device. Comparative analysis of the flow field distributions at different planes further revealed the evolution characteristics of the gas–solid two–phase flow in different regions. In addition, to quantitatively evaluate the effect of blade installation angle on the outlet flow field, 15 monitoring points were arranged on the outlet plane, as shown in Figure 5c. Monitoring points 1–5 were uniformly distributed along the upper part of the outlet. Monitoring points 6–10 were located along the centerline of the middle plane, while monitoring points 11–15 were uniformly distributed along the lower part of the outlet. These monitoring points were used to characterize the velocity distribution at different height positions.
2.4. Evaluation Indices
To comprehensively evaluate straw throwing performance, throwing distance and throwing stability were selected as evaluation indices.
(1) Throwing Distance
A plastic sheet was laid behind the combine harvester and divided into regions at intervals of 1 m. The straw mass collected in each region was measured to characterize the mass distribution along the throwing direction. The weighted geometric mean distance was used as the evaluation index for throwing distance, and it was calculated as follows:
where Mi is the percentage of straw mass in the i–th interval relative to the total straw mass, and xi is the distance between the midpoint of the corresponding interval and the throwing outlet (m).
(2) Throwing Stability
A plastic sheet was continuously pulled at a constant speed of 0.9 m/s to form a continuous straw deposition belt. The belt was divided into intervals with a length of 15 cm, and the straw mass in each interval was measured. Based on the dispersion degree of straw mass distribution, the coefficient of variation (CV) was used to evaluate throwing stability. A smaller CV value indicates more uniform straw distribution, lower fluctuation, and better throwing stability. In contrast, a larger CV value indicates greater distribution dispersion and poorer stability. The calculation formula is as follows:
where mi is the straw mass in the i–th interval, m is the average straw mass of all intervals, and n is the total number of intervals.
2.5. Formulation of the Multi-Objective Optimization Problem
The optimization problem was formulated using blade rotational speed, diversion plate angle, and blade installation angle as the decision variables. Their respective ranges were 2000–3000 r/min, 1.01–1.49 rad, and −15° to 15°. Throwing distance and throwing stability were selected as the response objectives. A larger throwing distance was preferred, whereas a smaller coefficient of variation indicated better throwing stability and more uniform straw distribution. Therefore, the multi-objective optimization aimed to maximize the throwing distance while minimizing the coefficient of variation within the prescribed parameter ranges. The response surface models established from the Box–Behnken design were subsequently used to evaluate the effects and interactions of the three decision variables and to determine the optimal parameter combination.
3. Results and Discussion
3.1. Effect of Blade Installation Angle on Straw Conveying Performance
3.1.1. Flow Field Evolution and Airflow Conveying Characteristics of Blades
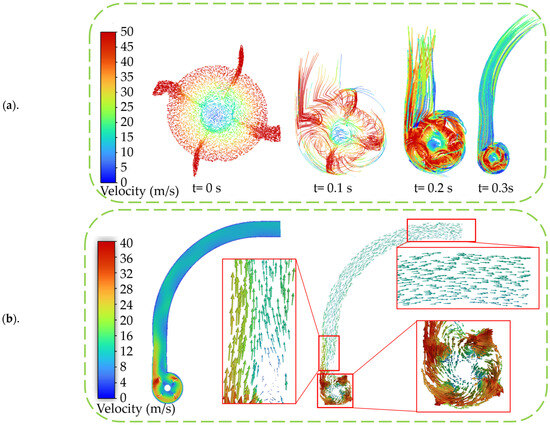
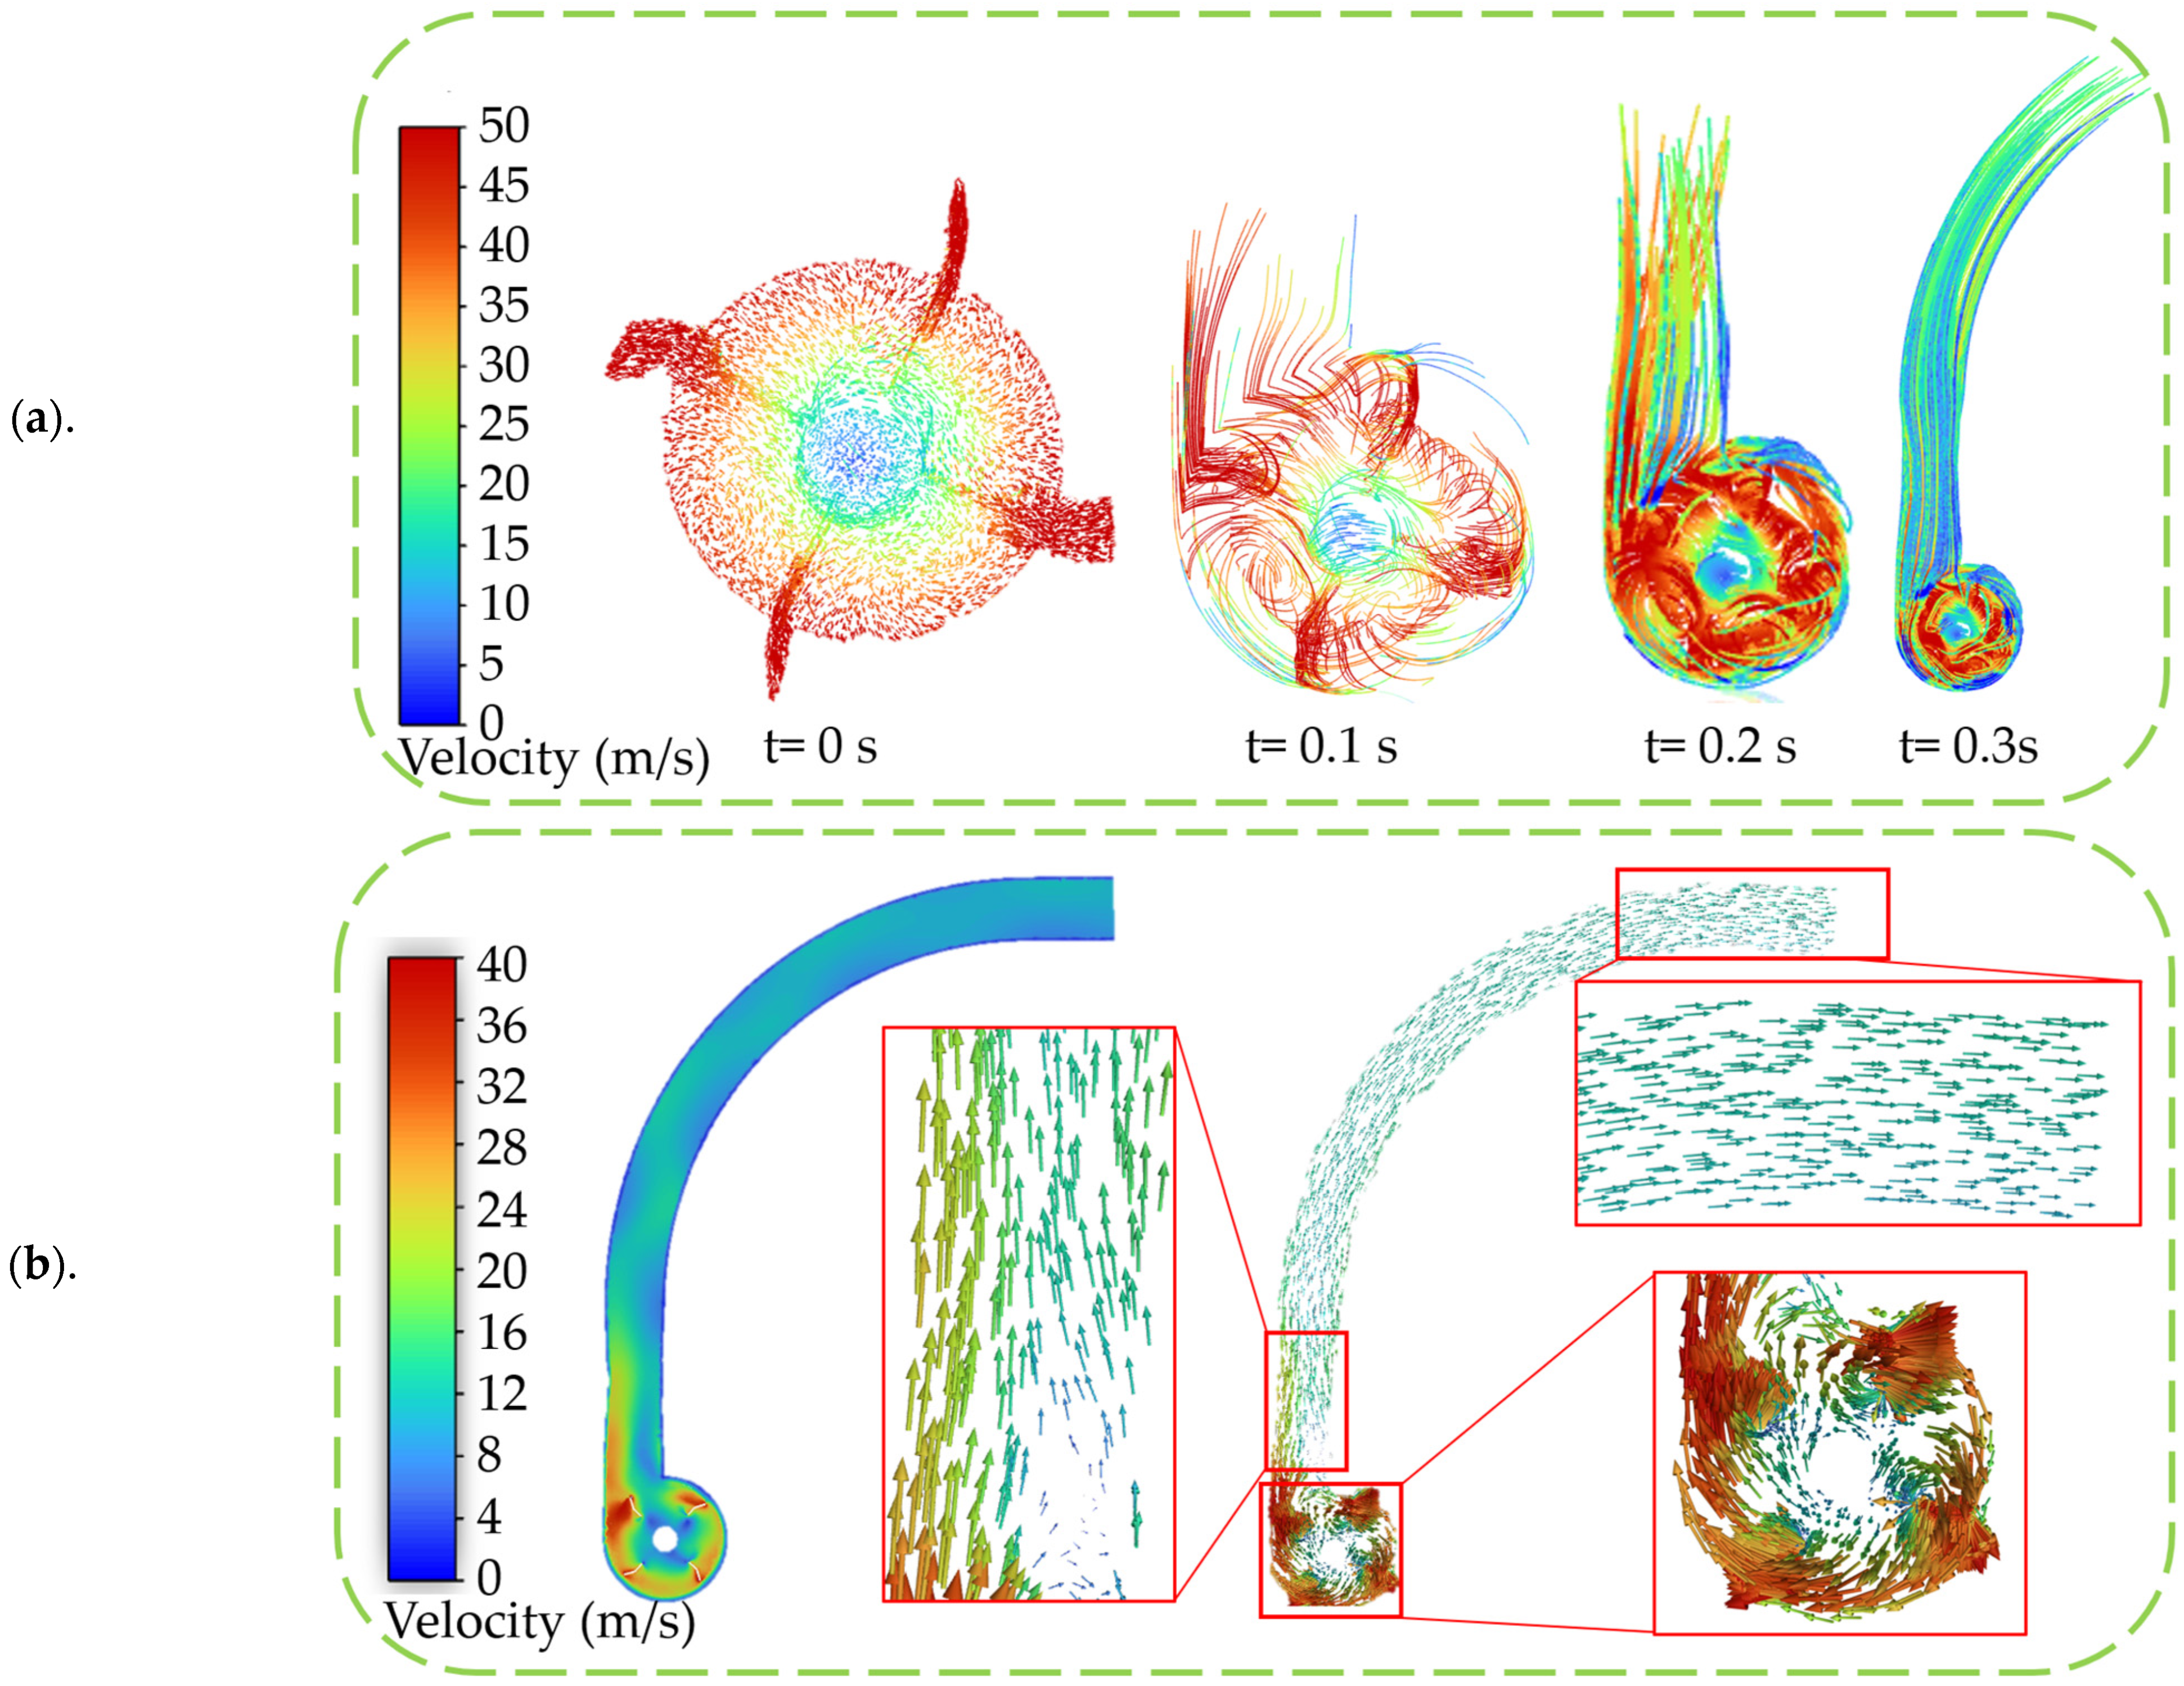
Figure 6 illustrates the flow field evolution inside the device with a blade installation angle of 15°. As shown in Figure 6a, the flow field gradually develops from a local rotational flow near the impeller into a stable axial conveying flow along the throwing cylinder [28]. At the initial stage, airflow is concentrated in the impeller region, where the streamlines exhibit a pronounced circumferential motion around the rotating blades. With time progression, the streamlines extend into the throwing cylinder, and a continuous axial conveying channel is gradually established. At t = 0.3 s, the flow field becomes stable, indicating the formation of a steady pneumatic conveying state.
Figure 6.
Evolution of blade streamlines and velocity distribution at Plane 1. (a)—Blade streamline formation process, (b)—Internal contour cloud map of the device.
Figure 6b presents the velocity contour and local velocity vectors at Plane 1. High-velocity regions are mainly distributed around the blade outer edge and sweeping region, with velocity increasing along the radial direction. The velocity vectors exhibit good directional consistency at the inlet and curved plane of the throwing cylinder, indicating favorable axial conveying characteristics. Although local vortices exist, no obvious low-velocity stagnation or strong backflow regions are observed. These results demonstrate that the 15° blade structure effectively enhances airflow induction and conveying capacity, thereby promoting stable straw acceleration and conveying.
3.1.2. Effect of Blade Installation Angle on Flow Field Structure and Conveying Characteristics
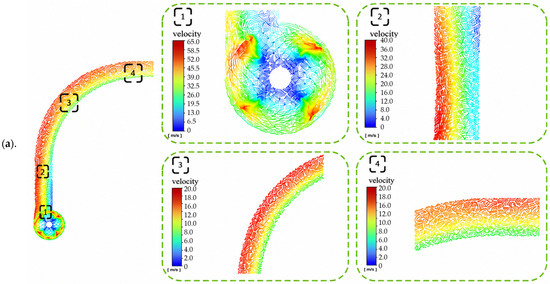
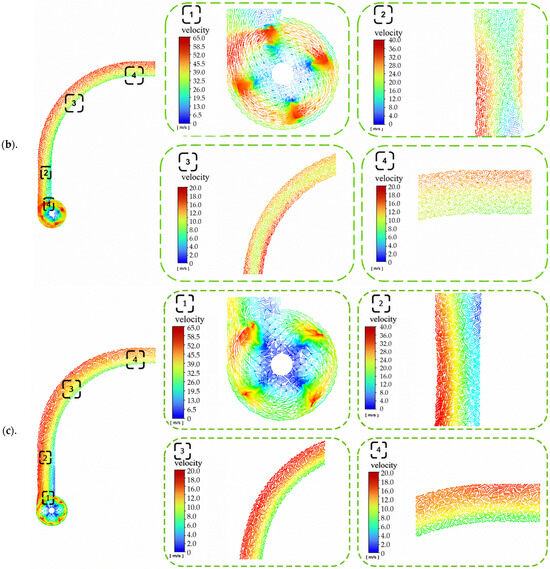
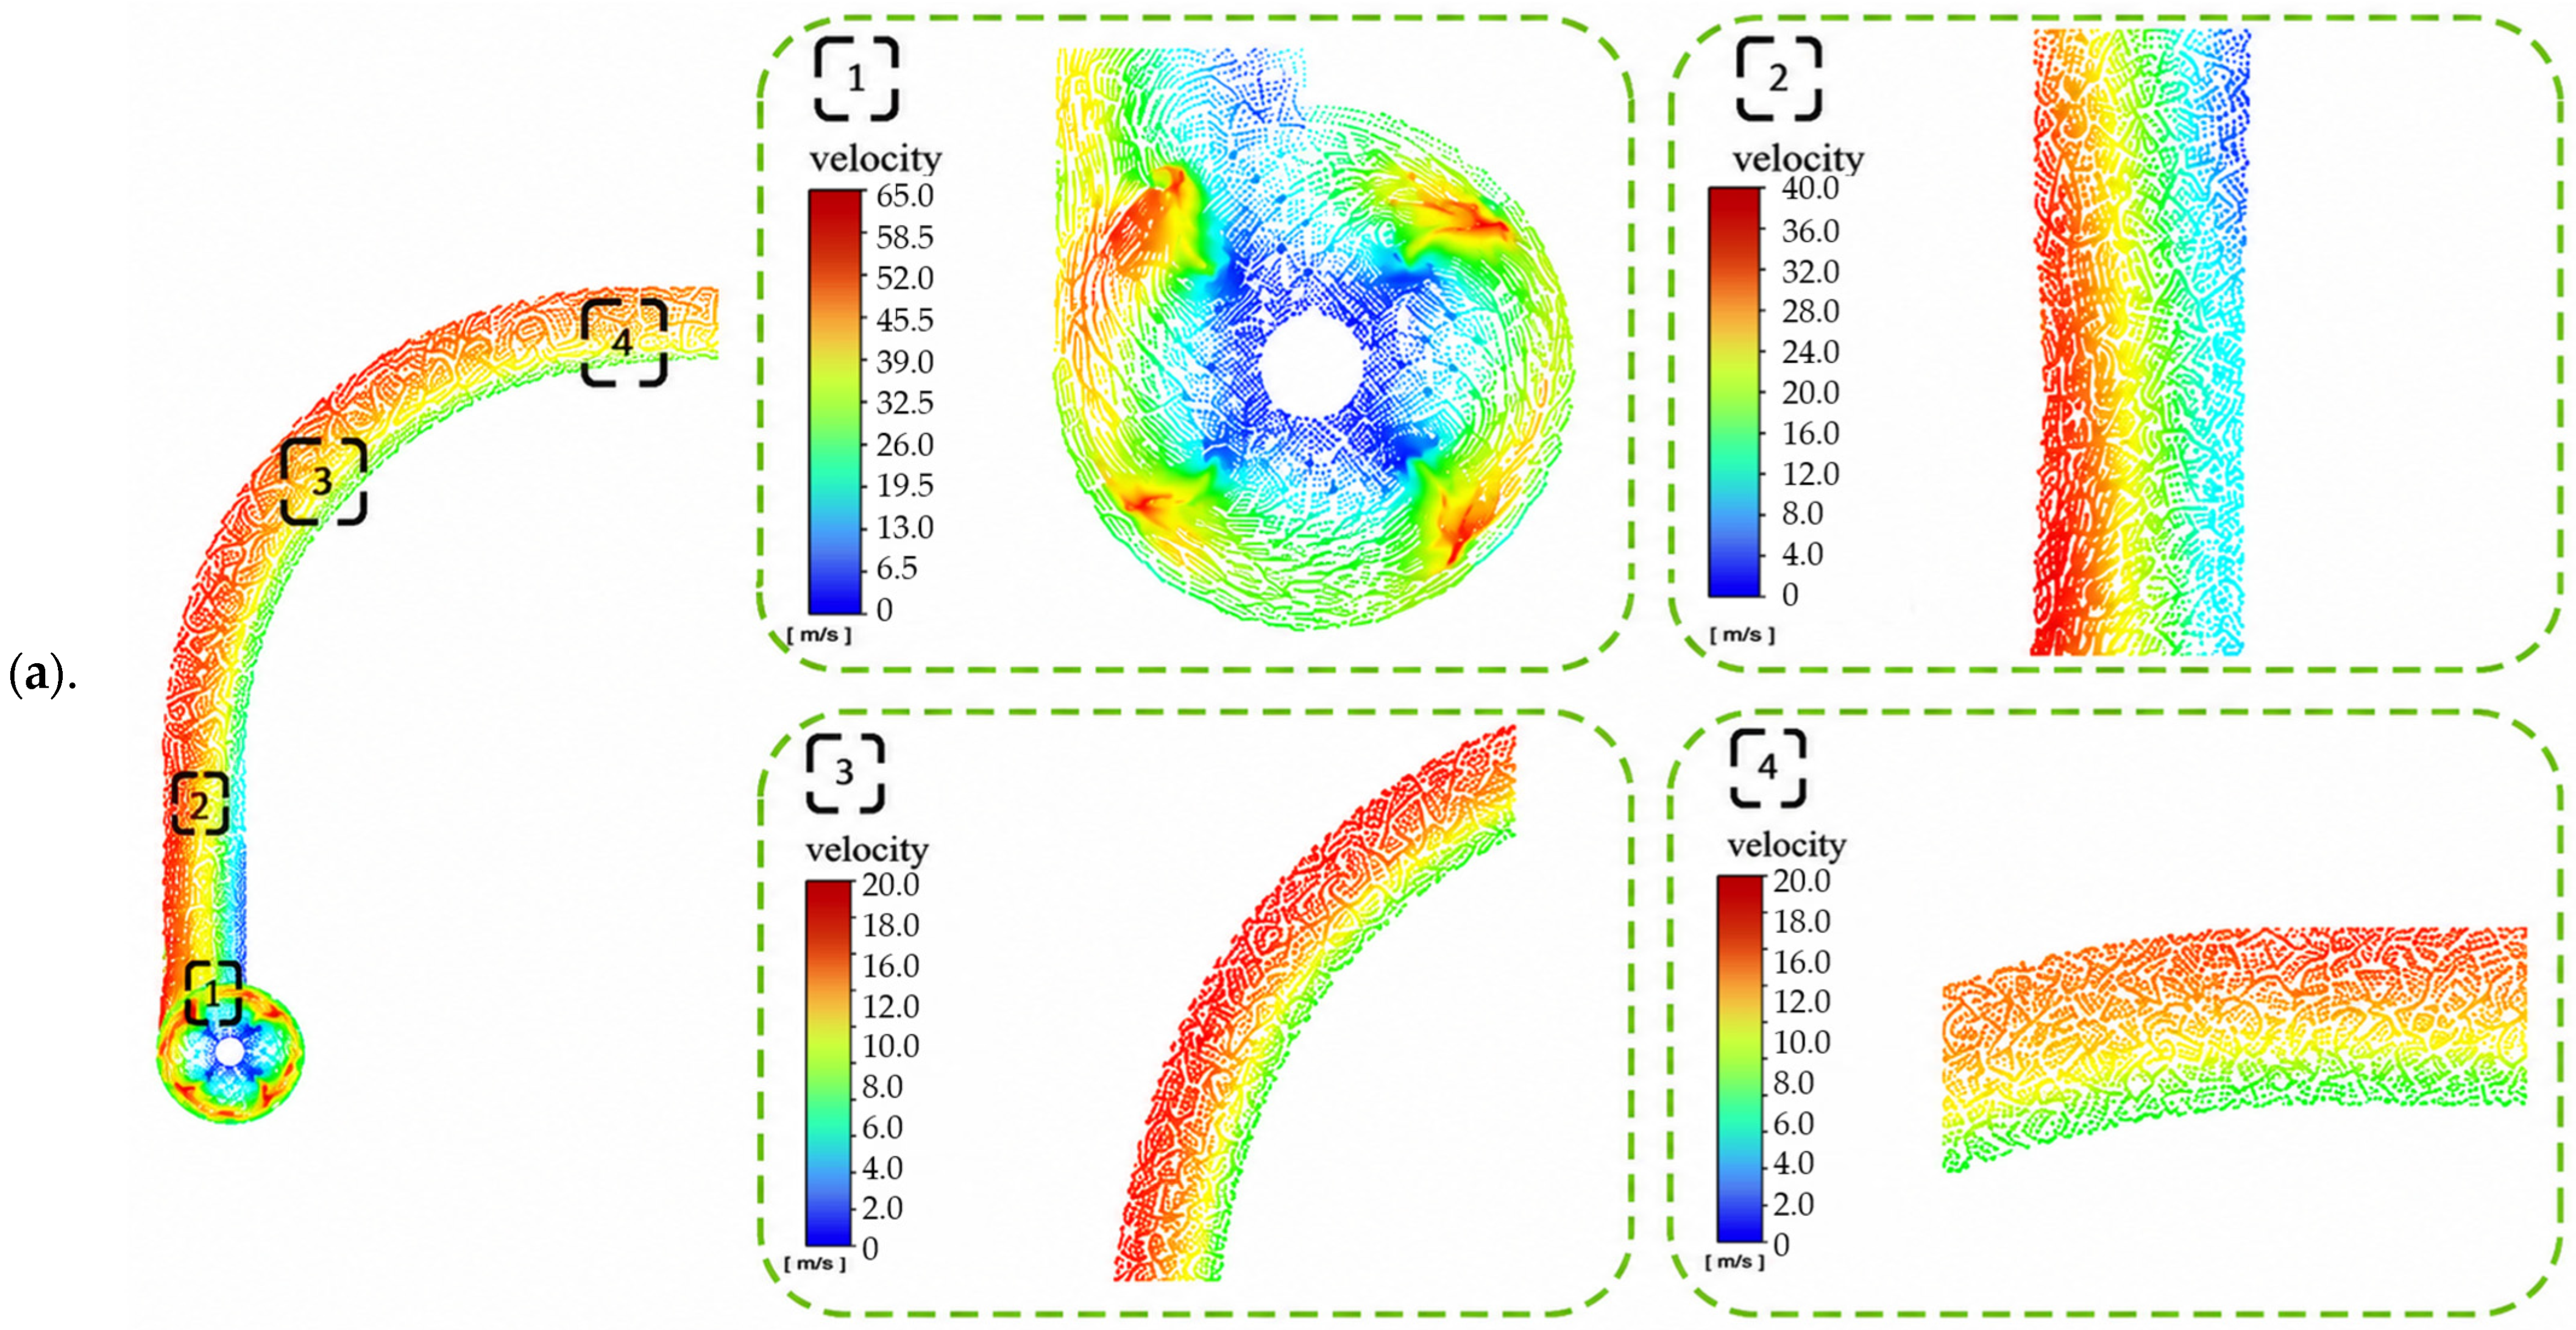
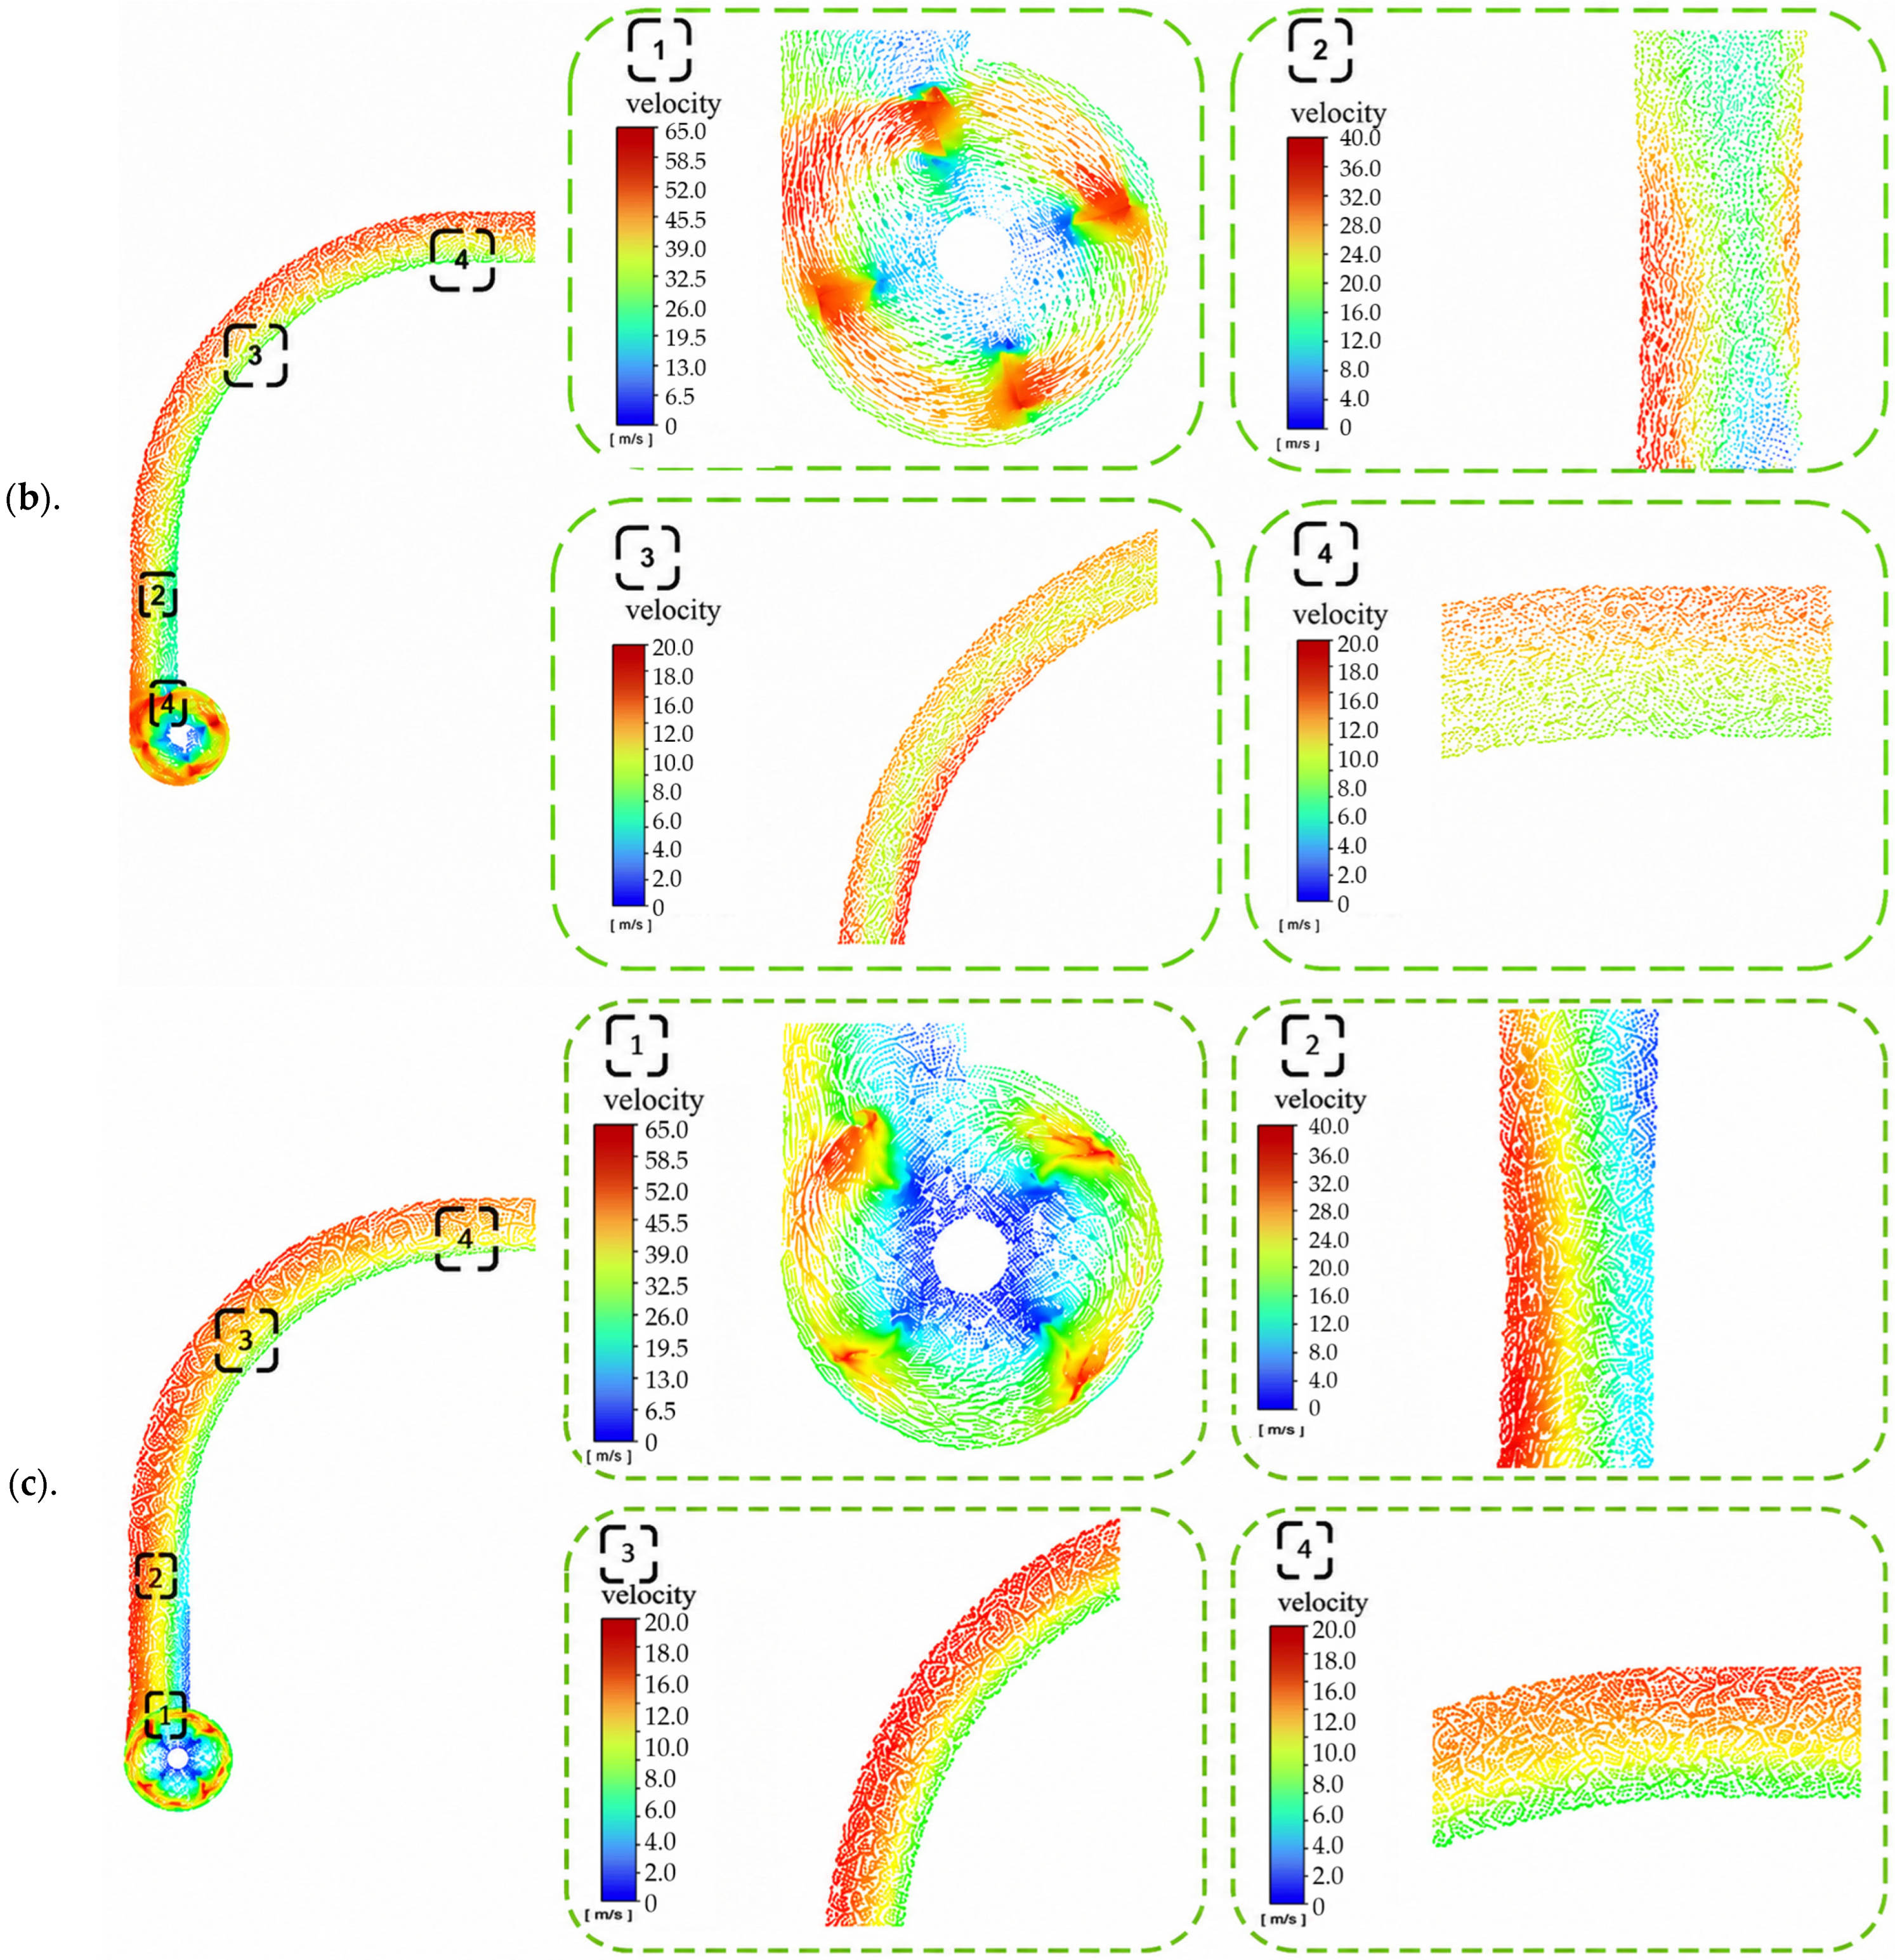
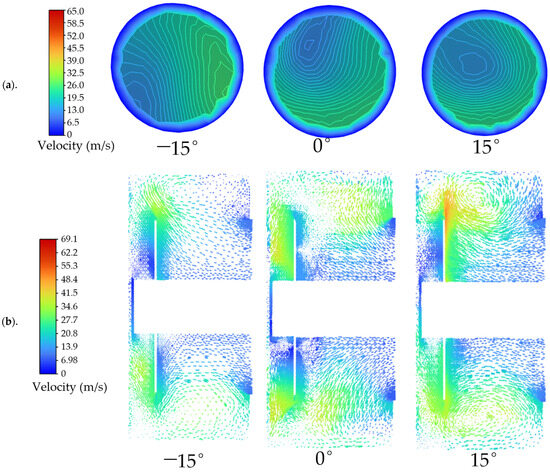
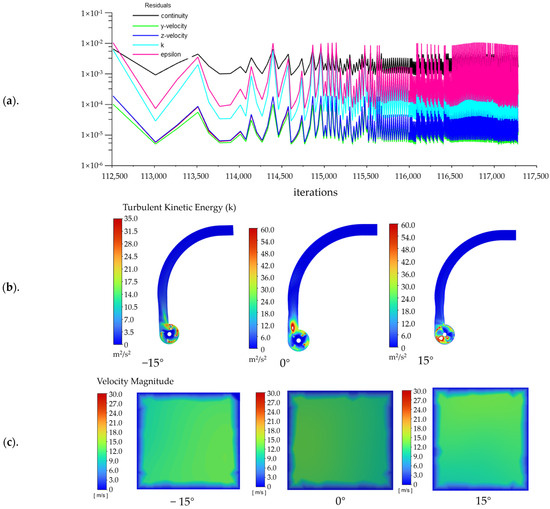
Figure 7 shows that the blade installation angle significantly affects the flow field structure at Plane 1 and the downstream conveying characteristics. With a forward inclination of 15°, small-scale strong vortices and local high-velocity wake regions are generated near the blade root, resulting in obvious flow separation. These unstable structures further develop into biased flow and velocity fluctuations in regions 2 and 3, leading to increased flow field non-uniformity and energy dissipation. When the blade installation angle is 0°, a continuous high-velocity zone forms along the blade sweeping path, and the overall flow symmetry is improved. However, large local velocity gradients still exist. In contrast, the backward 15° blade significantly improves the flow structure. The vortex intensity in the blade region is reduced, and the high-velocity region becomes more uniformly distributed. In addition, the flow transition between the blade region and the inlet of the throwing cylinder becomes smoother. In Regions 2 and 3, the velocity distribution is more uniform and the velocity gradient is reduced, which effectively suppresses biased flow and local fluctuations and enhances the stable conveying performance of straw in the contraction and curved planes [29]. At the outlet plane of region 4, the backward 15° blade shows the smallest velocity difference and effectively suppresses backflow.
Figure 7.
Velocity distribution at Plane 1 under different blade installation angles. (a–c) represent the vector distributions inside Plane 1 of the conveying–throwing device under blade installation angles of −15°, 0°, and 15°, respectively.
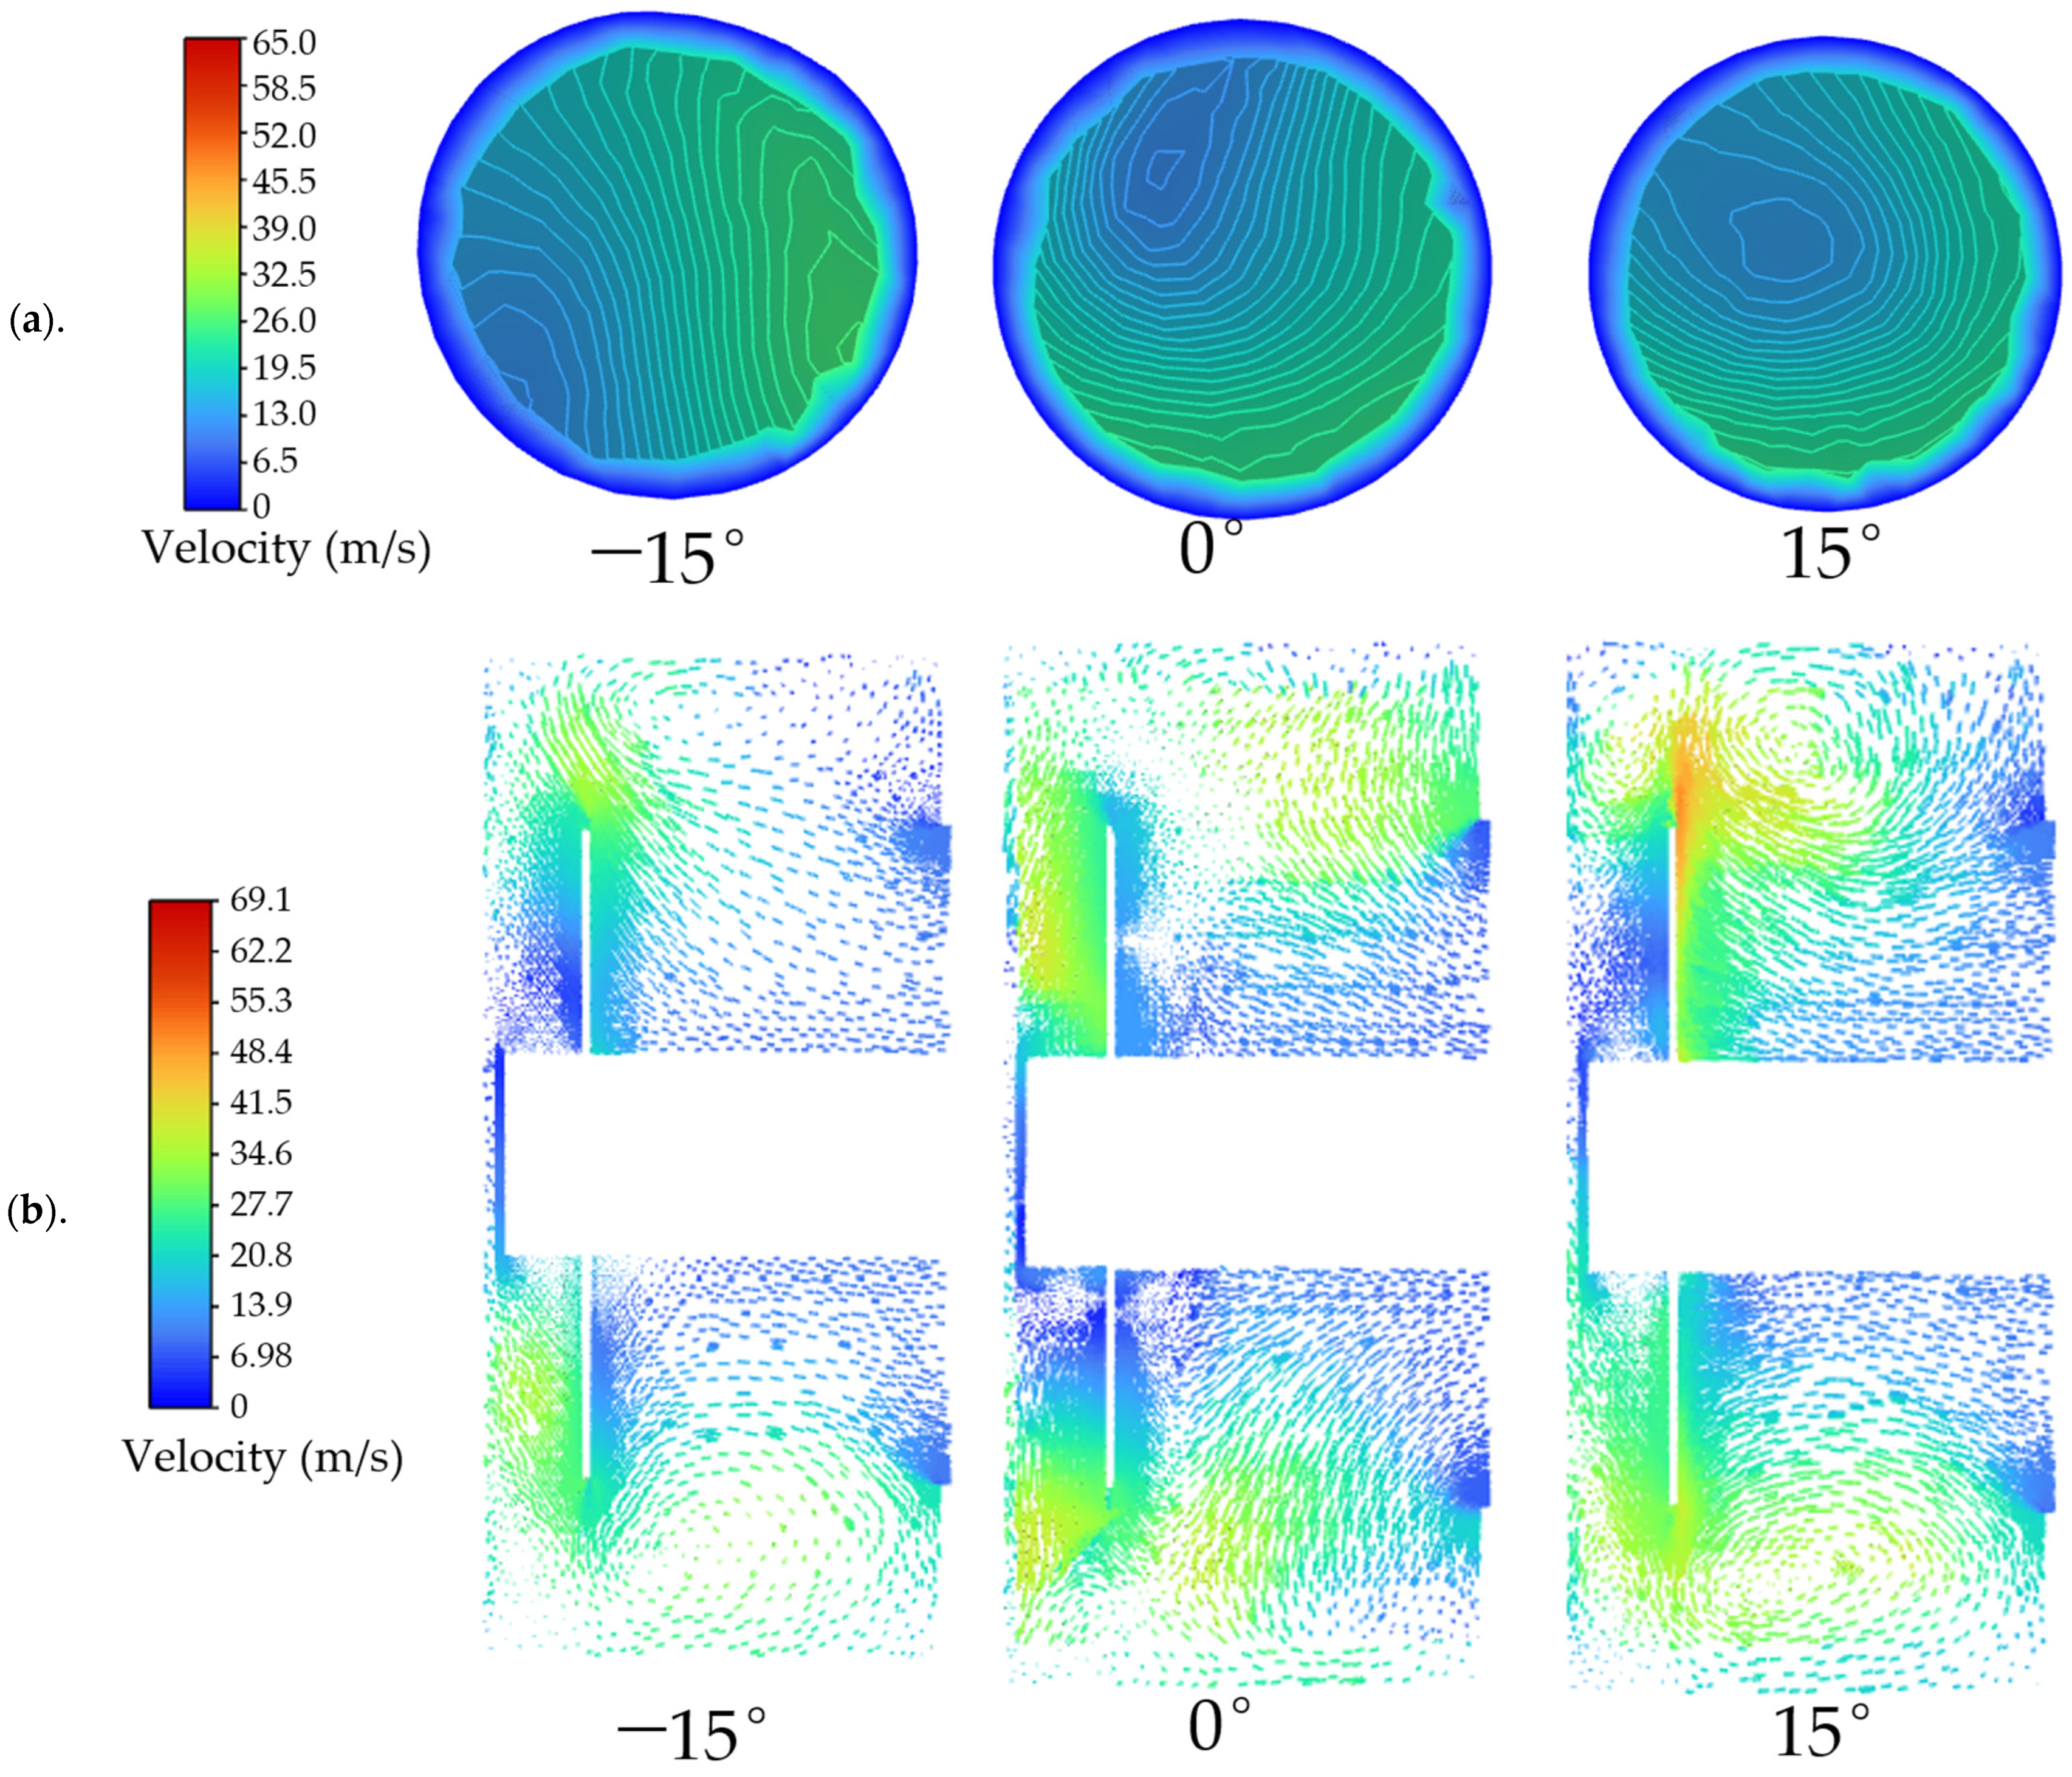
As shown in Figure 8, the blade installation angle markedly affects the flow-field characteristics at Planes 2 and 3. At a forward inclination of 15°, the velocity distribution at Plane 2 is strongly asymmetric, with the high-velocity region concentrated within a limited area, resulting in poor circumferential uniformity. At Plane 3, pronounced backflow and localized vortical structures are observed, indicating intensified flow separation and recirculation. When the blade installation angle is 0°, the flow-field uniformity is improved; however, distinct velocity gradients and weak vortical structures remain. In comparison, at a backward inclination of 15°, the velocity distribution at Plane 2 becomes more uniform, and the high-velocity region extends more continuously along the circumferential direction. Meanwhile, the backflow region at Plane 3 is substantially reduced, the vortical structures are weakened, and the overall flow-field symmetry is improved [30]. These results indicate that the backward 15° configuration promotes a more uniform airflow distribution and suppresses local recirculation, thereby improving airflow momentum transfer and contributing to more stable straw conveying and throwing.
Figure 8.
Velocity distributions at Planes 2 and 3 under different blade installation angles. (a,b) represent the vector distributions inside Planes 1 and 2 of the conveying–throwing device under different blade installation angles, respectively.
3.1.3. Quantitative Characterization of Numerical Stability, Turbulent Kinetic Energy, and Outlet Flow Uniformity
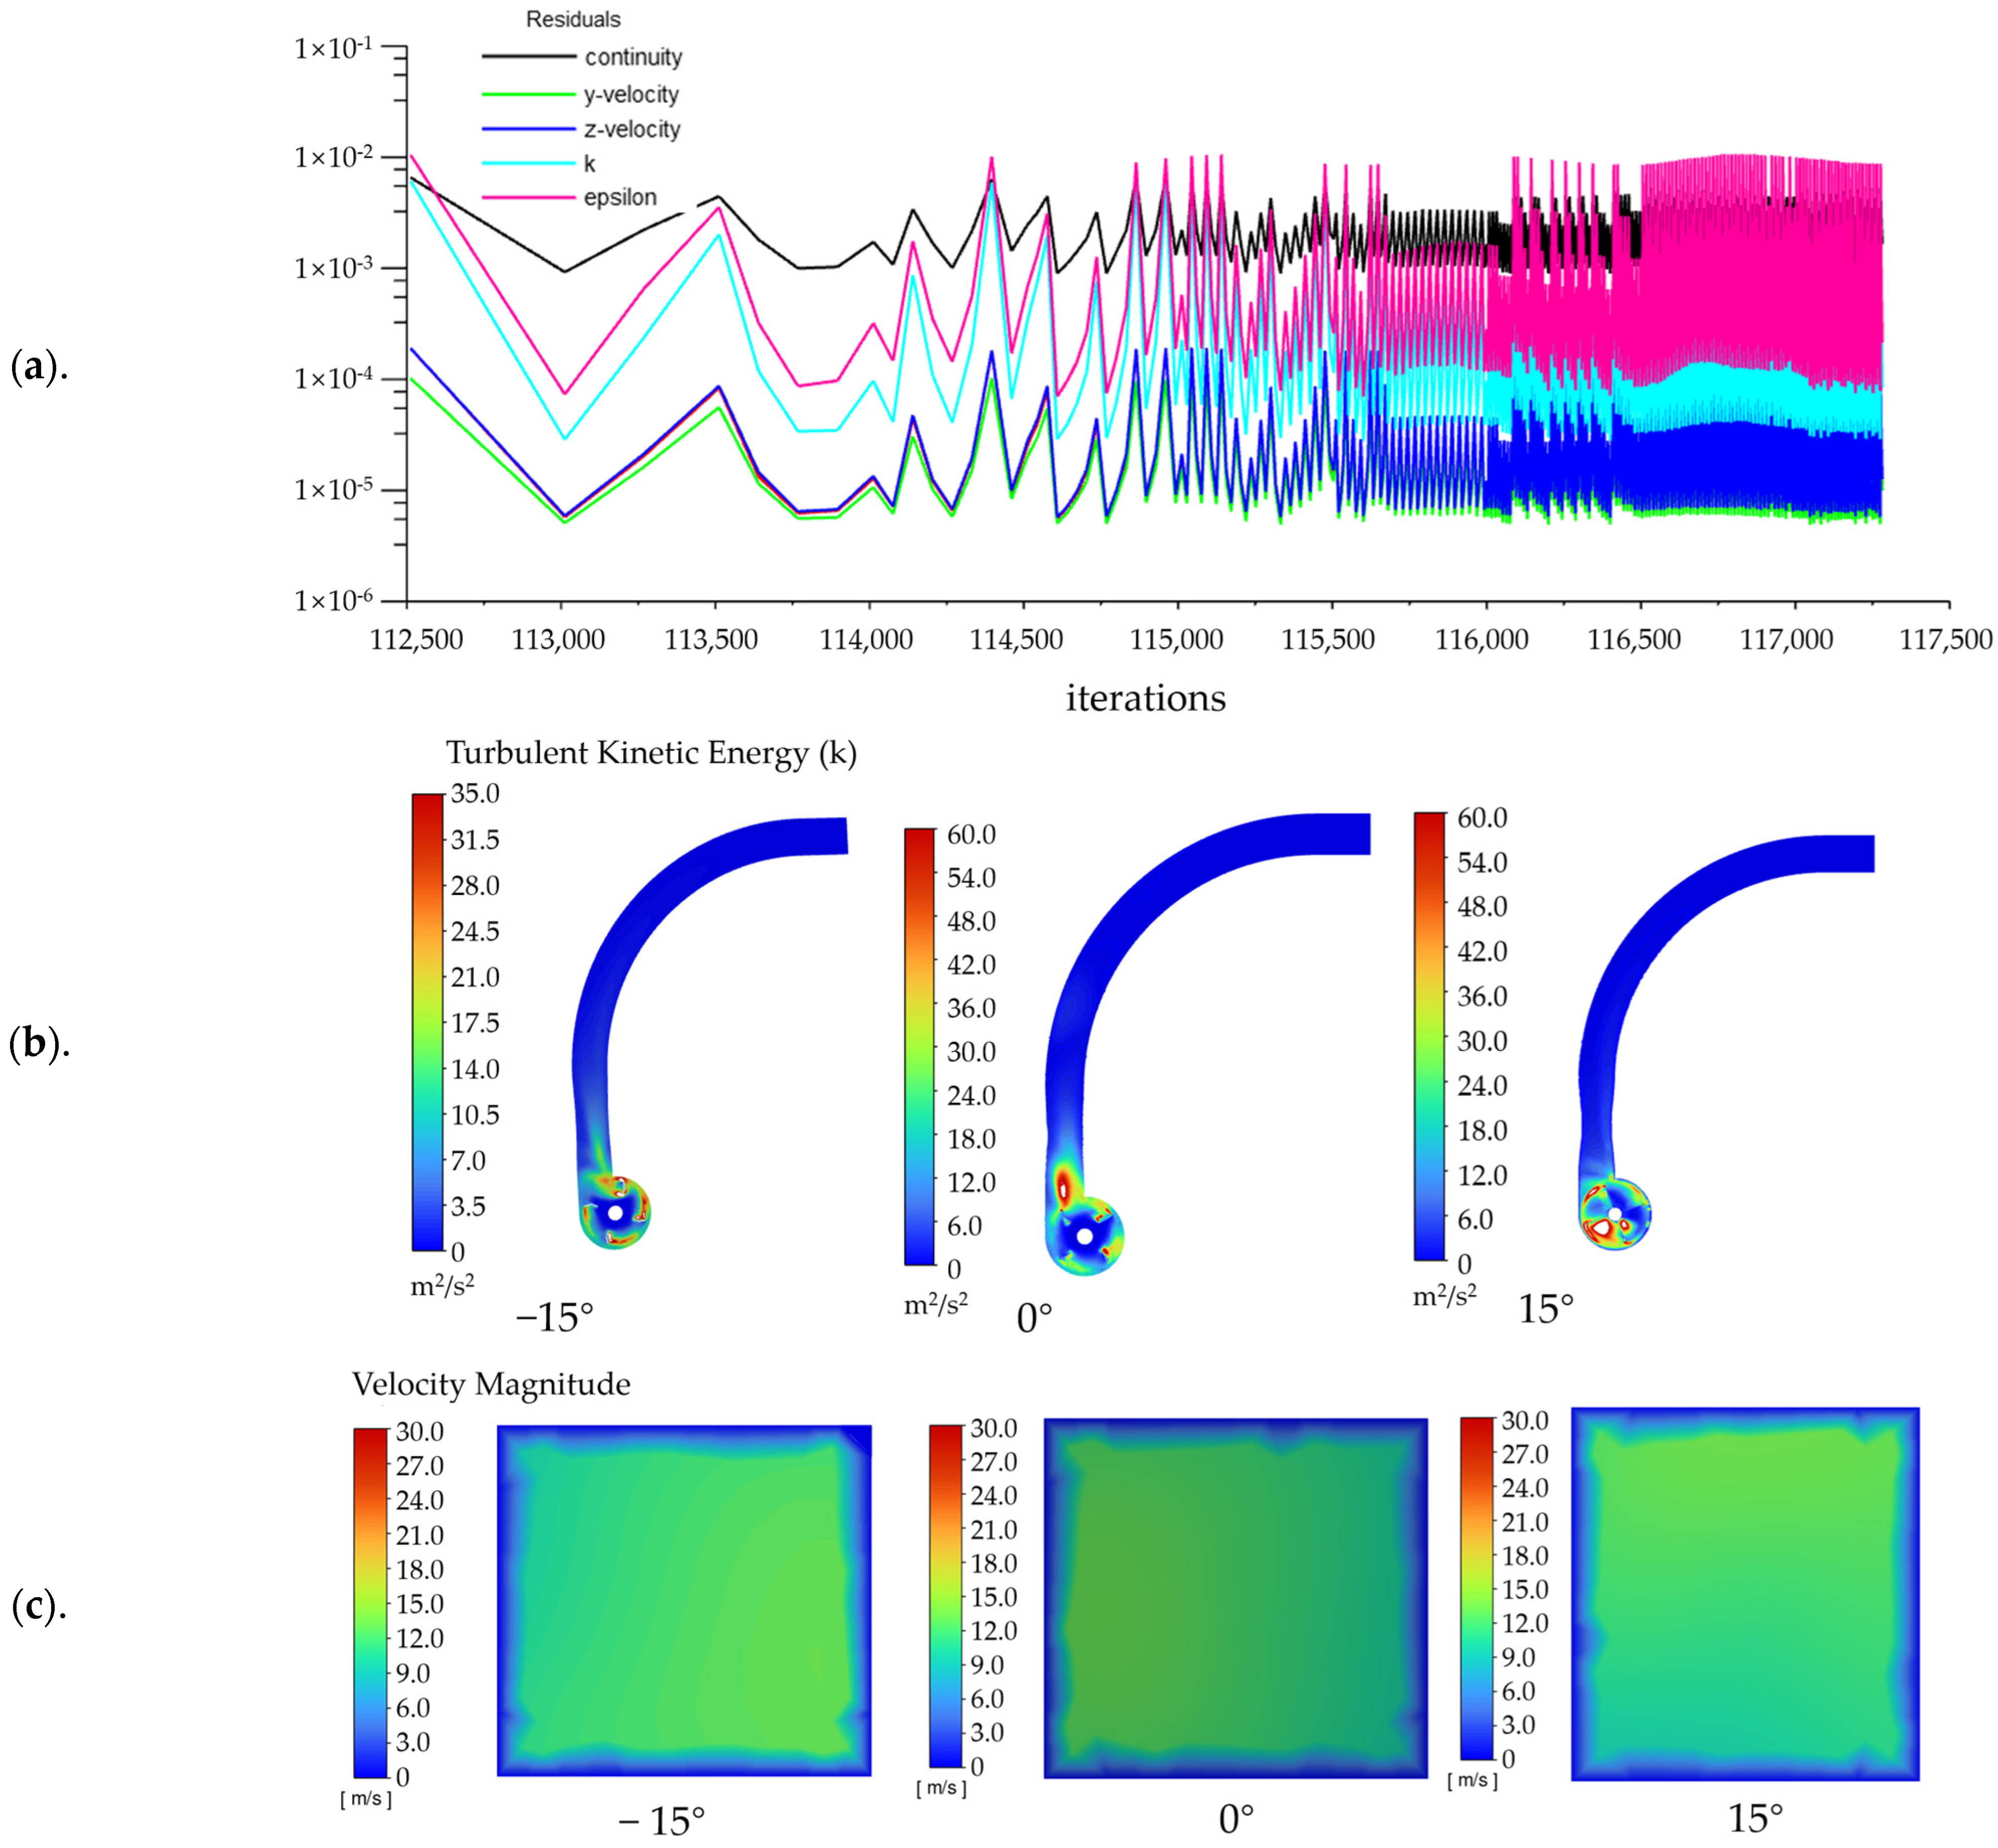
Figure 9 summarizes the numerical convergence, turbulent disturbance intensity, and outlet flow uniformity. As shown in Figure 9a, the residuals decreased rapidly at the initial stage and then entered an oscillatory convergence state owing to the sliding mesh and periodic blade rotation. The continuity residual was mainly maintained at the order of 10−3, the residuals of turbulent kinetic energy k and dissipation rate ε fluctuated within 10−4–10−2, and the velocity residuals remained at 10−5–10−4. No continuous divergence was observed, indicating good numerical stability of the transient simulation. As shown in Figure 9b, the blade installation angle markedly affected the turbulent disturbance inside the device. The average turbulent kinetic energy values for the −15°, 0°, and 15° conditions were 3.28, 4.32, and 4.86 m2/s2, respectively, indicating that the 15° condition provided stronger airflow induction and momentum input. Furthermore, Figure 9c shows that the outlet velocity distribution varied with blade installation angle. The flow uniformity indices calculated from the outlet surface velocity data according to Equation (15) were 0.669, 0.584, and 0.678 for the −15°, 0°, and 15° conditions, respectively. Compared with the 0° condition, the 15° condition produced a more uniform outlet velocity distribution and smaller differences between high- and low-velocity regions, thereby providing more stable airflow support for straw throwing.
where UI is the flow uniformity index, ui is the velocity at the i-th outlet mesh node, and is the mean velocity of all outlet mesh nodes.
Figure 9.
Numerical convergence and flow-field characteristics under different blade installation angles: (a)—residual convergence history; (b)—turbulent kinetic energy distribution; (c)—outlet velocity distribution.
3.1.4. Analysis of Outlet Velocity Distribution Characteristics
As shown in Figure 10, the outlet velocity generally decreases from the upper region to the lower region under different blade installation angles [31]. Under the for-ward 15° and 0° conditions, the velocity distributions in the upper and middle regions are basically symmetric, while obvious asymmetry appears in the lower region, resulting in poor overall flow uniformity and unfavorable straw throwing stability. In contrast, under the backward 15° condition, the velocity in the upper region slightly decreases, while the velocities in the middle and lower regions increase significantly. As a result, the velocity differences among different regions are reduced, and a more uniform velocity distribution is obtained. Moreover, the outlet velocity gradient becomes gentler, and the flow field distribution is more uniform. The difference between local high-velocity and low-velocity regions is effectively weakened. These results indicate that the backward-inclined blade can improve outlet flow field uniformity and reduce flow fluctuations, thereby enhancing the stability and uniformity of straw throwing.
Figure 10.
Outlet velocity distributions under different blade installation angles.
3.2. Effect of the Diversion Plate on Feeding Stability and Conveying Uniformity
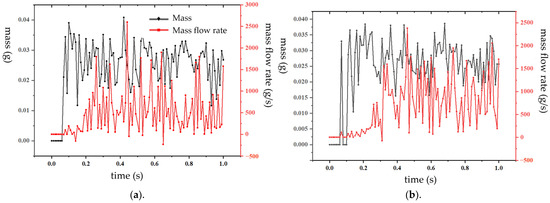
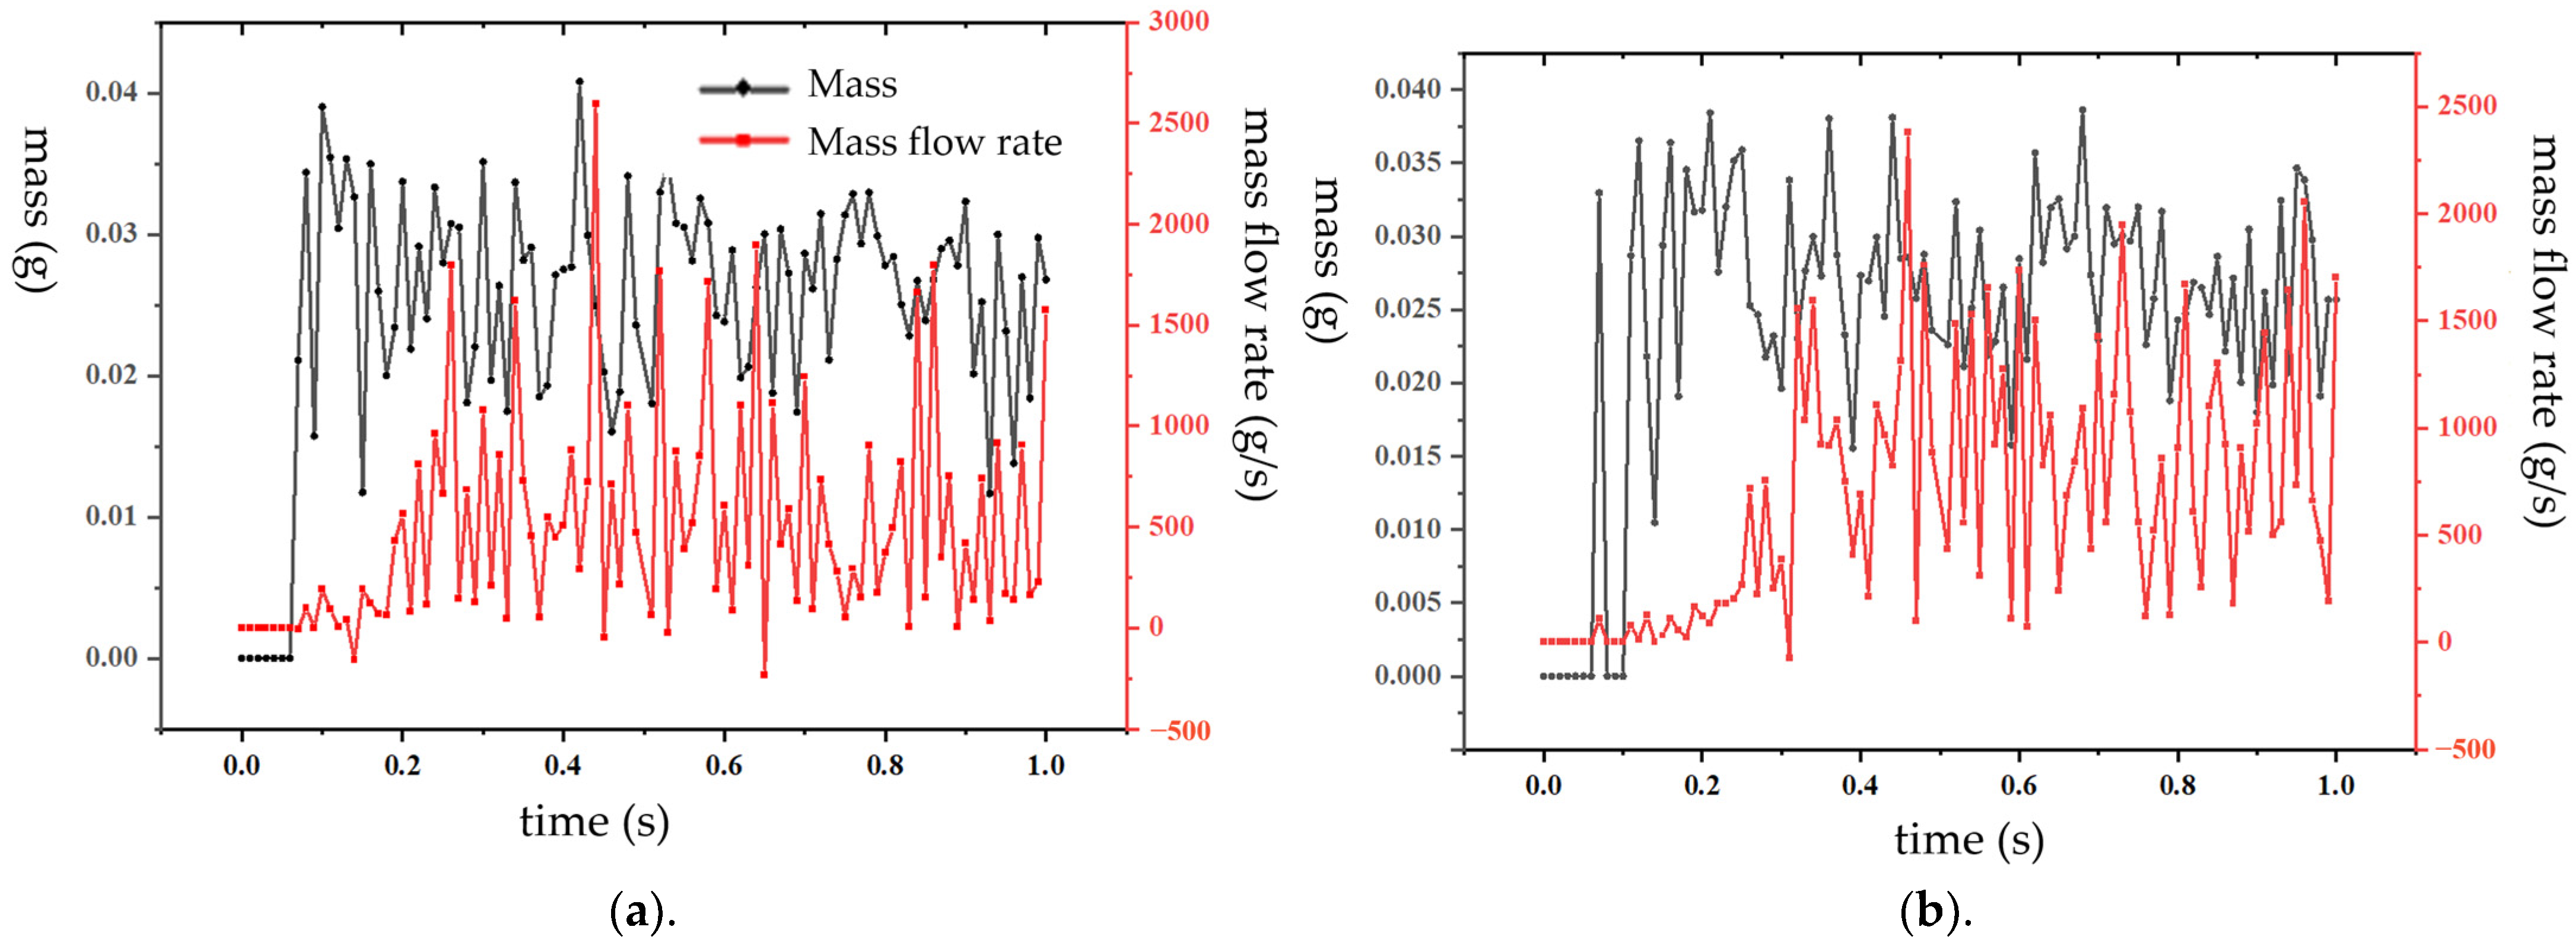
Figure 11a,b present the comparative results of feeding mass and mass flow rate with and without the diversion plate, respectively. Compared with the condition without the diversion plate (Figure 11b), the feeding mass and mass flow rate with the diversion plate (Figure 11a) exhibited smaller fluctuations, more stable variation trends, and more concentrated baseline values. In Figure 11a, the peak-to-valley difference was smaller and the mass flow rate changed more smoothly, indicating better feeding continuity and uniformity. In contrast, Figure 11b showed intensified fluctuations in feeding mass and mass flow rate, with larger peak-to-valley variations and stronger instantaneous flow rate changes, suggesting poorer feeding stability and a greater tendency toward feeding disturbances and non-uniformity. Overall, the diversion plate effectively improved material distribution and conveying stability, thereby enhancing feeding uniformity.
Figure 11.
Comparative analysis with and without the diversion plate: (a)—with diversion plate; (b)—without diversion plate.
3.3. Analysis of Experimental Results
The experimental design was based on the Box–Behnken response surface method. Compared with the central composite design, this method provides higher experimental efficiency and is more suitable for three-factor optimization studies. A total of 17 experimental runs were conducted, including 12 factorial points and 5 center points. The center points were used to estimate experimental error and evaluate model stability [32]. The experimental results of the straw conveying and throwing device are presented in Table 3.
Table 3.
Results of the orthogonal experimental tests.
Regression analysis was performed using Design-Expert 13 software. Polynomial regression models were established for the two response variables with A, B, and C as independent variables. The significance of each factor was analyzed, and response surface methodology was further applied for optimization analysis.
3.3.1. Significance Analysis of Throwing Distance
According to the ANOVA results in Table 4, the regression model for throwing distance Y1 was highly significant, with a p-value less than 0.0001. Among the linear terms, A and C had highly significant effects on throwing distance, whereas B was not significant. The interaction terms AB, AC, and BC were all insignificant, while the quadratic terms A2, B2, and C2 were highly significant, indicating strong nonlinear relationships between the factors and throwing distance. The influence order of the factors was A > C > B. The lack-of-fit test showed a sum of squares of 0.0281, a mean square of 0.0094, an F-value of 1.71, and a p-value of 0.3019, indicating that the lack of fit was not significant. The model showed good fitting and predictive accuracy, with R2, adjusted R2, and predicted R2 values of 0.9931, 0.9843, and 0.9334, respectively. In addition, the coefficient of variation was only 1.13%, and the adequate precision was 31.56, further confirming the reliability and applicability of the regression model. The regression equation for throwing distance can be expressed as:
Table 4.
Analysis of variance (ANOVA) for the regression model of throwing distance (Y1).
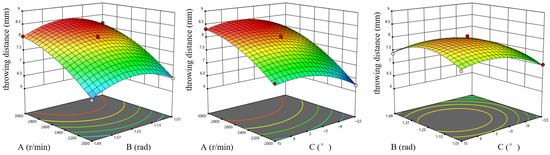
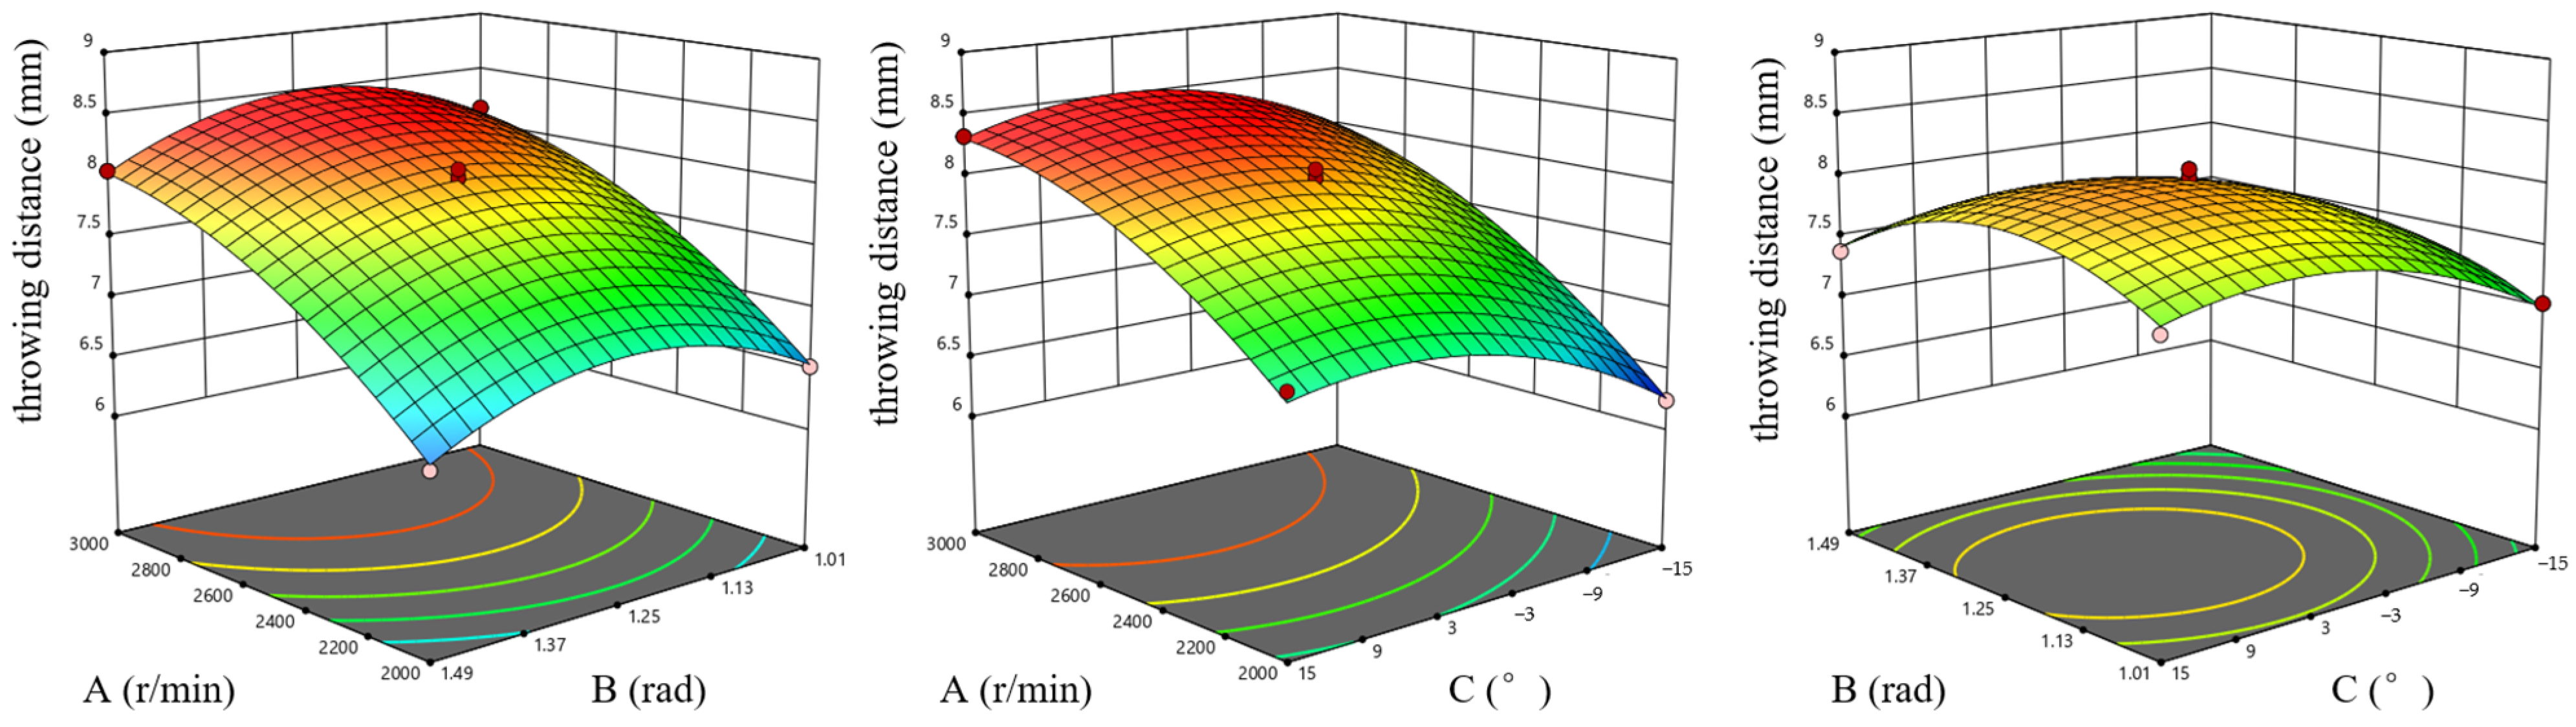
As shown in Figure 12, different factors exhibited distinct effects on throwing distance. Increasing A significantly extended the throwing distance, while B and C both initially increased and then stabilized or decreased. Overall, rotational speed was the dominant factor, the diversion plate angle exhibited an optimal range, and the blade installation angle showed a saturation effect. Mechanistically, higher rotational speed enhanced the initial kinetic energy and centrifugal acceleration of straw, thereby increasing throwing velocity. An appropriate diversion plate angle improved flow guidance and axial acceleration, whereas excessive angles increased collision losses. A moderate backward blade inclination enhanced axial conveying capacity, while excessive inclination weakened the improvement in throwing performance.
Figure 12.
Effects of interaction factors on throwing distance.
3.3.2. Significance Analysis of Throwing Stability
According to the ANOVA results in Table 5, the regression model for throwing stability Y2 was highly significant, with an F-value of 107.42 and a p-value less than 0.0001. Among the linear terms, B had a highly significant effect on throwing stability, C had a significant effect, whereas A was not significant. The interaction terms AB, AC, and BC were not significant, while the quadratic terms A2, B2, and C2 were all highly significant, indicating strong nonlinear relationships between the factors and throwing stability, with C2 showing the greatest effect. The influence order of the factors was B > C > A. The lack-of-fit test showed a sum of squares of 0.1725, a mean square of 0.0575, an F-value of 0.2186, and a p-value of 0.8790, indicating that the lack of fit was not significant. The model exhibited good fitting and predictive accuracy, with R2, adjusted R2, and predicted R2 values of 0.9928, 0.9836, and 0.9741, respectively. In addition, the coefficient of variation was 2.12%, and the adequate precision was 28.64, further confirming the reliability and applicability of the regression model. The regression equation for throwing stability can be expressed as:
Table 5.
Analysis of variance (ANOVA) for the regression model of throwing stability (Y2).
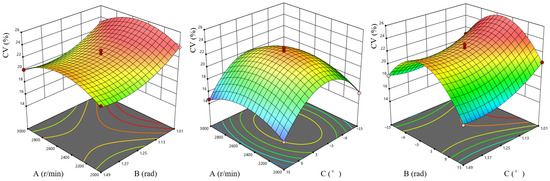
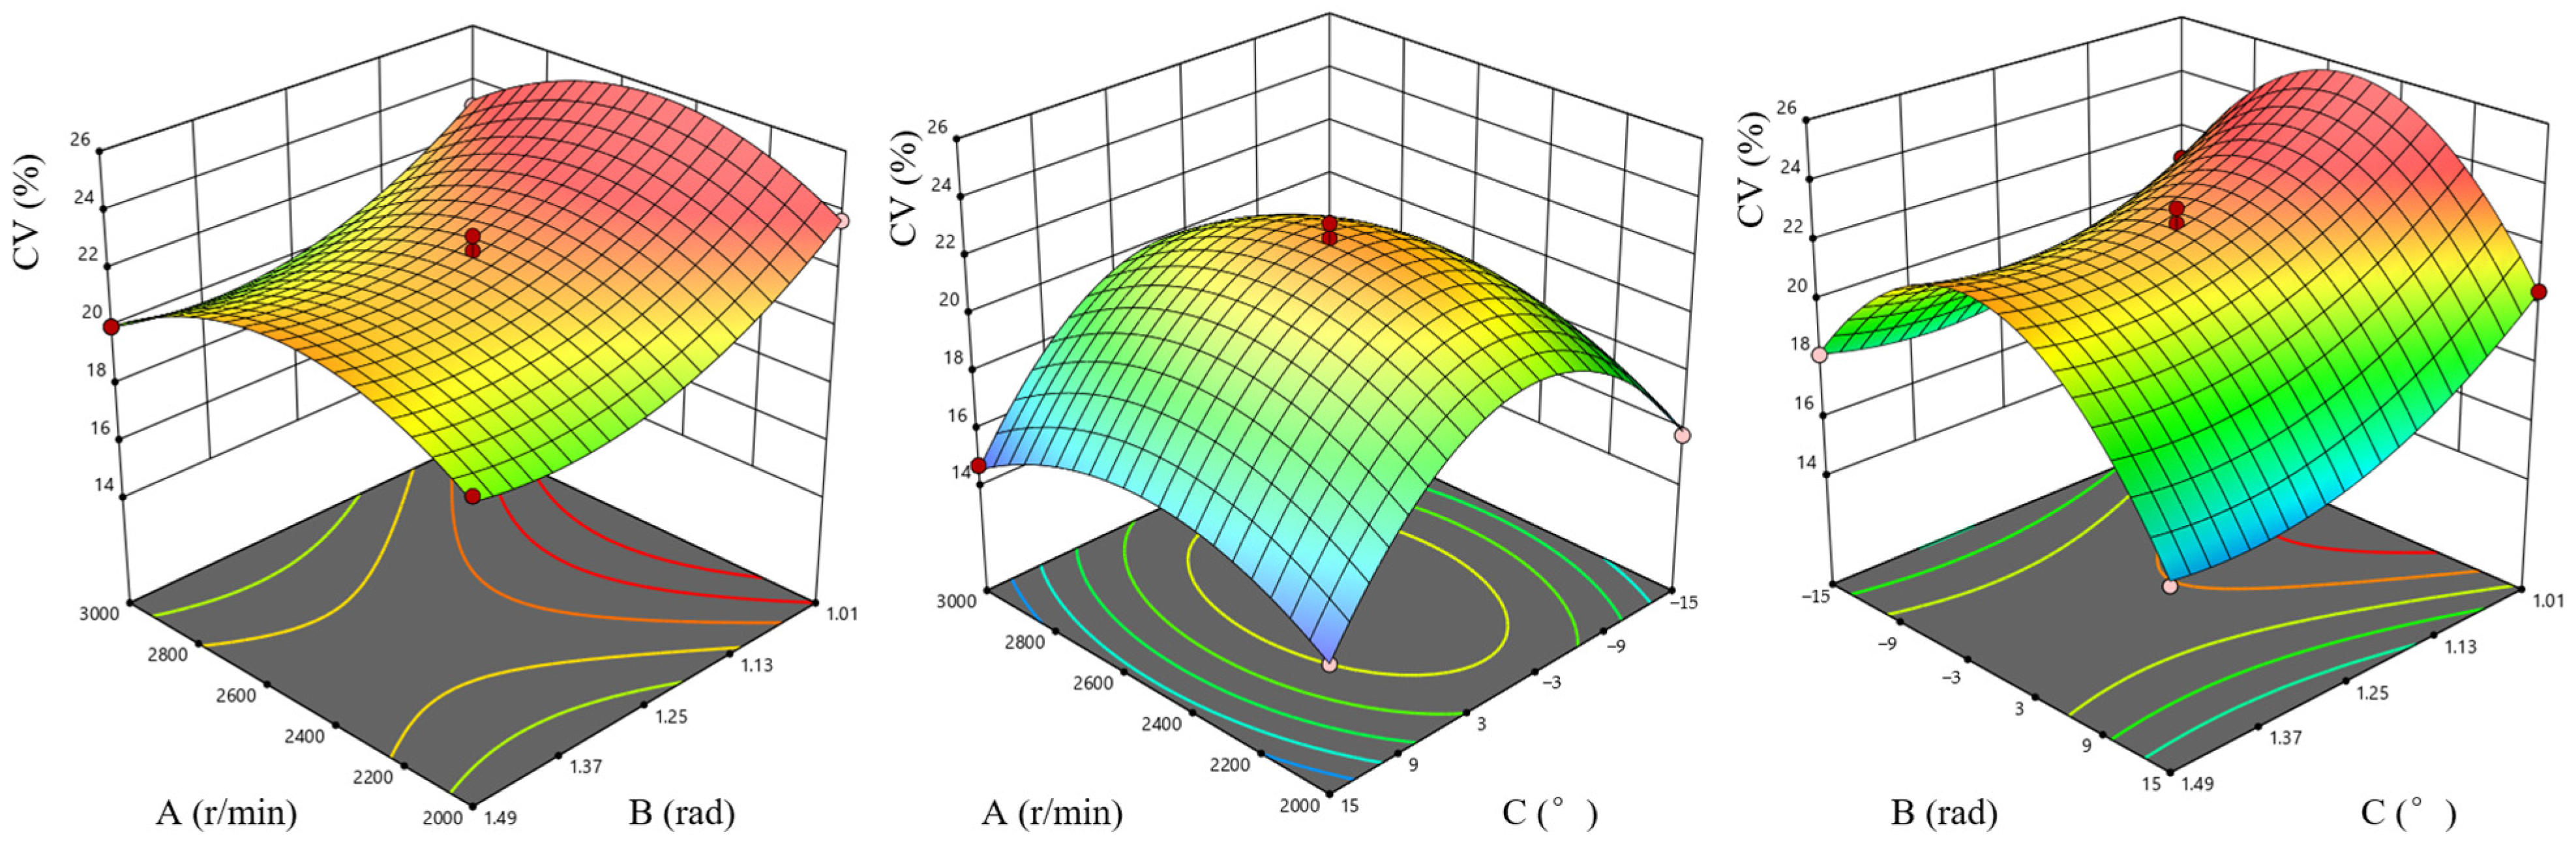
As shown in Figure 13, different factors have significant effects on throwing stability (CV). With the increase in A and C, the CV first increases and then decreases. In contrast, the CV continuously decreases with the increase in B, indicating a continuous improvement in throwing stability. Overall, rotational speed and blade installation angle exhibit obvious nonlinear effects, while the diversion plate angle continuously improves stability. From the mechanism perspective, under low rotational speed conditions, the airflow intensity is insufficient, and straw motion is easily disturbed by gravity and random collisions, resulting in large throwing fluctuations. As the rotational speed increases, the flow field gradually stabilizes, and the straw motion trajectory becomes more regular, thereby reducing the CV value. Increasing the diversion plate angle improves the axial velocity component and spatial distribution of straw, reduces lateral diffusion and local accumulation, and enhances feeding stability. The blade installation angle affects throwing uniformity by regulating the force condition and detachment behavior of straw particles. An appropriate backward inclination promotes stable straw acceleration and reduces velocity dispersion, thereby improving throwing stability.
Figure 13.
Effects of interaction factors on throwing stability.
3.3.3. Model Adequacy and Diagnostic Analysis
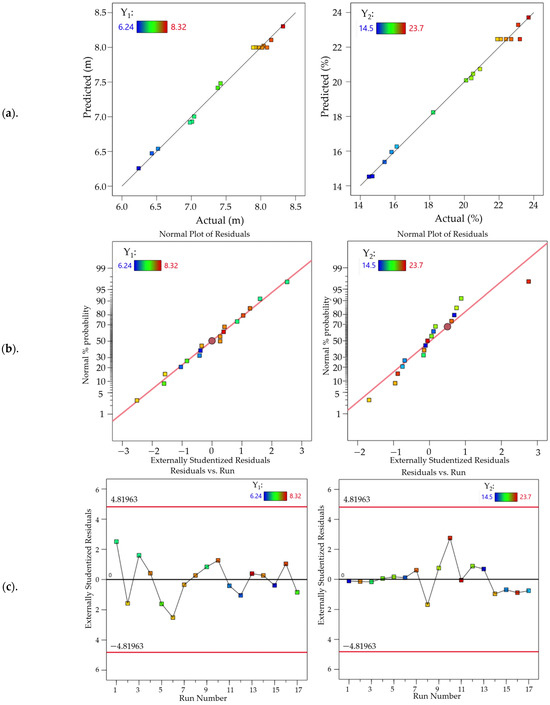
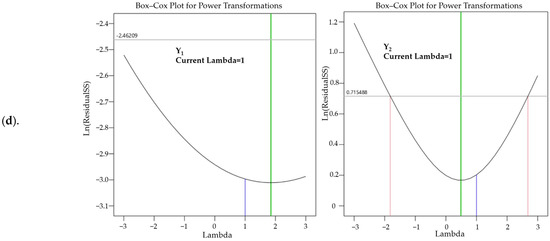
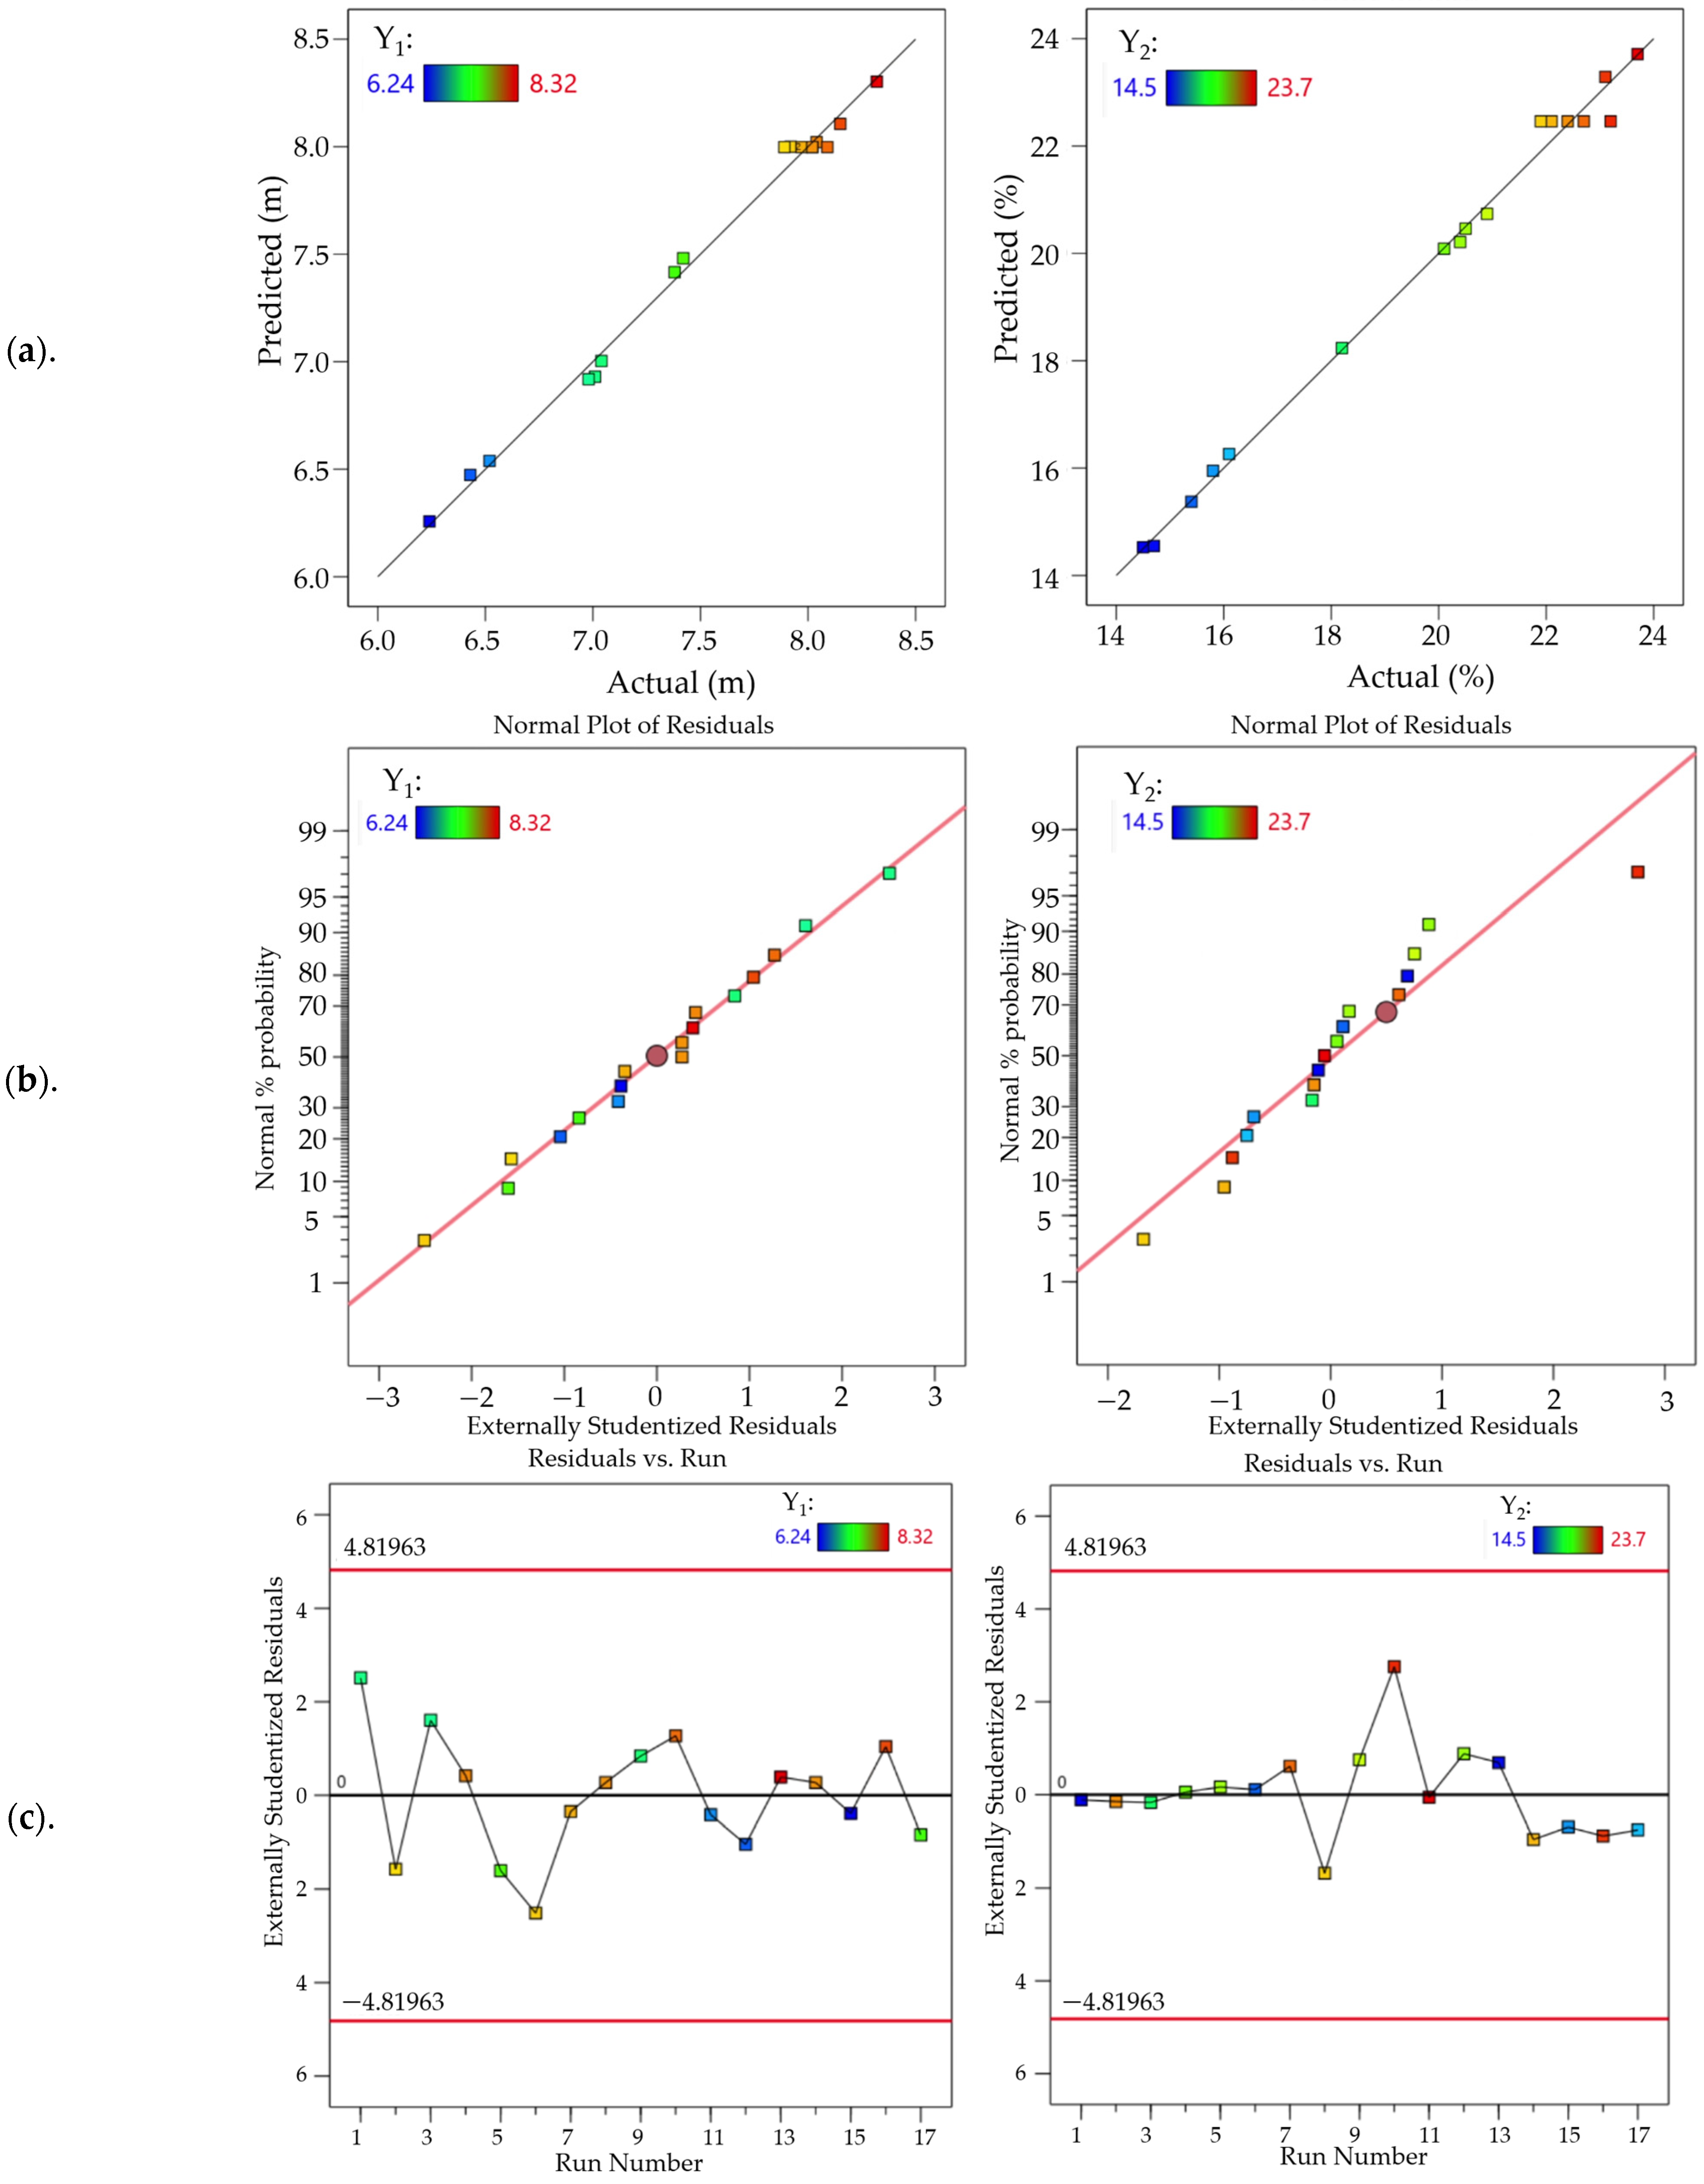
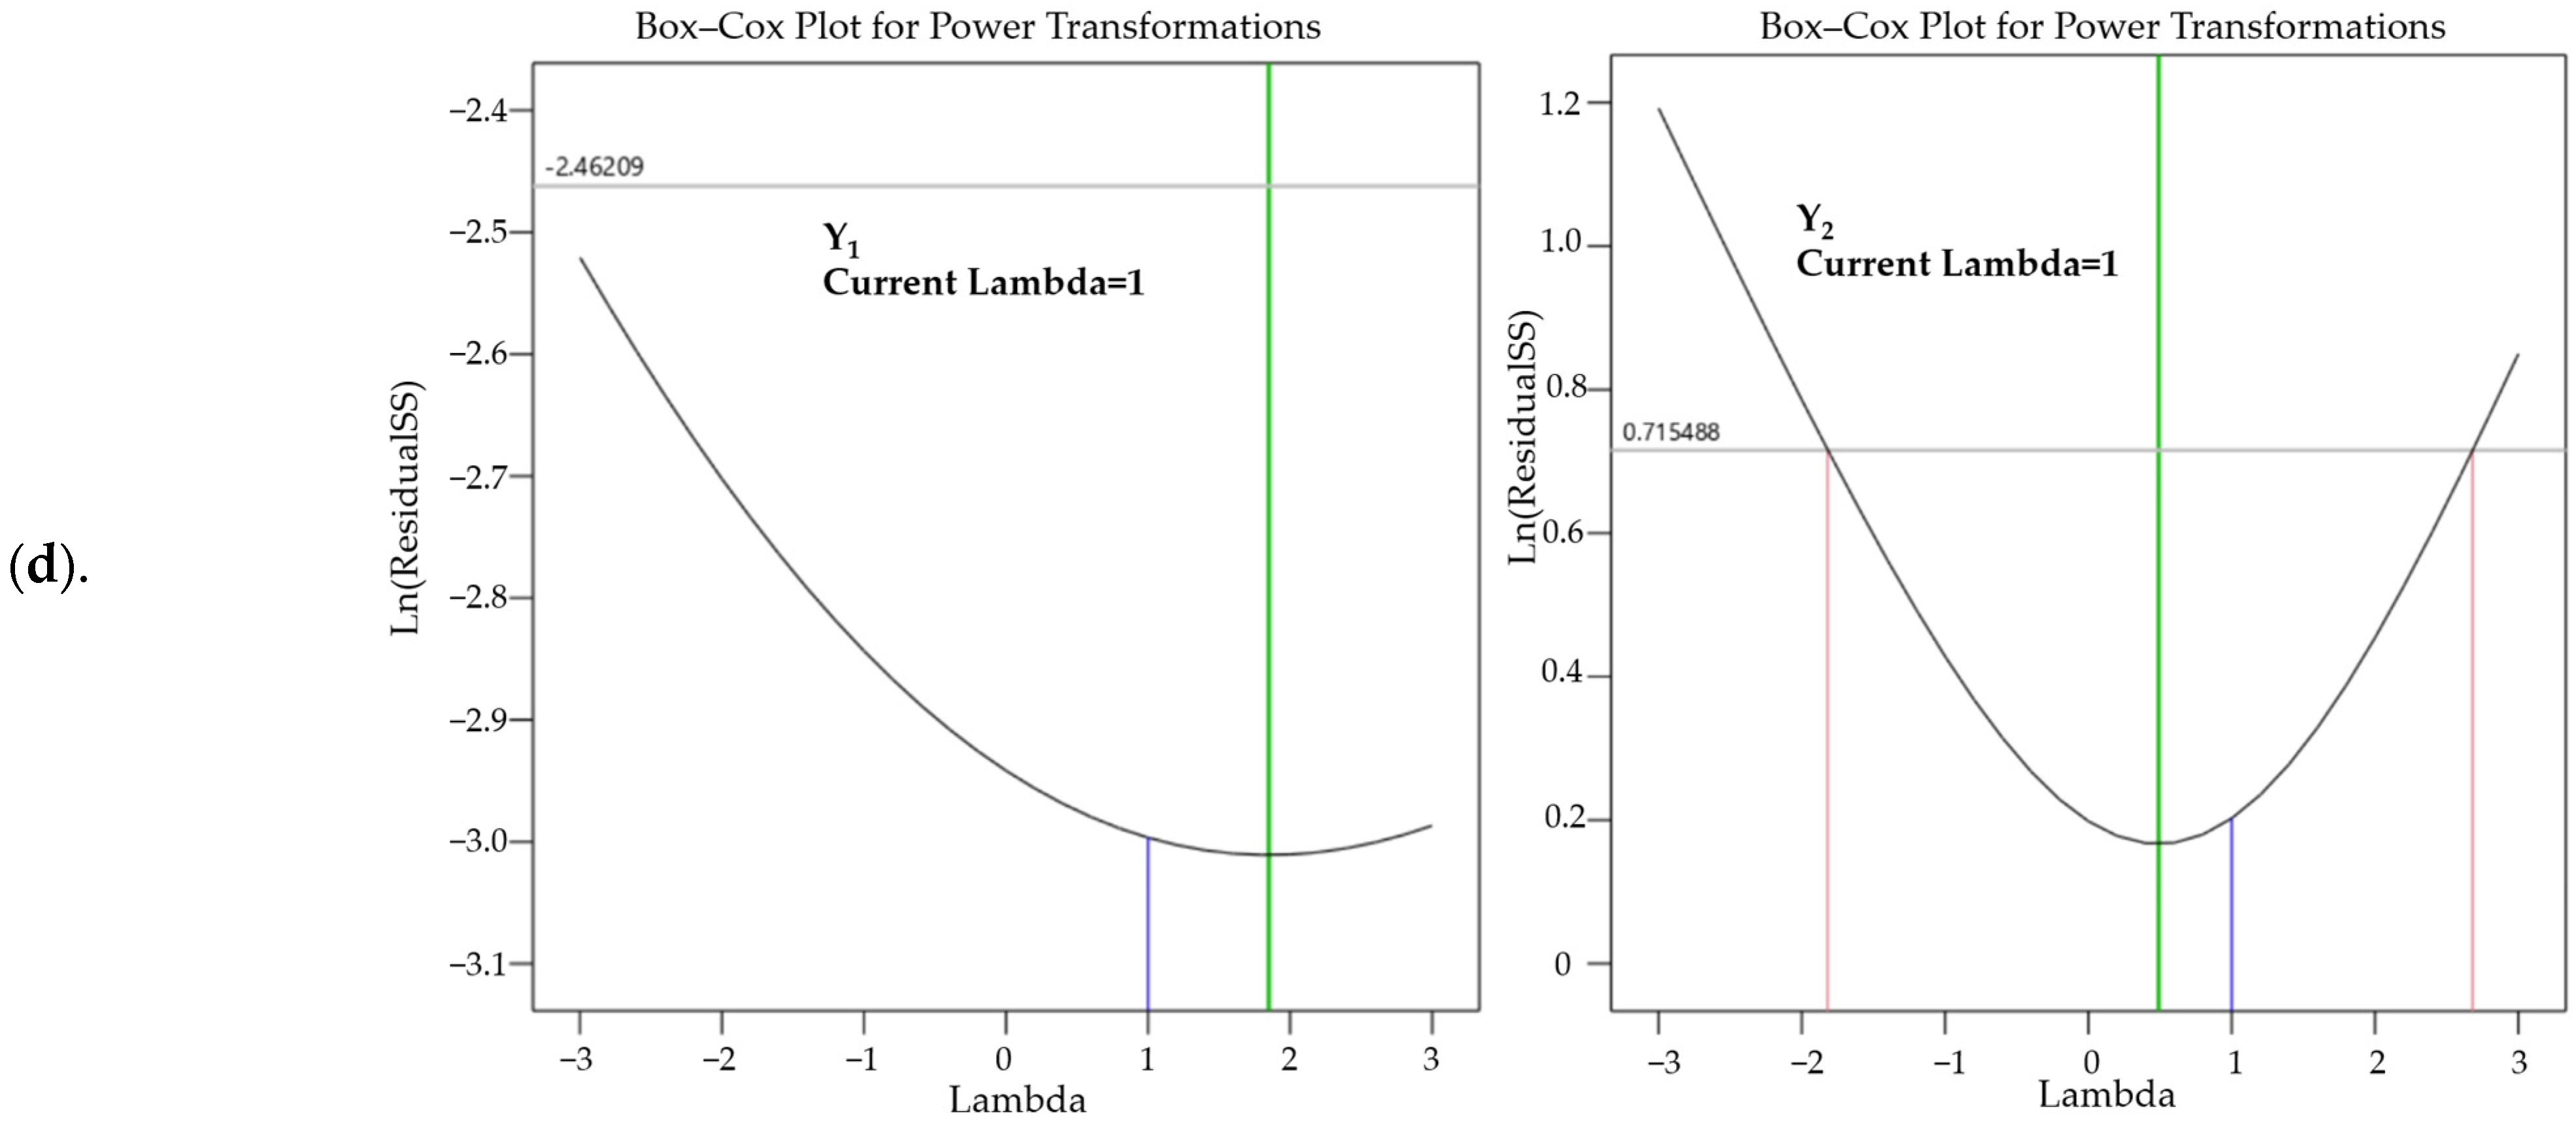
Figure 14 presents the diagnostic analysis of the response surface models established for throwing distance (Y1) and the coefficient of variation in straw distribution (Y2). As shown in Figure 14a, the predicted values of both responses were distributed close to the 1:1 reference line, indicating good agreement between the model predictions and the experimental observations, with no obvious systematic bias. The Y1 data points were more closely clustered around the reference line, whereas Y2 showed slightly greater dispersion at the higher response range, but the overall predictive performance remained satisfactory. The normal probability plots of externally studentized residuals in Figure 14b show that the residuals generally followed a straight-line trend, indicating that the normality assumption was reasonably satisfied. Although a slight deviation was observed for Y2 at the upper tail, the overall distribution remained acceptable. As shown in Figure 14c, the externally studentized residuals of both responses fluctuated randomly around zero and all points were within the control limits of ±4.81963, with no obvious trend, clustering, or funnel-shaped pattern. This indicates that the residuals were independent and that the variance was relatively stable, with no significant outliers. The Box–Cox diagnostic plots in Figure 14d further show that the optimal transformation parameters were close to the current response forms. In particular, the current value of λ = 1 for Y2 remained within the acceptable interval, indicating that no mandatory power transformation was required. Overall, the predicted-versus-actual comparison, residual normality analysis, residual randomness, and Box–Cox diagnostics collectively demonstrate that the developed quadratic regression models have good fitting accuracy, stable residual characteristics, and reliable predictive capability for subsequent optimization analysis.
Figure 14.
Diagnostic analysis of the response surface models for throwing distance and straw distribution uniformity: (a) predicted versus actual values; (b) normal probability plots of externally studentized residuals; (c) externally studentized residuals versus run number; and (d) Box–Cox plots for power transformations. The left and right panels correspond to throwing distance (Y1) and the coefficient of variation in straw distribution (Y2), respectively.
3.4. Parameter Optimization
To determine the parameter combination that simultaneously improves the straw throwing distance and throwing uniformity, a multi-objective numerical optimization was conducted. Blade rotational speed A (r/min), diversion plate angle B (rad), and blade installation angle C (°) were selected as the optimization variables. Throwing distance Y1 (m) and the coefficient of variation in straw distribution Y2 (%) were selected as the response variables. A larger Y1 indicates a greater throwing distance, whereas a smaller Y2 indicates a more uniform straw distribution and better throwing stability. Therefore, the optimization objectives were defined as maximizing y1 and minimizing y2. The ranges of the optimization variables were constrained according to the experimental factor levels. Based on the fitted regression models, the multi-objective optimization model was established as follows:
Based on the fitted response surface models, the Optimization function in Design–Expert 13 was used to determine the optimal parameter combination. The optimal solution consisted of a blade rotational speed of 2500 r/min, a diversion plate angle of 1.25 rad, and a backward blade installation angle of 15°. Under these conditions, the predicted throwing distance was 7.89 m, and the predicted coefficient of variation for throwing stability was 14.6%.
3.5. Validation Experiment
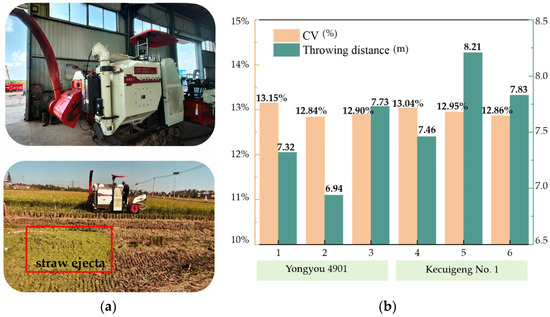
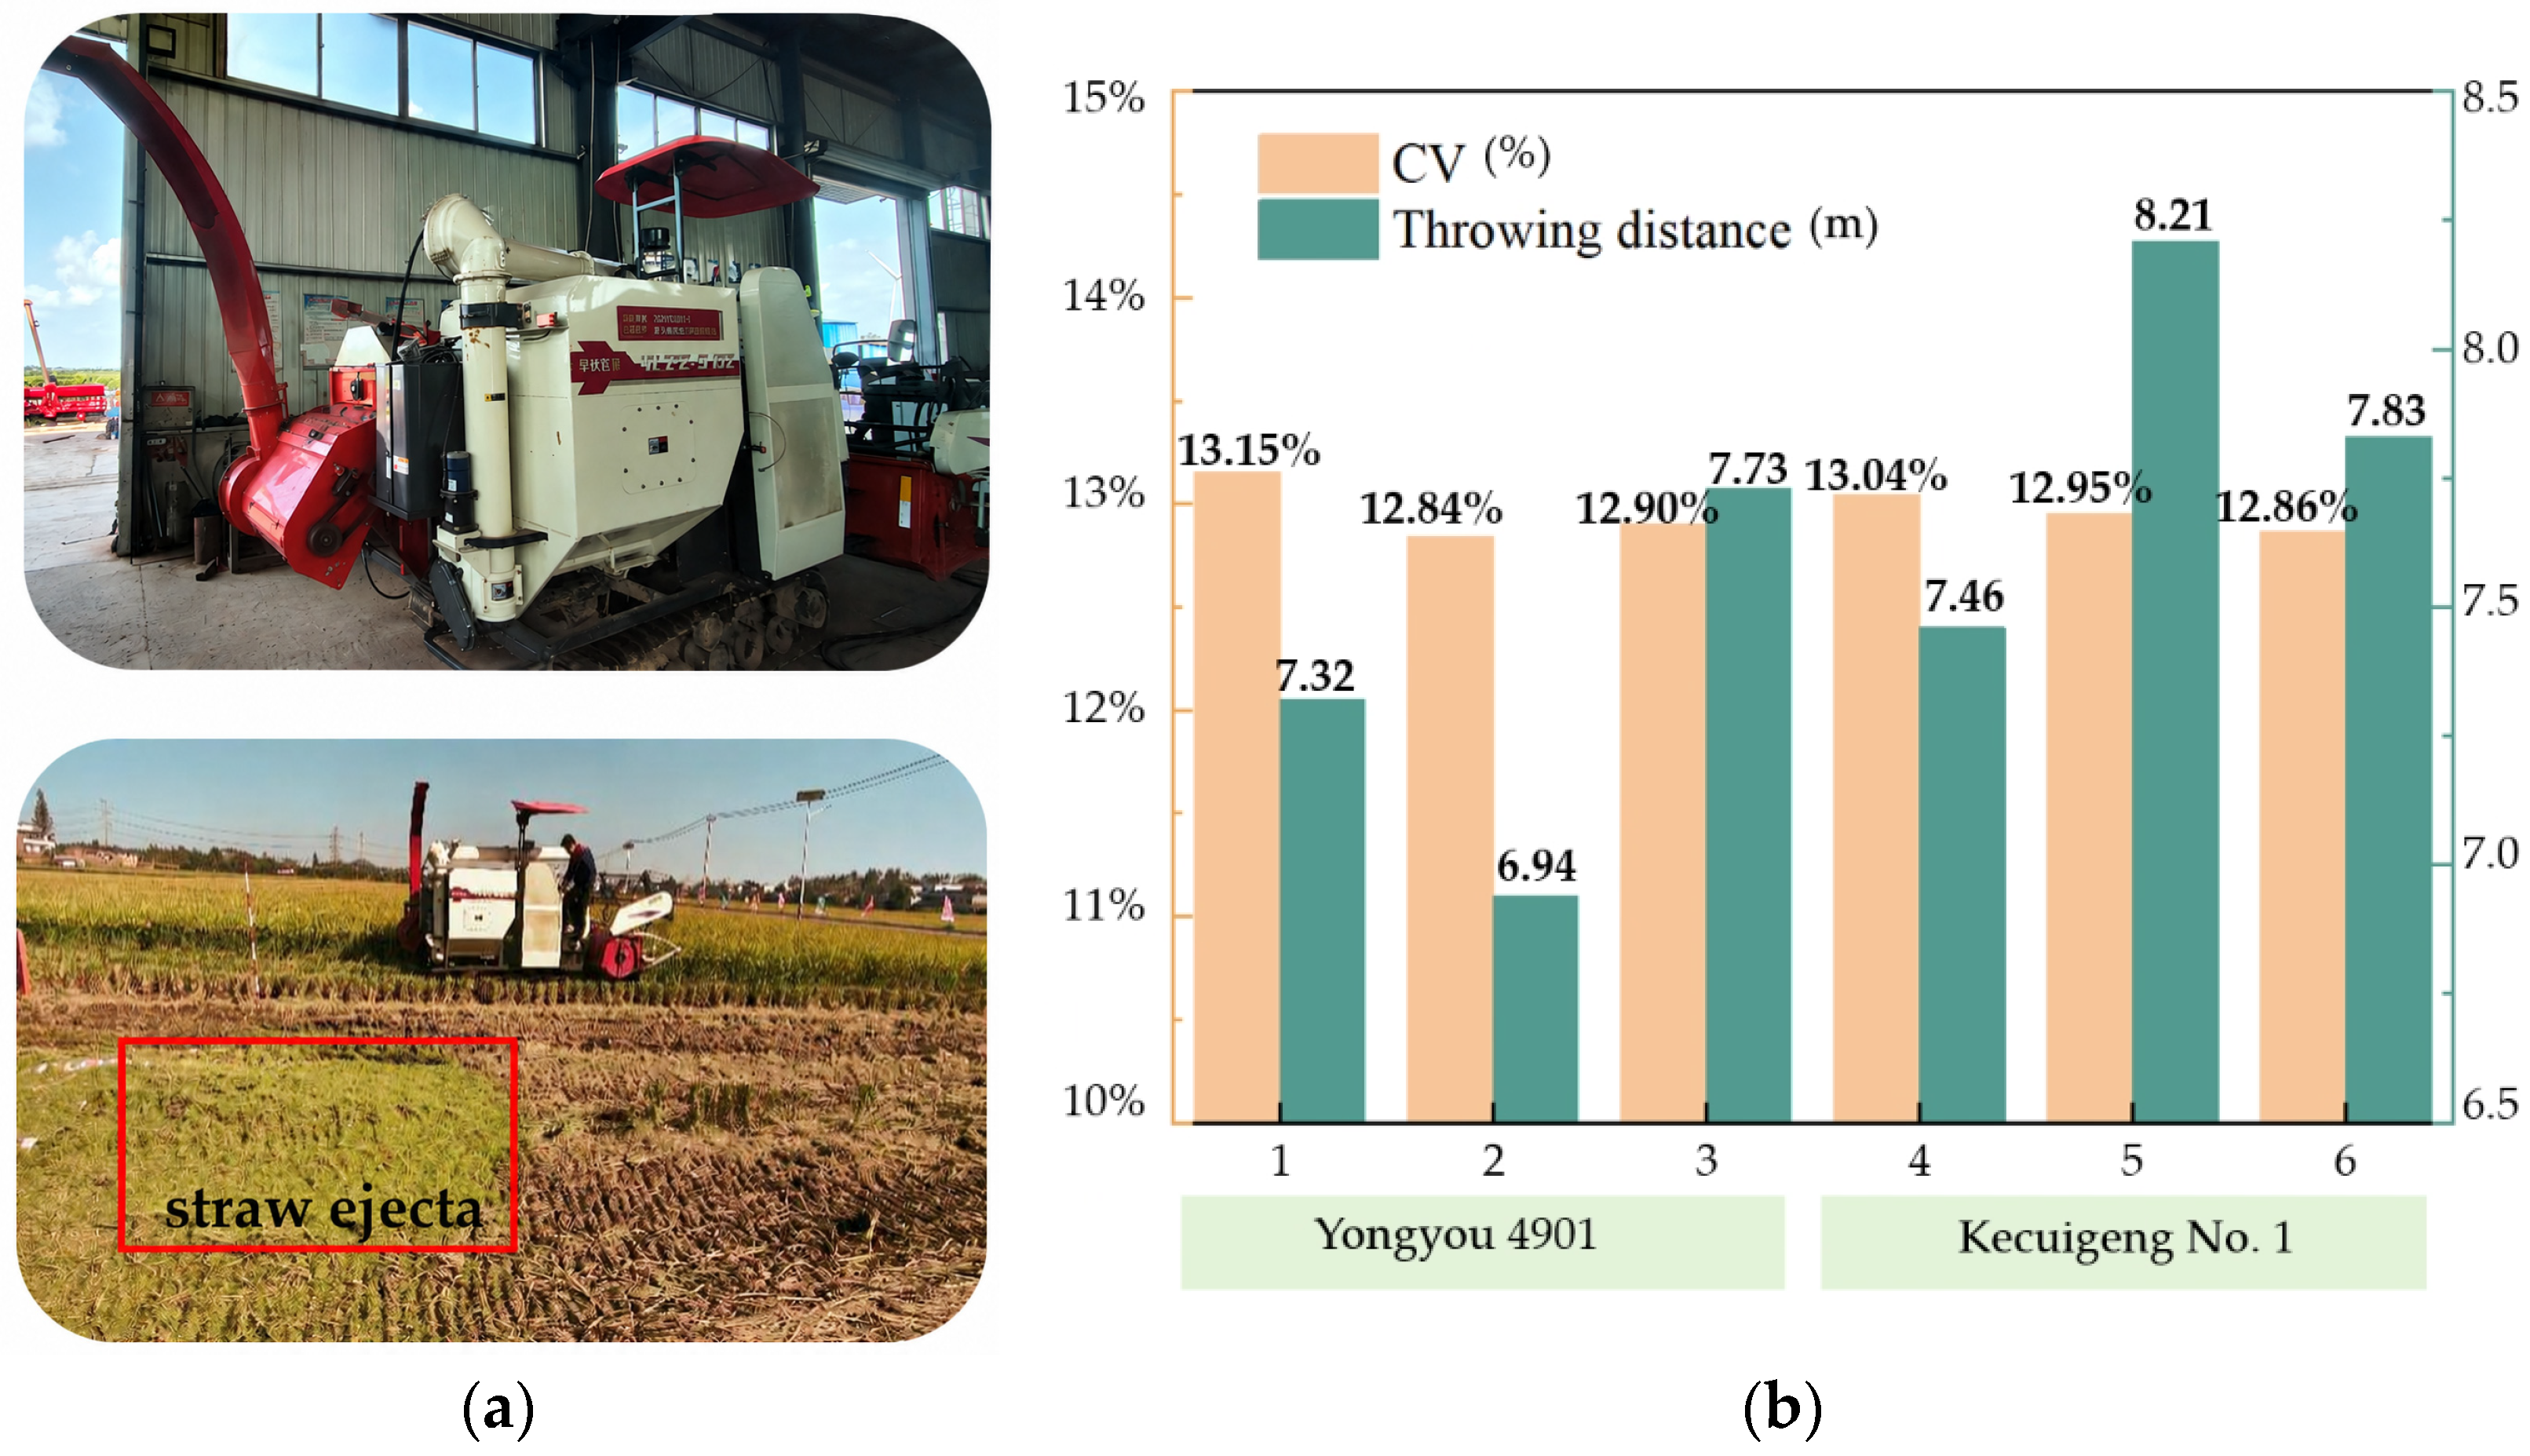
Based on the simulation and response surface optimization results, validation experiments were conducted using the optimized parameter combination to verify the reliability of the model predictions. The experiments were carried out in September 2025, as shown in Figure 15a. The test materials included two rice varieties, “Yongyou 4901” and “Kecuigeng No. 1”. The average straw moisture content was 44.12%, the straw-to-grain ratio was 1.2, the plant length ranged from 600 to 800 mm, and the manual feeding rate was 3 kg/s. During the experiments, the crushing drum rotational speed was set to 2500 r/min, the diversion plate angle was set to 1.25 rad, and the blade installation angle was set to a backward 15°. The forward operating speed of the machine was 1.0 m/s. Each operating condition was repeated three times. Throwing distance and the CV of uniformity were selected as the evaluation indices.
Figure 15.
Experimental process and validation results. (a)—Experimental process; (b)—Experimental results.
As shown in Figure 15b, both rice varieties exhibited favorable straw conveying and throwing performance under the optimized parameter conditions. For “Yongyou 4901”, the throwing distance ranged from 6.94 to 7.73 m, and the coefficient of variation for stability ranged from 12.84% to 13.15%. For “Kecuigeng No. 1”, the throwing distance ranged from 7.46 to 8.21 m, and the stability coefficient of variation ranged from 12.86% to 13.04%. Overall, the CV values remained around 13% under all operating conditions, indicating good throwing stability and distribution uniformity of the device. The experimental results agreed well with the model predictions, confirming the rationality of the optimized parameters. The Mixture model is suitable for comparing macroscopic airflow organization and bulk straw-conveying trends; however, it cannot explicitly resolve individual straw trajectories, particle–wall collisions, deformation, or entanglement as Eulerian-Lagrangian and CFD–DEM approaches can. In future studies, these particle-scale models will be combined with high-speed imaging or particle-tracking experiments to further investigate straw–air interactions and support adaptive control under complex operating conditions.
4. Conclusions
1. An integrated rice-straw conveying and throwing device was developed by combining diversion-guided feeding, axial conveying, and pneumatic throwing. The brachistochrone principle was used as a geometric reference for the diversion-plate surface to provide a smoother transition between the straw-falling region and the conveying inlet. Rather than establishing a universally optimal curve, this design offers a geometry-based approach for regulating the straw sliding path and feeding continuity within the investigated device.
2. The results clarified the distinct physical roles of the three design variables. The diversion plate angle mainly regulated the straw-guidance path and feeding continuity, blade rotational speed controlled airflow momentum and throwing distance, and blade installation angle altered recirculation and outlet velocity uniformity. The 15° backward-inclined blade produced a more continuous velocity distribution, a smaller reverse-flow region, and a more uniform outlet airflow. These findings indicate that stable straw throwing depends not only on increasing airflow velocity, but also on maintaining continuous material feeding and a uniform downstream momentum distribution.
3. Statistical analysis showed that blade rotational speed had the greatest influence on throwing distance, whereas diversion plate angle exerted a stronger effect on the coefficient of variation in straw distribution. The optimal combination was a blade rotational speed of 2500 r/min, a diversion plate angle of 1.25 rad, and a 15° backward blade installation angle. The predicted throwing distance and coefficient of variation were 7.89 m and 14.6%, respectively, while the validation experiments yielded throwing distances of 6.94–8.21 m and coefficients of variation of approximately 13%. These results support a practical design principle for straw conveying–throwing systems: upstream feeding continuity and downstream airflow uniformity should be improved simultaneously rather than optimized independently.
Author Contributions
Conceptualization, visualization, C.L.; methodology, software, validation, formal analysis, resources, data curation, C.L. and Y.B.; investigation, Y.B.; writing—original draft preparation, C.L. and G.W.; writing—review and editing, Y.B. and G.W.; supervision, G.W.; project administration, funding acquisition, M.Z. All authors have read and agreed to the published version of the manuscript.
Funding
This research was funded by the Institute-level Fundamental Scientific Research Business Expense Project of the Chinese Academy of Agricultural Sciences (Project No. S202403, Key Technology Research and Prototype Development for Integrated Rice Grain–Straw Harvesting); the Agricultural Science and Technology Innovation Program (ASTIP); the Innovation Program of the Chinese Academy of Agricultural Sciences; the Hunan Province Intelligent Agricultural Machinery Equipment Innovation and R&D Project (Xiangcainongzhi [2023] No. 6); and the Integrated Pilot Project for Agricultural Machinery R&D, Manufacturing, Promotion and Application (Project No. JSYTH2025-07). We sincerely express our gratitude for this support.
Institutional Review Board Statement
Not applicable.
Informed Consent Statement
Not applicable.
Data Availability Statement
The data presented in this study are available within the article. Further inquiries can be directed to the corresponding author.
Conflicts of Interest
The authors declare that they have no known competing financial interests or personal relationships that could have influenced the work reported in this paper.
Abbreviations
The following abbreviations are used in this manuscript:
| CV | Coefficient of Variation |
| A | blade rotational speed |
| B | diversion plate angle |
| C | blade installation angle |
| CFD | computational fluid dynamics |
| UI | the flow uniformity index |
References
- Samireddypalle, A.; Prasad, K.V.S.V.; Ravi, D.; Khan, A.A.; Reddy, R.; Angadi, U.B.; Blümmel, M. Embracing whole plant optimization of rice and wheat to meet the growing demand for food and feed. Field Crops Res. 2019, 244, 107634. [Google Scholar] [CrossRef] [Scilit]
- Zhao, X.; Yuan, G.; Wang, H.; Lu, D.; Chen, X.; Zhou, J. Effects of Full Straw Incorporation on Soil Fertility and Crop Yield in Rice–Wheat Rotation for Silty Clay Loamy Cropland. Agronomy 2019, 9, 133. [Google Scholar] [CrossRef] [Scilit]
- Luo, Z.; Song, H.; Huang, M.; Zhang, Z.; Peng, Z.; Zi, T.; Tian, C.; Eissa, M.A. Nitrogen–Reduction in Intensive Cultivation Improved Nitrogen Fertilizer Utilization Efficiency and Soil Nitrogen Mineralization of Double–Cropped Rice. Agronomy 2022, 12, 1103. [Google Scholar] [CrossRef] [Scilit]
- Tang, Z.; Zhang, B.; Liu, X.; Ren, H.; Li, X.; Li, Y. Structural model and bundling capacity of crawler picking and baling machine for straw wasted in field. Comput. Electron. Agric. 2020, 175, 105622. [Google Scholar] [CrossRef] [Scilit]
- Balingbing, C.; Van Hung, N.; Roxas, A.P.; Aquino, D.; Barbacias, M.G.; Gummert, M. An Assessment on the Technical and Economic Feasibility of Mechanized Rice Straw Collection in the Philippines. Sustainability 2020, 12, 7150. [Google Scholar] [CrossRef] [Scilit]
- Zhang, J.; Feng, B.; Yu, X.; Zhao, C.; Li, H.; Kan, Z. Experimental Study on the Crushing Properties of Corn Stalks in Square Bales. Processes 2022, 10, 168. [Google Scholar] [CrossRef] [Scilit]
- Du, J.; Zhang, Y.; Xi, Y.; Kong, X.; Chang, Z.; Ye, X.J.B. Preliminary Construction of Evaluation Index System and Method of Regional Suitability of Straw Storage and Transportation Mode. Bioresources 2021, 16, 3623–3630. [Google Scholar] [CrossRef] [Scilit]
- Wang, X.; Li, B.; Wang, S.; Yang, Z.; Cai, L. The transporting efficiency and mechanical behavior analysis of scraper conveyor. Proc. Inst. Mech. Eng. Part C J. Mech. Eng. Sci. 2018, 232, 3315–3324. [Google Scholar] [CrossRef] [Scilit]
- Wang, B.; Wu, F.; Gu, F.; Yang, H.; Wu, H.; Hu, Z. Experimental Analysis and Evaluation of Automatic Control System for Evenly Scattering Crushed Straw. Agriculture 2023, 13, 679. [Google Scholar] [CrossRef] [Scilit]
- Chen, S.; Ding, H.; Tang, Z.; Zhao, Y.; Ding, Z.; Su, Z. Fluid Movement Law and Influencing Factors of Shredding on Rice Straw Briquetting Machines. Agronomy 2022, 12, 1439. [Google Scholar] [CrossRef] [Scilit]
- Keppler, I.; Bablena, A. Optimal lamella geometry for mixed flow dryers. Arch. Appl. Mech. 2024, 94, 961–972. [Google Scholar] [CrossRef] [Scilit]
- Wang, B.; Gu, F.; Wu, F.; Ma, J.; Yang, H.; Hu, Z. Analysis of Influencing Factors and Operation Quality Evaluation Strategy of Straw Crushing and Scattering System. Agriculture 2022, 12, 508. [Google Scholar] [CrossRef] [Scilit]
- Yao, L.; Liu, Y.; Liu, J.; Xiao, Z.; Xie, K.; Cao, H.; Zhang, H. An optimized CFD–DEM method for particle collision and retention analysis of two–phase flow in a reduced–diameter pipe. Powder Technol. 2022, 405, 117547. [Google Scholar] [CrossRef] [Scilit]
- Zhao, L.; Chen, L.; Yuan, F.; Wang, L. Simulation Study of Rice Cleaning Based on DEM–CFD Coupling Method. Processes 2022, 10, 281. [Google Scholar] [CrossRef] [Scilit]
- Li, D.; He, Q.; Yue, D.; Geng, D.; Yin, J.; Guan, P.; Zha, Z. Research and Experiment on Airflow Field Control Technology of Harvester Cleaning System Based on Load Distribution. Agriculture 2024, 14, 779. [Google Scholar] [CrossRef] [Scilit]
- Ji, L.; Chu, K.; Kuang, S.; Chen, J.; Yu, A. Modeling the Multiphase Flow in Hydrocyclones Using the Coarse–Grained Volume of Fluid—Discrete Element Method and Mixture–Discrete Element Method Approaches. Ind. Eng. Chem. Res. 2018, 57, 9641–9655. [Google Scholar] [CrossRef] [Scilit]
- Chen, C.–.H.; Yaji, K. Topology optimization for particle flow problems using Eulerian–Eulerian model with a finite difference method. Comput. Fluids 2025, 291, 106573. [Google Scholar] [CrossRef] [Scilit]
- Safikhani, H. Modeling and multi–objective Pareto optimization of new cyclone separators using CFD, ANNs and NSGA II algorithm. Adv. Powder Technol. 2016, 27, 2277–2284. [Google Scholar] [CrossRef] [Scilit]
- Zhai, Z.P.; Yang, Z.Y.; Gao, B.; Li, J.X. Simulation of solid-gas two-phase flow in an impeller blower based on Mixture model. Trans. CSAE 2013, 29, 50–58, (In Chinese with English abstract). [Google Scholar] [CrossRef]
- Shang, Z.; Lou, J.; Li, H. CFD of dilute gas–solid two-phase flow using Lagrangian algebraic slip mixture model. Powder Technol. 2014, 266, 120–128. [Google Scholar] [CrossRef] [Scilit]
- Fang, M.; Yu, Z.; Zhang, W. Dynamic analysis of material motion using MATLAB/Simulation environment and test verification. Adv. Mech. Eng. 2014, 12, 1687814020957806. [Google Scholar] [CrossRef] [Scilit]
- Zhao, S.H.; Chen, J.Z.; Wang, J.Y. Design and experiment on V-groove dialing round type guiding-seed device. Trans. Chin. Soc. Agric. Mach. 2018, 49, 146–158, (In Chinese with English abstract). [Google Scholar] [CrossRef]
- Cherkasov, O.Y.; Malykh, E.V.; Smirnova, N.V. Brachistochrone problem and two-dimensional Goddard problem. Nonlinear Dyn. 2022, 111, 243–254. [Google Scholar] [CrossRef] [Scilit]
- Barsuk, A.A.; Paladi, F. On parametric representation of brachistochrone problem with Coulomb friction. Int. J. Non-Linear Mech. 2023, 148, 104265. [Google Scholar] [CrossRef] [Scilit]
- Li, X.R.; Liao, Q.X.; Wang, L.; Li, M.L.; Du, W.B. Design and experiments of the type–hole wheel with high–speed air–assisted centralized metering device for rice, wheat and rapeseed. Trans. Chin. Soc. Agric. Eng. 2023, 39, 35–48. [Google Scholar] [CrossRef]
- Chen, S.; Li, D.; Li, J.; Zhong, L. Optimization design of hydrocyclone with overflow slit structure based on experimental investigation and numerical simulation analysis. Sci. Rep. 2024, 14, 18410. [Google Scholar] [CrossRef] [Scilit] [PubMed]
- Subramaniam, S. Lagrangian–Eulerian methods for multiphase flows. Prog. Energy Combust. Sci. 2013, 39, 215–245. [Google Scholar] [CrossRef] [Scilit]
- Zhang, Q.; Zhang, H.; Jin, B.; Fang, Z.; Zhong, C. Flow pattern transformation and fiber–fluid interaction in rotating impellers: PIV–CFD–DEM combined investigations. Chem. Eng. Sci. 2026, 325, 123393. [Google Scholar] [CrossRef] [Scilit]
- Wang, J.; Wang, X.; Li, H.; Lu, C.; He, J.; Wang, Q.; Liu, D.; Deng, B.; Zhang, M. Improvement of Straw Throwing Performance of Harvester Based on Matching Header Width. Agriculture 2022, 12, 1291. [Google Scholar] [CrossRef] [Scilit]
- Zhang, J.; Tian, X.; Zhao, C.; Yu, X.; An, S.; Guo, R.; Feng, B. CFD–Based Study on the Airflow Field in the Crushing Chamber of 9FF Square Bale Corn Stalk Pulverizer. Agriculture 2024, 14, 219. [Google Scholar] [CrossRef] [Scilit]
- Zhou, B.; Ma, S.; Li, W.; Wu, Z.; Qian, J.; Huo, P.; Yang, S. CFD–DEM coupling simulation and parameter optimisation of sugarcane harvester extractor. Biosyst. Eng. 2025, 250, 80–93. [Google Scholar] [CrossRef] [Scilit]
- Wang, B.; Gu, F.; Hu, Z.; Wu, F.; Chen, X.; Luo, W. Analysis and Evaluation of Influencing Factors on Uniform Sowing of Wheat with Wide Seed Belt after Sowing and Soil Throwing Device. Agriculture 2022, 12, 1455. [Google Scholar] [CrossRef] [Scilit]

Disclaimer/Publisher’s Note: The statements, opinions and data contained in all publications are solely those of the individual author(s) and contributor(s) and not of MDPI and/or the editor(s). MDPI and/or the editor(s) disclaim responsibility for any injury to people or property resulting from any ideas, methods, instructions or products referred to in the content. |
© 2026 by the authors. Licensee MDPI, Basel, Switzerland. This article is an open access article distributed under the terms and conditions of the Creative Commons Attribution (CC BY) license.