


Abstract
The use of five machine-learning regression models, Gaussian Process Regression (GPR), Support Vector Machine (SVM), XGBoost, CatBoost, and LightGBM, was for predicting the ultimate tensile strength (UTS) of friction stir welded (FSW) AZ31B magnesium alloy joints. A controlled, single-source, experimental dataset comprising 99 observations was created on the same FSW machine under the same laboratory conditions. The dataset covered three feed rates, eleven rotational speeds and three tool tilt angles, and each parameter combination was represented by the mean UTS value from triplicate tensile tests. The input variables were the feed rate, rotational speed and tilt angle, and the prediction target was UTS measured using ASTM E8M-04. To create a more challenging and realistic assessment, we implemented blocked-holdout validation, keeping only the previously unseen rotational speed levels for the test set. Hyperparameters were selected via exhaustive grid search, with 5-fold GroupKFold cross-validation used solely on the training data. Among the models that were tested, GPR demonstrated the best overall blocked-holdout performance, with a R2 = 0.985 and RMSE = 1.798 MPa. XGBoost (R2 = 0.923) and CatBoost (R2 = 0.912) also demonstrated competitive performance. Conversely, LightGBM exhibited the poorest generalization performance (R2 = 0.817). The findings suggest that kernel and boosting-based approaches have the capacity to adequately simulate the nonlinear relationship between FSW process parameters and tensile performance, while GPR demonstrated the best generalization under the blocked-holdout evaluation strategy.
1. Introduction
The significance of magnesium alloys in aerospace, automotive and biomedicine is attributable to their low density (~1.74 g cm−3), high specific strength and biocompatibility [1,2]. AZ31B is a crucial element for wrought magnesium alloys due to the mechanical and formability trade-off in this particular alloy. Nevertheless, the integration of magnesium alloys remains a formidable challenge. It is widely acknowledged that traditional fusion welding is characterized by porosity, solidification cracking and grain coarsening. This is attributed to the high thermal conductivity and low melting point of magnesium, which results in rapid solidification and oxide entrapment [3]. Friction stir welding (FSW) has been shown to be an effective solution to a number of issues by facilitating the formation of a joint below the melting point through the application of frictional heating and substantial plastic deformation. This process enables dynamic recrystallisation and microstructural refinement, thereby enhancing the overall performance and reliability of the welding process [4,5]. In the field of FSW research, machine learning (ML) has been identified as a complementary tool for process modelling, property prediction, optimization, and defect-related analysis. More recently, the scope of ML applications in FSW has expanded toward explainability, physics-informed modelling, and digital manufacturing integration; for instance, hybrid frameworks combining machine learning with digital-twin simulation have been proposed to address explainability, generalizability, and adaptability challenges in real-time FSW process control, aligned with Industry 4.0 and 5.0 manufacturing paradigms [6], while broader reviews have systematically discussed the role of machine learning in real-time process control and tool-failure diagnosis as key application areas in FSW [7]. However, the majority of comparative ML studies published in the welding literature are based on heterogeneous datasets generated from various machines, laboratories, and experimental protocols. In addition, a significant proportion of the extant literature on ML focuses on aluminum alloys, non-similar joints, or more general review discussions than those pertaining to controlled ML studies in the context of analogous AZ31B joints [8,9,10,11,12,13,14]. Consequently, relatively few published ML studies have controlled comparative analysis of model behaviour using a single-source dataset that was preprocessed uniformly and tested under identical conditions. The literature on AZ31B also found that microstructure and tensile performance were strongly influenced by FSW process parameters [15,16,17]. Meanwhile, ML has been used to predict tensile-strength [18,19], to model dissimilar joints [10], to predict welding forces [20], to monitor tool-condition [21], and to define broader process improvement frameworks [11,12]. The available literature does, however, frequently employ heterogeneous data sources or material systems outside of parallel AZ31B magnesium joints. As a result, we do not understand how the top regression algorithms compare when they are trained and tested on a controlled dataset created by a single machine, single material system and standardized tensile testing procedure.
In this study, we created and tested 5 regression models (GPR, SVM, XGBoost, CatBoost, LightGBM) following 99 experimental observations generated from similar AZ31B FSW joints under identical conditions on the same FSW machine. In contrast to existing studies targeting dissimilar Mg/Al joints [22], the current paper focuses on similar AZ31B joints in a controlled single-source environment and performs a leakage-aware ML pipeline incorporating blocked-holdout testing, GroupKFold-based hyperparameter optimization and SHAP-based interpretability analysis. The working hypothesis states that a controlled dataset coupled with more rigorous evaluation practice could enable a more dependable comparison between the regression models and clearer characterization of the ratio of the joint tensile strength dependent on the process parameters. Rather than algorithmic novelty, the contribution of this work centres on the leakage-aware evaluation design applied to a controlled, single-source dataset, since GPR, XGBoost, CatBoost, and LightGBM are individually well established in the FSW literature. Unlike conventional random train–test splits commonly adopted in comparative FSW-ML studies, the blocked-holdout strategy adopted here specifically isolates an unseen, boundary region of the rotational-speed domain, providing a deliberately more demanding test of extrapolative generalization rather than interpolation within a previously observed parameter range. This evaluation design, combined with GroupKFold-based hyperparameter selection restricted to the training partition, a multiple linear regression baseline, bootstrap-based confidence intervals, and a multi-fold cross-validation across all rotational-speed levels, is intended to establish a transparent and statistically grounded benchmark for model comparison under realistic deployment-like conditions.
2. Materials and Methods
2.1. FSW Operation and Equipment
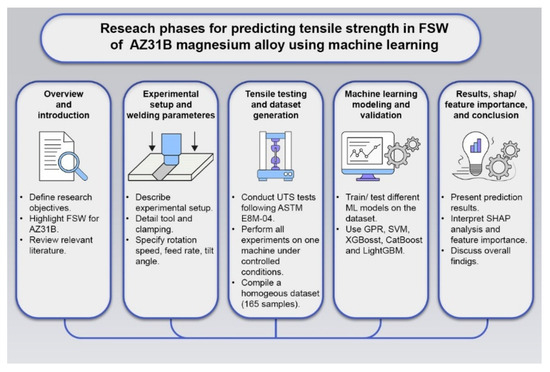
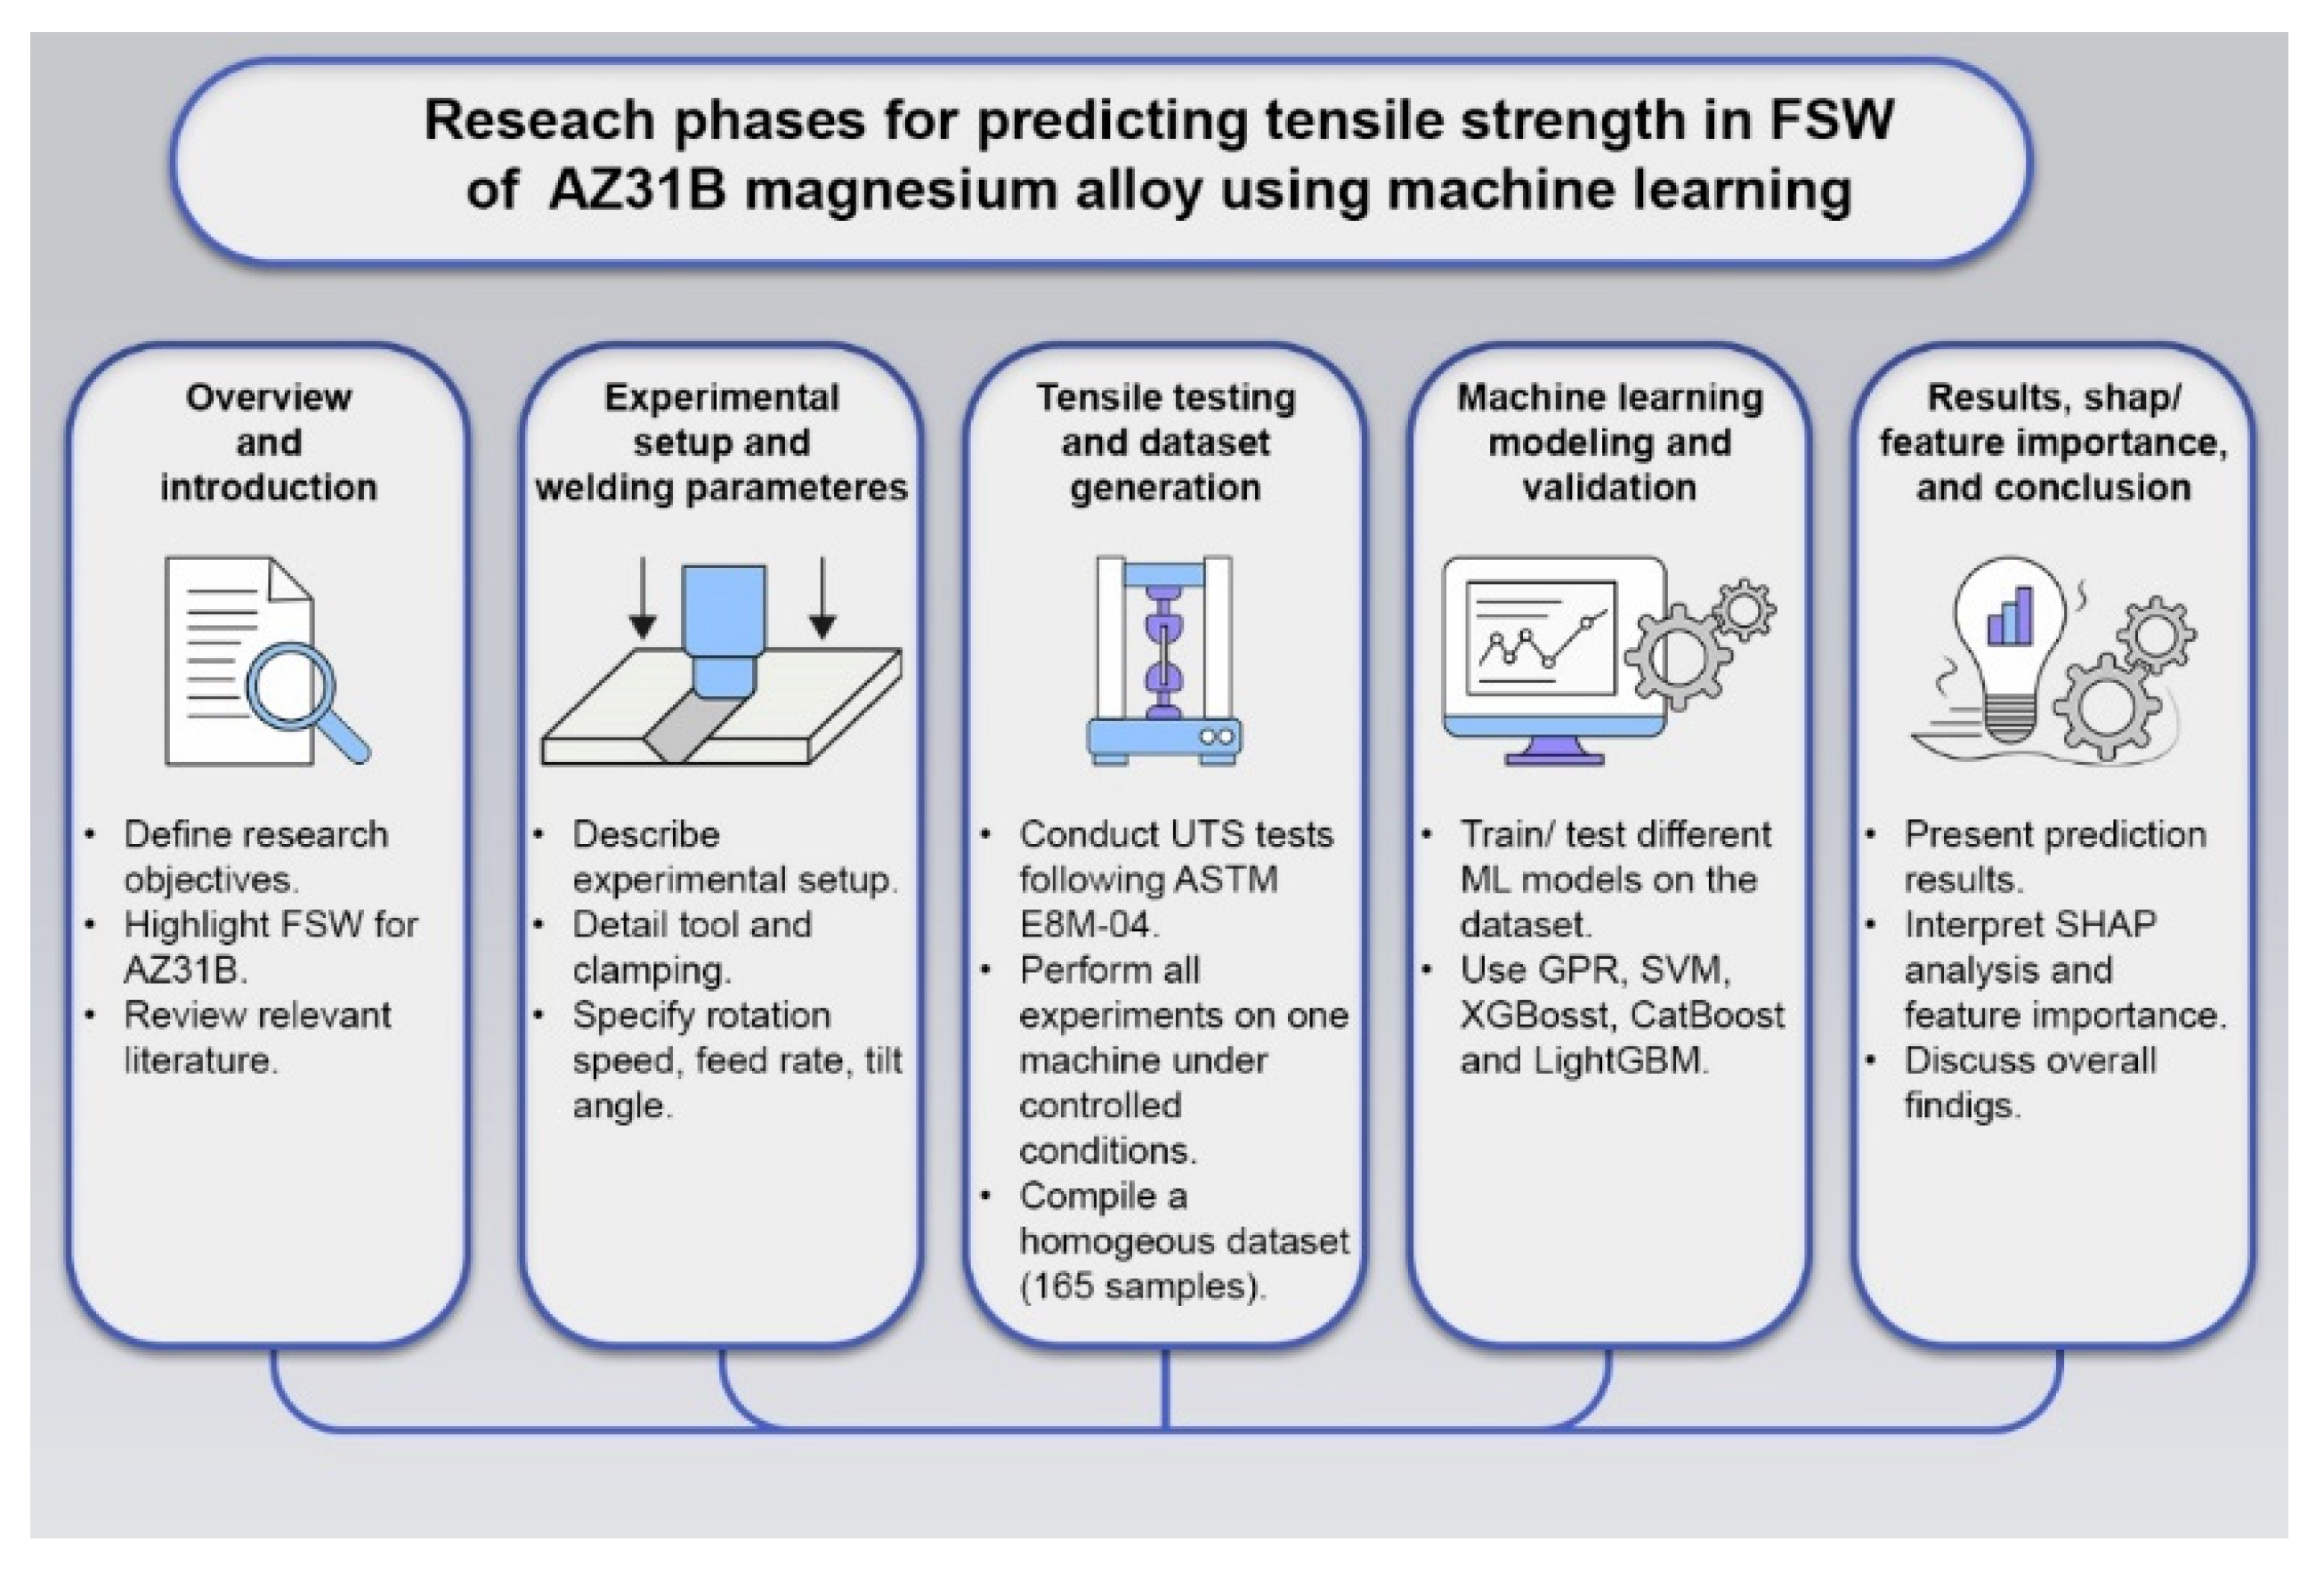
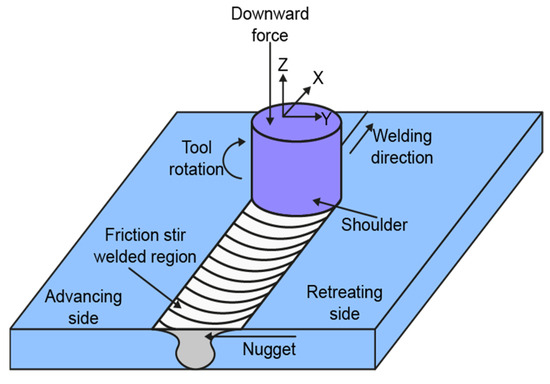
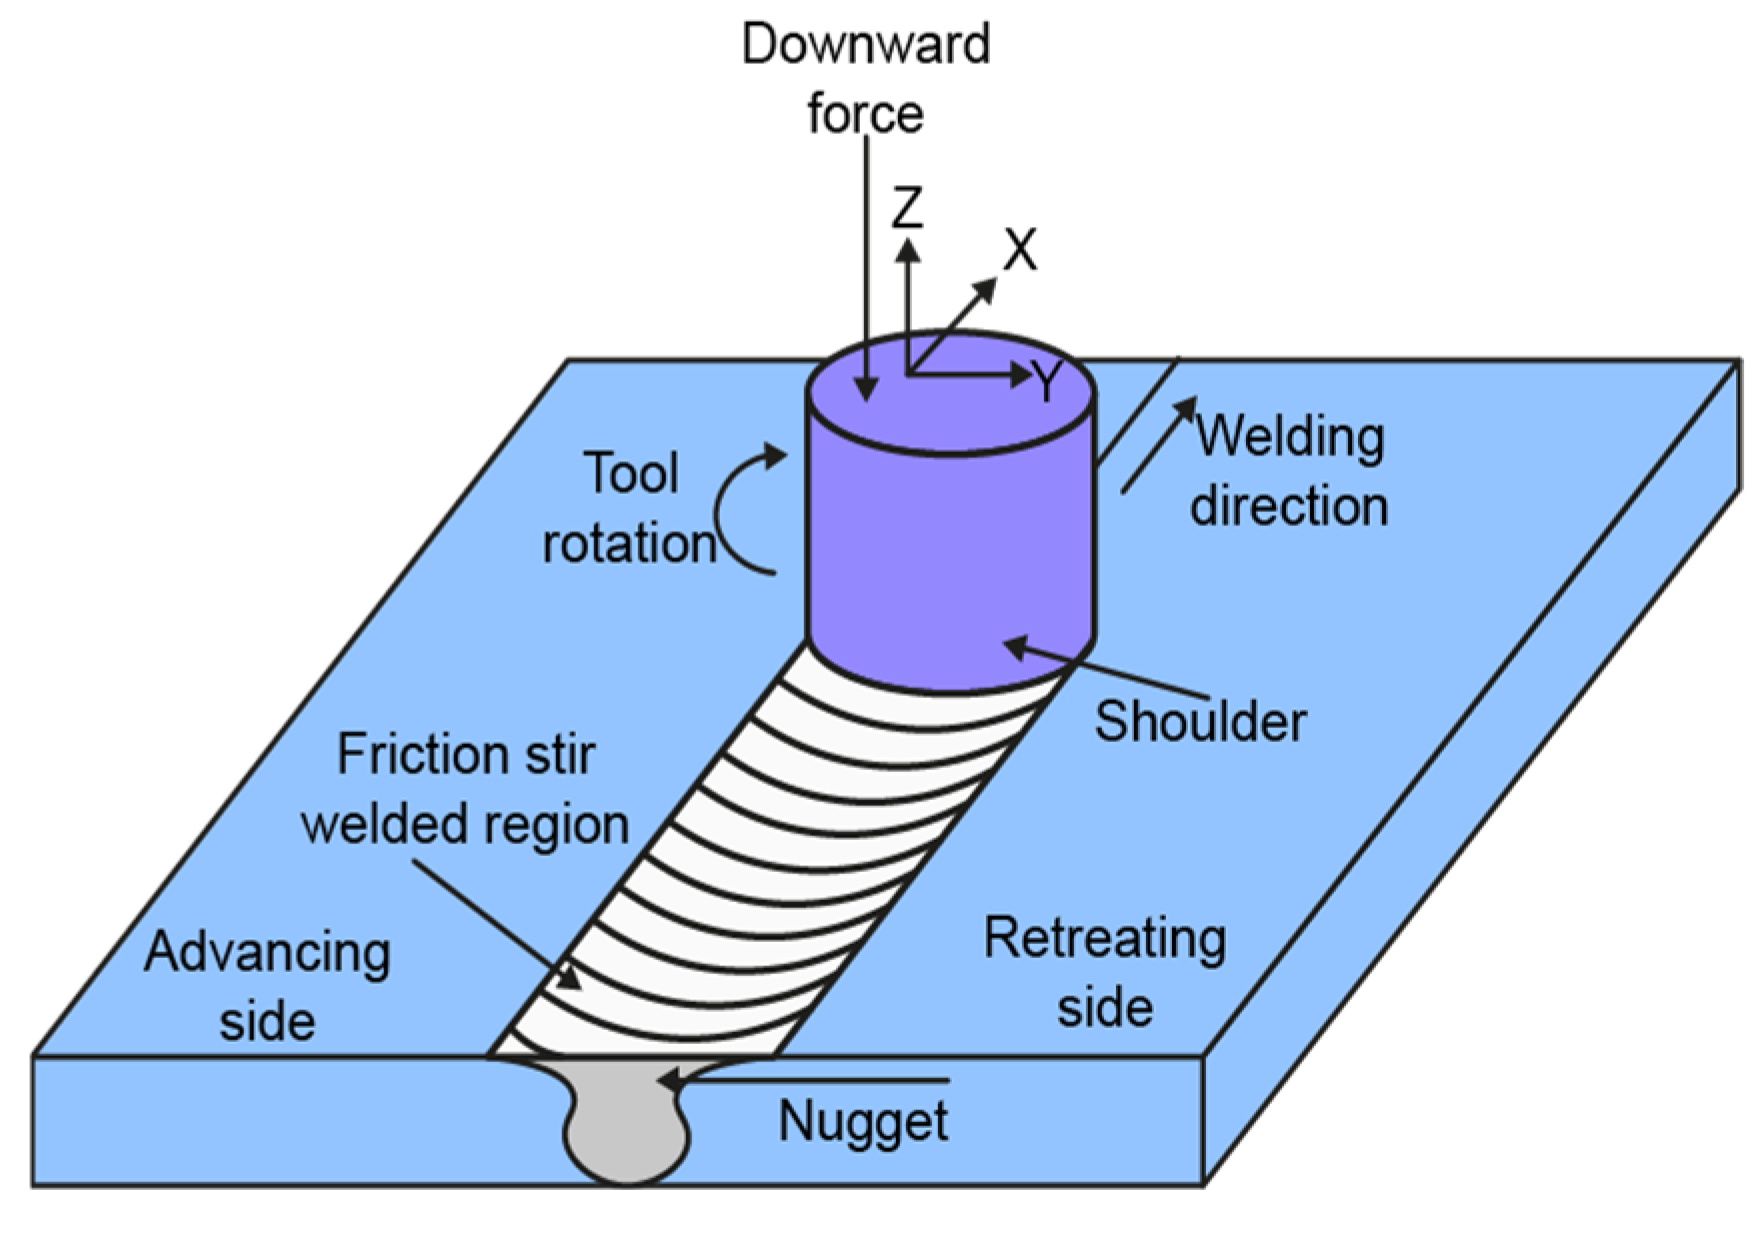
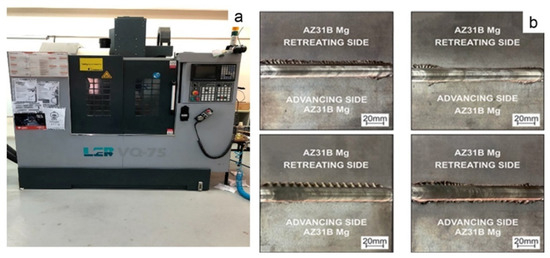
AZ31B magnesium alloy sheets with a thickness of 3 mm were cut into dimensions of 100 mm × 75 mm. Prior to the initiation of the welding process, the sheet surfaces underwent a meticulous preparation involving the milling and cleaning of the surfaces using SiC sandpaper and isopropyl alcohol. This procedure was undertaken with the objective of eradicating the native oxide layer and other surface contaminants. Friction stir welding was performed on a modified universal milling machine (LER VQ75 type LER VQ75 Vickers hardness tester (Laryee Technology Co., Ltd., Beijing, China)) using a conical pin tool manufactured from heat-treated 1.3343 high-speed steel. The tool had a shoulder diameter of 12 mm with a concave shoulder profile, a pin length of 2.95 mm, and outer and inner pin diameters of 3.0 mm and 1.5 mm, respectively. The concave shoulder geometry promotes material containment by generating hydrostatic pressure and thereby facilitates consolidation of the plasticized material within the weld zone. Prior to the execution of the welding pass, a dwell time of 30 s was implemented to ensure the generation of sufficient frictional heat at the tool-workpiece interface. The full methodology is shown in Figure 1, and the principle of the FSW and the experimental setup are presented in Figure 2 and in Figure 3.
Figure 1.
Overview of the machine learning workflow adopted for UTS prediction in friction stir welded AZ31B magnesium alloy joints.
Figure 2.
Schematic representation of the friction stir welding (FSW) process, with the rotational tool, shoulder contacting, pin, forward side (AS) and backward side (RS). Copied from Tolun, 2022, ref. [22] as cited herein.
Figure 3.
Experiment setup, illustration of typical weld bead surface appearance (a) universal milling machine (LER VQ75) used in FSW experiment, (b) weld surface under different process conditions [23].
The generation of heat in friction stir welding is primarily attributable to the rotating tool shoulder and the pin, which result in the imposition of significant plastic deformation within the weld region. It has been established that the interaction of tool rotation and traverse motion gives rise to the formation of two-way flow on the advancing side and a retreating side. This phenomenon is accompanied by the occurrence of the weld nugget, the thermomechanically affected area, and the heat-affected area. The configuration of the milling machine, including its rigid layout and gearbox-activated spindle, was instrumental in minimizing tool deflection, a crucial benefit during the process of plunging and welding. The arc-shaped flow patterns observed on typical weld surfaces reflected shoulder-driven material transport, which produced either smooth, well-consolidated welds or, under elevated pressure conditions, flash-contingent welds.
2.2. Experimental Parameters and Mechanical Testing
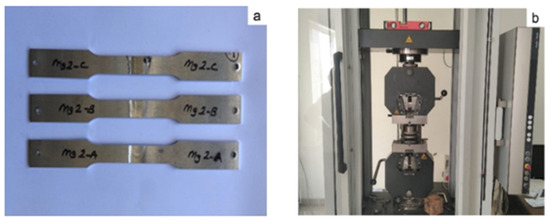
Three process variables and other experimental parameters were varied: the feed rate (30, 50 and 70 mm/min), the rotation speed (900–1400 rpm at 11 levels of rotation, with 50 rpm increments), and the tool tilt angle (0°, 1.5°, 3°). The combination of both factors was undertaken using a full-factorial design, which resulted in 99 experimental conditions (3 × 11 × 3 = 99). The parameter ranges under consideration were selected on the basis of preliminary trials and earlier AZ31B FSW experiments [22]. The tensile samples were machined in accordance with the provisions of ASTM E8M-04 [24], and tested at a crosshead speed of 2 mm/min using a Zwick/Roell universal testing machine (ZwickRoell Group, Ulm, Germany) (ZwickRoell Group, Ulm, Germany) (Figure 4). It is important to note that all possible parameter combinations were tested in triplicate. The average UTS of the three tensile tests was then taken as the response value for that condition. Consequently, the experimental campaign comprised 297 tensile tests in total, and 99 averaged UTS values were used for model development and comparison. The measured UTS values were also found to vary from 126.45 to 178.37 MPa. The findings of this study demonstrate that the weld efficiency ranges from 49 to 69% when compared to the AZ31B-H24 base metal tensile strength, which is approximately 260 MPa. The number of replicates was reduced in order to minimize replicate noise, with each experimental condition being reduced to a single response in the subsequent modelling.
Figure 4.
The tensile testing setup and the specimen geometry were provided: (a) tensile specimens according to ASTM E8M-04; (b) universal testing machine (Zwick/Roell) for mechanical checking.
2.3. Dataset and ML Configuration
The dataset under consideration comprised 99 observations. The feed rate, rotational speed, and tool tilt angle were utilized as input parameters, with the UTS serving as the prediction target. The descriptive statistics are displayed in Table 1.
Table 1.
Descriptive statistics of the dataset.
Rotational speed was selected as the grouping variable for the blocked-holdout split rather than feed rate or tilt angle for both statistical and physical reasons. Among the three process parameters, rotational speed was sampled at eleven discrete levels (900–1400 rpm, in 50 rpm increments), whereas feed rate and tilt angle were each varied across only three levels. Grouping by feed rate or tilt angle would have left only one of three levels available for the test partition, reducing the test set to approximately one-third of the dataset while simultaneously removing an entire level from the training data, which would constrain the training space far more severely than the eleven-level rotational-speed variable allows. In addition, rotational speed directly governs frictional heat generation and the resulting thermal history of the weld, making it the parameter most likely to produce physically meaningful extrapolation challenges when unseen levels are withheld from training. For these reasons, rotational speed offered the most statistically balanced and physically motivated basis for constructing a stringent, leakage-aware holdout test. To further verify that this choice did not bias the reported performance, the multi-fold blocked cross-validation, in which each of the eleven rotational-speed levels was withheld in turn, confirmed that model rankings remained stable regardless of which specific levels were excluded from training.
In order to assess the generalization of the model in the absence of new operating cases, a blocked-holdout approach was implemented. All observations at the rotational-speed levels of 1300, 1350 and 1400 rpm were designated as ‘test data’, while the remainder constituted the ‘training data’. The procedure yielded 72 training observations and 27 test observations. It is evident that the test set, which comprised rotational-speed levels not present in the training set, resulted in a more stringent evaluation than a conventional random train–test split. This enhanced the model’s capacity to generalize to previously unseen rotational-speed levels within the investigated parameter space.
To prevent data leakage, the test set was isolated before any preprocessing or model selection. Feature scaling was fitted only on the training data, and the fitted transformation was then applied to the corresponding evaluation data within the pipeline. Hyperparameters were selected via exhaustive grid search with 5-fold GroupKFold cross-validation performed exclusively on the training data. Cross-validation was used solely for hyperparameter optimization; model generalization was assessed exclusively on the blocked-holdout test set. Furthermore, the mean of the three tensile replicates recorded for each parameter combination was calculated prior to model development, thus ensuring that no repeated condition appeared in both the training and test partitions. All analyses were implemented in Python 3.12.13 using NumPy 2.0.2, pandas 2.2.2, matplotlib 3.10.0, SHAP 0.51.0, scikit-learn 1.6.1, XGBoost 3.2.0, CatBoost 1.2.10, and LightGBM 4.6.0. A fixed random seed of 42 was used for model initialization, data partitioning, and SHAP subsampling. The hyperparameters of the ML models were optimized using a five-fold GroupKFold cross-validation grid search on the training set, and the resulting optimal configurations are summarized in Table 2.
Table 2.
Hyperparameter configuration of the ML models (optimal values selected by five-fold GroupKFold cross-validation grid search on the training set).
To benchmark the nonlinear models against a conventional baseline, a multiple linear regression (MLR) model was additionally fitted using the same feature scaling and train–test partition. To quantify the statistical reliability of the blocked-holdout performance metrics, 95% confidence intervals were estimated via bootstrap resampling (2000 resamples) of the test-set predictions. Furthermore, to assess whether the reported performance was sensitive to the specific choice of the blocked-holdout boundary, a multi-fold blocked cross-validation was performed in which each of the 11 rotational-speed levels was held out in turn as an independent test fold, with all models retrained on the remaining levels for each fold.
2.4. Machine Learning Methods
Five regression algorithms were selected for comparison with kernel-based and boosting-based approaches under the same controlled dataset. The following ML algorithms are considered: GPR, SVM, XGBoost, CatBoost and LightGBM. These models were chosen because they are widely used for nonlinear regression and provide complementary modelling behaviour in small to medium-sized structured datasets. GPR is a Bayesian nonparametric method that places a probability distribution over functions. In the optimized model, a C(1.0) × RBF(0.1) kernel with alpha = 0.01 was used, enabling estimation of both predictive mean and predictive uncertainty [24,25]. Support Vector Regression maps the input space into a higher-dimensional feature space and determines a function that deviates from the observed targets by at most ɛ according to the ε-insensitive loss principle. In this study, the optimized SVM model used an RBF kernel.
XGBoost constructs an ensemble of shallow decision trees sequentially by using gradient information and regularization to improve predictive accuracy [26]. CatBoost is an ordered gradient-boosting method that uses symmetric trees and built-in regularization to reduce overfitting. LightGBM is a histogram-based gradient-boosting algorithm that uses leaf-wise tree growth and is known for computational efficiency and competitive predictive performance. Model performance was assessed using the coefficient of determination (R2), mean absolute error (MAE), root mean square error (RMSE), median absolute error (MedAE), and maximum error. Our combined usage of these metrics captured both overall fit and the distribution of prediction errors. For model inference, SHAP-based analyses were performed on fitted final models. TreeExplainer was applied to the tree-based models (XGBoost, CatBoost, and LightGBM), while KernelExplainer was used with the SVM and GPR models. SHAP values were computed on the blocked-holdout test set for all five models. This ensured consistent and comparable interpretability across kernel-based and tree-based approaches. For KernelExplainer (SVM and GPR), a background dataset comprising up to 40 training observations was utilized, with nsamples set to 100.
3. Results and Discussion
3.1. Performance Tests and Training
Model generalization was assessed using the blocked-holdout test set as the primary evaluation. GroupKFold cross-validation was applied exclusively for hyperparameter selection and is not reported as a primary performance metric. The results of the blocked-holdout experiment are presented in Table 3. GPR demonstrated the most optimal overall prediction performance for the five models when applied to unseen rotational speeds, with R2 = 0.985, MAE = 1.539 MPa and RMSE = 1.798 MPa. XGBoost also performed competitively (R2 = 0.923, RMSE = 4.118 MPa), followed by CatBoost (R2 = 0.912, RMSE = 4.425 MPa). SVM produced moderate predictive accuracy (R2 = 0.841), whereas LightGBM showed the weakest blocked-holdout performance (R2 = 0.817, RMSE = 6.369 MPa).
Table 3.
Performance metrics of the regression models on the blocked-holdout test set.
To contextualize these results, a multiple linear regression baseline was fitted on the same blocked-holdout split. The MLR model achieved only R2 = 0.088 and RMSE = 14.210 MPa, substantially underperforming all five nonlinear models (Table 3). This large gap indicates that the relationship between the process parameters (feed rate, rotational speed, tilt angle) and UTS is strongly nonlinear within the investigated parameter space, and confirms that the predictive gains of GPR, XGBoost, and CatBoost over a conventional baseline are not marginal. Because of its substantially higher error magnitude, the MLR baseline is excluded from Figure 5, Figure 6, Figure 7, Figure 8 and Figure 9 to preserve the visual interpretability of the comparison among the five nonlinear models; its performance is reported only in tabular form (Table 3 and Table 4).
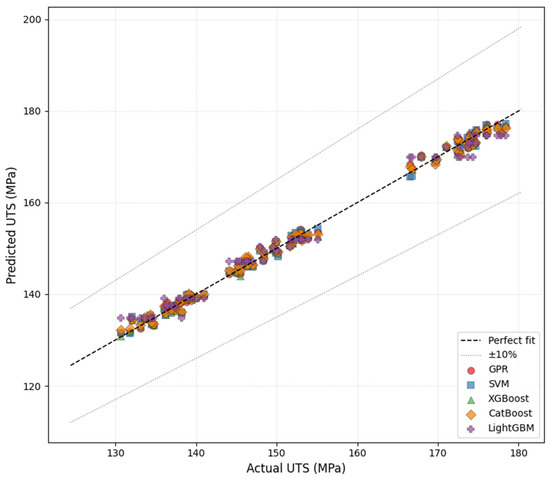
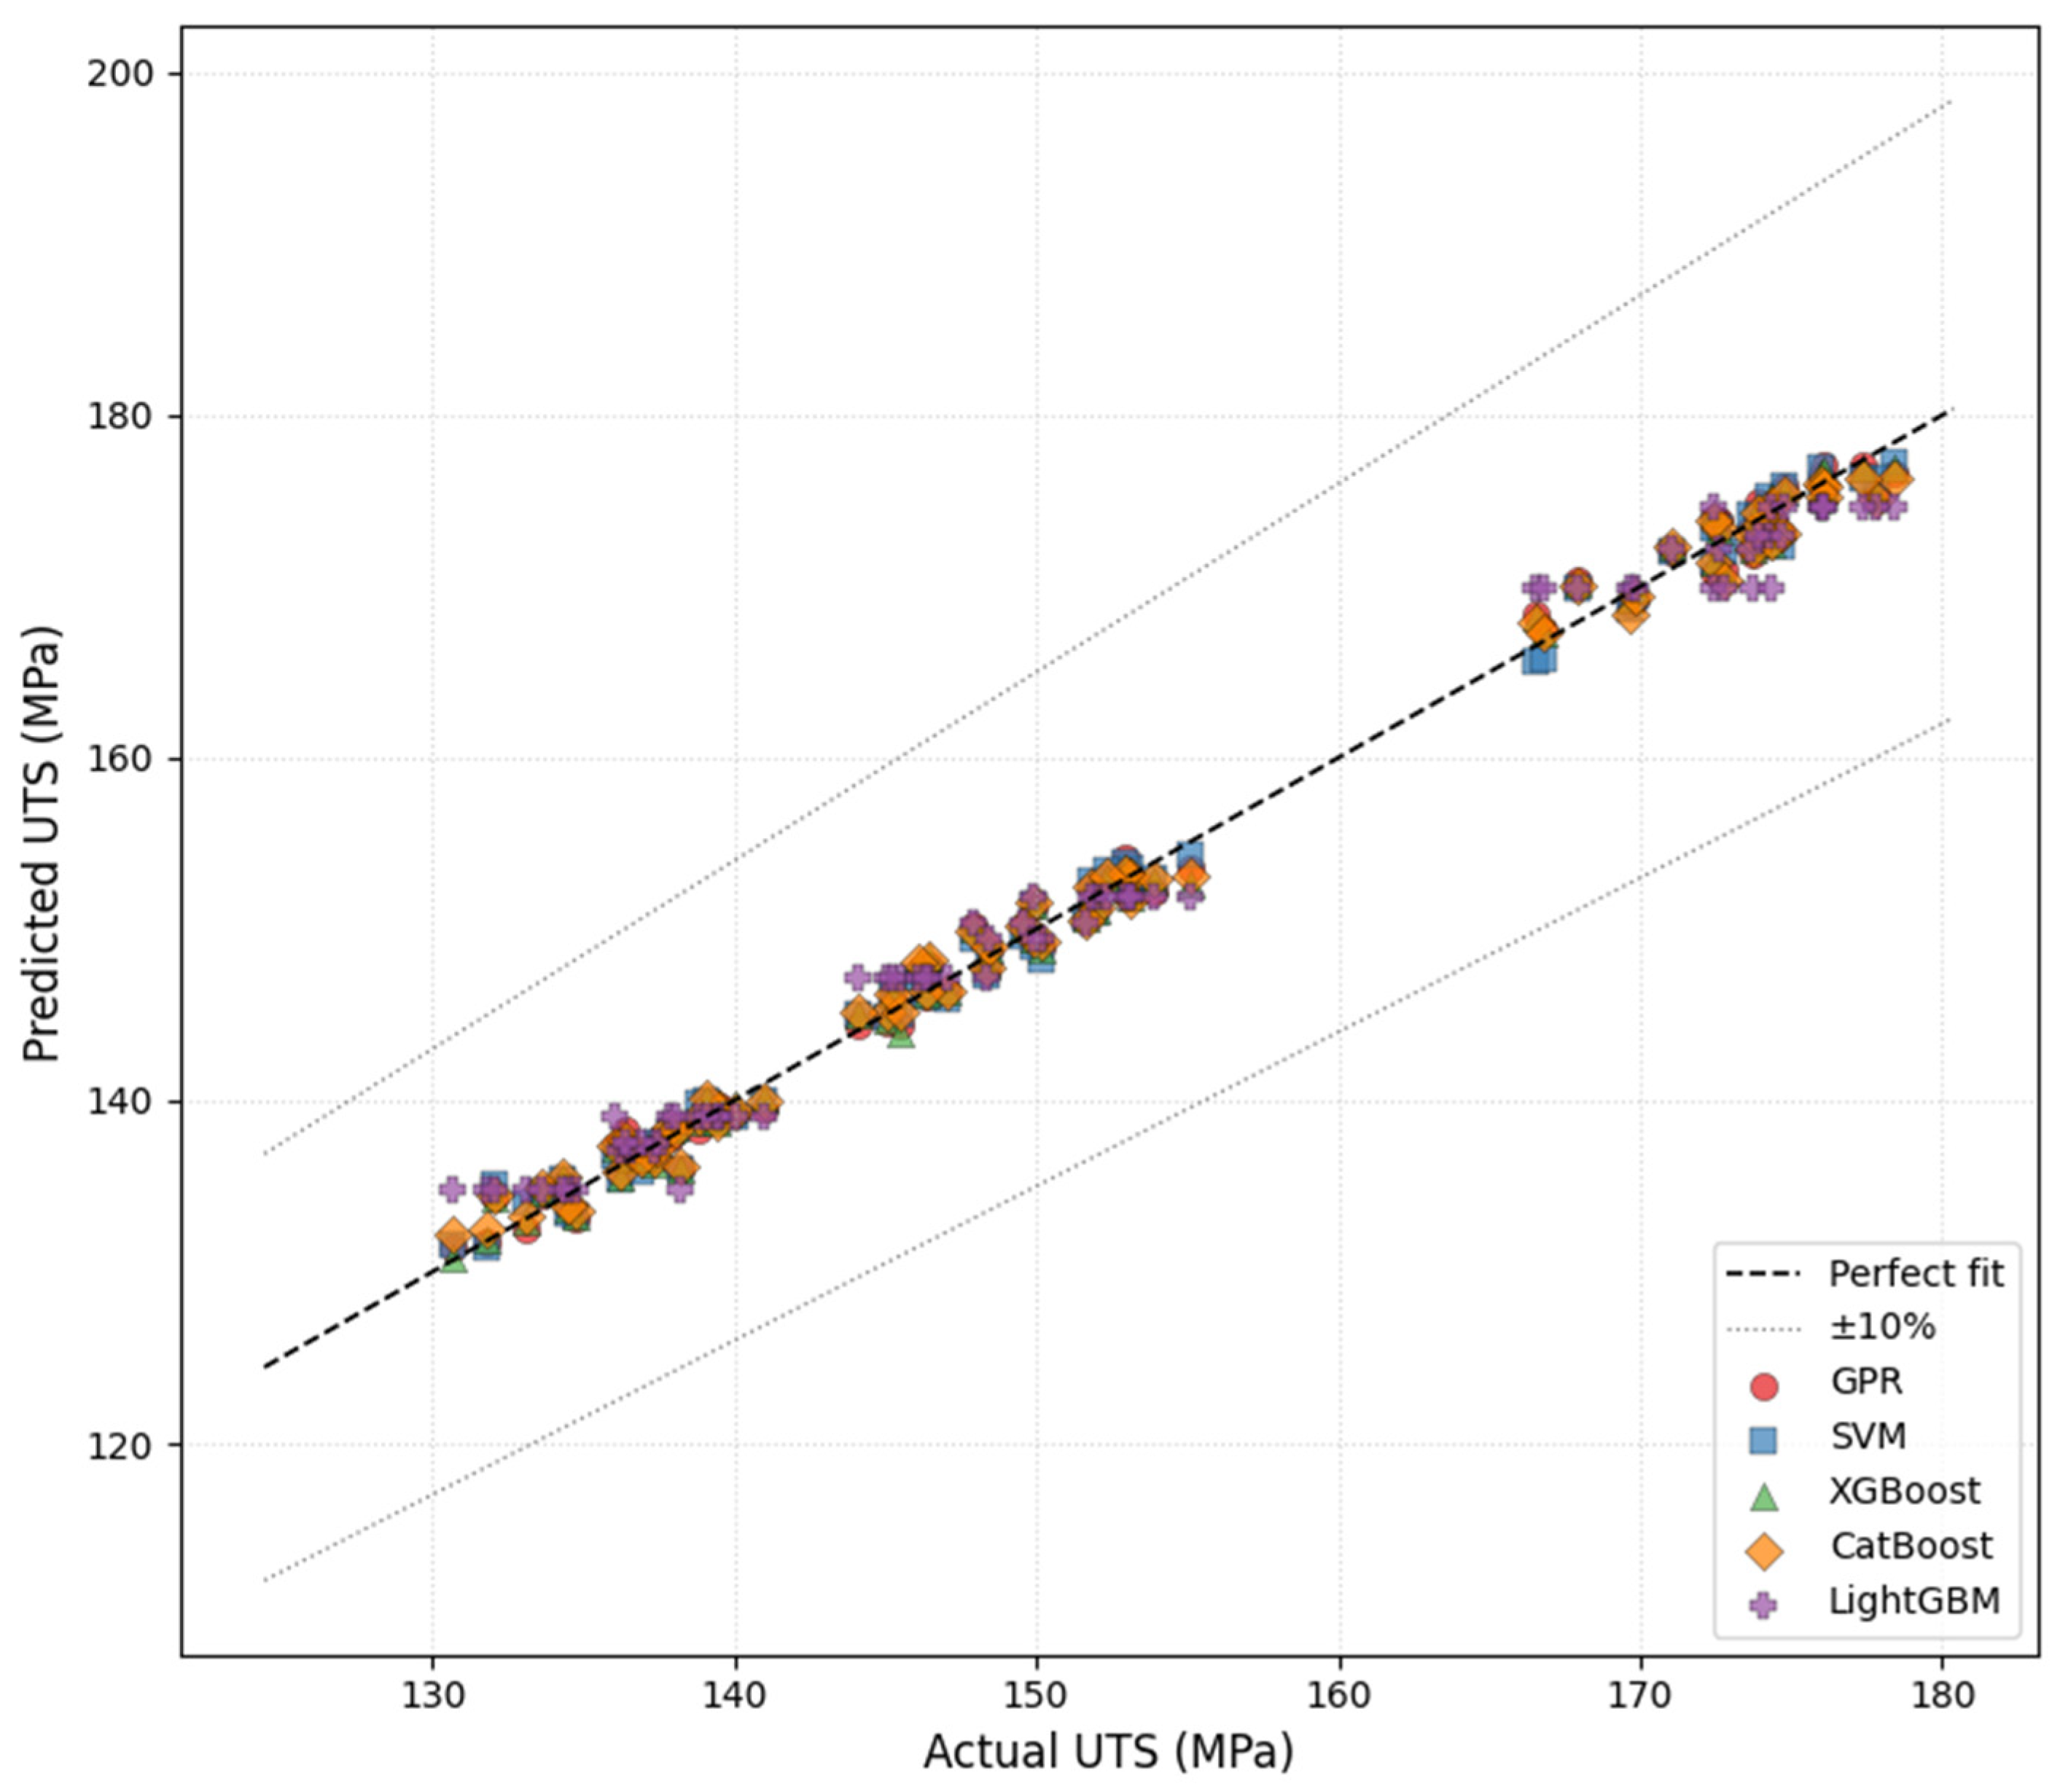
Figure 5.
UTS predictions versus actual values on training dataset.
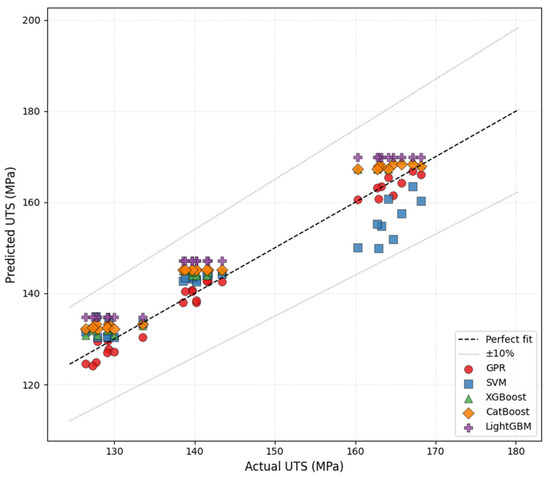
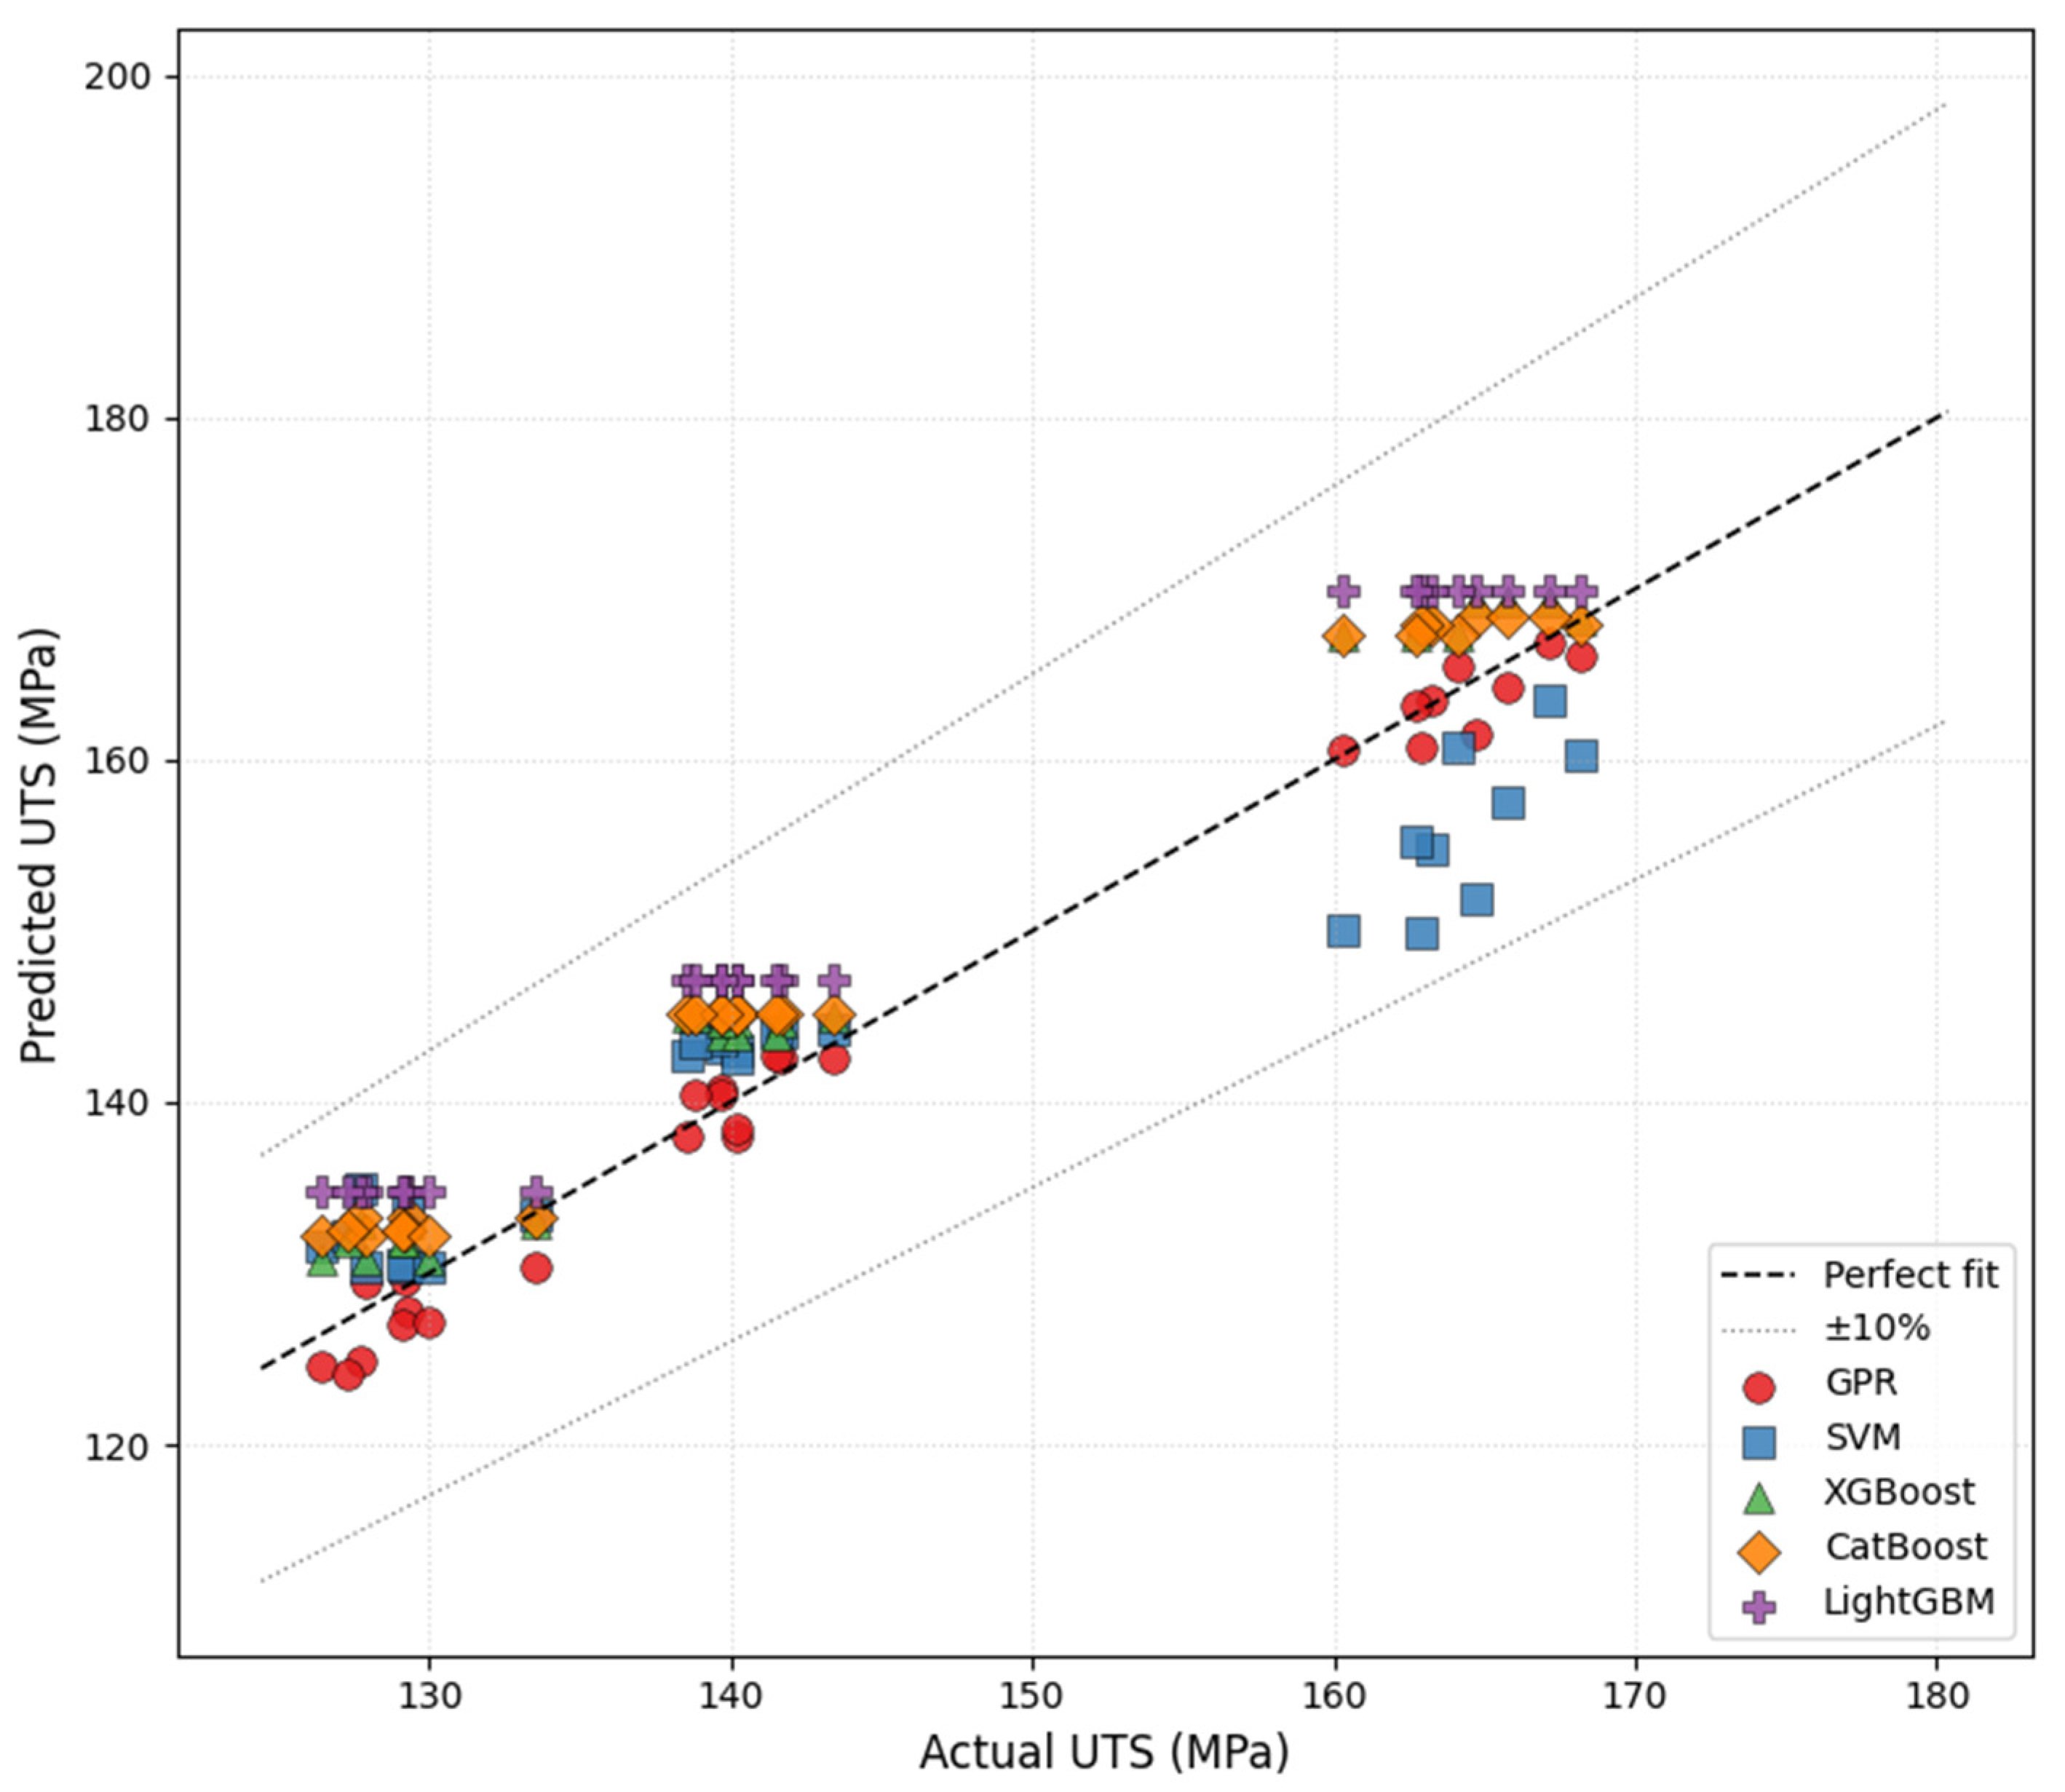
Figure 6.
Predicted vs. actual UTS on the blocked-holdout testing dataset.
Figure 7.
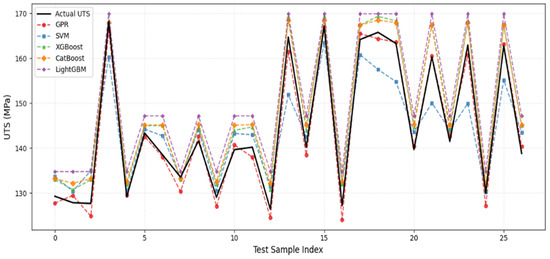
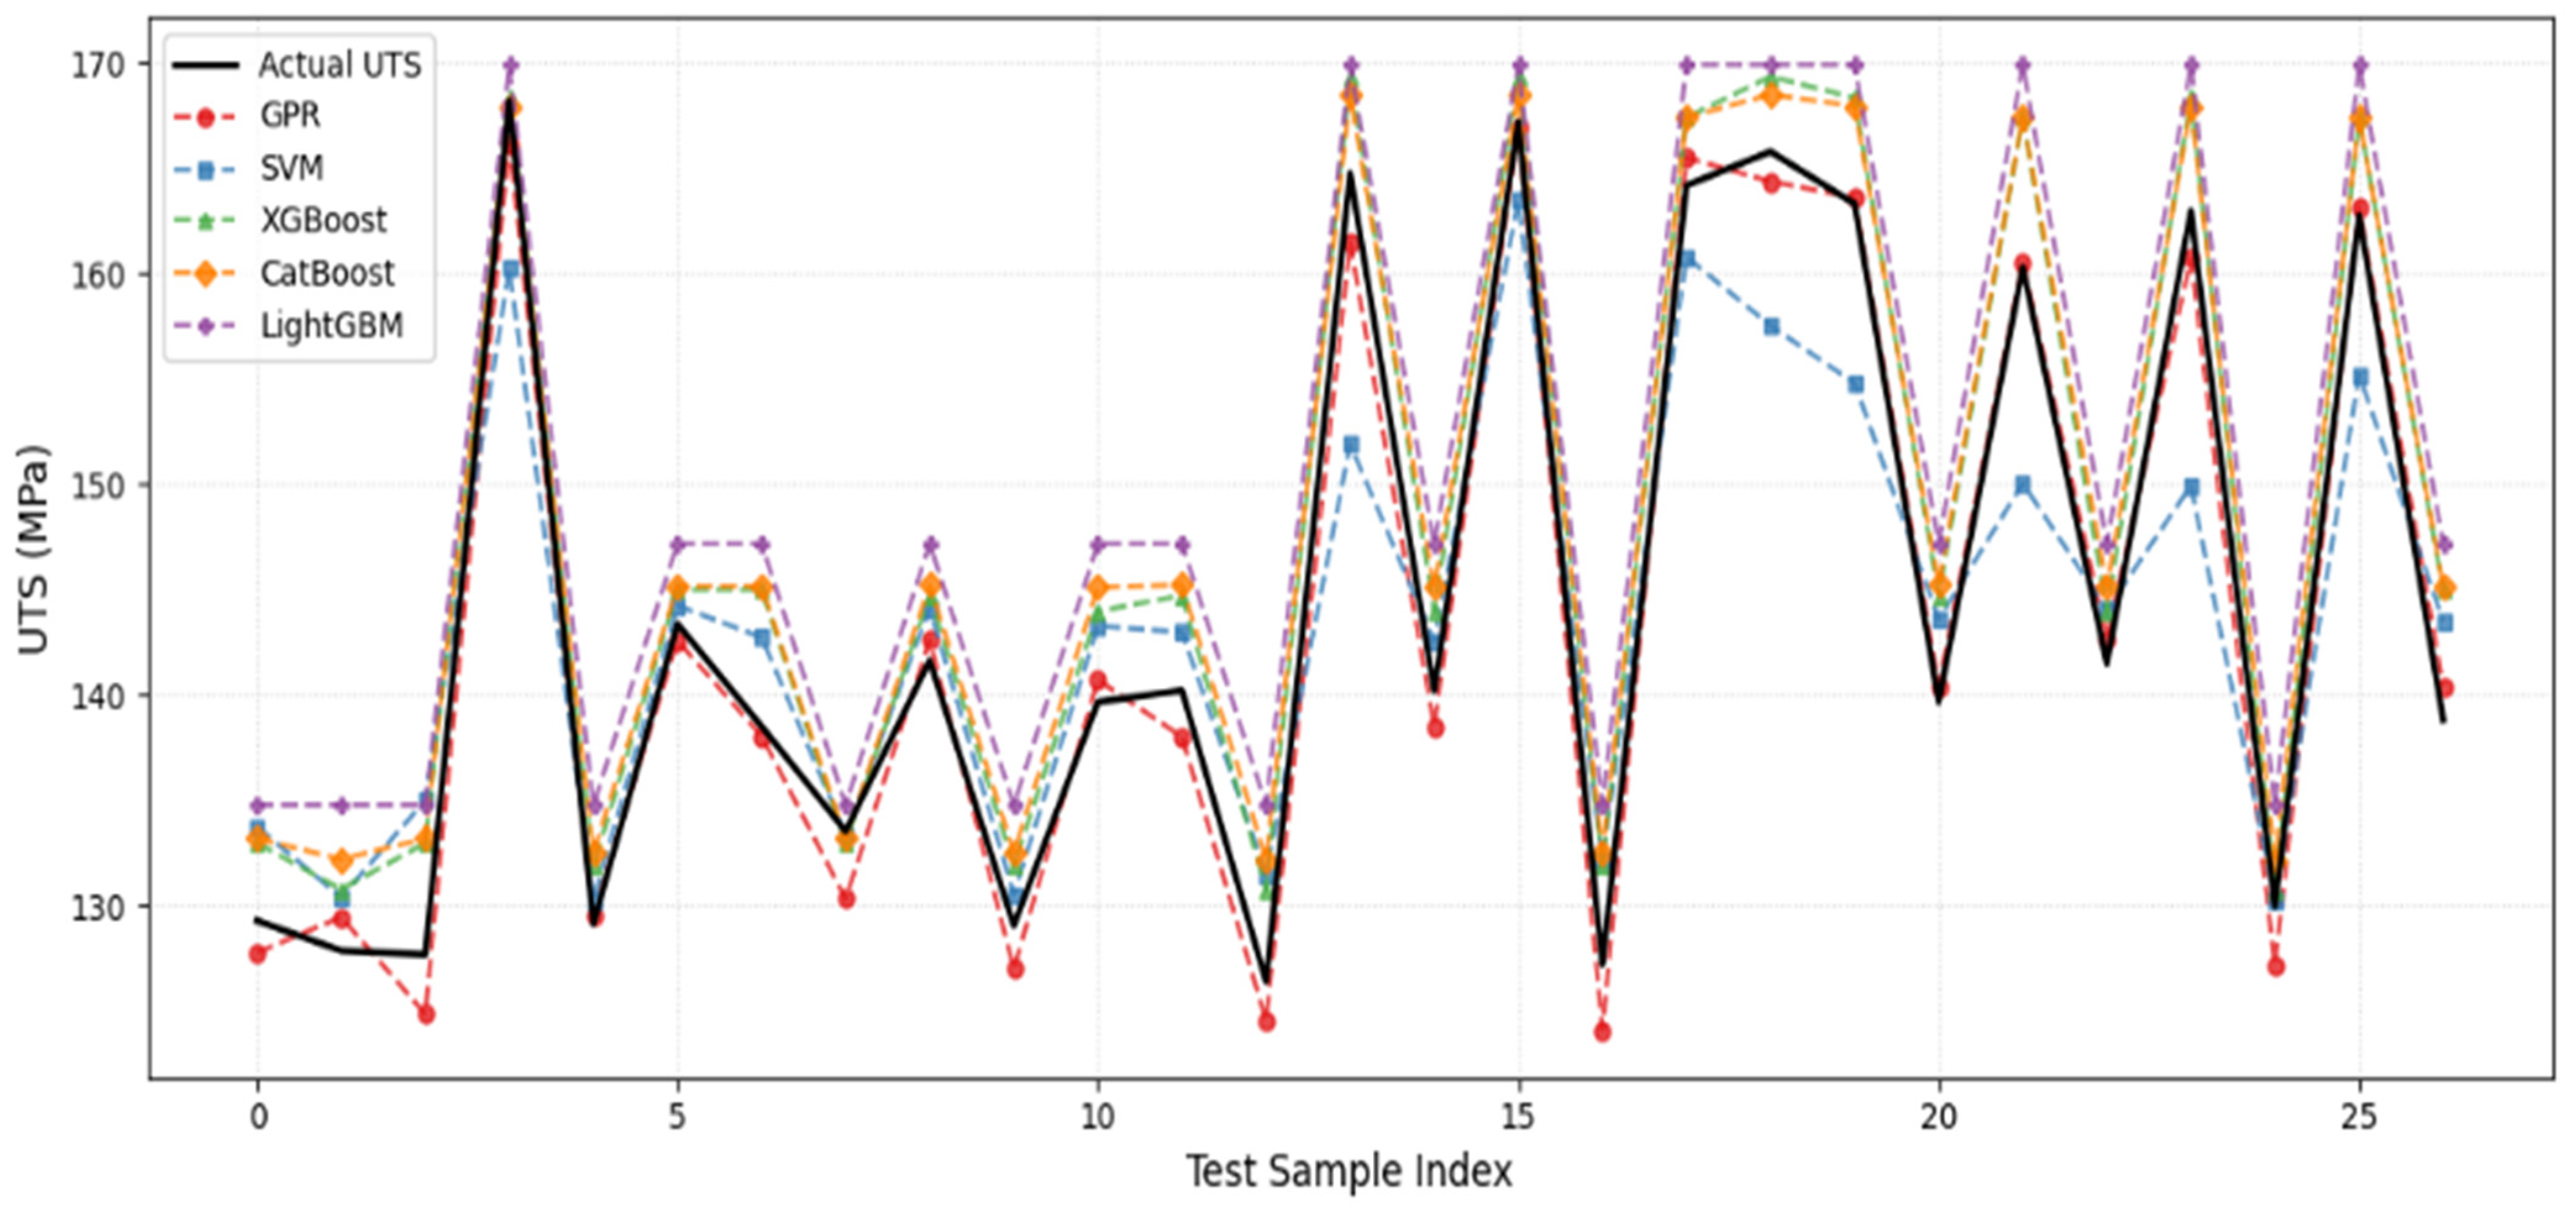
Sequential predicted vs. actual UTS as compared to the blocked-holdout test observations.
Figure 8.
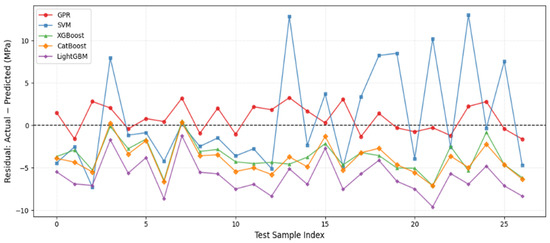
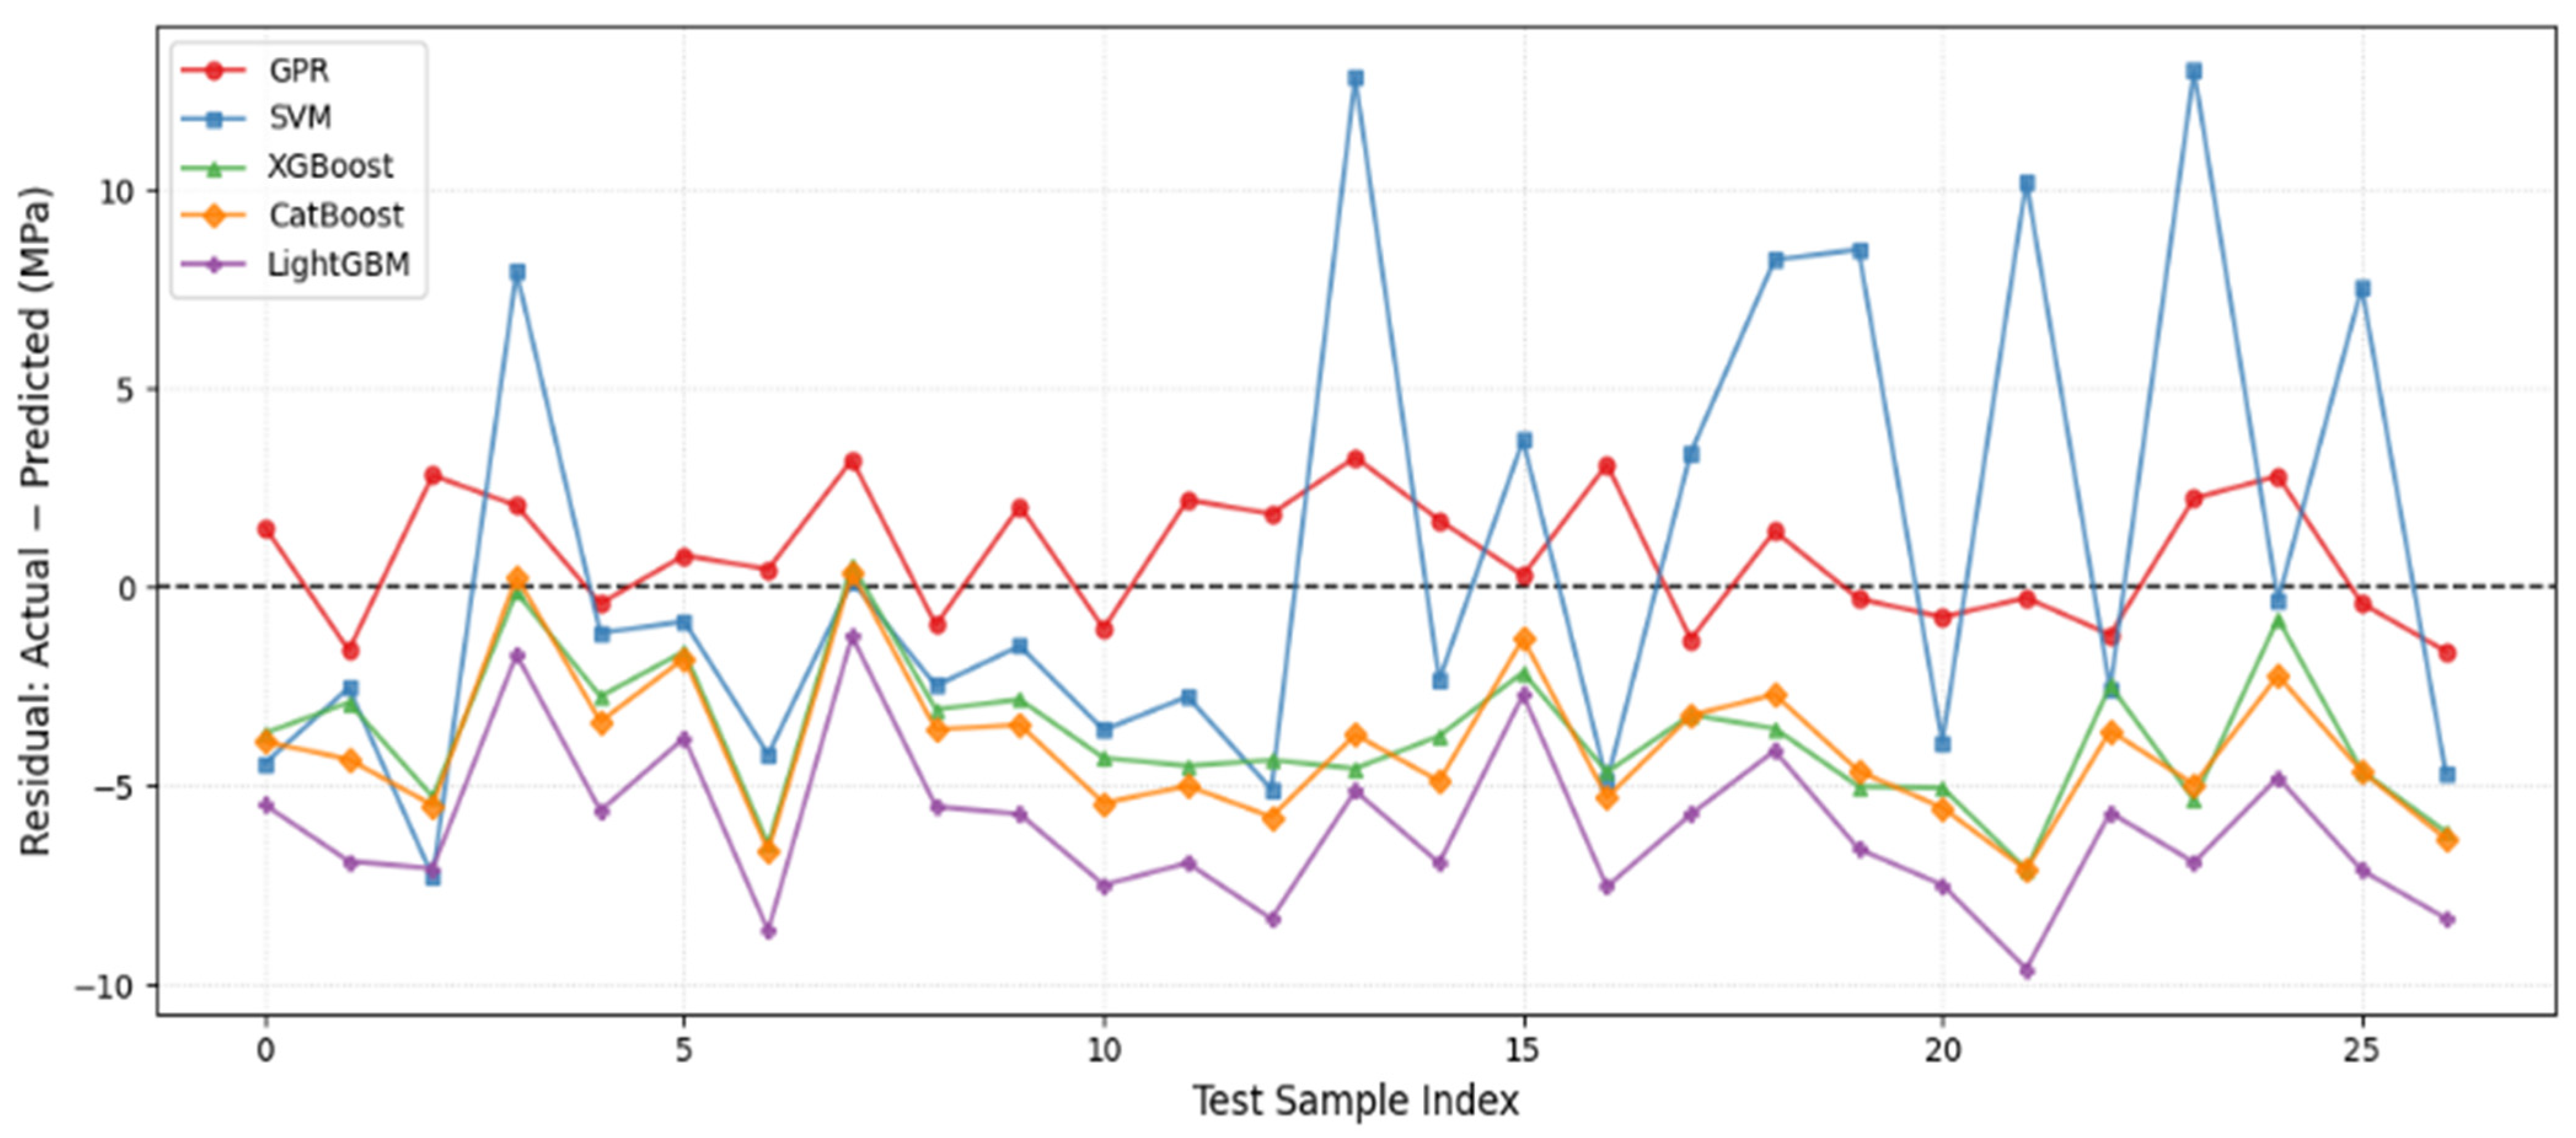
Residual distribution for the blocked-holdout test data set (Actual—Predicted, MPa).
Figure 9.
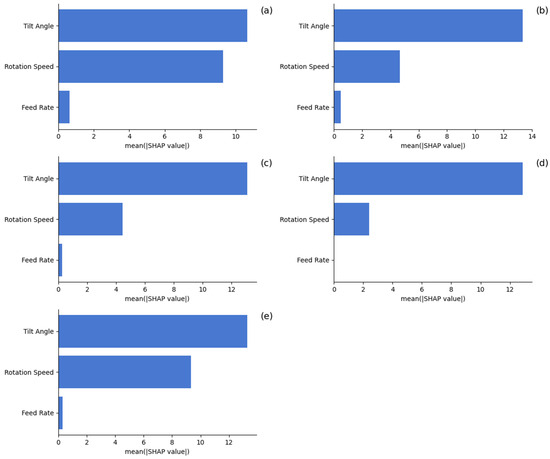
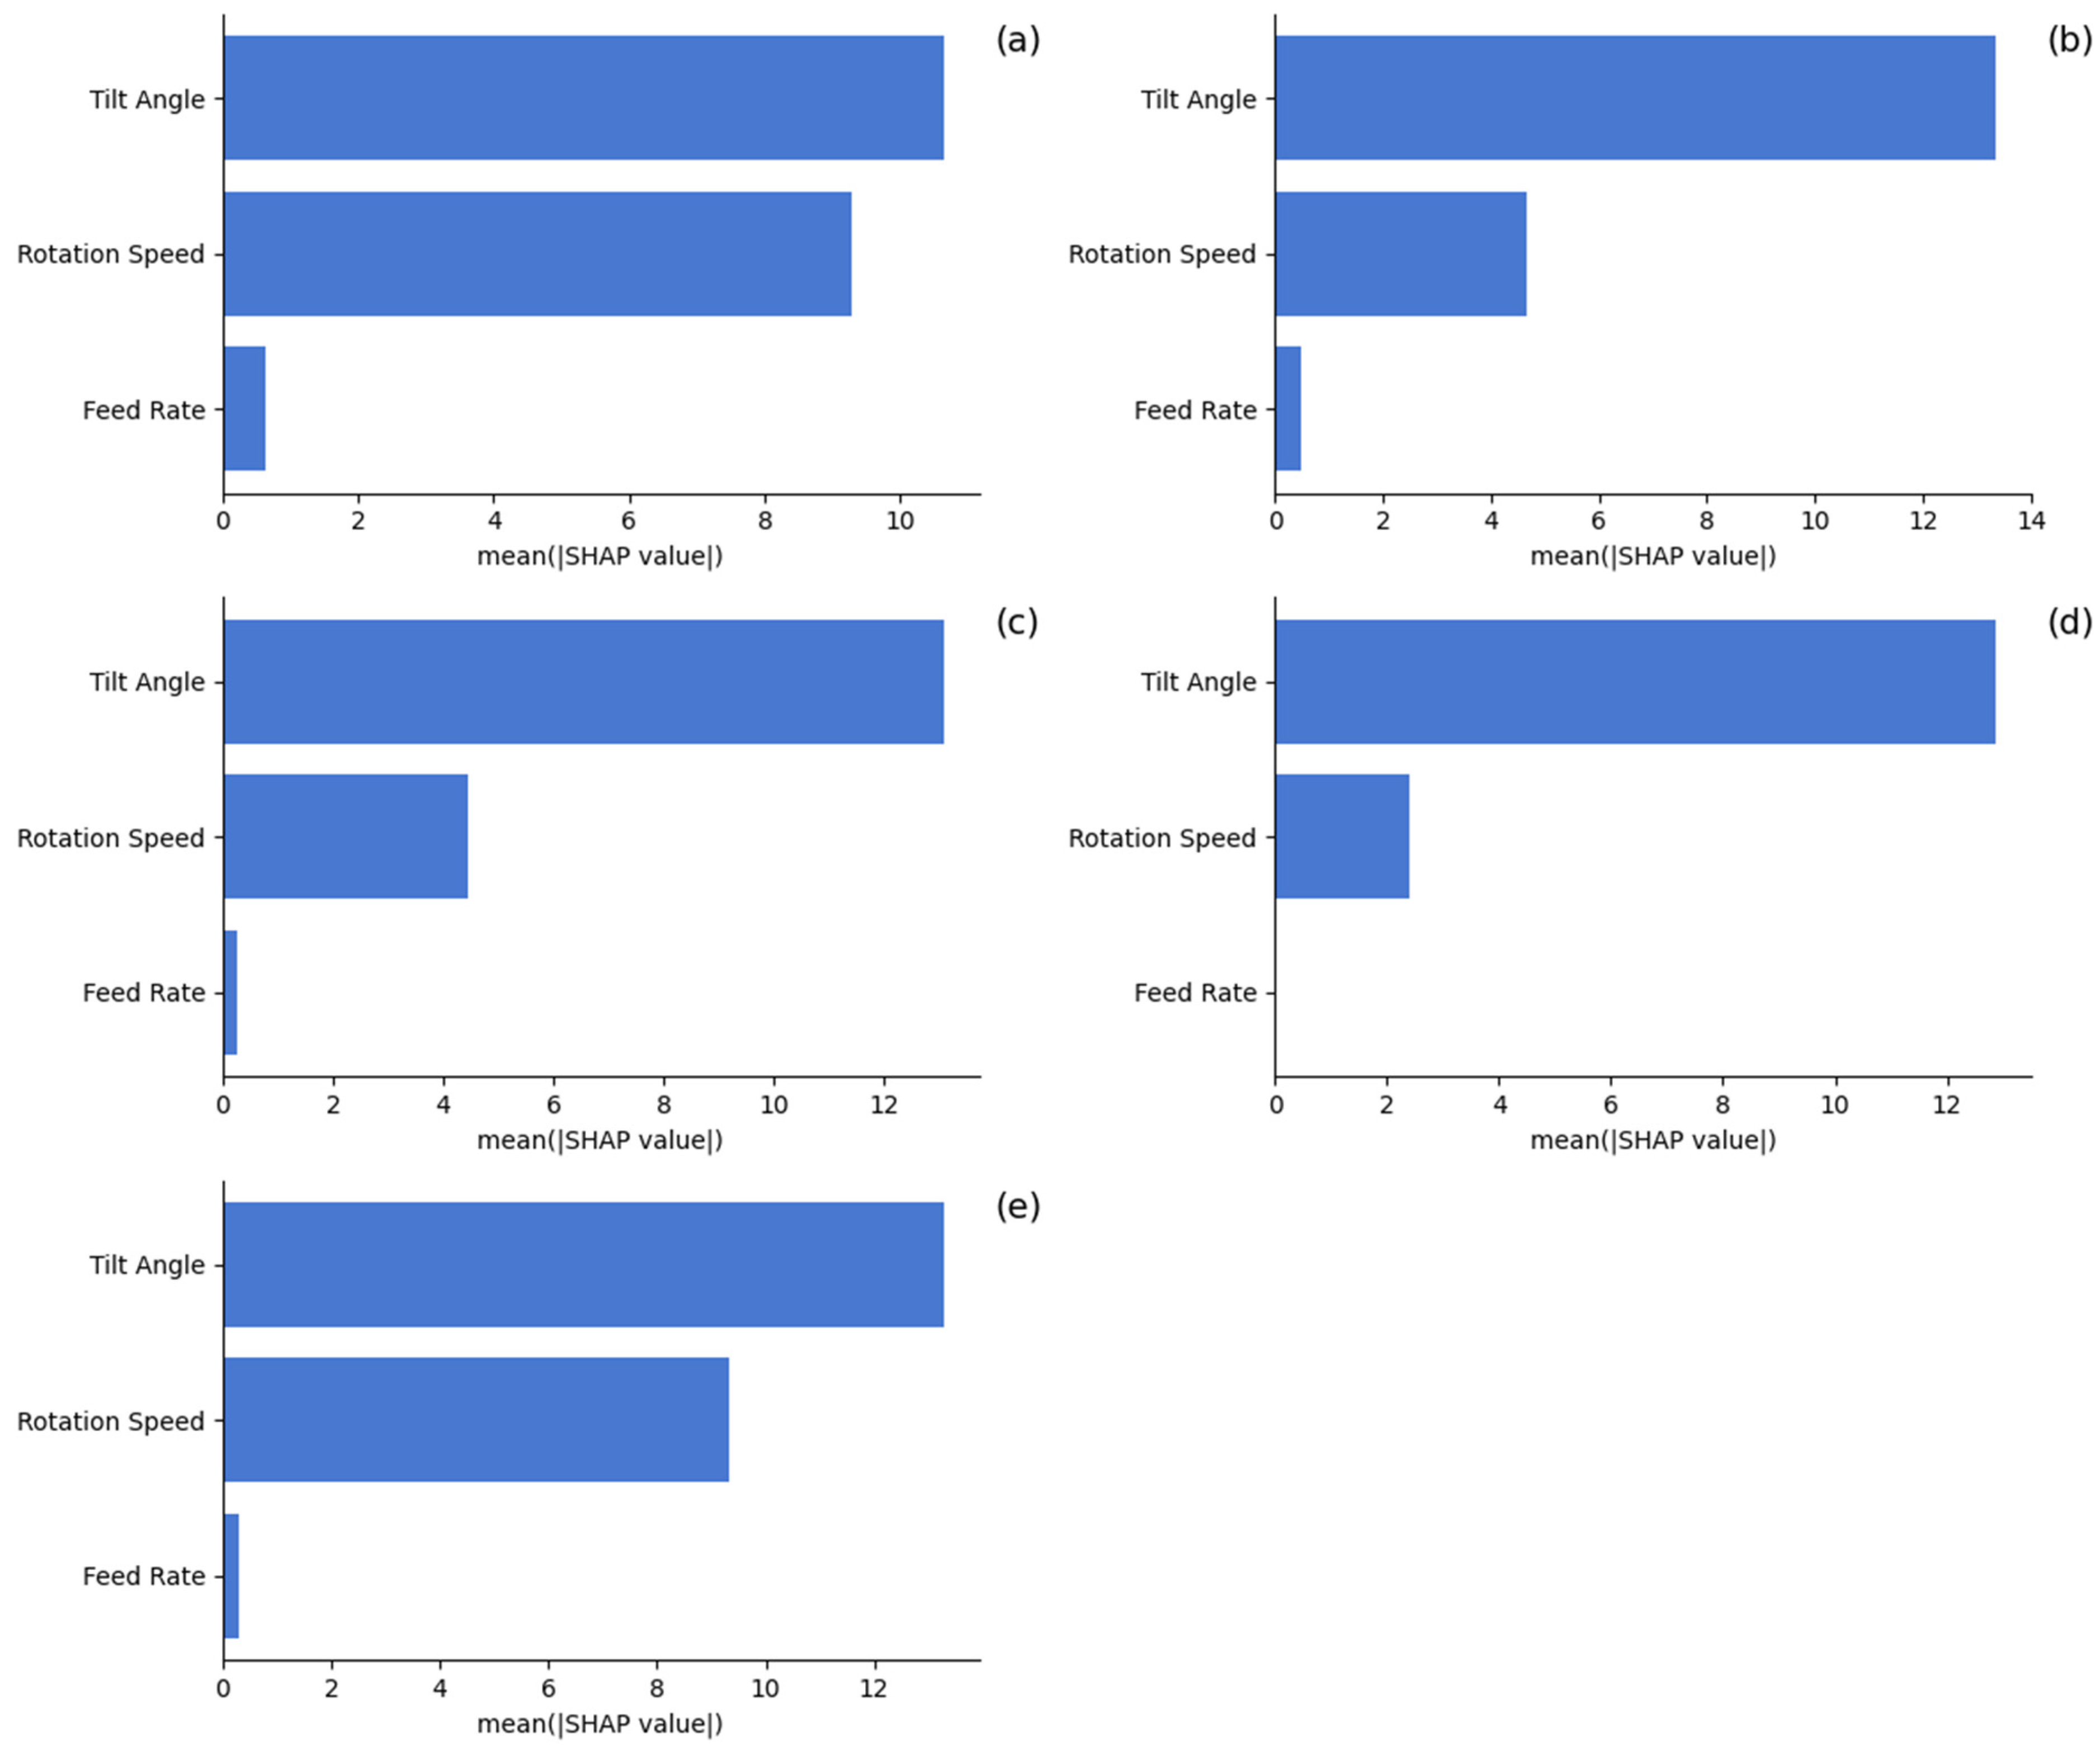
SHAP feature-importance bar plots for the five predictive models: (a) SVM, (b) XGBoost, (c) CatBoost, (d) LightGBM, and (e) GPR, indicating that tool tilt angle is the most influential predictor of UTS, followed by rotational speed, whereas feed rate makes the smallest contribution.
Table 4.
Bootstrap 95% confidence intervals (2000 resamples) for R2 and RMSE on the blocked-holdout test set.
Bootstrap resampling of the blocked-holdout predictions (Table 4) confirms that the observed performance ranking is statistically robust: the 95% confidence interval for GPR (R2 = 0.976–0.991) does not overlap with the intervals obtained for SVM, LightGBM, or the MLR baseline, indicating that GPR’s superiority is unlikely to be an artefact of the limited test-set size (n = 27). The relatively wide interval obtained for the MLR baseline, which spans negative R2 values, further corroborates the nonlinearity of the underlying relationship.
3.2. Expected and Residual Data Analysis
A comparison of the predicted and measured UTS results obtained for the training and blocked-holdout test conditions is presented in Figure 5, Figure 6, Figure 7 and Figure 8. As illustrated in the training scatter plot in Figure 5, the predictions of GPR, XGBoost, CatBoost, and SVM exhibited a higher degree of agreement with each other when they closely followed the 1:1 line. In contrast, the predictions of LightGBM demonstrated a greater degree of dispersion. An additional pattern emerges in the blocked-holdout test scatter plot, Figure 6. In summary, GPR predictions demonstrate the closest proximity to the diagonal, closely followed by XGBoost and CatBoost. The visual observation is consistent with the numerical data presented in Table 3.
As shown in Figure 7, the sequential prediction plot indicates that GPR aligns more closely with the experimental UTS trend in the 27 blocked-holdout test observations, exhibiting both gradual and sharper local changes. Furthermore, XGBoost and CatBoost consistently yield satisfactory results, exhibiting a uniform distribution across all metrics. Conversely, SVM, particularly LightGBM, demonstrates greater variability in outcomes across different testing points. Due to the limited size of the dataset, the findings must be interpreted with caution, as they are likely indicative of LightGBM’s sensitivity to the selected data partition and hyperparameters rather than an inherent general limitation of the algorithm.
In Figure 8, the residual plot corroborates the same intuition. The positive GPR residuals exhibit a tight clustering around zero, indicating a lack of systematic bias or predictability in their direction. This observation is consistent with the findings reported by XGBoost and CatBoost, which also demonstrate relatively stable residual behaviour. In contrast, LightGBM exhibits a wider and less stable residual distribution, while SVM demonstrates larger residual variations compared to the top-performing models across various test points.
3.3. Sensitivity and SHAP Analysis
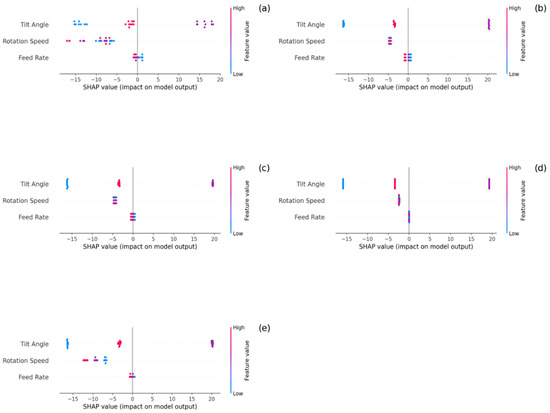
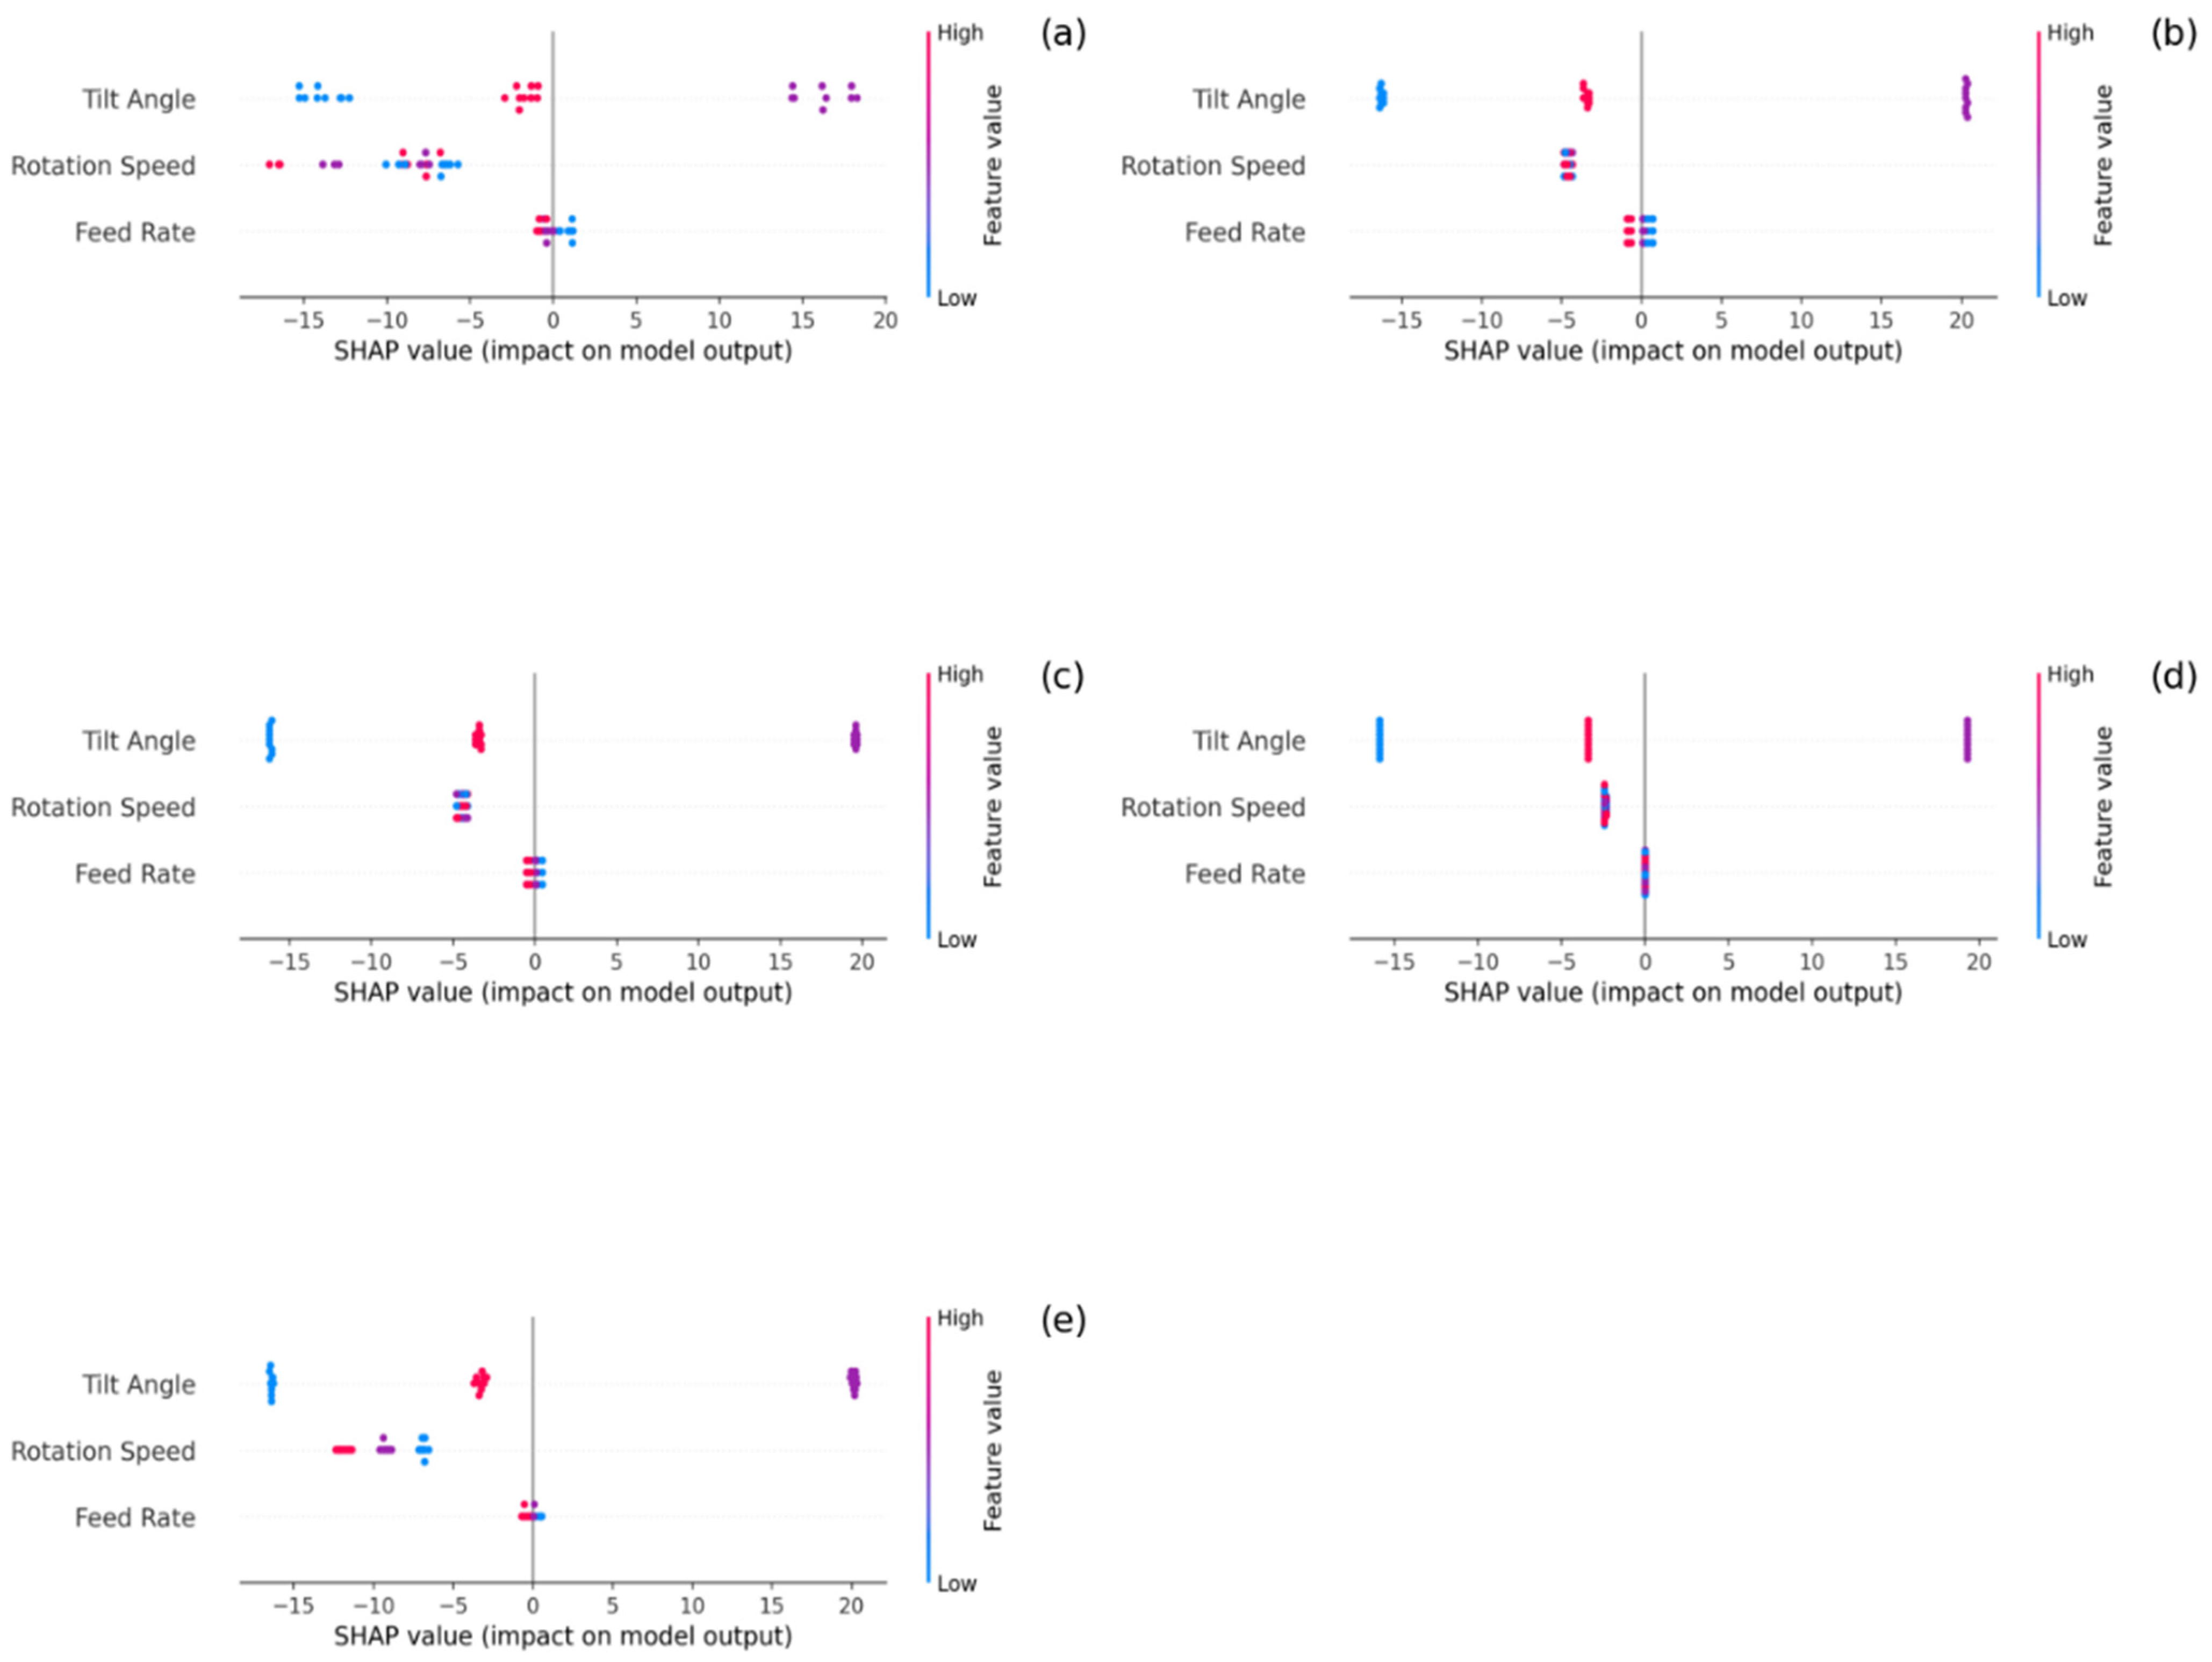
Sensitivity and SHAP analyses were performed to determine how much the input variables are involved, whether the trend of feature-importance did not shift across the five models used. All the models used produced a highly comparable order of process parameters, displayed in Figure 9. The contribution of tilt angle was identified as the most pronounced predictor of UTS, with rotational speed ranking second and feed rate contributing the least. This commonality among various algorithms indicates this to be the robustness among the determined feature hierarchy. The SHAP summary plots shown here are valuable for demonstrating the direction of the effects of the input variables. Overall the lowest tilt angle had the most negative contribution to predicted UTS and the intermediate tilt angle the best. At the highest tilt angle, the contribution not only fell off the apparent optimum, but had also shifted, which demonstrated a non-monotonic relation between the tilt angle and the tensile strength. The effect was a different but also less pronounced trend for the rotational speed: lower rotational speeds were generally associated with higher predicted UTS values, and higher speeds were associated with lower predicted strength. Feed rate stayed tightly packed around the zero point in a significant number of cases. Thus, there was probably a relatively small influence of it on other variables in the analyzed range. As a whole, the SHAP results indicate that tilt angle is the strongest predictor in the given data set, and rotational speed plays a role in terms of performance. Figure 10 presents the SHAP summary plots for the five predictive models, namely SVM, XGBoost, CatBoost, LightGBM, and GPR, illustrating the directional influence of tool tilt angle, rotational speed, and feed rate on the prediction of ultimate tensile strength (UTS).
Figure 10.
SHAP summary plots for the five predictive models: (a) SVM, (b) XGBoost, (c) CatBoost, (d) LightGBM, and (e) GPR, showing the directional influence of tool tilt angle, rotational speed, and feed rate on UTS prediction.
The dominance of tilt angle as the strongest SHAP-ranked predictor is consistent with its established mechanical role in FSW. The tool tilt angle directly governs the forging pressure exerted by the trailing edge of the shoulder on the plasticized material, which controls material consolidation beneath the tool and the effective contact area between the shoulder and the workpiece [4,5,27]. At insufficient tilt, the trailing-edge contact pressure is reduced, increasing the likelihood of incomplete consolidation and void-type defects in the stir zone, which is consistent with the pronounced negative SHAP contribution observed at the lowest tilt angle. As tilt increases toward an intermediate value, the trailing-edge pressure promotes more effective material forging and a more uniform stir-zone microstructure, in agreement with the positive contribution observed at intermediate tilt. The decline and partial reversal of the SHAP contribution at the highest tilt angle are plausibly associated with excessive forging pressure, which can locally increase frictional heat input, promote grain coarsening, or induce flash formation and material thinning, all of which would be expected to reduce the measured tensile strength. While the present dataset does not include direct microstructural evidence (e.g., grain size or defect density measurements) to confirm this mechanism, the observed non-monotonic SHAP trend for tilt angle is qualitatively consistent with previously reported tilt-angle effects on stir-zone consolidation quality in FSW of magnesium and aluminum alloys, and motivates microstructural correlation as a direction for future work.
Feature Engineering Assessment
To address the possibility that physics-informed feature engineering could further enhance model performance, a derived input representing the ratio of rotational speed to feed rate, commonly used in the FSW literature as a proxy for heat input per unit length, was constructed and incorporated into the modelling pipeline. Re-evaluation on the blocked-holdout test set showed no consistent improvement across the five models; performance changes were negligible and, in most cases, marginally unfavourable. This outcome is consistent with the fact that the engineered ratio is a deterministic function of two parameters already present in the input space, meaning that the tree-based and kernel-based models are inherently capable of capturing the corresponding interaction without requiring it to be made explicit. The result suggests that, within the present three-parameter design space, the raw process variables already provide sufficient information for the models to learn the relevant nonlinear interactions, and that further feature engineering of this kind offers limited additional value.
3.4. Comparison with Previous Studies
To address the possibility that the reported blocked-holdout performance reflects an arbitrarily favourable train–test split, a multi-fold blocked cross-validation was additionally performed, cycling through all 11 rotational-speed levels as the held-out fold (Table 5). Across folds, all nonlinear models maintained consistently high R2 (≥0.97) with low standard deviation, indicating that the strong generalization performance is not contingent on the specific boundary chosen for the primary blocked-holdout test. It is worth noting that the main blocked-holdout test set (1300–1400 rpm) corresponds to the upper boundary of the investigated rotational-speed range and therefore represents a stricter, extrapolation-type evaluation, whereas most of the 11 leave-one-speed-out folds involve interpolation within the observed range. The primary evaluation strategy was deliberately retained as the more demanding scenario, while the multi-fold results presented here provide additional evidence that the model ranking remains stable across alternative held-out regions.
Table 5.
Multi-fold blocked cross-validation: each of the 11 rotational-speed levels was held out in turn as an independent test fold.
A substantial body of research has previously demonstrated a decline in the predictive confidence of models that attempt to simulate the tensile behaviour of magnesium alloys. This decline has been observed when utilizing heterogeneous datasets, which are derived from literature sources or developed using computational methods. For example, Xu et al. [28] reported an R2 value of approximately 0.88 for the prediction of tensile properties in AZ31 magnesium alloys, while Dong et al. [29] reported an R2 of about 0.93 using a hybrid machine-learning framework supported by generated data. In the present study, the best-performing model under the blocked-holdout evaluation strategy was GPR, which achieved an R2 of 0.985 and an RMSE of 1.798 MPa. Although these values are numerically higher than those reported in the above studies, direct one-to-one comparison should be made with caution because the datasets differ in origin, consistency, material scope, and validation strategy.
The comparatively strong performance observed here is more plausibly attributed to the internal consistency of the controlled single-source dataset than to an unconditional algorithmic advantage. Because the present data were generated on the same machine, with the same material system, and under a standardized tensile-testing procedure, inter-laboratory variability, equipment-related differences, and specimen-preparation inconsistencies were minimized. In addition, the present study adopted a stricter evaluation strategy based on blocked-holdout testing with domain-aware train–test separation, which provides a more demanding assessment of model generalization than a conventional random split. For this reason, the reported metrics should not be interpreted as a guarantee of equivalent performance for data produced by different operators, machines, or laboratories. Thus, further validation on genuine external datasets is needed to establish wide industrial generalization.
The obtained UTS interval of 126.45–178.37 MPa gives us a weld-efficiency range of ∼49–69% compared to the base-metal tensile strength of ~260 MPa of AZ31B-H24. This range is in agreement with values reported in the literature from similar Mg-Mg friction stir welded joints [15,17], indicating that the experimental results are realistic from a metallurgical standpoint and that machine learning models were trained on physically meaningful properties data.
3.5. Process Optimization Map
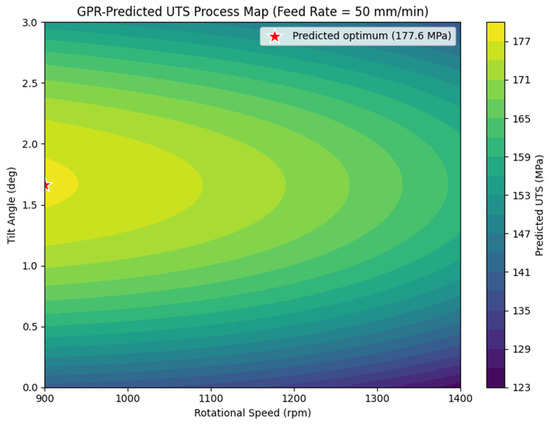
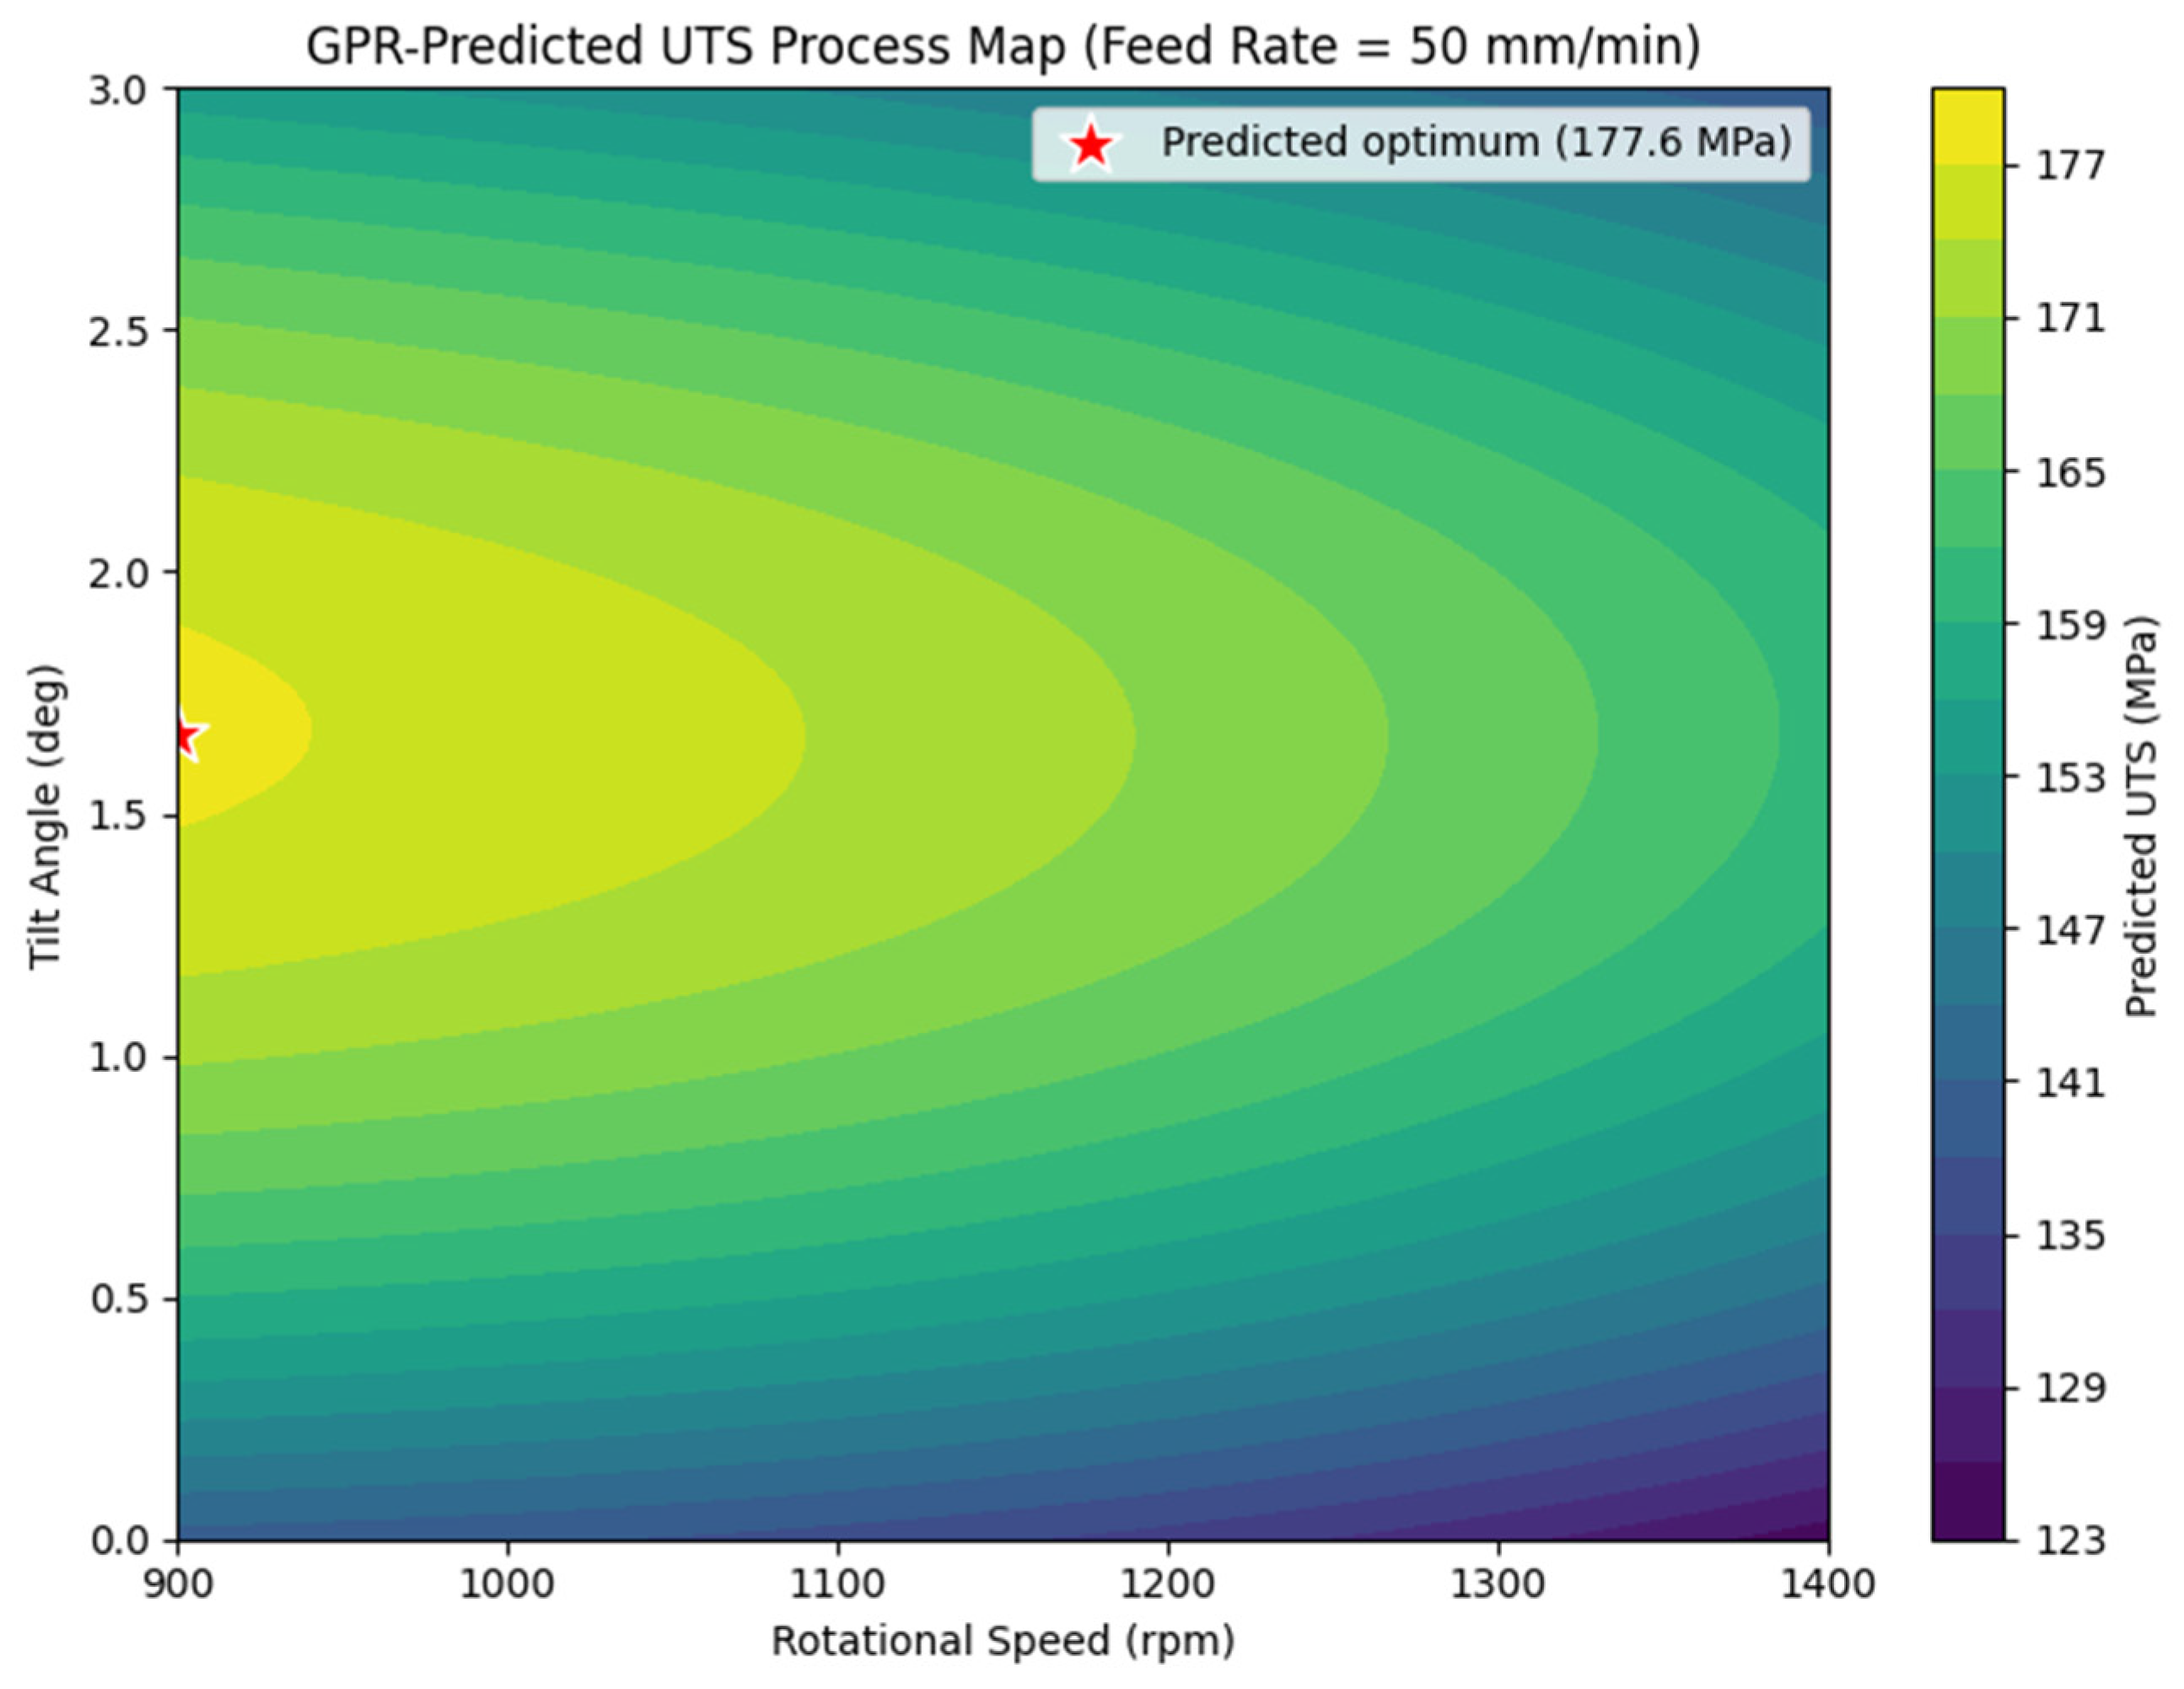
To illustrate the practical applicability of the trained models beyond predictive accuracy, the best-performing model (GPR) was used to construct a process optimization map across the rotational-speed and tilt-angle plane, with feed rate fixed at its dataset median (50 mm/min). Figure 11 presents the resulting predicted-UTS surface. The model identified a predicted optimum of 177.6 MPa at a rotational speed of 900 rpm and a tilt angle of approximately 1.65°, consistent with the SHAP-based findings, where lower rotational speeds and intermediate tilt angles were associated with higher predicted UTS. It should be noted that the predicted optimum lies at the lower boundary of the investigated rotational-speed range (900 rpm); consequently, this result should be interpreted as the best-supported operating point within the sampled parameter space rather than evidence that further reductions in rotational speed below this boundary would continue to improve joint strength, since such extrapolation falls outside the validated domain of the model. This process map demonstrates how the trained GPR model could support practical FSW parameter selection, complementing its primary role as a predictive tool.
Figure 11.
GPR-predicted UTS process map across rotational speed and tilt angle, with feed rate fixed at 50 mm/min.
3.6. Limitations
Several limitations should be acknowledged. First, the input space was restricted to feed rate, rotational speed, and tilt angle; process variables known to influence FSW joint quality, such as axial (plunge) force [30], tool geometry [31], and thermal history [32], were not measured in the present experimental campaign and could not be incorporated into the models. Second, although the dataset comprised 297 individual tensile tests, model development relied on 99 averaged observations, which is a modest sample size for training and comparing five distinct regression algorithms; the bootstrap and multi-fold cross-validation analyses were intended to partially mitigate, though not eliminate, this concern. Third, the dataset originates from a single FSW machine, material batch, and laboratory; consequently, the reported metrics should not be interpreted as a guarantee of equivalent performance on data generated by different equipment, operators, or laboratories, and external validation on independently generated datasets remains necessary before broader industrial generalization can be claimed. Finally, the present analysis is purely data-driven; correlating the SHAP-based feature rankings with direct microstructural evidence was beyond the scope of the available dataset and is identified as a direction for future work. More broadly, the combination of SHAP-based interpretability with leakage-aware evaluation protocols, as adopted in this study, reflects a methodological approach that has been increasingly applied across diverse engineering machine-learning domains [33,34].
4. Conclusions
Five regression models were developed and compared to predict the UTS of friction stir welded AZ31B magnesium alloy joints using a controlled single-source dataset of 99 observations. The GPR model delivered the highest overall predictive performance in a blocked-holdout evaluation with an R2 = 0.985 and RMSE = 1.798 MPa, while XGBoost and CatBoost also demonstrated competitive performance; however, LightGBM exhibited the lowest generalization capability, suggesting heightened sensitivity to data partitioning in small datasets. SHAP analysis revealed that the tilt angle was consistently the most significant predictor, followed by rotational speed, whereas feed rate showed the minimum contribution. A multiple linear regression baseline confirmed the strongly nonlinear character of the UTS–process-parameter relationship, while bootstrap confidence intervals and a multi-fold blocked cross-validation across all rotational-speed levels indicated that the observed model ranking, with GPR consistently outperforming the other algorithms, is statistically robust and not an artefact of the specific blocked-holdout split adopted. By implementing rigorous methodologies such as blocked holdouts and GroupKFold hyperparameter tuning to minimize data leakage, this study delivered a stringent estimate of out-of-sample performance, suggesting that future work should expand the input space to include variables like axial force and tool geometry.
Author Contributions
Conceptualization, F.T.; methodology, F.T.; software, E.O.; validation, F.T.; formal analysis, F.T.; investigation, F.T. and E.O.; resources, F.T.; data curation, F.T.; writing—original draft preparation, F.T. and E.O.; writing—review and editing, F.T.; visualization, F.T. All authors have read and agreed to the published version of the manuscript.
Funding
This research received no external funding.
Data Availability Statement
The data presented in this study are available on request from the corresponding author.
Conflicts of Interest
The authors declare that they have no known competing financial interests or personal relationships that could have appeared to influence the work reported in this paper.
Abbreviations
The following abbreviations are used in this manuscript:
| ML | Machine Learning |
| AI | Artificial Intelligence |
| FSW | Friction Stir Welding |
| GPR | Gaussian Process Regression |
| SVM | Support Vector Machine |
| UTS | Ultimate Tensile Strength |
References
- Khan, M.M.; Nemati, A.; Rahman, Z.U.; Shah, U.H.; Asgar, H.; Haider, W. Recent advancements in bulk metallic glasses and their applications: A review. Crit. Rev. Solid State Mater. Sci. 2018, 43, 233–268. [Google Scholar] [CrossRef] [Scilit]
- Tan, J.; Ramakrishna, S. Applications of magnesium and its alloys: A review. Appl. Sci. 2021, 11, 6861. [Google Scholar] [CrossRef] [Scilit]
- Meher, A.; Mahapatra, M.; Samal, P.; Vundavilli, P. A review on manufacturability of magnesium matrix composites: Processing, tribology, joining, and machining. CIRP J. Manuf. Sci. Technol. 2022, 39, 134–158. [Google Scholar] [CrossRef] [Scilit]
- Salih, O.S.; Ou, H.; Sun, W. Heat generation, plastic deformation and residual stresses in friction stir welding of aluminium alloy. Int. J. Mech. Sci. 2023, 238, 107827. [Google Scholar] [CrossRef] [Scilit]
- Kumar, S.; Triveni, M.K.; Katiyar, J.K.; Tiwari, T.N.; Roy, B.S. Prediction of heat generation effect on force, torque, and mechanical properties at varying tool rotational speed in friction stir welding using artificial neural network. Proc. Inst. Mech. Eng. Part C J. Mech. Eng. Sci. 2023, 237, 4495–4514. [Google Scholar] [CrossRef] [Scilit]
- Delir Nazarlou, R.; Pathak, R.; Schmidt, O.; Köpp, C.; Münchinger, E.; Schilling, C.; Salim, S.; Wiegand, M.; Kahlmeyer, M.; Jiang, Y.; et al. Optimizing and development of friction stir welding using AI-supported prediction method and digital twin technology. Weld. World 2026, 70, 935–948. [Google Scholar] [CrossRef] [Scilit]
- Elsheikh, A.H. Applications of machine learning in friction stir welding: Prediction of joint properties, real-time control and tool failure diagnosis. Eng. Appl. Artif. Intell. 2023, 121, 105961. [Google Scholar] [CrossRef] [Scilit]
- Bilgin, T.T.; Kunduracı, M.S.; Metin, A.; Doğru, M.; Nayir, E. Application of artificial intelligence techniques for defect prevention and quality control in arc welding processes: A comprehensive review. Middle East J. Sci. 2024, 10, 179–206. [Google Scholar] [CrossRef] [Scilit]
- Ravi Kumar, B.V.R.; Upender, K.; Ramana, M.V.; Sreenivasa Rao, M.S. Machine learning based tensile strength prediction and analysis on friction stir welded dissimilar joints (AA6082-AA5083) using conventional and hybrid tool pin profiles. Mater. Today Proc. 2023, in press. [Google Scholar] [CrossRef] [Scilit]
- Sambath, Y.; Natarajan, R.; Babu, P.K.; Raju, K.R.; Alahmadi, A.A.; Alwetaishi, M.; Khan, S.A. Comparative analysis of predictive modeling techniques for mechanical properties in dissimilar Friction Stir Welding of AA6061 and AZ31B. J. Mater. Eng. Perform. 2025, 34, 15597–15613. [Google Scholar] [CrossRef] [Scilit]
- Soto-Diaz, R.; Vásquez-Carbonell, M.; Escorcia-Gutierrez, J. A review of artificial intelligence techniques for optimizing friction stir welding processes and predicting mechanical properties. Eng. Sci. Technol. Int. J. 2025, 62, 101949. [Google Scholar] [CrossRef] [Scilit]
- Dorbane, A.; Harrou, F.; Sun, Y.; Ayoub, G. Machine learning for modeling and defect detection of friction stir welds: A review. J. Fail. Anal. Prev. 2025, 25, 110–139. [Google Scholar] [CrossRef] [Scilit]
- Sarsilmaz, F.; Kavuran, G. Prediction of the optimal FSW process parameters for joints using machine learning techniques. Mater. Test. 2021, 63, 1104–1111. [Google Scholar] [CrossRef] [Scilit]
- Fuse, K.; Venkata, P.; Reddy, R.M.; Bandhu, D. Machine learning classification approach for predicting tensile strength in aluminium alloy during friction stir welding. Int. J. Interact. Des. Manuf. 2025, 19, 639–643. [Google Scholar] [CrossRef] [Scilit]
- Thakur, A.; Sharma, V.; Bhadauria, S.S. Improving tensile properties by varying the welding conditions of the passes of the double-sided friction stir welding of AZ31B magnesium alloy. Mater. Today Commun. 2023, 34, 105406. [Google Scholar] [CrossRef] [Scilit]
- Xu, N.; Song, Q.; Bao, Y.; Fujii, H. Investigation on microstructure and mechanical properties of cold source assistant friction stir processed AZ31B magnesium alloy. Mater. Sci. Eng. A 2019, 761, 138027. [Google Scholar] [CrossRef] [Scilit]
- Husain, M.M.; Haldar, N.; Meena, L.K.; Ghosh, M. Evaluation of microstructure, mechanical properties, wear resistance and corrosion behaviour of friction stir-processed AZ31B-H24 magnesium alloy. Metallogr. Microstruct. Anal. 2023, 12, 34–48. [Google Scholar] [CrossRef] [Scilit]
- Mishra, A. Artificial intelligence algorithms for prediction of the ultimate tensile strength of the friction stir welded magnesium alloys. Int. J. Interact. Des. Manuf. 2024, 18, 1779–1787. [Google Scholar] [CrossRef] [Scilit]
- Imoisili, P.E.; Makhatha, M.E.; Jen, T.-C. Artificial intelligence prediction and optimization of the mechanical strength of modified natural fibre/MWCNT polymer nanocomposite. J. Sci. Adv. Mater. Devices 2024, 9, 100705. [Google Scholar] [CrossRef] [Scilit]
- D’Orazio, A.; Forcellese, A.; Simoncini, M. Prediction of the vertical force during FSW of AZ31 magnesium alloy sheets using an artificial neural network-based model. Neural Comput. Appl. 2019, 31, 7211–7226. [Google Scholar] [CrossRef] [Scilit]
- Krishnamurthy, B.; Rakkiyannan, J. Enhancing tool condition monitoring in friction stir welding with probabilistic neural network algorithm. Front. Mech. Eng. 2025, 11, 1613216. [Google Scholar] [CrossRef] [Scilit]
- Tolun, F. Effect of tool rotational speed and position on mechanical and microstructural properties of friction stir welded dissimilar alloys AZ31B Mg and Al6061. Mater. Test. 2022, 64, 714–725. [Google Scholar] [CrossRef] [Scilit]
- Zhou, B.; Feng, H.; Leng, Z.; Zhang, H. Effect of microstructure and mechanical properties of Al/Mg dissimilar alloy with Pb interlayer by friction stir welding. J. Sci. Adv. Mater. Devices 2025, 10, 100845. [Google Scholar] [CrossRef] [Scilit]
- ASTM E8-04; Standard Test Methods for Tension Testing of Metallic Materials. ASTM International: West Conshohocken, PA, USA, 2020. Available online: https://store.astm.org/e0008_e0008m-25.html (accessed on 1 June 2026).
- Williams, C.K.; Rasmussen, C.E. Gaussian Processes for Machine Learning; MIT Press: Cambridge, MA, USA, 2006. [Google Scholar]
- Álvarez, M.A.; Rosasco, L.; Lawrence, N.D. Kernels for vector-valued functions: A review. Found. Trends Mach. Learn. 2012, 4, 195–266. [Google Scholar] [CrossRef] [Scilit]
- Rizkallah, L.W. Enhancing the performance of gradient boosting trees on regression problems. J. Big Data 2025, 12, 35. [Google Scholar] [CrossRef] [Scilit]
- Xu, X.; Wang, L.; Zhu, G.; Zeng, X. Predicting tensile properties of AZ31 magnesium alloys by machine learning. JOM 2020, 72, 3935–3942. [Google Scholar] [CrossRef] [Scilit]
- Dong, S.; Wang, Y.; Li, J.; Li, Y.; Wang, L.; Zhang, J. Machine learning aided prediction and design for the mechanical properties of magnesium alloys. Met. Mater. Int. 2024, 30, 593–606. [Google Scholar] [CrossRef] [Scilit]
- Razal Rose, A.; Manisekar, K.; Balasubramanian, V. Effect of axial force on microstructure and tensile properties of friction stir welded AZ61A magnesium alloy. Trans. Nonferrous Met. Soc. China 2011, 21, 974–984. [Google Scholar] [CrossRef] [Scilit]
- Mallieswaran, K.; Padmanabhan, R.; Rajendran, C. Influence of tool pin profile on the microstructure and mechanical properties of friction stir welded copper–brass dissimilar joints. Trans. Can. Soc. Mech. Eng. 2026, 50, 1–14. [Google Scholar] [CrossRef] [Scilit]
- Chai, F.; Zhang, D.; Li, Y. Effect of thermal history on microstructures and mechanical properties of AZ31 magnesium alloy prepared by friction stir processing. Materials 2014, 7, 1573–1589. [Google Scholar] [CrossRef] [Scilit] [PubMed]
- Yılmaz, Ü. Behavioral Clustering and Load Characterization of EV Charging Stations: Revealing Hidden Grid Stress Patterns Using Machine Learning. Processes 2026, 14, 1692. [Google Scholar] [CrossRef] [Scilit]
- Yılmaz, Ü. Behavioral Fault Diagnosis in Inverter-Driven PMSM Systems Using a Hybrid CNN–BiLSTM–Attention Deep Learning Framework with SHAP-Based Interpretability. Machines 2026, 14, 638. [Google Scholar] [CrossRef] [Scilit]

Disclaimer/Publisher’s Note: The statements, opinions and data contained in all publications are solely those of the individual author(s) and contributor(s) and not of MDPI and/or the editor(s). MDPI and/or the editor(s) disclaim responsibility for any injury to people or property resulting from any ideas, methods, instructions or products referred to in the content. |
© 2026 by the authors. Licensee MDPI, Basel, Switzerland. This article is an open access article distributed under the terms and conditions of the Creative Commons Attribution (CC BY) license.