


Abstract
Predictive maintenance (PdM) has proven to be a critical strategy for minimizing downtime and optimizing operational efficiency in industrial systems. In this work the authors propose a data-driven PdM framework for circulating water pumps (CWPs), combining statistical analysis with machine learning. This begins with the analysis of a multivariate time-series dataset consisting of 51 sensors monitoring motor electrical parameters, pump hydraulics, vibration, temperatures, broken states, recovery states and finally normal states. With the help of a statistical analysis, utilizing boxplots and both Pearson and Spearman correlation indices, the aim is to identify the key degradation parameters. Notably, motor phase current (Pearson r = −0.872), pump vibration (r = −0.809), and discharge pressure (r = −0.732) showed the strongest negative correlation with failure states, revealing a complete system shutdown pattern during failure conditions. Applying these results to the development of a Random Forest classification model was the next step. Due to class imbalance and label interpretation challenges, i.e., normal state, broken state and recovery state, the reformulation of the multi-class problem into a binary task focusing on “at-risk” states was executed. Therefore, this led to the critical finding of the reversal of conventional state labels, where RECOVERING states were found to correspond to inactive post-shutdown conditions requiring maintenance intervention, whereas BROKEN states exhibited characteristics more consistent with partial degradation. Lastly, the statistically selected feature model achieved a Recall of 0.76, a Precision of 0.70 and an F1-score of 0.73. Furthermore, a physics-based grouped subsystem representation combining vibration, electrical, hydraulic, thermal and rotational measurements substantially improved classification performance, achieving a Precision = 0.997, a Recall = 0.992 and an F1-score = 0.995. These results demonstrate the effectiveness of combining statistical analysis, engineering knowledge and machine learning for the predictive maintenance of industrial pumping systems.
1. Introduction
In industry, circulating water pumps (CWPs) represent essential components in cooling, heat-transfer, and fluid-circulation systems; therefore, verifying their good operation proves necessary for maintaining production continuity, equipment safety, and cost-effective maintenance. Over the years, maintenance strategies have evolved from corrective (reacting after failure) to preventive (scheduled servicing) and now to predictive maintenance (PdM)—where faults are anticipated before they manifest [1]. Predictive maintenance leverages real-time and known sensor data, like advanced analytics such as statistical analysis and machine learning (ML), to detect changes in equipment behavior that may serve as a signal of degradation or future failure. The scientific evolution from preventive to predictive maintenance has been mainly driven by the goal to reduce downtime, optimize scheduling, extend asset life, and improve system reliability [2]. As in many mechanical systems, the pump system also faces many challenges such as failure modes from hydraulic instabilities, from bearing wear, from sealing degradation, from motor overload and from cavitation and flow blockages. Problems such these can lead to severe efficiency loss or catastrophic downtime [3].
Recent advancements in PdM research have expanded its scope, changing its profile. For example, in the work of [3,4] one may see the transition from condition monitoring to prognostics, incorporating machine learning with the necessary statistical analysis and modeling in order to achieve a more accurate prediction of asset health and remaining life [5,6]. Studies [7,8] have demonstrated that integrating vibration, temperature, and electrical signal analysis with ML algorithms provides a clearer image of the physical problem at hand, for it helps with feature extraction and anomaly detection capabilities [9,10,11]. For rotating equipment such as centrifugal and circulating pumps, data-driven PdM frameworks have been shown to present early signs of hydraulic and mechanical degradation, offering the opportunity for a proactive intervention before total failure [3,12,13,14]. Moreover, hybrid approaches to diagnosis involving expert systems, fuzzy-logical processes, and more sophisticated vibration analyses have increased detection precision when varying loads are being applied [15,16,17]. Therefore, on account of this analytical assistance, one can arrive at conclusions pertaining to a meaning being derived within a sensor-based PdM system concerning precision and transparency within operations.
Recent advancements in Prognostic and Health Management (PHM) are focusing on non-invasive monitoring of complex mechanical assemblies such as Rotate Vector (RV) reducers in robotics. Specifically, researchers in [18,19] have extracted, selected and reduced features from embedded electrical current signals and managed to train high-accuracy classifiers. The framework created has been able to isolate subtle mechanical degradation even in cases where the faulty component is distinct from the motor itself.
Recent research has shifted toward deep learning frameworks: by utilizing embedded electrical current data, recent models have succeeded in extracting deep features capable of generalizing across variable speed profiles [20]. Those studies are considered novel due to the fact that they do not utilize traditional vibration or acoustic emission sensors and demonstrated robust fault classification performance even during the evaluation of unseen operating data, therefore offering scalable solutions for real world industrial cases.
Raouf et al. [21], emphasized the importance of aircraft landing gear (LG) parts for flight safety, discussing the parts and their related faults. Another study identified sensor-based PHM, emphasizing different fault identification and isolation (FDI) techniques with challenges and gaps existing in this field [22].
Despite these advancements, there are a number of critical challenges that still need to be overcome to better accomplish strong PdM processes for CWPs:
- Data imbalance: Just like in our case, there is less occurrence of faults compared to normal operating conditions, causing these results to be biased [6].
- Feature selection and interpretability: The choice among several features available (such as motor current, pressure, and vibration) remains a challenge to this date [1]. As will become apparent, both vibration and temperature factors will demonstrate to be very relevant to our choice of features.
- Generalization and scalability: Most research is done at a lab or pilot scale, but less validation on an industrial level is available [2,3,4]. The identification of an appropriate dataset is an essential part of understanding a phenomenon.
- Non-stationarity and fault evolution: As per definitions, degradation trends of pumps are generally non-linear and involve multiple stages such that standard linear correlations may not capture these processes [1,2,3,4,5,6].
Within this work, we deal with these problems using a 51-sensor CWP dataset, which provides information on electrical, hydraulic, vibration, and thermal variables. The goals are as follows:
- To execute a full-blown statistical investigation using both visual (boxplots) and quantitative (Pearson and Spearman) correlation tests. As indicated above, such a system is rather unpredictable when it comes to its irregular behavior. Thus, it is absolutely imperative to discover crucial variables involved within faulty progression processes [23,24].
- Developing a machine learning-based PdM model, which uses these statistical findings to identify an “at-risk” state to make proactive maintenance decisions.
An important finding within this dataset regards how it is revealed that RECOVERING states exhibited characteristics consistent with inactive post-shutdown conditions, whereas BROKEN states exhibited behavior more consistent with partial degradation. The proposed hybrid statistical and ML framework is therefore designed not only to predict faults but also to reinterpret operational state information for more accurate maintenance planning in real-world pump systems.
The remainder of the paper is structured as follows. Section 2 presents the dataset and preprocessing procedures. Section 3 describes the proposed statistical and machine learning methodology. Section 4 presents the experimental results and model evaluation. Section 5 discusses the findings, limitations, and implications for predictive maintenance of industrial pump systems.
2. Data Description and Preprocessing
The analysis in this paper is based on the Pump Sensor Data dataset, an openly available multivariate time-series dataset hosted on Kaggle [25]. The dataset contains operational measurements collected from an industrial circulating water pump system under real operating conditions.
The dataset comprises approximately 220,000 time-series observations recorded from 51 sensors, capturing a wide range of system variables that include electrical variables like motor phase currents, frequency, and active and reactive power; mechanical variables like vibration signals, shaft dynamics, and bearing conditions; hydraulic variables like suction and discharge pressures and flow rates; and finally thermal variables like bearing temperatures and lubrication oil temperatures. The dataset’s structure makes it well-suited for statistical characterization, correlation analysis, and supervised machine learning tasks, as it contains both continuous sensor readings, such as temperature and pressure, and categorical operational labels, such as the normal state, recovery state, and broken state [26,27,28].
This diversity of measurements provides a comprehensive representation of the pump’s operational behavior and enables us to study degradation patterns from a multiple physical perspective.
The observations come with an operational state label. The states are the following: NORMAL, steady-state operation; RECOVERING, transitional state following a disturbance or shutdown, and BROKEN, degraded or faulty operation.
However, it is important here to note that the dataset lacks detailed metadata. For instance, it is lacking sensor placement and calibration, pump type and configuration and maintenance records or failure annotations. These limitations are acknowledged and discussed in the section to follow, as they affect the physical interpretation of the results.
In addition, one has to mention that the dataset is highly imbalanced, with failure-related events being significantly underrepresented. In the original dataset, the number of explicitly labeled BROKEN states is extremely limited (on the order of only a few instances across the dataset), while RECOVERING states account for a small but non-negligible portion of the data. In order to address this imbalance and enable effective model training, the predictive maintenance task was reformulated into a binary classification problem, distinguishing between two states, that is, the normal operation (NORMAL) and the At-Risk operation (RECOVERING + BROKEN). This step was necessary for the analysis of the problem, and it was motivated by both statistical evidence and operational considerations. Specifically, the statistical analysis revealed that RECOVERING states exhibit near-zero values across key operational variables, including motor current, vibration, and discharge pressure, indicating complete system shutdown rather than recovery. This behavior suggests that RECOVERING states correspond to critical conditions requiring maintenance intervention and should therefore be treated as part of the failure class.
A detailed analysis of the data revealed that missing values were present in a small subset of sensor channels. Overall, most sensor channels contained very few missing observations. However, Sensor 50 (discharge pressure) exhibited a substantially higher missing-value rate of approximately 35%, likely due to sensor outage or communication interruptions.
In order to address this issue the missing values were handled using linear interpolation for time-series continuity and exclusion or cautious interpretation of highly degraded signals. Furthermore, strong correlations between variables—such as motor current and discharge pressure—were leveraged to maintain monitoring capability in cases of sensor failure.
Due to the nature of the data, it is very crucial to note that the dataset underwent several preprocessing steps such as normalization. The normalization was used in order to ensure comparable scaling across variables and prevent bias in the machine learning model, and finally the continuous data stream was analyzed at the sample level. In addition, physics-based grouped subsystem features were constructed by aggregating sensors belonging to the same engineering category. The dataset was divided into a 70% training set, 15% validation set (used for hyperparameter tuning) and 15% test set (used for final evaluation).
As a first step, a statistical correlation analysis, e.g., Pearson and Spearman indices, was performed in order to establish the crucial variables. Variables exhibiting strong correlation with the target labels—such as motor current, vibration, and discharge pressure—were identified as key predictors and prioritized in the model development stage.
Lastly, taking into consideration the lack of ground-truth failure mode annotations, the absence of maintenance logs or operational context and the uncertainty regarding sensor placement and system configuration, there exists a limitation on the ability to directly link observed data patterns to specific physical failure mechanisms. Nevertheless, the dataset remains valuable for evaluating data-driven predictive maintenance approaches and identifying statistically significant indicators of abnormal system behavior.
3. Methodology
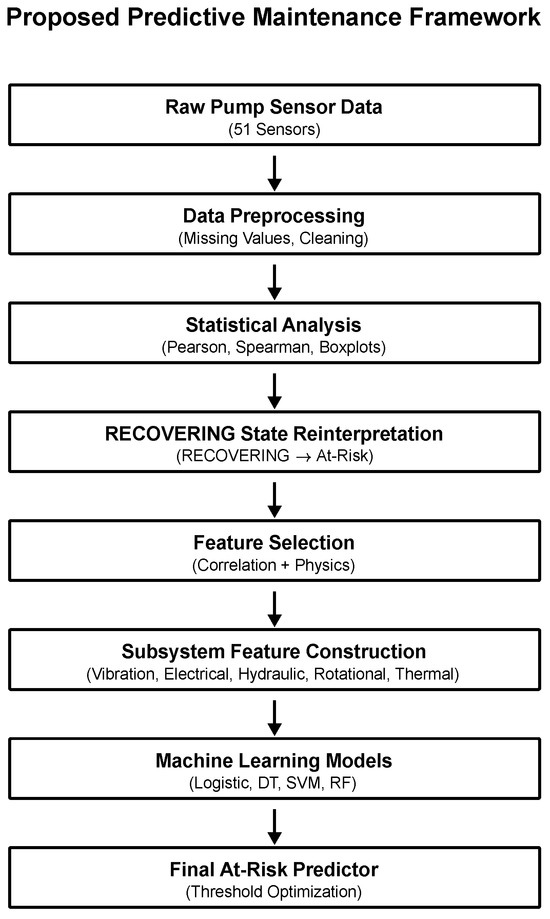
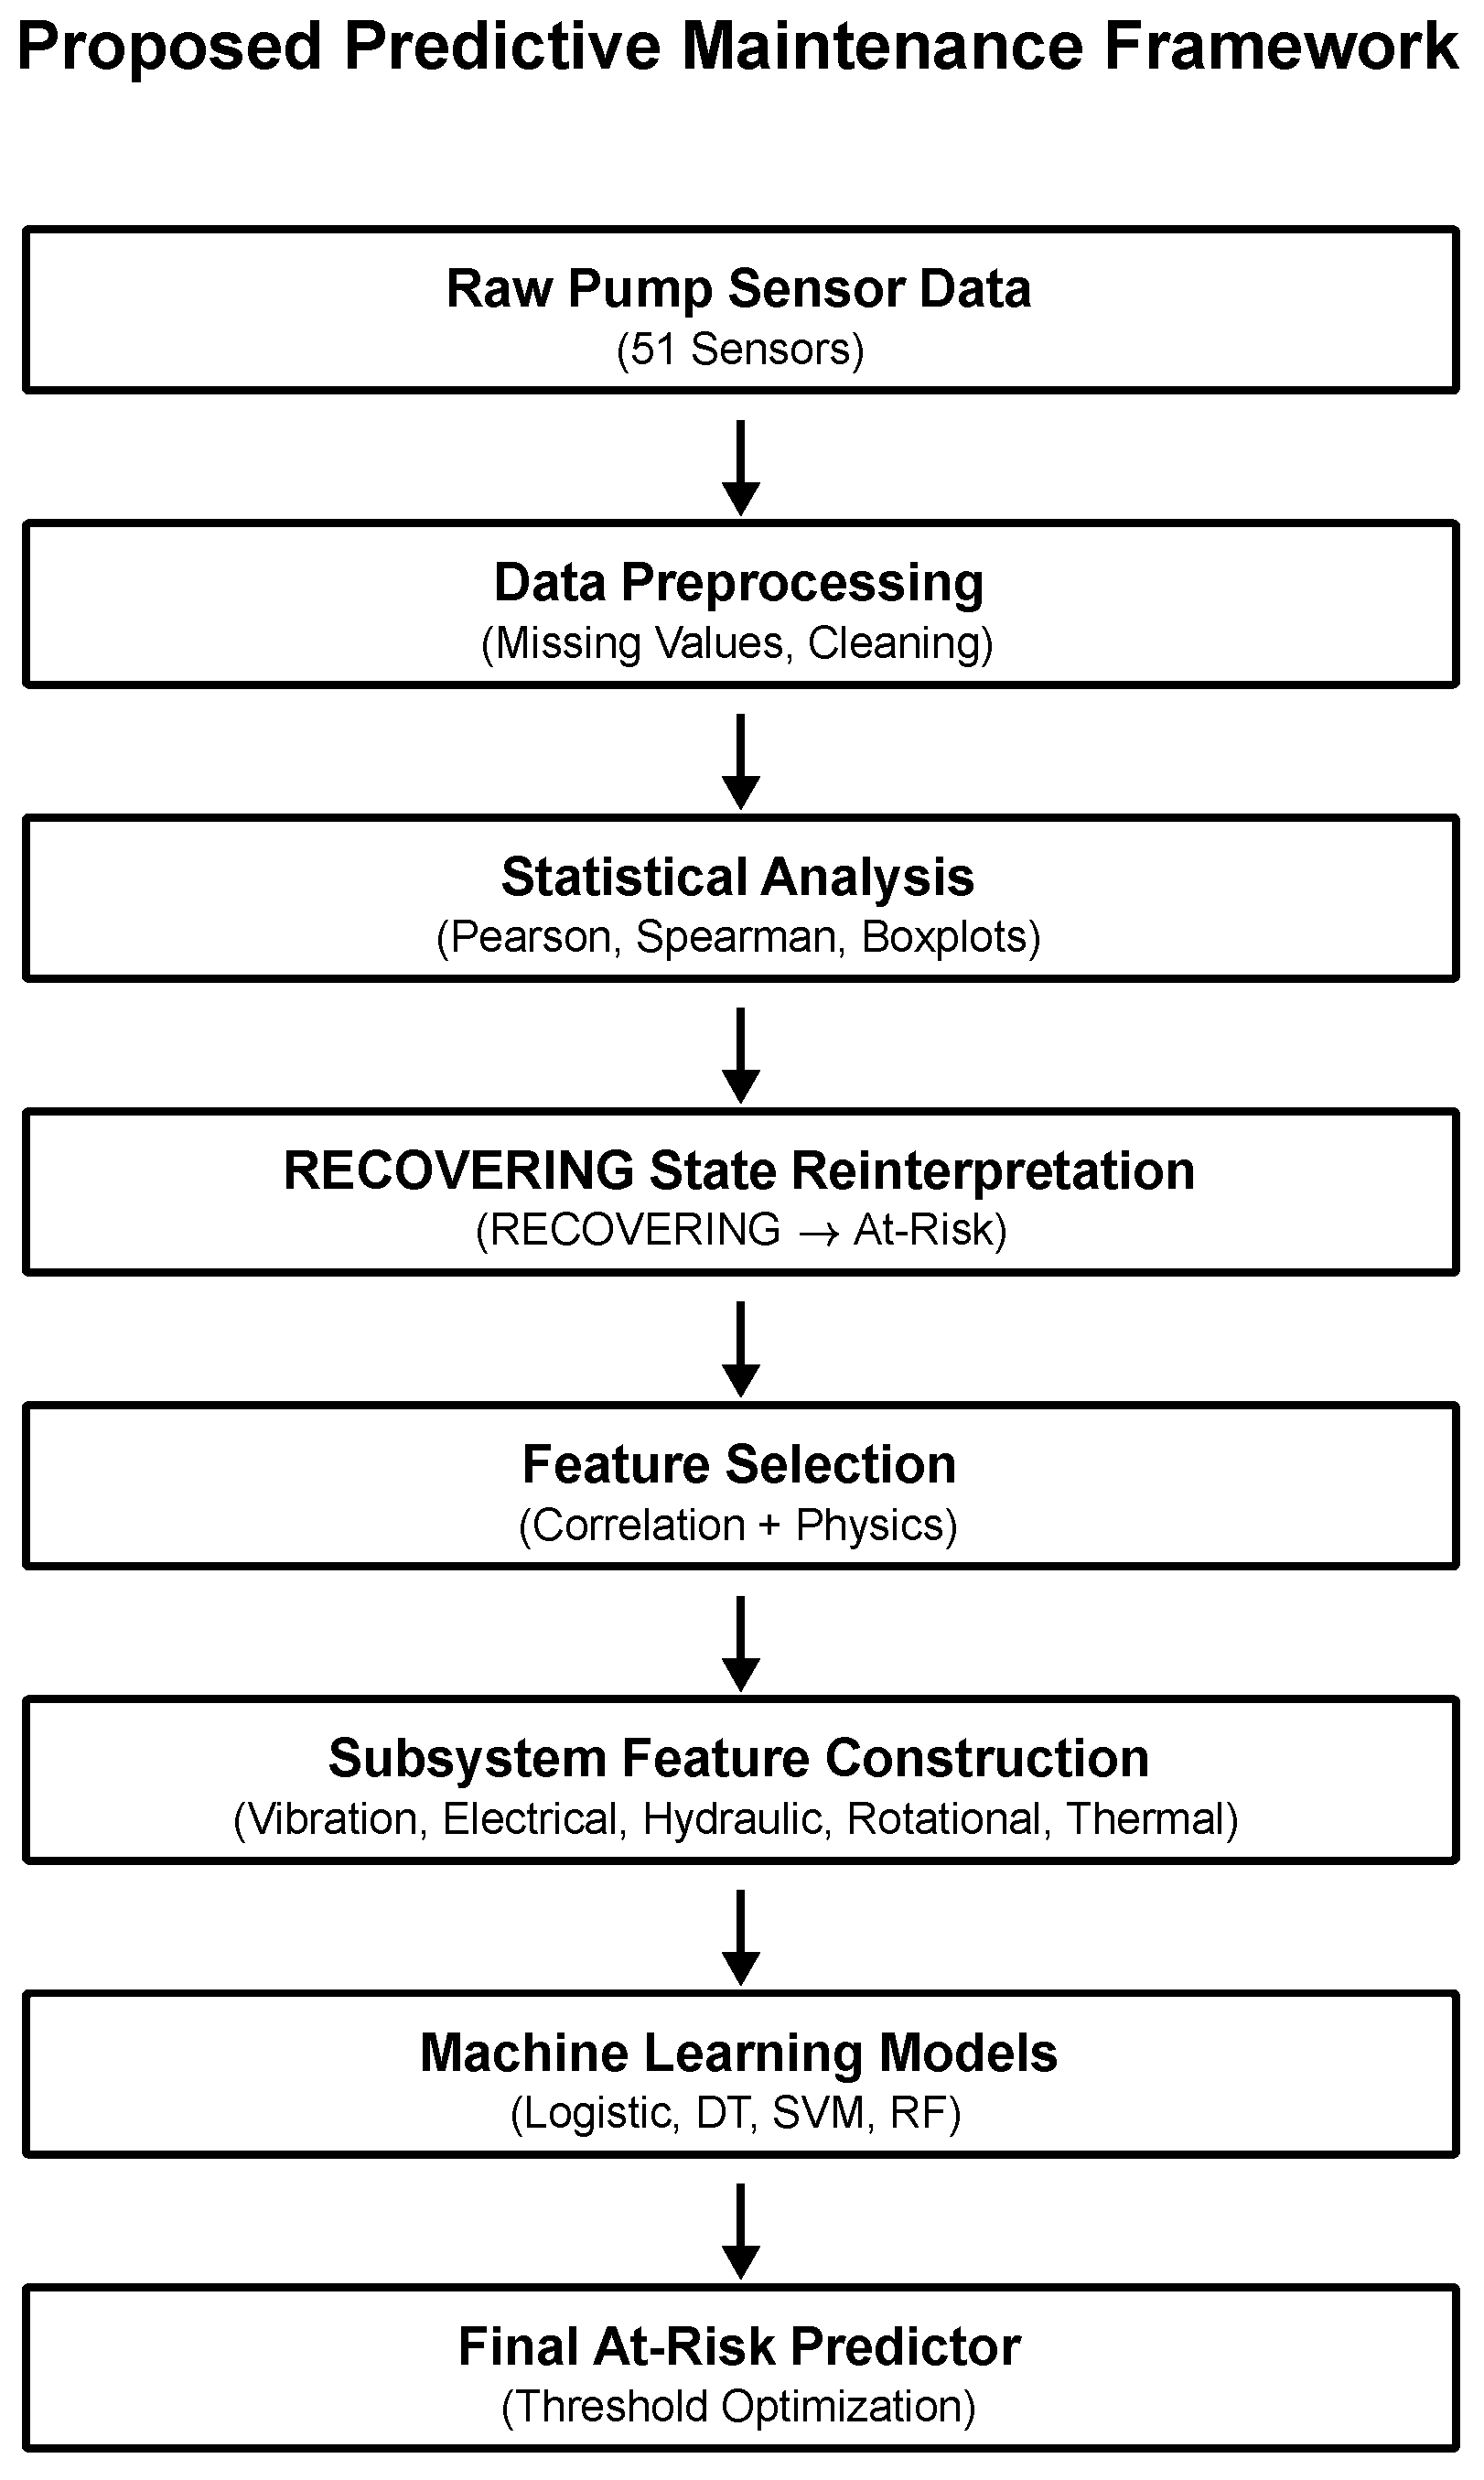
The proposed predictive maintenance (PdM) framework follows a structured, data-driven pipeline designed to detect early signs of degradation in circulating water pumps using multivariate sensor data. The methodology integrates statistical analysis with machine learning to enhance both predictive performance and interpretability.
The steps followed were data preprocessing, statistical feature analysis, feature selection, machine learning model development, and model evaluation, see Figure 1.
Figure 1.
Proposed predictive maintenance framework.
This hybrid approach enables the identification of meaningful degradation patterns while maintaining robustness in the presence of class imbalance.
Firstly, in order to identify the most informative variables for fault detection, an initial statistical analysis was performed using both visual and quantitative methods.
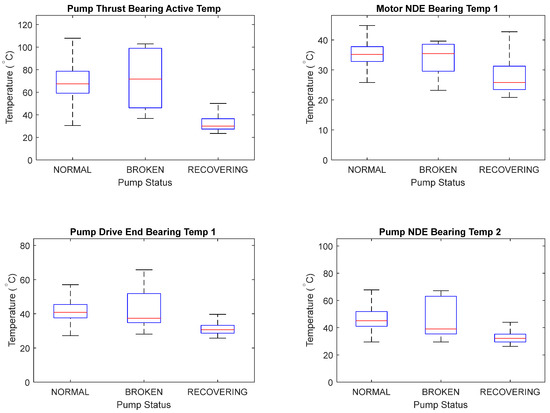
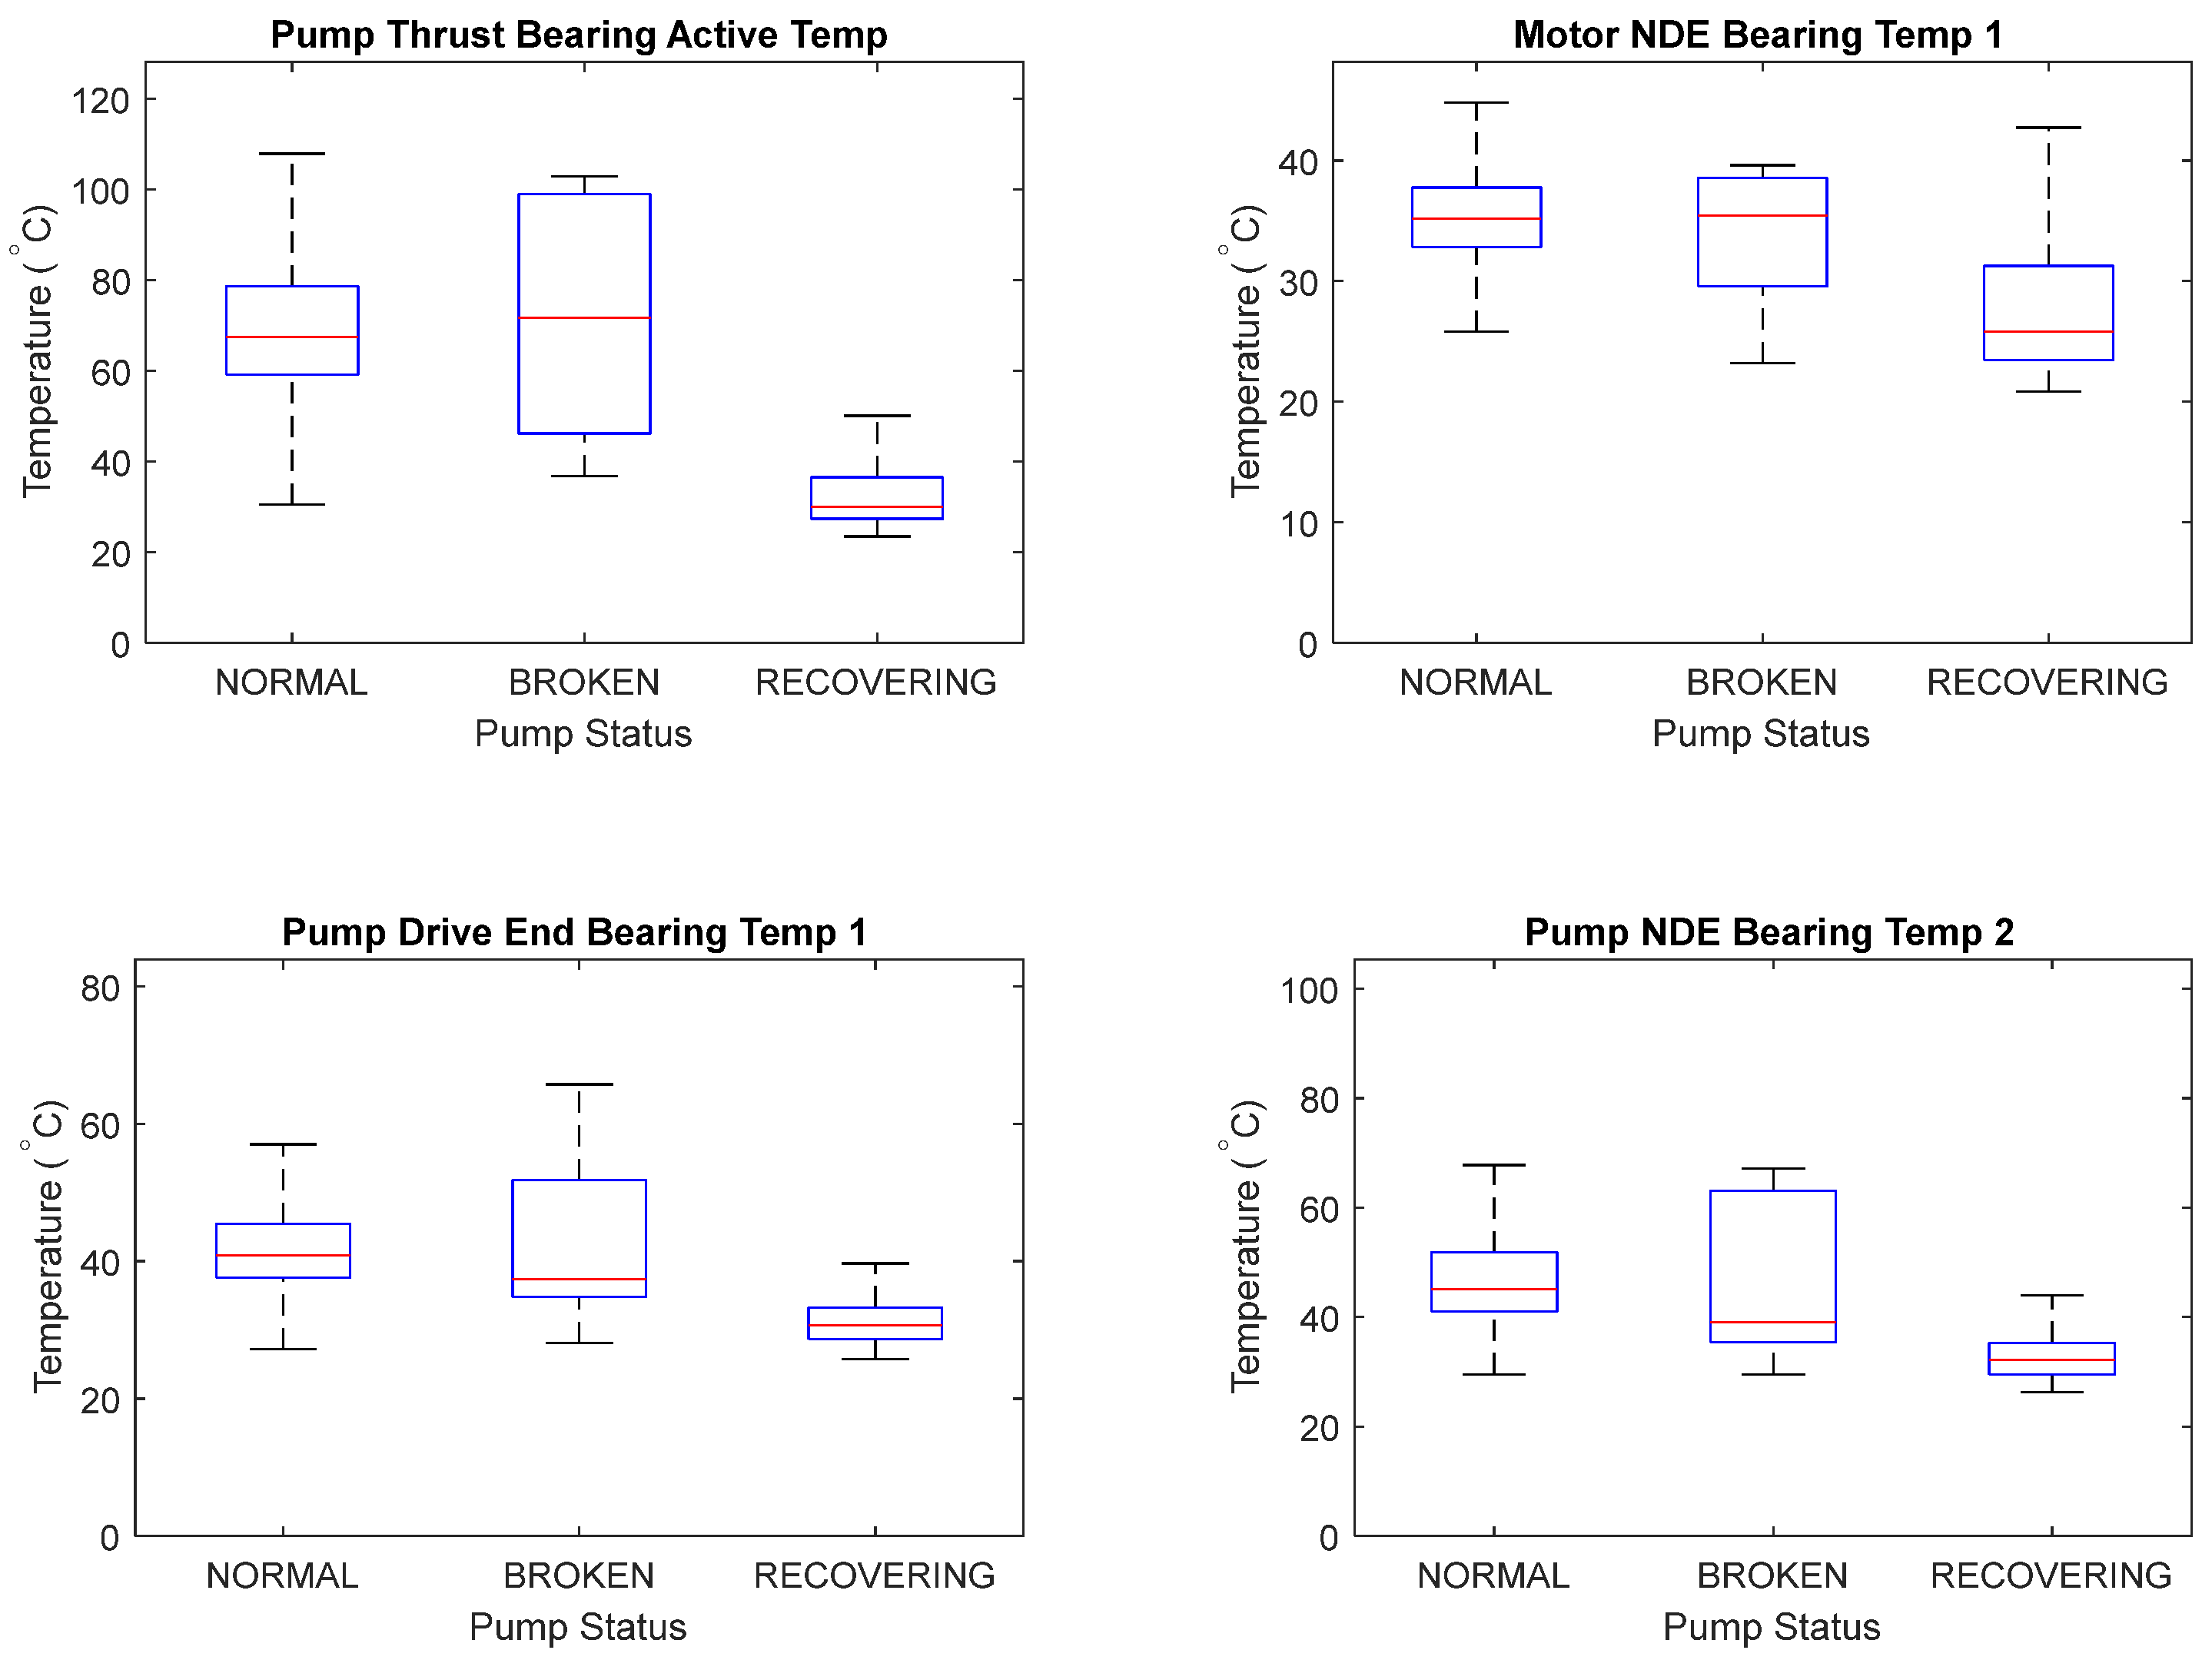
Boxplots were generated for all sensor variables across the three operational states (NORMAL, RECOVERING, and BROKEN) to examine distributional differences. This analysis revealed that several key variables exhibit abrupt shifts rather than gradual degradation trends. Specifically, as shown in Figure 2, motor current, vibration, and discharge pressure showed significant reductions during RECOVERING states. The interquartile range of these variables collapsed, indicating near-zero operational activity.
Figure 2.
Distribution of representative thermal sensor measurements across NORMAL, BROKEN and RECOVERING operating states.
From Figure 2, bearing and thrust temperatures exhibit clear differences between operating states, with the RECOVERING state characterized by substantially lower temperatures. This behavior is consistent with reduced pump activity or shutdown-like operating conditions. In contrast, BROKEN states exhibit intermediate distributions, suggesting partial functional deterioration rather than complete loss of operation. Therefore, the observed temperature reduction during RECOVERING states supports the interpretation that these observations are associated with inactive or post-shutdown conditions rather than simple degradation.
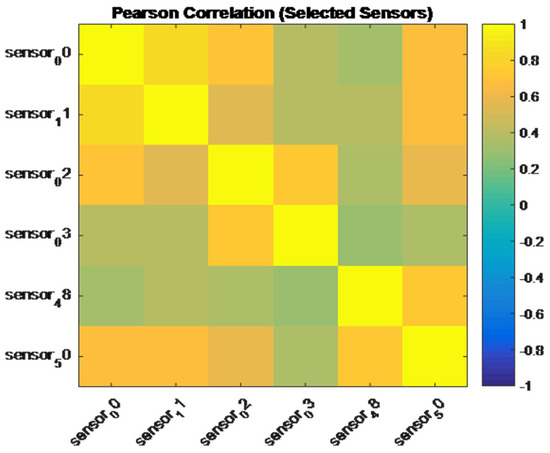
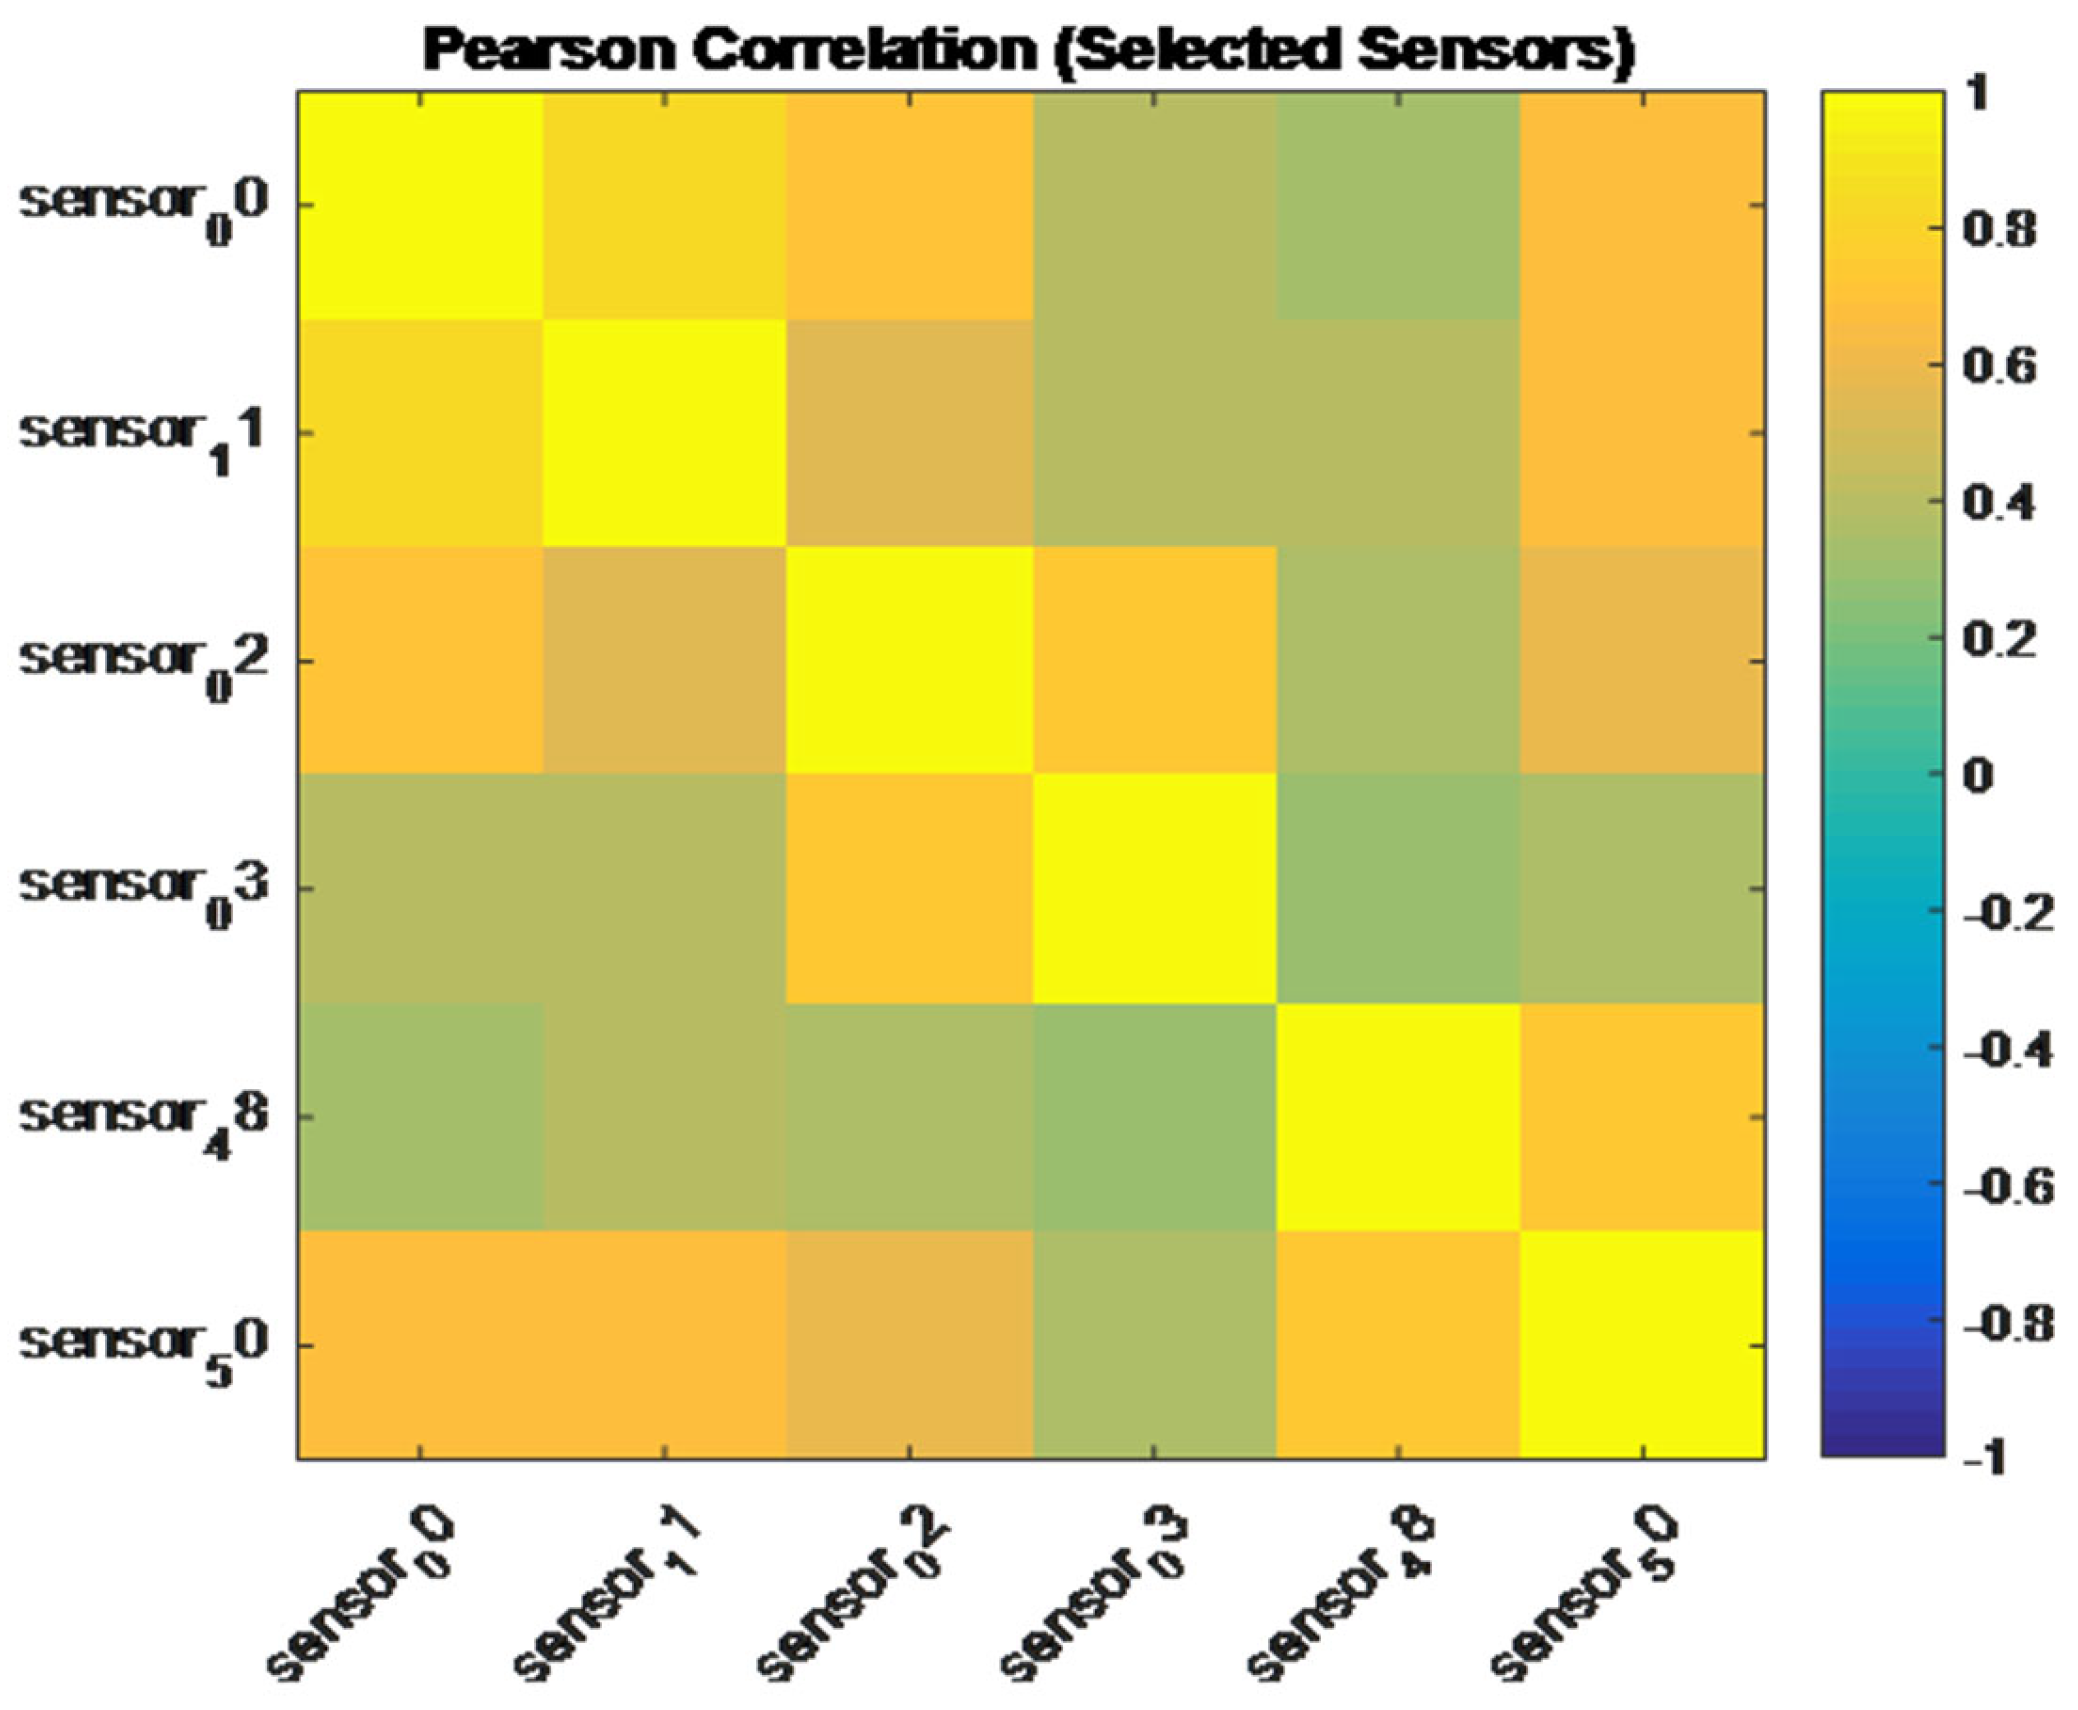
Moving on, we have the statistical analysis with the help of the correlation coefficients. In order to quantify relationships between sensor variables and system states, two correlation measures were used, namely the Pearson correlation coefficient (r), which helps capture linear relationships between variables, and the Spearman correlation coefficient (rho), which helps capture monotonic (possibly non-linear) relationships. As one may see form the figures below, the Pearson correlation matrix (Figure 3) shows strong positive relationships between sensor variables during normal operation.
Figure 3.
Pearson correlation matrix among selected sensor variables.
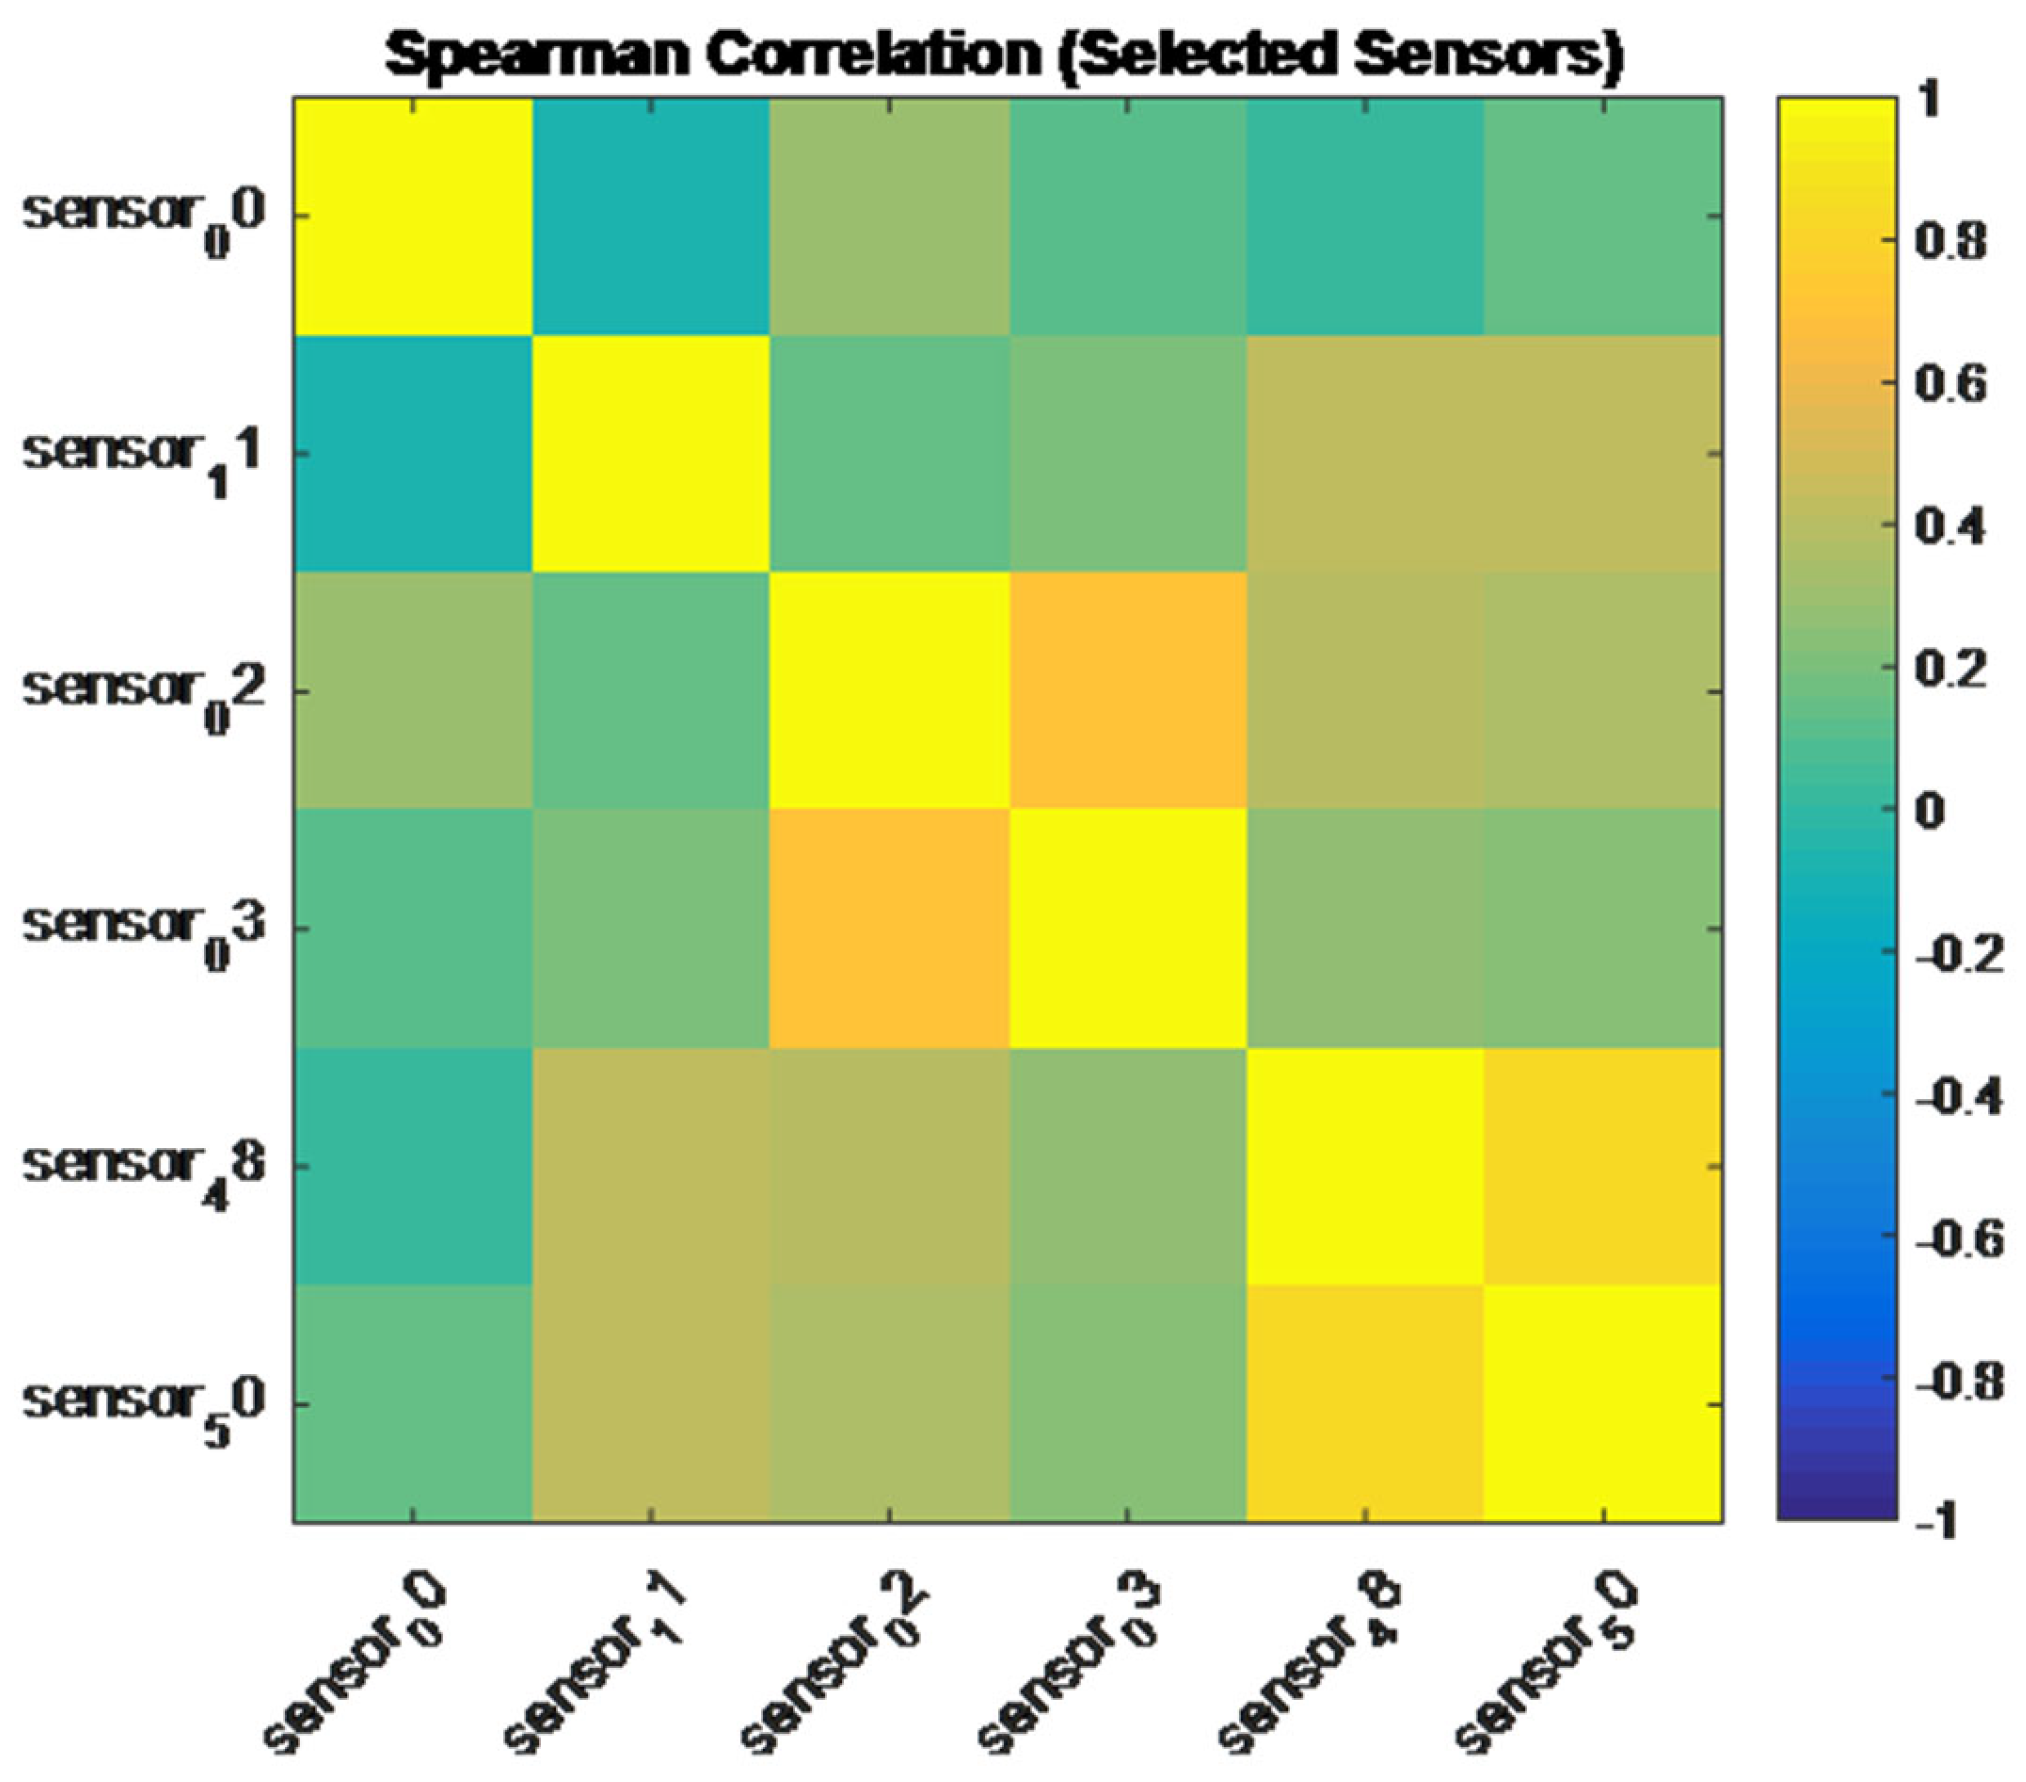
For visualization purposes, Figure 3 and Figure 4 present the six variables exhibiting the strongest statistical relationship with the target class.
Figure 4.
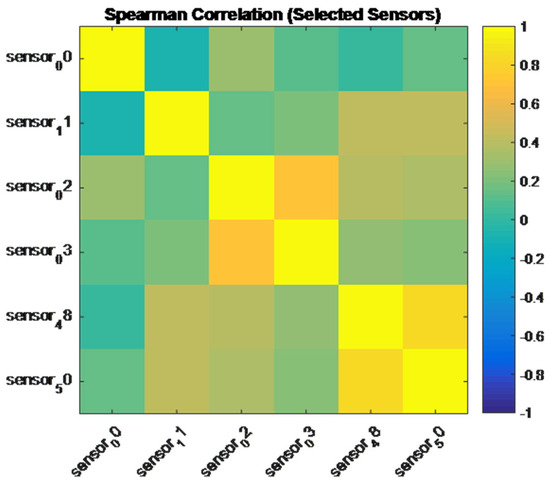
Spearman correlation matrix among selected sensor variables.
In contrast, from the Spearman matrix above (Figure 4), which is used to capture monotonic but non-linear correlations, it is obvious from the sensors of temperature and vibration behavior at hand that the phenomenon, though not strictly linear, as expected, it still exhibits degradation.
Feature selection was guided by a combination of statistical correlation analysis and distributional separation observed in boxplots. First, Pearson correlation coefficients were computed between each sensor signal and the binary target variable (Normal = 0, At-Risk = 1). Features with an absolute correlation value greater than 0.4 (|r| > 0.4) were considered statistically significant. The threshold of 0.4 was selected as a compromise between retaining physically meaningful predictors and avoiding the inclusion of weakly correlated variables. In engineering applications, correlation magnitudes above 0.4 are commonly interpreted as moderate-to-strong relationships suitable for preliminary feature selection. Second, boxplot analysis was used to evaluate the discriminative power of each feature, as shown in Figure 2. Sensors were retained if their distributions exhibited clear separation between operational states. Therefore, based on this process, key features included the variables like motor phase current, vibration signals, discharge and inlet pressure and bearing temperatures. Although several selected variables exhibit mutual correlation, no additional redundancy-removal procedure was applied because Random Forest models are relatively robust to multicollinearity. In addition, retaining correlated variables preserves physically distinct information originating from different pump subsystems, including electrical, hydraulic, thermal, and vibration-related measurements.
The analysis, as one may see in Table 1, revealed strong negative correlations between key sensor variables and failure-related states like we have with the motor phase current: r = −0.872, with a pump vibration r = −0.809, and with the discharge pressure r = −0.732. These findings indicate that failure conditions are associated with a collapse of operational signals, consistent with system shutdown rather than gradual degradation. Pearson correlations were computed with respect to the binary target variable (Normal = 0, At-Risk = 1).
Table 1.
Strongest failure correlations.
Continuing with the analysis of the data, a Random Forest (RF) classifier was selected due to its robustness to noise, ability to model non-linear relationships and built-in feature importance estimation. The Random Forest model was implemented with the following hyperparameters: (a) number of trees (n_estimators) 200, (b) maximum tree depth (max_depth) 12, (c) minimum samples per split 5, (d) minimum samples per leaf 2 and splitting criterion Gini impurity. Then, the hyperparameters were optimized using Random Search with n_estimators ∈ [100, 500], max_depth ∈ [5, 20], min_samples_split ∈ [2, 10], number of iterations 50, and a validation strategy of 5-fold cross-validation on the training set.
Class weighting was utilized to address the imbalanced nature of the dataset; specifically, the weight was defined as
where is the number of samples in class i. The model evaluation used was executed using metrics suitable for imbalanced classification like Recall, Precision, and F1-score, and the model performance was analyzed using Precision–Recall (PR) curves and threshold-based analysis.
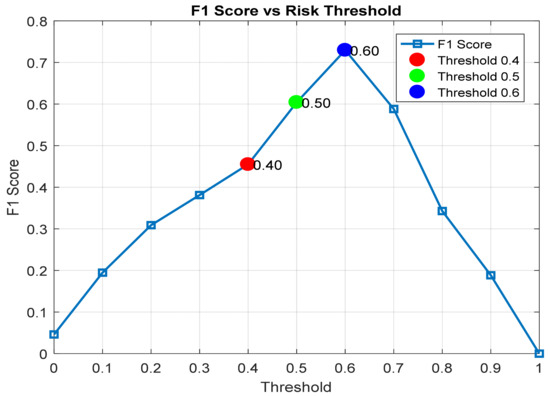
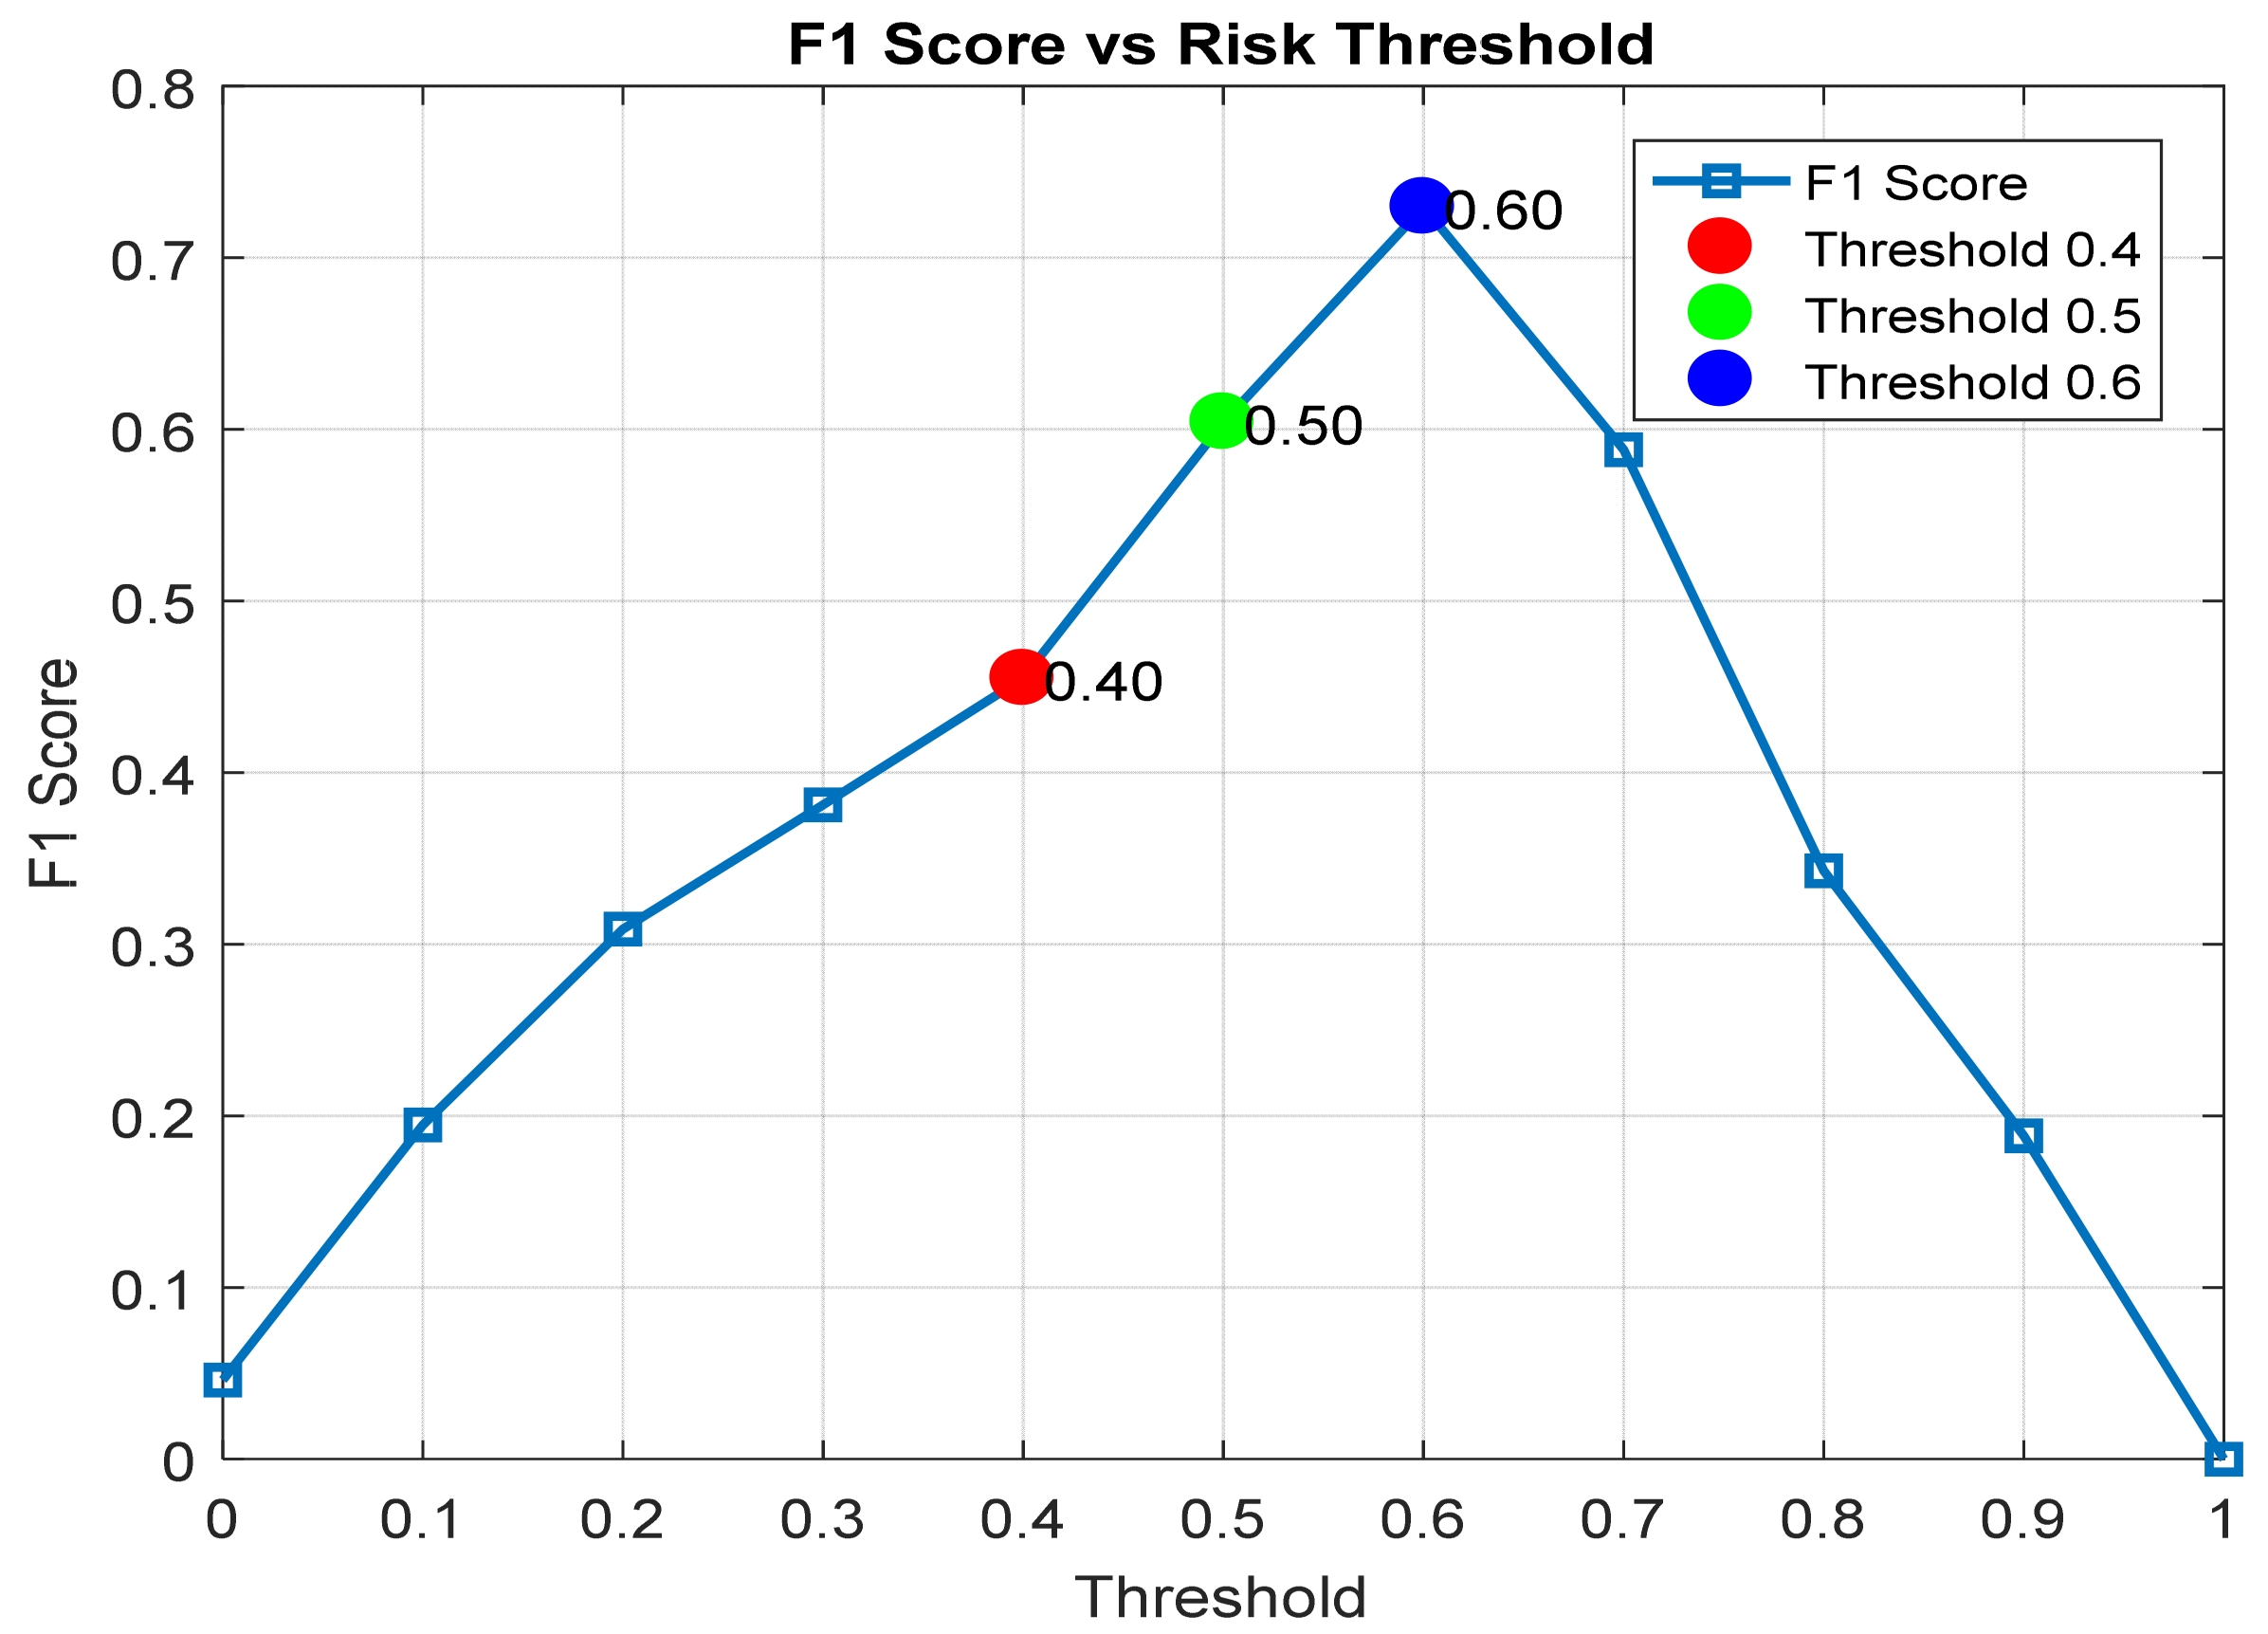
In order to avoid the detection of false alarms and balance the outcome, several tests were run and the classification threshold was varied. For example, we have the following results:
Threshold = 0.4 → high Recall, lower Precision;
Threshold = 0.5 → balanced sensitivity and Precision;
Threshold = 0.6 → highest F1-score and improved Precision while maintaining the same Recall level.
The threshold optimization study demonstrated that a threshold value of 0.6 provides the best overall balance between Precision and Recall. At this operating point the model achieved a Recall of 0.76, a Precision of 0.70 and an F1-score of 0.73. Consequently, a threshold of 0.6 was selected for the final predictive maintenance framework.
Lastly, a feature importance was extracted from the Random Forest model to identify the most influential predictors. These were (a) the motor phase current, (b) the bearing temperature, and (c) the pump pressure. The results obtained were consistent with the statistical analysis showing the robustness of the feature selection process.
All statistical analyses, machine learning experiments, and visualizations presented in this study were performed using MATLAB R2016b. Data preprocessing included missing-value handling, normalization, sample-level preprocessing and grouped-feature construction, boxplot analysis, and Pearson and Spearman correlation calculations. The machine learning models, including Decision Tree, Random Forest, Logistic Regression, and Support Vector Machine classifiers, were implemented using MATLAB’s Statistics and Machine Learning Toolbox. Hyperparameter optimization was performed using Random Search combined with five-fold cross-validation, while model evaluation was conducted using confusion matrices, Precision–Recall analysis, Recall, Precision, and F1-score metrics.
The continuous data stream was analyzed at the sample level. In addition, physics-based grouped subsystem features were constructed by taking into consideration sensors belonging to the same engineering category, including vibration, electrical, hydraulic, thermal, and rotational subsystems. This grouping reduced dimensionality and sensor noise while preserving the physical structure of the pump system. Feature grouping was performed exclusively using engineering subsystem definitions and did not use class labels, target information, or test-set information during feature construction.
4. Results
The statistical analysis provided important insights into the behavior of the pump system under different operational states. Namely, the boxplot analysis revealed distinct differences between NORMAL, RECOVERING, and BROKEN states. In particular, the NORMAL states exhibited stable distributions with consistent median values across sensors where the RECOVERING states showed near-zero values for key variables, such as motor current, vibration, and discharge pressure, and finally, BROKEN states exhibited moderate deviations, indicating partial degradation. These observations suggest that RECOVERING states correspond to complete system inactivity, while BROKEN states represent intermediate degradation conditions.
The correlation analysis, as shown in Table 1, confirmed strong relationships between key variables and failure states. The most significant findings showed strong negative correlations, indicating that failure conditions are characterized by a simultaneous collapse of electrical, mechanical, and hydraulic signals, consistent with system shutdown or protection-triggered behavior.
Taking into consideration the limited number of BROKEN observations, the proposed Random Forest model was evaluated using a binary classification setup (Normal vs. At-Risk). The initial binary Random Forest model achieved a Precision of 0.50, a Recall of 0.76 and an F1-score of 0.60. The corresponding confusion matrix is presented in Table 2. Although the model successfully identified the majority of At-Risk conditions, its Precision remained moderate due to false-positive alarms. In order to improve the balance between sensitivity and Precision, a threshold optimization study was subsequently performed using Precision–Recall analysis. Following threshold optimization, the final model achieved a Precision of 0.70, a Recall of 0.76 and an F1-score of 0.73 at the selected operating threshold of 0.6. The healthy F1-score value of 0.73 shows that our reformulation achieved success in forming a useful predictor, which obviously helped us to avoid more complex sampling methods [6].
Table 2.
Binary Random Forest classification results using statistically selected features.
The confusion matrix above provides a detailed view of the classifier’s performance. Out of 66,020 normal operating instances, 65,962 were correctly classified, while only 58 generated false alarms. Similarly, among the 76 At-Risk observations, 58 were correctly identified and only 18 were missed. These results confirm that the proposed framework is highly effective at preserving normal-operation recognition while simultaneously detecting the majority of failure-related conditions. The relatively small number of false positives demonstrates that the model remains practical for industrial deployment, where excessive alarms may lead to unnecessary maintenance interventions.
Therefore, from Table 3 one may deduce that the grouped-feature Random Forest achieved (1) a Precision of 0.997, (2) a Recall of 0.992 and (3) an F1-score of 0.995. The dramatic improvement in performance is primarily attributable to the reformulation of the feature space through subsystem-level aggregation. By combining highly correlated sensors into physically meaningful indicators, the grouped representation substantially reduced sensor noise and increased the separation of class.
Table 3.
Random Forest classification results using physics-based sensor groups.
To further investigate the influence of physical system behavior on predictive performance, the sensors were grouped according to their engineering function, including vibration, electrical, hydraulic, thermal and rotational characteristics. The resulting grouped-feature Random Forest model produced substantially improved classification performance. As shown in Table 3, only 12 false alarms and 35 missed At-Risk cases were observed. This result suggests that physically meaningful feature aggregation captures system-level degradation mechanisms more effectively than individual sensor measurements. The findings indicate that predictive maintenance performance benefits not only from machine learning algorithms but also from incorporating engineering knowledge into the feature construction process.
To further evaluate the effectiveness of the proposed grouped-feature representation, additional experiments were performed using four different classifiers trained on the same train–test partition and preprocessing pipeline. The results are presented in Table 4. Logistic Regression exhibited the lowest performance (F1-score = 0.625), indicating that the relationship between the grouped subsystem indicators and pump health is not purely linear. In contrast, the non-linear classifiers achieved substantially higher performance. Decision Tree and Support Vector Machine achieved F1-scores of 0.989 and 0.962, respectively, while Random Forest achieved the highest overall performance (Precision = 0.995, Recall = 0.993, and F1-score = 0.994). These results demonstrate that the grouped subsystem representation provides strong discriminatory information and further justifies the selection of Random Forest as the final predictive maintenance model.
Table 4.
Comparison of classifiers using grouped subsystem features.
To assess the robustness of the proposed framework, an additional Gradient Boosted Tree classifier was evaluated using the same grouped subsystem features and train–test partition. The model achieved Precision = 0.991, Recall = 0.985 and F1-score = 0.988. Although the performance was comparable to that of Random Forest, the latter achieved the highest overall F1-score (0.994). These results indicate that the predictive capability primarily originates from the physically meaningful grouped features rather than from a specific machine learning algorithm.
To assess the effectiveness of the proposed approach, the Random Forest model was compared against several baseline classifiers provided in the following table.
For completeness, Table 5 presents the corresponding classifier comparison using the original statistically selected sensor variables prior to the physics-based grouping procedure. In contrast, Table 4 presents the results obtained using the physics-based grouped subsystem features.
Table 5.
Baseline classifiers.
Continuing with the analysis, in order to evaluate the contribution of different sensor groups, a study was conducted by training the model using different subsets of features.
As seen in Table 6, electrical and mechanical features contribute most significantly to failure detection, whereas hydraulic features provide complementary information but are less predictive alone.
Table 6.
F1-score on different subsets of features.
The selected feature subset achieves near-optimal performance, confirming the effectiveness of the statistical feature selection process. This demonstrates that combining multiple sensor modalities improves predictive performance and robustness.
The feature importance analysis confirms the statistical findings obtained from the Pearson and Spearman correlation analyses. Variables associated with electrical load, vibration, and hydraulic behavior consistently emerge as the most informative predictors, reinforcing their physical relevance to pump degradation and shutdown behavior.
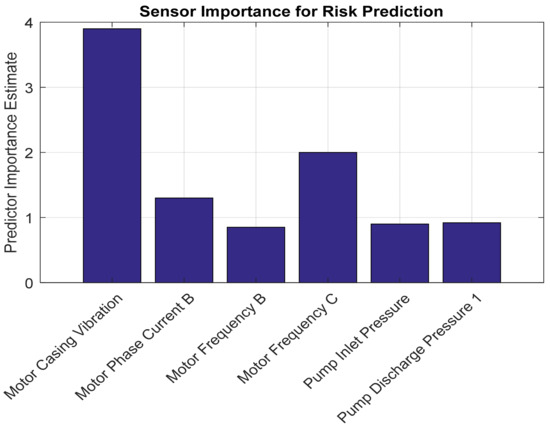
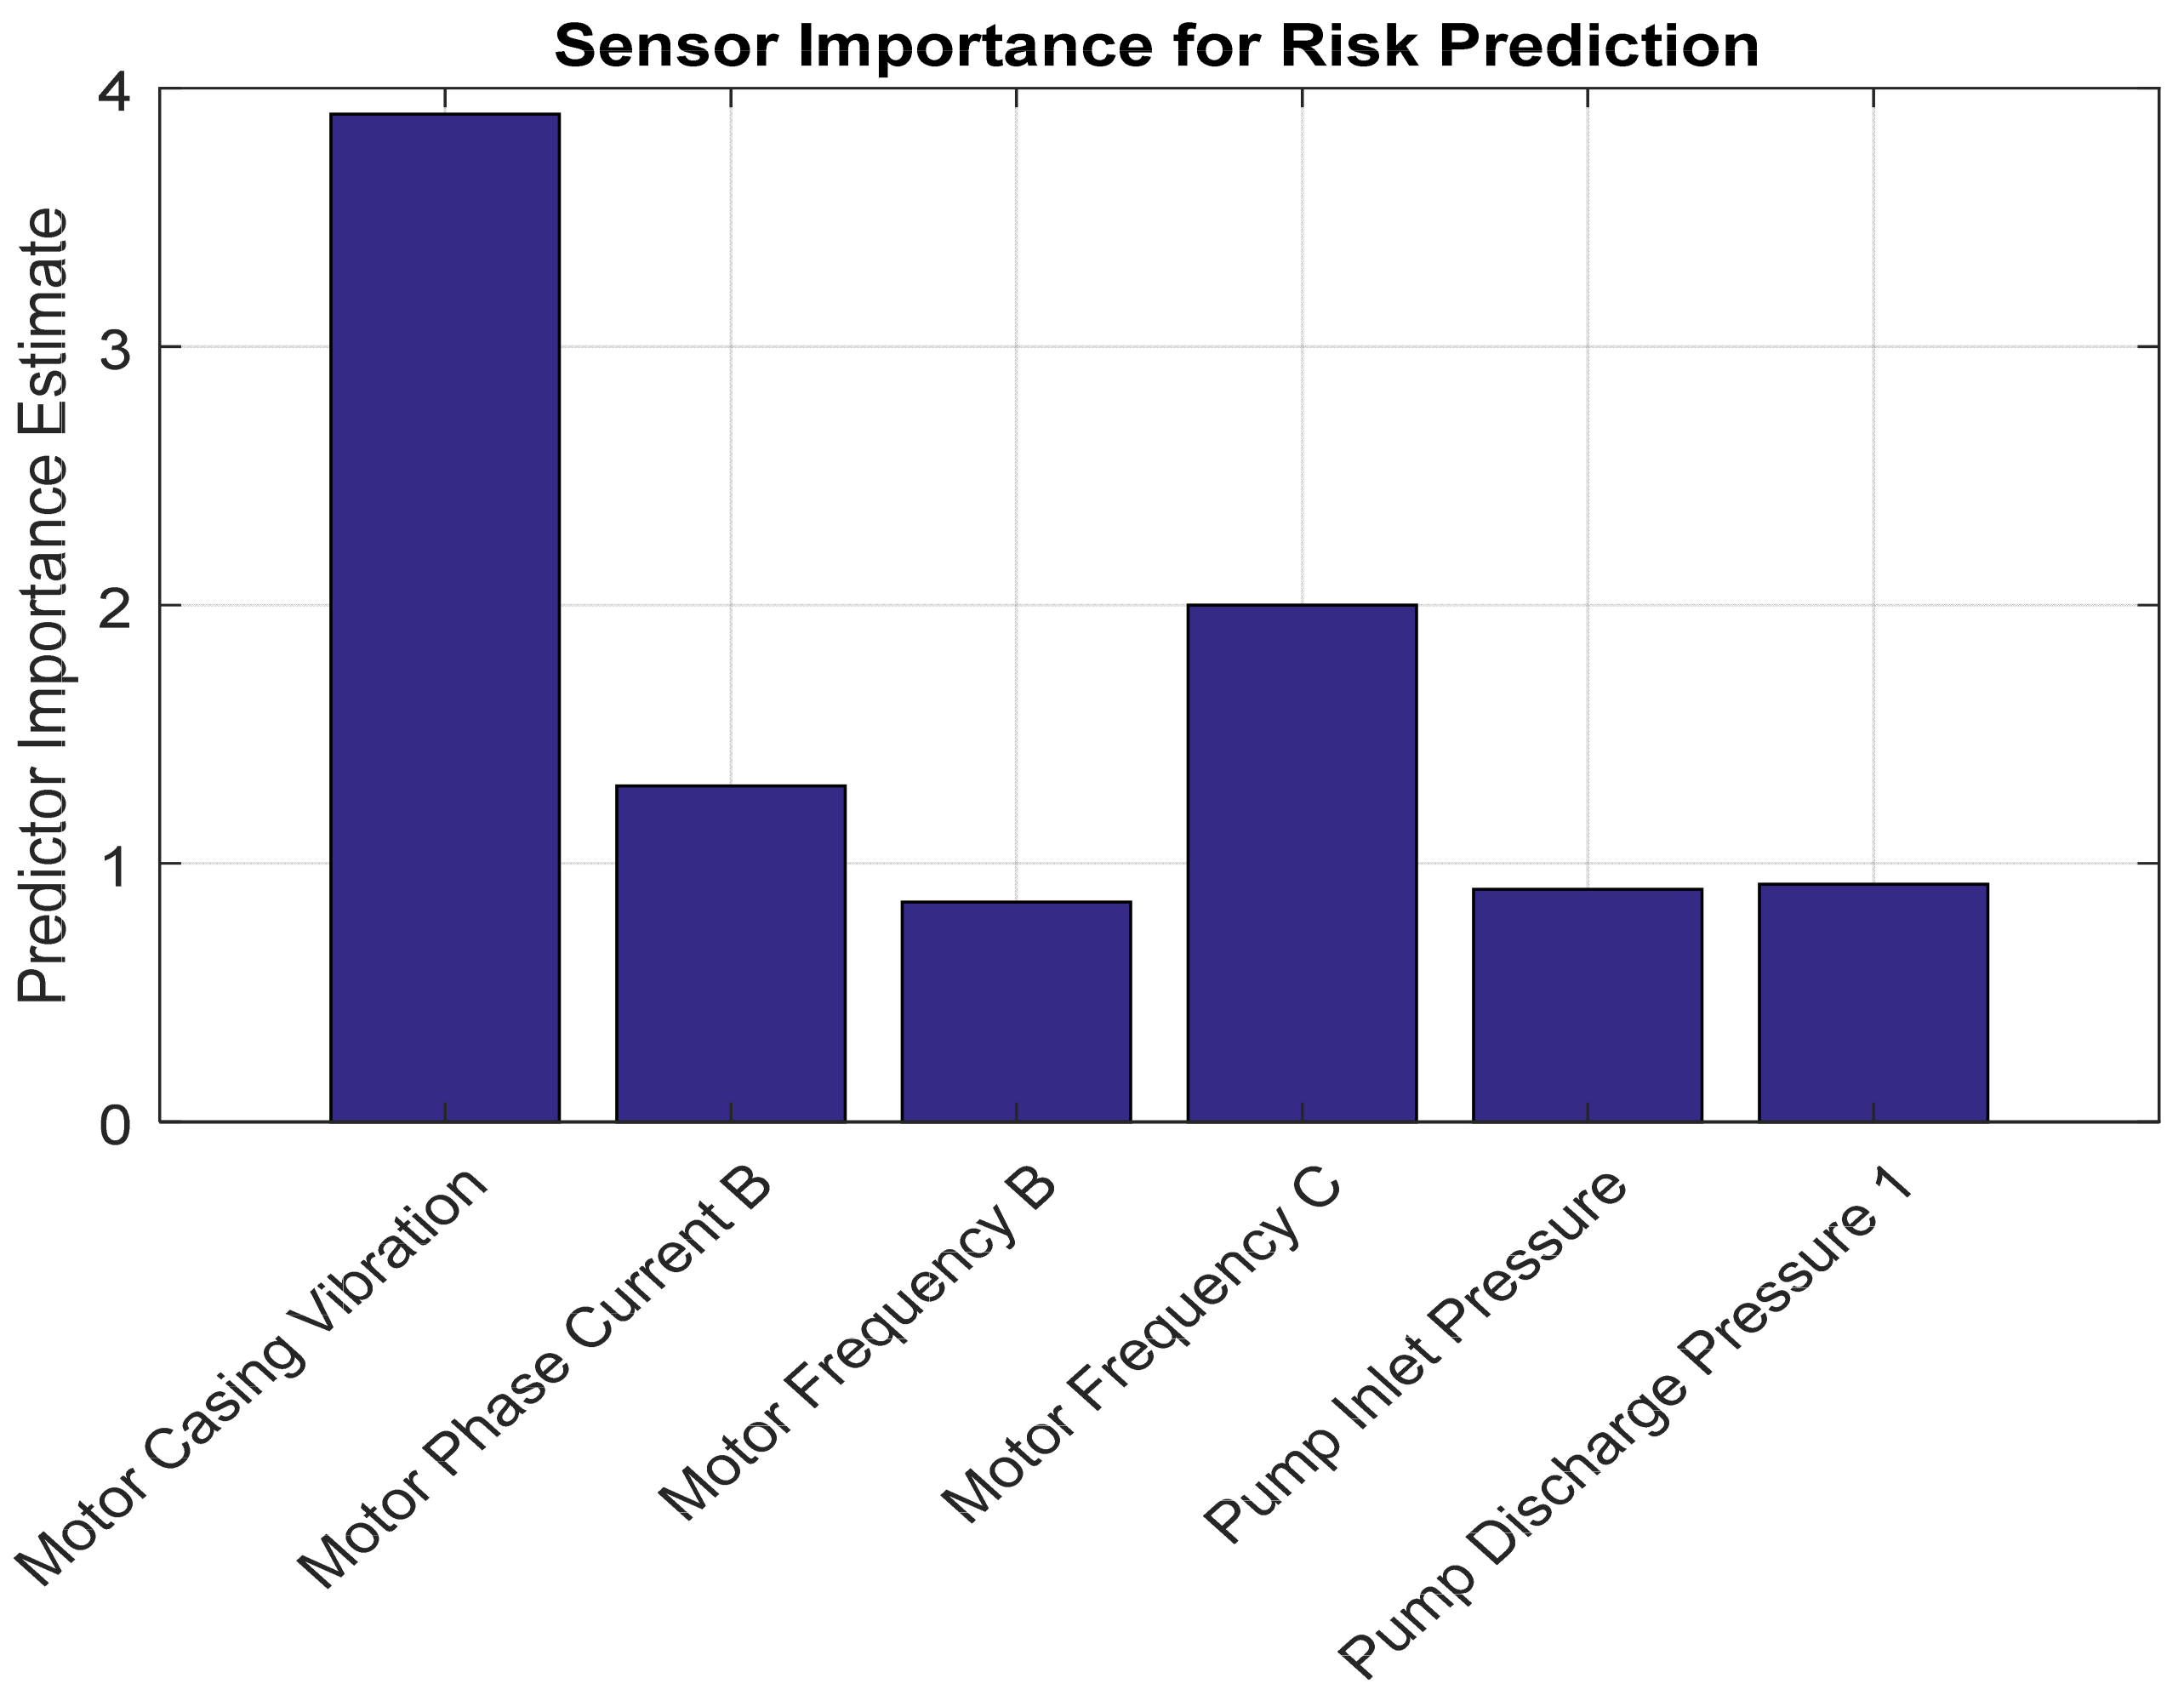
The feature importance analysis highlights motor casing vibration as the dominant predictor of risk, followed by motor frequency and pressure-related variables. This finding is physically meaningful because pump shutdown or severe degradation simultaneously affects the mechanical, electrical, and hydraulic subsystems. A reduction in vibration reflects the loss of rotational motion, changes in frequency indicate alterations in motor operation, and pressure collapse reflects the loss of hydraulic performance. The agreement between feature importance rankings and the correlation analysis strengthens confidence in the proposed feature selection strategy and demonstrates that the model is capturing physically interpretable degradation mechanisms rather than purely statistical relationships.
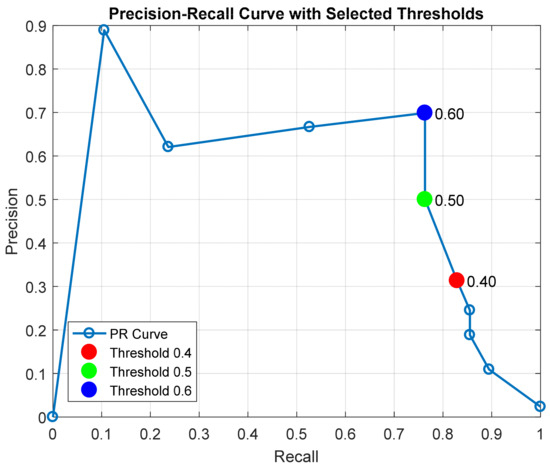
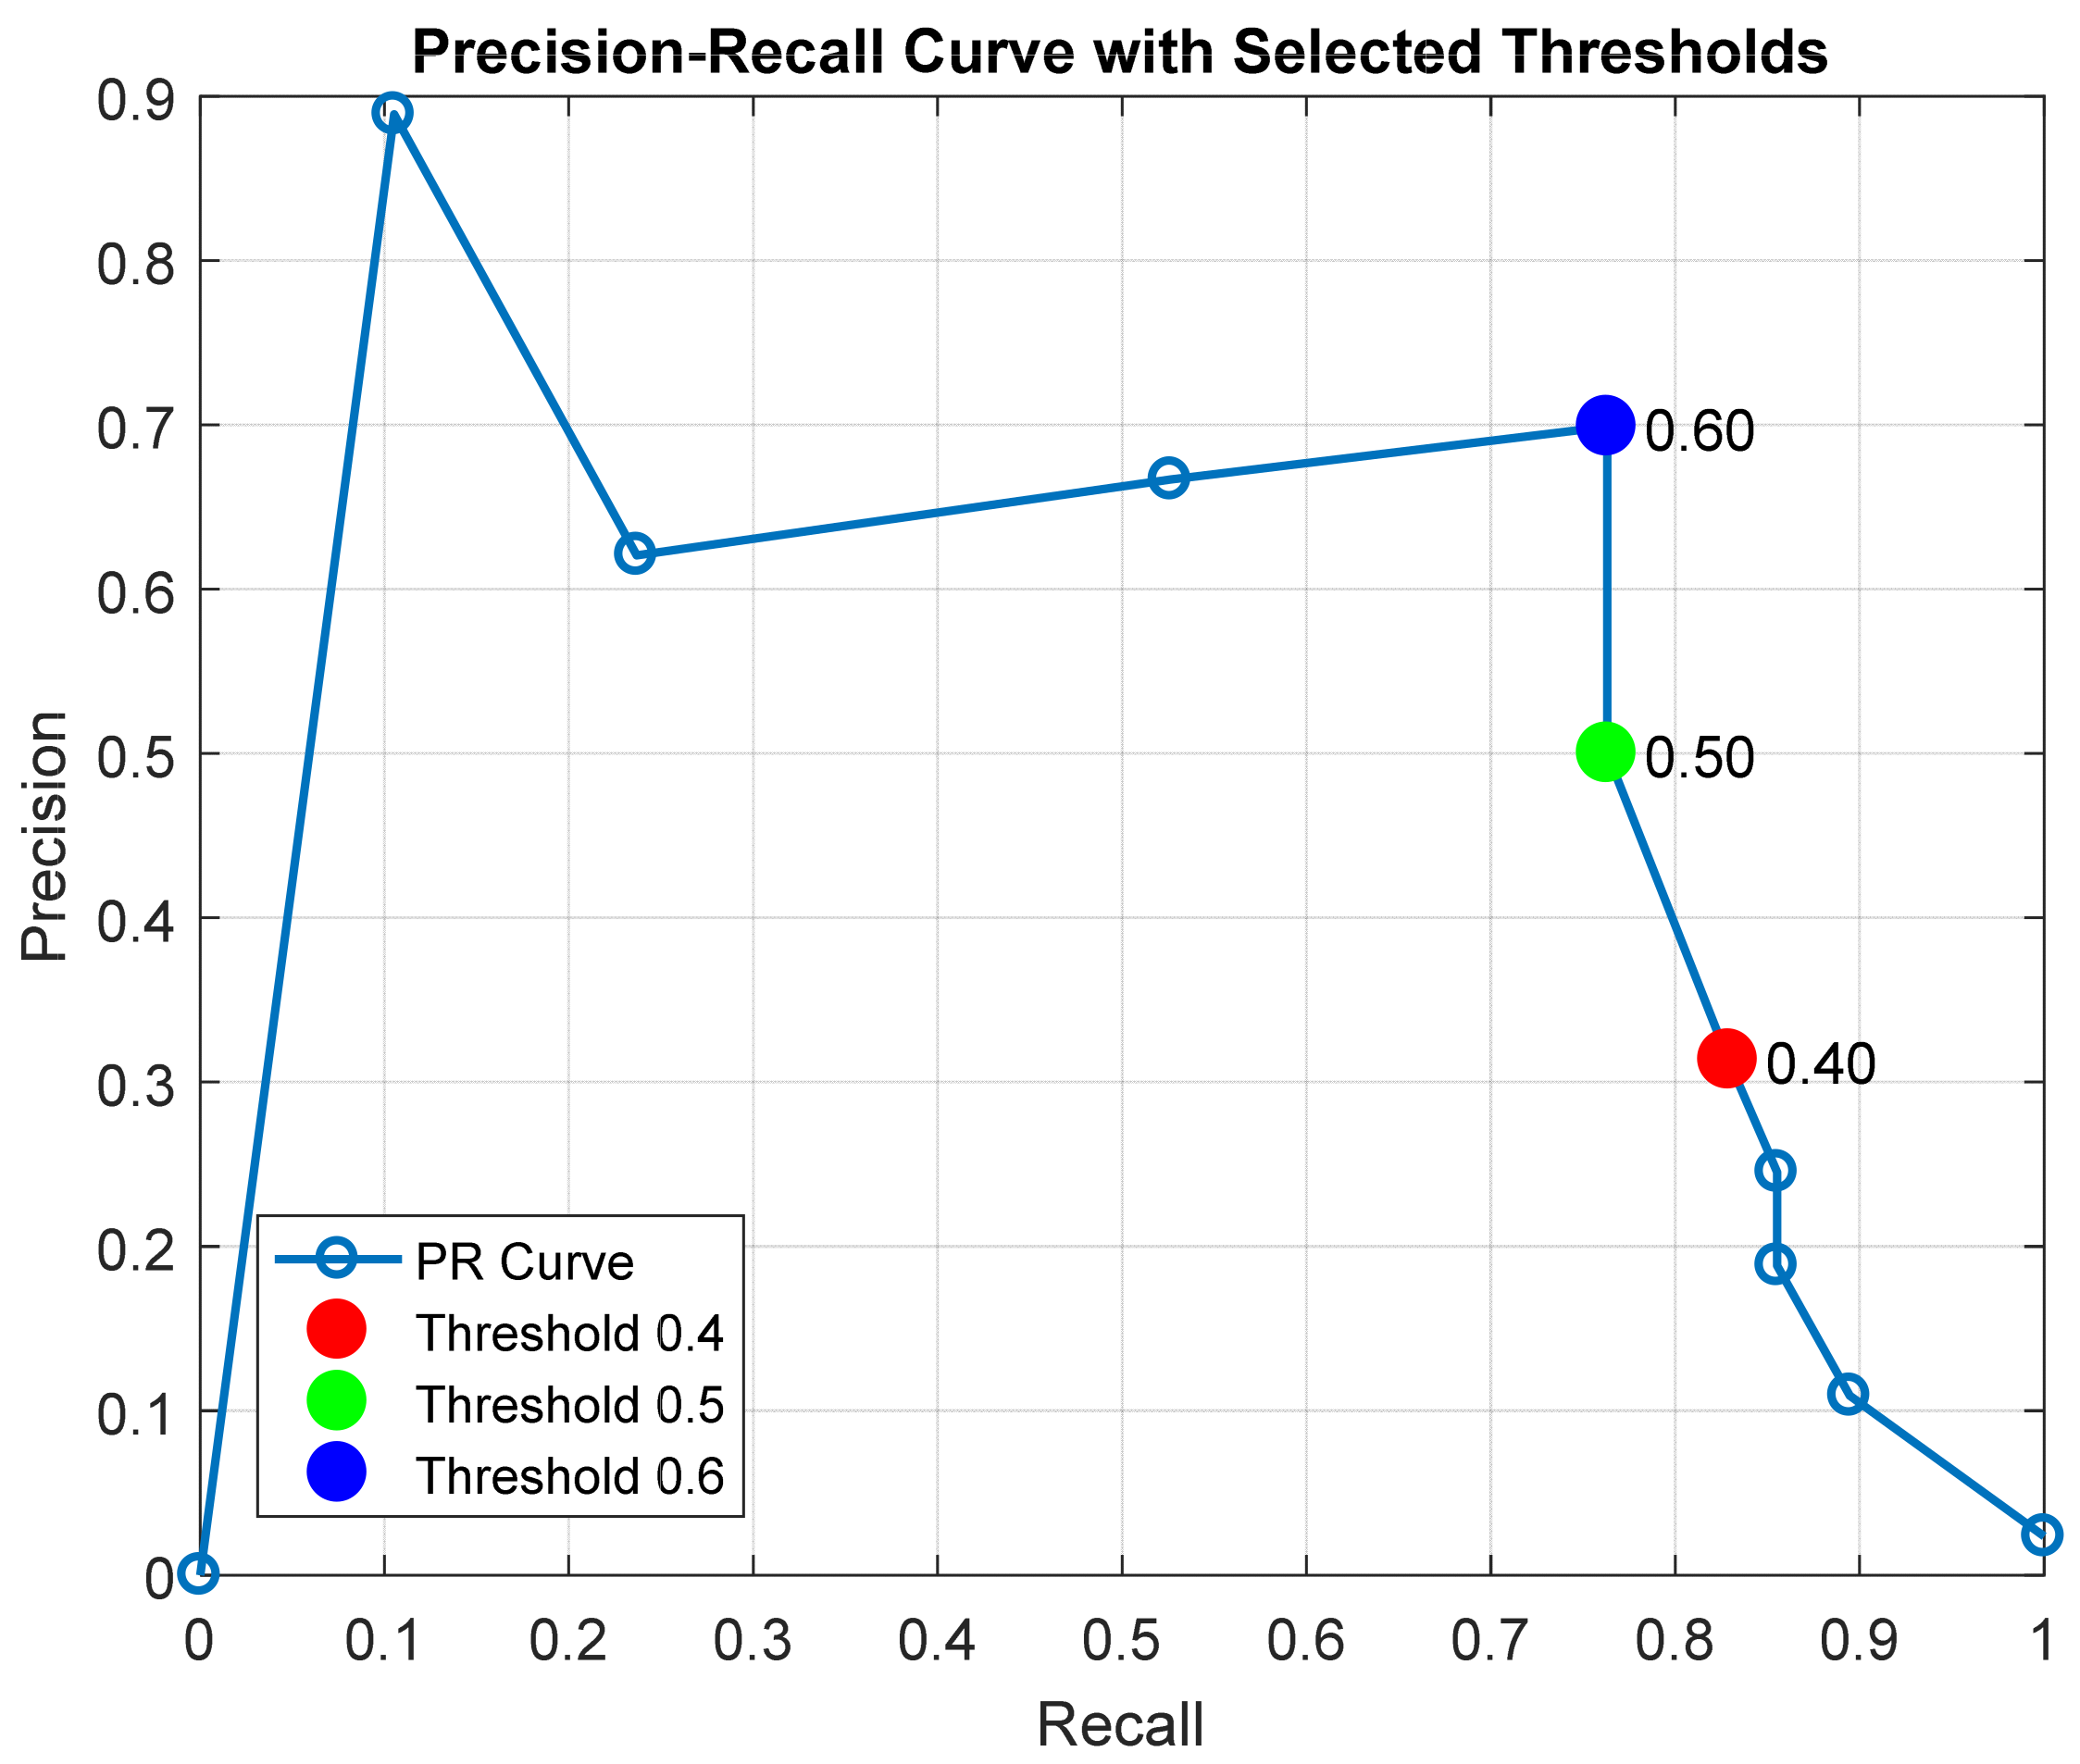
Feature importance values correspond to normalized Random Forest predictor importance scores obtained from the decrease in Gini impurity. Figure 5 presents the Random Forest predictor importance estimates. Motor casing vibration was identified as the most influential variable, followed by motor frequency and pressure-related measurements. The effect of the classification threshold on model performance was evaluated using Precision–Recall curves. As shown by these curves, seen in Figure 6 and Figure 7, lower thresholds (e.g., 0.4) increase Recall but reduce Precision, whereas higher thresholds increase Precision at the expense of missed detections. The threshold optimization analysis indicates that a threshold value of 0.6 provides the best compromise between these competing objectives, yielding the highest F1-score (0.73) while maintaining a Recall of 0.76.
Figure 5.
Relative feature importance estimated by the Random Forest classifier for selected physically meaningful sensor variables.
Figure 6.
Precision–Recall Curve with selected thresholds.
Figure 7.
F1-Score vs. risk threshold.
This flexibility allows the model to be adapted to different operational requirements like safety-critical systems, which will imply the prioritization of Recall, whereas resource-constrained systems will prioritize Precision.
Lower thresholds increase sensitivity to failure detection, while higher thresholds improve prediction Precision. The threshold optimization analysis improved the initial binary classifier from a Precision of 0.50 and F1-score of 0.60 to a Precision of 0.70 and F1-score of 0.73, while maintaining the same Recall value of 0.76. This demonstrates that threshold tuning substantially reduced false alarms without sacrificing the ability to detect At-Risk operating conditions.
Figure 7 illustrates the effect of the classification threshold on model performance. The F1-score reaches its maximum at a threshold of 0.6, confirming the suitability of this operating point for balancing Precision and Recall in predictive maintenance applications. This directly addresses one of the main problems that PdM models in real industrial settings present, as shown in [2,5].
To investigate whether the proposed framework operates solely as a state classifier or possesses predictive capability, additional experiments were performed by shifting the target labels into the future. The Random Forest model maintained high performance even when predicting At-Risk states several hundred samples ahead, with F1-scores decreasing from 0.994 for the current-state classification task to 0.967 and 0.948 for prediction horizons of 300 and 600 samples, respectively. These results suggest that the grouped subsystem features capture early degradation signatures within the electrical, hydraulic, thermal and vibration subsystems before the occurrence of the At-Risk state. Consequently, although the proposed framework does not explicitly model temporal dependencies, it exhibits meaningful short-term predictive capability.
5. Discussion
Maintaining diagnostic accuracy under dynamic operating profiles is a key challenge in data-driven degradation analysis, as traditional machine learning relies on rigid, handcrafted features that generalize poorly. Researchers have incorporated advanced network structures—such as attention-guided feature aggregation—that selectively merge correlated signal characteristics to significantly boost diagnostic metrics like accuracy and sensitivity in rotating machinery. In alignment with these frameworks, leveraging strong inherent correlations between system variables offers a robust strategy for continuous, fault-tolerant monitoring during local sensor failures.
The statistical and machine learning analysis above revealed a consistent and physically meaningful pattern across key sensor variables, specifically across the motor current, vibration, and discharge pressure. All three parameters exhibit strong negative correlations with failure-related states, indicating a collapse of system activity rather than progressive overload or gradual degradation. From a physical point of view this behavior is characteristic of system shutdown conditions, which may arise from protective mechanisms or severe mechanical faults. In centrifugal pump systems, such conditions are typically associated with phenomenon like (a) motor protection trips, (b) mechanical seizure or bearing failure, (c) severe cavitation or flow disruption, and (d) hydraulic blockages or loss of suction [3].
The observed near-zero motor current suggests that the electrical drive is no longer delivering power, which is consistent with motor shutdown or disconnection. Similarly, the collapse of vibration signals indicates the absence of rotating mechanical components, confirming that the pump is no longer in motion. Finally, the significant drop in discharge pressure reflects the loss of hydraulic activity, as pressure generation in centrifugal pumps depends directly on impeller rotation and fluid flow.
Taking into consideration all of the above observations, one may support the interpretation that the system enters a complete operational shutdown state rather than experiencing gradual performance degradation.
In addition, one of the most important findings of this study is the reinterpretation of the RECOVERING state. While originally defined as a transitional state following a disturbance, the statistical evidence shows that RECOVERING is characterized by phenomena of (a) a near-zero motor current, (b) minimal vibration and (c) a strong reduction in discharge pressure. Behavior of this type is not consistent with recovery but rather with inactive system conditions, where the pump is not operating. This interpretation is additionally supported by the simultaneous collapse of electrical, mechanical and hydraulic variables observed across the boxplots and correlation analysis. Although the original dataset documentation does not explicitly explain this labeling convention, the observed behavior strongly suggests that the RECOVERING label corresponds to a post-trip or post-shutdown condition during which the pump remains inactive prior to returning to normal operation.
In industrial practice, such behaviors usually suggest the existence of post-trip states, where the system is offline following a protective shutdown followed by maintenance or restart phases, during which the pump is not yet fully operational and transient states follow fault detection, where the system remains inactive until intervention.
Therefore, grouping RECOVERING with BROKEN into a unified “at-risk” class is justified not only statistically but also from an operational standpoint. This reinterpretation improves the consistency between data-driven labels and the underlying physical behavior of the system.
The existence of an abrupt failure leading to shutdown was supported by the findings of the sharp transitions observed in boxplots, the collapse of multiple sensor signals simultaneously, and the strong monotonic relationships identified by Spearman correlation. Such behavior is typical of seizure-type failures or protection-triggered shutdowns, where multiple system variables respond simultaneously to a critical event Although the statistical analysis reveals abrupt transitions associated with shutdown events, the future-horizon experiments indicate that measurable degradation signatures remain present before the occurrence of At-Risk states. These findings further suggest that the proposed framework captures early degradation information rather than merely identifying already-failed operating states. This observation highlights an important limitation but also clarifies the type of predictive capability achieved in this study.
The use of correlation indexes in this study provided some useful insights, especially on the use of monotonic analysis methods for identifying degradation patterns in complex mechanical systems. Namely, Spearman correlations remained relatively stable even when sensor values collapsed, indicating that relative ordering between variables is preserved during failure events. This suggests that failure processes involve coordinated system-wide changes, rather than isolated sensor anomalies.
As far as the industrial predictive maintenance goes, these results suggest firstly that the strong sensitivity of the model (Recall = 0.76) enables the detection of failure-related conditions before full system downtime, allowing timely intervention. Secondly, the strong correlation between motor current and discharge pressure provided the information that electrical measurements can be used as proxies for hydraulic behavior, particularly in cases of sensor failure. Thirdly, one may use the derived thresholds that can be directly implemented in real-time monitoring systems for rule-based fault detection. Hence, the alignment between statistical analysis and feature importance enhances trust in the model, making it suitable for industrial applications.
6. Conclusions
This study presents a data-driven predictive maintenance framework for industrial rotating machinery, successfully aligning statistical analysis with machine learning models to detect operational degradation. A key contribution of this work lies in the operational and statistical justification of unifying “RECOVERING” and “BROKEN” states into a single “At-Risk” class. This reinterpretation bridges the gap between data-driven labeling and actual physical system behavior, particularly during the transient, post-trip phases following a protective shutdown. The existence of abrupt, system-wide failure events—such as seizure-type faults—was strongly validated by the simultaneous collapse of multiple sensor signals, sharp boxplot transitions, and stable Spearman monotonic correlations, which proved that failure mechanisms involve coordinated system-wide changes rather than isolated sensor anomalies.
Despite the promising results, one may acknowledge that the dataset lacks detailed metadata, including sensor placement, pump configuration, and maintenance history. Failure modes are not explicitly labeled, limiting the ability to distinguish between different types of faults and their implications. Consequently, the proposed model predicts operational risk rather than specific fault types. The analysis does not explicitly model temporal dependencies, as each observation is treated independently. Therefore, future work may focus on incorporating time-dependent models to capture degradation evolution. Furthermore, a well-documented industrial dataset will help with the validation of the findings, and exploring noise-enhanced learning techniques may also improve the model’s robustness and generalization.
Although the proposed predictive maintenance framework demonstrated promising performance, several practical limitations should be acknowledged. First, the dataset exhibits severe class imbalance, a common characteristic of industrial monitoring systems where failure events are naturally rare. While the reformulation of the problem into a binary classification task (NORMAL versus At-Risk) improved model training and evaluation, the limited number of explicitly labeled BROKEN observations restricts the ability to characterize all possible degradation mechanisms and failure trajectories.
Second, industrial pump systems operate under varying load, flow, pressure and environmental conditions. Such variations may alter the statistical properties of sensor measurements and potentially affect model performance when applied to operating regimes that are not sufficiently represented in the training data. Consequently, periodic model retraining and recalibration may be required in practical deployments.
Third, although Random Forest models are generally robust to noise and missing values, industrial sensor networks remain vulnerable to measurement uncertainty, sensor drift, calibration errors and communication failures. The statistical preprocessing adopted in this study, including missing-value handling and correlation analysis, partially mitigates these effects; however, long-term deployment would benefit from dedicated sensor validation and data-quality monitoring procedures.
An analysis of the missing-value distribution for Sensor 50 revealed that the missing observations were highly concentrated rather than randomly distributed. Specifically, seven missing blocks consisted of isolated or very short gaps, while a single extended missing interval accounted for the vast majority of missing values. This pattern suggests a prolonged sensor outage or communication failure rather than random measurement loss. Consequently, although linear interpolation provided a practical preprocessing strategy, it may not fully recover the true discharge-pressure dynamics within the extended missing interval. Future work should investigate more advanced imputation methods specifically designed for long-duration sensor outages.
Finally, the present study was developed using data collected from a specific circulating water pump installation. While the proposed methodology is transferable to other rotating machinery applications, the trained model itself may not generalize directly to different pump types, operating environments or industrial facilities without additional retraining and validation. Future work will therefore focus on evaluating the proposed framework across multiple industrial assets and incorporating temporal learning models capable of capturing degradation evolution and remaining useful life estimation.
Lastly, although Gradient Boosted Trees achieved performance comparable to Random Forest, future work could investigate additional temporal learning architectures, such as LSTM and GRU networks, to determine whether explicit modeling of degradation evolution can further extend the prediction horizon. At the current horizon, the model performs exceptionally well (F1 = 0.994) but drops to an F1-score of 0.967 at 300 samples and 0.948 at 600 samples, driven primarily by a decrease in Recall (from 0.993 to 0.923). Because this growing prediction horizon accelerates the loss of Recall, future work could investigate temporal architectures, such as LSTM and GRU networks, to determine whether explicit modeling of degradation evolution can mitigate this decline and further extend the prediction horizon. Future-horizon experiments demonstrate that measurable degradation signatures remain detectable prior to entering these At-Risk states, confirming that the framework captures early degradation pathways rather than merely reacting to pre-existing failures.
Author Contributions
Conceptualization, M.P.; methodology, M.P. and Z.K.; software, M.P. and C.P.; validation, A.T., M.P. and C.P.; formal analysis, Z.K., M.P. and C.P.; investigation, M.P., Z.K., A.T. and C.P.; resources, M.P., Z.K. and C.P.; data curation, M.P., C.S. and C.P.; writing—original draft preparation, Z.K. and M.P.; writing—review and editing, Z.K., M.P. and C.P.; visualization, M.P. and A.T.; supervision, M.P. and C.S.; project administration, M.P. and C.S.; funding acquisition, C.P. All authors have read and agreed to the published version of the manuscript.
Funding
This research received no external funding.
Data Availability Statement
Data are contained within the manuscript.
Conflicts of Interest
The authors declare no conflicts of interest.
Abbreviations
The following abbreviations are used in this manuscript:
| PdM | Predictive Maintenance |
| CWPs | Circulating Water Pumps |
| IoT | Internet-of-Things |
| ML | Machine Learning |
| LG | Aircraft Landing Area |
References
- Romanssini, M.; de Aguirre, P.C.C.; Compassi-Severo, L.; Girardi, A.G. A Review on Vibration Monitoring Techniques for Predictive Maintenance of Rotating Machinery. Eng 2023, 4, 1797–1817. [Google Scholar] [CrossRef] [Scilit]
- Mallioris, P.; Diamantis, E.; Bialas, C.; Bechtsis, D. Predictive Maintenance Framework for Assessing Health State of Centrifugal Pumps. IAES Int. J. Artif. Intell. IJ-AI 2024, 13, 850–862. [Google Scholar] [CrossRef] [Scilit]
- Chen, L.; Wei, L.; Wang, Y.; Wang, J.; Li, W. Monitoring and Predictive Maintenance of Centrifugal Pumps Based on Smart Sensors. Sensors 2022, 22, 2106. [Google Scholar] [CrossRef] [Scilit]
- Aburakhia, S.; Tayeh, T.; Myers, R.; Shami, A. Similarity-Based Predictive Maintenance Framework for Rotating Machinery. In Proceedings of the 2022 5th International Conference on Communications, Signal Processing, and their Applications (ICCSPA), Cairo, Egypt, 27–29 December 2022; pp. 1–6. [Google Scholar]
- Benhanifia, A.; Cheikh, Z.B.; Oliveira, P.M.; Valente, A.; Lima, J. Systematic Review of Predictive Maintenance Practices in the Manufacturing Sector. Intell. Syst. Appl. 2025, 26, 200501. [Google Scholar] [CrossRef] [Scilit]
- Gawde, S.; Patil, S.; Kumar, S.; Kamat, P.; Kotecha, K.; Abraham, A. Multi-Fault Diagnosis of Industrial Rotating Machines Using Data-Driven Approach: A Review of Two Decades of Research. Eng. Appl. Artif. Intell. 2023, 123, 106139. [Google Scholar] [CrossRef] [Scilit]
- Ward, T.; Jenab, K.; Ortega-Moody, J.; Staub, S. A Comprehensive Review of Machine Learning Techniques for Condition-Based Maintenance. Int. J. Progn. Health Manag. 2024, 15, 1–20. [Google Scholar] [CrossRef] [Scilit]
- Zhu, T.; Ran, Y.; Zhou, X.; Wen, Y. A Survey on Intelligent Predictive Maintenance (IPdM) in the Era of Fully Connected Intelligence. IEEE Commun. Surv. Tutor. 2025, 28, 633–671. [Google Scholar] [CrossRef] [Scilit]
- Ulaganathan, J.; Sadyojatha, K. A Review on Maintenance Techniques for Industrial Equipment and Its Machine Learning Algorithms. Int. J. Adv. Res. Eng. Technol. IJARET 2021, 12, 183–194. [Google Scholar]
- Khalil, A.F.; Rostam, S. Machine Learning-Based Predictive Maintenance for Fault Detection in Rotating Machinery: A Case Study. Eng. Technol. Appl. Sci. Res. 2024, 14, 13181–13189. [Google Scholar] [CrossRef] [Scilit]
- Neupane, D.; Bouadjenek, M.R.; Dazeley, R.; Aryal, S. Data-Driven Machinery Fault Diagnosis: A Comprehensive Review. Neurocomputing 2025, 627, 129588. [Google Scholar] [CrossRef] [Scilit]
- Menanno, M.; Salsano, A. Centrifugal Pump Fault Diagnosis Using a Predictive Maintenance Model. In Proceedings of the International Conference on Industrial Engineering and Operations Management, Lisbon, Protugal, 18–20 July 2023; IEOM Society International: Southfield, MI, USA, 2023. [Google Scholar]
- Fausing Olesen, J.; Shaker, H.R. Predictive Maintenance for Pump Systems and Thermal Power Plants: State-of-the-Art Review, Trends and Challenges. Sensors 2020, 20, 2425. [Google Scholar] [CrossRef] [Scilit] [PubMed]
- Kalyankolo, Z.; Mwesigwa, S.; Ainomuhwezi, M.; Kibande, S.; Kalyankolo, U. Predictive Maintenance (Ai) In Power Generation for Rotating Machines Based on Vibration Analysis. Elite J. Sci. Res. Rev. 2024, 2, 34–50. [Google Scholar]
- Rysbayeva, G.; Umurzakova, A.; Alanesi, M. Implementation of Advanced Vibration Analysis Techniques for Predictive Maintenance of Rotating Machinery. East.-Eur. J. Enterp. Technol. 2025, 1, 69–79. [Google Scholar] [CrossRef] [Scilit]
- Kumar, M.S.; Prabhu, B.S. Rotating Machinery Predictive Maintenance Through Expert System. Int. J. Rotating Mach. 2000, 6, 285109. [Google Scholar] [CrossRef] [Scilit]
- Prommachan, W.; Surin, P.; Srinoi, P.; Pipathattakul, M. A Fuzzy Logic Modelling of Predictive Maintenance in Rotating Machinery. Arch. Mater. Sci. Eng. 2024, 126, 15–22. [Google Scholar] [CrossRef] [Scilit]
- Raouf, I.; Lee, H.; Kim, H.S. Mechanical Fault Detection Based on Machine Learning for Robotic RV Reducer Using Electrical Current Signature Analysis: A Data-Driven Approach. J. Comput. Des. Eng. 2022, 9, 417–433. [Google Scholar] [CrossRef] [Scilit]
- Raouf, I.; Kumar, P.; Soo Kim, H. Deep Learning-Based Fault Diagnosis of Servo Motor Bearing Using the Attention-Guided Feature Aggregation Network. Expert Syst. Appl. 2024, 258, 125137. [Google Scholar] [CrossRef] [Scilit]
- Raouf, I.; Lee, H.; Noh, Y.R.; Youn, B.D.; Kim, H.S. Prognostic Health Management of the Robotic Strain Wave Gear Reducer Based on Variable Speed of Operation: A Data-Driven via Deep Learning Approach. J. Comput. Des. Eng. 2022, 9, 1775–1788. [Google Scholar] [CrossRef] [Scilit]
- Raouf, I.; Kumar, P.; Cheon, Y.; Tanveer, M.; Jo, S.-H.; Kim, H.S. Advances in Prognostics and Health Management for Aircraft Landing Gear—Progress, Challenges, and Future Possibilities. Int. J. Precis. Eng. Manuf.-Green Technol. 2025, 12, 301–320. [Google Scholar] [CrossRef] [Scilit]
- Raouf, I.; Khan, A.; Khalid, S.; Sohail, M.; Azad, M.M.; Kim, H.S. Sensor-Based Prognostic Health Management of Advanced Driver Assistance System for Autonomous Vehicles: A Recent Survey. Mathematics 2022, 10, 3233. [Google Scholar] [CrossRef] [Scilit]
- Bruce, P.; Bruce, A.; Gedeck, P. Practical Statistics for Data Scientists: 50+ Essential Concepts Using R and Python; O’Reilly Media: Santa Rosa, CA, USA, 2020; ISBN 978-1-4919-5295-5. [Google Scholar]
- Trosset, M.W. An Introduction to Statistical Inference and Its Applications with R; Chapman and Hall/CRC: New York, NY, USA, 2009; ISBN 978-0-429-14849-1. [Google Scholar]
- Pump_Sensor_Data. Available online: https://www.kaggle.com/datasets/nphantawee/pump-sensor-data (accessed on 15 November 2025).
- Ahn, J.; Lee, Y.; Kim, N.; Park, C.; Jeong, J. Federated Learning for Predictive Maintenance and Anomaly Detection Using Time Series Data Distribution Shifts in Manufacturing Processes. Sensors 2023, 23, 7331. [Google Scholar] [CrossRef] [Scilit] [PubMed]
- Selvaraj, S.; Prabhu Kavin, B.; Kavitha, C.; Lai, W.-C. A Multiclass Fault Diagnosis Framework Using Context-Based Multilayered Bayesian Method for Centrifugal Pumps. Electronics 2022, 11, 4014. [Google Scholar] [CrossRef] [Scilit]
- Chen, J.; Wu, X.; Jiang, Z.; Li, Q.; Zhang, L.; Chu, J.; Song, Y.; Yang, L. Application of Machine Learning to Leakage Detection of Fluid Pipelines in Recent Years: A Review and Prospect. Measurement 2025, 248, 116857. [Google Scholar] [CrossRef] [Scilit]

Disclaimer/Publisher’s Note: The statements, opinions and data contained in all publications are solely those of the individual author(s) and contributor(s) and not of MDPI and/or the editor(s). MDPI and/or the editor(s) disclaim responsibility for any injury to people or property resulting from any ideas, methods, instructions or products referred to in the content. |
© 2026 by the authors. Licensee MDPI, Basel, Switzerland. This article is an open access article distributed under the terms and conditions of the Creative Commons Attribution (CC BY) license.