


Abstract
This paper presents a wearable system based on low-cost inertial sensors for the continuous monitoring of driver motion and behavior under controlled urban driving conditions. The system consists of distributed wearable units placed on the head, neck, and torso, each equipped with an inertial measurement unit (IMU) that measures linear acceleration and angular velocity. The acquired data are processed in real time to characterize the driver’s kinematic response during vehicle operation. The main contribution of this work is the definition of a novel Driving Aggressiveness Index (DAI) for quantitative driving style assessment. The proposed index integrates motion-derived features based on acceleration and angular velocity and combines information from multiple body segments through a normalization and weighting strategy, enabling a compact and interpretable representation of driver behavior. Experimental validation was conducted in an urban driving scenario under controlled traffic-free conditions, including typical maneuvers such as straight driving, braking, roundabout navigation, lane changes, and yielding, performed under both normal and aggressive driving styles. The results demonstrate that the monitoring system captures distinct kinematic patterns and that the proposed index provides a clear and consistent separation between driving behaviors. A data-driven threshold is also defined, enabling the quantitative classification of driving styles. Overall, the proposed approach offers an interpretable, scalable, and real-time solution for driver monitoring, with potential applications in road safety and sustainable mobility.
1. Introduction
Road safety remains a major global challenge affecting both developed and developing countries. Despite significant technological advances over recent decades, traffic accidents continue to be a leading cause of injury and mortality worldwide. Innovations such as advanced driver assistance systems (ADAS), automatic emergency braking, and vehicle-integrated sensing technologies have contributed substantially to improving road safety. However, human factors still play a dominant role, being responsible for the majority of traffic accidents [1,2]. Among these factors, aggressive driving behavior has been identified as a critical contributor to unsafe driving conditions.
Aggressive driving is typically characterized by abrupt and erratic maneuvers, including harsh acceleration and braking, rapid lane changes, and unstable vehicle control. These behaviors not only increase the likelihood of accidents but also negatively affect traffic flow efficiency, fuel consumption, and passenger comfort. Furthermore, aggressive driving has been associated with increased mechanical stress on vehicle components and higher environmental impact, reinforcing the need for monitoring solutions aligned with sustainable mobility objectives [3]. Consequently, the development of reliable systems capable of monitoring and evaluating driver behavior in real time has become a key research topic within intelligent transportation systems.
Existing approaches to driver behavior monitoring are predominantly based on computer vision techniques, which analyze visual information to detect driver state and behavior [4,5]. Although these methods have shown promising results, they often present limitations related to environmental conditions, such as illumination variability, occlusions, and camera positioning constraints [6,7,8,9,10,11,12]. In addition, privacy concerns and high computational requirements may hinder their deployment in real-world scenarios. In contrast, motion-based approaches using inertial sensors provide an alternative that is less sensitive to external factors and enables continuous, real-time measurement of driver kinematics with relatively low cost and computational complexity.
In this context, wearable sensing technologies, particularly those based on inertial measurement units (IMUs), have gained increasing attention in recent years. Wearable IMUs have been successfully applied in domains such as human motion analysis, biomechanics, healthcare, and industrial monitoring [13,14,15,16]. In the field of driver monitoring, previous studies have explored the use of body sensor networks to detect driver distractions and characterize specific movements, such as wrist, head, or leg motion, sometimes combined with vehicle data from controller area network (CAN) signals [17,18,19,20]. Nevertheless, the use of distributed wearable IMUs to comprehensively analyze upper-body kinematics for driving style assessment remains relatively unexplored, particularly in terms of deriving quantitative and interpretable metrics.
In parallel, several studies have proposed indicators to characterize driving style and aggressiveness [21], typically based on vehicle dynamics such as speed profiles, acceleration patterns, or fuel consumption metrics [22,23]. However, these approaches rely on vehicle-mounted sensors and may not fully capture the driver’s biomechanical response or posture-related behavior [24]. Moreover, many existing metrics lack generalizability or require complex calibration procedures, limiting their applicability in real-time and low-cost monitoring systems. Therefore, there is a clear need for approaches that combine wearable sensing with robust, interpretable, and scalable metrics for driver behavior assessment.
This paper presents a wearable system based on low-cost inertial sensors for continuous monitoring of driver motion and behavior during vehicle operation [25]. The system consists of distributed wearable units located on the head, neck, and torso, each equipped with an IMU that measures linear acceleration and angular velocity. These measurements are processed in real time to characterize the driver’s kinematic response during vehicle operation [26,27,28].
A novel quantitative Driving Aggressiveness Index (DAI) is proposed for driving style assessment. The index integrates motion-derived features based on acceleration and angular velocity collected from multiple body segments, including the head, neck, and torso. A normalization and weighting strategy is applied to ensure robustness, scalability, and comparability across different driving conditions and subjects.
From a biomechanical perspective, driving behavior can be reflected in the kinematic response of the driver’s body [29]. Aggressive driving is typically associated with abrupt vehicle maneuvers, including rapid acceleration, harsh braking, and sudden steering actions. These maneuvers generate larger inertial forces that are transmitted to the driver, resulting in increased linear acceleration and angular velocity of the upper body. Based on this observation, the following hypothesis is formulated: aggressive driving behavior produces larger amplitude and greater variability in the kinematic response of the driver’s upper body, which can be properly captured through wearable IMU measurements. Consequently, the motion of body segments such as the head, neck, and torso can be used as a proxy for driving style, supporting the definition of motion-based indicators, such as the proposed DAI.
The main contributions of this work can be summarized as follows:
- A wearable IMU-based system for real-time monitoring of driver motion using distributed sensors placed on the head, neck, and torso.
- The formulation of a novel DAI, integrating acceleration and angular velocity features into a single interpretable metric through normalization and weighted aggregation.
- Experimental validation under controlled driving conditions demonstrating that both the proposed DAI and the underlying IMU measurements capture discriminative kinematic patterns between normal and aggressive driving behaviors.
An experimental campaign was conducted in a real urban environment under controlled traffic-free conditions. The test protocol included representative driving maneuvers such as straight-line driving, braking, roundabout navigation, lane changes, and yielding, each performed under both normal and aggressive driving styles to evaluate the sensitivity of the proposed system and index.
The results demonstrate that the wearable monitoring system accurately captures driver motion patterns and that the proposed index provides a clear and consistent separation between normal and aggressive driving behaviors.
2. Materials and Methods
2.1. System Design and Hardware Architecture
The design of a driver monitoring system must satisfy several key requirements, including real-time data acquisition and processing, low-cost implementation, and minimal interference with natural driver behavior. In addition, the system should ensure user comfort and allow the execution of typical driving maneuvers without restriction.
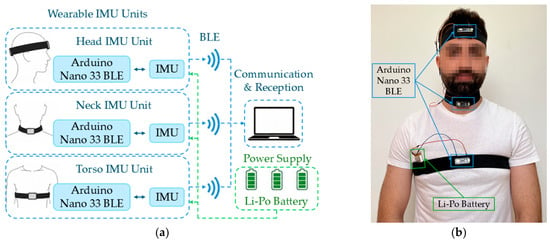
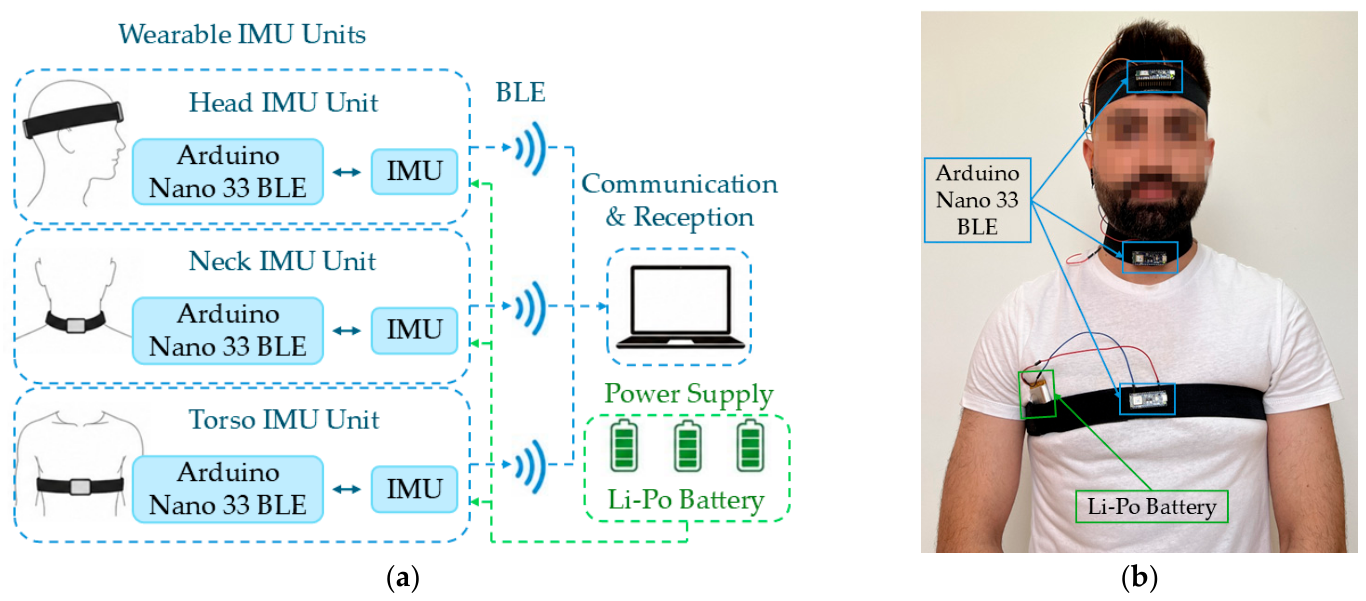
The proposed system consists of a set of wearable units distributed across the driver’s upper body (head, neck, and torso) [30]. Each unit integrates an Arduino Nano 33 BLE Sense Rev2 board [31], which incorporates an IMU capable of measuring linear acceleration and angular velocity along three orthogonal axes.
The wearable units are attached to the body using elastic straps placed on the head, neck, and torso. Each strap incorporates a dedicated pocket designed to house a 3.7 V, 2000 mAh lithium polymer battery, ensuring stable sensor positioning throughout the experiments, with no significant relative motion between the sensors and the body. An example of the experimental setup, including the placement of the wearable units, is shown in Figure 1.
Figure 1.
Proposed wearable monitoring system: (a) schematic diagram; (b) experimental setup on a participant.
Wireless communication between the wearable units and a laptop computer is established via Bluetooth Low Energy (BLE) using custom-developed firmware. Data acquisition, synchronization, and preliminary processing are performed in real time using algorithms implemented in MATLAB v24.1. (R2024a) https://www.mathworks.com (accessed on 27 September 2024). The IMUs operate at a sampling frequency of 50 Hz, providing continuous and synchronized measurements of the driver’s kinematic response during vehicle operation.
2.2. Participants
Four healthy volunteers (two male and two female participants) participated in the experimental campaign. Participants were aged between 23 and 37 years (mean age: 30 years), and all held valid driving licenses. Inclusion criteria included normal or corrected-to-normal vision and the absence of neurological or psychiatric disorders.
None of the participants had prior experience with the proposed wearable system. Before the experiments, each participant completed a short familiarization session and received instructions to ensure proper understanding of the system setup and the driving tasks to be performed.
The work was conducted in accordance with the ethical principles of the Declaration of Helsinki. The experimental protocol was reviewed and approved by the Committee on Ethics in Research of Universidad Carlos III de Madrid under the project “Monitoring of the physiological state of the driver of a vehicle” (acronym: PI_monitorización). All participants provided written informed consent prior to participation.
2.3. Experimental Setup
The experiments were conducted in Leganés (Madrid, Spain) using a commercial passenger vehicle (Opel Corsa, Zaragoza, Spain). The test environment was selected to replicate typical urban driving conditions while ensuring safety and repeatability. All trials were performed under controlled conditions in a traffic-free environment, allowing the execution of the predefined maneuvers without external interference.
These conditions were intentionally adopted to ensure repeatability and to isolate the effects of driving style on the recorded kinematic signals. This approach enabled a consistent comparison between normal and aggressive driving behaviors, minimizing the influence of external factors such as traffic or environmental variability.
Data acquisition sessions were carried out during daylight hours under clear weather conditions, ensuring good visibility and consistent experimental conditions. A co-driver was present to supervise the experimental procedure and manage the data acquisition system throughout the tests.
2.4. Experimental Protocol
Each participant performed a continuous driving task comprising representative urban driving maneuvers. The test protocol included the following maneuvers: straight-line driving, braking, roundabout navigation, lane changes, and yielding.
Prior to each driving session, participants received detailed instructions regarding the driving styles to be performed. Two distinct driving behaviors were defined:
- Normal driving: smooth and controlled maneuvers, adherence to traffic rules, stable speed, and proper lane positioning.
- Aggressive driving: abrupt acceleration and braking, rapid lane changes, higher maneuvering speeds, and less stable vehicle control, while maintaining safe operating conditions.
Participants were instructed to replicate these behaviors as consistently as possible. Each driving session included both styles, enabling direct comparison between driving conditions.
2.5. Data Acquisition and Processing
During the experiments, each wearable IMU continuously recorded linear acceleration and angular velocity along three orthogonal axes (X, Y, Z). The data streams from the different body locations (head, neck, and torso) were transmitted via BLE and synchronized in real time using custom-developed MATLAB scripts.
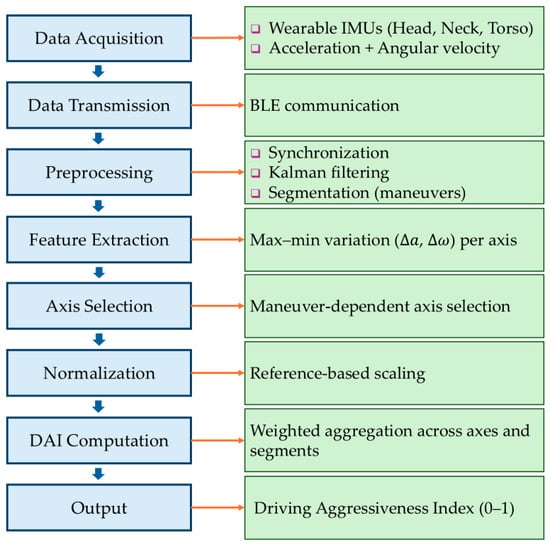
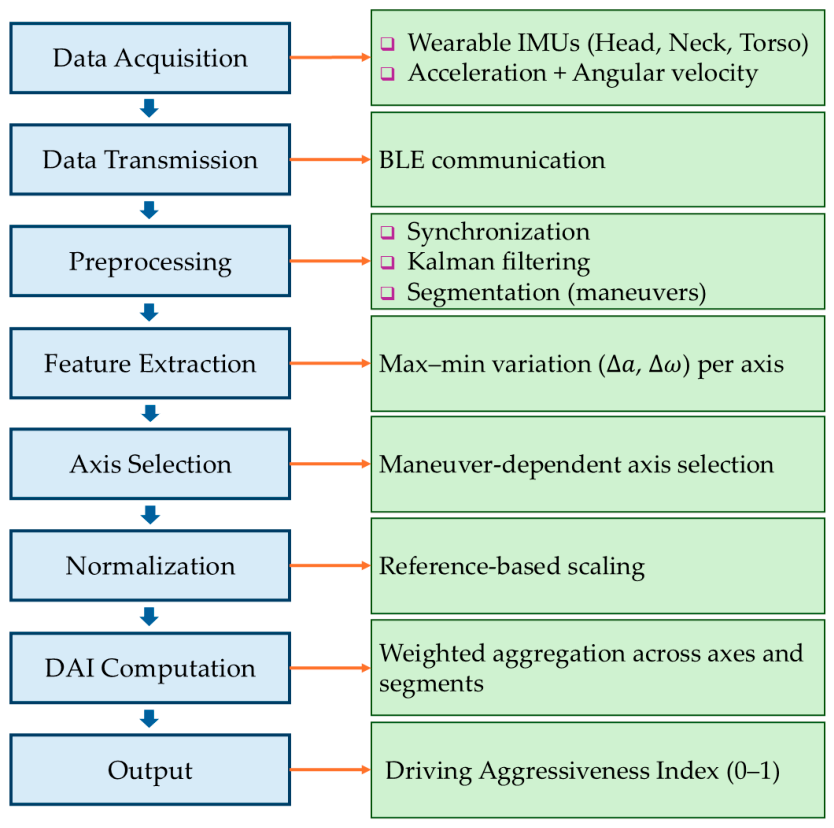
Preprocessing included signal synchronization, noise filtering, and segmentation according to the executed maneuvers. To mitigate measurement noise inherent to wearable IMU systems, a Kalman filter (KF) was applied to the recorded signals. The processed signals were then used for feature extraction and subsequent computation of the proposed DAI, as described in the following section.
To provide a clear overview of the proposed approach, the main processing stages are summarized in Figure 2. The flowchart illustrates the overall processing framework used for driver behavior assessment, from data acquisition using wearable IMUs to the computation of the DAI.
Figure 2.
Flowchart of the proposed wearable driver monitoring system.
3. Results
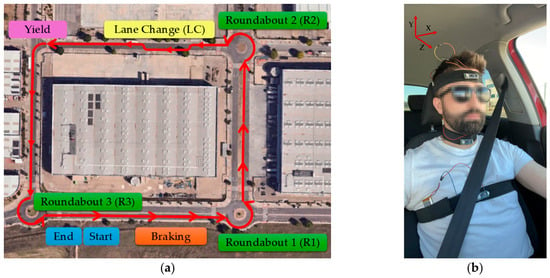
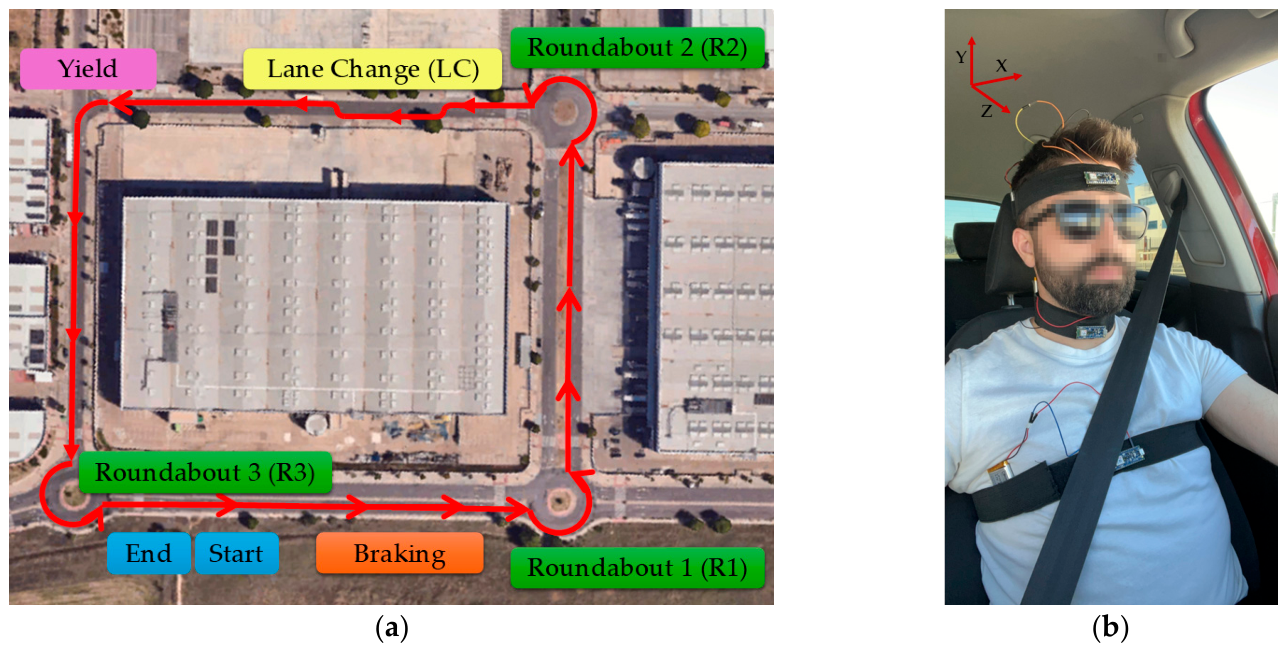
This section presents the results obtained from representative driving experiments conducted with one of the participants under two driving conditions: normal driving (Test 1) and aggressive driving (Test 2). Figure 3a illustrates the experimental scenario, including the route followed during the tests, while Figure 3b shows a participant during data acquisition.
Figure 3.
Experimental scenario: (a) map of the test area and vehicle trajectory; (b) participant during data acquisition.
To improve the reliability of the recorded signals, a KF was applied to the IMU signals prior to feature extraction [32].
The KF implementation consisted of a prediction stage and a correction stage. The time update (prediction) can be expressed by
and the measurement update (correction) is computed as
where represents the predicted state at time step , is the predicted state covariance, and denote the process and measurement noise covariance matrices, respectively, is the Kalman gain, and is the measurement at time k.
The driver’s motion is analyzed along three orthogonal axes: mediolateral (X-axis), vertical (Y-axis), and anteroposterior (Z-axis), as illustrated in Figure 3b.
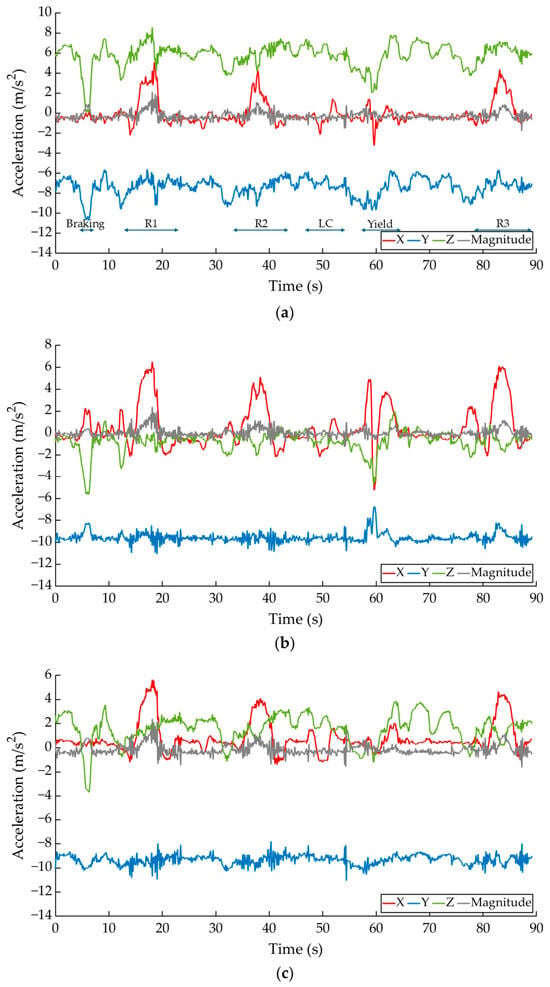
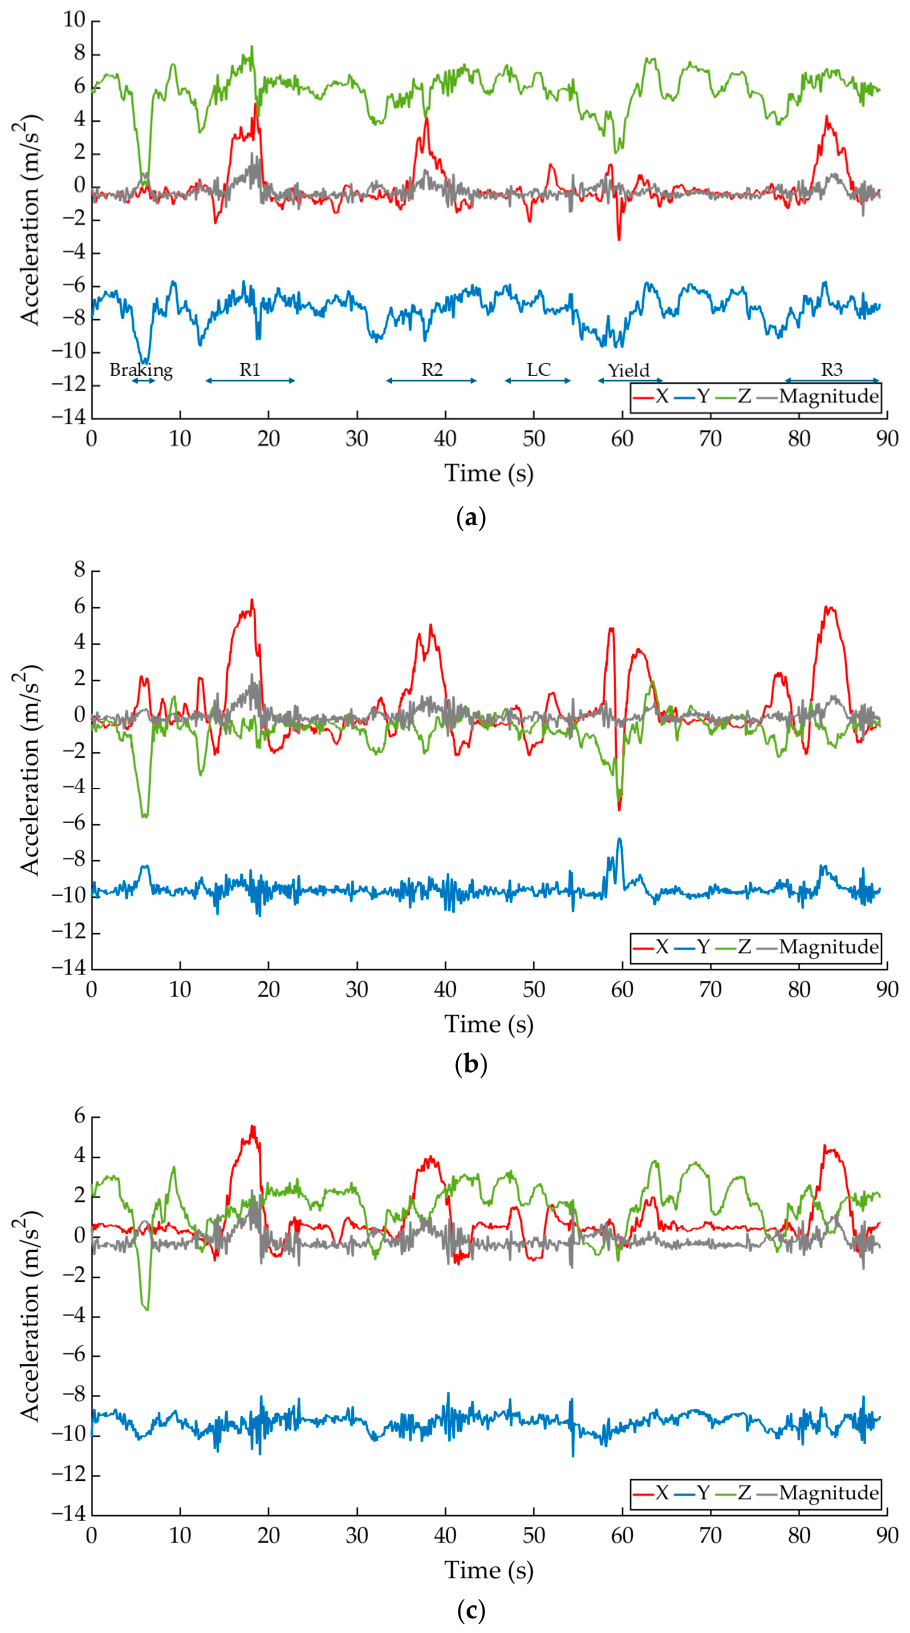
Figure 4 presents the filtered acceleration signals obtained from the head, neck, and torso sensors during Test 1 (normal driving), together with the corresponding acceleration magnitude. The magnitude of the acceleration is computed as
where , , and are the acceleration components along the three axes and is the acceleration due to gravity. This formulation isolates the dynamic component of motion by compensating for the gravitational contribution.
Figure 4.
Filtered acceleration signals obtained during Test 1 (normal driving) together with the corresponding acceleration magnitude for: (a) head; (b) neck; and (c) torso.
The temporal evolution of the signals in Figure 4 reflects the different driving maneuvers performed along the experimental route. During the intervals 0–3.94 s, 7.29–12.18 s, 22.94–32.73 s, 43.21–46.99 s, 54.01–57.25 s, and 64.24–78.44 s, the driver performed straight-line driving while maintaining a steady speed and stable lane position. In these segments, the acceleration signals exhibit low variability and reduced amplitude, reflecting stable and controlled driving behavior.
A braking maneuver was performed between 3.95 and 7.28 s. This event is characterized by a pronounced variation in the longitudinal acceleration component (Z-axis), indicating a smooth reduction in speed.
Roundabout maneuvers were carried out during the intervals 12.19–22.93 s, 32.74–43.20 s, and 78.45–89.14 s. These segments show increased activity in both the mediolateral (X-axis) and anteroposterior (Z-axis) components, associated with steering maneuvers and speed adjustments while navigating the circular trajectory.
The lane change maneuver, performed between 47.00 and 54.00 s, is reflected by a transient variation in the mediolateral acceleration (X-axis), corresponding to lateral vehicle displacement. Similarly, the yielding maneuver between 57.26 and 64.23 s is characterized by moderate longitudinal acceleration variations associated with controlled deceleration and subsequent reacceleration.
It can be observed that the vertical acceleration component (Y-axis) remains close to gravitational acceleration, confirming the correct vertical alignment of the sensors. Consequently, the driver’s motion is primarily captured in the mediolateral (X-axis) and anteroposterior (Z-axis) components, which are the most relevant for characterizing driving behavior.
Overall, the results demonstrate that the proposed system is capable of capturing distinct motion patterns associated with different driving maneuvers under normal driving conditions.
To complement the qualitative analysis, the acceleration signals were quantitatively processed by extracting the maximum–minimum variation for each axis and body segment, as summarized in Table 1. This metric provides a compact descriptor of signal amplitude and motion intensity during each maneuver while reducing sensitivity to transient fluctuations. Although the Y-axis mainly reflects the gravitational component, it is included for completeness; however, the most relevant variations are observed in the X- and Z-axes.
Table 1.
Maximum–minimum variation of acceleration (m/s2) during Test 1 maneuvers.
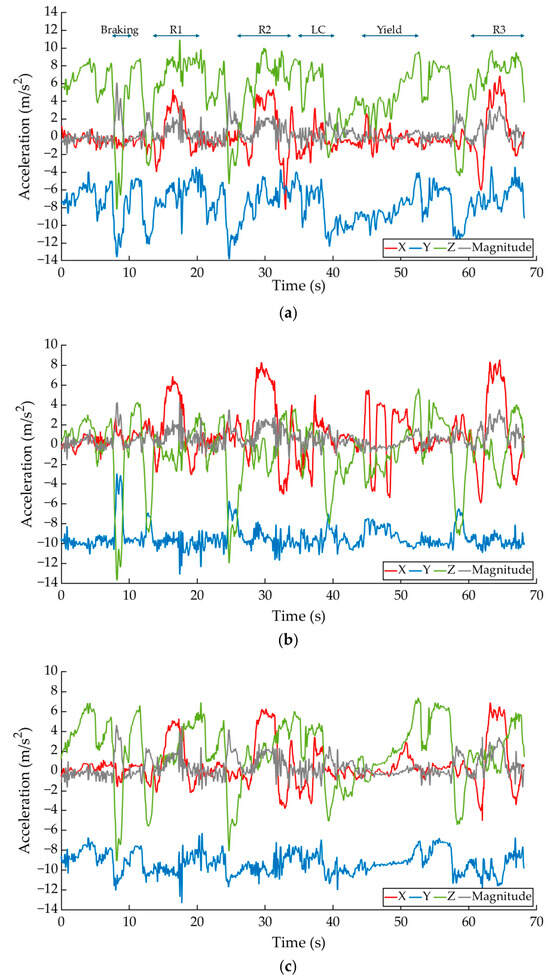
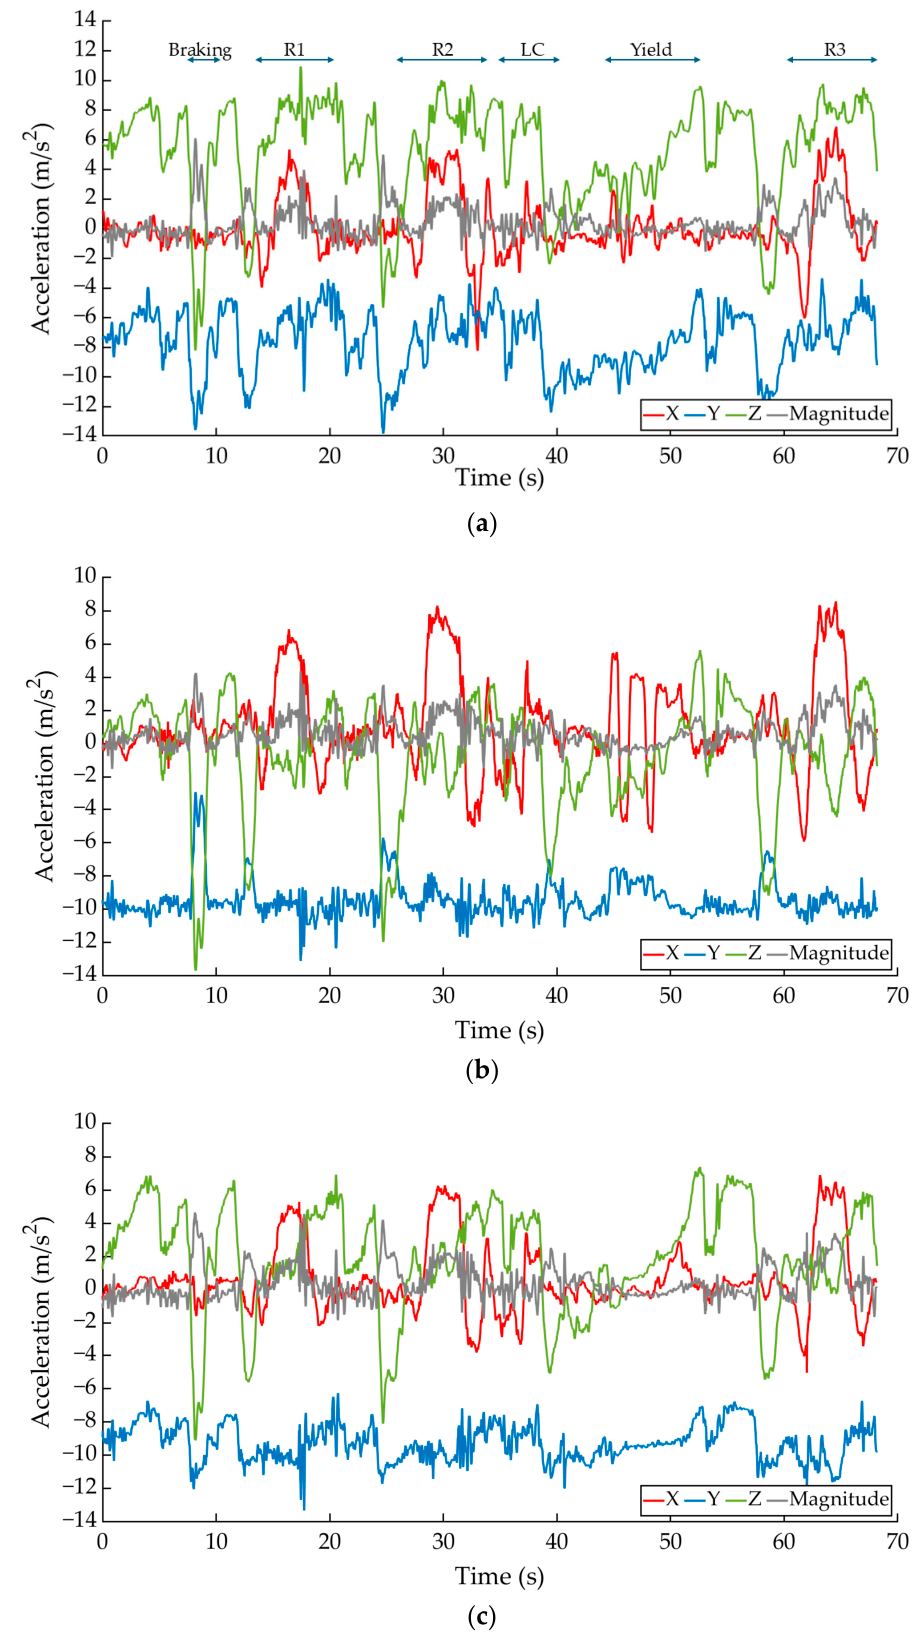
The filtered acceleration signals measured at the head, neck, and torso during Test 2 (aggressive driving), together with the corresponding acceleration magnitude, are shown in Figure 5. Compared to the normal driving condition in Figure 4, the signals exhibit higher amplitudes and greater variability, reflecting a more dynamic and abrupt driving behavior.
Figure 5.
Filtered acceleration signals obtained during Test 2 (aggressive driving) together with the corresponding acceleration magnitude for: (a) head; (b) neck; and (c) torso.
During the intervals 0–7.30 s, 11.59–13.44 s, 20.15–25.96 s, 33.94–35.17 s, 40.39–44.20 s, and 53.46–60.25 s, the driver maintained straight-line motion in the right lane under aggressive driving conditions. In contrast to Test 1, these segments show increased fluctuations in both the mediolateral (X-axis) and anteroposterior (Z-axis) acceleration components, indicating less stable vehicle motion.
A pronounced braking event was observed at approximately 7.31 s, characterized by a sharp peak in the longitudinal acceleration (Z-axis), corresponding to abrupt deceleration. Similarly, the yielding maneuver between 44.21 and 53.45 s presents larger acceleration variations compared to the equivalent maneuver under normal driving conditions.
Roundabout maneuvers, performed during the intervals 13.45–20.14 s, 25.97–33.93 s, and 60.26–68.18 s, exhibit significantly higher lateral and longitudinal acceleration levels. These patterns are associated with higher entry speeds and more abrupt steering inputs while navigating the circular trajectory.
The aggressive lane change maneuver between 35.18 and 40.38 s is characterized by rapid and high-amplitude variations in both the mediolateral (X-axis) and anteroposterior (Z-axis) acceleration components, indicating sudden lateral displacement combined with abrupt longitudinal vehicle dynamics.
Overall, the increased amplitude and variability of the signals in the X- and Z-axes reflect faster and more pronounced upper-body movements, which are consistent with aggressive driving behavior.
Table 2 summarizes the maximum–minimum variation of acceleration measured at the head, neck, and torso during the maneuvers performed in Test 2.
Table 2.
Maximum–minimum variation of acceleration (m/s2) during Test 2 maneuvers.
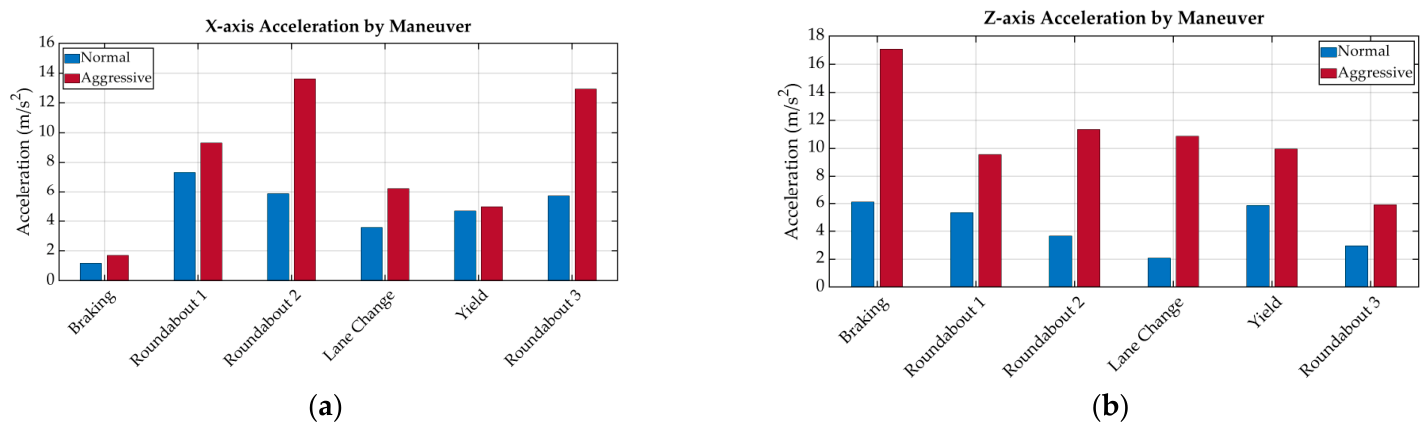
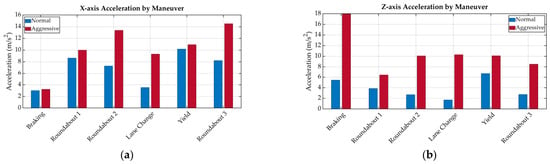
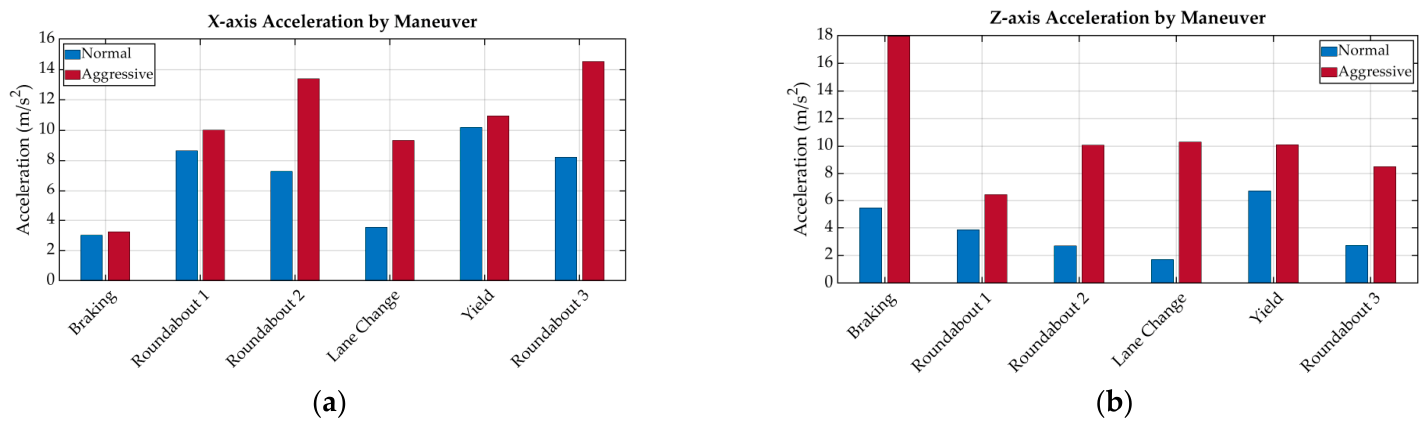
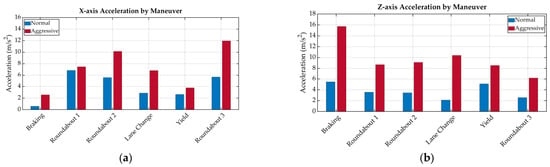
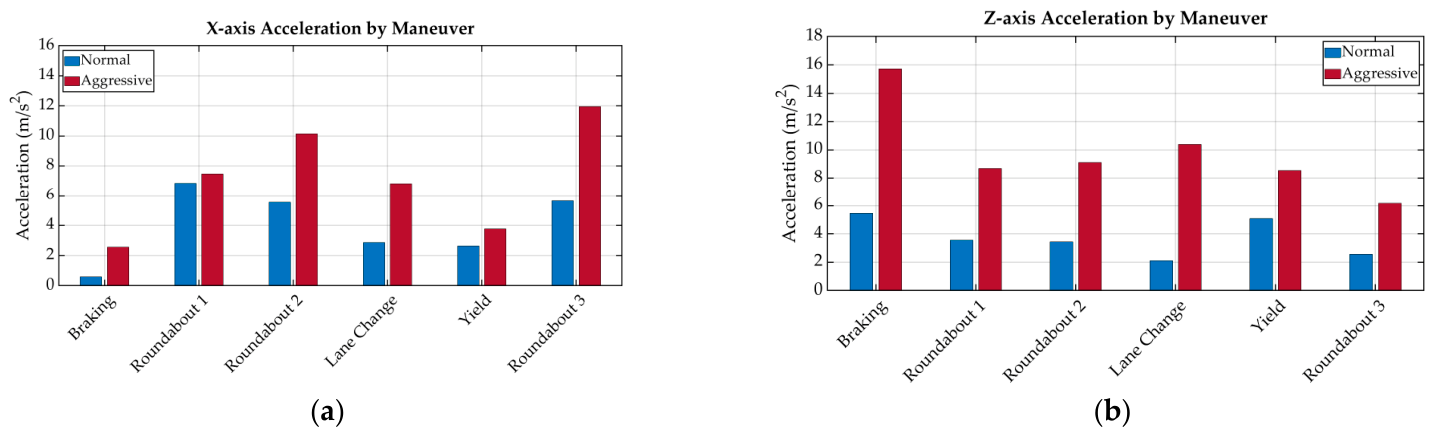
Figure 6, Figure 7 and Figure 8 summarize the maximum–minimum acceleration variation measured at the head, neck, and torso for each driving maneuver under normal and aggressive driving conditions. In all body segments, aggressive driving consistently produces higher acceleration ranges than normal driving, confirming the increased motion intensity associated with abrupt steering, acceleration, and braking maneuvers.
Figure 6.
Maximum–minimum acceleration variation measured at the head for each driving maneuver under normal and aggressive driving conditions: (a) X-axis; (b) Z-axis.
Figure 7.
Maximum–minimum acceleration variation measured at the neck for each driving maneuver under normal and aggressive driving conditions: (a) X-axis; (b) Z-axis.
Figure 8.
Maximum–minimum acceleration variation measured at the torso for each driving maneuver under normal and aggressive driving conditions: (a) X-axis; (b) Z-axis.
The largest differences are primarily observed in the mediolateral (X-axis) and anteroposterior (Z-axis) components. In the head measurements in Figure 6, aggressive braking produces a marked increase in longitudinal acceleration, with the Z-axis variation increasing from 6.12 m/s2 under normal driving to 17.07 m/s2 during aggressive driving. Similarly, Roundabout 2 exhibits a substantial increase in X-axis acceleration, from 5.83 m/s2 to 13.62 m/s2, reflecting stronger lateral head motion associated with abrupt steering actions.
The neck measurements shown in Figure 7 exhibit trends similar to those observed at the head, although with even larger acceleration variations in several maneuvers. For example, during Roundabout 3, the X-axis acceleration increases from 8.23 m/s2 under normal driving to 14.52 m/s2 during aggressive driving. Likewise, the lane change maneuver produces a marked increase in Z-axis acceleration, from 1.71 m/s2 to 10.31 m/s2, indicating increased sensitivity of the neck segment to combined lateral and longitudinal vehicle dynamics.
The torso measurements in Figure 8 exhibit smoother variations overall, reflecting the greater stability and inertia of the trunk. Nevertheless, aggressive driving still generates clearly distinguishable increases in acceleration amplitude. In particular, braking maneuvers increase the Z-axis acceleration variation from 5.46 m/s2 to 15.72 m/s2, while Roundabout 3 increases the X-axis variation from 5.64 m/s2 to 11.96 m/s2.
Overall, the results presented in Figure 4, Figure 5, Figure 6, Figure 7 and Figure 8 demonstrate that the proposed wearable system effectively captures consistent kinematic differences between normal and aggressive driving behaviors across multiple upper-body segments. Different body segments provide complementary information regarding driver motion dynamics. In particular, the neck exhibited the highest sensitivity to aggressive maneuvers, while the head provided a more direct representation of upper-body motion. In contrast, the torso offered a more stable representation of the overall body dynamics due to its greater mass and inertia. This complementary behavior supports the use of multi-sensor fusion for a comprehensive and robust assessment of driving behavior.
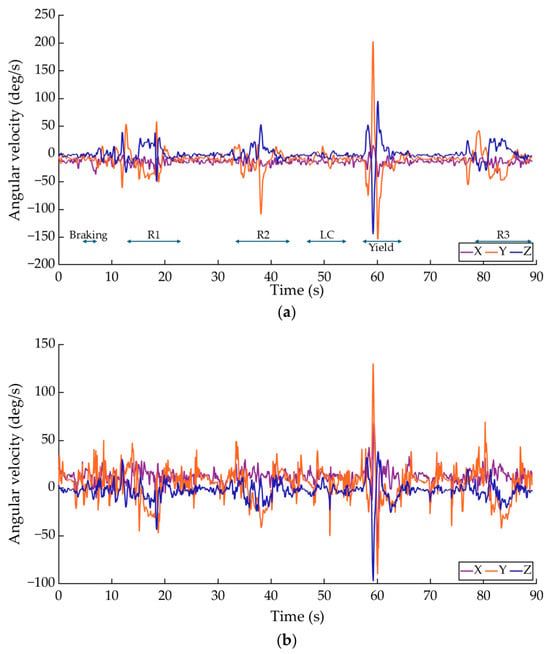
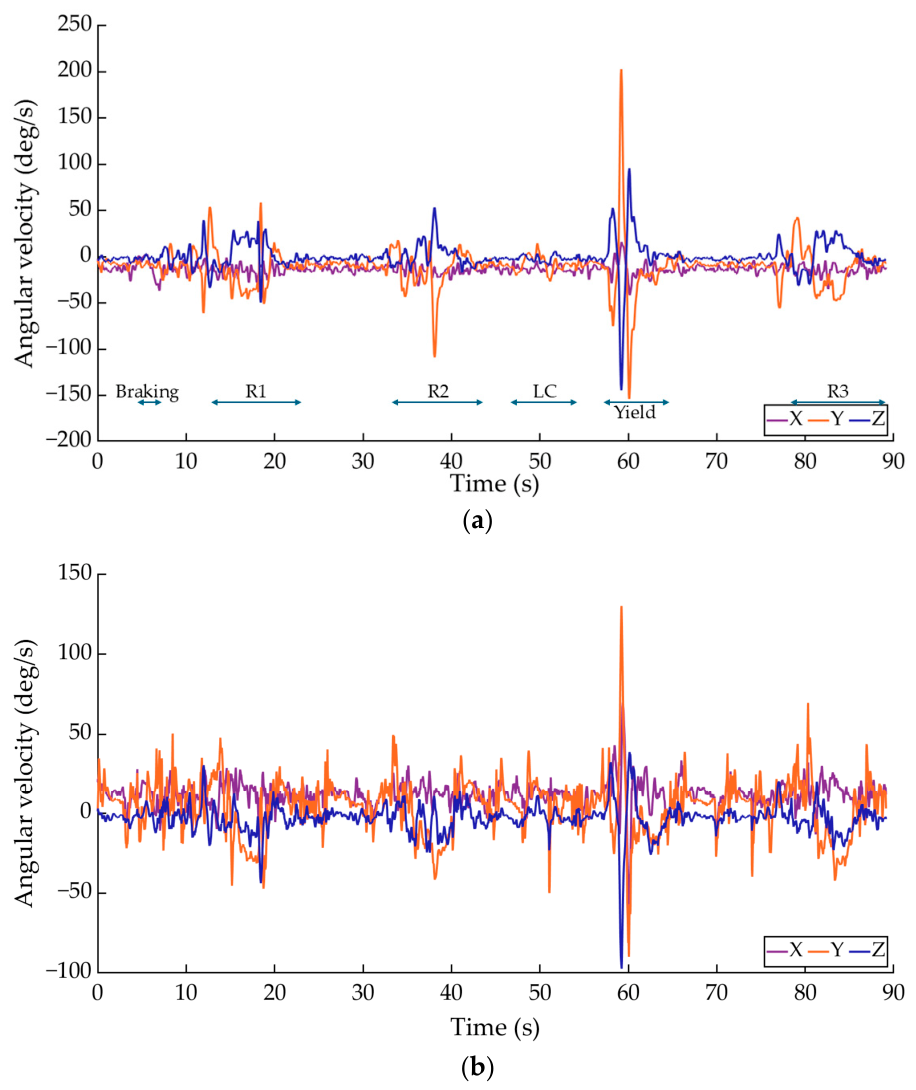
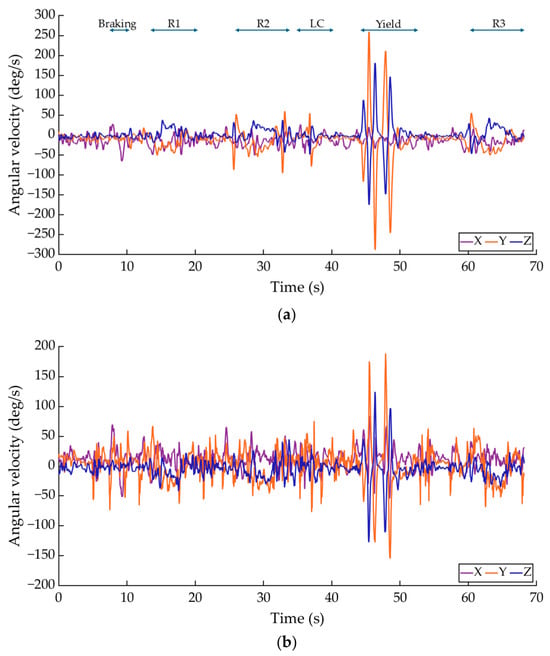
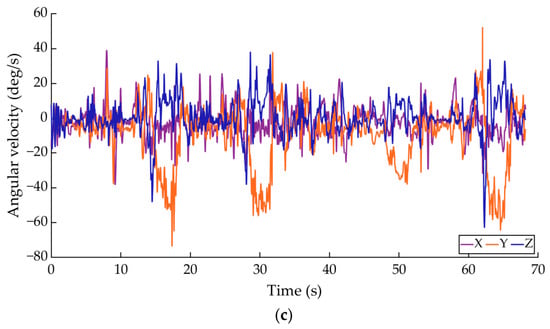
To further characterize the driver’s motion, the angular velocity signals measured at the head, neck, and torso were analyzed under both normal and aggressive driving conditions. Figure 9 and Figure 10 show the angular velocity profiles obtained from the IMUs for normal and aggressive driving, respectively. These signals provide complementary information to the linear acceleration data by capturing the rotational dynamics of the driver’s upper body during vehicle operation.
Figure 9.
Acquired results during Test 1 in terms of angular velocity of: (a) head; (b) neck; (c) torso.
Figure 10.
Acquired results during Test 2 in terms of angular velocity of: (a) head; (b) neck; (c) torso.
As shown in Figure 9, the angular velocity signals under normal driving conditions exhibit relatively low amplitudes and smooth temporal variations, reflecting stable and controlled rotational motion of the head, neck, and torso. In contrast, Figure 10 shows that aggressive driving is characterized by higher angular velocity peaks and increased signal variability, especially during dynamic maneuvers involving abrupt steering actions and rapid body adjustments.
Table 3 and Table 4 summarize the maximum–minimum variation of angular velocity obtained under normal and aggressive driving conditions. The results reveal a consistent increase in angular velocity ranges during aggressive driving across all maneuvers and body segments. For example, during braking, the X-axis angular velocity measured at the head increased from 39.85 deg/s under normal driving to 94.16 deg/s during aggressive driving. Similarly, during the lane change maneuver, the head X-axis angular velocity increased from 17.47 deg/s to 73.53 deg/s. The neck also exhibited particularly high sensitivity, especially in the Y-axis, where the yielding maneuver increased from 220.30 deg/s to 343.47 deg/s during aggressive driving. In several cases, the angular velocity range during aggressive driving was two to four times higher than that observed under normal driving conditions, highlighting the high sensitivity of rotational motion to driving style.
Table 3.
Maximum–minimum variation of angular velocity (deg/s) during Test 1 maneuvers.
Table 4.
Maximum–minimum variation of angular velocity (deg/s) during Test 2 maneuvers.
Overall, these results confirm that rotational motion constitutes a highly sensitive indicator of driving style, exhibiting clear differences between normal and aggressive driving conditions across all analyzed body segments. These observations are consistent with the acceleration-based analysis presented earlier, reinforcing the need for a unified metric that integrates both translational and rotational motion.
The clear differences observed between driving conditions motivate the definition of a quantitative metric capable of capturing such variations. This metric is introduced in the following subsection as the proposed DAI.
3.1. Driving Aggressiveness Index Definition
To provide a quantitative measure of driving style, a novel Driving Aggressiveness Index (DAI) is defined by combining acceleration- and angular-velocity-based features extracted from wearable IMUs located at the head, neck, and torso. The proposed DAI can be interpreted as a composite metric that aggregates motion descriptors from multiple body segments into a single scalar value. The computation is structured in three main steps: (i) feature extraction based on signal variability, (ii) normalization to ensure comparability across physical quantities, and (iii) weighted aggregation of the normalized features. This formulation ensures both interpretability and computational efficiency, making the index suitable for real-time applications.
The axes considered in the computation of the DAI were selected based on the experimental analysis of the recorded signals. The results showed that the dominant motion components vary depending on both the physical magnitude (linear acceleration or angular velocity) and the type of driving maneuver. Therefore, for each maneuver, the two axes exhibiting the highest variability were selected to capture the most relevant motion variations while preserving a compact formulation.
The selected axes for each maneuver and magnitude are summarized in Table 5.
Table 5.
Selected acceleration and angular velocity axes for DAI computation.
For each body segment and maneuver , the maximum–minimum variation of linear acceleration and angular velocity is computed as
where and denote the selected axes for acceleration and angular velocity, respectively, according to Table 5.
To combine variables with different physical units, all features are normalized with respect to reference values as
The normalization step ensures that all features contribute within a common bounded range, preventing dominance of variables with larger numerical values and enabling consistent integration across different magnitudes.
A partial aggressiveness score is then defined for each body segment as
with the constraint . In this work, greater relevance is assigned to acceleration-based features due to their higher discriminative capability observed in the experimental analysis, particularly during maneuvers involving abrupt changes in vehicle dynamics. Accordingly, the following weights are adopted: , , , and .
Finally, the global DAI is obtained by combining the contributions of the three body segments as
where . Based on the experimental results, the neck segment exhibited the highest sensitivity to changes in driving style, showing larger variability across maneuvers. Therefore, the segment weights were set to , , and .
A sensitivity analysis was conducted by evaluating alternative values of the segment weights in Equation (12) within moderate ranges. The results showed that, for all tested configurations, the DAI values obtained under aggressive driving remained higher than those corresponding to normal driving for each maneuver. This indicates that the relative differences between driving styles are preserved under moderate variations of the segment weighting parameters. However, the class separation margin may vary depending on the selected weight configuration.
The resulting index provides a normalized scalar value in the range [0, 1], where higher values indicate more aggressive driving behavior. Through the proposed formulation, the DAI effectively integrates complementary information from translational and rotational motion into a single interpretable metric suitable for maneuver-based analysis and real-time driving style assessment.
Although the DAI is defined as a continuous variable, its values can be interpreted in relation to the intensity of the driver’s kinematic response. Based on the experimental results, indicative ranges can be identified, where smaller values correspond to smooth driving, intermediate values to moderate behavior, and larger values to aggressive maneuvers.
3.2. Illustrative Example of DAI Computation
To illustrate the proposed formulation, the lane change maneuver (LC) was selected as a representative example, since it showed clear differences between normal and aggressive driving conditions in both the acceleration- and angular-velocity-based measurements. The normalization reference values were defined as the maximum observed variations within the experimental dataset. For linear acceleration, the reference values were and . For angular velocity, the reference values were and .
For the aggressive lane change maneuver, the acceleration ranges obtained from Table 2 are , , , , , and . The corresponding angular velocity ranges obtained from Table 4 are , , , , , and .
Using Equations (9) and (10), the normalized values for the head are:
For the neck:
For the torso:
By applying Equation (11), with , , , and , the partial aggressiveness scores for each body segment are given by
Finally, using Equation (12) with , , and , the global DAI for the aggressive lane change maneuver is:
For comparison, the same procedure was applied to the normal lane change maneuver using the values reported in Table 1 and Table 3. In this case, the resulting normalized segment scores were , , and , leading to a global value of:
Therefore, the aggressive lane change maneuver yielded a DAI approximately three times higher than that obtained under normal driving conditions. This example demonstrates that the proposed formulation effectively transforms the observed kinematic differences between driving styles into a normalized and interpretable quantitative metric.
3.3. Driving Aggressiveness Index Evaluation
Table 6 summarizes the values of the DAI computed for each driving maneuver under both normal and aggressive driving conditions. The results provide a quantitative comparison of driving style across different scenarios, integrating both translational and rotational motion components derived from wearable IMU data.
Table 6.
Computed DAI for normal and aggressive driving conditions for each maneuver.
As observed in Table 6, the proposed DAI consistently yields higher values under aggressive driving conditions for all maneuvers, confirming its capability to distinguish between different driving styles. The magnitude of the difference between normal and aggressive driving varies depending on the type of maneuver, reflecting the underlying vehicle dynamics and the associated driver motion patterns.
The braking maneuver exhibits the largest increase in the DAI, highlighting the strong sensitivity of the proposed metric to abrupt longitudinal dynamics. This result is consistent with the significant acceleration and angular velocity variations observed during aggressive deceleration.
Lane change and roundabout maneuvers (R1, R2, and R3) show moderate but consistent differences between driving conditions. Among them, R2 and R3 present a more pronounced increase in the index, indicating a higher level of motion intensity during aggressive execution of continuous steering maneuvers.
The yielding maneuver exhibits relatively high DAI values even under normal driving conditions. This behavior can be attributed to the elevated angular velocity observed in the upper-body segments, particularly in the head and neck, which reduces the relative difference between driving styles. Nevertheless, the index still captures an increase under aggressive conditions, confirming its robustness in scenarios with inherently complex motion patterns.
A statistical analysis was conducted to assess the significance of the observed differences in DAI values between normal and aggressive driving to preliminarily assess the discriminative capability of the proposed DAI. The Wilcoxon signed-rank test [33] revealed a statistically significant difference between normal and aggressive driving conditions (p = 0.0312), indicating that the increase in DAI under aggressive driving is not due to random variation. The DAI values obtained under normal driving conditions were 0.267 ± 0.079, whereas under aggressive driving conditions, they increased to 0.525 ± 0.106. This reflects a clear increase in motion intensity and variability during aggressive driving. Nevertheless, given the limited number of samples, these results should be interpreted as preliminary, while a larger and more diverse experimental campaign is planned for future activity.
Overall, the results demonstrate that the proposed DAI provides a consistent and interpretable quantitative measure of driving behavior across different maneuvers. The integration of acceleration and angular velocity, together with the maneuver-dependent axis selection, allows the index to adapt to the dominant motion characteristics associated with each maneuver while maintaining its applicability for real-time driver monitoring.
3.4. Quantitative Validation of the DAI
To complement the descriptive analysis, a quantitative validation of the proposed DAI was performed.
First, a threshold-based decision analysis was carried out using the DAI values obtained for each maneuver under normal and aggressive driving conditions. A preliminary data-driven threshold was defined as the midpoint between the maximum DAI observed under normal driving and the minimum DAI observed under aggressive driving as
Using the values reported in Table 6, Equation (24) yields a threshold value of 0.397. Using this threshold, all analyzed maneuvers were properly classified as normal or aggressive driving.
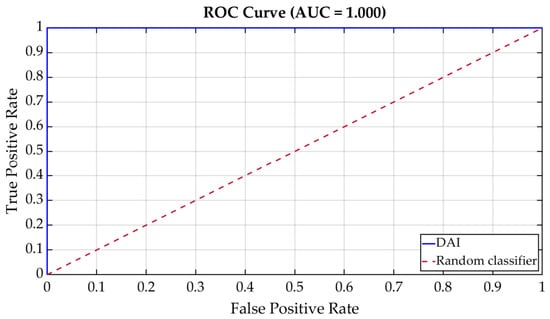
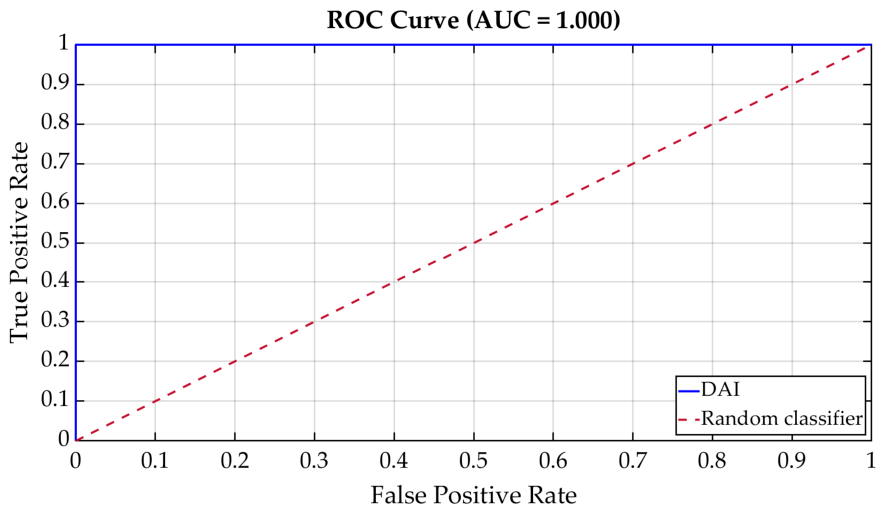
To further evaluate the discriminative capability of the DAI, a Receiver Operating Characteristic (ROC) analysis [34] was performed. The resulting ROC curve is shown in Figure 11, with an Area Under the Curve (AUC) equal to 1.000, indicating excellent separation between the two classes within the analyzed dataset.
Figure 11.
ROC curve of the DAI for binary classification between normal and aggressive driving.
To further assess the discriminative information contained in the acquired IMU signals, additional supervised classification models were evaluated using the acceleration and angular velocity signals measured at the head, neck, and torso as input features. The labels were defined as normal driving and aggressive driving, and the dataset was divided into training and test subsets using an 80/20 split.
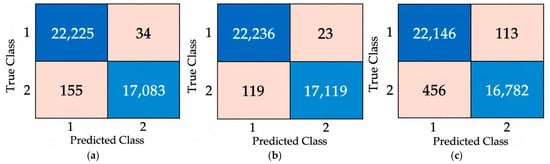
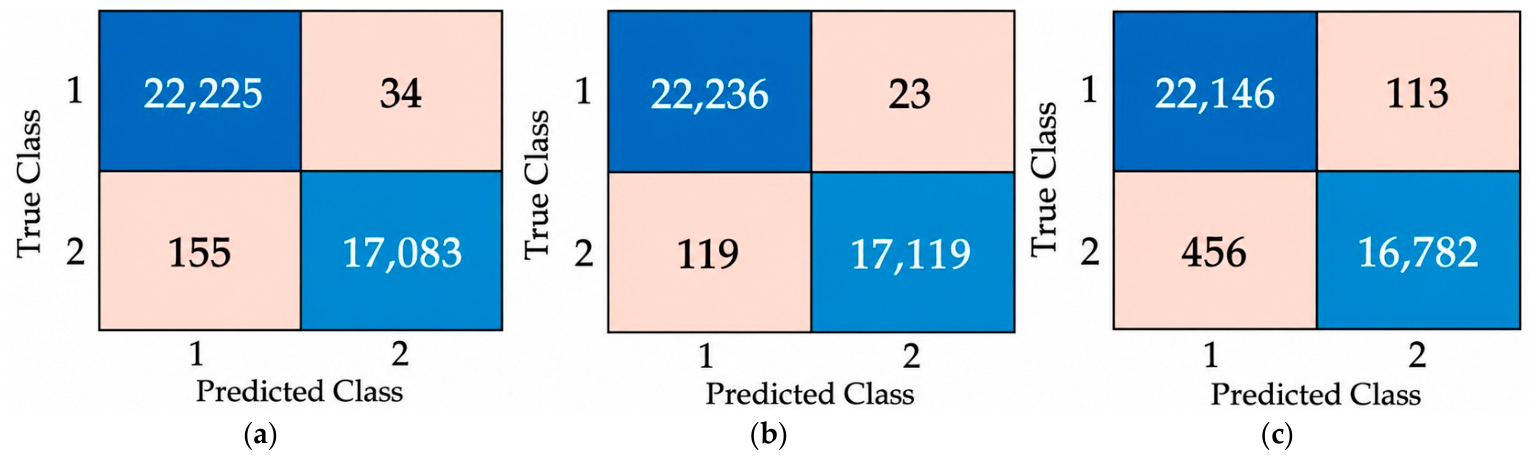
Three classification models were considered: a Long Short-Term Memory (LSTM) network, a Convolutional Neural Network (CNN), and a fully connected neural network (FCNN). The obtained classification accuracies were 99.52%, 99.64%, and 98.56%, respectively.
The confusion matrices corresponding to these models are shown in Figure 12. The results reveal a very low number of misclassifications for all evaluated approaches. In particular, the CNN achieved the best overall performance, with only 23 normal driving samples misclassified as aggressive and 119 aggressive driving samples misclassified as normal. The LSTM model also showed excellent performance, with similarly low misclassification rates. Although the FCNN presented slightly lower accuracy, it still provided a clear separation between driving behaviors.
Figure 12.
Confusion matrices obtained for the classification of driving behavior using IMU signals: (a) LSTM; (b) CNN; (c) FCNN. Class labels are defined as 1 = normal driving and 2 = aggressive driving.
These results confirm that the filtered IMU signals contain strong discriminative kinematic information capable of distinguishing normal and aggressive driving conditions with high reliability.
Overall, the quantitative analysis demonstrates that both the proposed DAI and the filtered IMU signals enable effective discrimination between normal and aggressive driving. However, it should be noted that these results were obtained under controlled experimental conditions using a limited dataset. Therefore, they should be interpreted as preliminary, and further validation with larger and more diverse datasets is required to assess generalizability.
4. Discussion
The results presented in this work demonstrate the capability of the proposed wearable sensing system and the associated DAI to effectively characterize and quantify driver behavior under controlled urban driving conditions. The integration of linear acceleration and angular velocity measurements obtained from multiple upper-body segments provides a comprehensive representation of driver kinematics, enabling the detection of distinct motion patterns associated with different driving styles.
A key finding of this work is the consistent increase in the DAI under aggressive driving conditions across all evaluated maneuvers. This confirms that the proposed index successfully captures the higher motion intensity and variability induced by abrupt driving actions. In particular, maneuvers involving strong longitudinal dynamics, such as braking, exhibit the largest differences between normal and aggressive driving. This behavior is consistent with the significant acceleration peaks and pronounced body movements observed during abrupt deceleration, highlighting the sensitivity of the index to critical safety-related events.
For maneuvers involving continuous steering, such as roundabouts (R1, R2, and R3) and lane changes, the DAI also shows a clear separation between driving styles, although with more moderate differences. This result reflects the more gradual and sustained nature of these maneuvers, where motion intensity is distributed over time rather than concentrated in short-duration events. Among them, R2 and R3 exhibit a more pronounced increase in the index, indicating a stronger kinematic response during curved driving maneuvers.
The yielding maneuver presents a particular behavior, with relatively high DAI values even under normal driving conditions. This effect can be attributed to the elevated angular velocity observed in the head and neck segments, likely associated with visual scanning and situational awareness tasks performed by the driver. As a result, the relative difference between normal and aggressive driving is reduced for this maneuver. Nevertheless, the index still reflects an increase under aggressive conditions, demonstrating its robustness in scenarios characterized by inherently complex motion patterns.
Although variability across participants was observed, all subjects exhibited higher DAI values under aggressive driving, indicating consistent behavior across individuals.
Recent driver behavior assessment approaches can be broadly classified into vision-based, vehicle-based, and wearable sensor-based methods. Vision-based systems relying on deep learning techniques have shown high performance in detecting driver states, although they are sensitive to illumination conditions and occlusions [35]. Vehicle-based approaches, on the other hand, infer driver behavior from signals, such as speed, steering angle, or lane position, but only provide indirect measurements of the driver’s state [36].
More recently, wearable sensing approaches based on IMUs have gained attention as a lightweight and low-cost alternative. For instance, body-worn accelerometers have been used to detect inattentive driving and drowsiness by analyzing motion patterns and physiological signals [37]. Similarly, wrist-mounted IMUs have demonstrated the ability to recognize driver distraction in real time using deep learning models, achieving high F1-scores across different distraction tasks [38]. In addition, smartphone-based IMU data have been successfully used to classify driving styles such as normal, aggressive, or slow driving with high accuracy using machine learning techniques [39].
In addition to data-driven and sensor-based approaches, several studies have proposed quantitative indices to characterize aggressive driving behavior. For example, aggressiveness has been modeled using driving signals such as speed and acceleration, enabling classification accuracies above 90% [40]. Similarly, composite indices such as the Aggressiveness Propensity Index or Erratic Driving Index have been introduced to quantify aggressive driving based on vehicle dynamics or simulated driving patterns [41,42]. However, these indices are typically derived from vehicle-level signals and do not directly capture the driver’s physical response.
Despite these advances, most IMU-based approaches rely on complex feature engineering or black-box machine learning models, which may limit interpretability. In contrast, the proposed approach focuses on a compact and interpretable representation of driver aggressiveness based on kinematic measurements and index computation, enabling real-time deployment while maintaining low computational complexity.
To better evaluate the proposed approach within the existing literature, a comparison with representative driver behavior monitoring methods is summarized in Table 7. The comparison highlights differences in sensing modalities, data types, methodological approaches, and practical limitations, helping to contextualize the proposed IMU-based DAI within the existing driver behavior monitoring literature.
Table 7.
Comparison with existing driver behavior monitoring approaches.
Despite the above-mentioned advantages, several limitations should be pointed out. First, the experimental campaign was conducted under controlled conditions in a traffic-free environment, and aggressive driving behavior was intentionally simulated by the participants. While this approach ensures repeatability and safety, it may not fully capture the complexity of real-world driving scenarios, where factors such as traffic density, environmental conditions, and driver stress can influence behavior. Nevertheless, the controlled experimental design allows the identification of kinematic differences between driving styles, providing a clear baseline for the definition and validation of the proposed index.
Second, the number of participants was limited, which may affect the generalizability of the results. Inter-subject variability, including differences in driving habits, physical characteristics, and sensor placement, should be further investigated.
From a practical perspective, the proposed system relies on multiple wearable units placed on the head, neck, and torso, which may raise concerns regarding usability in real-world scenarios. During the experimental campaign, participants wore the devices using elastic straps without reporting noticeable discomfort, suggesting that the system can be used for short- to medium-duration driving sessions without significantly interfering with natural driving behavior. However, long-term comfort and user acceptance remain important factors to be verified, particularly in professional driving contexts.
In this work, the wearable units were securely attached using elastic straps, ensuring stable positioning of the sensors throughout the experiments, with no significant relative motion between the sensors and the corresponding body segments during data acquisition. Nevertheless, potential sensor displacement in long-term or real-world scenarios should be further investigated in future large-scale experimental campaigns involving professional drivers.
Additionally, the definition of the reference values used for normalization may influence the resulting DAI values, and alternative normalization strategies could be explored in future work.
Future research should focus on extending the experimental validation to a larger and more diverse population, including different driving conditions, traffic scenarios, and road types. The integration of the proposed system with vehicle-based data and ADAS could also be explored to develop hybrid monitoring solutions. Furthermore, future work could explore the integration of machine learning techniques to automatically adapt the weighting factors of the proposed DAI or to develop hybrid approaches combining interpretable index-based assessment with data-driven classification models.
Overall, the results confirm that the proposed wearable IMU-based monitoring system, combined with the DAI, constitutes a promising approach for real-time driver behavior assessment. The method provides a scalable, low-cost, and non-intrusive solution with potential applications in road safety enhancement, driver training, fleet monitoring, and sustainable mobility frameworks.
5. Conclusions
This paper presents a wearable IMU-based system for the continuous monitoring of driver motion and real-time assessment of driving behavior. The proposed system, based on distributed sensors placed on the head, neck, and torso, enables a comprehensive characterization of upper-body kinematics through the measurement of linear acceleration and angular velocity.
A novel DAI is introduced to quantify driving style by integrating motion-derived features from multiple body segments. The index incorporates a maneuver- and magnitude-dependent axis selection strategy, allowing the index to adapt to the dominant motion patterns associated with each driving scenario.
The experimental results demonstrate that the proposed system captures distinct kinematic patterns associated with different driving behaviors. In particular, aggressive driving consistently produces larger DAI values across all analyzed maneuvers, reflecting increased motion intensity and variability. The largest differences between normal and aggressive driving were detected in maneuvers involving strong longitudinal dynamics, such as braking, while maneuvers with continuous steering, such as roundabouts and lane changes, exhibited more moderate but consistent variations. These results confirm the capability of the proposed index to discriminate between different driving styles based on motion-derived features.
Overall, the proposed method provides a robust, interpretable, and computationally efficient metric for driver behavior assessment. Its wearable and non-intrusive nature, combined with the use of low-cost sensors, makes it well-suited for real-time applications in intelligent transportation systems.
Future work will focus on extending the validation to larger and more diverse populations and more complex driving environments. In addition, the integration with vehicle-based data and ADAS, as well as the incorporation of machine learning techniques, will be explored to further enhance system performance.
Author Contributions
Conceptualization, M.G. and M.C.; methodology, M.G. and M.C.; software, M.G.; validation, M.G.; formal analysis, M.G. and M.C.; investigation, M.G. and M.C.; resources, M.G. and M.C.; data curation, M.G.; writing—original draft preparation, M.G.; writing—review and editing, M.G. and M.C.; visualization, M.G. and M.C.; supervision, M.C. All authors have read and agreed to the published version of the manuscript.
Funding
This research received no external funding.
Data Availability Statement
Data are available upon request to the corresponding author.
Acknowledgments
The study was conducted in accordance with the Declaration of Helsinki and approved by the Institutional Ethics Committee of Universidad Carlos III de Madrid on 4 March 2024.
Conflicts of Interest
The authors declare no conflicts of interest.
References
- Rolison, J.J.; Regev, S.; Moutari, S.; Feeney, A. What are the factors that contribute to road accidents? An assessment of law enforcement views, ordinary drivers’ opinions, and road accident records. Accid. Anal. Prev. 2018, 115, 11–24. [Google Scholar] [CrossRef] [Scilit]
- Sagberg, F.; Selpi; Bianchi Piccinini, G.F.; Engström, J. A review of research on driving styles and road safety. Hum. Factors 2015, 57, 1248–1275. [Google Scholar] [CrossRef] [Scilit] [PubMed]
- Szumska, E.M.; Jurecki, R. The effect of aggressive driving on vehicle parameters. Energies 2020, 13, 6675. [Google Scholar] [CrossRef] [Scilit]
- Shahverdy, M.; Fathy, M.; Berangi, R.; Sabokrou, M. Driver behavior detection and classification using deep convolutional neural networks. Expert Syst. Appl. 2020, 149, 113240. [Google Scholar] [CrossRef] [Scilit]
- Lee, K.W.; Yoon, H.S.; Song, J.M.; Park, K.R. Convolutional neural network-based classification of driver’s emotion during aggressive and smooth driving using multi-modal camera sensors. Sensors 2018, 18, 957. [Google Scholar] [CrossRef] [Scilit]
- Papadelis, C.; Chen, Z.; Kourtidou-Papadeli, C.; Bamidis, P.D.; Chouvarda, I.; Bekiaris, E.; Maglaveras, N. Monitoring sleepiness with on-board electrophysiological recordings for preventing sleep-deprived traffic accidents. Clin. Neurophysiol. 2007, 118, 1906–1922. [Google Scholar] [CrossRef] [Scilit] [PubMed]
- Wang, L.; Wu, X.; Ba, B.; Dong, W. A vision-based method to detect perclos features. Comput. Eng. Sci. 2006, 6, 52–54. [Google Scholar]
- Xia, Q.; Song, Y.; Zhu, X. The research development on driving fatigue based on perclos. Tech. Autom. Appl. 2008, 6, 39, 43–46. [Google Scholar]
- Ji, Q.; Zhu, Z.; Lan, P. Real-time nonintrusive monitoring and prediction of driver fatigue. IEEE Trans. Veh. Technol. 2004, 53, 1052–1068. [Google Scholar] [CrossRef] [Scilit]
- Abtahi, S.; Hariri, B.; Shirmohammadi, S. Driver Drowsiness Monitoring Based on Yawning Detection. In Proceedings of the 2011 IEEE International Instrumentation and Measurement Technology Conference, Hangzhou, China, 10–12 May 2011. [Google Scholar] [CrossRef] [Scilit]
- Xiao, F.; Bao, C.Y.; Yan, F.S. Yawning detection based on gabor wavelets and LDA. J. Beijing Univ. Technol. 2009, 35, 409–413. [Google Scholar]
- Yin, B.C.; Fan, X.; Sun, Y.F. Multiscale dynamic features based driver fatigue detection. Int. J. Pattern Recogn. Artif. Intell. 2009, 23, 575–589. [Google Scholar] [CrossRef] [Scilit]
- Fang, Y.M.; Chang, C.C. Users’ psychological perception and perceived readability of wearable devices for elderly people. Behav. Inf. Technol. 2016, 35, 225–232. [Google Scholar] [CrossRef] [Scilit]
- Camomilla, V.; Bergamini, E.; Fantozzi, S.; Vannozzi, G. Trends Supporting the In-Field Use of Wearable Inertial Sensors for Sport Performance Evaluation: A Systematic Review. Sensors 2018, 18, 873. [Google Scholar] [CrossRef] [Scilit]
- Martino Cinnera, A.; Picerno, P.; Bisirri, A.; Koch, G.; Morone, G.; Vannozzi, G. Upper limb assessment with inertial measurement units according to the international classification of functioning in stroke: A systematic review and correlation meta-analysis. Top. Stroke Rehabil. 2023, 31, 66–85. [Google Scholar] [CrossRef] [Scilit]
- Fang, Z.; Woodford, S.; Senanayake, D.; Ackland, D. Conversion of Upper-Limb Inertial Measurement Unit Data to Joint Angles: A Systematic Review. Sensors 2023, 23, 6535. [Google Scholar] [CrossRef] [Scilit]
- Sun, W.; Si, Y.; Guo, M.; Li, S. Driver Distraction Recognition Using Wearable IMU Sensor Data. Sustainability 2021, 13, 1342. [Google Scholar] [CrossRef] [Scilit]
- Sathyanarayana, A.; Nageswaren, S.; Ghasemzadeh, H.; Jafari, R.M.; Hansen, J.H. Body Sensor Networks for Driver Distraction Identification. In Proceedings of the 2008 IEEE International Conference on Vehicular Electronics and Safety, Columbus, OH, USA, 22–24 September 2008. [Google Scholar] [CrossRef] [Scilit]
- Tavakoli, A.; Kumar, S.; Boukhechba, M.; Heydarian, A. Driver State and Behavior Detection Through Smart Wearables. In Proceedings of the 2021 IEEE Intelligent Vehicles Symposium (IV), Nagoya, Japan, 11–17 July 2021. [Google Scholar] [CrossRef] [Scilit]
- Choi, M.; Koo, G.; Seo, M.; Kim, S.W. Wearable Device-Based System to Monitor a Driver’s Stress, Fatigue, and Drowsiness. IEEE Trans. Instrum. Meas. 2018, 67, 634–645. [Google Scholar] [CrossRef] [Scilit]
- Moinard, J.; Ceccarelli, M.; Russo, M. Design and testing of a wearable system for monitoring car drivers. Appl. Sci. 2025, 15, 1930. [Google Scholar] [CrossRef] [Scilit]
- Al-refai, G.; Al-refai, M.; Alzu’bi, A. Driving style and traffic prediction with artificial neural networks using on-board diagnostics and smartphone sensors. Appl. Sci. 2024, 14, 5008. [Google Scholar] [CrossRef] [Scilit]
- Shahariar, G.H.; Bodisco, T.A.; Zare, A.; Sajjad, M.; Jahirul, M.I.; Van, T.C.; Bartlett, H.; Ristovski, Z.; Brown, R.J. Impact of driving style and traffic condition on emissions and fuel consumption during real-world transient operation. Fuel 2022, 319, 123874. [Google Scholar] [CrossRef] [Scilit]
- Zhao, D.; Zhong, Y.; Fu, Z.; Hou, J.; Zhao, M. A Review of Driving Behavior Recognition Methods Based on Vehicle Multisensor Information. J. Adv. Transp. 2022, 2022, 7287511. [Google Scholar] [CrossRef] [Scilit]
- Garrosa, M.; Ceccarelli, M. Experimental Characterization of a Monitoring System for Car Drivers. In Proceedings of I4SDG Workshop 2025—IFToMM for Sustainable Development Goals, I4SDG 2025; Mechanisms and Machine Science; Carbone, G., Quaglia, G., Eds.; Springer: Cham, Switzerland, 2025; Volume 180, pp. 539–548. [Google Scholar] [CrossRef] [Scilit]
- Garrosa, M.; Ceccarelli, M.; Díaz, V. Biomechanics in vehicle accidents for risk analysis. Int. J. Mech. Control 2023, 24, 43–52. [Google Scholar]
- Garrosa, M.; Ceccarelli, M.; Díaz, V.; Russo, M. Experimental Validation of a Driver Monitoring System. Machines 2023, 11, 1060. [Google Scholar] [CrossRef] [Scilit]
- Garrosa, M.; Ceccarelli, M.; Sanz Sánchez, S.; Russo, M. Design and validation of a low-cost vehicle driver monitoring device. Mech. Syst. Signal Process. 2025, 235, 112939. [Google Scholar] [CrossRef] [Scilit]
- Bastien, C.; Blundell, M.V.; Neal-Sturgess, C. A study into the kinematic response for unbelted human occupants during emergency braking. Int. J. Crashworthiness 2017, 22, 689–703. [Google Scholar] [CrossRef] [Scilit]
- Ceccarelli, M.; Garrosa, M.; Díaz, V. Corpetto di Monitoraggio Per Conducente di Veicoli. Italy Patent No.102023000010938, 10 June 2025. [Google Scholar]
- Arduino Nano 33 BLE Sense Rev2. Available online: https://docs.arduino.cc/hardware/nano-33-ble-sense-rev2/ (accessed on 30 January 2026).
- Alfian, R.I.; Ma’arif, A.; Sunardi, S. Noise reduction in the accelerometer and gyroscope sensor with the Kalman filter algorithm. J. Robot. Control 2021, 2, 180–189. [Google Scholar] [CrossRef] [Scilit]
- Wilcoxon, F. Individual comparisons by ranking methods. Biom. Bull. 1945, 1, 80–83. [Google Scholar] [CrossRef] [Scilit]
- Fawcett, T. An introduction to ROC analysis. Pattern Recognit. Lett. 2006, 27, 861–874. [Google Scholar] [CrossRef] [Scilit]
- Rahman, A.; Hriday, M.B.H.; Khan, R. Computer vision-based approach to detect fatigue driving and face mask for edge computing device. Heliyon 2022, 8, e11204. [Google Scholar] [CrossRef] [Scilit]
- Mohammed, K.; Abdelhafid, M.; Kamal, K.; Ismail, N.; Ilias, A. Intelligent driver monitoring system: An Internet of Things-based system for tracking and identifying the driving behavior. Comput. Stand. Interfaces 2023, 84, 103704. [Google Scholar] [CrossRef] [Scilit]
- Akiduki, T.; Nagasawa, J.; Zhang, Z.; Omae, Y.; Arakawa, T.; Takahashi, H. Inattentive Driving Detection Using Body-Worn Sensors: Feasibility Study. Sensors 2022, 22, 352. [Google Scholar] [CrossRef] [Scilit]
- Xie, Z.; Li, L.; Xu, X. Real-time driving distraction recognition through a wrist-mounted accelerometer. Hum. Factors 2022, 64, 1412–1428. [Google Scholar] [CrossRef] [Scilit] [PubMed]
- Kanwal, K.; Rustam, F.; Chaganti, R.; Jurcut, A.D.; Ashraf, I. Smartphone inertial measurement unit data features for analyzing driver driving behavior. IEEE Sens. J. 2023, 23, 11308–11323. [Google Scholar] [CrossRef] [Scilit]
- Rodríguez González, A.B.; Wilby, M.R.; Vinagre Díaz, J.J.; Sánchez Ávila, V. Modeling and detecting aggressiveness from driving signals. IEEE Trans. Intell. Transp. Syst. 2014, 15, 1419–1428. [Google Scholar] [CrossRef] [Scilit]
- Hamdar, S.H.; Mahmassani, H.S.; Chen, R.B. Aggressiveness propensity index for driving behavior at signalized intersections. Accid. Anal. Prev. 2008, 40, 315–326. [Google Scholar] [CrossRef] [Scilit]
- Kim, Y.; Oh, C.; Choe, B.; Choi, S.; Kim, K. Development of a methodology for detecting intentional aggressive driving events using multi-agent driving simulations. J. Korean Soc. Transp. 2018, 36, 51–65. [Google Scholar] [CrossRef] [Scilit]
- Baccour, M.H.; Driewer, F.; Schäck, T.; Kasneci, E. Comparative analysis of vehicle-based and driver-based features for driver drowsiness monitoring by support vector machines. IEEE Trans. Intell. Transp. Syst. 2022, 23, 23164–23178. [Google Scholar] [CrossRef] [Scilit]

Disclaimer/Publisher’s Note: The statements, opinions and data contained in all publications are solely those of the individual author(s) and contributor(s) and not of MDPI and/or the editor(s). MDPI and/or the editor(s) disclaim responsibility for any injury to people or property resulting from any ideas, methods, instructions or products referred to in the content. |
© 2026 by the authors. Licensee MDPI, Basel, Switzerland. This article is an open access article distributed under the terms and conditions of the Creative Commons Attribution (CC BY) license.