


Abstract
Turbine selection requires information on the operating range as well as peak efficiency. This paper extends previously documented bench-scale Francis, Pelton, and Cross-flow turbine data through a new analysis of CFD and laboratory performance curves. The original ANSYS CFX (2025) calculations used steady incompressible RANS, standard k–ε closure, and Frozen-Rotor coupling. The reported global comparison gives relative-deviation ranges of 1.13–9.96% for shaft power and 0.83–4.67% for hydraulic efficiency; geometry adjustments against the same benchmarks prevent treating this comparison as independent validation. The present analysis extracts plotted operating points and normalizes power and efficiency by their sampled maxima and speed by the corresponding peak locations. Approximate upper limits for retaining 90% of the sampled maximum efficiency occur at normalized speeds of 1.13, 1.43, and 1.06 for the Francis, Pelton, and Cross-flow cases, respectively. These describe the recorded operating paths, which have different discharges and varying heads, rather than universal turbine-family characteristics. Static-pressure plots identify locations for further investigation, but their incomplete pressure reference prevents quantitative cavitation-margin or vapor-volume assessment. The resulting qualitative selection workflow connects operating-speed compatibility and performance retention to site-specific hydraulic, generator, manufacturing, and maintenance checks.
1. Introduction
The global transition toward low-carbon electricity is increasing interest in decentralized generation that can be adapted to local resources. Micro-hydropower can use small rivers, irrigation networks, and existing water infrastructure, but energy yield depends strongly on the match between the site hydrograph and the selected turbine [1,2]. In this article, “micro-hydropower” is used consistently because the investigated bench-scale systems are well below the commonly used 100 kW upper bound.
Net head and available discharge determine which turbine configurations can be considered at a site. Generator speed, the seasonal distribution of flow, installation requirements, maintainability, and cost then determine how these configurations can be operated [3,4]. Because these conditions change the operating point, the highest efficiency quoted for a turbine is insufficient to estimate its usefulness over an entire operating period.
Seasonal variation in head and discharge can force a turbine to operate away from its best-efficiency point for substantial periods. Treating efficiency as constant can consequently bias annual-energy estimates [5,6]. This motivates examining the shape of an operating curve and the fraction of maximum performance retained away from its peak.
Pelton, Francis, Kaplan/propeller, and Cross-flow turbines occupy distinct but overlapping head–discharge domains. Pelton machines generally suit higher heads and lower discharges, Francis machines suit intermediate conditions, and Cross-flow machines can retain useful performance over variable flows [2,3,7,8,9,10,11,12,13,14,15]. These ranges provide preliminary screening only; the final choice depends on the actual operating distribution and project constraints.
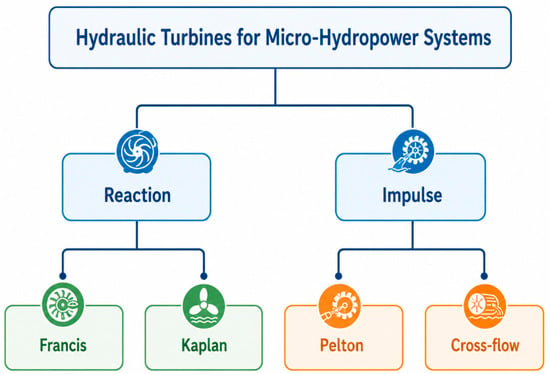
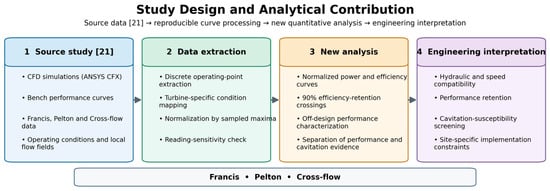
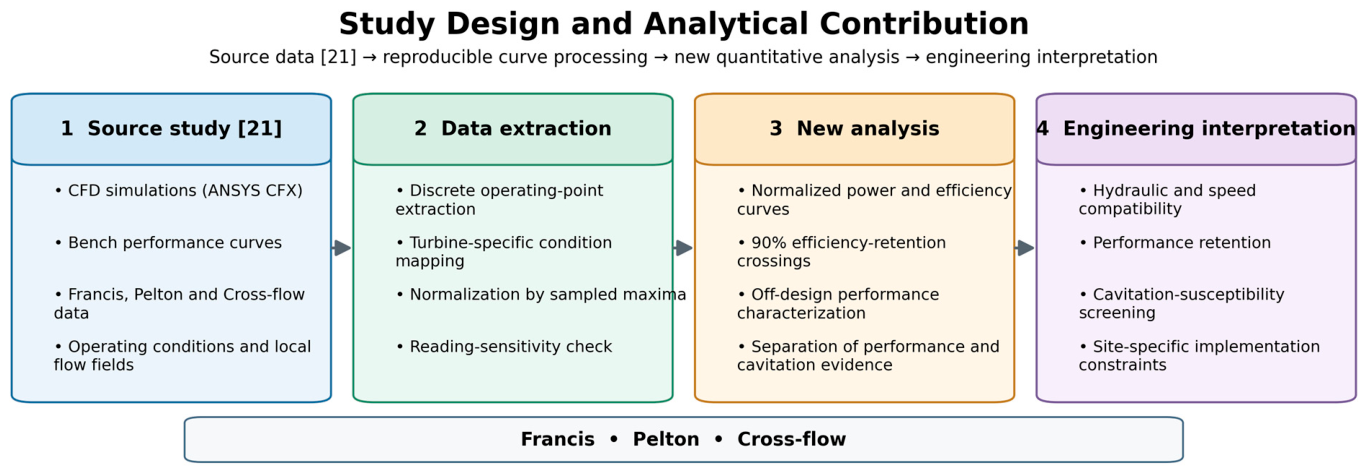
Hydraulic turbines may be classified as reaction machines, such as Francis and Kaplan turbines, or impulse machines, such as Pelton and conventional Cross-flow turbines (Figure 1). The present study considers the Francis, Pelton, and Cross-flow configurations; Figure 2 identifies the original research inputs and the analysis undertaken in this article.
Figure 1.
Classification of hydraulic turbines considered for micro-hydropower applications.
Figure 2.
Study design and analytical workflow based on the original CFD and benchmark datasets.
Hydraulic efficiency measures the fraction of available water power transferred to the shaft. Cavitation susceptibility involves a different physical quantity: the difference between local absolute static pressure and the vapor pressure of water at the operating temperature. A turbine can therefore retain useful efficiency while a small region approaches vapor pressure. Studies of Francis erosion and Cross-flow cavitation discuss this local-pressure condition and its consequences [16,17,18]. A pressure contour can identify a region to examine; determining vapor volume, erosion, or cavitation-induced performance loss requires additional modeling and measurements.
Computational fluid dynamics (CFD) can resolve pressure, velocity, torque, and hydraulic-loss mechanisms that global measurements alone cannot identify. Its credibility depends on transparent boundary conditions, mesh and convergence evidence, and comparison with measured data [19,20]. Global power and efficiency curves can show agreement in overall performance, whereas validation of local pressure or velocity requires measurements at corresponding positions in the flow.
This paper builds on Francis, Pelton, and Cross-flow turbine work carried out by the first author during his master’s research at UQAT [21]. The central question is how much operating information can be obtained beyond the location of the largest reported power or efficiency. The objectives are to identify the documented conditions of the original numerical and bench comparisons, calculate normalized performance-retention intervals from the reported curves, and use these results in a conditional turbine-selection procedure. The normalized intervals and the explicit separation of performance evidence from cavitation evidence are the analytical additions of this article; they are not presented as new CFD simulations or new laboratory measurements.
Relevant recent work addresses Francis draft-tube flow [22], Cross-flow technology [23], Pelton needle–nozzle dynamics [24], Francis internal flow and loading [25,26,27,28,29], Pelton multiphase simulation [30], Cross-flow design [31], grid convergence and validation [32], particle-based Pelton simulation [33], and cavitation control and inception [34,35]. In particular, Kumar et al. [17] review the additional modeling and experimental requirements for interpreting erosion, while Meng et al. [35] combine experiments and CFD to relate Cross-flow cavitation to effective head and available suction head.
2. Materials and Methods
The numerical models and benchmark datasets used in this study are documented in [21]. The present article uses the reported dimensions, operating curves, and bench comparisons and adds the graph-based analysis defined in Section 2.9. Table 1, Table 2 and Table 3 specify the conditions associated with the analyzed datasets, while Supplementary Materials S1 provides the extracted curve values and calculation procedure.
Table 1.
Design/reference operating settings of the three turbine configurations.
Table 2.
Principal geometric parameters used in the CFD models.
Table 3.
Numerical operating conditions and geometric parameters of the analyzed turbines.
2.1. Methodological Framework and Data Provenance
This section describes the methodology adopted for the reanalysis of previously published numerical and experimental results and clarifies the provenance of the underlying data.
The workflow comprised the following steps: (i) definition of the reference geometry and operating point for each turbine; (ii) construction of stationary and rotating fluid domains in ANSYS CFX; (iii) steady-state RANS simulations with Frozen-Rotor coupling; (iv) comparison of shaft-power and efficiency trends with the available experimental benchmark curves; and (v) qualitative synthesis of operating-range characteristics, pressure-margin behavior, and site-dependent implementation evidence. This reanalysis did not include new CFD simulations or new experimental measurements; it interprets and synthesizes results previously reported in the literature.
Dimensional quantities (power, efficiency, head, discharge, and rotational speed) were analyzed within the specific operating envelope of each turbine. Because the Francis, Pelton and Cross-flow machines were not tested under a common dynamically similar condition, no universal ranking based on peak power, peak efficiency, or best-efficiency speed is proposed. The analysis therefore emphasizes performance trends, operating-range characteristics and site-dependent trade-offs.
The study limitations are explicitly acknowledged. The CFD models were developed and calibrated against the available benchmark data; consequently, the reported numerical–experimental agreement does not constitute validation on an independent held-out dataset. Normalized comparisons are used solely to examine relative trends and curve shapes across the recorded operating ranges and do not imply geometric, kinematic, or dynamic similarity among the turbines.
2.2. Reference Turbines and Operating Matrix
Table 1 summarizes the design/reference settings for the HM 450C Francis configuration and the HT 703 reference installation used for the Cross-flow and Pelton cases. These values must be distinguished from the discharges associated with the speed-sweep curves analyzed here: 24.12 m3/h for Francis, 12.24 m3/h for Pelton, and 25.31 m3/h for Cross-flow. The corresponding head varies along the recorded speed series. The reference heads of 10, 14, and 10 m are therefore not imposed as constant heads for the entire plotted series.
Table 2 presents the reported design dimensions, and Figure 3 defines the principal geometric symbols. The reference runner counts are 11 blades for Francis, 16 buckets for Pelton, and 14 blades for Cross-flow. The source also reports geometric variants, but the present curve analysis does not combine their results. The Pelton dimensions in the calculated design table differ from its initial reference dimensions; both are identified below to avoid presenting them as one confirmed final geometry.
Figure 3.
Definition schematic of the Francis, Pelton, and Cross-flow design dimensions; values correspond to Table 2. The schematic is not to scale.
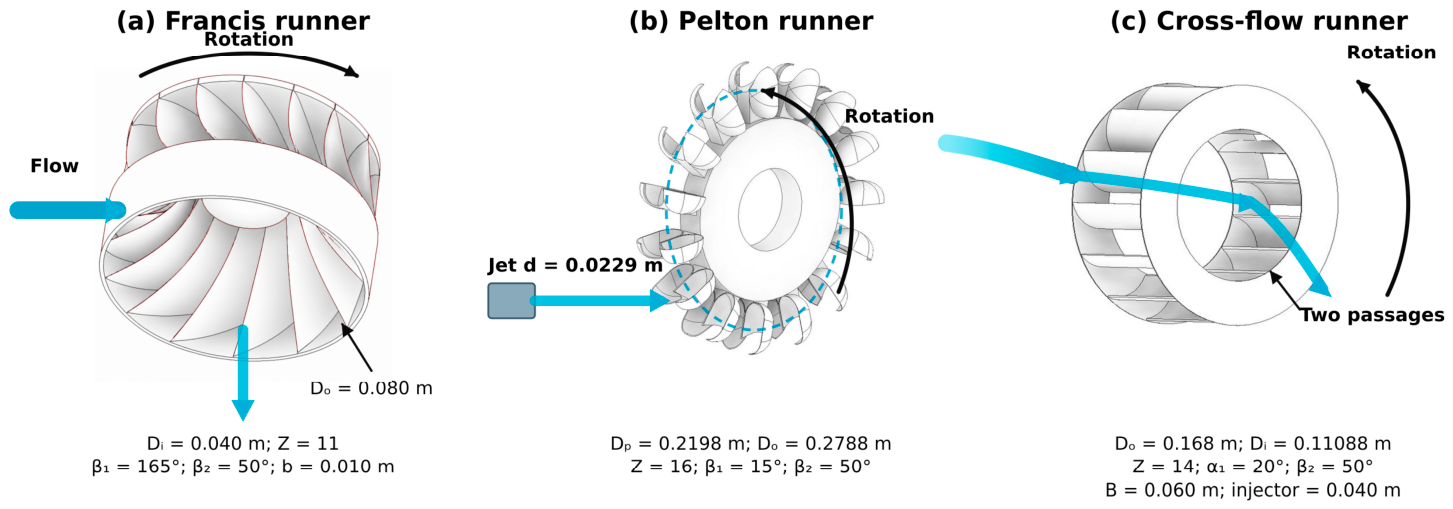
Table 3 identifies the series used in this article. The 10- and 12-blade Francis cases are separate geometric variants from the original study and are not included in the normalized reference curves. Likewise, the 13- and 15-blade Cross-flow variants and the 15- and 17-bucket Pelton variants are not pooled with the reference series. Where a case-specific setting is not documented unambiguously, it is identified as unconfirmed rather than assigned a nominal value.
2.3. Geometry and Computational Domains
The Francis design includes an inlet passage, spiral casing, guide passages, an 11-blade runner, and a draft tube. The Cross-flow design includes an injector and a 14-blade runner through which the water passes twice. The Pelton reference has a nozzle and a 16-bucket runner. Autodesk Inventor was used to define the solid geometry and prepare the fluid regions. The paper uses the reference series specified in Table 3; the additional blade-count variants are outside its quantitative curve analysis.
The computational domain is the volume occupied by water inside and around the modeled components. It is divided into a rotating runner region and stationary inlet and outlet regions. Their common surfaces allow the solver to transfer flow information between the regions. The original study provides component dimensions and views of these regions, but not every casing contour, blade surface, or interface location. Thus, Table 2 describes the reported design without being sufficient to rebuild the identical three-dimensional mesh.
For the Pelton model, the documented calculation treats the flow as steady while representing runner rotation. It does not provide a time-resolved record of successive buckets entering and leaving the jet, nor a fully specified calculation tracking the moving boundary between air and water. Its power curve can be compared with the bench curve, but jet breakup and transient loading cannot be assessed from this calculation.
2.4. Governing Equations and Turbulence Closure
The hydraulic performance of each turbine was evaluated from the energy available in the water flow and the mechanical power transferred to the runner. The hydraulic power available at the turbine inlet is expressed as
where is the available hydraulic power (W), is the water density (kg m−3), g is the gravitational acceleration (m s−2), is the volumetric flow rate (m3 s−1), and Hn is the net hydraulic head across the turbine (m). The mechanical shaft power obtained from the CFD solution was calculated from the runner torque as
where T is the shaft torque (N m) and ω is the angular velocity (rad s−1). The corresponding hydraulic efficiency was determined from
or, equivalently,
The source uses these quantities to report shaft power and hydraulic efficiency. In the present analysis, each reported output is also normalized by its own largest sampled value, as defined in Section 2.9.
The original calculations solve the steady Reynolds-averaged Navier–Stokes equations for incompressible, Newtonian, isothermal water. These equations are given to identify the model underlying the published curves.
For an incompressible fluid of constant density, conservation of mass reduces to
where u is the mean velocity vector. The steady RANS momentum equation can be written as
where p is the static pressure, = μ + μt is the effective dynamic viscosity, μ is the molecular viscosity, μt is the turbulent viscosity, and represents the momentum source terms associated with the rotating reference frame.
For a runner rotating at a constant angular velocity Ω, the rotational source term was expressed as
where r is the position vector relative to the axis of rotation. The first term represents the Coriolis contribution, whereas the second corresponds to the centrifugal acceleration. Because the prescribed rotational speeds were constant for each operating point, the Euler acceleration term associated with temporal changes in angular velocity was neglected.
Turbulence closure used the standard k–ε model with wall functions, consistent with the original calculations. The present analysis retains that formulation; changing the turbulence model would require a new simulation campaign.
The model transports turbulent kinetic energy k and its dissipation rate ε. Their equations are
and
where Pk denotes the production of turbulent kinetic energy. The turbulent viscosity is evaluated from
For the standard k–ε formulation, the conventional model constants are
The standard k–ε formulation can have limitations in separated and strongly curved flows. Agreement in shaft power and efficiency does not establish the accuracy of individual pressure or velocity values. The original validation measurements concern global performance; local velocity and pressure distributions were not independently tested.
Accordingly, the pressure and velocity plots are used to identify flow regions for further investigation, while the quantitative additions of this paper are calculated from the reported operating curves.
2.5. Boundary Conditions and Numerical Setup
The original numerical setup used a static-pressure specification at the inlet, a mass-flow condition at the outlet, wall functions, and prescribed runner speed. For the speed-series curves analyzed here, the documented volume flow rates are 24.12, 12.24, and 25.31 m3/h for Francis, Pelton, and Cross-flow, respectively (Table 3). At the documented water density of 997 kg/m3, these correspond to calculated mass flows of 6.680, 3.390, and 7.009 kg/s. These conversions do not establish the exact CFX boundary expressions or pressure reference used in each original run.
The Frozen-Rotor interface transfers flow information between stationary and rotating regions at a fixed relative angular position. It represents a steady configuration and does not resolve the passage of individual blades, transient wakes, or free-jet breakup.
The Francis stationary regions include the inlet, casing, guide passages, and draft tube. The Cross-flow and Pelton stationary regions include their respective injector/nozzle passages. The Francis reference table specifies water at 25 °C with density 997 kg/m3. The exact pressure datum, all fluid-property entries, and the detailed boundary profiles are not tabulated for every case; they would have to be checked in the original solver definitions before rerunning the models.
The methodological description discusses tetrahedral meshes and mesh refinement. It does not tabulate a completed mesh-refinement series for the turbine calculations. Its generic mesh illustration is not evidence of the mesh used for an individual turbine.
The source study also describes available discretization options without identifying the selected option and stopping criterion for every run. Table 4 states the resulting limits on reproducing the original calculations, separately from the reproducible curve processing supplied in Supplementary Materials S1.
Table 4.
Documentation of the original numerical study and requirements for independent CFD reruns.
2.6. Reproduction of the CFD Calculations and the Curve Analysis
Two different procedures must be distinguished. Repeating the CFD solution requires the original geometry, mesh, solver settings, and convergence records. Repeating the analysis in this article requires the published curves, the extracted coordinates, and the normalization equations. The normalization equations are supplied in Supplementary Materials S1. Table 4 summarizes the documentation available for the original CFD campaign.
The source CAD geometry, mesh, CFX definition and result files, and solver logs are needed to reproduce and audit the original numerical campaign in full. These files were not included in the materials used for the present analysis. This limits independent reproduction of the original numerical campaign. The first author is responsible for the original numerical study.
2.7. Criterion for Cavitation Susceptibility
The physical screening criterion is the local absolute static pressure relative to the saturation vapor pressure at the water temperature. A pressure margin may be expressed as follows:
The local pressure-margin indicator is
where Δpcav is the pressure margin, pmin is the minimum absolute static pressure, and pv is the vapor pressure. This equation defines the quantity needed for a numerical margin assessment. A smaller positive value indicates proximity to vapor pressure; it is not by itself a validated prediction of cavity growth or erosion.
The exported figures do not identify the absolute-pressure reference sufficiently to calculate this margin reliably for the three cases. Consequently, no numerical value of Δpcav or cavitation-free operating limit is reported. Pressure distributions are used only to locate regions that merit a properly documented cavitation calculation. Vapor fraction, cavity volume, performance loss, erosion, and pulsation remain unvalidated.
2.8. Comparison with Laboratory Performance Curves
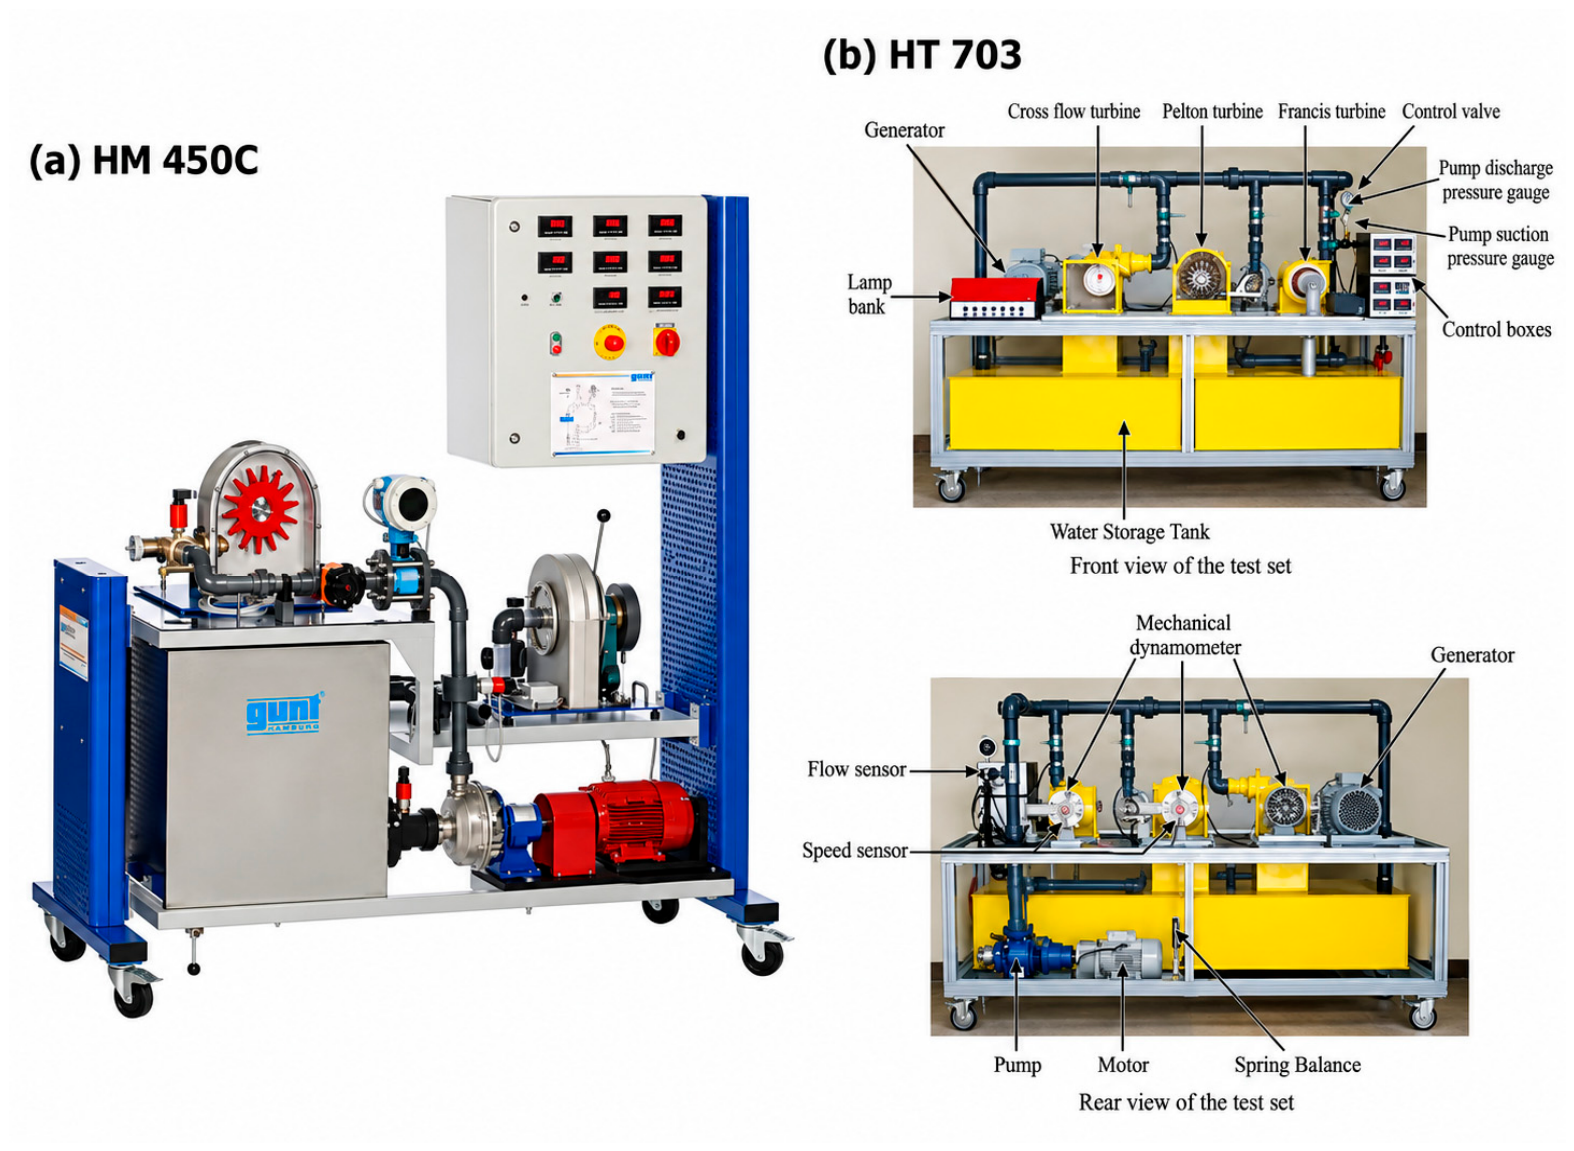
The original numerical results were compared with the HM 450C and HT 703 performance references used in the source study. Figure 4 shows the corresponding installations, including water circulation, loading, and instrumentation for global operating quantities. The available dataset does not provide a point-by-point test log associating every comparison point with head, discharge, and the final adjusted geometry.
Figure 4.
Recirculating test rig for the HM-450C Francis and HT-703 Pelton and Cross-flow benchmark tests. The original comparison evaluates shaft power and hydraulic efficiency. It was not designed to validate spatial pressure or velocity distributions. Consequently, the present article does not use agreement in these global quantities as evidence that every local flow value is accurate.
The reported minimum and maximum relative deviations summarize differences between the numerical and laboratory curves. Complete paired numerical tables and an instrument uncertainty budget are not available in the archived record. RMSE, R2, or an experimental validation uncertainty cannot therefore be reconstructed from the published deviation ranges. Moreover, because the original study documents model adjustment against the same bench curves, this is a model-development comparison rather than an independent prediction test.
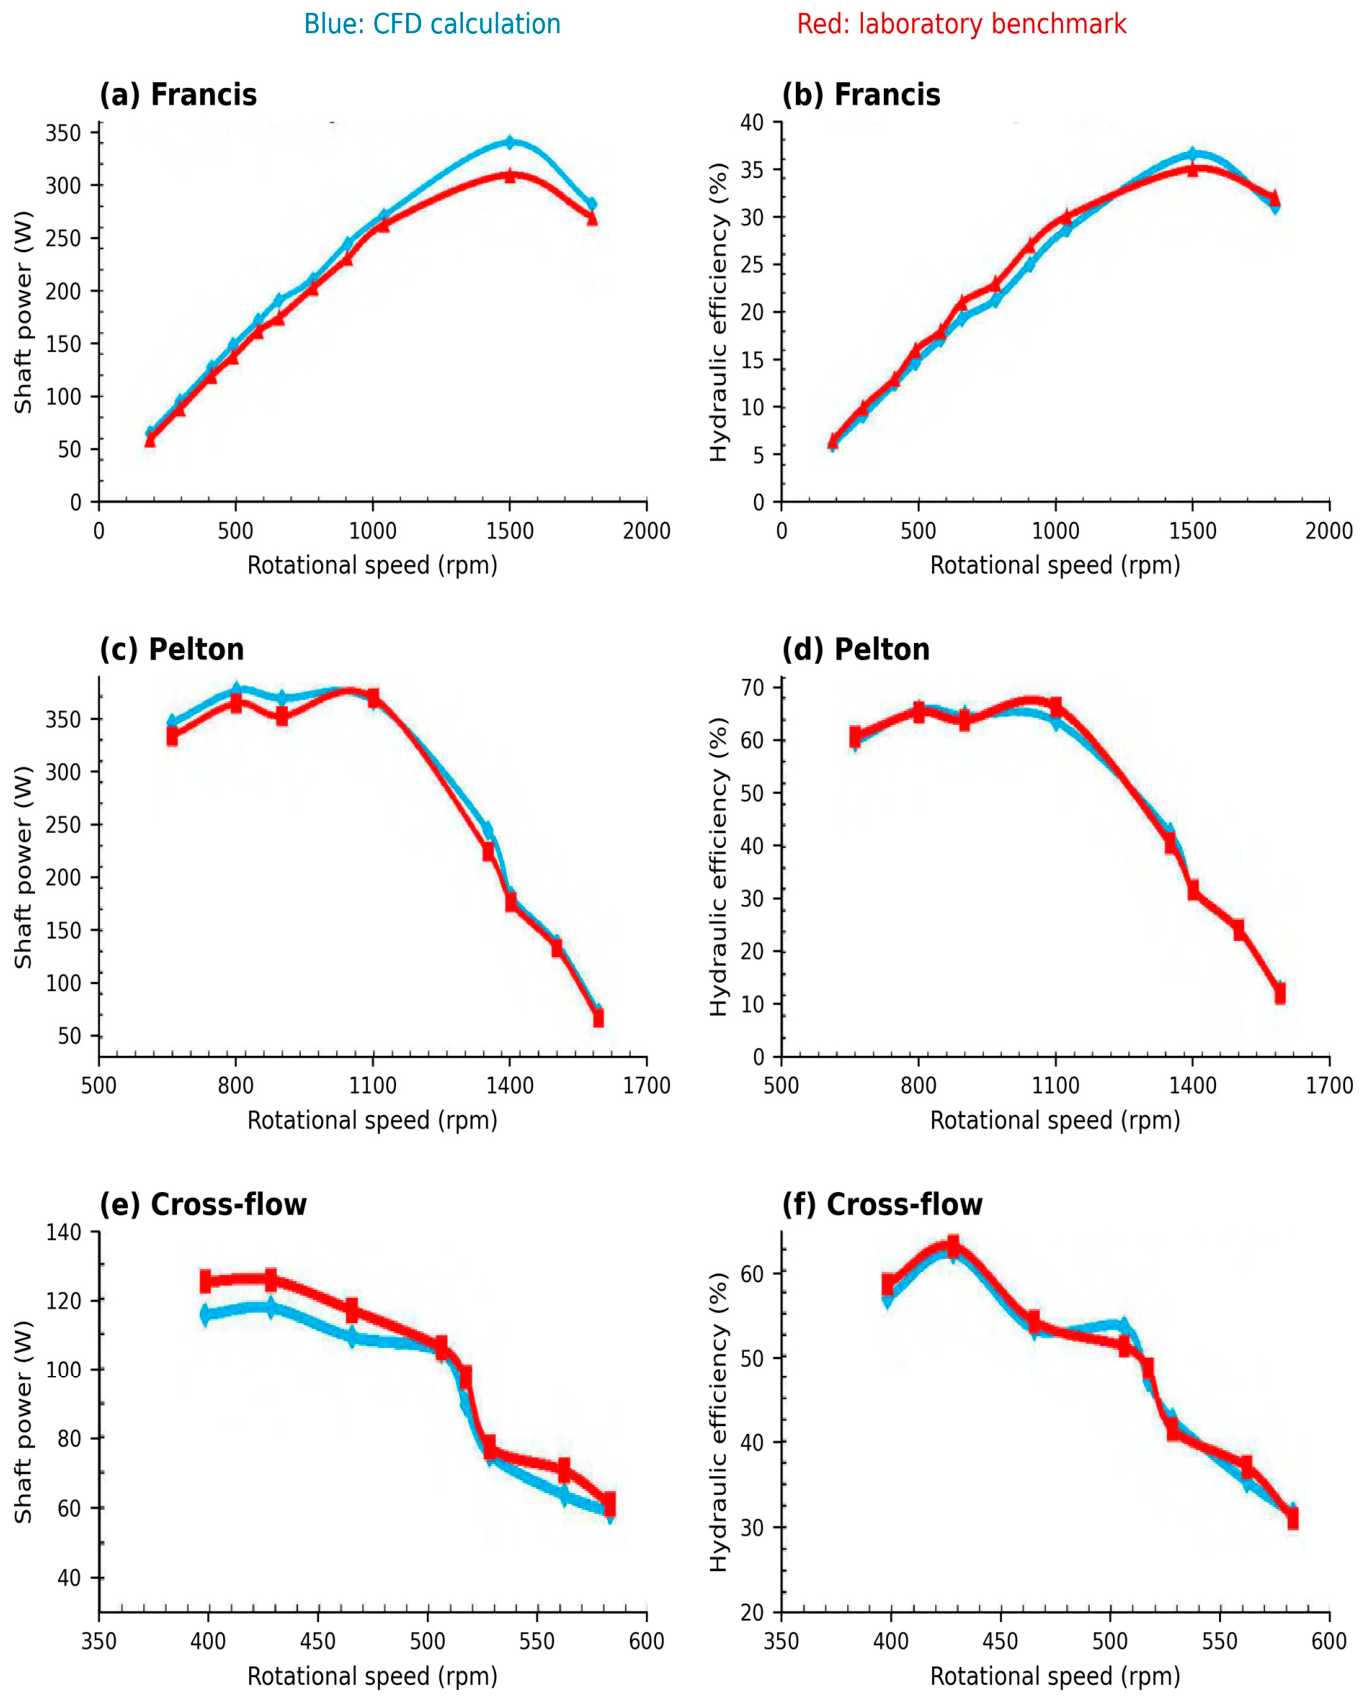
Figure 5 retains the original CFD–laboratory comparison as evidence of the numerical study’s reported global agreement. It is distinct from the present analysis of the operating curves. Curve-specific settings are reported only to the extent documented in Table 3 and Supplementary Materials S1.
2.9. Extraction and Normalization of the Reported Operating Curves
The new quantitative analysis uses the discrete markers in the operating curves reported in [21]. The source plots were rendered at 1.8 pixels per PDF point. Two tick positions on each axis were used for linear calibration, and the center of each plotted marker was read. Smooth connectors in the original plots were not treated as additional simulation points. Supplementary Materials S1 records the calibration, pixel coordinates, and converted values.
For each output Y, where Y is shaft power P or hydraulic efficiency η, the largest sampled value and its associated speed were identified. These are the denominators of the normalized quantities in Equation (13). The maximum is a sampled maximum, not an optimized or continuously resolved best-efficiency point.
An illustrative 90% efficiency-retention interval was calculated by finding where the normalized efficiency crosses 0.90. Between two adjacent markers, the crossing was estimated by straight-line interpolation. No extrapolation was used when the lower or upper crossing lay outside the displayed range. This 90% level is a reporting choice, not a cavitation limit, a decision weight, or an optimized engineering requirement.
A ±3-pixel coordinate perturbation was used to examine sensitivity to graphical reading. The resulting bounds are numerical reading-sensitivity ranges, not confidence intervals or CFD/experimental uncertainty. Because the source curves are sparse and their head changes with speed, the normalized intervals are reported approximately and refer only to the corresponding recorded path. They do not supply a common-head comparison or an annual-energy calculation.
3. Results
3.1. CFD Benchmarking Against Experimental Performance Trends
Figure 5 reproduces the original CFD and laboratory curves. It shows agreement in their overall shape after the model adjustments documented in the source study. The design references are those in Table 1 and Table 2; the available record does not provide a final run sheet confirming all head, discharge, and geometry settings for each plotted comparison. Thus, these panels are reported as the original global comparison, not as a newly completed validation experiment.
The source study reports shaft-power relative deviations of 1.13–9.96% and efficiency deviations of 0.83–4.67% across the three cases (Table 5). These are previously reported ranges, not statistics recalculated from the operating curves extracted for the present analysis. They describe the agreement reported for the original comparisons; they do not quantify experimental uncertainty or establish independent model validation.
Table 5.
Reported minimum–maximum relative-deviation ranges between the CFD and benchmark curves.
Figure 5.
CFD–laboratory performance comparisons for the Francis, Pelton, and Cross-flow turbines. Panels (a–f) correspond to the Francis, Pelton, and Cross-flow turbines, respectively. The associated design/reference settings and available case-specific operating conditions are summarized in Table 3 and Supplementary Materials S1.
3.2. Normalized Operating Curves and Performance Retention
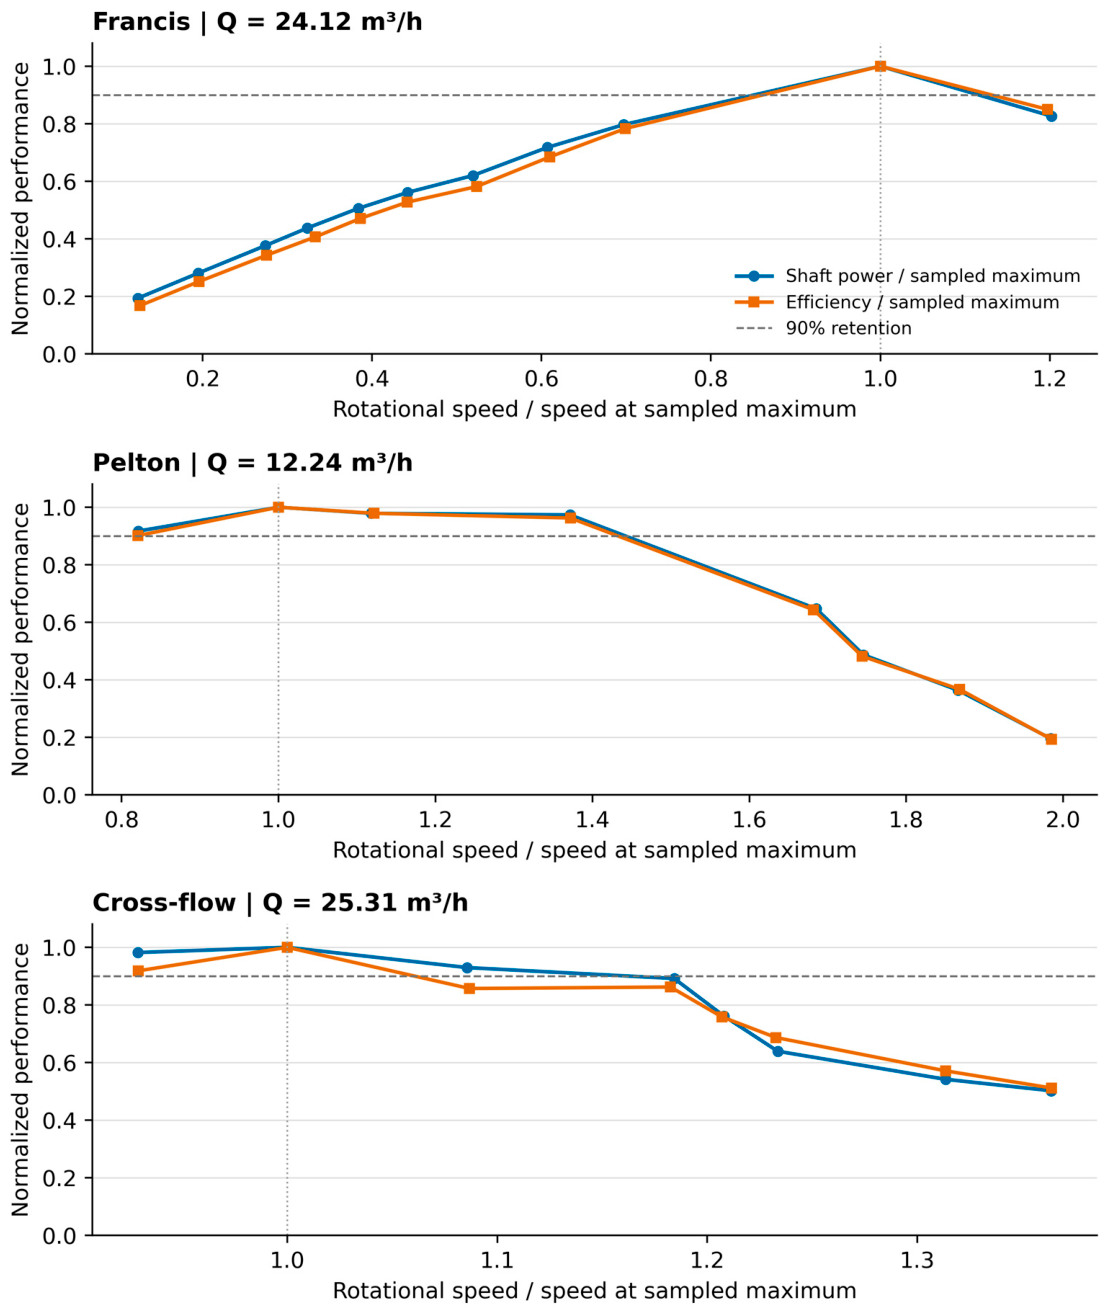
Figure 6 presents the normalized curves calculated in this article from the extracted operating points. The discharges are 24.12 m3/h for Francis, 12.24 m3/h for Pelton, and 25.31 m3/h for Cross-flow. Because the reported head changes along these series, the results describe performance along the recorded operating paths. They are not constant-head maps.
Francis turbine
For the reference Francis series, the sampled maximum occurs near 1500 rpm. Linear interpolation between the extracted efficiency points places the 90% retention crossings at approximately 0.86 and 1.13 times the speed of the sampled efficiency maximum. At the high-speed endpoint near 1800 rpm, efficiency retains approximately 85% of its sampled maximum. Both threshold crossings lie within the plotted range.
Pelton turbine
For the reference Pelton series, the largest sampled power and efficiency occur near 800 rpm, with a relatively flat region extending toward 1100 rpm. The upper 90% efficiency-retention crossing is approximately 1.43 times the speed at the sampled maximum. The first plotted point, at a normalized speed of about 0.82, is already close to 90%; the lower threshold cannot be bounded reliably from the plot. Around 1400 rpm, the plotted power and efficiency retain approximately 49% and 48% of their respective sampled maxima. Thus, the 1400 rpm design-reference entry must not be interpreted as the best-performance speed of this plotted series.
Cross-flow turbine
For the reference Cross-flow series, the largest sampled values occur near 430 rpm. The upper 90% efficiency-retention crossing is approximately 1.06 times the speed at the sampled maximum. The first plotted point, at a normalized speed of about 0.93, remains above the threshold, so the lower crossing is not captured. At the endpoint near 585 rpm, the normalized efficiency is approximately 0.51. This behavior concerns the stated injector/runner configuration and the recorded head–speed path.
Table 6 summarizes these calculated intervals. The Pelton curve has the broadest high-speed retention region of the three plotted cases, while the Cross-flow curve has the closest upper efficiency-retention crossing to its sampled maximum. This is a comparison of these curves, not an intrinsic ranking of the turbine families or of their annual energy yield.
Table 6.
Estimated operating intervals retaining at least 90% of peak efficiency, derived from the original plotted data points.
The approximate peak speeds remain consistent with the descriptive values of 1500, 800, and 430 rpm in the original operating curves. The new result is the explicit calculation of normalized retention intervals and the distinction between a threshold crossing captured by the data and one outside the sampled range.
Figure 6.
Normalized shaft-power and hydraulic-efficiency trends from extracted operating points. Dashed line: 90% peak-efficiency retention threshold.
3.3. Pressure and Velocity Field Analysis
Figure 7 reproduces original pressure and velocity exports at Q = 24.12 m3/h for the 11-blade Francis runner, Q = 12.24 m3/h for the Pelton case, and Q = 25.31 m3/h for the 14-blade Cross-flow runner. The source’s fixed-speed procedure refers to 1500, 1400, and 428 rpm, respectively, but those speed values are not separately printed on each field export. This distinction is retained in Table 3. The scales are source-specific and are not used to compare absolute pressure margins between turbines.
Figure 7.
Pressure and velocity fields for the Francis, Pelton, and Cross-flow turbines.
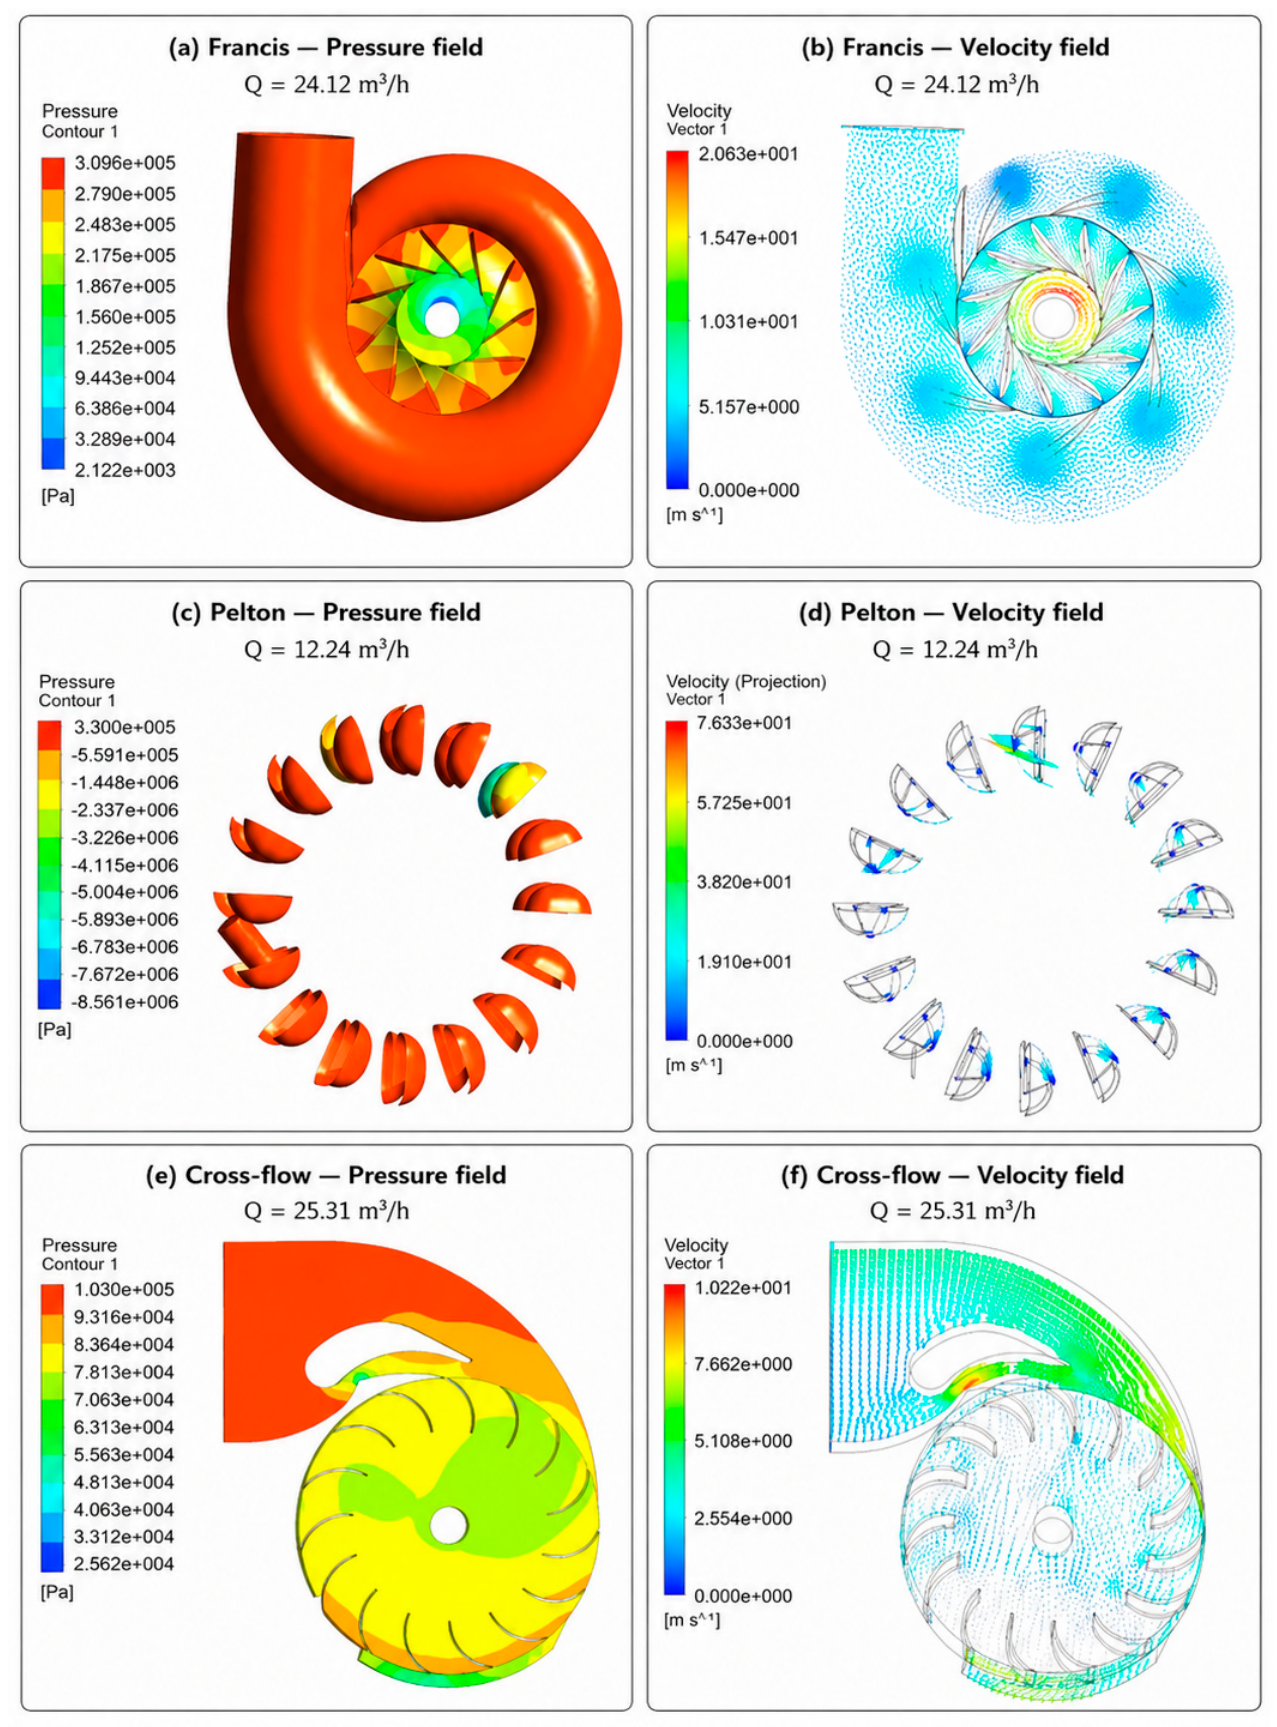
The Francis exports show the variation in pressure around the casing and runner and the corresponding velocity distribution. The blade surfaces and downstream region are locations for further examination, but the color map alone does not establish cavitation inception.
The Pelton export shows the jet–bucket interaction represented by the steady model. Its pressure scale includes large negative values whose meaning cannot be resolved without the pressure reference and the original case definition. It is therefore retained solely to document the model output; it does not support a physical cavitation threshold or a local validation claim.
The selected Cross-flow exports correspond to the 14-blade reference panel, not the 15-blade variant. They show the injector and the passage through the runner. Assessing the pressure distribution in either passage requires checking the pressure reference before any vapor-pressure comparison.
These local plots provide context for the regions represented in the models. They do not establish a causal explanation for the normalized performance-retention differences, which would require controlled calculations and local measurements.
3.4. Cavitation Susceptibility and Off-Design Behavior
No quantitative cavitation margin can be calculated from the available pressure exports. The pressure reference, complete phase-change setup, and cavitation-specific measurements are not given for the cases analyzed here. The cavitation component of the selection workflow therefore identifies a required follow-up assessment, rather than certifying an acceptable operating range.
In particular, the global efficiency curves are not used to infer cavity volume, cavitation-induced efficiency loss, erosion rate, or pressure pulsations. A region of lower displayed pressure is not assigned a numerical cavitation risk score.
Table 7 specifies what can be stated for each turbine. A quantitative follow-up requires absolute pressure, water temperature and vapor pressure, a documented multiphase model where needed, and measurements appropriate to cavitation inception and its consequences.
Table 7.
Interpretation of the original local fields and requirements for cavitation assessment.
3.5. Comparative Turbine Selection Framework
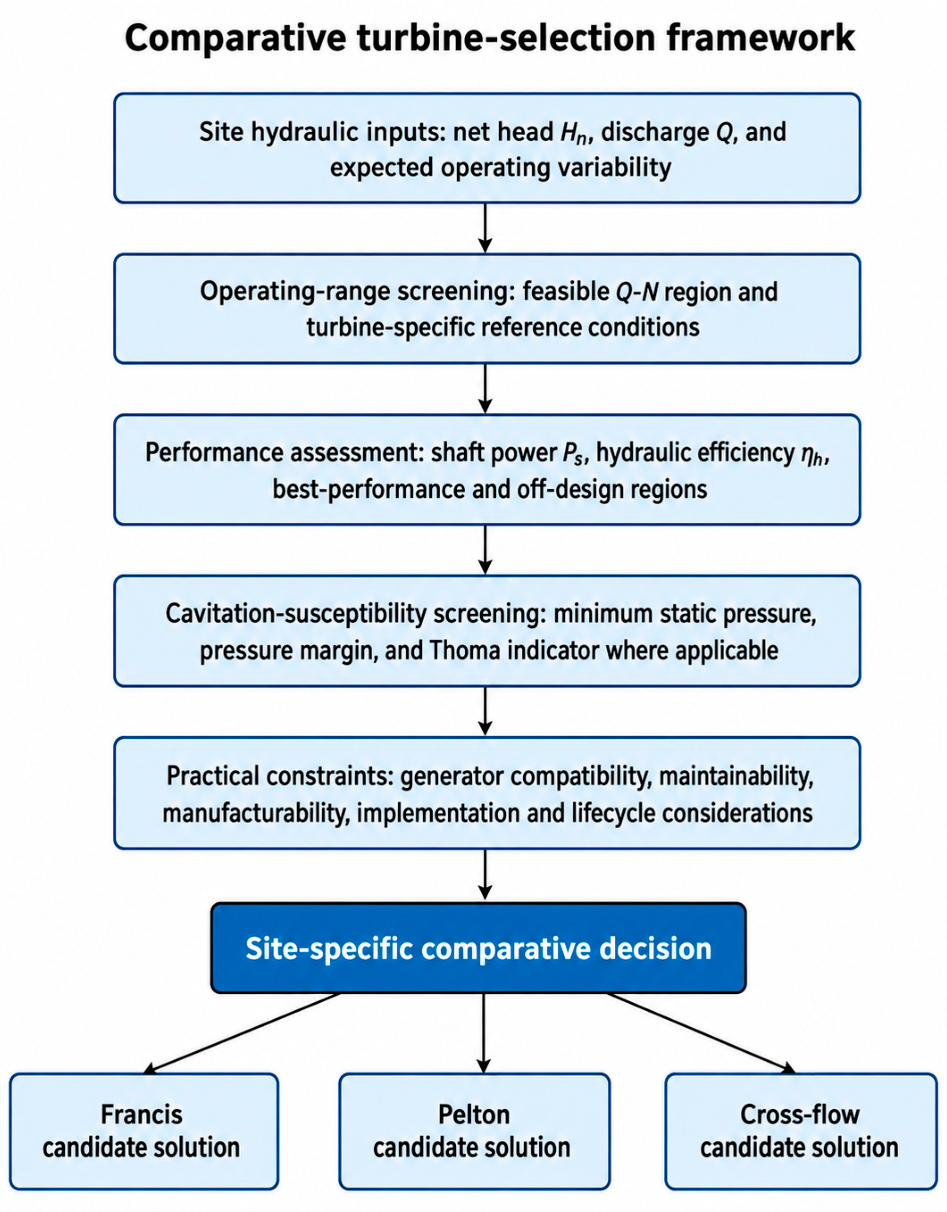
The operating curves supply one part of a turbine-selection assessment: compatibility between required shaft speed and the performance retained along an available operating path. Hydraulic feasibility at the site must first be established from head and discharge. The present bench curves do not themselves establish that feasibility for a proposed installation.
Figure 8 organizes these checks into five sequential stages: site hydraulic characterization, operating-range screening, performance assessment, cavitation assessment, and practical implementation. The normalized retention calculation informs operating-range screening and performance assessment. The incomplete absolute-pressure information leaves the cavitation stage unresolved for the present cases; the workflow therefore requires further analysis before a final selection. It does not assign numerical decision weights or claim a validated optimum.
Figure 8.
Qualitative sequence for site-specific turbine screening. The present normalized curves inform operating-range assessment; the cavitation and implementation stages require additional site and design information.
For example, a generator requirement near 1400 rpm should be compared with the performance at that speed, rather than with the maximum of the Pelton curve near 800 rpm. A different generator or transmission ratio would change that compatibility check. Manufacturing tolerances, access for runner repair, sediment exposure, replacement parts, and the excavation or tailwater requirements of a draft tube can then eliminate a hydraulically feasible option. These are decision inputs to obtain for a real site, not cost results measured in this study.
4. Discussion
The original global comparisons show that the numerical curves follow the laboratory trends. Their interpretation is limited by the use of those same trends during geometric adjustment. This is relevant to model development but does not test performance on independent operating conditions. Spatially resolved validation can reveal discrepancies that an integrated power comparison does not expose, as illustrated by the PIV-plane analysis of Salehi and Nilsson [19]; grid and roughness sensitivity also affect turbine predictions [29,32].
The normalized analysis adds information that is absent from a list of maximum efficiencies. At the illustrative 90% retention level, the upper normalized-speed crossing is approximately 1.13 for Francis, 1.43 for Pelton, and 1.06 for Cross-flow. Only the Francis curve captures both crossings. Reporting the missing lower crossings prevents a partial plotted range from being presented as a complete operating envelope. The broad plateau in the Pelton case and the earlier decline in the Cross-flow case can guide speed-matching questions for these particular configurations, subject to their different head–speed paths.
A second result concerns the difference between design-reference speed and observed performance. The Pelton reference entry of 1400 rpm is about 1.75 times the reported peak-region speed of 800 rpm, and the recovered curve at approximately 1400 rpm retains only about half of the largest plotted power and efficiency. This discrepancy would be concealed by a comparison based only on the reference table. It warrants checking the final model dimensions and operating settings before a generator or transmission is selected.
Normalization does not remove the effects of changing head, Reynolds number, runner dimensions, or the jet/nozzle arrangement. The intervals are therefore descriptive results along the recorded operating paths. A scale-transfer model would additionally require geometric similarity and matched dimensionless flow and speed conditions, followed by validation at the target scale. These requirements explain why an operating speed in rpm cannot be used as a universal turbine-family design target.
The separation between output agreement and physical-model adequacy also applies to other CFD applications. Studies on porous turbine-blade cooling [36], tracer transport in a vacuum degasser [37], and supercritical-fluid regenerative cooling [38] address systems with different governing physics. Their relevance here is methodological: properties, boundaries, and validation observables must match the modeled process. They supply no hydraulic-turbine performance or cavitation data for the present comparison.
The scientific scope is an analysis of the first author’s documented numerical study, with new normalized curve calculations and a conditional engineering interpretation. It is limited by graphical reading accuracy, sparse points around some thresholds, variable head along the speed curves, incomplete final-case metadata, and the absence of independent local-field validation. The pressure plots cannot complete the cavitation decision stage. These limits define which conclusions follow from the present data and which require access to the original files or new measurements.
5. Conclusions
The original numerical and laboratory dataset provides the basis for this article. The reported deviation ranges are 1.13–9.96% for shaft power and 0.83–4.67% for efficiency. Because the models were adjusted using those bench curves, this evidence describes global agreement during model development and does not establish independent uncertainty-quantified validation.
The present graph-based analysis quantifies the operating-curve shape beyond the peak locations near 1500, 800, and 430 rpm. The approximate upper normalized-speed limits for 90% efficiency retention are 1.13, 1.43, and 1.06 for the Francis, Pelton, and Cross-flow cases. The lower crossing is resolved only for Francis. The extracted point tables and calculation method are provided in Supplementary Materials S1 so these analytical results can be reproduced.
The Pelton example shows why design-reference speed and measured or computed peak-region speed must be distinguished: near the 1400 rpm reference setting, the plotted power and efficiency retain approximately half of their sampled maxima. The normalized intervals describe the stated configurations and their recorded head–discharge–speed paths; they are not universal rpm targets or scale-transfer laws.
The proposed screening sequence uses these operating results to inform speed compatibility while requiring separate site hydraulics, cavitation, and implementation checks. The pressure exports identify model regions for follow-up but do not provide a defensible numerical cavitation margin. Access to the original CFD cases and complete test settings remains necessary to repeat the simulations and complete a quantitative design validation.
Supplementary Materials
The following supporting information can be downloaded at https://www.mdpi.com/article/10.3390/machines14101098/s1. Supplementary Materials S1. Operating conditions and reproducible curve analysis. Supplementary Materials S1 contains dataset mapping, documented source discrepancies, extracted operating points, the normalization procedure, and the graphical reading-sensitivity calculation.
Author Contributions
Conceptualization, F.M.K., G.D.N. and F.E.; methodology, F.M.K.; software, F.M.K.; validation, F.M.K., G.D.N. and V.T.W.; formal analysis, F.M.K. and V.T.W.; investigation, F.M.K.; resources, G.D.N. and F.E.; data curation, F.M.K.; writing—original draft preparation, F.M.K.; writing—review and editing, G.D.N., F.E. and V.T.W.; visualization, F.M.K.; supervision, G.D.N. and F.E.; project administration, G.D.N. and F.E. All authors have read and agreed to the published version of the manuscript.
Funding
This research received no external funding.
Data Availability Statement
All numerical and benchmark data analyzed in this study are publicly available in the master’s thesis [21] at https://depositum.uqat.ca/id/eprint/770/ (accessed on 27 July 2026). Supplementary Materials S1 provides the graphically extracted operating points and equations used for the new normalized analysis. These values are readings of published plots, not original solver or instrument records. The original CAD, mesh, CFX project files, and raw laboratory records were not used in the present reanalysis.
Acknowledgments
The authors gratefully acknowledge the Turbomachinery Laboratory (E-216) at the Université du Québec en Abitibi-Témiscamingue (UQAT) for providing the technical facilities and research environment that supported this work. During manuscript preparation, the authors used OpenAI ChatGPT (5.6 sol) and Microsoft Copilot (wave 2) for text structuring, language refinement, and English-language editing. OpenAI Codex was also used to assist with source-figure reading, analysis-code preparation, and figure layout during revision. All AI-assisted outputs were reviewed and revised by the authors, who verified the scientific accuracy and take full responsibility for the content of this publication.
Conflicts of Interest
The authors declare no conflicts of interest.
References
- International Energy Agency. Renewables 2024: Analysis and Forecast to 2030; IEA: Paris, France, 2024; Available online: https://www.iea.org/reports/renewables-2024 (accessed on 22 August 2026).
- Jawahar, C.P.; Michael, P.A. A Review on Turbines for Micro Hydro Power Plant. Renew. Sustain. Energy Rev. 2017, 72, 882–887. [Google Scholar] [CrossRef] [Scilit]
- Chaulagain, R.K.; Poudel, L.; Maharjan, S. A Review on Non-Conventional Hydropower Turbines and Their Selection for Ultra-Low-Head Applications. Heliyon 2023, 9, e17753. [Google Scholar] [CrossRef] [Scilit] [PubMed]
- Williamson, S.J.; Stark, B.H.; Booker, J.D. Low Head Pico Hydro Turbine Selection Using a Multi-Criteria Analysis. Renew. Energy 2014, 61, 43–50. [Google Scholar] [CrossRef] [Scilit]
- Shamsuddeen, M.M.; Shahzer, M.A.; Roh, M.-S.; Kim, J.-H. Feasibility Study of Ultra-Low-Head Hydro Turbines for Energy Extraction from Shallow Waterways. Heliyon 2024, 10, e35008. [Google Scholar] [CrossRef] [Scilit] [PubMed]
- Yildiz, V.; Brown, S.; Rougé, C. Importance of Variable Turbine Efficiency in Run-of-River Hydropower Design under Deep Uncertainty. Water Resour. Res. 2024, 60, e2023WR035713. [Google Scholar] [CrossRef] [Scilit]
- Chitrakar, S.; Solemslie, B.W.; Neopane, H.P.; Dahlhaug, O.G. Review on Numerical Techniques Applied in Impulse Hydro Turbines. Renew. Energy 2020, 159, 843–859. [Google Scholar] [CrossRef] [Scilit]
- Paish, O. Small Hydropower: Technology and Current Status. Renew. Sustain. Energy Rev. 2002, 6, 537–556. [Google Scholar] [CrossRef] [Scilit]
- Anand, R.S.; Jawahar, C.P.; Bellos, E.; Malmquist, A. A Comprehensive Review on Crossflow Turbine for Hydropower Applications. Ocean. Eng. 2021, 240, 110015. [Google Scholar] [CrossRef] [Scilit]
- Mehr, G.; Durali, M.; Khakrand, M.H.; Hoghooghi, H. A Novel Design and Performance Optimization Methodology for Hydraulic Cross-Flow Turbines Using Successive Numerical Simulations. Renew. Energy 2021, 169, 1402–1421. [Google Scholar] [CrossRef] [Scilit]
- Leguizamón, S.; Avellan, F. Computational Parametric Analysis of the Design of Cross-Flow Turbines under Constraints. Renew. Energy 2020, 159, 300–311. [Google Scholar] [CrossRef] [Scilit]
- Adanta, D.; Sari, D.P.; Syofii, I.; Thamrin, I.; Yani, I.; Marwani; Fudholi, A.; Prakoso, A.P. Configuration Blade Shape for Enhancement Crossflow Turbine Performance by the CFD Method. Int. J. Thermofluids 2024, 22, 100665. [Google Scholar] [CrossRef] [Scilit]
- Kifumbi, F.M.; Ngoma, G.D.; Erchiqui, F.; Tshibangu, T.M. Experimental and Numerical Modeling of a Cross-Flow Turbine Runner Made of HDPE: Experimental and Numerical Approach. HighTech Innov. J. 2025, 6, 1104–1122. [Google Scholar] [CrossRef] [Scilit]
- Kifumbi, F.M.; Ngoma, G.D.; Erchiqui, F.; Tshibangu, T.M. Performance Analysis of a Cross-Flow Turbine Runner Made of HDPE-Wood Fiber Biocomposite. HighTech Innov. J. 2026, 7, 413–429. [Google Scholar] [CrossRef] [Scilit]
- Assefa, E.Y.; Tesfay, A.H. Effect of Blade Number on Internal Flow and Performance Characteristics in Low-Head Cross-Flow Turbines. Energies 2025, 18, 318. [Google Scholar] [CrossRef] [Scilit]
- Noon, A.A.; Kim, M.-H. Sediment and Cavitation Erosion in Francis Turbines—Review of Latest Experimental and Numerical Techniques. Energies 2021, 14, 1516. [Google Scholar] [CrossRef] [Scilit]
- Kumar, P.; Singal, S.K.; Gohil, P.P. A Technical Review on Combined Effect of Cavitation and Silt Erosion on Francis Turbine. Renew. Sustain. Energy Rev. 2024, 190, 114096. [Google Scholar] [CrossRef] [Scilit]
- Adhikari, R.C.; Vaz, J.; Wood, D. Cavitation Inception in Crossflow Hydro Turbines. Energies 2016, 9, 237. [Google Scholar] [CrossRef] [Scilit]
- Salehi, S.; Nilsson, H. Effects of Uncertainties in Positioning of PIV Plane on Validation of CFD Results of a High-Head Francis Turbine Model. Renew. Energy 2022, 193, 57–75. [Google Scholar] [CrossRef] [Scilit]
- Galvis-Holguin, S.; Sierra-Del Rio, J.; González-Arango, D.I.; Correa-Quintana, E.; Meneses, L.R. Numerical and Experimental Validation of a New Methodology for the Design of Michel-Banki Turbine. CFD Lett. 2025, 17, 76–89. [Google Scholar] [CrossRef] [Scilit]
- Kifumbi, F.M. Conception et Modélisation Numérique d’un Simulateur de Mini-Centrale Hydroélectrique Muni des Turbines Francis, Pelton et Cross-Flow pour la Caractérisation des Performances et l’Étude de la Cavitation. Master’s Thesis, Université du Québec en Abitibi-Témiscamingue, Rouyn-Noranda, QC, Canada, 2018. Available online: https://depositum.uqat.ca/id/eprint/770/ (accessed on 20 September 2026).
- Hou, Y.; Liu, X.; Xiao, M.; Zhang, H.; Cai, Y.; Zeng, Y.; Zou, L.; Pang, J. Internal Flow Characteristics in the Draft Tube of a Francis Turbine under Different Working Conditions. Adv. Mech. Eng. 2024, 16, 16878132241292399. [Google Scholar] [CrossRef] [Scilit]
- Sanchez-Cortez, L.; Salvador-Gutierrez, B.; Pantoja-Carhuavilca, H.; Tinoco-Gomez, O.; Montaño-Pisfil, J.; Chávez-Sánchez, W.; Gutiérrez-Tirado, R.; Poma-García, J.; Santos-Mejia, C.; Vara-Sanchez, J. Pico-Hydropower and Cross-Flow Technology: Bibliometric Mapping of Scientific Research and Review. Water 2025, 17, 3524. [Google Scholar] [CrossRef] [Scilit]
- Marcelo Aldana, D.; Abad, A.; Merino, M. Computational Fluid Dynamics Analysis of Integrated Needle-Nozzle Dynamics in Pelton Turbines: Insights from Cañón del Pato Hydroelectric Plant, Peru. Clean Energy 2026, 10, 160–169. [Google Scholar] [CrossRef] [Scilit]
- Xue, B.; Li, Y.; Li, Y.; Tang, Z.; Xu, B.; Xu, K.; Zhou, Z.; Yu, Z.; Yao, B.; Pang, J. Numerical Simulation of Flow Fields and Sediment-Induced Wear in the Francis Turbine. Water 2024, 16, 3148. [Google Scholar] [CrossRef] [Scilit]
- Li, S.; Pang, J.; Dan, C.; Xiang, W.; Yi, X.; Liu, X. Influence of Load Variation on the Flow Field and Stability of the Francis Turbine. J. Mar. Sci. Eng. 2025, 13, 316. [Google Scholar] [CrossRef] [Scilit]
- Xu, J.; Chen, P.; Li, Y.; Yang, X.; Yu, A. Research on Internal Flow and Runner Force Characteristics of Francis Turbine. Water 2025, 17, 3004. [Google Scholar] [CrossRef] [Scilit]
- Liu, J.; Zhang, Y.; Zhu, D.; Liu, Q.; Tao, R. Effect of Blade Number on the Performance of a Small Francis Turbine for Rural Local Power Generation. Water 2026, 18, 1950. [Google Scholar] [CrossRef] [Scilit]
- Mukherjee, A.; Khullar, S.; Zehab Ud Din, M.; Pant, C.S.; Kumar, A. A Comparative Analysis of CFD Methodologies to Predict the Performance of Francis Turbine. IOP Conf. Ser. Earth Environ. Sci. 2024, 1411, 012009. [Google Scholar] [CrossRef] [Scilit]
- Qin, M.; Yu, Z.; Wu, B.; Pang, J.; Jiang, D.; Zhang, H.; Liu, J.; Hua, H.; Liu, X. Numerical Simulation of Multiphase Flow and Prediction of Sediment Wear in a Large Pelton Turbine. Energy Sci. Eng. 2024, 12, 5031–5044. [Google Scholar] [CrossRef] [Scilit]
- Lukeš, R.; Honus, S.; Blejchař, T.; Balco, M. Reaction Cross-Flow Turbine for Small Hydropower Plants: Flow Profile Design and CFD Analysis. Renew. Energy 2025, 252, 123560. [Google Scholar] [CrossRef] [Scilit]
- Sudsuansee, T.; Phitaksurachai, S.; Udomsin, C.; Sathornsamritphon, S.; Chalermrat, T.; Chandravisut, S.; Sritrakul, N.; Tiaple, Y. Impact of Surface Roughness on CFD Performance Prediction of Francis Turbines: Grid Convergence Analysis and Experimental Validation across Variable Operating Conditions. Int. J. Thermofluids 2026, 32, 101567. [Google Scholar] [CrossRef] [Scilit]
- Decaix, J.; Mettille, M.; Münch-Alligné, C. Simulation of a Pelton Turbine Using the Moving Particle Simulation Method: Application to Two Challenging Situations. J. Hydraul. Res. 2024, 62, 365–369. [Google Scholar] [CrossRef] [Scilit]
- Showkat, S.; Harmain, G.A.; Masoodi, J.H. Cavitation Control in Francis Turbines by Design Optimization across Variable Operating Conditions. Next Energy 2025, 9, 100391. [Google Scholar] [CrossRef] [Scilit]
- Meng, X.; Nishikawa, Y.; Iio, S.; Kitahora, T. Study on Condition for Cavitation Occurrence in Cross-Flow Water Turbine and Its Effect on Turbine Performance. Int. J. Fluid Mach. Syst. 2026, 19, 37–48. Available online: https://www.jstage.jst.go.jp/article/ijfms/19/3/19_37/_pdf/-char/ja. [CrossRef]
- Mou, X.; Fan, J.; Zhang, J.; Duan, P. Porosity-Driven Aerothermal-Mechanical Coupling for High-Performance Transpiration-Cooled Turbine Blades. Case Stud. Therm. Eng. 2026, 85, 108359. [Google Scholar] [CrossRef] [Scilit]
- Xu, Z.; Ouyang, X.; Chen, C.; Li, Y.; Wang, T.; Ren, R.; Yang, M.; Zhao, Y.; Xue, L.; Wang, J. Numerical Simulation of the Density Effect on the Macroscopic Transport Process of Tracer in the Ruhrstahl-Heraeus (RH) Vacuum Degasser. Sustainability 2024, 16, 3923. [Google Scholar] [CrossRef] [Scilit]
- Liu, J.; Guo, W.; Zhao, G.; Ma, J.; Xi, W.; Sunden, B. Study on Heat Transfer Characteristics of Supercritical CO2/n-Decane Composite Double Triangular Regenerative Cooling for Scramjets. Aerosp. Sci. Technol. 2026, 172, 111725. [Google Scholar] [CrossRef] [Scilit]

Disclaimer/Publisher’s Note: The statements, opinions and data contained in all publications are solely those of the individual author(s) and contributor(s) and not of MDPI and/or the editor(s). MDPI and/or the editor(s) disclaim responsibility for any injury to people or property resulting from any ideas, methods, instructions or products referred to in the content. |
© 2026 by the authors. Licensee MDPI, Basel, Switzerland. This article is an open access article distributed under the terms and conditions of the Creative Commons Attribution (CC BY) license.