


Abstract
Degradation processes forming as a result of direct and indirect environmental interactions with soluble salts are important for the structural material of marble and in geotechnical applications. This is necessary, not only to identify the source and describe the material, but also to ensure the sustainability of artifacts and to be able to provide appropriate material for preservation and restoration. In this study, the durability of Afyon–İscehisar marbles (calcitic and dolomitic) to cyclic salt mist was investigated in a laboratory environment by considering weight, color, and ultrasonic pulse velocity values. Additionally, comprehensive experiments including mineralogical and petrographic investigations (polarizing microscope, X-ray diffractometry, scanning electron microscope (SEM/EDX), geochemical investigations, and physical and mechanical tests) were performed to evaluate the durability against the effect of salt mist. The results show that the calcite content in the calcitic marbles varied from 96% to 99%, while the dolomite content in the dolomitic marbles reached 64%–74%, in line with microscopic and semi-quantitative XRD analyses and geochemical investigations. The calcitic–dolomitic differentiation was tightly controlled by the magnesium (Mg) content. With the effect of salt mist, the samples had negligible weight changes (0.02% in the KH sample) and there was no significant material loss in any of the groups. For color analyses, total color differences (ΔE) in the KH and MN samples reached 4.39 and 4.06, respectively, and exceeded the human perception threshold. The dolomitic KS and PB samples and calcitic KP sample had increases identified for ultrasonic pulse velocity. Contrary to this, the GR (calcitic) sample was found to have a 15.15% reduction in ultrasonic pulse velocity. These findings provide critical selection, performance prediction and preservation criteria for Afyon–İscehisar marbles in both modern structural engineering applications and in archeological studies.
1. Introduction
From ancient times to the present day, natural stones have been chosen as construction materials for many buildings and used as the most reliable material, in addition to their functionality. In ancient times, natural stones comprised an important material for floor and wall coverings and in the construction of monumental and religious structures, statues, and tombs. In addition to physical features like hardness, color, texture, etc., natural stones are a durable material type with product variety including marble, granite, basalt, limestone, sandstone, and tuff.
In recent years, when studies performed in detail about the most common marble types used in the ancient age are investigated, the marble production areas include Prokonnesos (Marmara Island) marble, Thasos marble, Carrara, Parian marbles, Afrodisias marble, and Pentelikos marble. These locations were identified as important producers due to the quality of the material, locations on important trade routes, or proximity to important ancient towns. Considering white marble, the majority of the most important quarries in the Mediterranean region are located within the current borders of Greece, Türkiye, and Italy [1]. In Türkiye, in the period of the Roman Empire following the Hellenistic era, interest in temples and statues made with white and colored marbles continued. Marbles quarried at sites on Marmara Island (Prokonnesos), in Afyon–İscehisar (Dokimeion), Şuhut (Synnada), Seferihisar (Teos), Babadağı (Salbakos), İzmir-Belevi, Bilecik, and İznik were commonly used, not just regionally, but in a variety of towns in the Roman Empire through marine transport [2]. The Afyon–İscehisar (Dokimeion) region is a marble production center, with deposits of fine-grained marble with a variety of colors (Afyon violet, gray, cream, and white). Evidence about Afyon–İscehisar Dokimeion marble is based on Roman records and archeological discoveries from the 1870s. It was proposed that only three centers produced the main cluster of marble tombs during the period of the Roman Empire. In addition to Rome and Athens, a workshop in Anatolia called Dokimeion is accepted as one of these centers [3]. A study by Waelkens defined all garlands on some tombs and tombs with figures and friezes as Dokimeion tombs [4]. It is believed that the marbles in these tombs were obtained from quarries in Dokimeion. The concept of Dokimeion marble (Dokimites-Dokimeion) was first mentioned by Strabo [5]. In the Roman-era cities of Perge, Aspendos, Side, and Attaleia (Antalya) in the Pamphylia region of the Mediterranean, İscehisar marble was widely used in monumental sarcophagi, fountains, columns, and sculptures. Some examples include sarcophagi in Perge, the columns of the Kestros (Düden) Fountain, the Hadrian Nymphaium, and the Septimius Severus Fountain; the Great Monumental Fountain (Nymphaium) and agora in Side; the columns of the Aspendos Theater; and the statues of Asklepios and Telesphoros located in public places throughout the city.
Countless artifacts and architectural elements like columns, decorations, and covering material from Afyon–İscehisar Dokimeion marbles were produced in the Roman period [6]. These artifacts produced in the Docimium quarry in the Roman period can be seen in a variety of monumental structures in several cities in countries like Greece, Syria, and Italy [7,8]. In studies from recent years, determining the origin of the raw materials used carries great importance for both archeologists and scientists in the field of monument preservation and for scientists investigating rock features and structural changes (degradation, weathering, damage). This is not just necessary to identify the source and describe the material, but also to ensure the sustainability of these artifacts and to be able to provide suitable material for preservation and restoration.
Degradation is a complex process and, as a result, several words are used to describe the process. For example, weathering is used for the process of natural degradation of the rock due to external factors, while deterioration represents loss of value and use. In addition to these words, there are two more that are generally used interchangeably: degradation and decay. Finally, the last word that needs to be mentioned is damage [9]. Rocks may be exposed to several types of damage [10]. Related to different areas of use and locations, a variety of damage types can be described as a result of direct or indirect environmental interactions. The damage mechanism related to environmental factors is generally investigated as physical, chemical, or biological factors and the interactions between them. Damage due to the presence of salt is probably the most important degradation mechanism for construction material.
Undeniably, salt is probably the single most damaging factor in the degradation of rock. Several studies have been performed on this topic [11,12,13]. Degradation due to salts was concluded to form a continuum from granular fragmentation to flaking, delamination, and bubble patterns [14]. This damage diversifies in accordance with the type of rock (marble, limestone, granite, etc.) and, most importantly, the amount of water available during crystallization is related to environmental conditions and the conditions of salt crystallization. Acid accumulation from the atmosphere is an important source of salt enrichment in construction materials. The main anions associated with types of salt forming from atmospheric acid are sulfate and nitrate. In addition to these salts formed by chemical reactions, salt from the atmosphere directly interacts with the rock. Marine aerosol droplets are accepted as one of the most important primary sources of emissions and atmospheric aerosols [15]. These salt particles form both dry and wet accumulations on marble surfaces. Evidence acquired from several monuments show that saltwater accumulation and enrichment may be an important cause of decay [16,17].
Laboratory tests were performed with the aim of investigating the effect of damage processes related to soluble salts. These tests, called aging tests, include the [18] “Determination of Resistance to Salt Crystallization” and [19] “Determination of Resistance to Aging by Salt Mist” tests. Though the test features and requirements of these standards may be met, researchers have a tendency to change test conditions like the sample size, the type and concentration of salt solutions, the temperature, cycle number, etc. [20]. When studies are investigated, marine aerosols (salt mist) are generally shown to make processes more rapid, especially in porous rocks, due to not just physical weathering but also hygroscopic (attracting moisture) features related to the continuous dampness of the rock, causing the acceleration of chemical dissolution (CaCO3 solution) in carbonate rocks (limestone/marble). A study by Rodriguez-Navarro and Doehne [21] is one of the foundational sources investigating how damage occurs in porous rocks due to sodium sulfate (Na2SO4) crystals. The study proved that the main cause of damage was supersaturation, and that the pressure applied to pore walls during crystal growth caused fragmentation exceeding the tensile strength of the rock. Another study investigating the relationship between the porous structure of rocks and salt damage examined the effect of the distribution of pore size in the rock on strength. In the study, pores less than 0.1 μm in size (micropores) were concluded to be the riskiest structure due to the pressure created by trapped salt crystals [22]. As a result of accelerated aging experiments performed with different rock types, pore connections and water-holding capacity were revealed to directly determine the rate of damage [23]. Studies focusing on the effect of marine aerosols, especially in coastal regions, are very common in the literature. Salt aerosols from the sea (NaCl and Mg-salts) were emphasized to cause not just the physical fragmentation of rocks, but also to create chemical changes in the minerals (hygroscopic water-holding) [24].
Additionally, studies including the changes in the salt effect related to the mineralogical and petrographic properties of natural stones investigated the mineral diversity, grain boundaries, and porosity features. Morphological structures like the crystal size and crystal boundaries within the calcitic matrix of marbles affect the depth of effect and crystallization processes of salt solutions. In marbles with a fine grain size and locked crystal texture, high cohesion at grain boundaries limits the progression of micro-fractures, while textures with a large grain size and linear crystal boundaries display mechanical behavior more vulnerable to dissolution between grains [25]. Furthermore, from a petrographic perspective, the effective porosity of the rock and the density of micro-fractures determine the crystallization mechanism of the salt. In rocks with low porosity but high mineralogical diversity, salt crystals accumulate immediately below the surface (subflorescence) and trigger surface degradation and mass loss. Also, interactions between color-giving accessory minerals and ions in solution intensify achromatizing deviations by changing the surface reflection capacity. For this reason, the mineralogical armor and degree of textural locking in a rock are the primary determinants of both mechanical strength and esthetic lifespan [26].
Recent studies, as summarized above, present tests conducted with different salt solutions, studies with solutions of a specific salt, studies comparing seawater and other salt solutions (including other natural solutions), and studies related to salt mixtures [27,28,29]. Considering the studies in the literature mentioned above, it has been determined that samples (rocks) consist of immersion, holding, and removal cycles in a salt solution. However, studies determining the strength of the rock surface by exposure to salt mist under standard conditions are limited [30,31]. For this purpose, the behavior of Afyon–İscehisar marbles against the effect of salt mist was evaluated in this study through mass loss, color changes, and ultrasonic wave velocity (UPV). Additionally, the degradation mechanisms of these marbles were analyzed by an integrated approach, revealing the relationships of these changes with mineralogical and petrographic features. In this way, the study aims to provide important contributions to both material characterization and to the preservation of cultural heritage stones. The oldest unit in the study area comprises the Paleozoic Doğanlar schists.
Above the Doğanlar schists, the İscehisar marbles have great importance for the region economically and structurally comprise carbonate units developed in the form of two lenses.
2. Geological Setting
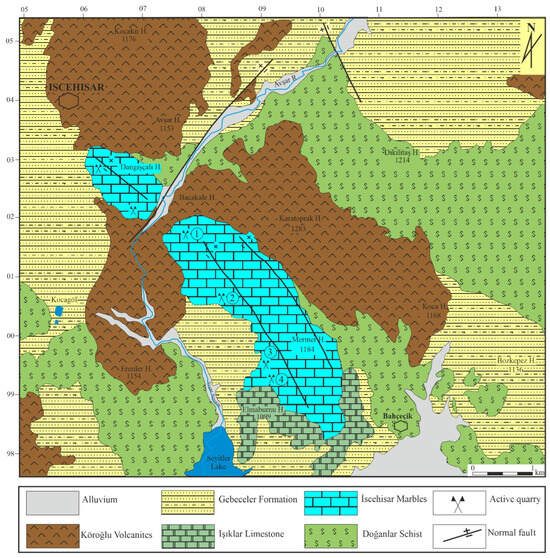
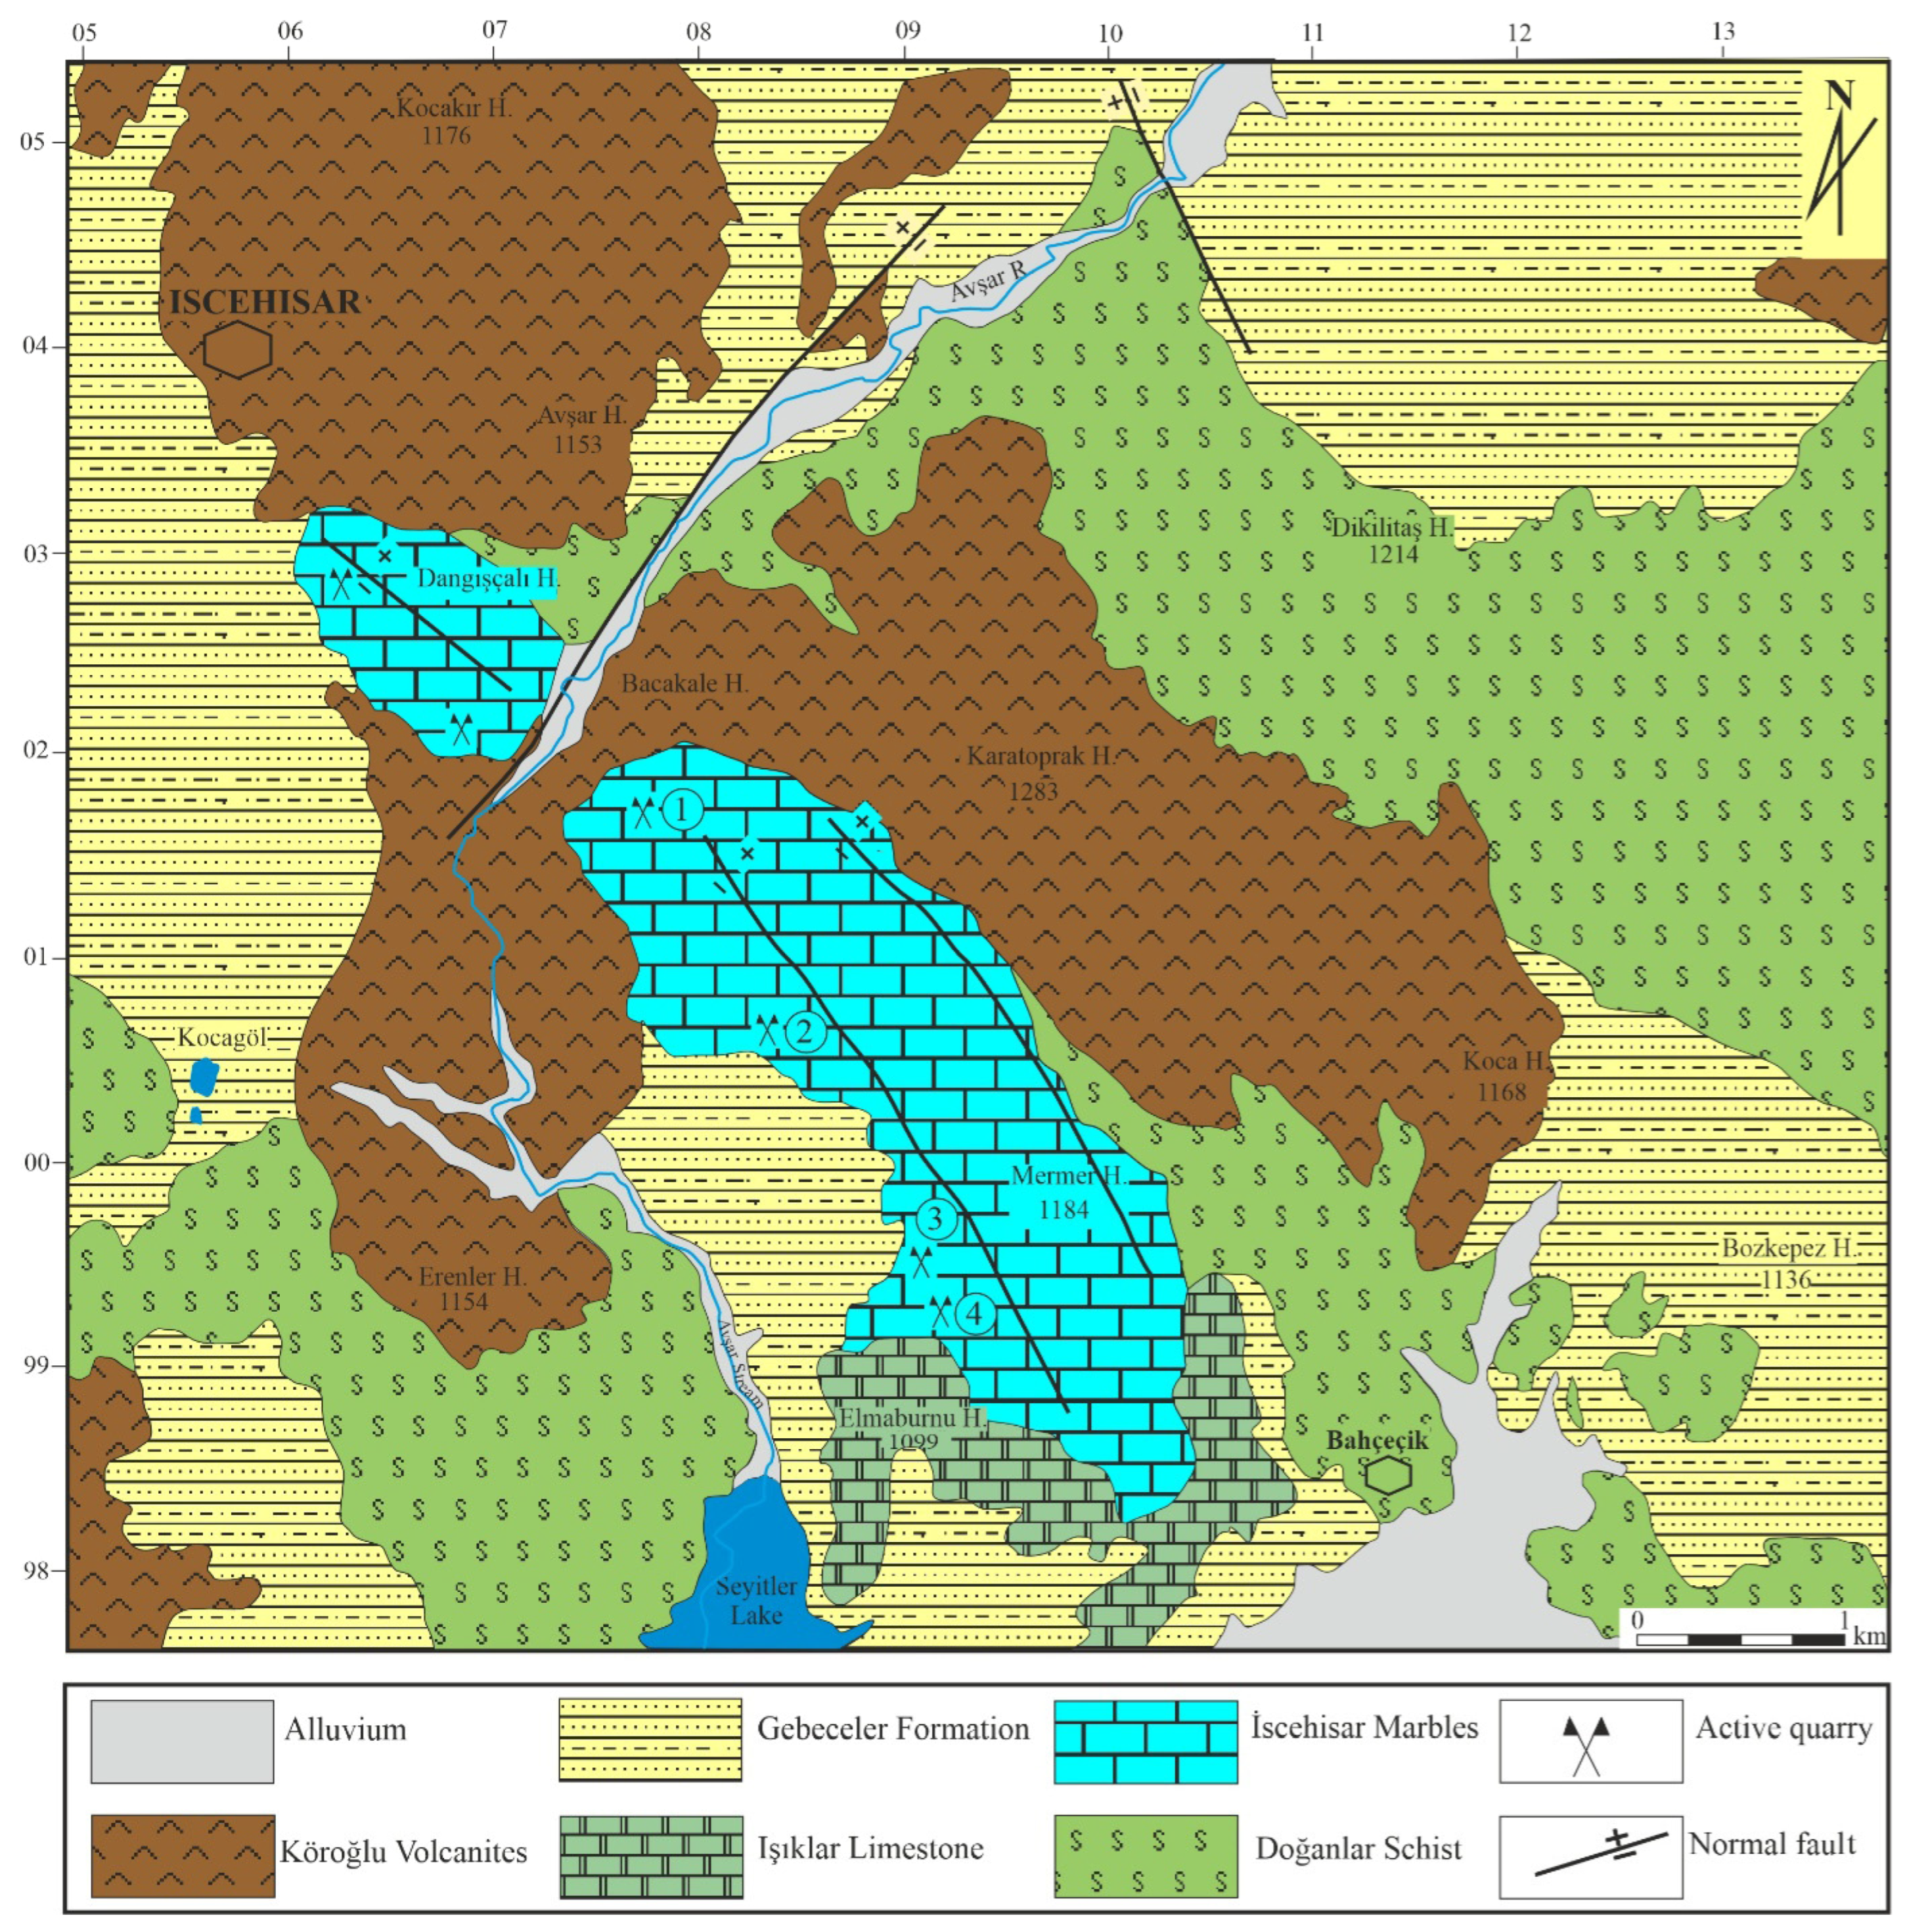
The study area is located in the Afyon–İscehisar (Dokimeion) region, comprising an important tectonic and lithological assemblage in Western Anatolia. The study area contains, from older to younger, the Doğanlar schists, İscehisar marbles, Işıklar limestone, Seydiler tuff and agglomerate, Köroğlu volcanics (basalt), and alluvium (Figure 1 and Figure 2).
Figure 1.
Generalized geological map of the study area (modified from [32]). (1) Oğuz marble quarry, (2) Şenler marble quarry, (3) Başoğlu marble quarry, (4) Serkan marble quarry.
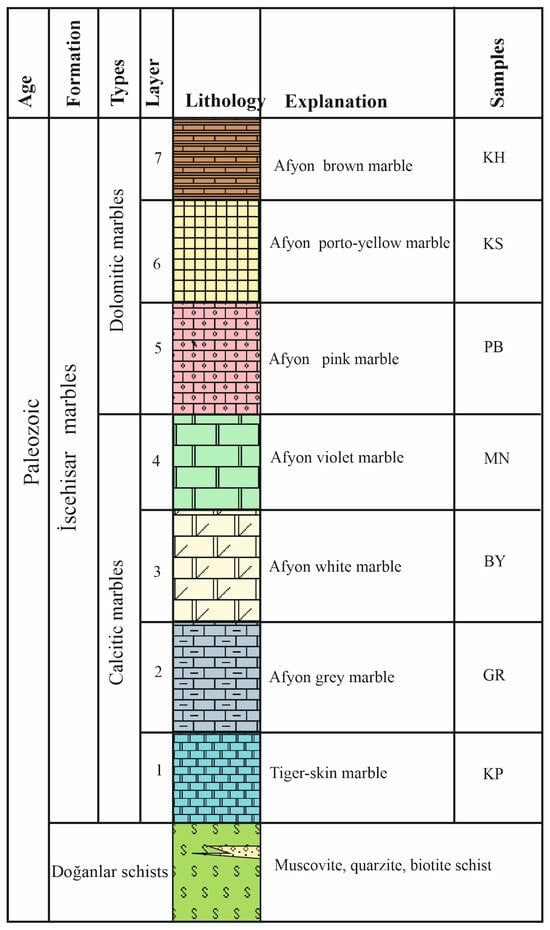
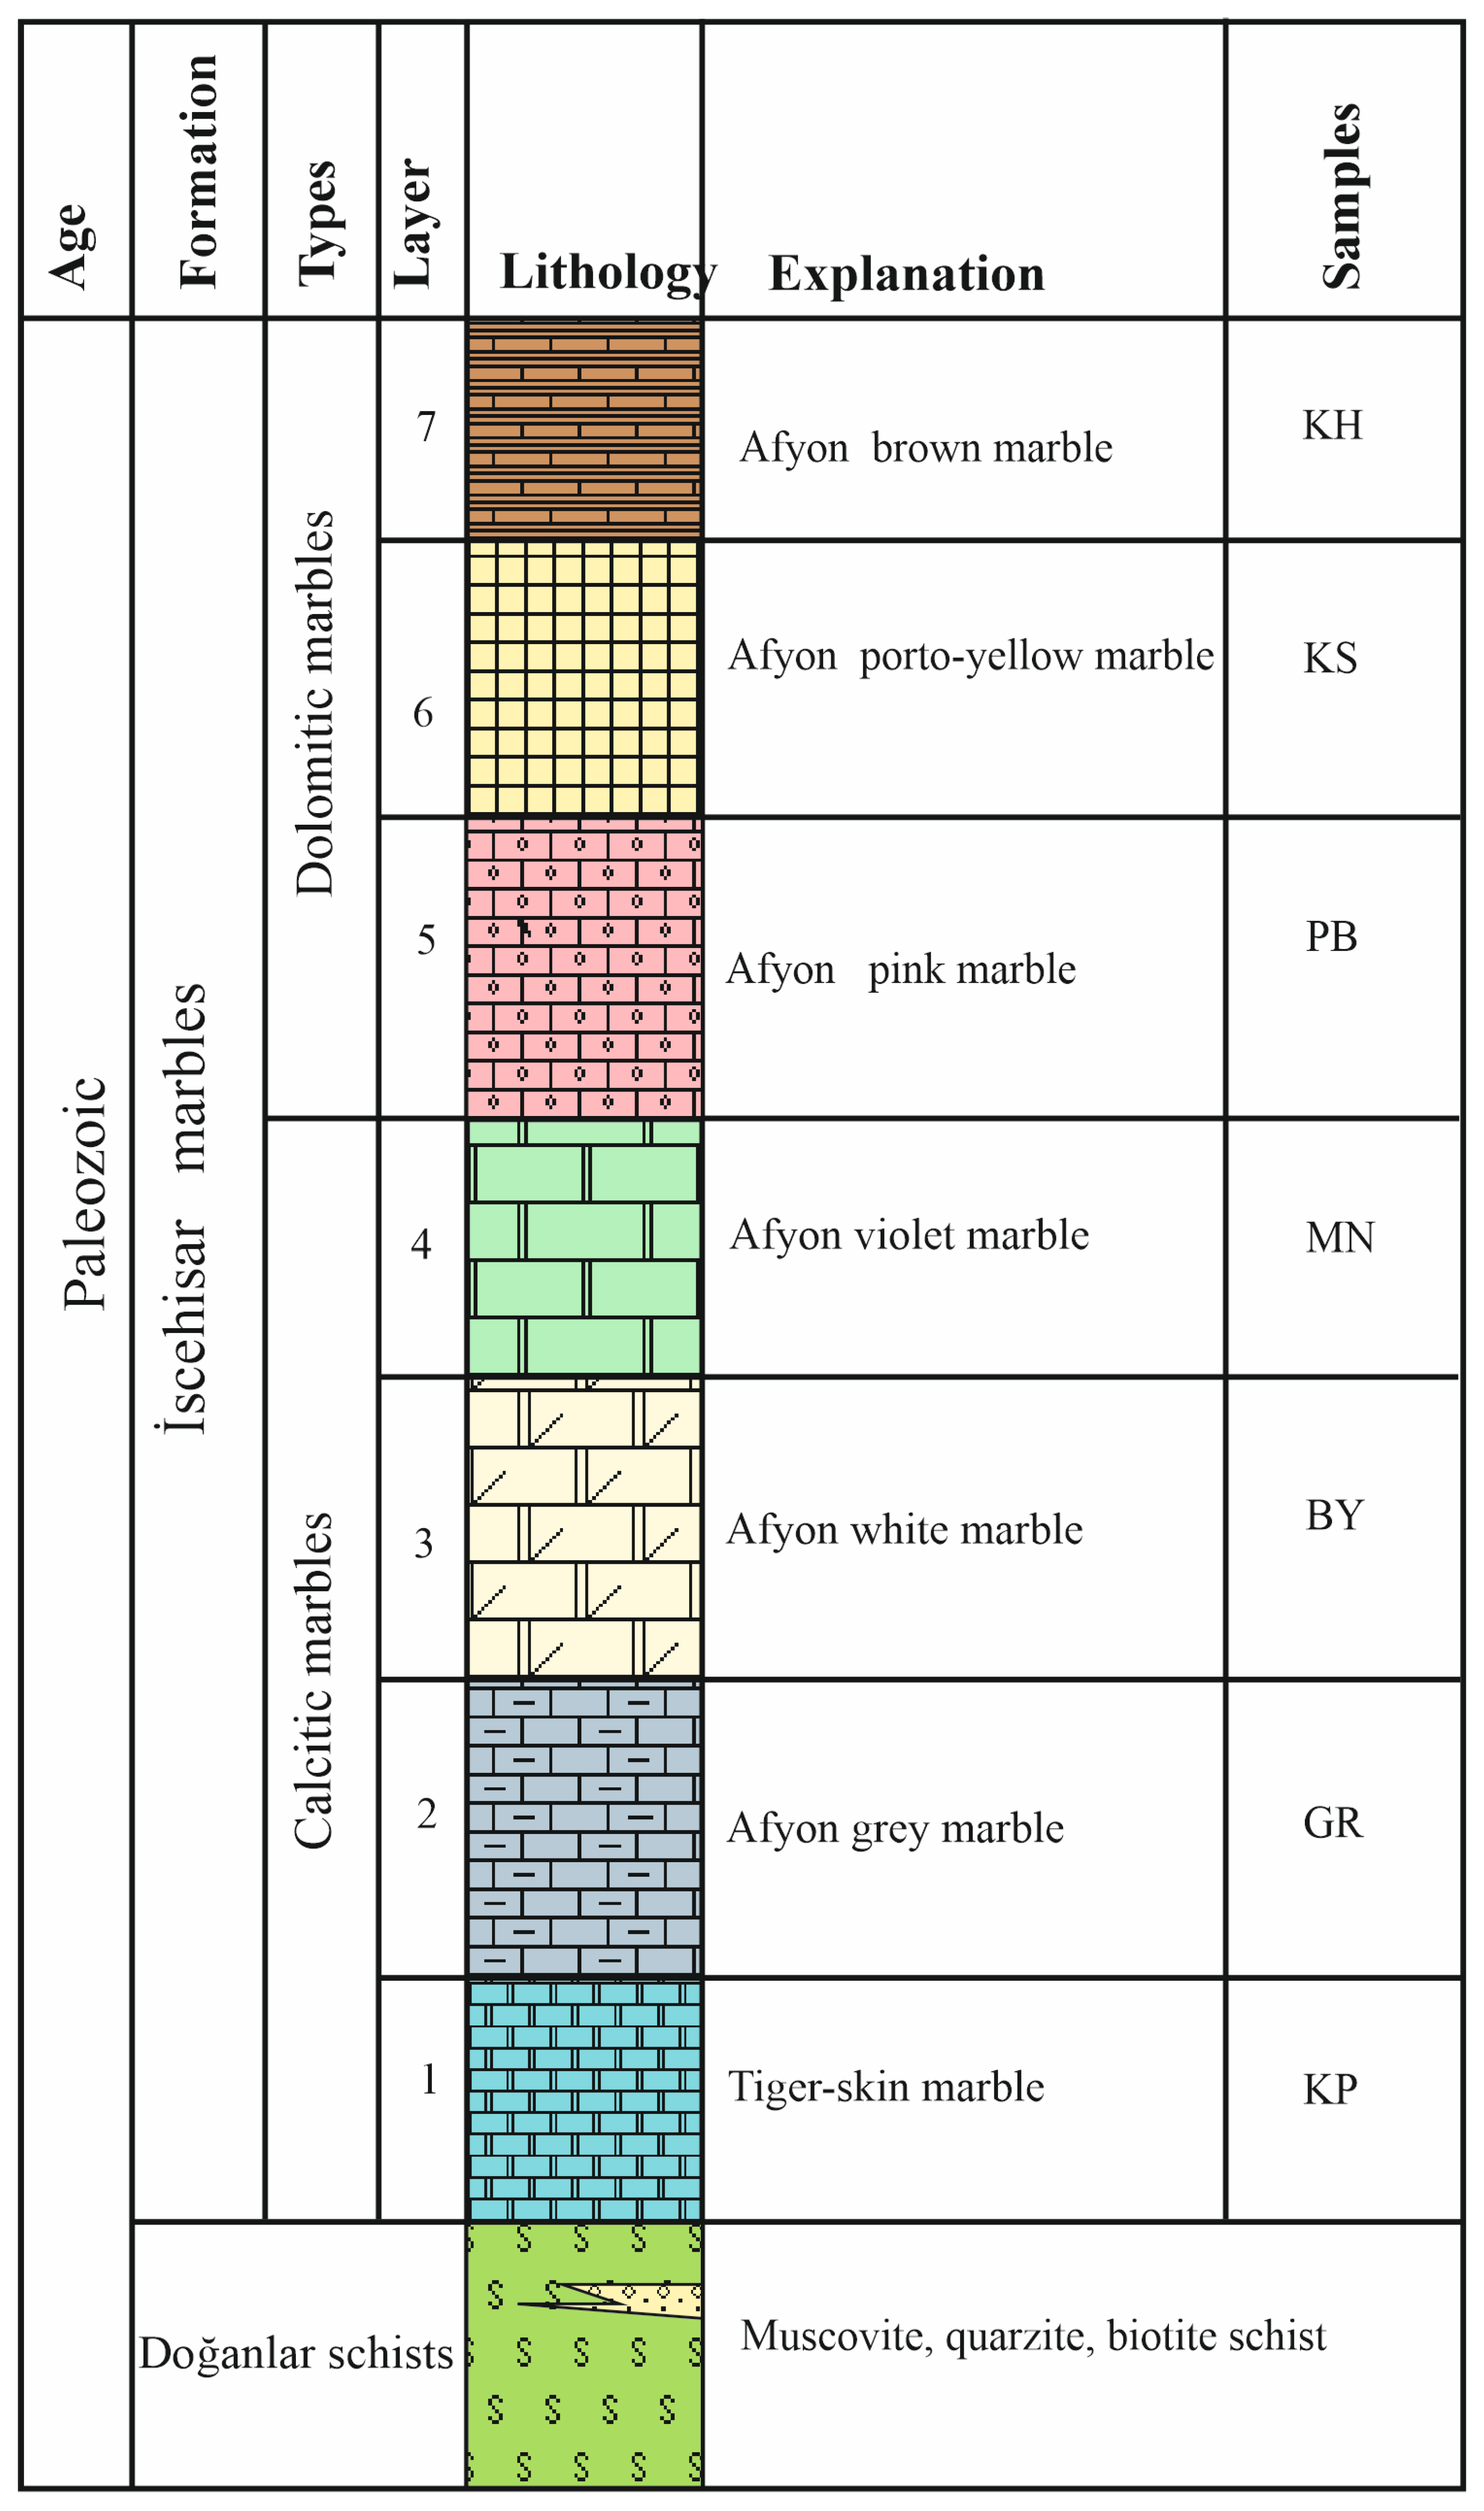
Figure 2.
Stratigraphic column section of the İscehisar marbles (not to scale).
The complete vertical succession of the seven marble varieties examined in this study is illustrated in the stratigraphic column of Figure 2. Resting on the underlying Doğanlar schists, the calcitic marbles (tiger-skin, gray, white, and violet) constitute the lower to middle parts of the sequence and transition upward into the dolomitic marbles (pink, porto-yellow, and brown) at the top, consistent with the calcitic-to-dolomitic petrological continuity detailed in Section 4.
These units, outcropping around Dangışçalı and Mermer Tepe, are Paleozoic in age with relative thickness reaching up to 250 m. The marbles generally appear massive and homogeneous, but contain common fractures and joint systems due to tectonic effects. On a mesoscopic scale, the marbles are observed to have white, gray, yellow, and violet tones. Stratigraphically, the Afyon–İscehisar marbles are separated into three main levels from bottom to top. The bottom levels contain units with dominant gray tones, while the middle levels contain fine-grained white and yellowish-white marbles, while purple-violet colored marbles are common in the upper levels. This vertical change reflects both differences in the depositional environments and the effects of metamorphic processes. The Afyon–İscehisar marbles are overlain unconformably by Mesozoic (Jurassic) Işıklar limestone. This unit outcrops in the southern sections of the study area especially, and represents a continuation of the carbonate sequence.
The Cenozoic Neogene Seydiler tuff and agglomerate and Köroğlu volcanics (basalt) are included among younger units, and these units reflect volcanic effects in the region. The youngest unit of Quaternary alluvium is distributed along valleys. In line with petrographic and geochemical investigations, marbles investigated within the scope of the study were separated into two main groups of calcitic and dolomitic marbles according to mineralogical composition (Figure 2). Marbles with striped, gray, white, and violet color represent the calcitic group, while brown, yellow-veined, and pink marbles are evaluated as having dolomitic composition. This differentiation reflects chemical and mineralogical differences related to both the formation conditions of the rocks and later diagenetic and metamorphic processes. The geological environment in which the İscehisar marbles developed is a multi-component system containing metamorphic basement, carbonate cover units, and volcanic rocks together: this comprises the basic geological setting directly controlling the mineralogical and petrographic features of the marbles in addition to their engineering behavior.
3. Materials and Methods
3.1. Materials
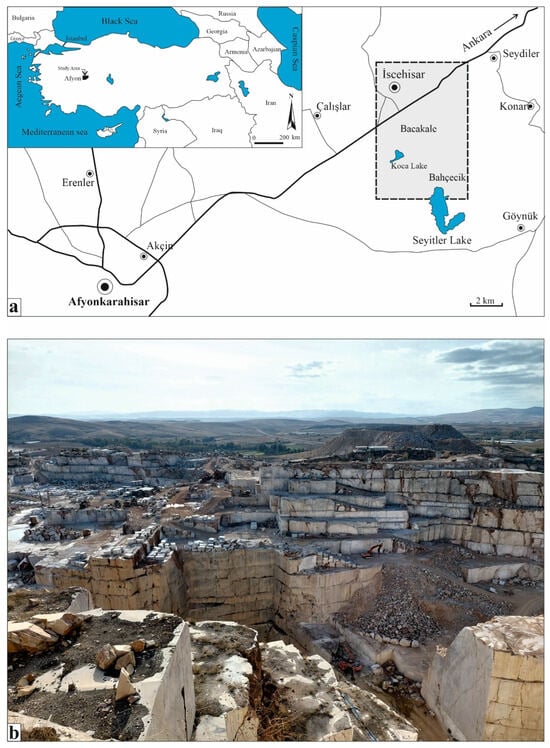
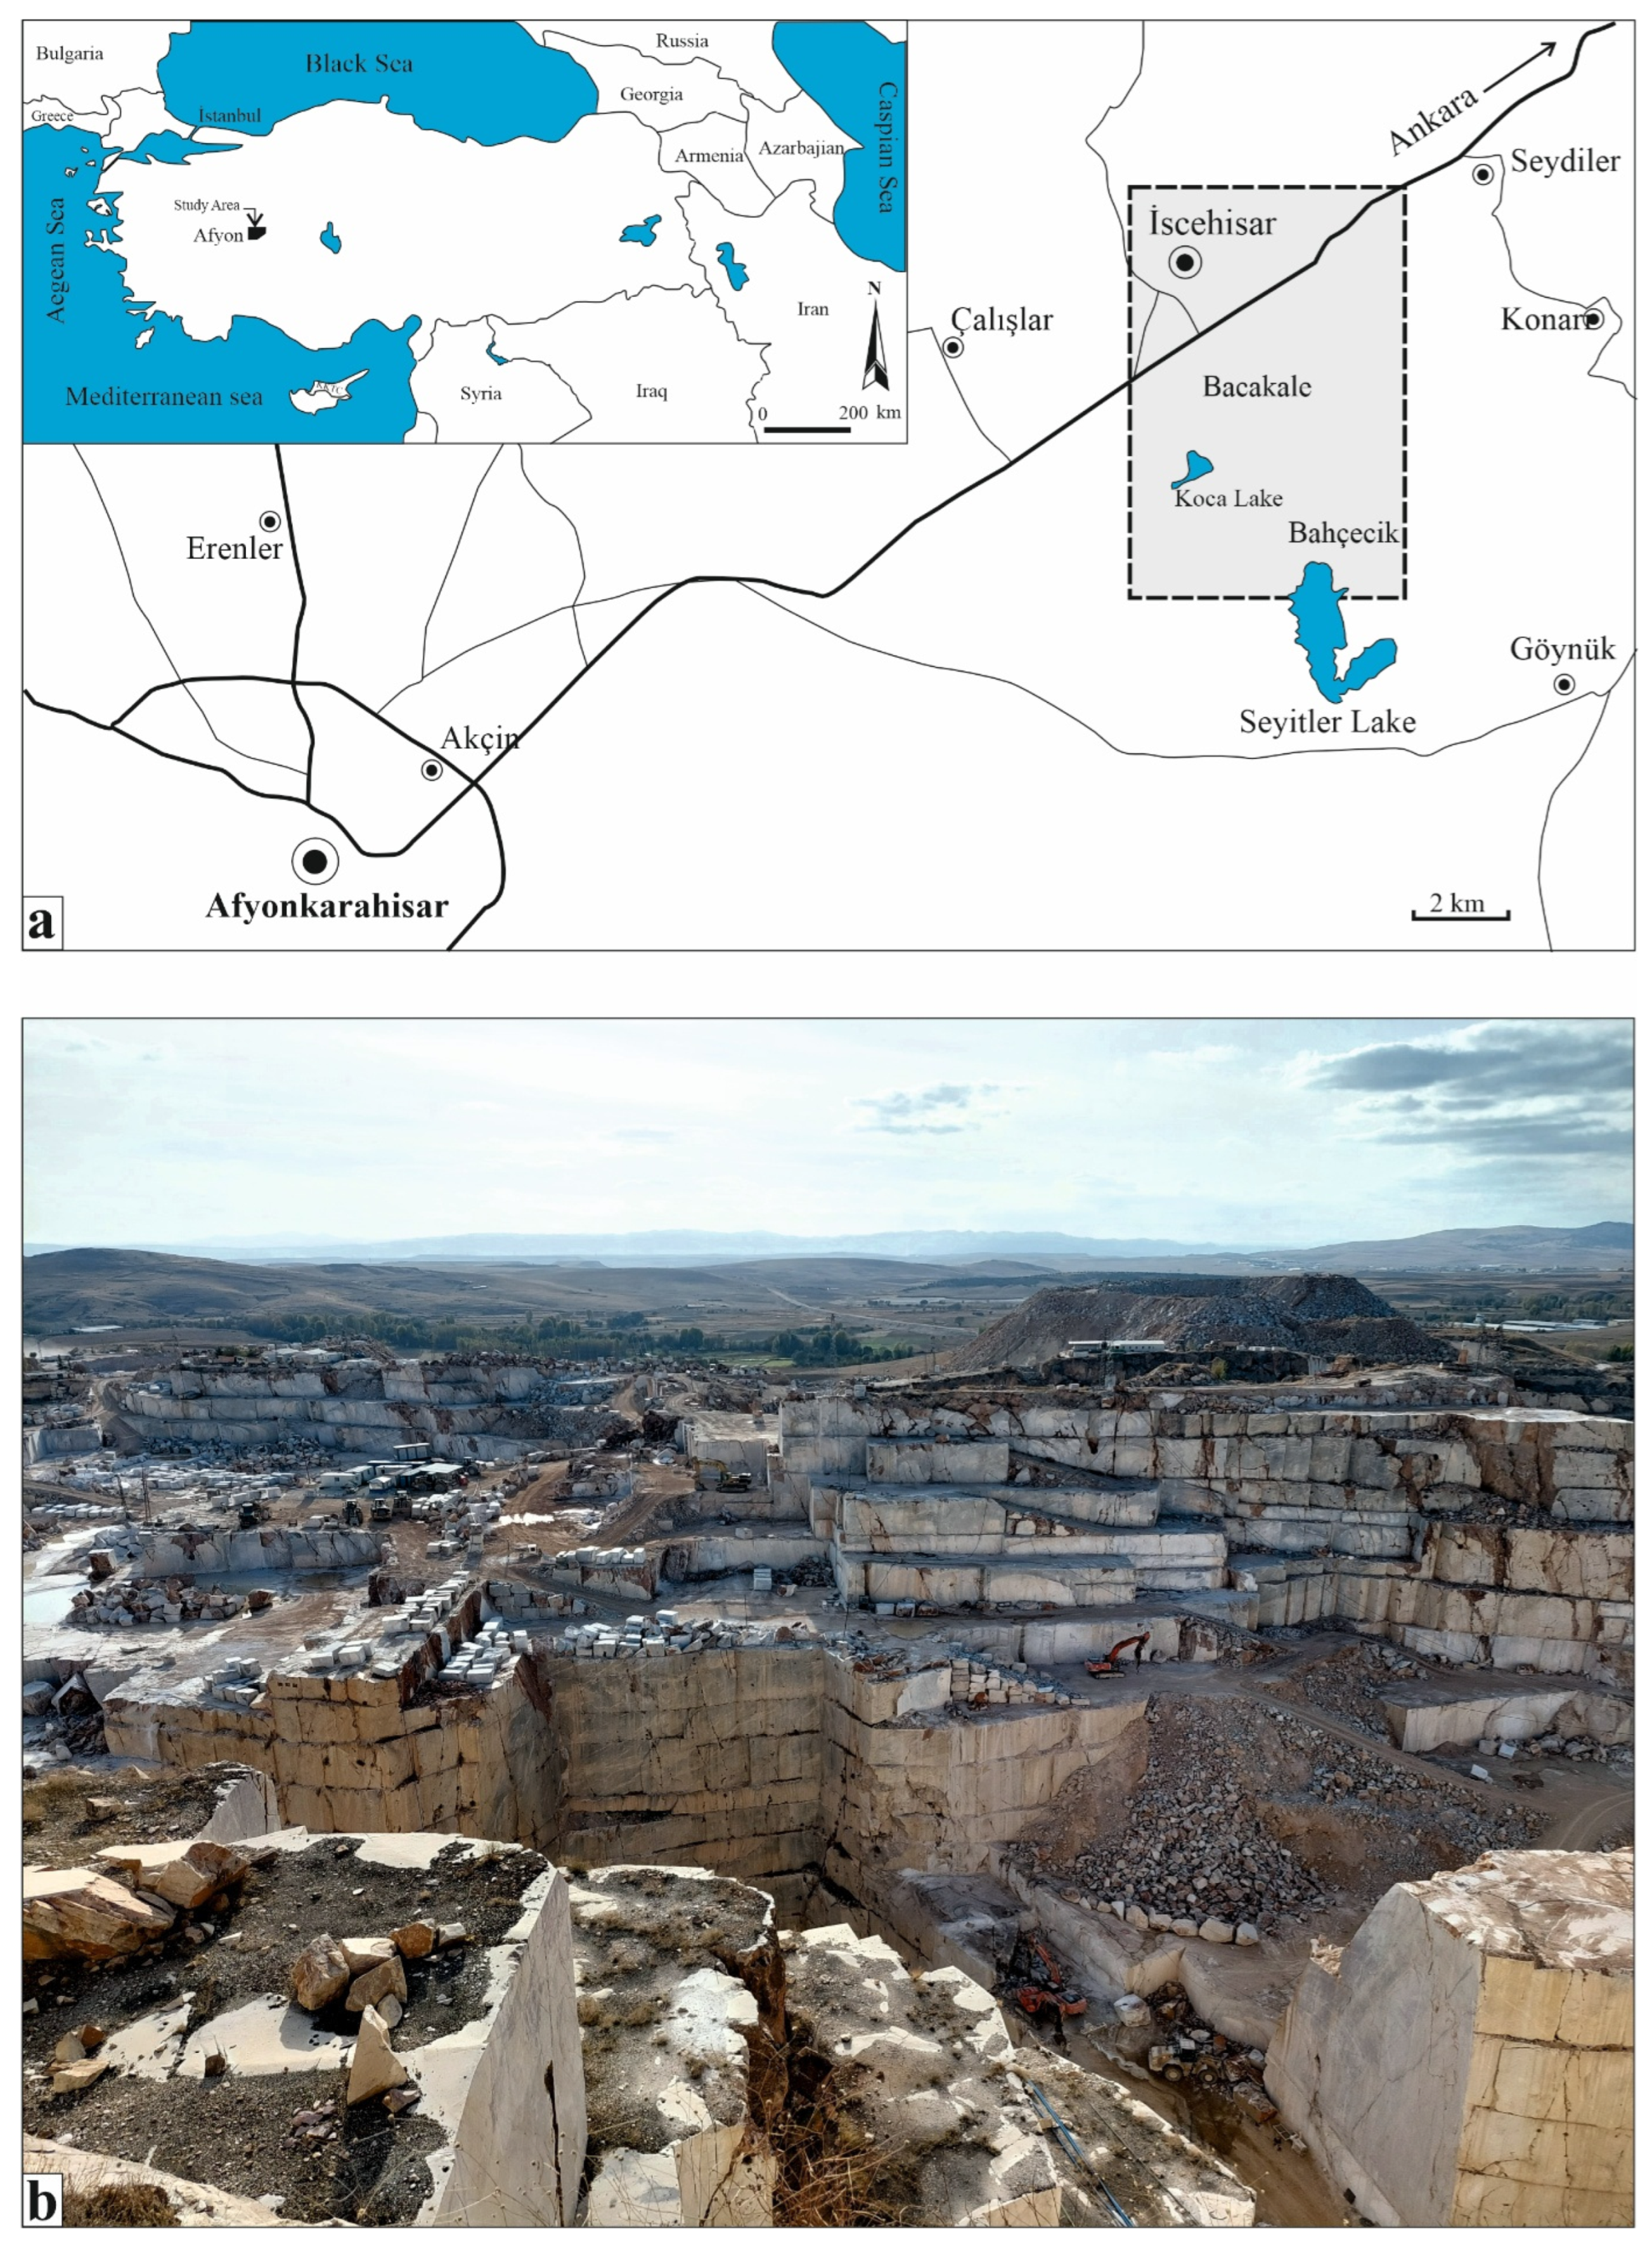
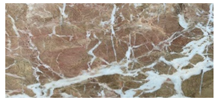
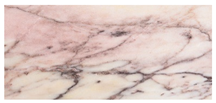
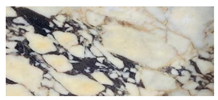
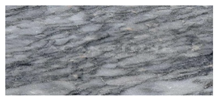
The Afyon–İscehisar region in Türkiye has a large marble deposit with a variety of color and textural features. Marble quarries in this region have actively operated over the duration from the ancient period to the present day. For our experimental studies, samples of seven different marble types were collected from İscehisar marble levels produced in the region, located 23 km to the northeast of Afyonkarahisar (Figure 3). For the aging test, seven 50 × 50 × 50 mm specimens were prepared from each marble type (six exposed and one unexposed witness), as detailed in Section 3.2. The codes, commercial descriptions, and macro appearance of these samples are given in Table 1. Although the generalized geological map (Figure 1) shows four marble quarries in the district, the samples examined in this study were obtained only from the Oğuz (No. 1) and Serkan (No. 4) quarries. Laboratory studies were performed with the aim of revealing the mineralogical, petrographic, and physico-mechanical properties of the marble samples.
Figure 3.
Location map for the study area (a); view of marble quarry (b).
Table 1.
Sample codes, commercial names, and macro view of the surface.
Firstly, thin sections were prepared from the marble samples and the mineral compositions and micromorphological features were investigated in detail with a Leica brand DM 2500 P polarizing microscope in Afyon Kocatepe University. Additionally, mineralogical investigation via the XRD method for the İscehisar marble samples were completed with a Shimadzu XRD-6000 model device in Afyon Kocatepe University Measurements were taken with copper kα X-rays at an angle of 2 theta between 2° and 70°. The Afyon–İscehisar marble samples had their density (Ref. [33]), water absorption (Ref. [34]), porosity (Ref. [33]), compressive strength (Ref. [35]), point load strength (ISRM), flexural strength (Ref. [36]), and wide-wheel abrasion resistance (Ref. [37]) tested according to TS EN standards in physical and mechanical tests.
3.2. Methods
With the aim of identifying some of the physical changes in Afyon–İscehisar marbles related to the atmosphere, durability against degradation by salt mist was examined according to the standard in [19]. In the test, seven samples with 50 × 50 × 50 mm dimensions were used, with six samples used for the tests and one witness sample. The test samples were dried in an oven until a fixed mass was reached, then cooled to room temperature and weighed with 0.1 g sensitivity (Mo). Dry samples were placed in a cabinet so they would only be exposed to salt mist and were separated from each other. A sodium chloride solution, prepared using sodium chloride with a purity of at least 95% and deionized water at (25 ± 2) °C, was used. The solution was prepared by dissolving 10 ± 1 parts sodium chloride in 90 parts deionized water to obtain a concentration of (100 ± 10) g/L. After preparation, the solution was filtered or decanted. Samples in the cabinet were exposed to salt mist for 4 h ± 15 min, the salt release system was stopped, and then samples were dried at room temperature for 8 h ± 15 min. This process comprised one cycle. During the cycle, storage was set at a room temperature of 35 ± 5 °C. The test included 60 cycles. At the end of the test, samples were carefully removed from the test cabinet. Samples were dipped in distilled water with the aim of removing salt accumulations. The volume of water in the washing container should be two or three times the total volume of the samples. After this procedure, test samples were dried in an oven (70 ± 5 °C) until a fixed mass was reached, cooled at room temperature, and then weighed with 0.1 g sensitivity (Mn). The data were computed into Equation (1) to find the mass loss that occurred.
- .
- .
- .
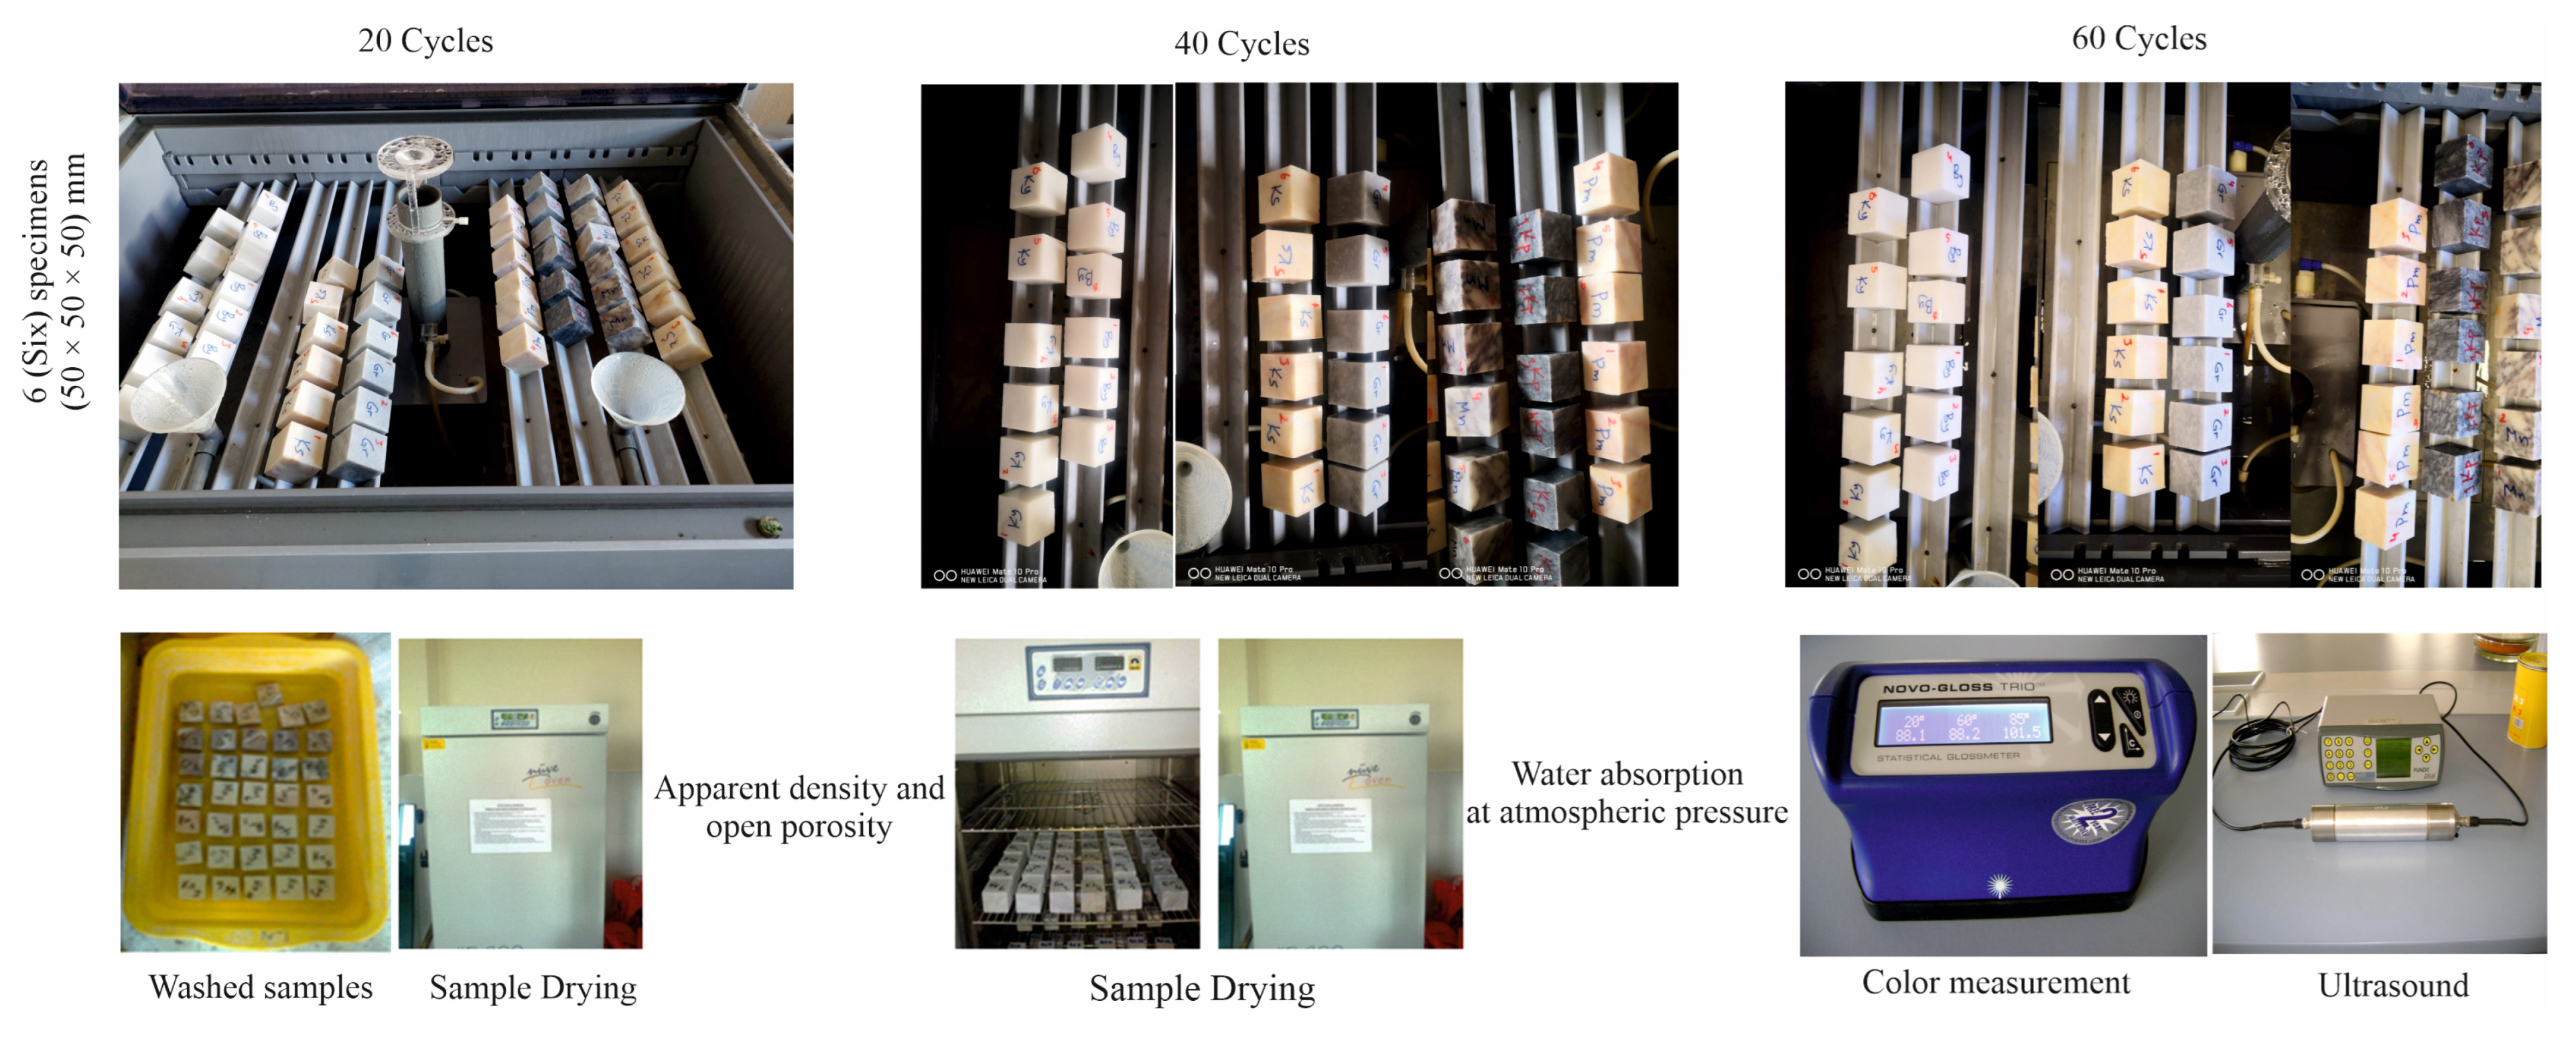
Before and after exposure to salt mist, the ultrasonic pulse velocity and color measurement tests were performed on the marble samples. The general schematic for the research methodology is given in Figure 4.
Figure 4.
General schematic for the research methodology.
The measurements for ultrasonic pulse velocity on the Afyon–İscehisar marbles were performed according to standards in [38]. Measurement points were chosen, with the transmitter and receiver ends of the device in parallel. Color measurements for the samples were determined using standard test procedures recommended in [39]. Color measurements were performed before and after durability tests against degradation by salt mist. Color measurements were completed using a Hunterlab colorimeter (Hunter Associates Laboratory, Inc., Reston, VA, USA) with metric intervals of 0%–150% and 45°/0° measurement geometry based on the CIELAB system.
The light source for the device was a xenon flash lamp. The ∆L, ∆a, ∆b, and ∆E values were calculated according to the following equations (Equations (2) and (3)):
where L1*, a1*, and b1* are the final values, and L0*, a0*, and b0* are the reference values.
∆L* = L1* − L0*; ∆a* = a1* − a0*; ∆b* = b1* − b0*,
The total color difference was determined by Equation (3):
A standard observer sees the difference in color as follows. When:
∆E* = (∆L*2 + ∆a*2 + ∆b*2)1/2.
- 0 < ∆E < 1—the observer does not notice the difference;
- 1 < ∆E < 2—only experienced observers can notice the difference;
- 2 < ∆E < 3.5—inexperienced observers also notice the difference;
- 3.5 < ∆E < 5—a clear difference in color is noticed;
- 5 < ∆E—the observer notices two different colors [40].
4. Results and Discussion
4.1. Mineralogical and Petrographic Investigation
The Afyon–İscehisar marble deposits, shaped by polyphase stages within the complex tectonometamorphic evolution of Western Anatolia, display an advanced degree of heterogeneity in terms of both stratigraphic sequence and mineralogical–petrographic character. The classic stratigraphic model defining the lower (tiger-striped–gray), middle (honey–sugar–white), and upper (violet) levels was proposed by Sümer et al. [41]. This model was developed with the addition of mineralogical and geochemical data by Bağcı [42] and transferred to a petrological continuity plane from calcitic marbles at the basal levels to dolomitic composition varieties in the upper levels.
4.1.1. Polarizing Microscope Investigation
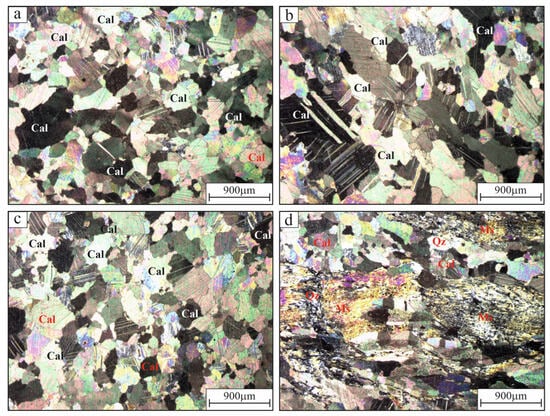
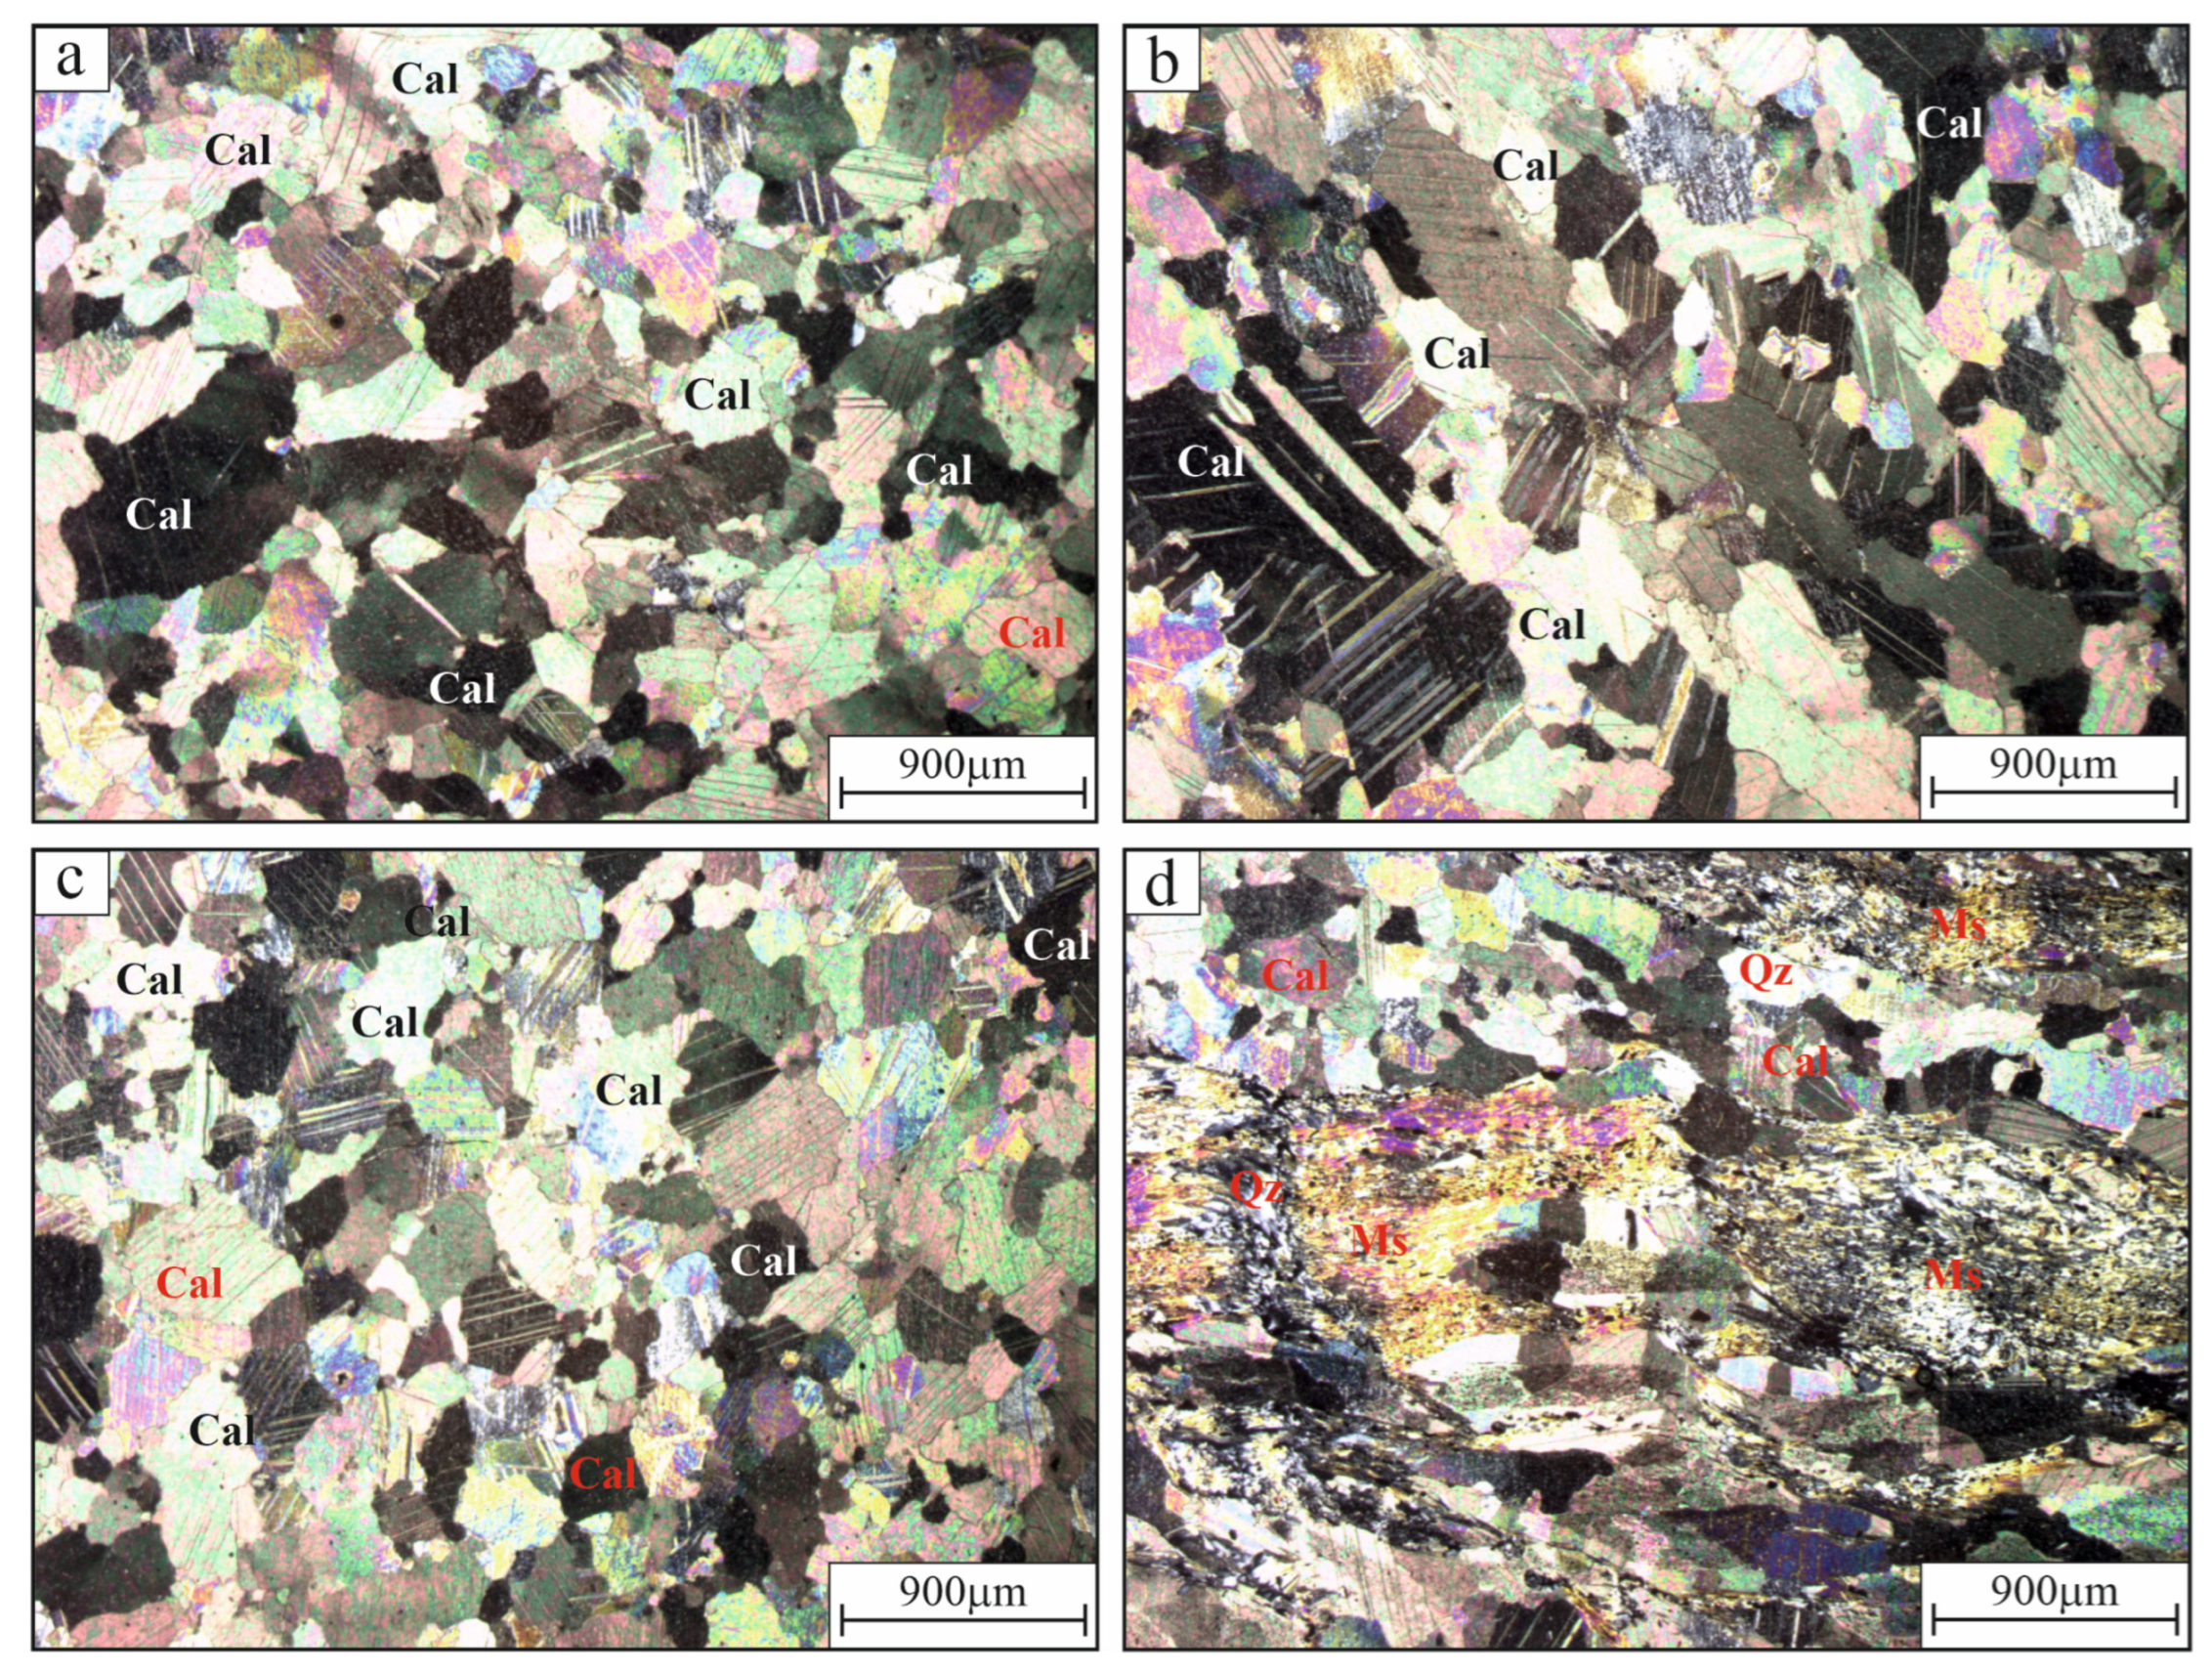
The dominant mineral phase in the calcitic marbles is calcite, showing that the mineralogical identity of the carbonate protolith was largely preserved during the metamorphism process. Polysynthetic twinning commonly observed in calcite crystals and maximum grain sizes varying from 400 to 500 µm prove that this unit underwent dynamic recrystallization under low–moderate metamorphic conditions. The tiger-stripe marbles forming the lower units of the sequence were observed to have a cataclastic breccia texture in hand samples. Thin sections of the tiger-stripe marbles have grain boundary migration (GBM) commonly observed in calcite crystals (Figure 5a). The graded transitions observed from the tiger-stripe to the gray marbles reflect the spatial continuity of the metamorphic and metasomatic processes. Micro-vein systems identified within the relatively homogeneous granoblastic texture of the gray marbles form discontinuities at the microstructural level, which play a determinative role in the mechanical anisotropy in the rocks (Figure 5b). The white marbles, representing the middle levels of the calcitic marbles, mainly display a massive texture comprising large equigranular calcite crystals (Figure 5c). The violet (Pavonazzetto) marbles, forming the uppermost unit of the calcitic marbles, are characterized by phlogopite (mica), illite, and fine-grained hematite (Fe oxide) minerals accompanying the calcite matrix (Figure 5d). Grain-size analysis performed at the microscopic scale offers a systematic differentiation between marble types according to Kun’s [43] classification. The maximum grain sizes reach 400 µm in the Afyon violet and Afyon white marbles, while they are around 500 µm in the tiger-stripe types, indicating that these units are the products of advanced recrystallization processes and are included in the fine–moderate-grained marble group.
Figure 5.
Thin-section images of Afyonkarahisar–İscehisar calcitic marbles. (a) Granoblastic texture, moderate–large crystal calcite (Cal) in KP sample. (b) Large crystals, occasionally oriented calcite and advanced twinning in GR sample. (c) Heterogeneous grain size, granoblastic calcite texture in BY sample. (d) Calcite (Cal) with quartz (Qz) and mica (Ms) minerals with weak foliation development in MN sample.
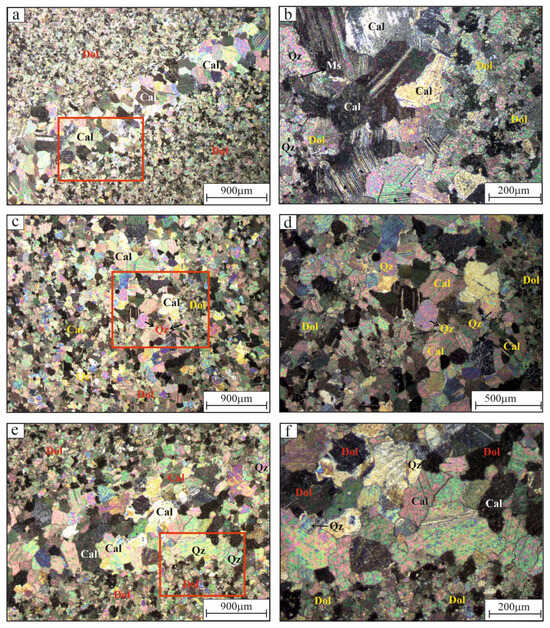
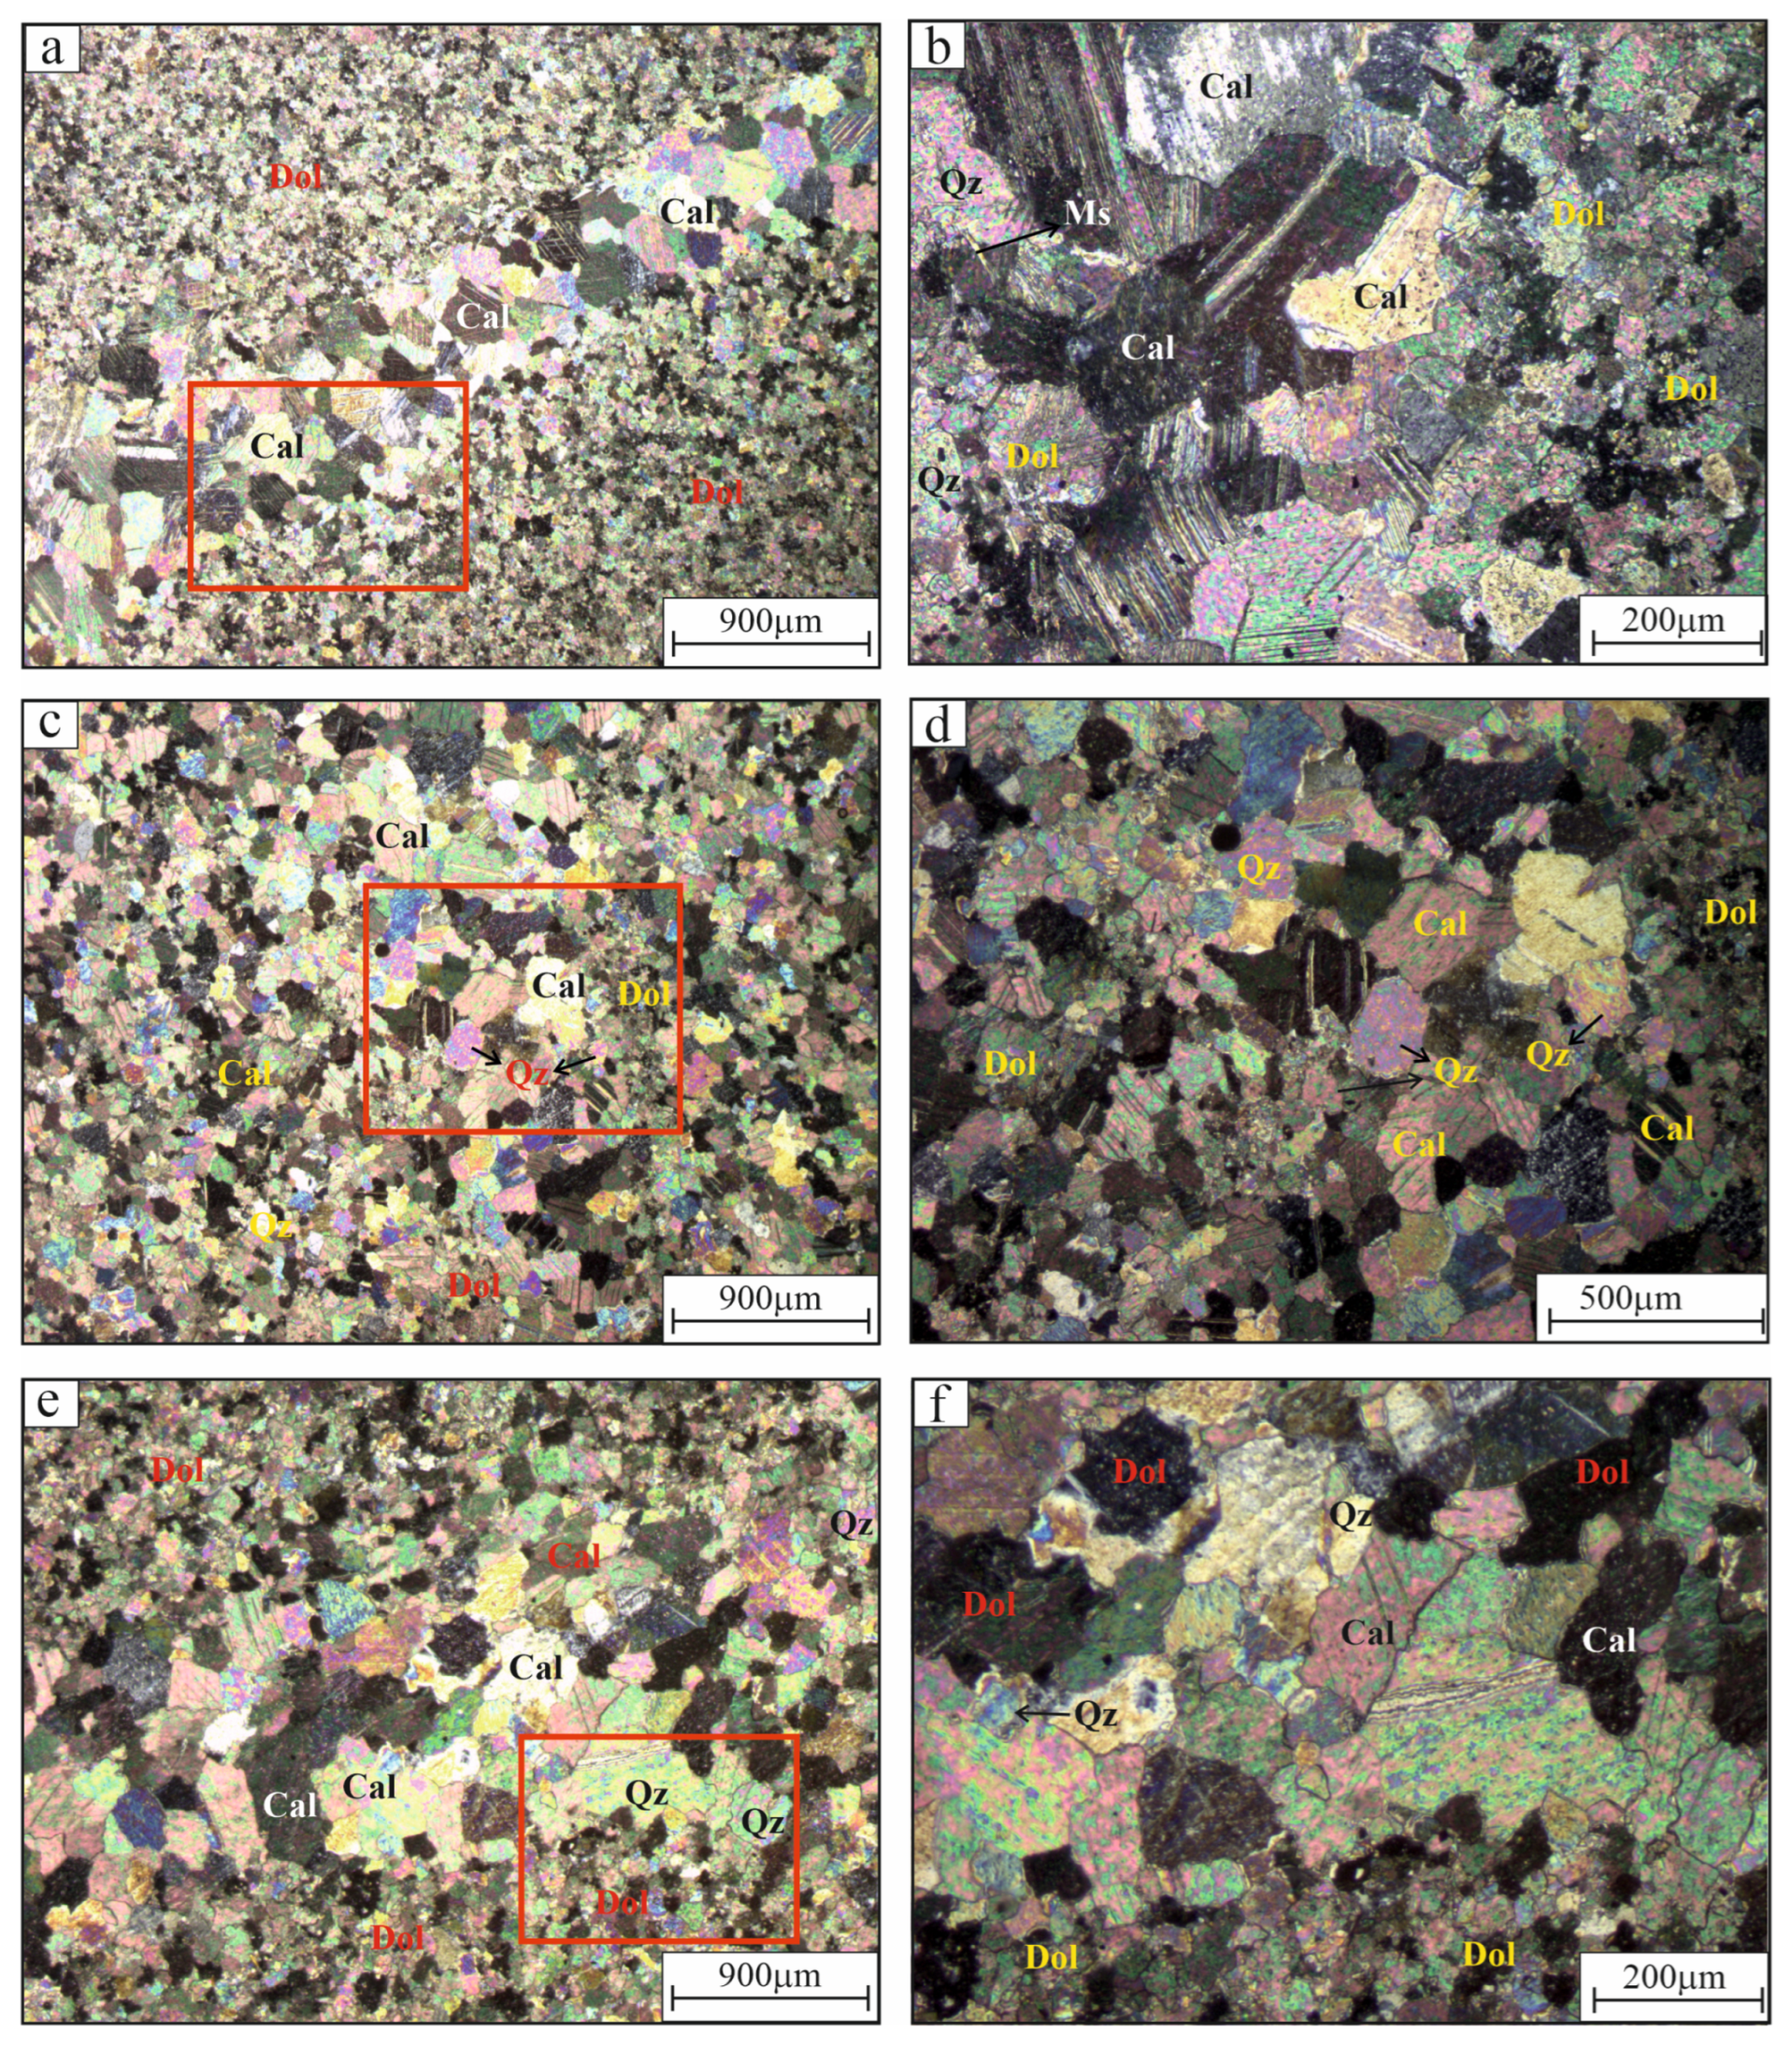
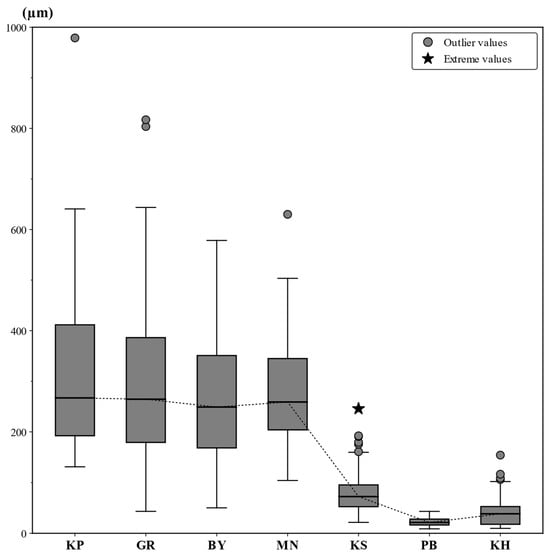
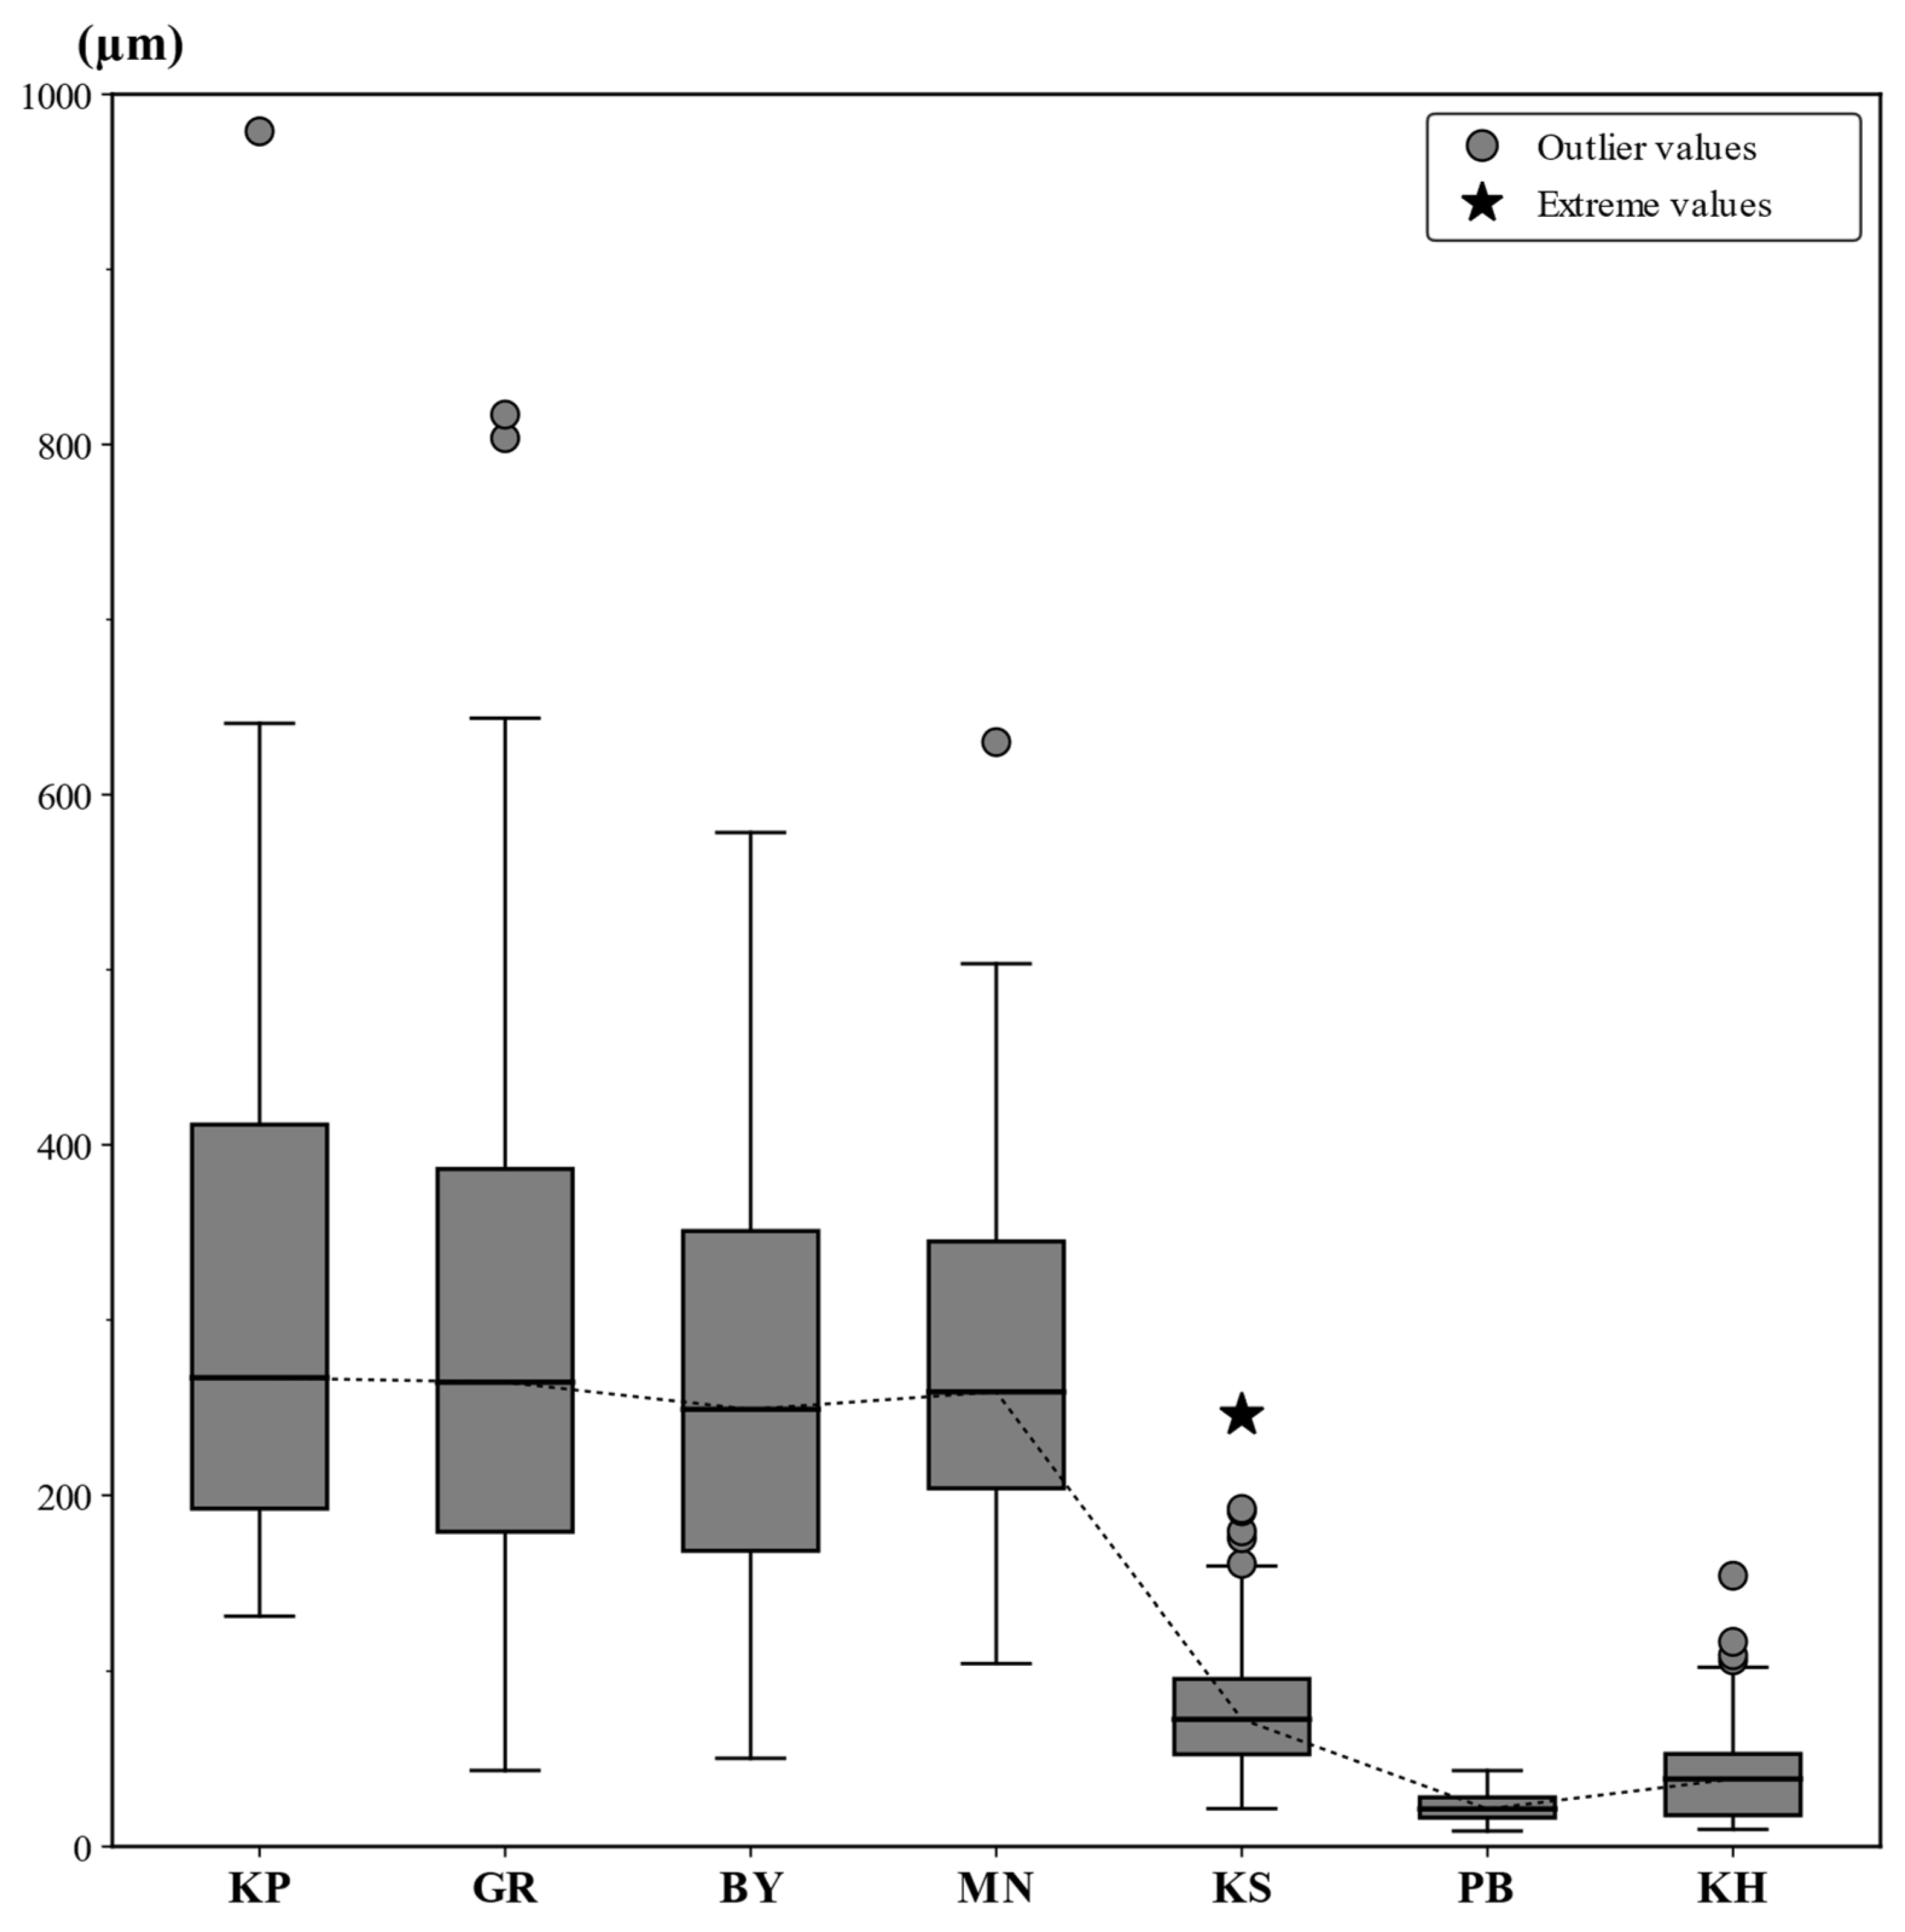
Thin-section images of dolomitic marble samples (Figure 6) show clear mineralogical and textural differences between the samples. In the PB sample, calcite and dolomite are found together, with dolomite crystals occasionally developed within calcite grains and partial replacement textures form. The presence of quartz is limited, and the rock generally displays a moderate degree of dolomitization (Figure 6a,b). In the KS sample, calcite and dolomite are found along with more pronounced quartz content, while the granoblastic texture with heterogeneous grain size is notable. The distribution of dolomite crystals is more common, indicating a more advanced degree of dolomitization compared to the PB sample (Figure 6c,d). In the KH sample, dolomite crystals become more dominant, and a mosaic texture is developed with calcite. Quartz minerals are occasionally accessories, while the prevalence of dolomite crystals shows that this sample has the most advanced level of dolomitization (Figure 6e,f). In conclusion, the microstructural heterogeneities, mineralogical phase changes, and maximum grain-size distribution observed in the İscehisar marbles are the basic petrological data directly determining both the performance parameters in modern engineering projects and the sensitivity of archeometric definitions of use during the ancient period. The grain-size distributions of the seven marble types are summarized as box plots in Figure 7.
Figure 6.
Thin-section images of Afyonkarahisar–İscehisar dolomitic marbles. (a,b) Calcite (Cal) and dolomite (Dol) associations along with a heterogeneous granoblastic texture containing quartz (Qz) and mica (Ms) minerals in PB sample. (c,d) Granoblastic structure with heterogeneous grain size containing calcite (Ca), dolomite (Dol), and occasional quartz (Qz) in KS. (e,f) Mosaic texture with clear dolomite (Dol) crystals along with calcite (Cal) and quartz (Qz) in a KH sample.
Figure 7.
Box plots of grain-size distributions (µm) for the seven Afyon–İscehisar marble samples (KP, GR, BY, MN, KS, PB, KH), based on 54–88 grains measured per sample; the box shows the interquartile range and median, whiskers the non-outlier range, circles the outlier values, and stars the extreme values—the dashed line connects the medians.
4.1.2. X-Ray Diffractometry Investigation
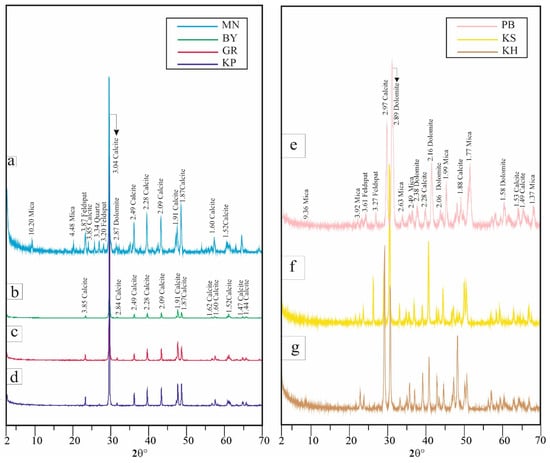
The mineralogical features of the Afyon–İscehisar marbles were determined with X-ray diffractometry (XRD) analyses. In line with the findings obtained, marbles were separated into two main groups of dolomitic and calcitic marbles. XRD analyses completed according to variety ensured mineralogical differences between the units were revealed.
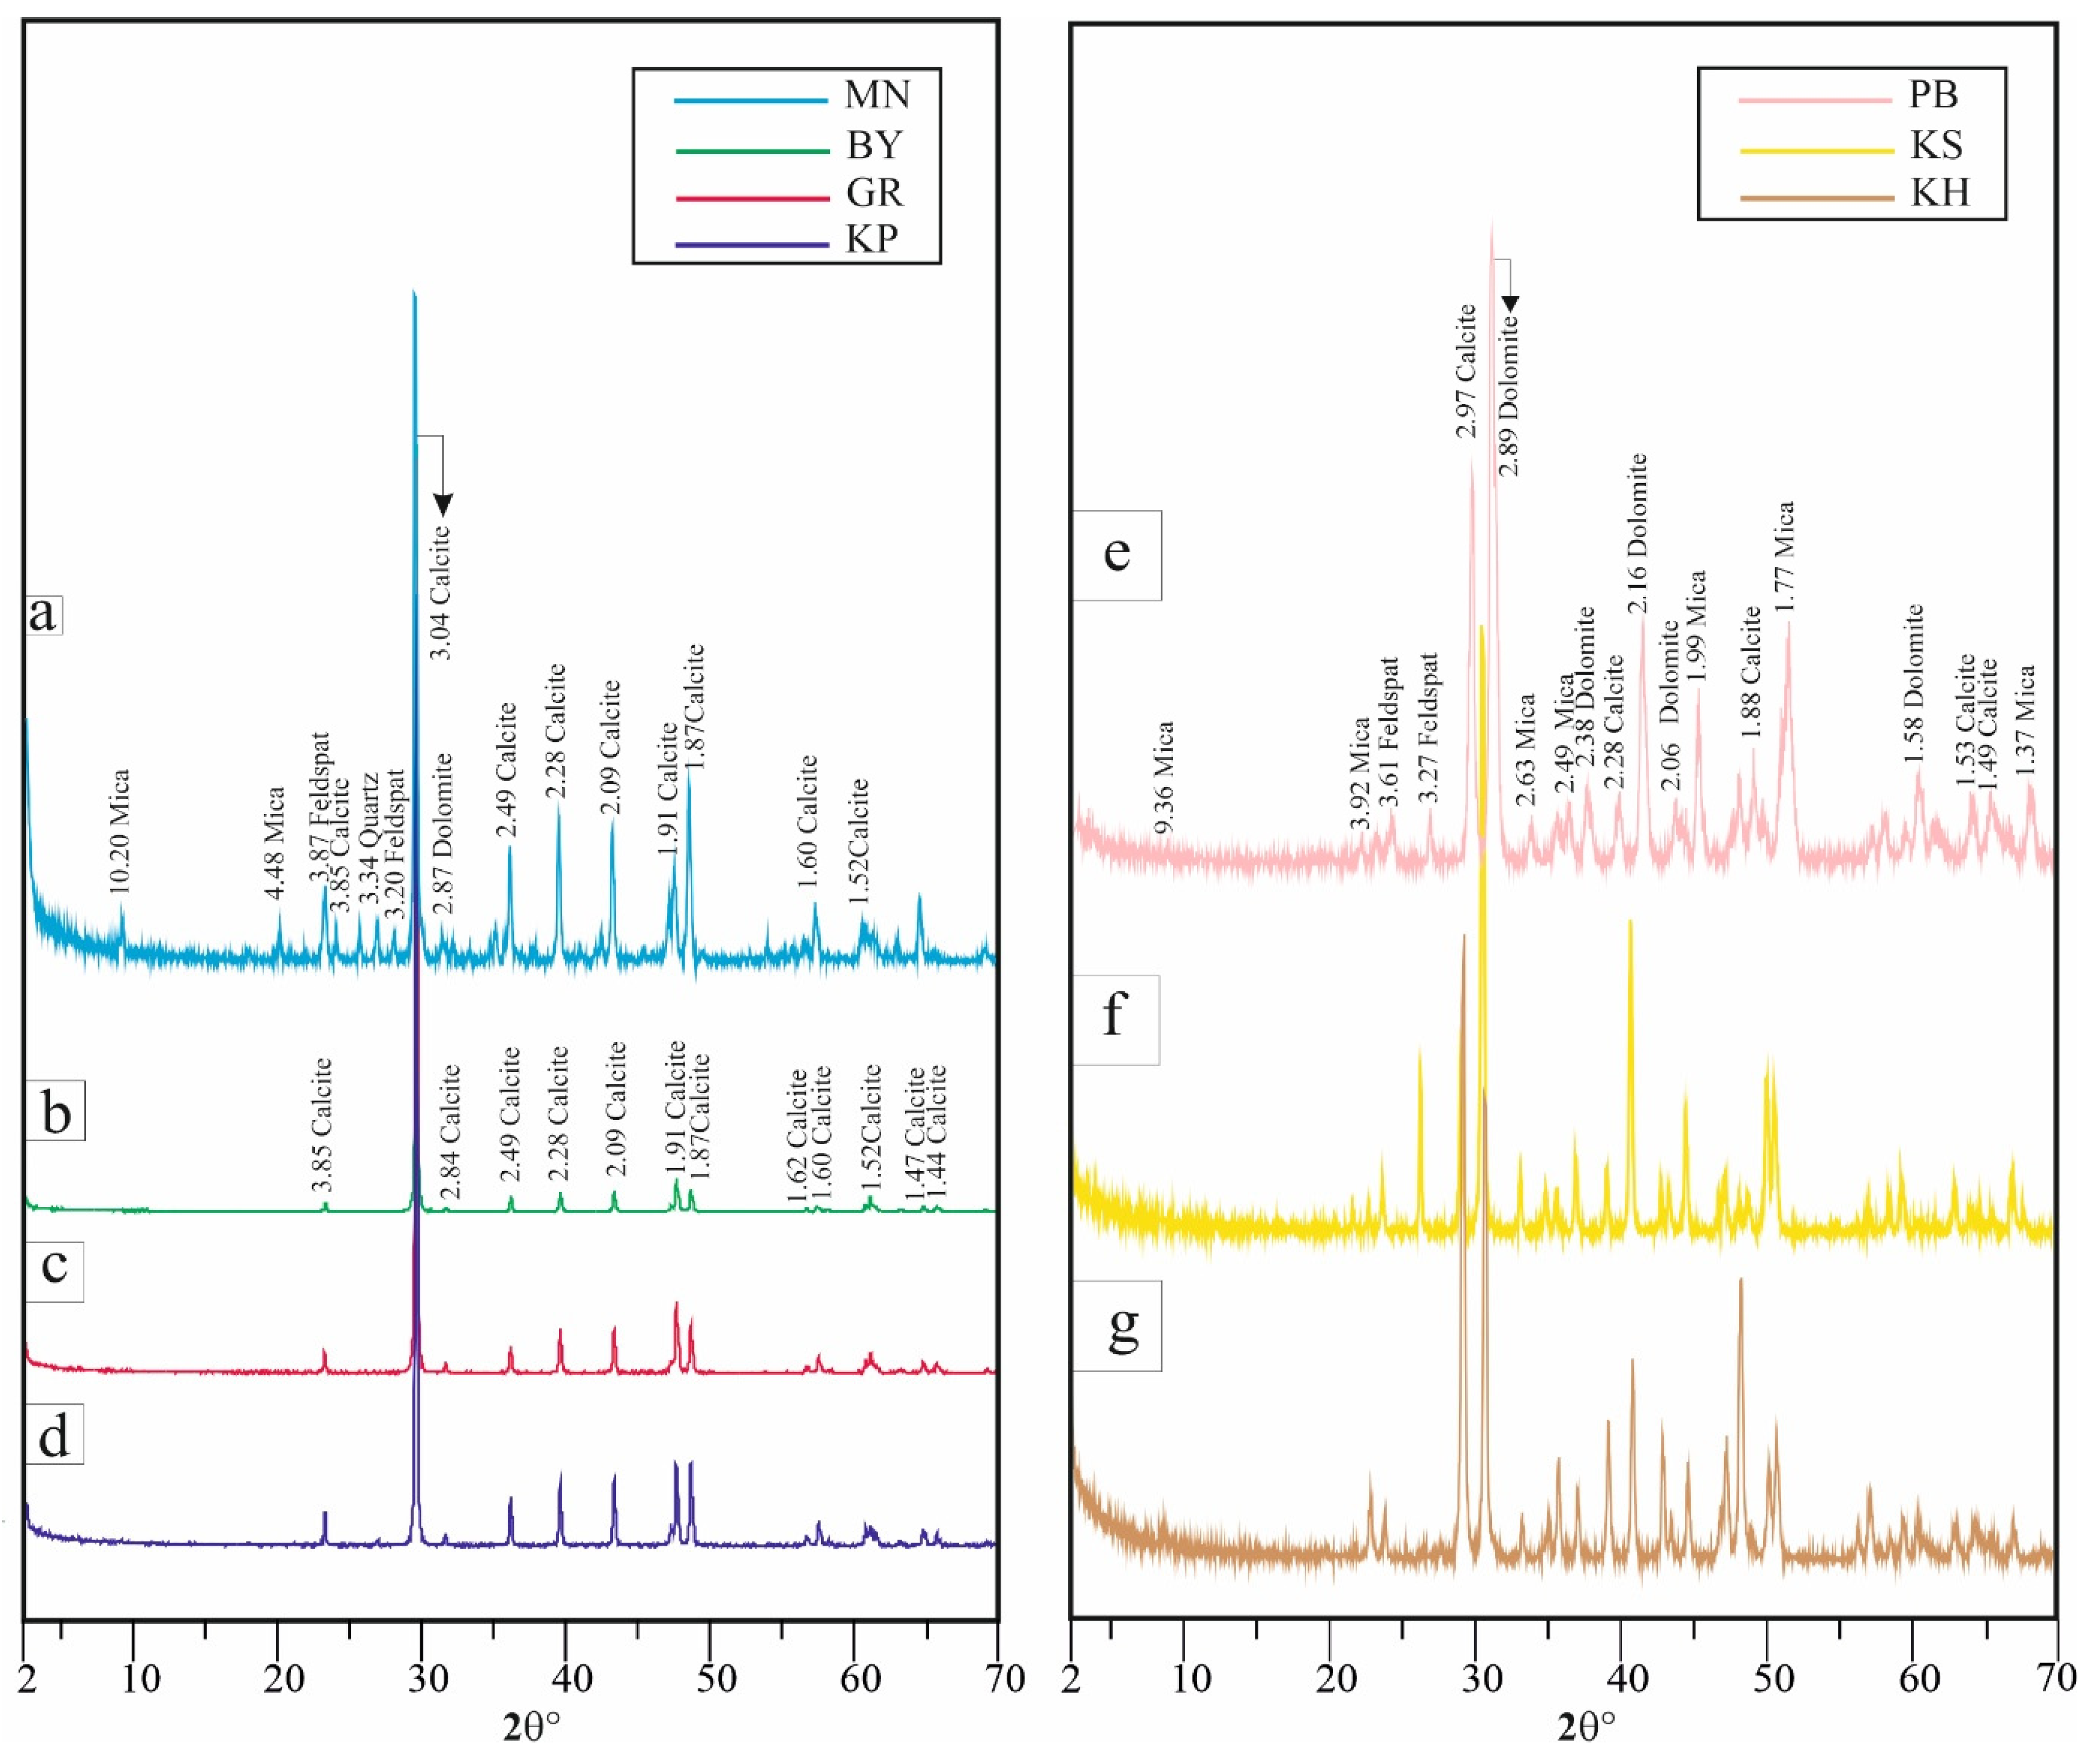
As a result of XRD investigations of the KH, KS, and PB marbles, representing the dolomitic marbles, dolomite, calcite, and quartz minerals were found together (Figure 8). In the MN marbles, evaluated within the calcitic marbles, calcite, quartz, and mica minerals were identified, while calcite and quartz minerals were identified in the KP marble. XRD analyses of the BY and GR marbles, included within the same group, show only the presence of calcite minerals (Figure 8). Semi-quantitative evaluations noting the XRD peak intensities determined the calcite proportion in the calcitic marbles to be 96%–99%, while the dolomite content generally remained under 1% (Table 2). Contrary to this, samples representing the dolomitic marbles had dolomite proportions from 64% to 74%, while calcite and dolomite were dominant phases together in some samples. This reveals that the carbonate rocks in the study area display mineralogical variation from calcitic to dolomitic.
Figure 8.
X-ray dispersion (XRD) patterns for Afyon–İscehisar marbles. (a–d) Samples representing the calcitic marbles; (e–g) samples representing the dolomitic marbles.
Table 2.
Semi-quantitative mineral ratios according to XRD analysis of Afyon–İscehisar marble.
The values in Table 2 are quantitative estimates reconciled with the whole-rock geochemistry: the dolomite and calcite proportions were derived by stoichiometric mass balance from the MgO and CaO contents (Table 3), and are consistent with integrated-intensity XRD quantification, the XRD patterns being used for phase identification. The geochemistry independently constrains these proportions: the calcitic varieties show CaO ≈ 54–56 wt.% with Mg/Ca ≈ 0.002–0.003, whereas the dolomitic varieties show MgO ≈ 14–16 wt.% with Mg/Ca ≈ 0.32–0.38, values that require dolomite to be the dominant carbonate (≈64%–74%). Full Rietveld refinement is recommended for future work where higher-precision absolute phase fractions are required.
Table 3.
Main oxide compounds (wt.%) and trace element content (ppm) in Afyon–İscehisar marble samples.
4.1.3. Scanning Electron Microscope Investigations
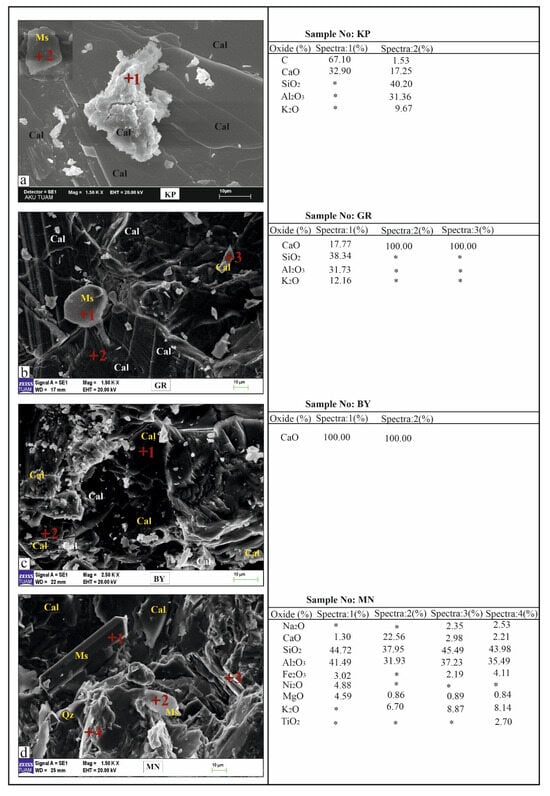
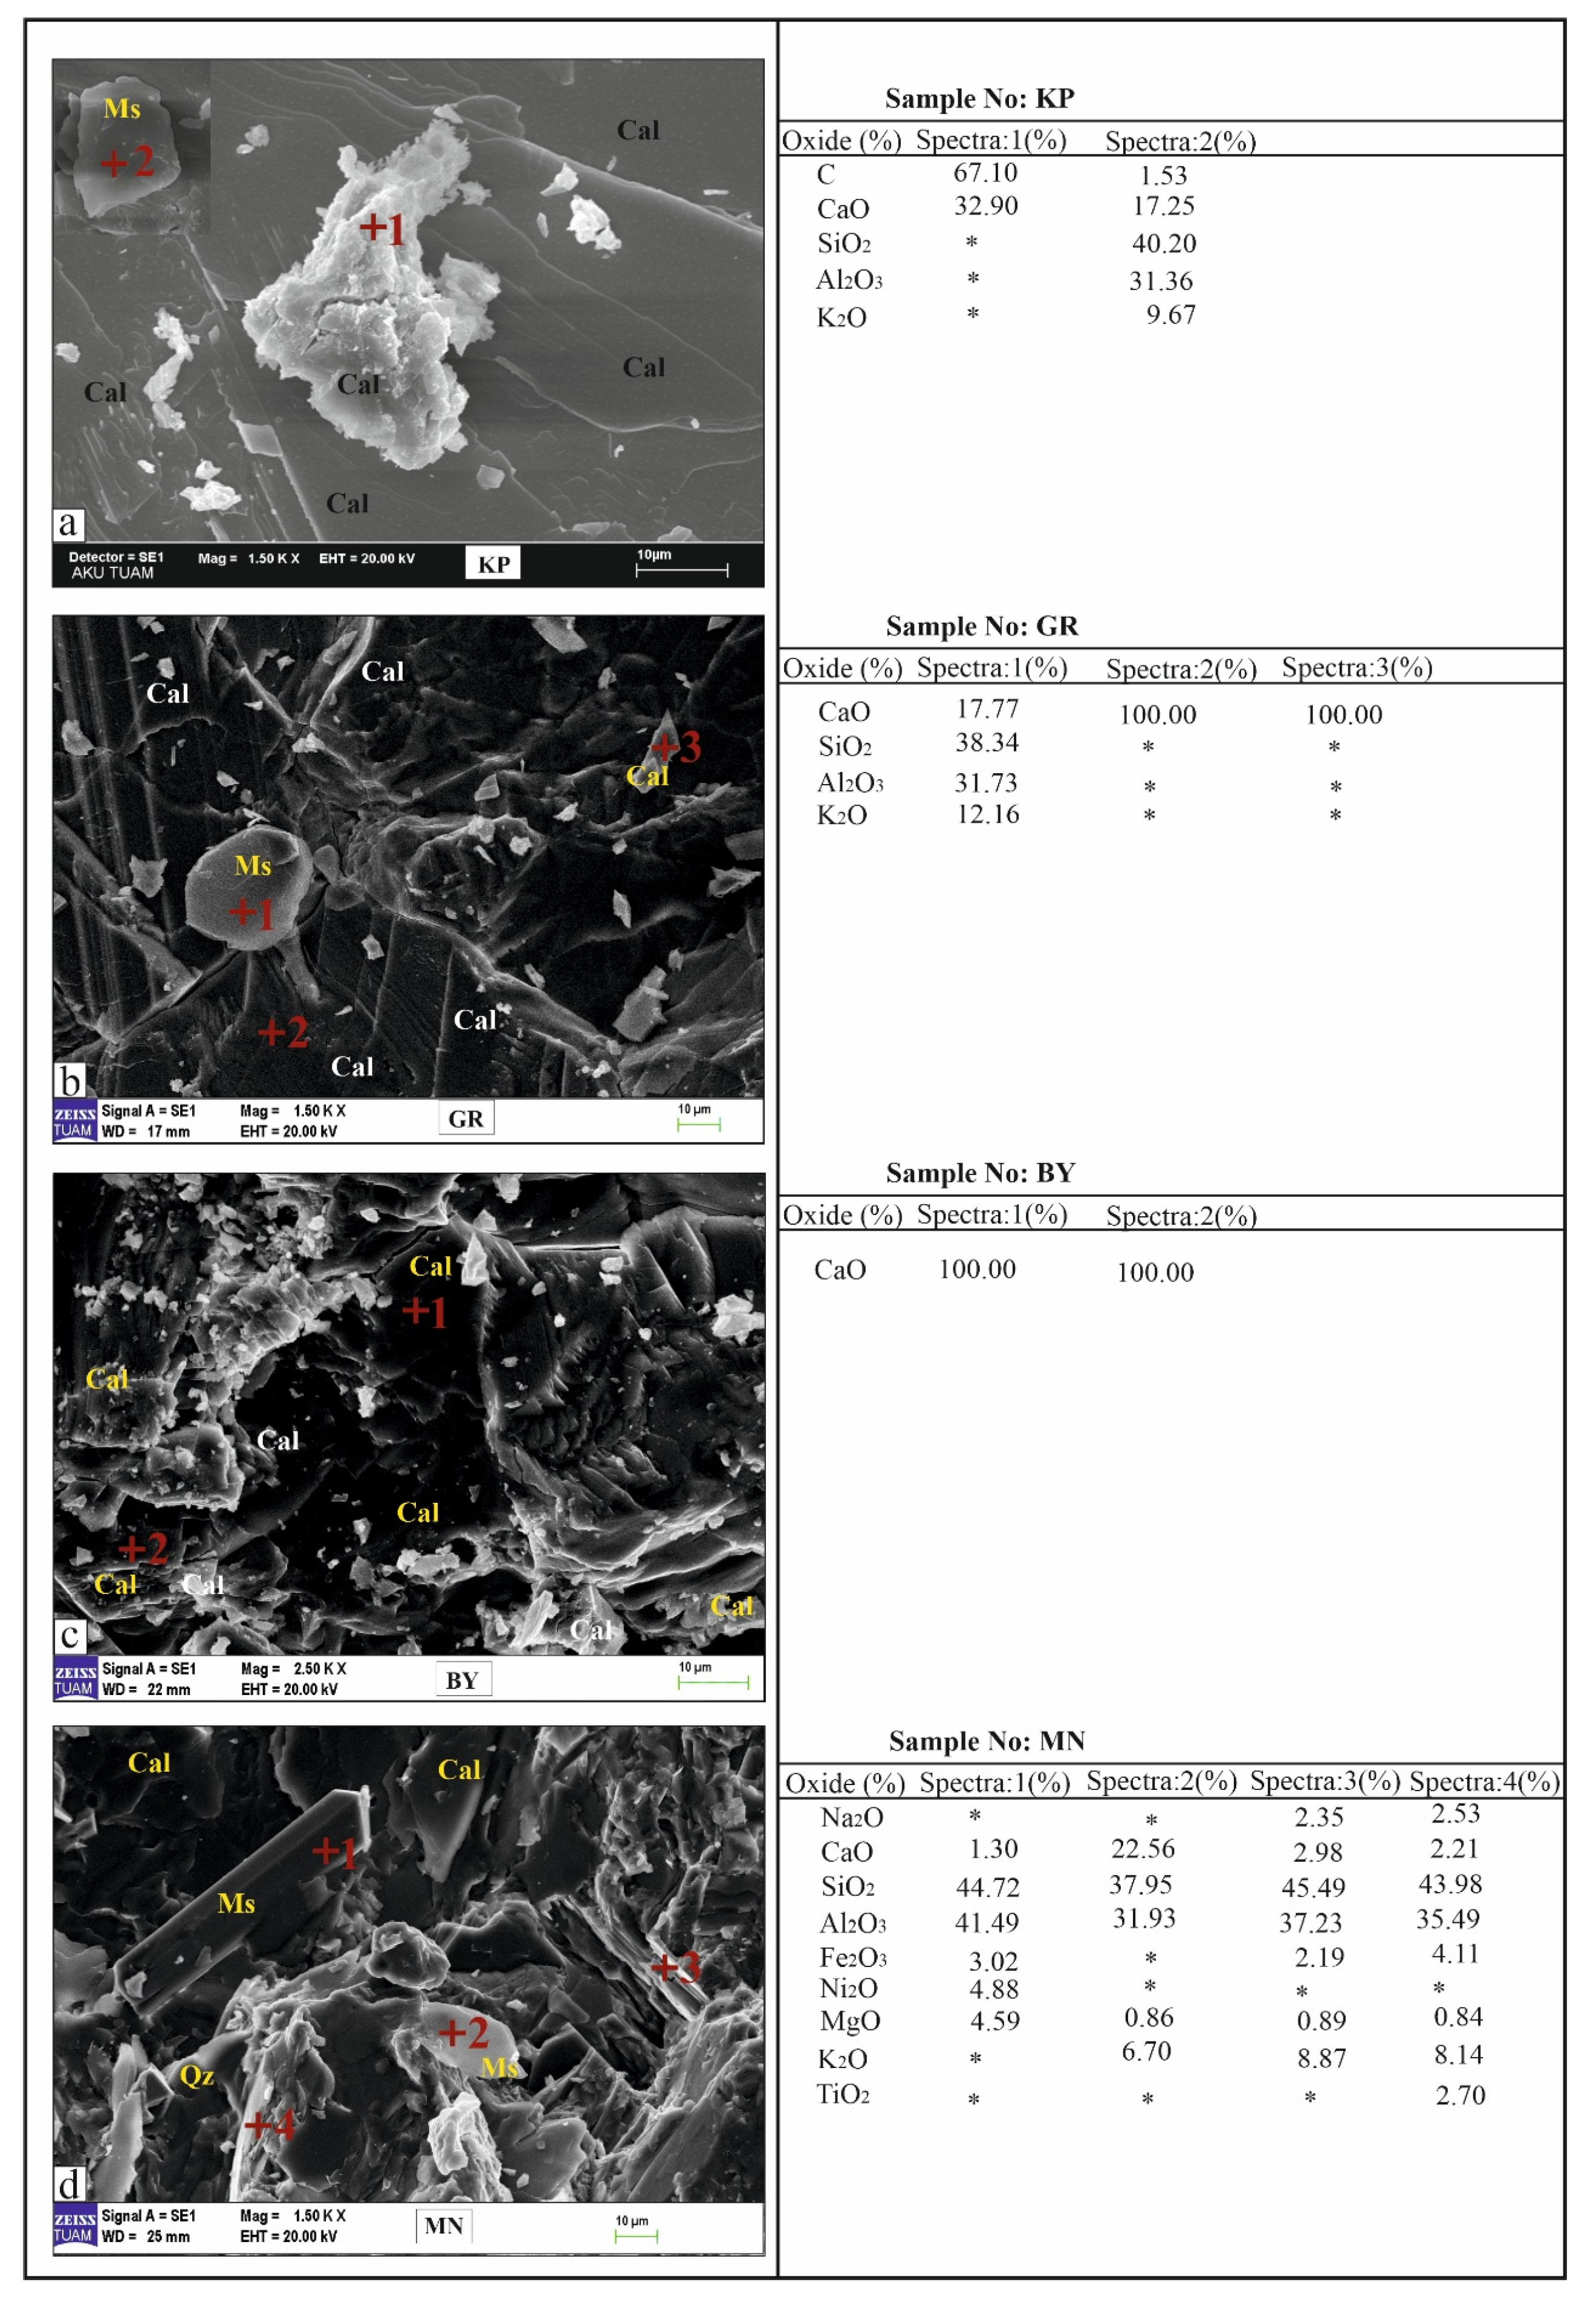
Scanning electron microscope (SEM) and energy-dispersive X-ray spectroscopy (EDX) analyses were performed on all samples, with the aim of revealing the microstructural and chemical features of the marble samples (Figure 9). While grain size, crystal shape, and surface morphology were determined with SEM analyses, the elemental composition of mineral phases was evaluated with EDX analyses. The data provide the opportunity to understand the textural homogeneity of samples and the correlations between mineral phases. SEM investigations revealed the microstructural features of marble samples, while EDX analyses determined the chemical composition of minerals, and the correlations between calcite and other mineral phases were evaluated. SEM/EDX investigations for marbles in the calcitic group revealed that calcite was the dominant mineral phase in the KP, GR, and BY marbles. In the KP sample, the carbon content in spectrum 1 was 67.10%, with a significant increase in carbon content. This was evaluated as being associated with the dark gray coloring observed in the rock (Figure 8a). On spectrum 2 of the same sample, values were SiO2 40.20%, Al2O3 31.36%, CaO 17.25%, C 1.53%, and K2O 9.67%. The EDX analyses indicated mica-group minerals (especially muscovite) with high SiO2, Al2O3, and K2O contents, accompanied by carbonate phases (probably calcite) with pronounced CaO and the presence of a low proportion of C (Figure 9a).
Figure 9.
SEM images and EDX analysis results for Afyon–İscehisar calcitic marble samples. (a) Calcite (Cal) crystals along with mica (Ms) in the KP sample. (b) Calcite (Cal) and occasional mica (Ms) in the GR sample. (c) Dominant calcite (Cal) crystals in the BY sample. (d) Calcite (Cal) along with mica (Ms) and quartz (Qz) minerals in the MN sample; *. not be determined.
EDX analysis of the GR-1 sample from the Afyon gray marble detected high rates of SiO2, Al2O3, and K2O in spectrum 1. Values were SiO2 38.34%, Al2O3 31.73%, CaO 17.77%, and K2O 12.16%. In this situation, the high SiO2, Al2O3, and K2O contents indicate mica-group minerals (especially muscovite), while the pronounced presence of CaO shows accompanying carbonate phases (probably calcite). On spectrum 2 and spectrum 3, the CaO value is 100%, confirming calcite as the dominant mineral in this rock (Figure 9b). In the BY-1 sample, spectrum 1 and spectrum 3 had a 100% CaO value, showing calcite as the main component (Figure 9c). For the MN sample, EDX point analysis obtained EDX measurements in four different spectra. Spectrum 1 contained the elements Ca, Si, Al, Fe, Mn, and Ti together, showing that these samples have a more complex mineralogical composition (Figure 9d). On spectrum 2, Ti content clearly increased, with limited increases observed in the Si, Al, and Fe values. Muscovite is characterized by Al, Si, Fe, and Mg content (Figure 9d). Additionally, the presence of needle-like manganese minerals within cavities in the samples was detected.
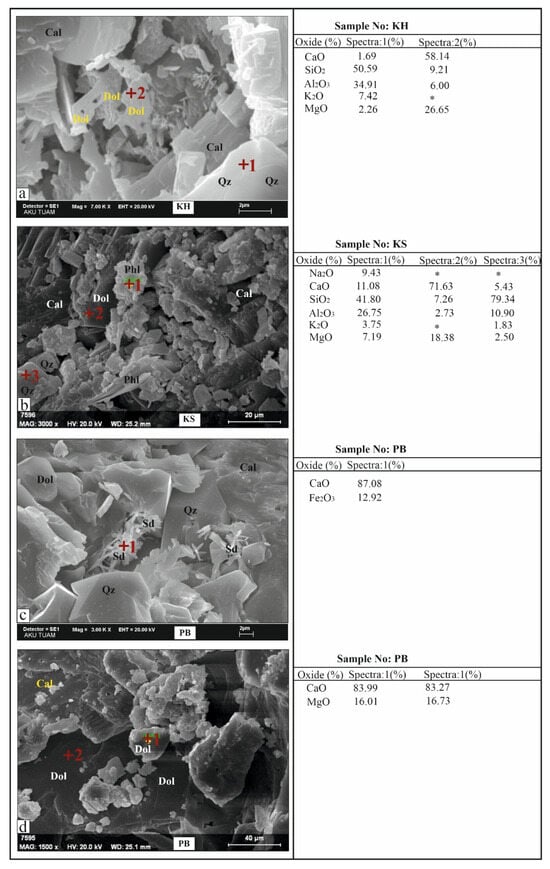
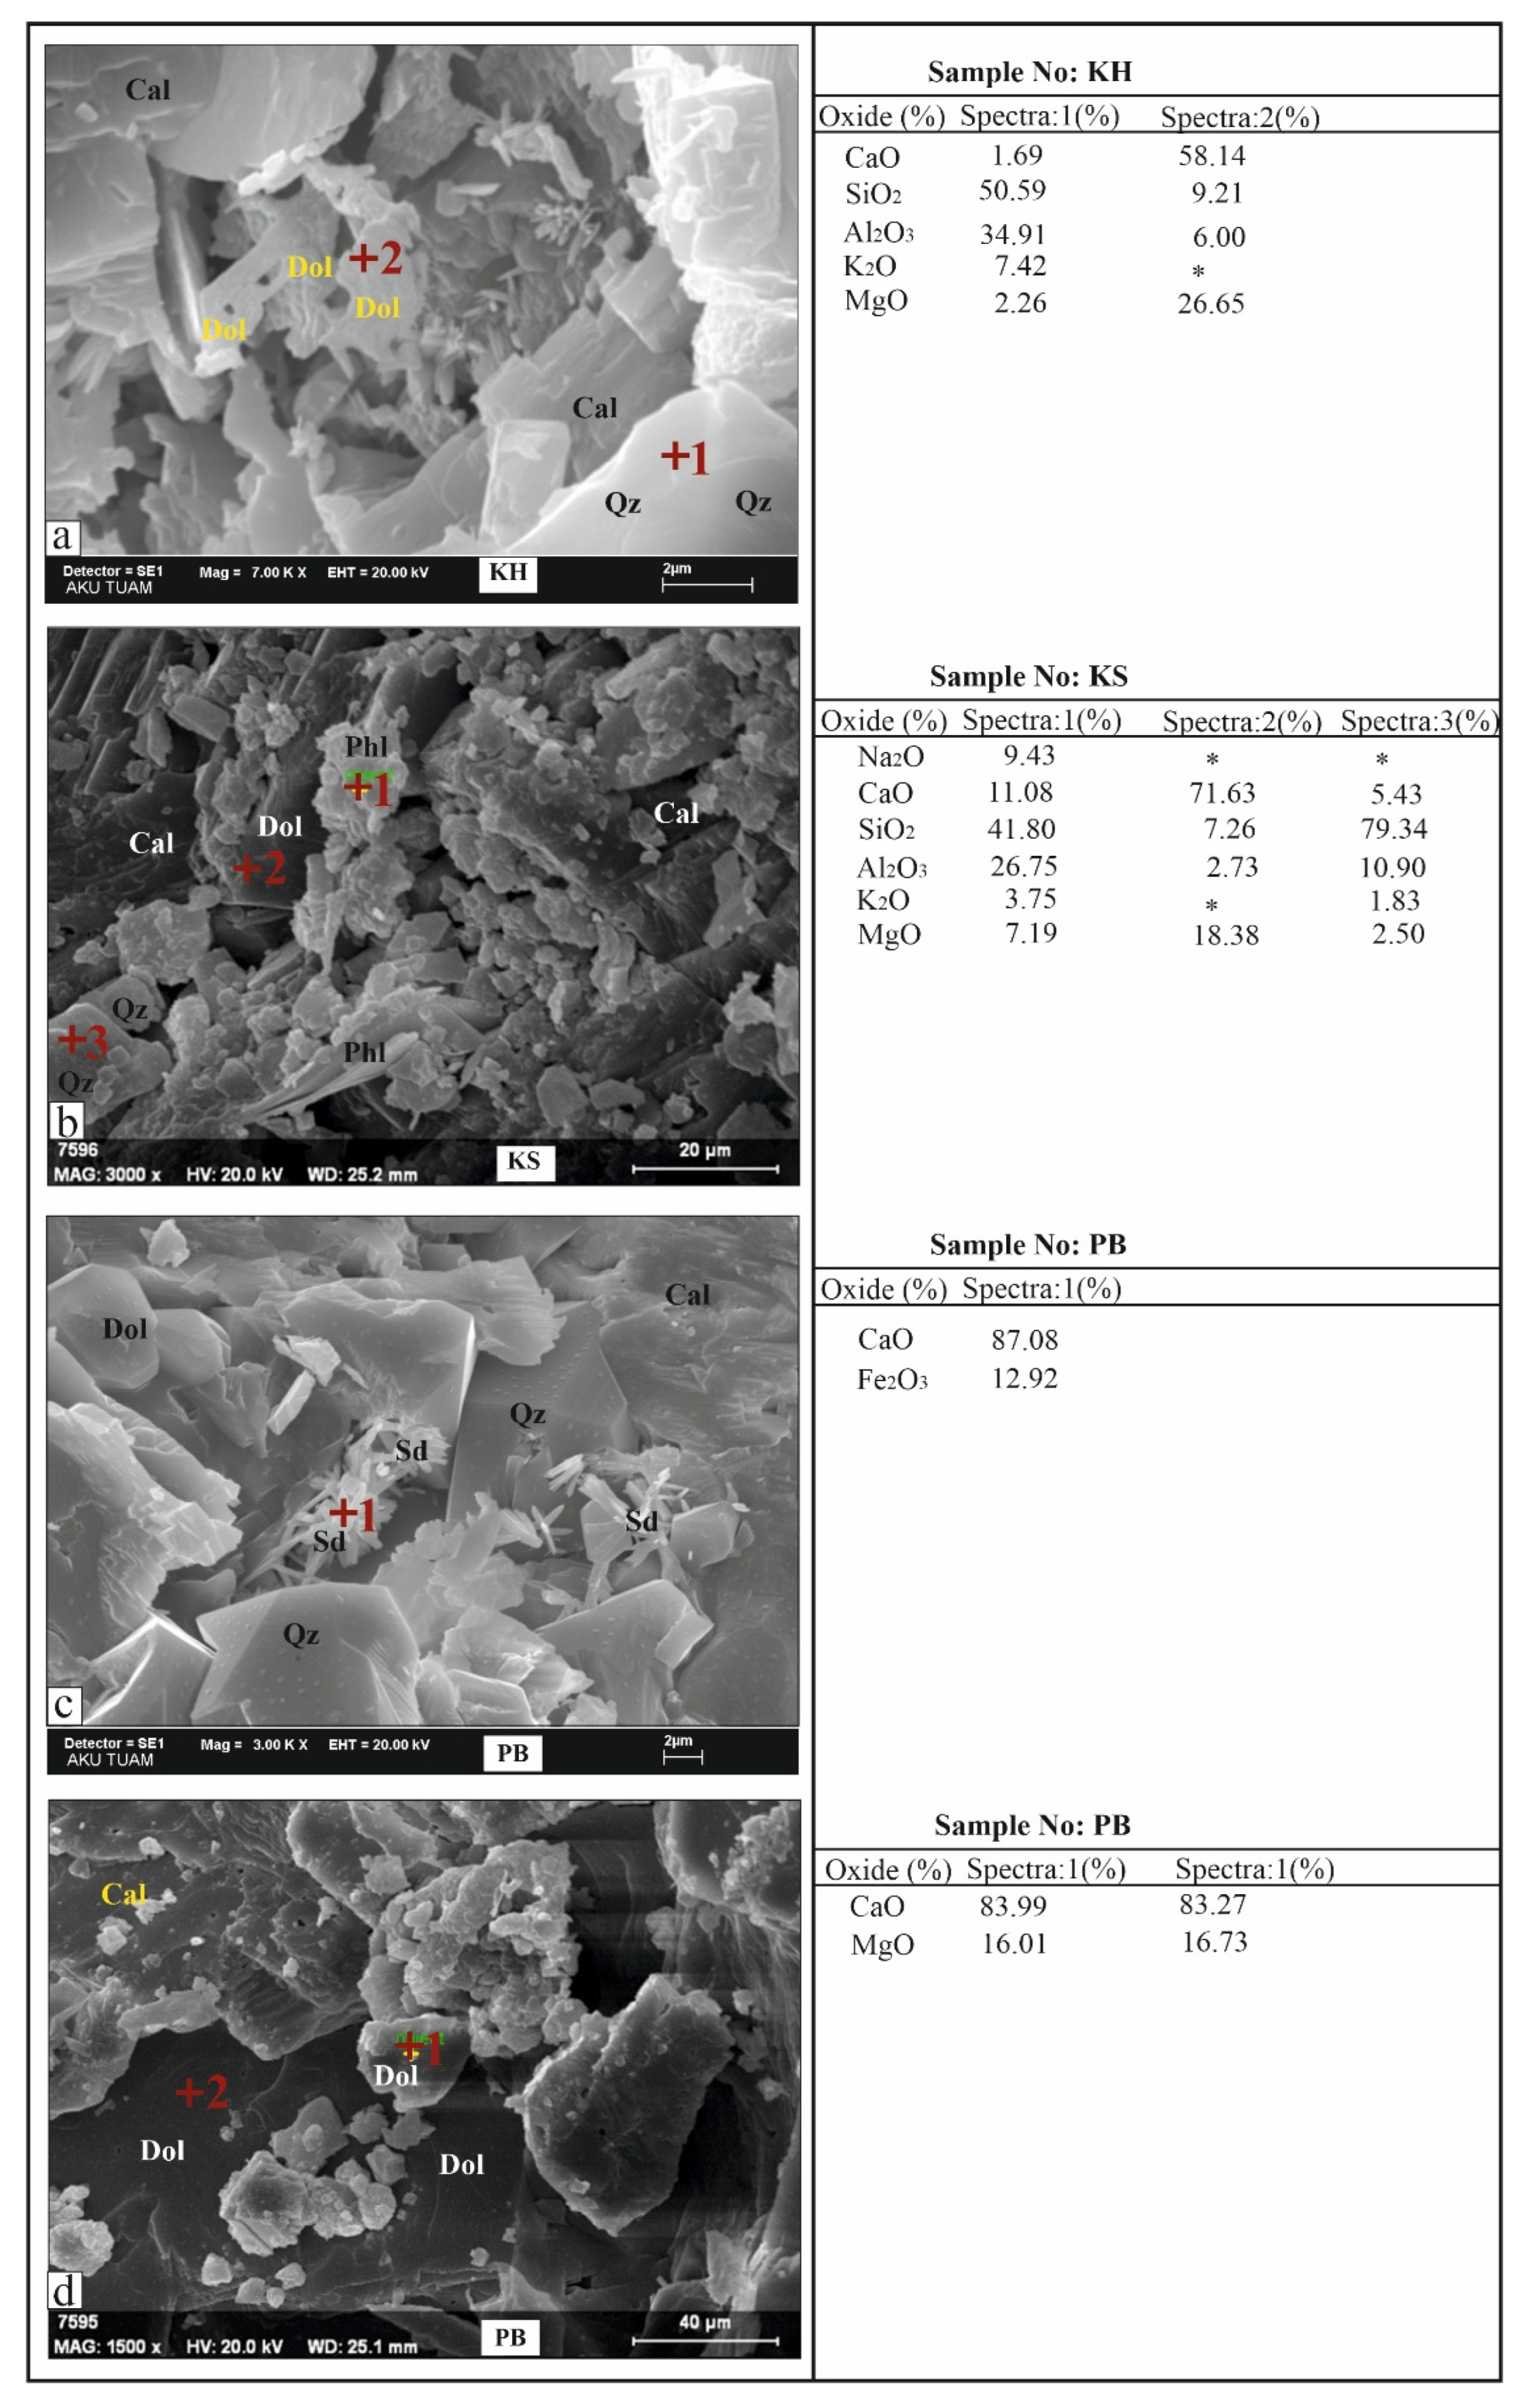
SEM/EDX analyses revealed clear variations related to color differences in the chemical composition of dolomitic marbles. KH marble veins were characterized by high SiO2 content varying from 9.21% to 50.59%, indicating the presence of silicate-rich phases. In these samples, Al, K, Mg, and lower rates of Na were also identified (Figure 10a). In KS marbles, the pronounced variability in CaO content is notable. Spectrum 1 contains 11.08% CaO, while spectrum 2 increased to 71.63% (Figure 10b). This large interval reflects the heterogeneous distribution of carbonate phases and occasional purification processes. PB marbles were distinguished by high Fe2O3 content (12.93%), different to other dolomitic marbles. This situation shows that the coloring is associated with iron oxide/hydroxide phases (Figure 10c,d). Common to all samples, thin, extended, and opaque mineral phases were observed as clustered aggregates within the rock matrix. Additionally, dolomitic marbles in general were determined to have 2.26%–25.25% MgO content, revealing the differences between the degree of dolomitization in the samples.
Figure 10.
SEM images and EDX analysis results for Afyon–İscehisar dolomitic marble samples. (a) Dolomite (Dol) and calcite (Cal) along with quartz (Qz) minerals in the KH sample. (b) Dolomite (Dol) and calcite (Cal), along with phlogopite (Phl) and quartz (Qz) in the KS sample. (c,d) Dolomite (Dol) and calcite (Cal) together along with occasional quartz (Qz) and other secondary phases in PB sample. *. not be determined.
4.2. Geochemical Investigations
Geochemical analysis results reveal that the marbles separate into two main groups in a pronounced way (Table 3). The KP, GR, BY, and MN samples had high CaO contents (≈54–56 wt.%) and very low MgO values (<0.3 wt.%), displaying a calcitic character. Contrary to this, the PB, KS, and KH samples have lower CaO values (≈35–37 wt.%) and high MgO contents (≈14–16 wt.%), reflecting a dolomitic composition. This differentiation is very plainly seen in the Mg/Ca ratios. The calcitic marbles are observed to have very low values (≈0.002–0.003), while this ratio is increased in the dolomitic marbles (≈0.32–0.38). When trace element content is investigated, the dolomitic samples had higher Sr values (≈113–146 ppm) compared to the calcitic samples; contrary to this, the Ba content displayed clear enrichment, especially in the KH sample. Compounds like SiO2, Al2O3, and Fe2O3 were found at low rates in all samples, showing that the carbonate phase was dominant and the siliciclastic contribution remained limited. These findings are consistent with the mineralogical and petrographic data, revealing that the İscehisar marbles differentiate into calcitic and dolomitic marbles and this differentiation is controlled by the Mg content and the degree of dolomitization.
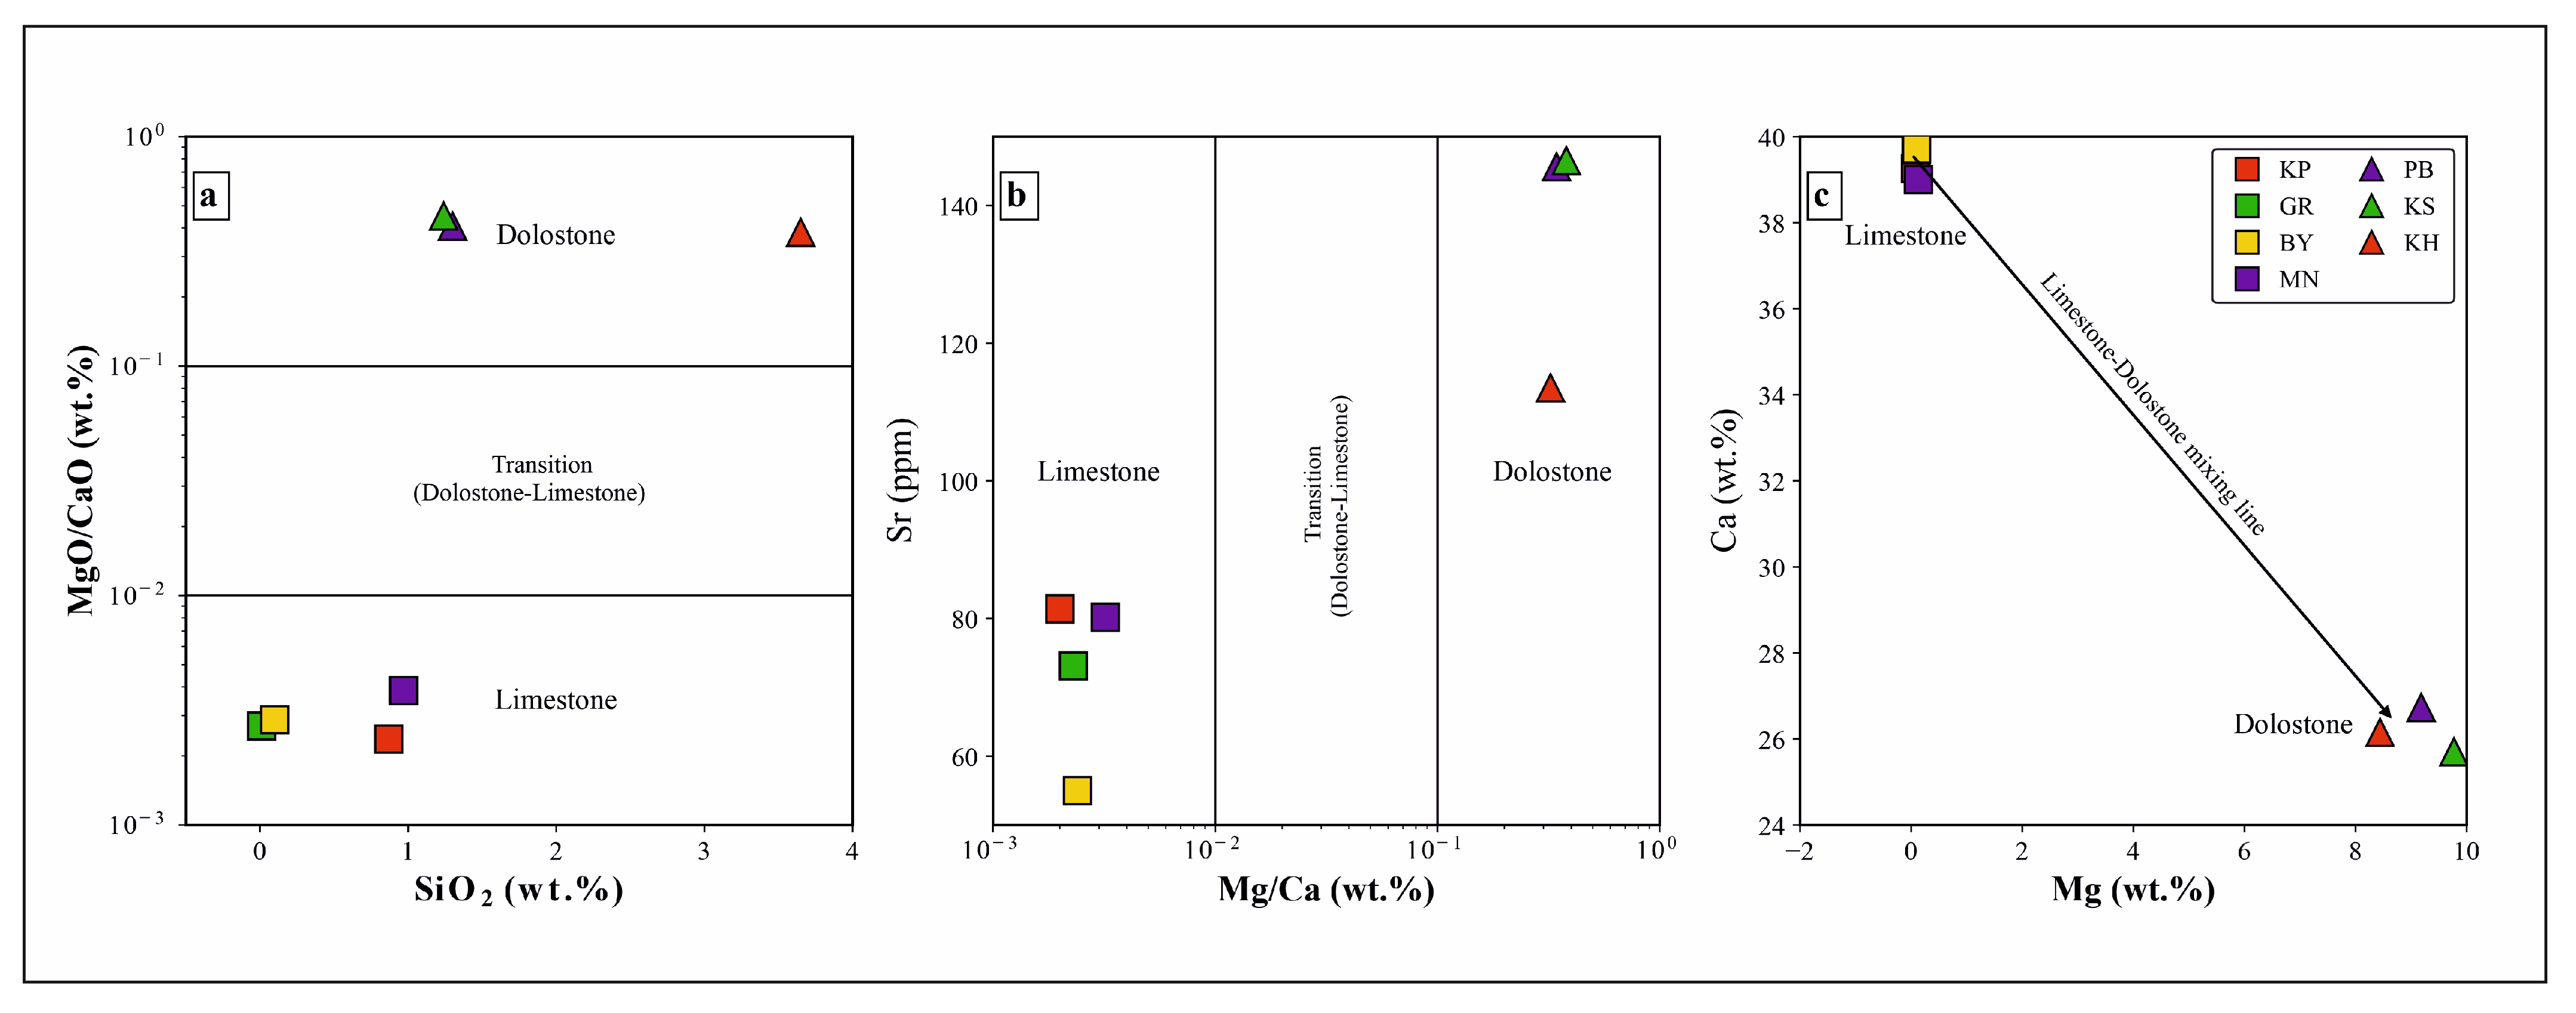
The geochemical classification diagrams shown in Figure 11 clearly show that the marble samples are separated into two main groups. On the SiO2–MgO/CaO diagram (Figure 11a), the KP, GR, BY, and MN samples are located in the limestone field with low MgO/CaO ratios, while the PB, KS, and KH samples are placed in the dolomite field with high MgO/CaO ratios. There is a clear but narrow transition between these two groups, showing that the samples display a sharp differentiation in chemical terms. Similarly, on the Sr–Mg/Ca diagram (Figure 11b), calcitic marbles cluster in the limestone field with low Mg/Ca and relatively low Sr contents, while dolomitic marbles are located in the dolomite field with high Mg/Ca ratios and increasing Sr values (Figure 11c).
Figure 11.
Geochemical classification diagrams for Afyon–İscehisar marble samples. (a) Distribution of samples in the limestone, transitional (dolostone–limestone), and dolomite (dolostone) fields on the SiO2 (wt.%)–MgO/CaO (wt.%) diagram. (b) Locations of the samples in the same classification fields on the Sr (ppm)–Mg/Ca (wt.%) diagram. (c) distribution of samples along the limestone-dolostone mixing line on the Ca (wt.%)–Mg (wt.%) diagram.
This distribution obtained from these diagrams is consistent with the table data, revealing that the degree of dolomitization in the İscehisar marbles is directly controlled by the Mg content, and that the calcitic–dolomitic differentiation is strongly supported geochemically.
4.3. Physical and Mechanical Properties
Physical and mechanical characterization of the Afyon–İscehisar marbles was conducted in accordance with the relevant European (EN) and international standards to establish baseline properties prior to salt spray exposure. These included apparent density and open porosity (Ref. [33]), water absorption at atmospheric pressure (Ref. [34]), uniaxial compressive strength (Ref. [35]), flexural strength under concentrated load (Ref. [36]), point load strength index (ISRM Suggested Methods), and wide-wheel abrasion resistance (Ref. [37], Method A). The obtained physical and mechanical test results are summarized in Table 4 and Table 5, respectively.
Table 4.
Physical properties of the İscehisar (Afyonkarahisar) marble samples.
Table 5.
Mechanical properties of the İscehisar (Afyonkarahisar) marble samples.
Physical and mechanical properties play important roles in determining the suitability of marbles for different uses. The results show that all samples of both calcitic and dolomitic Afyon–İscehisar marbles have densities with values very close to each other. Similarly, water-holding values are very close to each other.
The KH marble sample from the dolomitic marbles has the highest water-holding capacity, with a value of 0.579%. Porosity values are from 0.299% to 0.434% for marble samples of the calcitic type, while values are from 0.386% to 1.509% for marbles in the dolomitic group. These low values for the physical properties positively impact the mechanical properties. When compressive strength, included in mechanical properties, is investigated, values were determined as from 160.13 to 189.16 MPa for samples in the dolomitic group, while values were from 89.93 to 92.80 MPa for samples of the calcitic type. This shows that samples of Afyon–İscehisar marble of the dolomitic type have higher strength. Similarly, the results regarding flexural strength and point load strength were the same. For weathering resistance values, with an increase in strength, the weathering values for the dolomitic marbles had lower values compared to calcitic samples. Generally, rocks with low porosity and water-holding capacity are known to be more resistant to weathering processes. The water-holding capacity of the marble samples being less than 1% shows that the amount of weathering will be limited. Wide-wheel abrasion resistance (Ref. [37]) shows the same calcitic–dolomitic contrast: the abrasion values range from 18.45 mm (PB) to 21.75 mm (GR), with the dolomitic marbles (KH, KS, PB: 18.45–19.57 mm) more resistant than the calcitic marbles (BY, KP, MN, GR: 20.44–21.75 mm), consistent with their higher strength and indicating better suitability for abrasion-prone service conditions such as flooring.
4.4. Resistance to Aging by Salt Mist
4.4.1. Mass Change
One of the most important parameters in weathering processes of Afyon–İscehisar marbles is mass change. In this study, the weight change related to the salt mist degradation test was calculated for marble samples. The weight changes obtained for each sample are listed in Table 6.
Table 6.
Mass data and variations in samples before and after salt mist treatments.
When Table 6 is investigated, the mass variation in marble samples exposed to degradation cycles with salt mist appeared to vary from 0.02% to 0.01%. The mass changes were uniformly small across all samples (~0.01%–0.02%) and showed no systematic relationship with porosity, indicating that only a very small amount of salt was taken up during the salt mist cycles. However, no clear salt accumulation was observed on the surface at macro scale after 60 cycles related to the effect of salt mist for the marble samples used in this study. When evaluating studies in the literature on the degradation behavior of building stones under the influence of salt vapor, it is observed that the mass losses of different rock groups under salt influence vary over a wide range. For example, Silva and Simão [44], after applying a 14-cycle degradation process to silicate (granite, syenite, gabbro, and basalt) and carbonate (limestone and marble) rock groups, reported mass loss rates ranging from 0.05% to 0.70% in silicate rocks and from 0.05% to 5.50% in carbonate rocks. The higher loss rates observed in carbonate-based rocks are consistent with the carbonate origin of the marble samples used in our study. Similarly, other studies examining the stability of carbonate-based rocks such as limestone and marble under salt influence also support the findings obtained. Carvalho et al. [30] found that, as a result of 60 salt spray aging cycles on six different limestone samples, mass loss values varied between 0.1% and 0.4%. Relative to these literature ranges, the mass changes measured here (~0.01%–0.02%; Table 6) are very low—about an order of magnitude below the values typically reported for carbonate stones and marbles—indicating that the Afyon–İscehisar marbles are highly resistant to salt-mist-induced mass loss.
4.4.2. Color Changes
Color is one of the most characteristic and visible features affecting the use of marbles in certain structures. If exposed to real environmental effects in outdoor spaces, changes to or lightening of the colors compared to the original color of the rock related to weathering of minerals contained in the stone are dealt with as color changes. Another important physical parameter in the degradation processes related to the effect of salt mist for the Afyon–İscehisar marbles is color change. In this study, color differences between marble samples before and after the salt mist test were calculated as ΔL, Δa, Δb, and total color difference value ΔE using Equations (2) and (3), with the aim of determining the color changes. The data are given in Table 7.
Table 7.
Color parameter values.
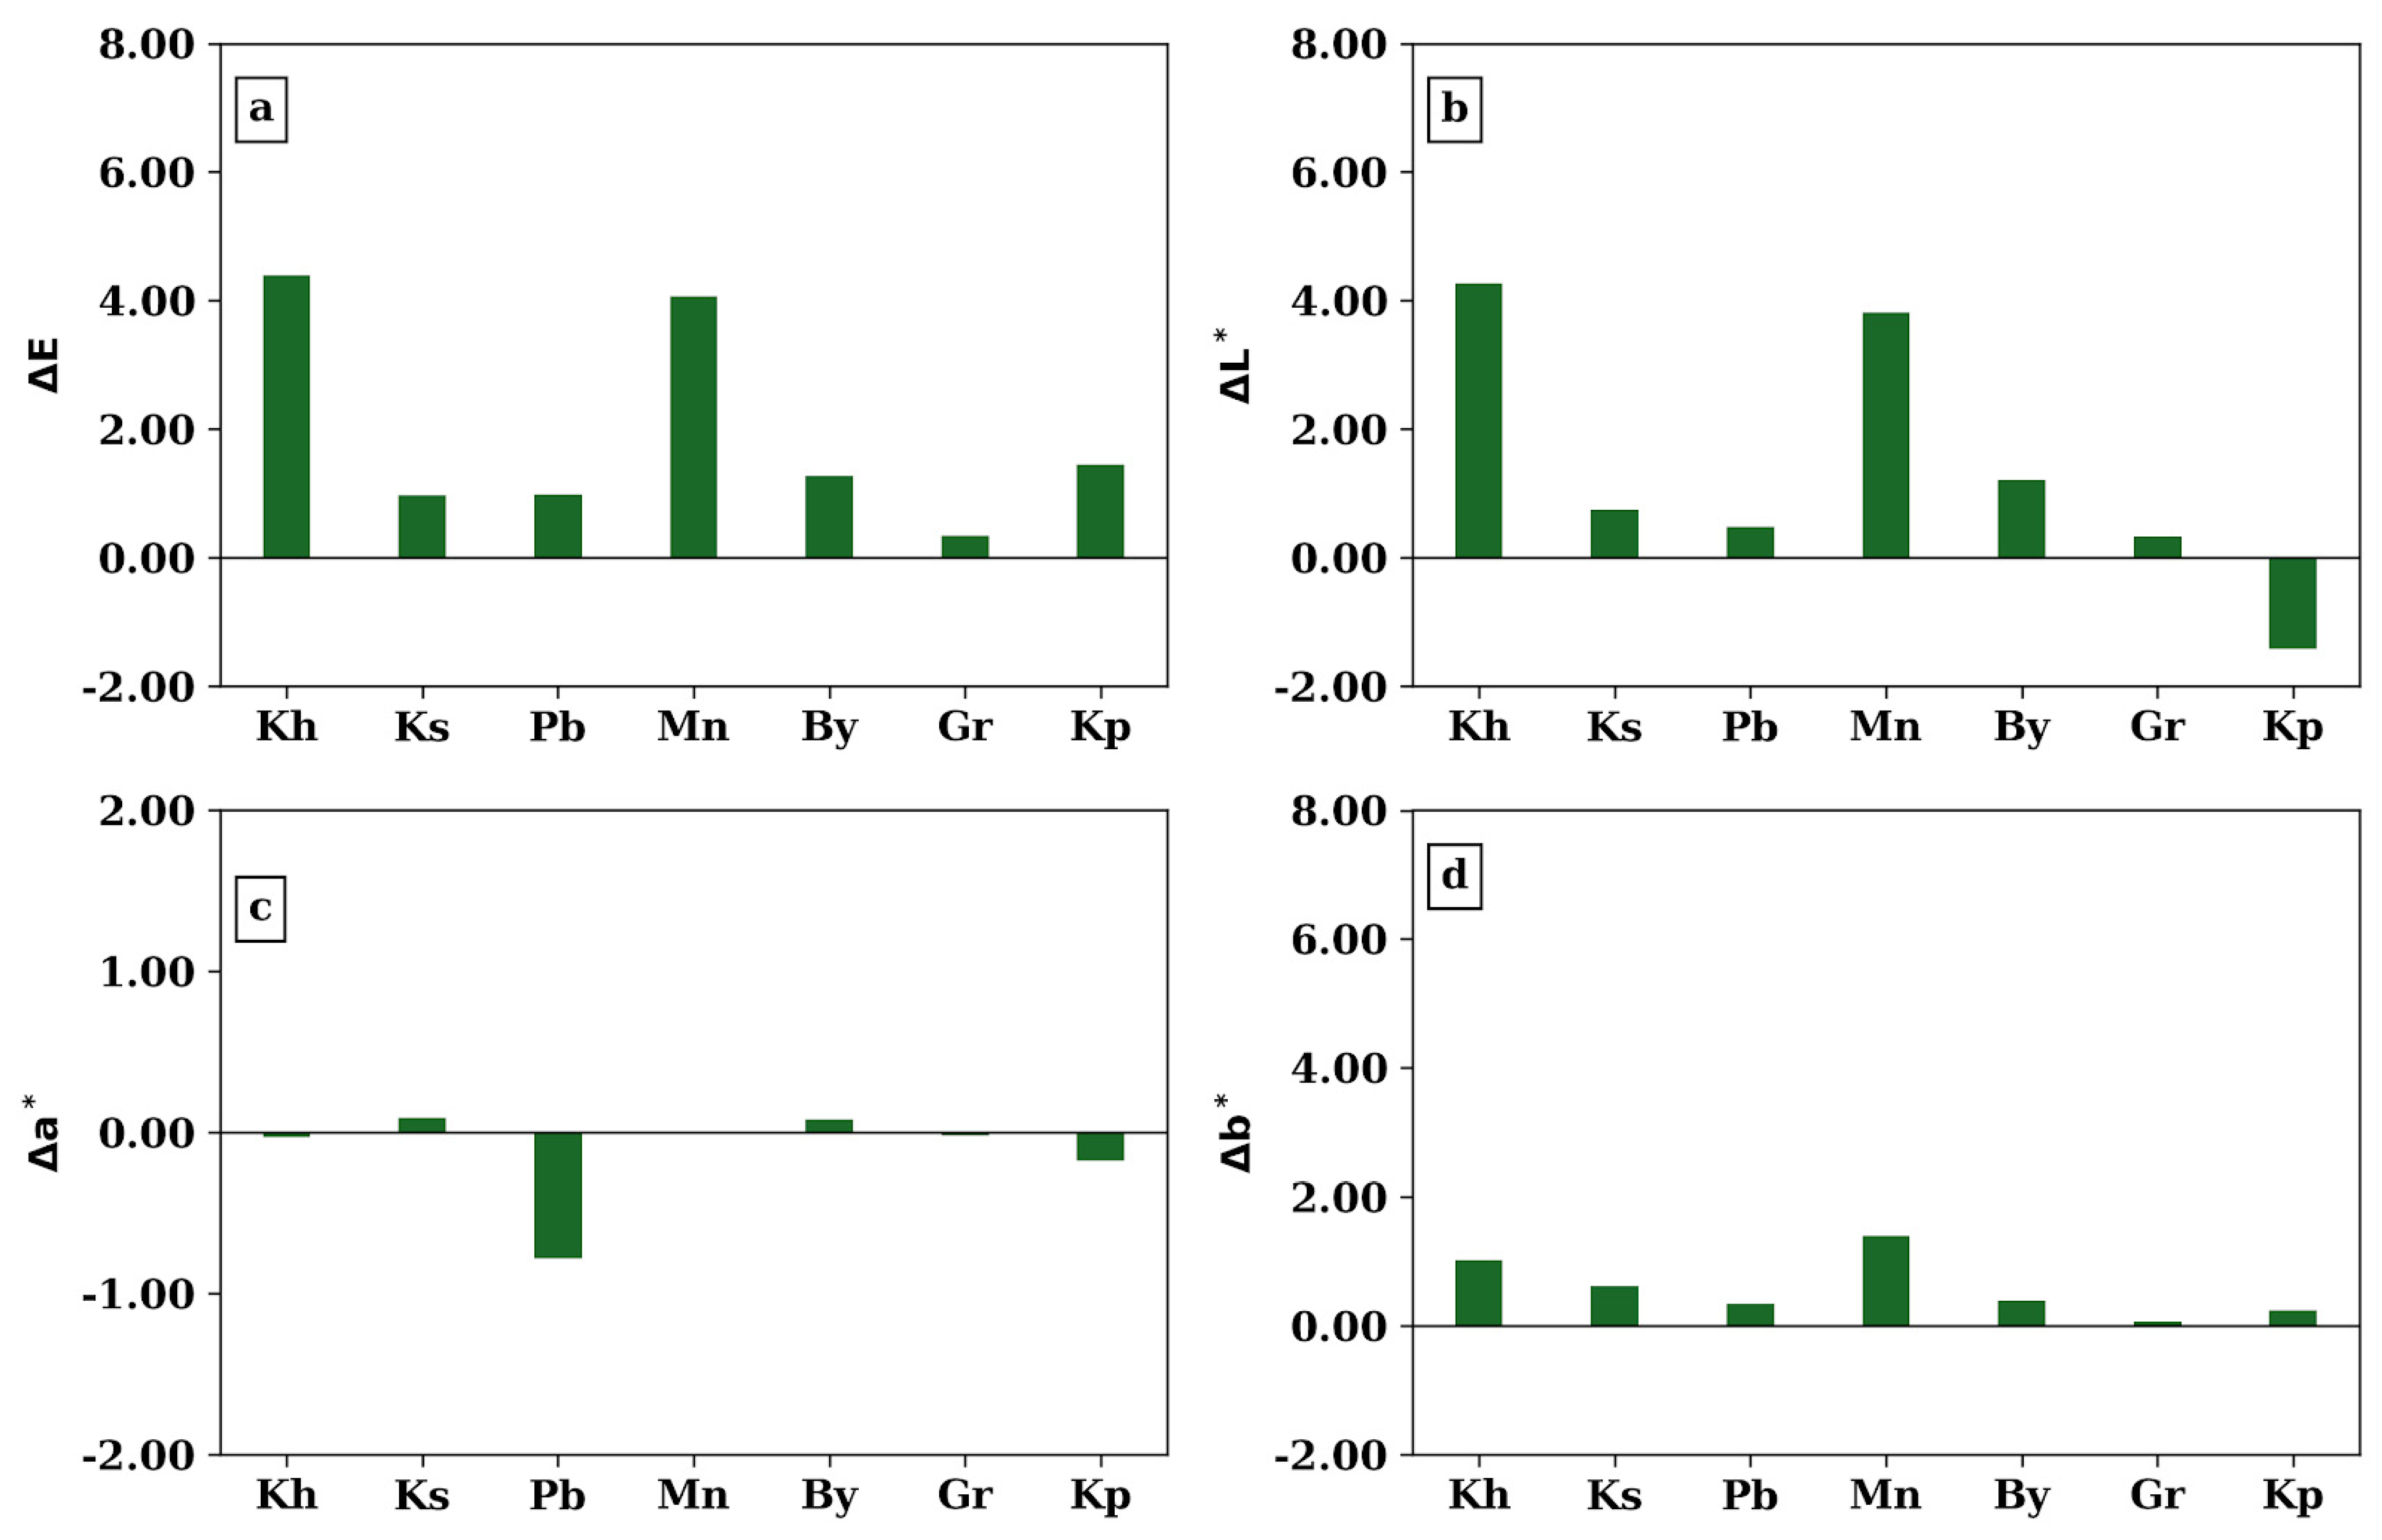
The total color differences related to the effect of salt mist are shown in Figure 12a. Among the samples, KH and MN samples had values above the color perceptibility threshold (∆E* > 3.5) of 4.39 and 4.06, respectively [45,46]. The total color differences obtained do not show how the colors of the samples change. They only indicate the magnitude of the total color variation between samples. The fact that the values obtained in the KH and MN samples exceed this threshold confirms that the applied processes lead to a significant visual change at the macroscopic level on the sample surface. Exceeding the perception threshold is a result of intra-matrix mineralogical alterations and/or micro-scale textural damage (cracking that alters light reflection properties) occurring in the sample matrix. When evaluated in terms of physical durability parameters, the color change exceeding the perception threshold indicates a decrease in the long-term surface performance of the material.
Figure 12.
(a) ∆E color change, (b) ∆L color change, (c) ∆a color change, (d) ∆b color change.
The ∆L value positively increases toward whiteness and negatively decreases toward darkening. When Figure 12b is investigated, the KP sample from the Afyon–İscehisar marbles darkened in color, with a negative reduction. All other samples in the study had positive increases in ∆L values. While the KH sample had the highest increase to 4.27, the GR sample had the lowest increase to 0.33. When the ∆a and ∆b parameters are investigated, the ∆a values only increased in the KS and BY samples, while they were reduced for the other samples (Figure 12c,d). The variation interval was very low. For the ∆b color value, all samples had positive increases.
However, the variations in both the ∆a and ∆b color parameters show that there was not much differentiation in the color of the Afyon–İscehisar marbles. The effect of salt mist tends to change the color of the stone surface. However, a significant variation did not occur in the Afyon–İscehisar marbles in this study. Some researchers stated that carbonaceous stones exposed to the atmosphere gain a yellowish appearance, and color changes are due to mineralogical variations or other processes like erosion [46,47,48].
4.5. Ultrasonic Pulse Velocity (UPV) Changes
Ultrasonic techniques are commonly used both in the field and in the laboratory for the determination of rock properties, due to being non-destructive and easy to apply. In recent years, ultrasonic measurements have gained importance as non-destructive tools to assess structural damage in historical buildings and art pieces. This method provides a measurement method for the degree of damage caused due to erosion and degradation [49,50]. In this study, UPV measurement results before and after the salt mist test are given in Table 8 and Table 9 with the aim of determining the change related to the salt mist effect.
Table 8.
UPV results obtained initially for each specimen of each marble (mean velocities and the percentage changes reported in the text were calculated from the raw m/s measurements).
Table 9.
UPV results obtained after the salt mist test (60 cycles) for each specimen of each marble (mean velocities and the percentage changes reported in the text were calculated from the raw m/s measurements).
The KH sample from the dolomitic marbles had mean UPV values that lowered from 5.43 km/s to 5.10 km/s. The reduction in the KH sample was thus 6.15%. However, the UPV values for the KS and PB samples from the same group increased. This increase was 1.89% for the KS sample and 6.01% for the PB sample. When the UPV values for samples from the calcitic marbles are investigated, the KP sample had a UPV of 4.27 km/s before the salt mist test, and 4.54 km/s after the test. As a result, the UPV increase was 6.41% in the KP sample, related to the salt mist effect. For the MN sample, the value was 5.11 km/s before the test and 4.95 km/s after the test. For the BY sample, values were 4.48 km/s before the test and 4.41 km/s afterwards. For the GR sample, the UPV before the test was 5.12 km/s, while the value was 4.35 km/s after the test. According to this data, the greatest decrease in UPV value was observed in the GR sample with 15.15%, followed by the KH sample with 6.15%, the MN sample with 2.99%, and the BY sample with 1.72%.
When the correlations between the UPV variations and the mineralogical–microstructural features of the İscehisar marble samples are investigated, the changes were shown to be due to the mineral composition, degree of dolomitization, and microstructural discontinuities. In a study by Siegesmund and Dürrast [50], they emphasized that reductions occurred in UPV values in natural stones exposed to salt crystallization and environmental degradation processes. This is consistent with the reductions in UPV value observed in the KH sample from the dolomitic marbles and the MN, BY, and GR samples from the calcitic marbles. The high rate of UPV variation observed in the GR sample especially shows an advanced level of degradation. This reduction indicates structural damage and formation of internal flaws. Additionally, increases in UPV were seen to occur after the salt effect. These increases can be explained by partial filling of material pores with salt crystals and increases in continuity of the wave propagation path. In this study, the UPV increases identified in the KS, PB, and KP samples overlap with this mechanism described in the literature [51,52,53]. This microstructural heterogeneity observed in the İscehisar marbles reflects differences in UPV values with mineralogical phase changes and maximum grain-size distribution. In conclusion, UPV was confirmed to be a reliable and sensitive non-destructive test method for the determination of structural changes related to environmental effects like salt mist.
The negligible mass change (≤0.02%) and the measurable UPV changes are not contradictory but both follow from the very low porosity of the marbles: the amount of salt that can be taken up is inherently small, so it alters the bulk mass by an amount close to the balance resolution, yet the same small amount—by partially filling, or conversely by exploiting, a few micropores and microcracks—is sufficient to change the ultrasonic wave-path continuity measurably, UPV being far more sensitive than bulk mass to such micro-scale changes. The divergent UPV responses at essentially constant mass therefore indicate that the process is governed by microstructure rather than by the absolute quantity of salt taken up.
The largest velocity decrease, recorded in the low-porosity GR marble, is attributed to the two coexisting families of discontinuities identified within its granoblastic fabric (Figure 5b): a network of matrix micro-veins and well-developed polysynthetic twin lamellae within the calcite crystals. These intergranular and intracrystalline planes of weakness provide preferential paths for micro-fracture opening and propagation during the salt cycles, so that in a stone of very low porosity, the UPV response is controlled by pre-existing discontinuities rather than by bulk pore volume, consistent with discontinuity- and microfabric-controlled velocity losses reported for compact carbonate stones and marbles [54,55]. This attribution is inferred from the macroscopic UPV trend and the observed baseline petrographic fabric, and would require post-exposure microstructural imaging for direct confirmation.
5. Conclusions
In this study, the aim was to determine weight changes, color changes, and UPV changes with the effect of salt mist, paying attention to the mineralogical–petrographic features, geochemical characteristics, and physical and mechanical properties of the Afyon–İscehisar marbles, divided into two groups of calcitic and dolomitic marbles according to mineralogical composition. Based on experimental results, the main results obtained in this study are as follows:
- (i)
- Microscopic investigations showed that calcite was the dominant mineral phase in the calcitic marbles and dolomite in the dolomitic marbles, though clear mineralogical and textural differences were observed in both calcitic and dolomitic marble samples. Microstructural heterogeneity, mineralogical phase changes, and maximum grain-size distribution are basic elements directly determining both performance parameters for modern engineering projects and the sensitivity of archeometric identification of use in ancient periods.
- (ii)
- XRD analysis, supported by whole-rock geochemistry, showed a calcite proportion of 96–99% in calcitic marbles samples, while the dolomite content generally remained under 1%. Contrary to this, samples representing dolomitic marbles had dolomite proportions of 64–74%, while in some samples calcite and dolomite together comprised the dominant phases. This reveals that the carbonate rocks in the study area vary mineralogically from calcitic to dolomitic.
- (iii)
- Geochemical classification diagrams show that the marble samples are clearly clustered into two main groups. This distribution obtained from the diagrams reveals that the degree of dolomitization of İscehisar marbles is directly controlled by the Mg content, and that the calcitic–dolomitic differentiation is strongly supported geochemically.
- (iv)
- The weight change related to the salt mist effect in the Afyon–İscehisar marbles was uniformly small across all samples (~ 0.01–0.02%). In all samples, the weight variation values show that no material loss occurred in any of the marbles with the effect of salt mist.
- (v)
- Related to the effect of salt mist, the ∆L, ∆a, and ∆b values of the marbles were affected. Among the samples, the ∆E (total color difference) values were 4.39 and 4.06 for the KH and MN samples, respectively, above the color perceptibility threshold. The ∆L value increased in all samples, apart from the KP sample. The ∆a parameter increased in the KS and BY samples, while it was reduced in the other samples. For the ∆b parameter, increases were observed in all samples. However, it was determined that these increases and reductions did not cause differentiation of the colors.
- (vi)
- When the UPV values related to the salt mist effect were investigated, the reduction identified for the KH sample from the dolomitic marbles was 6.15%. However, the KS and PB samples from the same group were identified to have increased UPV values. These increases were 1.89% in the KS sample and 6.01% in the PB sample. When UPV values for samples from the calcitic marbles were investigated, the UPV increase was 6.41% in the KP sample, related to the salt mist effect. However, reductions occurred in the UPV values for samples in this group. The highest reduction was 15.15% in the GR sample. It is thought that the reduction in this value was due to the micro-vein systems identified within the granoblastic texture of the GR sample being affected by the salt mist cycles.
- (vii)
- The results of this study provide important benefits for the use and preservation of Afyon–İscehisar marbles as a construction material by determining the changes in these marbles with the salt mist effect.
Author Contributions
M.B.: Project administration, Investigation, Formal Analysis, Methodology, Resources, Writing—Original Draft. S.Ç.: Methodology, Investigation, Formal Analysis, Writing—Original Draft, Writing—Review and Editing. All authors have read and agreed to the published version of the manuscript.
Funding
This study was funded by the Coordinatorship of Scientific Research Projects of Afyon Kocatepe University (AKU-BAP) under Project No: 15.MUH.11.
Data Availability Statement
Data are contained within the article.
Acknowledgments
The authors gratefully acknowledge AKU-BAP for financial support of the field and laboratory work. The authors also thank the marble quarry managers for granting permission to conduct geological investigations in their quarries and for allowing access to their facilities.
Conflicts of Interest
The authors declare no conflicts of interest.
Abbreviations
The following abbreviations are used in this manuscript:
| UPV | Ultrasonic Pulse Velocity |
| SEM | Scanning Electron Microscopy |
| EDX | Energy-Dispersive X-ray Spectroscopy |
| XRD | X-Ray Diffraction |
| NaCl | Sodium Chloride |
| ΔL, Δa, Δb | CIELAB color coordinate differences (lightness; red–green; yellow–blue) |
| ΔE | Total color difference |
| TS EN | Turkish Standard—European Norm |
References
- Moropoulou, A.; Delegou, E.T.; Apostolopoulou, M.; Kolaiti, A.; Papatrechas, C.; Economou, G.; Mavrogonatos, C. The white marbles of the Tomb of Christ in Jerusalem: Characterization and provenance. Sustainability 2019, 11, 2495. [Google Scholar] [CrossRef] [Scilit]
- Yüzer, E.; Güngör, Y.; Angı, S. Doğal Taş Deyince; Granitaş Kültür Yayınları: Istanbul, Türkiye, 2008. (In Turkish) [Google Scholar]
- Koch, G.; Sichtermann, H. Römische Sarkophage; C.H. Beck: Munich, Germany, 1982. [Google Scholar]
- Waelkens, M. Dokimeion. Die Werkstatt der Repräsentativen Kleinasiatischen Sarkophage. Chronologie und Typologie ihrer Produktion; Archäologische Forschungen, Bd. 11; Gebr. Mann Verlag: Berlin, Germany, 1982. [Google Scholar]
- Korkut, T.; Dirican, M. Pamphylia ve Phrygia Bölgeleri Roma Dönemi Lahit Üretim Merkezleri ve Atölye Sorunları. TÜBA-AR 2020, 27, 241–262. (In Turkish) [Google Scholar] [CrossRef] [Scilit]
- Attanasio, D.; Bruno, M.; Prochaska, W. The Dokimeion marble of the Ludovisi and Capitoline Gauls and other replicas of the Pergamene Dedications. Am. J. Archaeol. 2011, 115, 575–587. [Google Scholar] [CrossRef] [Scilit]
- Herrmann, J.J.; Tykot, R.H. Some products from the Docimium quarries: Craters, tables, capitals, and statues. In Proceedings of the ASMOSIA VII, 7th International Conference of the Association for the Study of Marble and Other Stones in Antiquity; Maniatis, Y., Ed.; Bulletin de Correspondance Hellénique Supplément 51; École française d’Athènes: Athens, Greece, 2009; pp. 59–75. [Google Scholar]
- Çelik, M.Y.; Sert, M. The significance of Afyon Violet Marble (İscehisar-Afyonkarahisar) from the Roman age until today, its characterisation, and evaluation of durability by salt crystallization and freezing-thawing tests. J. Polytech. 2021, 24, 785–796. (In Turkish) [Google Scholar] [CrossRef] [Scilit]
- Steiger, M.; Charola, A.E. Weathering and deterioration. In Stone in Architecture, 4th ed.; Siegesmund, S., Snethlage, R., Eds.; Springer: Berlin/Heidelberg, Germany, 2011; pp. 227–316. [Google Scholar] [CrossRef] [Scilit]
- Charola, A.E. Understanding and managing stone decay. J. Am. Inst. Conserv. 2004, 43, 190–192. [Google Scholar] [CrossRef] [Scilit]
- Charola, A.E. Salts in the deterioration of porous materials. J. Am. Inst. Conserv. 2000, 39, 327–343. [Google Scholar] [CrossRef]
- Doehne, E. Salt weathering: A selective review. Geol. Soc. Lond. Spec. Publ. 2002, 205, 51–64. [Google Scholar] [CrossRef] [Scilit]
- Simon, S.; Drdácký, M. (Eds.) European Research on Cultural Heritage (State of the Art Studies, 5): Problems of Salts in Masonry–SALTeXPERT: Ariadne 13; ITAM Institute of Theoretical and Applied Mechanics: Prague, Czech Republic, 2006. [Google Scholar]
- Snethlage, R.; Wendler, E. Moisture cycles and sandstone degradation. In Saving Our Architectural Heritage: The Conservation of Historic Stone Structures; Baer, N.S., Snethlage, R., Eds.; John Wiley & Sons: Chichester, UK, 1997; pp. 7–24. [Google Scholar]
- Blanchard, D.C.; Woodcock, A.H. The production, concentration, and vertical distribution of the sea-salt aerosol. Ann. N. Y. Acad. Sci. 1980, 338, 330–347. [Google Scholar] [CrossRef] [Scilit]
- Theoulakis, P.; Moropoulou, A. Microstructural and mechanical parameters determining the susceptibility of porous building stones to salt decay. Constr. Build. Mater. 1997, 11, 65–71. [Google Scholar] [CrossRef] [Scilit]
- Zezza, F.; Macrì, F. Marine aerosol and stone decay. Sci. Total Environ. 1995, 167, 123–143. [Google Scholar] [CrossRef] [Scilit]
- EN 12370:2020; Natural Stone Test Methods—Determination of Resistance to Salt Crystallisation. European Committee for Standardization: Brussels, Belgium, 2020.
- TS EN 14147:2004; Natural Stone Test Methods—Determination of Resistance to Ageing by Salt Mist. Turkish Standards Institute: Ankara, Türkiye, 2004.
- Sousa, L.M.O.; Menningen, J.; López-Doncel, R.; Siegesmund, S. Petrophysical properties of limestones: Influence on behaviour under different environmental conditions and applications. Environ. Earth Sci. 2021, 80, 814. [Google Scholar] [CrossRef] [Scilit]
- Rodriguez-Navarro, C.; Doehne, E. Salt weathering: Influence of evaporation rate, supersaturation and crystallization pattern. Earth Surf. Process. Landf. 1999, 24, 191–209. [Google Scholar] [CrossRef] [Scilit]
- Benavente, D.; García del Cura, M.A.; Fort, R.; Ordóñez, S. Durability estimation of porous building stones from pore structure and strength. Eng. Geol. 2004, 74, 113–127. [Google Scholar] [CrossRef] [Scilit]
- Yu, S.; Oguchi, C.T. Role of pore size distribution in salt uptake, damage, and predicting salt susceptibility of eight types of Japanese building stones. Eng. Geol. 2010, 115, 226–236. [Google Scholar] [CrossRef] [Scilit]
- Cardell, C.; Yebra, A.; Van Grieken, R. Applying digital image processing to SEM-EDX and BSE images to determine and quantify porosity and salts with depth in porous media. Microchim. Acta 2002, 140, 9–14. [Google Scholar] [CrossRef] [Scilit]
- Yavuz, A.B.; Topal, T. Thermal and salt crystallization effects on marble deterioration: Examples from Western Anatolia, Turkey. Eng. Geol. 2007, 90, 30–40. [Google Scholar] [CrossRef] [Scilit]
- Benavente, D.; Martínez-Martínez, J.; Cueto, N.; Ordóñez, S.; García-del-Cura, M.A. Impact of salt and frost weathering on the physical and durability properties of travertines and carbonate tufas used as building material. Environ. Earth Sci. 2018, 77, 147. [Google Scholar] [CrossRef] [Scilit]
- Çelik, M.Y.; Kaçmaz, U.A. Geotechnical characterization of five types of building stones of Afyonkarahisar, Türkiye origin and assessment of durability using different salt solutions in salt crystallization. Bull. Eng. Geol. Environ. 2026, 85, 241. [Google Scholar] [CrossRef] [Scilit]
- Oguchi, C.T.; Yu, S. A review of theoretical salt weathering studies for stone heritage. Prog. Earth Planet. Sci. 2021, 8, 32. [Google Scholar] [CrossRef] [Scilit]
- Alves, C.; Figueiredo, C.A.M.; Sanjurjo-Sánchez, J.; Hernández, A.C. Salt weathering of natural stone: A review of comparative laboratory studies. Heritage 2021, 4, 1554–1565. [Google Scholar] [CrossRef] [Scilit]
- Carvalho, C.; Silva, Z.; Simão, J. Evaluation of Portuguese limestones’ susceptibility to salt mist through laboratory testing. Environ. Earth Sci. 2018, 77, 523. [Google Scholar] [CrossRef] [Scilit]
- Pires, V.; Rosa, L.G.; Amaral, P.M.; Simão, J.A.R. The susceptibility to salt fog degradation of stone cladding materials: A laboratory case study on two limestones from Portugal. Heritage 2023, 6, 492–504. [Google Scholar] [CrossRef] [Scilit]
- Erentöz, C.; Pamir, H.N. 1/500.000 Ölçekli Türkiye Jeoloji Haritası, Ankara Paftası; MTA Yayınları: Ankara, Türkiye, 1975. (In Turkish) [Google Scholar]
- TS EN 1936:2010; Natural Stone Test Methods—Determination of Real Density and Apparent Density and Total and Open Porosity. Turkish Standards Institute: Ankara, Türkiye, 2010.
- TS EN 13755:2014; Natural Stone Test Methods—Determination of Water Absorption at Atmospheric Pressure. Turkish Standards Institute: Ankara, Türkiye, 2014.
- TS EN 1926:2000; Natural Stone Test Methods—Determination of Compressive Strength. Turkish Standards Institute: Ankara, Türkiye, 2000.
- TS EN 12372:2001; Natural Stone Test Methods—Determination of Flexural Strength under Concentrated Load. Turkish Standards Institute: Ankara, Türkiye, 2001.
- TS EN 14157:2017; Natural Stone Test Methods—Determination of the Abrasion Resistance. Turkish Standards Institute: Ankara, Türkiye, 2017.
- ASTM C597:2016; Standard Test Method for Pulse Velocity through Concrete and Constituent Materials. ASTM International: West Conshohocken, PA, USA, 2016.
- ASTM D2244:2011; Standard Practice for Calculation of Color Tolerances and Color Differences from Instrumentally Measured Color Coordinates. ASTM International: West Conshohocken, PA, USA, 2011.
- Mokrzycki, W.S.; Tatol, M. Color difference Delta E—A survey. Mach. Graph. Vis. 2011, 20, 383–411. [Google Scholar]
- Sümer, E.Ö.; Tolluoğlu, A.Ü.; Erkan, Y. Mermer Üretiminde Jeolojik Verilerin Önemi ve Afyon-İscehisar Mermerlerinde Üç Boyutlu Modelleme Yöntemi. In Proceedings of the Türkiye II. Mermer Sempozyumu, Afyon, Türkiye, 1–2 May 1997; pp. 35–41. (In Turkish) [Google Scholar]
- Bağcı, M. Mineralogical, petrographic, and geochemical characterization of colored İscehisar marbles (Afyonkarahisar, W-Turkey). Turk. J. Earth Sci. 2020, 29, 946–975. [Google Scholar] [CrossRef] [Scilit]
- Kun, N. Mermer Jeolojisi ve Teknolojisi; Tezer Matbaası: Izmir, Türkiye, 2000. (In Turkish) [Google Scholar]
- Silva, Z.S.G.; Simão, J.A.R. The role of salt fog on alteration of dimension stone. Constr. Build. Mater. 2009, 23, 3321–3327. [Google Scholar] [CrossRef] [Scilit]
- Prieto, B.; Sanmartín, P.; Silva, B.; Martínez-Verdú, F. Measuring the color of granite rocks: A proposed procedure. Color Res. Appl. 2010, 35, 368–375. [Google Scholar] [CrossRef] [Scilit]
- Grossi, C.M.; Brimblecombe, P.; Esbert, R.M.; Alonso, F.J. Color changes in architectural limestones from pollution and cleaning. Color Res. Appl. 2007, 32, 320–331. [Google Scholar] [CrossRef] [Scilit]
- Benavente, D.; Martínez-Verdú, F.; Bernabeu, A.; Viqueira, V.; Fort, R.; García del Cura, M.A.; Illueca, C.; Ordóñez, S. Influence of surface roughness on colour changes in building stones. Color Res. Appl. 2003, 28, 343–351. [Google Scholar] [CrossRef] [Scilit]
- Fort, R.; Álvarez de Buergo, M.; López de Azcona, M.C.; Mingarro, F. The efficiency of urban remodelling in reducing the effects of atmospheric pollution on monuments. In Air Pollution and Cultural Heritage; Sáiz-Jiménez, C., Ed.; Taylor & Francis: London, UK, 2004; pp. 225–232. [Google Scholar]
- Menningen, J.; Siegesmund, S.; Lopes, L.; Martins, R.; Sousa, L. The Estremoz marbles: An updated summary on the geological, mineralogical and rock physical characteristics. Environ. Earth Sci. 2018, 77, 191. [Google Scholar] [CrossRef] [Scilit]
- Siegesmund, S.; Dürrast, H. Physical and mechanical properties of rocks. In Stone in Architecture, 4th ed.; Siegesmund, S., Snethlage, R., Eds.; Springer: Berlin/Heidelberg, Germany, 2011; pp. 97–225. [Google Scholar] [CrossRef] [Scilit]
- Omrani, I.A.N.; Maniukiewicz, W.; Świątkowski, M.; Koniorczyk, M. The non-destructive evaluation of the salt crystals content in building materials: Ultrasonic technique plus differential scanning calorimetry. Mater. Struct. 2026, 59, 56. [Google Scholar] [CrossRef] [Scilit]
- Török, Á.; Přikryl, R. Current methods and future trends in testing, durability analyses and provenance studies of natural stones used in historical monuments. Eng. Geol. 2010, 115, 139–142. [Google Scholar] [CrossRef] [Scilit]
- Sánchez, M.; Navacerrada, M.A.; Fort, R.; Barbero-Barrera, M.M. Assessment of limestone cladding deterioration due to crystallisation of salts by non-destructive techniques. Constr. Build. Mater. 2023, 400, 132640. [Google Scholar] [CrossRef] [Scilit]
- Sousa, L.M.O.; Suárez del Río, L.M.; Calleja, L.; Ruiz de Argandoña, V.G.; Rodríguez-Rey, A. Influence of microfractures and porosity on the physico-mechanical properties and weathering of ornamental granites. Eng. Geol. 2005, 77, 153–168. [Google Scholar] [CrossRef] [Scilit]
- Martínez-Martínez, J.; Benavente, D.; García-del-Cura, M.A. Spatial attenuation: The most sensitive ultrasonic parameter for detecting petrographic features and decay processes in carbonate rocks. Eng. Geol. 2011, 119, 84–95. [Google Scholar] [CrossRef] [Scilit]




Disclaimer/Publisher’s Note: The statements, opinions and data contained in all publications are solely those of the individual author(s) and contributor(s) and not of MDPI and/or the editor(s). MDPI and/or the editor(s) disclaim responsibility for any injury to people or property resulting from any ideas, methods, instructions or products referred to in the content. |
© 2026 by the authors. Licensee MDPI, Basel, Switzerland. This article is an open access article distributed under the terms and conditions of the Creative Commons Attribution (CC BY) license.