


Abstract
This study investigated the soil geochemistry associated with magnetite-bearing Fe–Cu mineralization in northeastern Aksaray (Türkiye). Reservoir normalization, threshold-based geochemical anomaly classification, and multivariate statistical analyses were combined to evaluate the effects of parent lithology, weathering, and mineralization. Reservoir normalization analysis showed pronounced Cu enrichment, together with high geochemical variability, suggesting an influence beyond lithological inheritance alone. The depletion of relatively mobile components and the variable behavior of S further suggested modification of primary geochemical signatures during weathering. Threshold-based anomaly classification showed that positive Cu and Zn anomalies are closely associated with the known Fe–Cu mineralization zones, whereas Fe2O3, Co, and V anomalies primarily reflect basaltic parent rocks and the positive Zr anomaly reflects felsic lithological influence. The multivariate statistical analyses, including correlation analysis (CA), hierarchical cluster analysis (HCA), and principal component analysis (PCA), revealed coherent geochemical associations corresponding to basaltic parent rocks, felsic lithologies, and mineralization-related element assemblages. PCA resolved three principal components reflecting a mafic–felsic lithological contrast (PC1), the survey-scale compositional variability in the As–Pb–Rb–Zr association (PC2), and a Cu–Zn–S mineralization-related signature (PC3). Overall, the results indicate that soil geochemical patterns reflect the overlapping influences of parent lithology, weathering, and Fe–Cu mineralization, emphasizing the importance of local geological background and lithological variability in geochemical anomaly interpretation.
1. Introduction
Soil geochemistry is widely used to characterize the geochemical expression of mineralized systems because soils can preserve elemental signatures derived from underlying geological materials and subsequent secondary processes [1,2,3,4,5,6,7,8,9,10]. Compared with drilling, geophysical surveys, and trenching, soil geochemical surveys provide a rapid and cost-effective method of evaluating geochemical variability, particularly in areas where bedrock exposure is limited or discontinuous. Numerous studies have demonstrated that soil geochemistry can reveal elemental dispersion patterns associated with ore-forming processes and provide valuable information for geological interpretation and mineral exploration [1,2,3,4,5,6,7,8,9,10,11]. The distribution of elements in soils, however, reflects the combined influence of multiple geological and surficial processes rather than a single controlling factor. Parent-rock composition, weathering, hydrothermal alteration, and local environmental conditions may all modify primary geochemical signatures and influence the spatial distribution of elements [4,5,8,9]. Weathering transforms primary minerals into secondary clay minerals and iron oxides while simultaneously redistributing many major oxides and trace elements, thereby modifying the geochemical expression observed in soils [12]. Furthermore, the interpretation of soil geochemical data may be complicated by factors such as vegetation cover, soil horizon continuity, leaching, and topography, which can modify primary geochemical patterns and anomaly distributions [1,12]. Because soil geochemistry reflects multiple superimposed geological and secondary processes, interpretation based solely on the concentration of individual elements may not adequately distinguish mineralization-related anomalies from natural lithological background or weathering effects [11,12]. To address this complexity, multivariate statistical methods are increasingly employed to identify elemental associations, reduce data dimensionality, and evaluate the dominant controls on soil geochemistry. These methods are particularly valuable because multivariate geochemical datasets commonly contain overlapping lithological and geochemical trends that cannot be adequately recognized using individual variables alone [13]. Among these methods, correlation analysis (CA), hierarchical cluster analysis (HCA), and principal component analysis (PCA) are widely applied in soil geochemical studies [2,3,6,7,8,10,12]. Accordingly, integrating complementary multivariate statistical approaches can provide additional insight into soil geochemical variability by evaluating different aspects of the geochemical data structure [13,14].
Although multivariate statistical methods reveal relationships among elements, additional geochemical approaches can be used to evaluate elemental enrichment and objectively identify anomalous concentrations. Reservoir normalization approaches allow elemental enrichment and depletion to be evaluated relative to representative geological reservoirs and local rocks, thereby helping to distinguish lithological inheritance from secondary geochemical modification (e.g., weathering and mineralization processes) [5,15,16,17]. Likewise, threshold-based geochemical anomaly classification facilitates objective identification of positive and negative anomalies and enables their geological interpretation when considered together with lithology and spatial relationships [8,18]. Geochemical datasets generally consist of background populations together with anomalous and occasionally spurious values; therefore, reliable estimation of background levels is essential for establishing geochemical threshold values that objectively distinguish anomalous concentrations from background populations [19,20,21]. Despite their complementary roles, reservoir normalization, threshold-based anomaly classification, and multivariate statistical analyses have often been applied independently or in partial combinations in soil geochemical studies. Their combined application for evaluating the relative contributions of lithology, weathering, and mineralization to soil geochemical patterns at the survey-scale has received comparatively less attention.
The study area is located in the southwestern part of the Central Anatolian Crystalline Complex (CACC) [22,23,24] and hosts magnetite-bearing Fe–Cu mineralization developed within basaltic rocks of the ophiolitic sequence. Exploration studies conducted by the General Directorate of Mineral Research and Exploration (MTA) during the late 1980s reported Cu grades of up to 0.65% within magnetite lenses at the İncebel Hill and Bakırçukuru mineralization zones. The mineralization formed in association with submarine mafic volcanism during ocean-floor spreading within the ophiolitic sequence [25]. Although the occurrence and geological characteristics of these mineralizations have been documented, the relative contributions of lithological inheritance, weathering, and mineralization to soil geochemical patterns within the study area remain poorly constrained. Accordingly, this study aims to characterize the soil geochemistry associated with the Fe–Cu mineralization in northeastern Aksaray by combining reservoir normalization analysis, threshold-based geochemical anomaly classification, and multivariate statistical analyses. We hypothesize that lithological inheritance, weathering, and Fe–Cu mineralization exert distinct but overlapping controls on the survey-scale soil geochemical patterns. Specifically, the objectives are to: (i) evaluate elemental enrichment and depletion relative to representative geological reservoirs; (ii) interpret the spatial distribution of geochemical anomalies by integrating threshold-based anomaly classification with geological and land-use information; and (iii) identify and interpret the principal geochemical associations and their geological controls using CA, HCA, and PCA.
2. Study Area
2.1. Geographic Setting
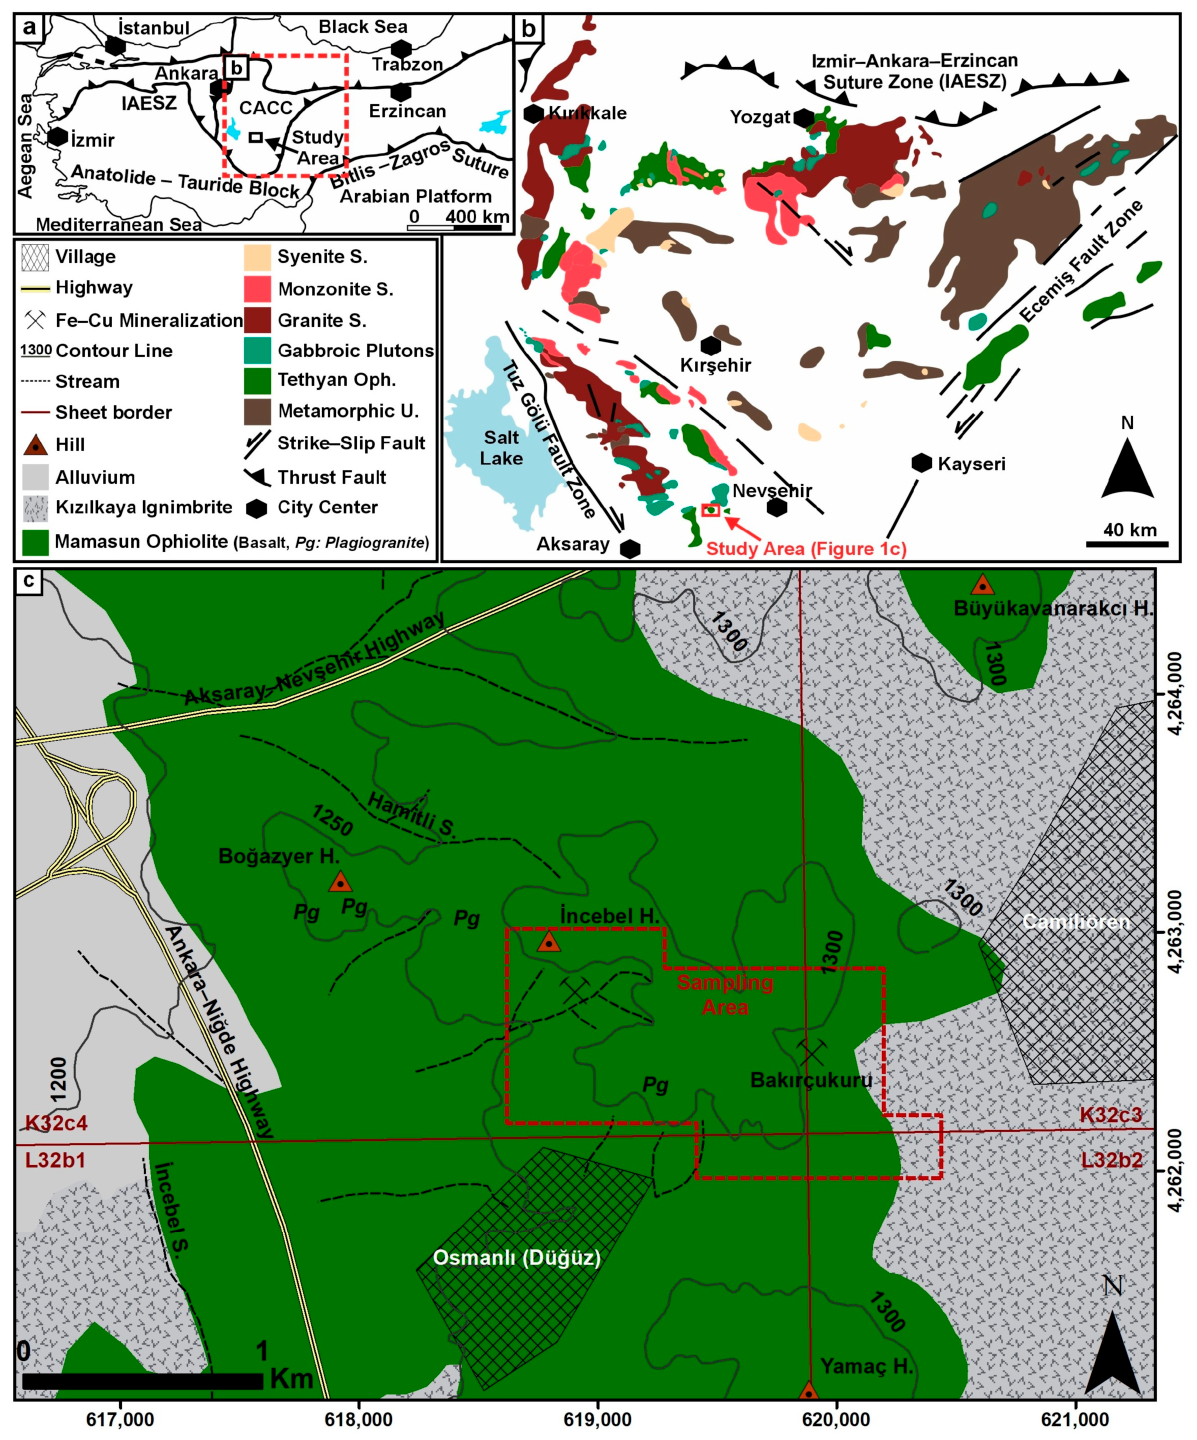
Aksaray Province, located in the central part of Türkiye (Figure 1a,b), has an average elevation of approximately 980 m above sea level and experiences hot, dry summers and cold, wet winters. Based on long-term meteorological records obtained from the Turkish State Meteorological Service, the average annual temperature and precipitation are 12.2 °C and 357.6 mm, respectively. The mapped study area is situated approximately 40 km northeast of Aksaray city center and covers approximately 17 km2. It is located at the intersection of the K32c3, K32c4, L32b1, and L32b2 topographic map sheets (Figure 1c). The area is characterized by moderately rugged topography, with the main topographic highs including Büyükavanarakcı Hill (1329 m), Yamaç Hill (1329 m), İncebel Hill (1311 m), and Boğazyer Hill (1277 m) (Figure 1c). Numerous seasonal streams drain the area, which is characterized by sparse vegetation cover. The soils are predominantly brown-colored. Anthropogenic activities are relatively limited and mainly consist of small-scale agriculture and livestock farming, together with local village roads and sparse residential areas. Within the mapped study area, the soil geochemical survey was conducted over an approximately 2 km2 survey-scale area (Figure 1c).
2.2. Geological Setting
The study area is located within the CACC, one of the major tectono-stratigraphic units of Türkiye (Figure 1a,b). The CACC mainly consists of the Kırşehir, Akdağmadeni, and Niğde metamorphic massifs, collectively referred to as the Central Anatolian Metamorphics (CAM); dismembered Tethyan ophiolites, known as the Central Anatolian Ophiolites (CAO); and plutonic rocks, referred to as the Central Anatolian Granitoids (CAG) (Figure 1b) [22,23,24,26,27]. The CAM units consist predominantly of migmatite, gneiss, schist, quartzite, and marble [22,28] and are tectonically overlain by the CAO units. The CAO, which was emplaced during the Late Cretaceous (Turonian–Santonian), comprises serpentinite, gabbro, tonalite, plagiogranite, rhyolitic dykes and sills, diabase, dolerite, pillow lavas, and chert [29,30,31,32,33]. The CAM and CAO units are intruded by Late Cretaceous–Eocene CAG plutons, which range in composition from syenite and monzonite to granite [26,27]. These basement units are unconformably overlain by younger cover sequences consisting of sedimentary, pyroclastic, and volcanic rocks [22,23,24,26,27].
Figure 1.
Maps of the study area: (a) location of the study area in Türkiye; (b) geological framework of the CACC [26]; and (c) simplified geological map of the study area showing the main lithological units and known Fe–Cu mineralization zones (modified from [29,34]). Projected coordinates in panel (c) are shown in ED50/UTM Zone 36N.
2.3. Local Geology
The study area is mainly underlain by Late Cretaceous ophiolitic rocks represented by basalts and plagiogranites, together with cover units comprising the Lower Pliocene Kızılkaya Ignimbrite and younger alluvial deposits (Figure 1c) [29,34]. The ophiolitic rocks occur as discontinuous bodies in the Ekecikdağ, Sarıkaraman, Mamasun, and Akmezar areas around Aksaray and do not preserve a complete ophiolitic succession. They are predominantly represented by lithologies corresponding to the upper levels of the oceanic crust [29,30,31,32,33].
Basaltic rocks, which constitute the dominant lithology and cover large parts of the study area, occur as pillow lavas and basaltic flows (Figure 1c and Figure 2a). They are typically black, dark gray, and grayish-green in color and are characterized by fine-grained, massive textures, and locally moderate to strong magnetic susceptibility. Microscopic observations further indicate that the basaltic rocks have hypocrystalline and porphyritic textures and consist of plagioclase, pyroxene, and opaque minerals (Figure 2b). Vesicles are commonly infilled by secondary minerals, including quartz, epidote, calcite, and opaque minerals, producing widespread amygdaloidal textures (Figure 2c). Plagiogranites intrude the basaltic rocks and are exposed over limited areas in the study area (Figure 1c and Figure 2d). They are generally light gray, locally displaying a pale green coloration associated with chloritization and epidotization, and have fine- to medium-grained phaneritic textures. The plagiogranites consist predominantly of plagioclase and quartz, with subordinate altered mafic minerals and opaque minerals (Figure 2e).
Figure 2.
(a) Field view of pillow basalt; (b) plagioclase, pyroxene, and opaque minerals in basalt; (c) amygdaloidal basalt showing vesicles filled with quartz and epidote; (d) field contact between basalt and plagiogranite; (e) argillized plagioclase, chlorite, and opaque minerals in plagiogranite; (f) field photograph of Kızılkaya Ignimbrite containing pumice and lithic fragments; (g) intensely altered greenish basalt exhibiting iron oxide/hydroxide alteration; (h) alteration assemblages comprising chlorite, epidote, quartz, and opaque minerals; (i) plagioclase affected by sericitic and argillic alteration, together with pyroxene altered to chlorite and epidote; (j) plagioclase partially replaced by calcite and epidote; (k) field photograph of magnetite mineralization accompanied by malachite; (l) hematite, magnetite, and intense iron oxide/hydroxide alteration; (m–o) reflected-light photomicrograph showing ore mineral assemblages comprising magnetite, pyrite, chalcopyrite, hematite, and chalcocite ((c,e,h): plane-polarized light; (b,i,j): cross-polarized light; (m–o): reflected light) (Cal = calcite; Ccp = chalcopyrite; Cc = chalcocite; Chl = chlorite; Ep = epidote; Hm = hematite; Lf = lithic fragment; Mal = malachite; Mt = magnetite; Opq = opaque minerals; Pl = plagioclase; Px = pyroxene; Py = pyrite; Qz = quartz; Ser = sericite).
The Kızılkaya Ignimbrite crops out mainly in the eastern and southwestern parts of the study area (Figure 1c) and unconformably overlies the ophiolitic rocks. The ignimbrite is grayish-white to pale reddish in color and consists of poorly sorted, moderately to strongly welded pyroclastic deposits. It contains abundant oval-shaped pumice fragments and subangular to angular basaltic lithic clasts ranging from a few millimeters to approximately 20 cm in size (Figure 2f).
The basaltic rocks hosting the magnetite-bearing Fe–Cu mineralization at İncebel Hill and Bakırçukuru are strongly hydrothermally altered in the vicinity of the mineralization and are commonly greenish, locally whitish to reddish in color (Figure 2g). Mineralogical investigations reveal hydrothermal alteration assemblages characterized by varying degrees of chloritization, epidotization, argillitization, sericitization, silicification, carbonatization, and iron-oxide alteration (Figure 2h–j). The mineralization occurs as massive, disseminated, lens-shaped, and vein-type bodies and is dominated by magnetite, accompanied by pyrite, chalcopyrite, hematite, goethite, chalcocite, and malachite (Figure 2k–o).
3. Materials and Methods
3.1. Soil Sampling and Geochemical Analysis
The sampling design consisted of linear traverses planned prior to fieldwork to characterize survey-scale geochemical variability within the sampled area (Figure 1c). The traverses were arranged to include the known Fe–Cu mineralization zones as well as the principal lithological units (basalt, plagiogranite, and ignimbrite), rather than concentrating samples exclusively around the known mineralized outcrops. However, plagiogranite bodies are limited in extent and occur mainly as small intrusive bodies within the basaltic rocks (Figure 2d); therefore, they are represented by fewer sampling locations than the more extensively exposed basalt and ignimbrite units. Soil samples were collected at intervals of approximately 250 m along these traverses. Within the survey-scale sampling area, local topographic variation was relatively limited, and no pronounced differences in apparent soil thickness were observed during field sampling. Following removal of the surface soil layer, the 20–30 cm depth interval was used as a general sampling guide, with subsurface material exhibiting field characteristics consistent with the B horizon preferentially collected. The B horizon was targeted because it commonly represents an accumulation zone within the soil profile and can preserve geochemical signatures related to the underlying parent material and mineralization while reducing the influence of surface contamination [1,2,3,5,6,8,9,15,16,17].
Geographic coordinates of the 30 sampling sites were recorded using a handheld Global Positioning System (GPS) device with an accuracy of approximately ±5 m and were referenced to the European Datum 1950 (ED50), Universal Transverse Mercator (UTM) Zone 36N coordinate system.
Information on the parent lithology and the proximity of each sampling location to known Fe–Cu mineralization zones and potential anthropogenic sources (agricultural land, village roads, and residential areas) is provided in Supplementary Table S1. To minimize cross-contamination, all sampling equipment was cleaned after each sampling event. The collected samples were placed in labeled polyethylene bags and transported to the laboratory. Following air-drying under clean laboratory conditions, the samples were sieved to <2 mm using a stainless-steel sieve and subsequently pulverized to <75 µm using a ball mill. The powdered samples were homogeneously mixed with Micropulver Wachs C binder and pressed into pellets under hydraulic pressure. Major oxide and trace element analyses were performed at the Geochemical Analysis Laboratory of the Scientific and Technological Application and Research Center of Aksaray University (ASUBTAM–JAL) using a Malvern Panalytical Axios wavelength-dispersive X-ray fluorescence spectrometer (WD–XRF) (Malvern Panalytical, Almelo, The Netherlands). The analytical dataset comprised 24 geochemical variables, including ten major oxides (%) (SiO2, TiO2, Al2O3, Fe2O3, MnO, MgO, CaO, Na2O, K2O, and P2O5) and fourteen trace elements (ppm) (As, Ba, Co, Cr, Cu, Nb, Ni, Pb, Rb, S, Sr, V, Zn, and Zr). Quality assurance and quality control (QA/QC) procedures at ASUBTAM–JAL included analyses of certified reference materials (CRMs; DTS–2b, IA–HGC, IA–MGC–A, JA–2, JGb–1, JSI–1, JSy–1, NCS DC71303, NCS DC73301, SARM–44, and SDC–1), three duplicate sample pairs, and laboratory protocols to minimize the risk of cross-contamination. Analytical accuracy was assessed using the CRMs, whereas analytical precision was evaluated using duplicate analyses of samples S–10, S–14, and S–24. For the reported CRM results, recoveries for the analytes ranged from 95.3% to 104.8%. Relative percentage difference (RPD) values were predominantly below 5%; only the S–24/S–24R pair for As (6.24%) and the S–10/S–10R pair for Cr (6.57%) exceeded 5%. Fifteen measurements were below the corresponding analytical detection limits (DL), comprising seven As determinations (7/30; 23.3%; DL = 3 ppm) and eight S determinations (8/30; 26.7%; DL = 10 ppm). These values were replaced with one-half of the respective detection limit (1.5 ppm for As and 5 ppm for S) prior to statistical analyses. No below-detection-limit substitutions were required for the other variables included in the multivariate analyses. To assess the sensitivity of the threshold estimates to this substitution procedure, the As and S calculations were additionally repeated using DL/√2 as an alternative replacement value. Supplementary Table S2 provides the analytical results for all samples, element-specific analytical detection limits, duplicate analytical results and corresponding RPD values, and the reference and measured values and percentage recoveries of the reported CRMs.
3.2. Statistical Analysis
Descriptive statistics, including mean, minimum, maximum, standard deviation, coefficient of variation (CV), skewness, and kurtosis, were calculated to evaluate the characteristics of the geochemical dataset. Based on CV values, geochemical variability was classified as weak (<10%), moderate (10%–100%), and strong (>100%) [35]. Because several geochemical variables showed positively skewed distributions, logarithmic transformation was applied prior to multivariate statistical analyses [2,3,5,6,8,36]. Following logarithmic transformation, the geochemical variables were standardized using Z-scores prior to CA, HCA, PCA, and subsequent geochemical anomaly assessment to minimize scale effects between major oxides (%) and trace elements (ppm).
CA was performed using Pearson correlation coefficients. To control the false discovery rate associated with multiple pairwise comparisons, the significance of the correlations was further evaluated using the Benjamini–Hochberg false discovery rate (BH–FDR) correction (Q = 0.05) [37]. The complete BH–FDR evaluation of all pairwise correlations is provided in Supplementary Table S3.
Considering the relatively small sample size (n = 30), a reduced variable set was employed for HCA and PCA to improve the sample-to-variable ratio and the suitability of the dataset for multivariate statistical analyses. Geochemical variables were selected by jointly considering statistical criteria, including the individual measures of sampling adequacy (MSA) derived from the anti-image correlation matrix and communalities, together with geological criteria (Table 1). The final variable set consisted of Fe2O3, As, Co, Cu, Pb, Rb, S, V, Zn, and Zr, corresponding to a sample-to-variable ratio of 3:1 (30 samples and 10 variables); these variables were subsequently used for both HCA and PCA. Although Cu, S, and Zn had comparatively lower MSA values than the other selected geochemical variables, they were retained because of their geological relevance to mineralization and their high communalities (>0.70).
Table 1.
Statistical and geological criteria used for selecting the variables included in HCA and PCA analyses.
In HCA, squared Euclidean distance was used as the distance measure, and Ward’s linkage method was applied to generate clusters. The suitability of the selected geochemical variables for PCA was evaluated using the Kaiser–Meyer–Olkin (KMO) measure of sampling adequacy and Bartlett’s test of sphericity prior to component extraction. PCA was performed using Varimax rotation with Kaiser normalization. Components with eigenvalues greater than 1 were initially retained and further evaluated using the scree plot. Communality values were also examined to assess the degree to which each variable was represented by the extracted components. Absolute principal component (PC) loadings of 0.50–0.69 and ≥0.70 were considered moderate and strong, respectively, and were used for component interpretation. In addition, PC scores were calculated using the regression method. To evaluate the robustness of the PCA solution, sensitivity analyses were additionally performed by separately excluding As and S, the two variables affected by below-detection-limit substitution, and by jointly excluding Cu, S, and Zn to assess the stability of the principal elemental associations after removal of the variables defining the original mineralization-related component. The resulting rotated component solutions are provided in Supplementary Table S4. Multivariate statistical analyses were performed using IBM SPSS Statistics 24 (IBM Corporation, Armonk, NY, USA). All maps were prepared using ArcMap 10.2 (Esri, Redlands, CA, USA).
3.3. Threshold Calculation
Prior to interpreting geochemical patterns, statistical threshold values were established to distinguish anomalous values from the local geochemical background represented by the sampled dataset [9,18,38]. In this study, two complementary threshold approaches were applied to geochemical variables and PC scores to compare a conventional parametric criterion with a robust criterion that is less sensitive to extreme values. For the geochemical variables, thresholds were calculated for the log-transformed data and their corresponding Z-score-standardized values, whereas thresholds for PC scores were calculated directly from the standardized PC scores obtained using the regression method.
The first threshold (Threshold 1) was defined using the conventional statistical criterion of the arithmetic mean plus or minus two standard deviations (Mean ± 2SD), which is widely used in soil geochemical studies, with values beyond these limits classified as extreme positive or negative anomalies [39,40,41,42]. The second threshold (Threshold 2) was determined using the robust Median ± 2MAD approach, where MAD (median absolute deviation) was calculated in its unscaled (raw) form as the median of the absolute deviations of individual observations from the dataset median [21,42]. The Gaussian consistency factor of 1.4826 was not applied. Unlike the standard deviation, MAD is less affected by extreme values and skewed distributions, making it particularly suitable for geochemical datasets that commonly contain anomalous concentrations [18,38,43]. Values exceeding the upper Threshold 2 limit or falling below the lower Threshold 2 limit were classified as robust positive or negative anomalies, respectively. The resulting anomalies were subsequently evaluated in relation to parent lithology, proximity to known Fe–Cu mineralization, and potential anthropogenic influences (Supplementary Table S1).
4. Results
4.1. Geochemical Characteristics of the Soil Samples
The descriptive statistics (mean, minimum, maximum, standard deviation, CV, skewness, and kurtosis) of the raw, log-transformed, and Z-score-standardized geochemical data for 24 geochemical variables are presented in Table 2.
Table 2.
Descriptive statistics of the raw, log-transformed, and Z-score-standardized geochemical data.
The major oxide concentrations in the raw dataset ranged from 39.92 to 56.31% for SiO2, 0.92 to 1.57% for TiO2, 11.05 to 18.08% for Al2O3, 8.10 to 20.22% for Fe2O3, 0.14 to 0.42% for MnO, 2.84 to 5.99% for MgO, 1.46 to 17.18% for CaO, 0.58 to 2.15% for Na2O, 0.38 to 1.64% for K2O, and 0.07 to 0.19% for P2O5.
The trace element concentrations ranged from 1.50 to 7.78 ppm for As, 135.14 to 471.92 ppm for Ba, 38.60 to 184.50 ppm for Co, 105.88 to 548.95 ppm for Cr, 33.12 to 7135.33 ppm for Cu, 6.24 to 13.19 ppm for Nb, 42.40 to 98.65 ppm for Ni, 13.29 to 39.56 ppm for Pb, 13.31 to 76.48 ppm for Rb, 5 to 369.93 ppm for S, 82.41 to 279.57 ppm for Sr, 165.45 to 463.56 ppm for V, 85.78 to 325.23 ppm for Zn, and 67.06 to 151.72 ppm for Zr (Table 2).
According to the CV classification, SiO2 and Al2O3 exhibit weak variability (<10%), whereas TiO2, Fe2O3, MnO, MgO, CaO, Na2O, K2O, P2O5, As, Ba, Co, Cr, Nb, Ni, Pb, Rb, Sr, V, Zn, and Zr show moderate variability (10%–100%). In contrast, Cu and S display strong variability (>100%) (Table 2).
Several variables in the raw dataset show departures from normality based on their skewness and kurtosis values. Marked positive skewness values (>1) were observed for Cu (4.18), CaO (2.36), Co (2.34), Zn (2.14), MnO (2.00), Sr (1.56), and S (1.13), whereas Pb had a negative skewness value (−1.05). Elevated kurtosis values (>2) were recorded for Cu (17.76), Co (9.92), MnO (6.28), CaO (5.90), Zn (4.35), SiO2 (2.26), Sr (2.17), Al2O3 (2.12), and Fe2O3 (2.09). Logarithmic transformation substantially reduced the skewness and kurtosis of most variables, resulting in distributions that more closely approached normality. However, Cu (2.57 and 6.98), Pb (−1.82 and 4.47), Zn (1.42 and 2.06), and Al2O3 (−1.17 and 2.89) continued to exhibit departures from normality, although their skewness and kurtosis values were markedly reduced compared to the raw dataset (Table 2).
4.2. Reservoir Normalization Analysis
To evaluate elemental enrichment and depletion relative to representative geological reservoirs, raw soil geochemical data were normalized to the mean geochemical compositions of Upper Continental Crust (UCC) [44], basalt and plagiogranite from the ophiolitic rocks [30,31,32], and ignimbrite [45]. The local geological reservoirs were selected because they represent the principal rock units exposed within the study area, whereas the UCC provides a broader reference composition for comparison. Normalized values greater than 1 indicate enrichment relative to the corresponding reservoir, whereas values less than 1 indicate depletion. The mean, median, minimum, and maximum normalized values relative to the UCC, basalt, plagiogranite, and ignimbrite are summarized in Supplementary Table S5. Because the normalized datasets contain locally extreme values, the median values are emphasized in the following descriptions.
The UCC-normalized median values of the soil samples show enrichments of 7.6 for Cr, 7.4 for Co, 4.7 for V, 3.2 for Ni, 3.0 for As, 2.9 for Cu, 2.6 for MnO, 2.4 for Fe2O3, 2.3 for TiO2, and 2.0 for MgO. Most soil samples are enriched in TiO2, Al2O3, Fe2O3, MnO, MgO, As, Co, Cr, Cu, Ni, Pb, V, and Zn relative to the UCC. In contrast, SiO2, CaO, Na2O, K2O, P2O5, Ba, Nb, Rb, S, Sr, and Zr show depletion (Figure 3a).
Figure 3.
Reservoir-normalized geochemical patterns of the soil samples relative to (a) UCC; (b) basalt; (c) plagiogranite; and (d) ignimbrite.
The basalt-normalized median values of the soil samples indicate enrichments of 8.5 for Ba, 6.8 for Nb, 6.6 for K2O, 5.7 for Rb, 4.0 for Pb, 2.3 for both Cu and Zr, and 2.2 for P2O5. Most soil samples are enriched in TiO2, Fe2O3, K2O, P2O5, Ba, Cr, Cu, Nb, Pb, Rb, Sr, V, Zn, and Zr relative to basalt. In contrast, MnO, MgO, CaO, Na2O, Ni, and S are depleted. SiO2 and Al2O3 are generally close to 1 (Figure 3b).
Relative to plagiogranite, the median normalized values exhibit enrichments of 32.3 for Cu, 13.0 for V, 11.8 for Ni, 10.8 for Cr, 5.1 for Fe2O3, 4.9 for MgO, 4.3 for Pb, 4.1 for Zn, 3.9 for TiO2, 3.8 for MnO, 2.5 for Nb, and 2.3 for P2O5 in the soil samples. Most soil samples are enriched in TiO2, Al2O3, Fe2O3, MnO, MgO, CaO, K2O, P2O5, Ba, Cr, Cu, Nb, Ni, Pb, Rb, V, and Zn, whereas SiO2, Na2O, and Zr show depletion relative to plagiogranite (Figure 3c).
The median normalized values relative to ignimbrite indicate enrichments of 31.1 for Ni, 24.4 for Cu, 18.8 for Cr, 16.7 for V, 14.3 for Pb, 12.0 for MgO, 8.9 for Fe2O3, 8.4 for Zn, 7.9 for Co, 5.4 for TiO2, 3.9 for MnO, 2.7 for P2O5, and 2.6 for CaO. Most soil samples are enriched in TiO2, Al2O3, Fe2O3, MnO, MgO, CaO, P2O5, Co, Cr, Cu, Ni, Pb, Sr, V, and Zn, whereas SiO2, Na2O, K2O, Ba, Nb, Rb, and Zr are depleted relative to the ignimbrite (Figure 3d).
4.3. Threshold Values for Geochemical Anomaly Classification
The statistical thresholds calculated for the selected geochemical variables are presented in Table 3. Threshold 1 produced a uniform value of ±2.0 for all geochemical variables because Z-score standardization yields a mean of 0 and a standard deviation of 1. Threshold 2 varied among the geochemical variables owing to differences in their distributions around the median, as represented by the MAD. The upper robust threshold ranged from 0.261 for Cu to 1.790 for Rb, whereas the lower robust threshold ranged from −1.707 for V to −0.652 for Pb (Table 3). Under a normal distribution, approximately 4.6% of observations are expected to fall outside the Mean ± 2SD limits [42], highlighting the importance of considering Threshold 1 together with Threshold 2 and relevant geological factors, including parent lithology and spatial proximity to the known Fe–Cu mineralization zones.
Table 3.
Threshold values calculated from the log-transformed elemental concentrations and their corresponding Z-score-standardized values. Log-transformed and Z-score-standardized values are dimensionless.
A sensitivity check was performed for As and S by replacing the below-detection-limit values with DL/√2 instead of ½DL. The median and MAD of the log-transformed data remained unchanged for both elements, resulting in identical Threshold 2 limits in log space. Although the corresponding Z-score limits of Threshold 2 changed because of differences in the mean and standard deviation used for standardization, the number and identity of samples exceeding the upper or lower Threshold 2 limits remained unchanged. Likewise, Threshold 1 classifications were unaffected by the alternative substitution.
4.4. Geochemical Anomalies of the Selected Variables
The anomaly maps of the selected geochemical variables, based on Threshold 1 and Threshold 2, are presented in Figure 4 and Figure 5. Most samples were classified as background, whereas only a limited number fell outside the corresponding threshold limits and were classified as anomalies. Cu shows two positive extreme anomalies at S–5 and S–16, together with four positive robust anomalies at S–2, S–3, S–12, and S–30, whereas one negative robust anomaly occurs at S–1 (Figure 4d). Similarly, Zn displays three positive extreme anomalies at S–3, S–5, and S–24, two positive robust anomalies at S–16 and S–21, and two negative robust anomalies at S–1 and S–15 (Figure 5d). Most positive Cu and Zn anomalies occur near the İncebel Hill and Bakırçukuru Fe–Cu mineralization zones.
Figure 4.
Geochemical anomalies of the selected variables at the sampling locations based on the Z-score-standardized geochemical variables: (a) Fe2O3; (b) As; (c) Co; (d) Cu; and (e) Pb. Blank cells in the anomaly class legend indicate that no samples were classified within the corresponding anomaly class for that variable; they do not represent missing data. Projected coordinates are shown in ED50/UTM Zone 36N.
Figure 5.
Geochemical anomalies of the selected variables at the sampling locations based on the Z-score-standardized geochemical variables: (a) Rb; (b) S; (c) V; (d) Zn; and (e) Zr. Blank cells in the anomaly class legend indicate that no samples were classified within the corresponding anomaly class for that variable; they do not represent missing data. Projected coordinates are shown in ED50/UTM Zone 36N.
Fe2O3 exhibits a single positive extreme anomaly at S–16 and five negative robust anomalies at S–14, S–15, S–17, S–25, and S–30 (Figure 4a). Co is characterized by one positive extreme anomaly at S–16 and one positive robust anomaly at S–20, whereas one negative extreme anomaly occurs at S–14 and four negative robust anomalies occur at S–15, S–17, S–25, and S–30 (Figure 4c). V shows one positive robust anomaly at S–19 and one negative robust anomaly at S–14 (Figure 5c).
The remaining selected geochemical variables are predominantly characterized by negative anomalies, most of which are classified as robust. As shows negative robust anomalies at S–1, S–16, S–18, S–19, S–20, S–21, and S–29 (Figure 4b). Pb displays one negative extreme anomaly at S–20 and negative robust anomalies at S–1, S–18, S–19, and S–29 (Figure 4e). Rb has one negative extreme anomaly at S–20 and one negative robust anomaly at S–29 (Figure 5a). Eight negative robust S anomalies occur at S–1, S–9, S–18, S–20, S–22, S–26, S–28, and S–29 (Figure 5b). Zr is characterized by one negative extreme anomaly at S–16, one positive robust anomaly at S–30, and three negative robust anomalies at S–1, S–20, and S–29 (Figure 5e).
4.5. Correlation Analysis
Pearson correlation coefficients among the 24 geochemical variables are presented in Figure 6. Only correlations remaining significant after BH–FDR correction (Q = 0.05) [37] are discussed below. Moderate to strong positive correlations occur among several variables within the group comprising K2O, Rb, Ba, Nb, Zr, As, and Pb (r = 0.538 to 0.962). Within this group, the strongest correlations are observed for K2O–Rb (r = 0.962), Ba–Rb (r = 0.929), K2O–Ba (r = 0.926), As–Nb (r = 0.876), Nb–Zr (r = 0.868), Ba–Zr (r = 0.860), Rb–Nb (r = 0.837), Rb–Zr (r = 0.824), and As–Pb (r = 0.813). In contrast, these elements generally show moderate to strong negative correlations with Fe2O3, MgO, Co, and V (r = −0.930 to –0.457).
Figure 6.
Heatmap showing Pearson correlation coefficients among the Z-score-standardized geochemical variables of the soil samples. Only correlations remaining significant after BH–FDR correction (Q = 0.05) are highlighted; white off-diagonal cells indicate correlations that were not significant after BH–FDR correction. For the present dataset, the weakest correlation retained as significant after BH–FDR correction was |r| = 0.421.
Fe2O3 also shows strong positive correlations with Co (r = 0.963), V (r = 0.870), and MgO (r = 0.801), while Co–V, Co–MgO, and V–MgO show strong positive correlations (r = 0.801, 0.752, and 0.784, respectively). Another notable relationship involves Al2O3, CaO, and Sr. Al2O3 is strongly negatively correlated with CaO (r = −0.893) and Sr (r = −0.751), whereas CaO and Sr are strongly positively correlated (r = 0.844). Furthermore, CaO exhibits moderate to strong negative correlations with Co (r = −0.745) and Fe2O3 (r = −0.645), while Sr shows strong negative correlations with Co (r = −0.916), Fe2O3 (r = −0.882), V (r = −0.807), and MgO (r = −0.683). Cu has a moderate positive correlation with Zn (r = 0.611), whereas Cr and Ni have a strong positive correlation (r = 0.800). In addition, TiO2 displays moderate to strong positive correlations with V (r = 0.791), MnO (r = 0.676), Fe2O3 (r = 0.584), and Na2O (r = 0.554) (Figure 6).
4.6. Hierarchical Cluster Analysis
The R-mode hierarchical cluster dendrogram (Figure 7) classified the selected geochemical variables into two major clusters. These clusters merge at a rescaled linkage distance of approximately 25, thereby defining two major clusters within the dataset. The first major cluster (MC–I) comprises two sub-clusters: MC–IA (Fe2O3, Co, and V) and MC–IB (Cu and Zn). The second major cluster (MC–II) consists of MC–IIA (Rb, Zr, As, and Pb) and MC–IIB (S), with S forming a separate branch that merges with MC–IIA at a higher linkage distance. Overall, the HCA results are generally consistent with the relationships observed in the CA (Figure 6).
Figure 7.
R-mode hierarchical cluster dendrogram of the Z-score-standardized selected geochemical variables obtained using Ward’s linkage method and squared Euclidean distance. Major clusters (MC–I and MC–II) and their corresponding sub-clusters are highlighted using different colors.
4.7. Principal Component Analysis
The selected geochemical variables showed acceptable sampling adequacy for PCA, with a KMO value of 0.728. Bartlett’s test of sphericity was highly significant (χ2 = 311.909, df = 45, p < 0.001), indicating that the correlation matrix was suitable for PCA. The initial eigenvalues, variance explained before and after rotation, and the rotated component matrix are presented in Table 4, whereas Figure 8 shows the scree plot and the three-dimensional PCA loading plot.
Table 4.
PCA results for the selected Z-score-standardized geochemical variables: (a) initial eigenvalues, extraction sums of squared loadings, and rotation sums of squared loadings; and (b) rotated component matrix following Varimax rotation with Kaiser normalization. Absolute rotated component loadings ≥ 0.50 are shown in bold.
Figure 8.
PCA results derived from the Z-score-standardized selected geochemical variables: (a) scree plot of the initial eigenvalues; and (b) three-dimensional PCA loading plot (PC1–PC2–PC3).
Based on the unrotated PCA solution, three components satisfied the Kaiser criterion (eigenvalue > 1), with eigenvalues of 5.325, 2.181, and 1.014, explaining 53.246%, 21.814%, and 10.145% of the total variance, respectively (85.204% cumulatively). Following Varimax rotation, the variance was redistributed among the three retained components, with PC1, PC2, and PC3 accounting for 32.783%, 31.263%, and 21.158% of the variance, respectively (Table 4a). PC1 was characterized by strong positive loadings of V (0.860), Fe2O3 (0.828), and Co (0.811), together with negative loadings of S (−0.663), Rb (−0.573), and Zr (−0.497). PC2 was dominated by strong positive loadings of As (0.927), Pb (0.845), Rb (0.739), and Zr (0.730). PC3 had strong positive loadings of Cu (0.909) and Zn (0.751), together with a moderate positive loading of S (0.543) (Table 4b). Although the unrotated eigenvalue of PC3 (1.014) was only marginally above the Kaiser criterion, retention of the third component was additionally supported by the coherent Cu–Zn–S association resolved in the rotated solution.
The scree plot (Figure 8a) showed that the first three components met the eigenvalue > 1 criterion, with the eigenvalue decreasing below 1 from the fourth component onward. The three-dimensional PCA loading plot visually illustrates these principal elemental associations (Figure 8b).
To evaluate the robustness of these elemental associations to variable exclusion, sensitivity analyses were performed by separately excluding S and As and by jointly excluding Cu, S, and Zn (Supplementary Table S4). When S was excluded, two components were retained; the Cu–Zn association remained strong on the second component, with rotated loadings of 0.800 and 0.856, respectively, while the Fe2O3–Co–V and As–Pb–Rb–Zr associations remained evident as opposing loading groups on the first component. Similarly, exclusion of As retained a strong Cu–Zn association (0.857 and 0.806, respectively), with S also loading moderately on the same component (0.504), whereas the Fe2O3–Co–V and Pb–Rb–Zr associations remained evident as opposing loading groups on the first component. When Cu, S, and Zn were jointly excluded, the Fe2O3–Co–V association remained strongly expressed on the first component (loadings of 0.951, 0.962, and 0.854, respectively), whereas As, Pb, Rb, and Zr loaded together on the second component (0.886, 0.949, 0.690, and 0.559, respectively). Overall, the sensitivity analyses showed that the principal elemental associations were generally preserved following variable exclusion, although their partitioning among individual components changed.
4.8. Principal Component Score Anomalies
The statistical threshold values used for anomaly classification of the PC scores are summarized in Table 5. Based on these thresholds, the PC scores at the sampling locations were classified as positive anomalies, negative anomalies, or background (Figure 9).
Table 5.
Statistical thresholds calculated from Z-score-standardized PC scores.
Figure 9.
Geochemical anomalies of PC scores at the sampling locations based on the Z-score-standardized geochemical variables: (a) PC1; (b) PC2; and (c) PC3. Blank cells in the anomaly class legend indicate that no samples were classified within the corresponding anomaly class for that variable; they do not represent missing data. Projected coordinates are shown in ED50/UTM Zone 36N.
The conventional threshold (Threshold 1) corresponded to ±2.0 for all PCs, whereas the robust threshold (Threshold 2) varied among the components. The upper robust thresholds were 1.136, 1.684, and 0.541 for PC1, PC2, and PC3, respectively, while the corresponding lower thresholds were −0.393, −1.462, and −1.098.
For PC1, two samples (S–14 and S–25) were classified as negative extreme anomalies, while five additional samples (S–7, S–13, S–15, S–17, and S–30) were classified as negative robust anomalies. Only one sample (S–22) exceeded the positive robust threshold, and no positive extreme anomalies were identified (Figure 9a). For PC2, sample S–20 exceeded the negative extreme threshold, whereas samples S–16 and S–29 exceeded the negative robust threshold. No positive extreme or positive robust anomalies were observed (Figure 9b). For PC3, two samples (S–5 and S–16) exceeded the positive extreme threshold, while four additional samples (S–2, S–3, S–12, and S–24) exceeded the positive robust threshold. Only one sample (S–1) was classified as a negative robust anomaly. Most positive PC3 anomalies occurred near the İncebel Hill and Bakırçukuru Fe–Cu mineralization zones (Figure 9c).
5. Discussion
5.1. Geochemical Characteristics and Controlling Factors of Soils
The UCC-normalized median values suggest pronounced enrichment of TiO2, Fe2O3, MnO, MgO, As, Co, Cr, Cu, Ni, and V (Figure 3a). These enrichments may reflect the influence of basaltic parent rocks and/or Fe–Cu mineralization. However, these enrichments should be evaluated relative to local geological background rather than the UCC alone, because geochemical background is inherently site-specific and controlled by lithology and secondary processes [19,20,40]. The UCC normalization in this study is based on the compilation of Taylor and McLennan [44]; however, published UCC compositions depend on the compilation adopted, and alternative estimates, such as those of Rudnick and Gao [46], differ for several elements. Accordingly, the absolute magnitudes of UCC-normalized enrichment or depletion ratios may vary with the selected reference composition.
The normalized median SiO2 values are depleted relative to the felsic lithologies (0.7–0.8) but are close to those of basalt (1.0), whereas the normalized median Al2O3 values are close to 1 relative to basalt and slightly enriched (≈1.2) relative to the felsic lithologies (Figure 3b–d). Together, these normalized patterns suggest relative preservation of the major silicate-related geochemical signature during weathering because, although primary silicate minerals were progressively altered, Si and Al appear to have been relatively less mobile than more readily leached elements [47] (Figure 2h–j). Silica released during mineral weathering may have been retained through incorporation into secondary silicate minerals and/or reprecipitation as secondary silica (Figure 2c). Local Al enrichment (>1) in some soil samples probably reflects residual concentration caused by the preferential removal of more mobile elements, potentially accompanied by the formation of secondary Al-bearing clay minerals [47]. This interpretation is further supported by a moderate positive correlation between SiO2 and Al2O3 (Figure 6), consistent with their shared association with primary and secondary silicate minerals.
The normalized median TiO2 values are elevated relative to all local lithologies (Figure 3b–d). This enrichment likely reflects the relatively immobile behavior of Ti and its consequent residual concentration during weathering [47]. The normalized median Fe2O3 value is enriched relative to both basalt (1.4) and the felsic lithologies (5.1–8.9), whereas MnO and V have median values close to those of basalt (0.9–1.0) but are markedly enriched relative to the felsic lithologies (3.8–4.1 and 13.0–16.7, respectively). Similarly, the UCC- and ignimbrite-normalized median Co values indicate approximately eightfold enrichment (Figure 3a,d). Collectively, these patterns suggest that basaltic parent rocks exerted the primary control on the distribution of these elements. This interpretation is further supported by the pattern of moderate to strong positive correlations involving TiO2, Fe2O3, MnO, MgO, Co, and V (Figure 6), which define a coherent mafic geochemical association. Although ferromagnesian minerals progressively decompose during weathering, Fe and Mn are commonly retained and reprecipitated as secondary oxide/hydroxide phases, whereas Co may be retained through adsorption onto or incorporation into these secondary phases [8,9,12,16,17,47,48,49,50]. The observed Fe enrichment likely reflects the combined influence of basaltic parent rocks, weathering, and Fe–Cu mineralization, consistent with the abundance of opaque minerals in the basalt, the widespread chlorite–epidote and iron-oxide/hydroxide alteration, and the occurrence of magnetite–dominated mineralization (Figure 2b,c,g,h,k–o). The positive correlations of V with the other mafic-associated elements (Figure 6) are consistent with its affinity for ferromagnesian and Fe–Ti-bearing minerals in basaltic rocks [21,48,49,51]. The normalized median MgO values are elevated relative to the felsic lithologies (4.9–12.0), whereas they are depleted relative to basalt (0.5) (Figure 3b–d). These patterns suggest that Mg was primarily inherited from basaltic parent rocks and subsequently depleted during weathering.
The normalized median Cr and Ni values show similar patterns relative to basalt (1.2 and 0.7), plagiogranite (10.8 and 11.8), and ignimbrite (18.8 and 31.1) (Figure 3b–d). Together with the strong positive Cr–Ni correlation (r = 0.800; Figure 6), these patterns suggest a predominantly lithological contribution to their distributions, consistent with the characteristic enrichment of Cr and Ni in mafic to ultramafic rocks [17,48,49]. However, Cr does not covary with the Fe2O3–Co–V–MgO association, whereas Ni is negatively correlated with Fe2O3, MgO, and V (Figure 6), indicating that the Cr–Ni association is geochemically decoupled from the Fe2O3–MgO–Co–V association. Such decoupling is plausible because Cr and Ni may occur in different primary and secondary mineral phases and may respond differently to weathering and subsequent redistribution processes [52,53]. Cr is commonly retained in relatively weathering-resistant Cr-bearing spinel phases, favoring preservation and possible residual enrichment of the parent-rock signature, whereas Ni may occur in silicate and secondary weathering phases and may be more readily redistributed during weathering [12,52,53]. Unlike Cr, which remains slightly enriched relative to basalt, Ni is slightly depleted relative to basalt despite its strong enrichment relative to the felsic lithologies. This contrasting behavior is consistent with a predominantly mafic to ultramafic lithological contribution modified by differential redistribution of Cr and Ni during weathering.
Na2O is markedly depleted relative to all local lithologies (Figure 3b–d). This systematic depletion likely reflects the high mobility of Na and its progressive removal during plagioclase weathering [47] (Figure 2e,i). In contrast, the normalized median CaO values are enriched relative to the felsic lithologies (1.5–3.7), but depleted relative to basalt (0.5) (Figure 3b–d), suggesting that Ca distribution was influenced by both parent-rock composition and subsequent weathering. The depletion of CaO relative to basalt suggests that Ca was lost through plagioclase weathering in some soils, whereas local CaO enrichment (>1) may partly reflect carbonatization within the study area (Figure 2j). However, secondary carbonate accumulation during pedogenesis may also have contributed to the observed CaO distribution. Pedogenic carbonate formation and accumulation are particularly important in arid to semi-arid soil environments and are controlled by factors including moisture/precipitation, the weathering of soil parent material, soil properties, and topography [54,55]. In this context, the relatively low mean annual precipitation of the study area (357.6 mm) provides climatic conditions under which secondary carbonate accumulation may occur [54]. The strong positive CaO–Sr correlation (Figure 6) is consistent with the substitution of Sr for Ca in plagioclase [47,48].
The normalized median K2O, Ba, and Rb values show similar patterns relative to basalt (5.7–8.5), plagiogranite (1.0–1.4), and ignimbrite (0.2–0.4) (Figure 3b–d). These patterns suggest that the distributions of K2O, Ba, and Rb were primarily controlled by felsic lithology. The strong positive K2O–Rb–Ba correlations (Figure 6) are consistent with their common association with K-bearing minerals [47,48]. Relative to basalt, plagiogranite, and ignimbrite, the normalized median Nb values are 6.8, 2.5, and 0.8, whereas the corresponding Zr values are 2.3, 0.9, and 0.8 (Figure 3b–d). The normalized Nb and Zr values, together with their negative correlations with the mafic-associated elements (Figure 6), are consistent with a greater felsic than mafic lithological influence on their distributions. Their preservation in the soils may reflect their relatively immobile behavior and occurrence in resistant accessory minerals during weathering [47].
The UCC-normalized median As value is 3.0, whereas the normalized median Pb values are elevated relative to all geological reservoirs (Figure 3a). The strong positive correlations of As with K2O, Rb, Ba, Nb, and Zr are consistent with felsic lithological contributions, whereas its positive correlation with Pb (Figure 6) suggests a close geochemical association between these two elements. Adsorption onto clay minerals and secondary Fe oxide/hydroxide phases may have further contributed to the retention of As in weathered soils [47,48,56]. In the context of the observed sulfide minerals associated with the Fe–Cu mineralization (Figure 2k–o), the As–Pb association may also partly reflect the influence of sulfide mineralization and its oxidative weathering [12,16]. Overall, these patterns suggest that the distributions of As and Pb reflect the combined influence of felsic lithological inheritance and mineralization.
The normalized median Cu values are enriched relative to basalt (2.3), plagiogranite (32.3), and ignimbrite (24.4) (Figure 3b–d). The contrast between the moderate enrichment relative to basalt and the substantially higher enrichment relative to the felsic lithologies suggests that lithological inheritance alone cannot adequately explain the observed Cu distribution. The exceptionally high CV value of Cu (315.76%; Table 2) indicates extreme geochemical variability, while its moderate positive correlation with Zn (Figure 6) supports a mineralization-related association [16,17]. This interpretation is consistent with the petrographic identification of Cu-bearing minerals, including chalcopyrite, chalcocite, and malachite in the mineralization (Figure 2k,n,o). However, the degree of Zn enrichment is considerably lower than that observed for Cu, and its CV is also comparatively lower (37.90%; Table 2). These patterns, together with the relatively high Zn contents commonly reported in mafic-derived soils [48,50], suggest that Zn distribution may reflect the combined influence of mineralization and lithological inheritance. Unlike Cu and Zn, S does not show a consistent enrichment pattern relative to the geological reservoirs. Instead, both enrichment and depletion are observed relative to basalt (0.1–4.8) and plagiogranite (0.1–5.5) (Figure 3b,c). The wide range of normalized values and the high CV value (103.33%; Table 2) indicate highly variable S behavior, reflecting both sulfide mineralization and its subsequent modification during weathering. During prolonged weathering, sulfide minerals are among the first phases to oxidize, promoting the release and preferential removal of S from the weathering profile [12,47] (Figure 2g,l,m).
The normalized median P2O5 values are elevated relative to all local rock reservoirs (Figure 3b–d). This enrichment likely reflects the relative accumulation of P during weathering through the preferential removal of more mobile elements, consistent with the generally low mobility of P under most weathering conditions [47]. P2O5 does not show significant correlations with the principal geochemical associations (Figure 6), suggesting that its distribution was not strongly coupled with the dominant lithological and mineralization-related element associations. Pedogenic processes may have contributed to this pattern, although localized anthropogenic inputs associated with small-scale agriculture and livestock farming within the study area cannot be excluded [47].
Because the present interpretations are based primarily on bulk geochemical data, and soil pH, carbonate and organic-carbon contents, particle-size distribution, and selective-extraction data were not determined, the proposed weathering-related mobility and retention processes remain interpretive rather than directly demonstrated. Future studies incorporating these soil properties and complementary analyses could better constrain these processes and help distinguish pedogenic carbonate accumulation from hydrothermal carbonatization. Likewise, the enrichment ratios calculated using literature-derived mean compositions of the local geological reservoirs are subject to uncertainty associated with the number of analyses and natural compositional variability within the respective reference datasets (Supplementary Table S5) and should therefore be regarded as comparative rather than absolute enrichment factors.
5.2. Implications of Threshold-Based Geochemical Anomalies
The anomaly classifications based on Threshold 1 and Threshold 2 provide additional insight into the factors influencing the distribution of the selected geochemical variables when evaluated together with parent lithology, proximity to known Fe–Cu mineralization zones, and potential anthropogenic influences associated with nearby agricultural land, village roads, and residential areas (Figure 4 and Figure 5; Supplementary Table S1). Such geological contextualization is important because statistically identified geochemical patterns gain greater interpretive significance when they exhibit spatial coherence with known geological or mineralization-related features [57]. Among the investigated variables, Cu and Zn show prominent positive threshold anomalies, consistent with their positive association in the CA (Figure 6). The positive extreme Cu anomalies at S–5 and S–16 occur within 50 m of the İncebel Hill and Bakırçukuru Fe–Cu mineralization zones, respectively, and both are developed on basalt-derived soils. Although sample S–16 is also located close to agricultural land, S–5 is not; therefore, proximity to agricultural land does not provide a common explanation for the extreme Cu anomalies at both locations, whereas both samples occur close to the known mineralization (Figure 4d; Supplementary Table S1). The positive robust Cu anomalies at S–2, S–3, and S–12 are likewise associated with basalt-derived soils within approximately 250–350 m of the İncebel Hill mineralization, suggesting that elevated Cu signatures extend beyond the exposed mineralized outcrops. In contrast, sample S–30, which is developed on ignimbrite-derived soil and located more than 500 m from the nearest known mineralization zones, also exhibits a positive robust Cu anomaly. Because the ignimbrite stratigraphically overlies the basaltic parent rocks hosting the Fe–Cu mineralization, and contains abundant basaltic lithic fragments (Figure 2f), this enrichment may partly reflect basalt-derived material incorporated into the ignimbrite and subsequently transferred to the soil during weathering. However, its proximity to agricultural land (<50 m) indicates that a local environmental contribution cannot be excluded, although the available data are insufficient to distinguish between geological and potential local environmental contributions (Figure 4d; Supplementary Table S1).
Apart from samples S–3, S–5, and S–16, which display coincident positive Cu and Zn anomalies, S–21 and S–24 exhibit positive Zn anomalies despite the absence of corresponding Cu enrichment. Both samples are developed on basalt-derived soils; however, S–24 is located closer to the known mineralization zones than S–21 and lies within 50–100 m of agricultural land and village road (Figure 5d; Supplementary Table S1). These observations suggest that Zn distribution partly overlaps with the Cu anomaly pattern but may also reflect local lithological influences. The negative Cu and Zn anomalies at S–1 further suggest that basaltic parent lithology and moderate proximity to the İncebel Hill mineralization do not necessarily result in positive Cu and Zn anomalies. This pattern may partly reflect the localized and lens-shaped nature of the mineralization observed in the study area. Unlike Cu and Zn, S does not exhibit positive threshold anomalies; instead, eight samples (S–1, S–9, S–18, S–20, S–22, S–26, S–28, and S–29) display negative robust anomalies (Figure 5b). With the exception of S–18, these samples are developed on basalt-derived soils and occur both near to and distant from the known Fe–Cu mineralization zones, suggesting that the distribution of S is not controlled solely by proximity to mineralization. The predominance of negative S anomalies is consistent with the weathering-related S loss discussed in Section 5.1 [12,47]. The isolated position of S in the HCA (MC–IIB; Figure 7) is also consistent with its comparatively distinct geochemical behavior within the study area.
The positive anomalies of Fe2O3, Co, and V occur exclusively in basalt-derived soils (Figure 4a,c and Figure 5c; Supplementary Table S1). The coincident positive extreme Fe2O3 and Co anomalies at S–16 are particularly noteworthy because this sample is located within 50 m of the Bakırçukuru Fe–Cu mineralization. In contrast, the positive robust Co anomaly at S–20 and the positive robust V anomaly at S–19 occur more than 500 m from the known Fe–Cu mineralization zones. The co–enrichment of Fe2O3 and Co at S–16 likely reflects the combined influence of the basaltic parent rock and the nearby mineralization, whereas the isolated Co and V enrichments at S–20 and S–19 may reflect local compositional variability within the basaltic rocks. Negative Fe2O3 and Co anomalies are concentrated in ignimbrite-derived soils, particularly at S–14, S–15, S–17, S–25, and S–30, whereas the only negative V anomaly also occurs in an ignimbrite-derived soil at S–14 (Figure 4 and Figure 5; Supplementary Table S1). The concentration of negative Fe2O3, Co, and V anomalies within the ignimbrite unit is consistent with the comparatively lower abundances of mafic-associated elements in the felsic volcanic cover, suggesting a predominantly lithological influence on these negative anomalies. These observations indicate that Fe2O3, Co, and V anomalies should primarily be interpreted in the context of lithological variation, whereas localized enrichments adjacent to the known mineralization may additionally reflect mineralization-related processes.
The positive robust Zr anomaly at S–30 occurs in an ignimbrite-derived soil. Because Zr is generally regarded as an immobile element hosted mainly in resistant accessory minerals such as zircon [47], it commonly becomes residually enriched during prolonged weathering while preserving the lithological signature of the parent material [12]. Therefore, the positive Zr anomaly most likely reflects local felsic lithological inheritance. In contrast, the negative As, Pb, Rb, and Zr anomalies occur predominantly in basalt-derived soils (Figure 4b,e and Figure 5a,e; Supplementary Table S1). This pattern is consistent with the reservoir normalization and CA results and suggests that these negative anomalies largely reflect lithological contrasts between basaltic and felsic parent materials.
Overall, the threshold-based anomaly classification suggests that geochemical anomalies are not controlled by a single process. Previous soil geochemical investigations in the Aksaray region have similarly shown that element distributions may reflect overlapping geogenic and local anthropogenic influences, suggesting that proximity to agricultural land, roads, or residential areas alone is insufficient for source attribution [15]. Positive Cu and Zn anomalies are closely associated with the known Fe–Cu mineralization, positive Fe2O3, Co, and V anomalies primarily reflect the influence of basaltic parent rocks, and the positive Zr anomaly reflects the felsic lithological signature of ignimbrite-derived soils. Conversely, the concentration of negative Fe2O3, Co, and V anomalies within ignimbrite-derived soils is consistent with the natural geochemical background of the felsic volcanic cover. Evaluating threshold-based anomalies together with lithological and sample-location information therefore facilitates interpretation of lithological and mineralization-related geochemical signatures, particularly where multiple processes contribute to soil geochemistry.
The sampling design and spatial scale of a geochemical survey influence the geological and geochemical processes that can be detected and interpreted [57]. Geochemical background is inherently spatially variable and scale dependent; therefore, threshold values should ideally be established for the spatial scale represented by the sampling dataset rather than transferred from broader or unrelated areas [21]. In the present study, the thresholds were derived from 30 samples collected over an approximately 2 km2 survey-scale sampling area and should therefore be regarded as estimates of the local geochemical background rather than a regional background. Although two complementary statistical threshold methods were applied in this study, alternative threshold estimation approaches (e.g., Tukey inner fence or cumulative probability methods) may identify different anomaly populations and consequently produce somewhat different anomaly classifications [21,38]. Accordingly, the specific anomaly populations identified here are partly dependent on the statistical criteria adopted. Yusta et al. [20] emphasized that lithology-specific threshold estimation may improve anomaly discrimination by reducing geological background variability. Although lithological information was incorporated during interpretation, threshold values were calculated from the complete dataset rather than from separate lithological subsets. Consequently, the calculated thresholds reflect the overall geochemical variability of the study area rather than lithology-specific background distributions. Future studies based on larger and lithologically representative datasets could establish lithology-specific background and threshold values and further improve anomaly discrimination.
5.3. Multivariate Statistical Interpretation of Soil Geochemical Patterns
The multivariate statistical analyses (CA, HCA, and PCA) provide additional insight into the principal geochemical associations within the soil dataset, complementing the reservoir normalization and threshold-based anomaly analyses. CA quantifies pairwise relationships and HCA illustrates the hierarchical organization of these associations (Figure 6 and Figure 7). The PCA loading patterns summarize the principal multivariate geochemical associations, whereas the PC score anomalies show how these patterns are expressed across the sampling locations (Figure 8 and Figure 9).
PC1 is characterized by strong positive loadings of V, Fe2O3, and Co, together with negative loadings of S, Rb, and Zr (Figure 8b). The close association of Fe2O3, Co, and V is also evident in the CA and HCA (MC–IA sub-cluster), consistent with a coherent mafic-related geochemical association (Figure 6 and Figure 7). Together, these relationships suggest that PC1 primarily reflects the influence of basaltic parent rocks. Conversely, the negative loadings of Rb and Zr are consistent with the contrasting felsic lithological component. The PC1 score anomalies support this interpretation. Negative PC1 anomalies are concentrated mainly in ignimbrite-derived soils, particularly at S–14, S–15, S–17, S–25, and S–30 (Figure 9a; Supplementary Table S1), coinciding with the negative Fe2O3, Co, and V anomalies discussed previously. In contrast, the only positive robust PC1 anomaly occurs at S–22, which is developed on basalt-derived soil. Collectively, these patterns are consistent with the interpretation of PC1 principally as a lithological component reflecting the contrast between basalt-derived mafic geochemical signatures and felsic lithological contributions.
PC2 is dominated by strong positive loadings of As, Pb, Rb, and Zr (Figure 8b). The close association of these variables is likewise evident in the CA and HCA (MC–IIA sub-cluster) (Figure 6 and Figure 7). Although As and Pb are commonly regarded as pathfinder elements [1,5,8], neither exhibits positive threshold anomalies. Instead, the negative PC2 score anomalies at S–16, S–20, and S–29 coincide with negative anomalies within the As–Pb–Rb–Zr assemblage, consistent with relative depletion of this geochemical association at these sampling locations. Collectively, PC2 is interpreted as representing the survey-scale compositional variability of the As–Pb–Rb–Zr association rather than directly reflecting Fe–Cu mineralization.
PC3 is characterized by strong positive loadings of Cu and Zn, together with a moderate positive loading of S (Figure 8b). This association corresponds closely to the Cu–Zn sub-cluster identified by the HCA (MC–IB sub-cluster; Figure 7) and to the positive Cu–Zn correlation obtained from the CA (Figure 6). Positive extreme PC3 anomalies occur at S–5 and S–16, immediately adjacent to the İncebel Hill and Bakırçukuru Fe–Cu mineralization zones, respectively (Figure 9c; Supplementary Table S1). Positive robust anomalies at S–2, S–3, S–12, and S–24 largely coincide with the positive Cu and/or Zn anomalies identified from the element-specific anomaly patterns. An exception is S–30, which exhibits a positive robust Cu anomaly but does not exceed the positive PC3 threshold. This discrepancy indicates that its Cu anomaly is not accompanied by a sufficiently strong combined Cu–Zn–S signature to produce a positive PC3 score anomaly, consistent with the potentially mixed controls on Cu at this location discussed in Section 5.2. Conversely, the negative robust PC3 anomaly at S–1 corresponds to the negative Cu and Zn anomalies at the same location. Despite the absence of positive S anomalies, its moderate positive loading with Cu and Zn in PC3 (Figure 8b) suggests that S covaries with the Cu–Zn association at the multivariate level, although its individual distribution may have been modified by weathering processes. Collectively, these relationships support interpretation of PC3 as a Cu–Zn–S mineralization-related component.
Sensitivity analyses (Supplementary Table S4) further support the robustness of the principal elemental associations, while indicating some sensitivity in their partitioning among individual PCs. Exclusion of S did not eliminate the strong Cu–Zn association, indicating that the mineralization-related association was not dependent on inclusion of S. Similarly, exclusion of As preserved the Cu–Zn association, with S remaining moderately associated with the same component, while the Fe2O3–Co–V and Pb–Rb–Zr associations also remained evident. Following joint exclusion of Cu, S, and Zn, the Fe2O3–Co–V and As–Pb–Rb–Zr associations likewise remained clearly expressed. However, because the sensitivity models retained two rather than three components, the assignment of these associations to individual PCs was more sensitive to variable selection than the underlying elemental associations themselves.
The general agreement among the three multivariate statistical methods supports the internal consistency of the identified element assemblages. This complementary behavior is consistent with the observations of Iwamori et al. [13], who showed that different multivariate statistical methods can capture different aspects of geochemical data structure. An additional methodological consideration is that the multivariate analyses were performed on log-transformed and Z-score-standardized geochemical variables. Although log transformation and Z-score standardization substantially reduced skewness and improved variable comparability (Table 2), these transformations do not specifically address the closure effect inherent in compositional geochemical data [57]. Chen et al. [14] showed that log-ratio transformations, particularly the isometric log-ratio transformation, may further improve the identification of geochemical associations by reducing compositional bias. Nevertheless, the principal geochemical associations identified by the multivariate analyses are broadly consistent with the reservoir normalization patterns, element-specific anomaly distributions, and geological observations discussed above, although potential compositional bias cannot be completely excluded.
6. Conclusions
This study investigated the soil geochemical characteristics associated with magnetite-bearing Fe–Cu mineralization in northeastern Aksaray (Türkiye) by combining reservoir normalization, threshold-based geochemical anomaly classification, and multivariate statistical analyses (CA, HCA, and PCA).
Reservoir normalization analysis showed pronounced Cu enrichment, while the high geochemical variability of Cu suggests that its distribution cannot be explained by lithological inheritance alone and also reflects the influence of Fe–Cu mineralization. Fe2O3, MgO, Co, and V primarily reflect a coherent basaltic geochemical signature, whereas Cr and Ni are more consistent with a broader mafic–ultramafic lithological contribution. K2O, Rb, Ba, Nb, and Zr are mainly associated with felsic lithologies (plagiogranite and ignimbrite). The depletion of relatively mobile components and the variable behavior of S suggest modification of the primary lithological and mineralization-related signatures during weathering.
Threshold-based anomaly classification indicated that positive Cu and Zn anomalies are closely associated with the known İncebel Hill and Bakırçukuru Fe–Cu mineralization zones, whereas Fe2O3, Co, and V anomalies primarily reflect basaltic parent rocks and the positive Zr anomaly reflects felsic lithological influence. Evaluating threshold-based anomalies together with lithological information and sample locations facilitated interpretation of mineralization-related and lithology-controlled geochemical signatures.
The multivariate statistical analyses further supported these interpretations. CA and HCA showed coherent geochemical associations corresponding to basaltic parent rocks, felsic lithologies, and mineralization-related element assemblages. PCA resolved three principal components reflecting (i) a mafic–felsic lithological contrast (PC1), (ii) the survey-scale compositional variability of the As–Pb–Rb–Zr association (PC2), and (iii) a Cu–Zn–S mineralization-related signature (PC3).
Overall, the results demonstrate that soil geochemical patterns in the study area reflect the overlapping influences of parent lithology, weathering, and Fe–Cu mineralization, emphasizing the importance of considering local geological background and lithological variability when interpreting geochemical anomalies.
Supplementary Materials
The following supporting information can be downloaded at: https://www.mdpi.com/article/10.3390/min16090929/s1. Table S1. Geographic coordinates, parent lithology, and proximity of the soil sampling locations to known Fe–Cu mineralization zones and potential anthropogenic influences; Table S2. Raw geochemical analytical results and quality assurance/quality control (QA/QC) data for the soil samples; Table S3. Pairwise Pearson correlation coefficients ranked by ascending p-values and evaluated using the Benjamini–Hochberg false discovery rate (BH–FDR) procedure (Q = 0.05); Table S4. Sensitivity analysis of the PCA solution following exclusion of selected variables; Table S5. Geochemical compositions and descriptive statistics of the geological reservoirs used for normalization, together with summary statistics of the soil geochemical values normalized to the UCC, basalt, plagiogranite, and ignimbrite.
Author Contributions
Conceptualization, methodology, formal analysis, investigation, data curation, writing—original draft preparation, writing—review and editing, visualization, supervision, and project administration (M.H.T.). Investigation, writing—original draft preparation, and visualization (E.T.). All authors have read and agreed to the published version of the manuscript.
Funding
This research was supported by the Research Fund of Aksaray University (Project number: 2025–074).
Data Availability Statement
All data are included in the manuscript and Supplementary Materials.
Acknowledgments
This study forms part of the MSc thesis of the second author, conducted under the supervision of the first author. The authors gratefully acknowledge the Editor and the three anonymous reviewers for their constructive and insightful comments, which significantly improved the quality and clarity of this manuscript.
Conflicts of Interest
The authors declare no conflicts of interest.
Abbreviations
The following abbreviations are used in this manuscript:
| BH–FDR | Benjamini–Hochberg False Discovery Rate |
| CA | Correlation Analysis |
| CACC | Central Anatolian Crystalline Complex |
| CAG | Central Anatolian Granitoids |
| Cal | Calcite |
| CAM | Central Anatolian Metamorphics |
| CAO | Central Anatolian Ophiolites |
| Cc | Chalcocite |
| Ccp | Chalcopyrite |
| Chl | Chlorite |
| CRMs | Certified Reference Materials |
| CV | Coefficient of Variation |
| DL | Detection Limit |
| ED50 | European Datum 1950 |
| Ep | Epidote |
| GPS | Global Positioning System |
| HCA | Hierarchical Cluster Analysis |
| Hm | Hematite |
| KMO | Kaiser–Meyer–Olkin Measure |
| Lf | Lithic Fragment |
| MAD | Median Absolute Deviation |
| Mal | Malachite |
| MC–I | First Major Cluster |
| MC–II | Second Major Cluster |
| MSA | Measures of Sampling Adequacy |
| Mt | Magnetite |
| MTA | General Directorate of Mineral Research and Exploration |
| Opq | Opaque Minerals |
| PCA | Principal Component Analysis |
| PC(s) | Principal Component(s) |
| Pl | Plagioclase |
| Px | Pyroxene |
| Py | Pyrite |
| QA/QC | Quality Assurance/Quality Control |
| Qz | Quartz |
| RPD | Relative Percentage Difference |
| SD | Standard Deviation |
| Ser | Sericite |
| UCC | Upper Continental Crust |
| UTM | Universal Transverse Mercator |
| WD–XRF | Wavelength Dispersive X-ray Fluorescence Spectrometer |
References
- Çiftçi, E.; Kolayli, H.; Tokel, S. Lead-arsenic soil geochemical study as an exploration guide over the Killik volcanogenic massive sulfide deposit, Northeastern Turkey. J. Geochem. Explor. 2005, 86, 49–59. [Google Scholar] [CrossRef] [Scilit]
- Yaylalı-Abanuz, G.; Tüysüz, N. Statistical evaluation of the geochemical data from Akoluk epithermal gold area (Ulubey–Ordu), NE Turkey. Geochem. J. 2011, 45, 209–219. [Google Scholar] [CrossRef] [Scilit][Green Version]
- Yaylalı–Abanuz, G.; Tüysüz, N.; Akaryalı, E. Soil geochemical prospection for gold deposit in the Arzular area (NE Turkey). J. Geochem. Explor. 2012, 112, 107–117. [Google Scholar] [CrossRef] [Scilit]
- Yaylalı-Abanuz, G. Determination of anomalies associated with Sb mineralization in soil geochemistry: A case study in Turhal (northern Turkey). J. Geochem. Explor. 2013, 132, 63–74. [Google Scholar] [CrossRef] [Scilit]
- Köprübaşı, N.; Çiftçi, E.; Cordan, S.; Köprübaşı, N.; Özkul, C.; Tükel, F.Ş. Comparative geochemical study of soils developed on characteristic black and yellow polymetallic massive sulfide deposits in Eastern Pontides (NE Turkey). Turk. J. Earth Sci. 2014, 23, 129–146. [Google Scholar] [CrossRef] [Scilit]
- Martins–Ferreira, M.A.C.; Campos, J.E.G.; Pires, A.C.B. Near–mine exploration via soil geochemistry multivariate analysis at the Almas gold province, Central Brazil: A study case. J. Geochem. Explor. 2017, 173, 52–63. [Google Scholar] [CrossRef] [Scilit]
- Çavdar, B.; Günay, K. Soil geochemistry prospection of a mafic–clastic type volcanogenic massive sulfide deposit in Central Pontides: A case study from the Sarıseki deposit (Kastamonu, Türkiye). Neues Jahrb. Für Mineral. Abh. 2023, 198, 211–233. [Google Scholar] [CrossRef] [Scilit]
- Çavdar, B.; Günay, K. Soil geochemistry characteristics of bimodal–mafic type VMS deposits in the Central Pontides: Importance of data investigation in exploration and following discovery. Turk. J. Earth Sci. 2025, 34, 504–531. [Google Scholar] [CrossRef] [Scilit]
- Çavdar, B.; Günay, K.; Mutlu, H. Stream sediment and soil geochemistry of the largest volcanogenic massive sulfide deposit in Türkiye, Karaburun deposit (Central Pontides). J. Geochem. Explor. 2025, 277, 107816. [Google Scholar] [CrossRef] [Scilit]
- Li, S.; Tan, L.; Wang, Z.; Nie, R.; Meng, M.; Han, W.; Yang, C.; Li, J.; Zhang, B.; Liu, J. Soil geochemical characteristics and prospecting potential in the Nibao carlin–type gold deposit and peripheral areas, southwestern Guizhou, China. Minerals 2025, 15, 922. [Google Scholar] [CrossRef] [Scilit]
- Vural, A. Soil geochemistry survey for gold exploration at Kısacık area (Çanakkale, Ayvacık, Türkiye). Period. Mineral. 2024, 93, 61–83. [Google Scholar] [CrossRef] [PubMed]
- Anand, R.R.; Butt, C.R.M. A guide for mineral exploration through the regolith in the Yilgarn Craton, Western Australia. Aust. J. Earth Sci. 2010, 57, 1015–1114. [Google Scholar] [CrossRef] [Scilit]
- Iwamori, H.; Yoshida, K.; Nakamura, H.; Kuwatani, T.; Hamada, M.; Haraguchi, S.; Ueki, K. Classification of geochemical data based on multivariate statistical analyses: Complementary roles of cluster, principal component, and independent component analyses. Geochem. Geophys. Geosyst. 2017, 18, 994–1012. [Google Scholar] [CrossRef] [Scilit]
- Chen, Y.; Liu, Y.; Guo, P.; Chen, S.; Han, Z. Delineating geochemical anomalies based on the methods of principal component analysis, multifractal model, and singularity model: A case study of soil geochemical survey in the Hongyahuo area, Qinghai Province. Minerals 2025, 15, 585. [Google Scholar] [CrossRef] [Scilit]
- Terzi, M.H.; Kalkan, M. Evaluation of soil pollution by heavy metal using index calculations and multivariate statistical analysis. Environ. Monit. Assess. 2024, 196, 443. [Google Scholar] [CrossRef] [Scilit] [PubMed]
- Demirela, G.; Terzi, M.H.; Durgun, M.B. Comprehensive assessment of heavy metal contamination in forested and agricultural soils: Distribution patterns, source apportionment, environmental and human health risks. Sci. Total Environ. 2025, 1002, 180647. [Google Scholar] [CrossRef] [Scilit] [PubMed]
- Demirela, G.; Terzi, M.H.; Durgun, M.B. Heavy metal enrichments in rural environment soils, pollution dynamics, source identification, and the role of subsurface mineralizations. Sci. Rep. 2025, 15, 35858. [Google Scholar] [CrossRef] [Scilit] [PubMed]
- Özerkan, Ö.S.; Özerkan, Ö.; Akıska, S. Geostatistical modeling of stream sediment anomalies in the Biga Peninsula, NW Türkiye: A threshold–based approach for mineral exploration. Period. Mineral. 2026, 95, 1–23. [Google Scholar] [CrossRef] [PubMed]
- Zhou, D. Adjustment of geochemical background by robust multivariate statistics. J. Geochem. Explor. 1985, 24, 207–222. [Google Scholar] [CrossRef] [Scilit]
- Yusta, I.; Velasco, F.; Herrero, J.M. Anomaly threshold estimation and data normalization using EDA statistics: Application to lithogeochemical exploration in Lower Cretaceous Zn–Pb carbonate-hosted deposits, northern Spain. Appl. Geochem. 1998, 13, 421–439. [Google Scholar] [CrossRef] [Scilit]
- Reimann, C.; De Caritat, P. Establishing geochemical background variation and threshold values for 59 elements in Australian surface soil. Sci. Total Environ. 2017, 578, 633–648. [Google Scholar] [CrossRef] [Scilit] [PubMed]
- Göncüoğlu, M.C.; Toprak, V.; Kuşcu, İ.; Erler, A.; Olgun, E. Orta Anadolu Masifinin Batı Bölümünün Jeolojisi, Bölüm 1: Güney Kesim; Report No: 2909; TPAO Publication: Ankara, Türkiye, 1991. [Google Scholar]
- Göncüoğlu, M.C.; Toprak, V.; Kuşcu, İ.; Erler, A.; Olgun, E.; Rojay, B. Orta Anadolu Masifinin Batı Bölümünün Jeolojisi, Bölüm 2: Orta Kesim; Report No: 3155; TPAO Publication: Ankara, Türkiye, 1992. [Google Scholar]
- Göncüoğlu, M.C.; Erler, A.; Toprak, V.; Olgun, E.; Yalınız, K.; Kuşcu, İ.; Köksal, S.; Dirik, K. Orta Anadolu Masifinin Orta Bölümünün Jeolojisi, Bölüm 3: Orta Kızılırmak Tersiyer Baseni’nin Jeolojik Evrimi; Report No: 3313; TPAO Publication: Ankara, Türkiye, 1993. [Google Scholar]
- Oygür, V.; Alkan, M.; Cihnioğlu, M.; Gülseren, E.; Güyer, F.; Yıldırım, S. Ekecikdağı (Aksaray–Niğde) Yöresi Demir Prospeksiyonu Jeoloji Raporu; Report No: 8205; MTA Publication: Ankara, Türkiye, 1987. [Google Scholar]
- Kadıoglu, Y.K.; Dilek, Y.; Foland, K.A. Slab break–off and syncollisional origin of the Late Cretaceous magmatism in the Central Anatolian Crystalline Complex. In Postcollisional Tectonics and Magmatism in the Mediterranean Region and Asia; Dilek, Y., Pavlides, S., Eds.; Special Paper; Geological Society of America: Boulder, CO, USA, 2006; Volume 409, pp. 381–415. [Google Scholar] [CrossRef] [Scilit]
- Akıman, O.; Erler, A.; Göncüoğlu, M.C.; Güleç, N.; Geven, A.; Türeli, T.K.; Kadıoğlu, Y.K. Geochemical characteristics of granitoids along the western margin of the Central Anatolian Crystalline Complex and their tectonic implications. Geol. J. 1993, 28, 371–382. [Google Scholar] [CrossRef] [Scilit]
- Seymen, İ. Stratigraphy and metamorphism of the Kırşehir Massif around Kaman (Kırşehir–Turkey). Bull. Geol. Soc. Turk. 1981, 24, 7–14. [Google Scholar]
- Dönmez, M.; Akçay, A.E.; Kara, H.; Türkecan, A.; Yergök, A.F.; Esentürk, K. 1:100.000 Ölçekli Türkiye Jeoloji Haritaları: Aksaray–L32 Paftası; No: 52; MTA Publication: Ankara, Türkiye, 2005. [Google Scholar]
- Göncüoğlu, M.C.; Türeli, T.K. Petrology and geodynamic interpretation of plagiogranites from Central Anatolian Ophiolites (Aksaray–Turkey). Tr. J. Earth Sci. 1993, 2, 195–203. [Google Scholar]
- Yalınız, M.K.; Floyd, P.A.; Göncüoğlu, M.C. Supra–subduction zone ophiolites of Central Anatolia: Geochemical evidence from the Sarikaraman Ophiolite, Aksaray, Turkey. Mineral. Mag. 1996, 60, 697–710. [Google Scholar] [CrossRef] [Scilit]
- Floyd, P.A.; Yaliniz, M.K.; Goncuoglu, M.C. Geochemistry and petrogenesis of intrusive and extrusive ophiolitic plagiogranites, Central Anatolian Crystalline Complex, Turkey. Lithos 1998, 42, 225–241. [Google Scholar] [CrossRef] [Scilit]
- Yıldız, M.; Kalkan, M.; Dağlı, O. Pseudo Stratigraphy and Geochemical Features of the Ocean Crust Section of the Akmezar Ophiolite, Aksaray/Central Anatolia. In Proceedings of the International Cappadocia Scientific Research Congress–III, Göreme, Türkiye, 11–12 December 2022. [Google Scholar]
- Atabey, E. 1:100.000 Ölçekli Açınsama Nitelikli Türkiye Jeoloji Haritaları Serisi: Aksaray–H18 (K32) Paftası; MTA Publication: Ankara, Türkiye, 1989. [Google Scholar]
- Zhao, L.; Wang, Z.; Kong, L.; Zhao, Z.; Geng, B.; Gu, S.; Li, Y.; Han, X.; Liu, S.; Li, B.; et al. Risk assessment of soil heavy metals in mining activity areas: A case study in eastern Shandong Province. China. Environ. Earth Sci. 2023, 82, 513. [Google Scholar] [CrossRef] [Scilit]
- Ozer Atakoglu, O.; Yalcin, M.G.; Leventeli, Y.; San, B.T. Geochemistry of red soils in the Kas District of Antalya (Türkiye) using multivariate statistical approaches and GIS. Minerals 2023, 13, 772. [Google Scholar] [CrossRef] [Scilit]
- Benjamini, Y.; Hochberg, Y. Controlling the false discovery rate: A practical and powerful approach to multiple testing. J. R. Stat. Soc. Ser. B Methodol. 1995, 57, 289–300. [Google Scholar] [CrossRef] [Scilit]
- Ander, E.L.; Johnson, C.C.; Cave, M.R.; Palumbo-Roe, B.; Nathanail, C.P.; Lark, R.M. Methodology for the determination of normal background concentrations of contaminants in English soil. Sci. Total Environ. 2013, 454, 604–618. [Google Scholar] [CrossRef] [Scilit] [PubMed]
- Hawkes, H.E.; Webb, J.S. Geochemistry in Mineral Exploration; Harper: New York, NY, USA, 1962. [Google Scholar]
- Matschullat, J.; Ottenstein, R.; Reimann, C. Geochemical background–can we calculate it? Environ. Geol. 2000, 39, 990–1000. [Google Scholar] [CrossRef] [Scilit]
- Reimann, C.; Garrett, R.G. Geochemical background—Concept and reality. Sci. Total Environ. 2005, 350, 12–27. [Google Scholar] [CrossRef] [Scilit] [PubMed]
- Reimann, C.; Filzmoser, P.; Garrett, R.G. Background and threshold: Critical comparison of methods of determination. Sci. Total Environ. 2005, 346, 1–16. [Google Scholar] [CrossRef] [Scilit] [PubMed]
- Reimann, C.; Filzmoser, P. Normal and lognormal data distribution in geochemistry: Death of a myth. Consequences for the statistical treatment of geochemical and environmental data. Environ. Geol. 2000, 39, 1001–1014. [Google Scholar] [CrossRef] [Scilit]
- Taylor, S.R.; McLennan, S.M. The geochemical evolution of the continental crust. Rev. Geophys. 1995, 33, 241–265. [Google Scholar] [CrossRef] [Scilit]
- Çiner, A.; Aydar, E.; Dirik, K.; Rojay, B.; Ersoy, O.; Sayın, E.; Çubukçu, E.; Yıldırım, C.; Kutluay, A. Vertical Anatolian Movement Project; TÜBİTAK Project No: 107Y333; TÜBİTAK: Ankara, Türkiye, 2011.
- Rudnick, R.L.; Gao, S. Composition of the continental crust. In Treatise on Geochemistry; Holland, H.D., Turekian, K.K., Eds.; Elsevier–Pergamon: Oxford, UK, 2003; Volume 3, pp. 1–64. [Google Scholar] [CrossRef] [Scilit]
- Reimann, C.; De Caritat, P. Chemical Elements in the Environment: Factsheets for the Geochemist and Environmental Scientist, 1st ed.; Springer: Berlin, Germany, 1998. [Google Scholar] [CrossRef] [Scilit]
- Vural, A. Elemental pollution due to hydrothermal alteration: Canca (Gümüşhane–Türkiye). J. Investig. Eng. Technol. 2022, 5, 87–103. [Google Scholar]
- Kabata–Pendias, A. Trace Elements in Soils and Plants, 4th ed.; CRC Press (Taylor & Francis Group): Boca Raton, FL, USA, 2010. [Google Scholar] [CrossRef] [Scilit]
- Hooda, P.S. (Ed.) Trace Elements in Soils, 1st ed.; Wiley: Chichester, UK, 2010. [Google Scholar] [CrossRef] [Scilit]
- Reimann, C.; Birke, M.; Demetriades, A.; Filzmoser, P.; O’Connor, P. Chemistry of Europe’s Agricultural Soils, Part A: Methodology and Interpretation of the GEMAS Data Set; Geologisches Jahrbuch Reihe B, Band B 102; Schweizerbart Science Publishers: Stuttgart, Germany, 2014. [Google Scholar]
- Vithanage, M.; Kumarathilaka, P.; Oze, C.; Karunatilake, S.; Seneviratne, M.; Hseu, Z.Y.; Gunarathne, V.; Dassanayake, M.; Ok, Y.S.; Rinklebe, J. Occurrence and cycling of trace elements in ultramafic soils and their impacts on human health: A critical review. Environ. Int. 2019, 131, 104974. [Google Scholar] [CrossRef] [Scilit] [PubMed]
- Marescotti, P.; Comodi, P.; Crispini, L.; Gigli, L.; Zucchini, A.; Fornasaro, S. Potentially toxic elements in ultramafic soils: A study from metamorphic ophiolites of the Voltri Massif (Western Alps, Italy). Minerals 2019, 9, 502. [Google Scholar] [CrossRef] [Scilit]
- Zamanian, K.; Pustovoytov, K.; Kuzyakov, Y. Pedogenic carbonates: Forms and formation processes. Earth Sci. Rev. 2016, 157, 1–17. [Google Scholar] [CrossRef] [Scilit]
- Batool, M.; Cihacek, L.J.; Alghamdi, R.S. Soil inorganic carbon formation and the sequestration of secondary carbonates in global carbon pools: A review. Soil Syst. 2024, 8, 15. [Google Scholar] [CrossRef] [Scilit]
- Huang, J.H.; Matzner, E. Mobile arsenic species in unpolluted and polluted soils. Sci. Total Environ. 2007, 377, 308–318. [Google Scholar] [CrossRef] [Scilit] [PubMed]
- Grunsky, E.C.; Caritat, P.D. State-of-the-art analysis of geochemical data for mineral exploration. Geochem. Explor. Environ. Anal. 2020, 20, 217–232. [Google Scholar] [CrossRef] [Scilit]
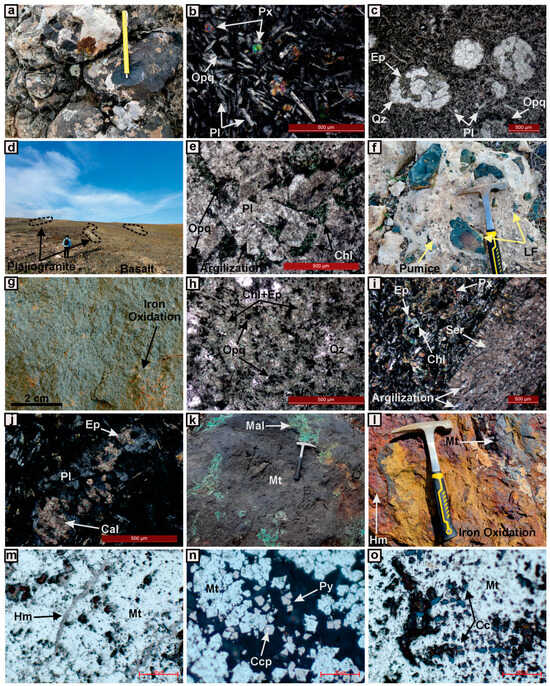
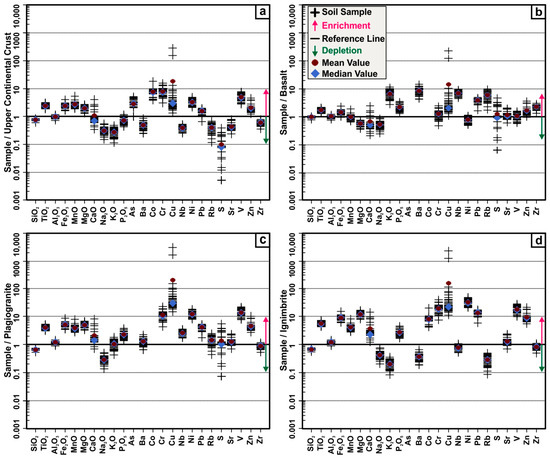
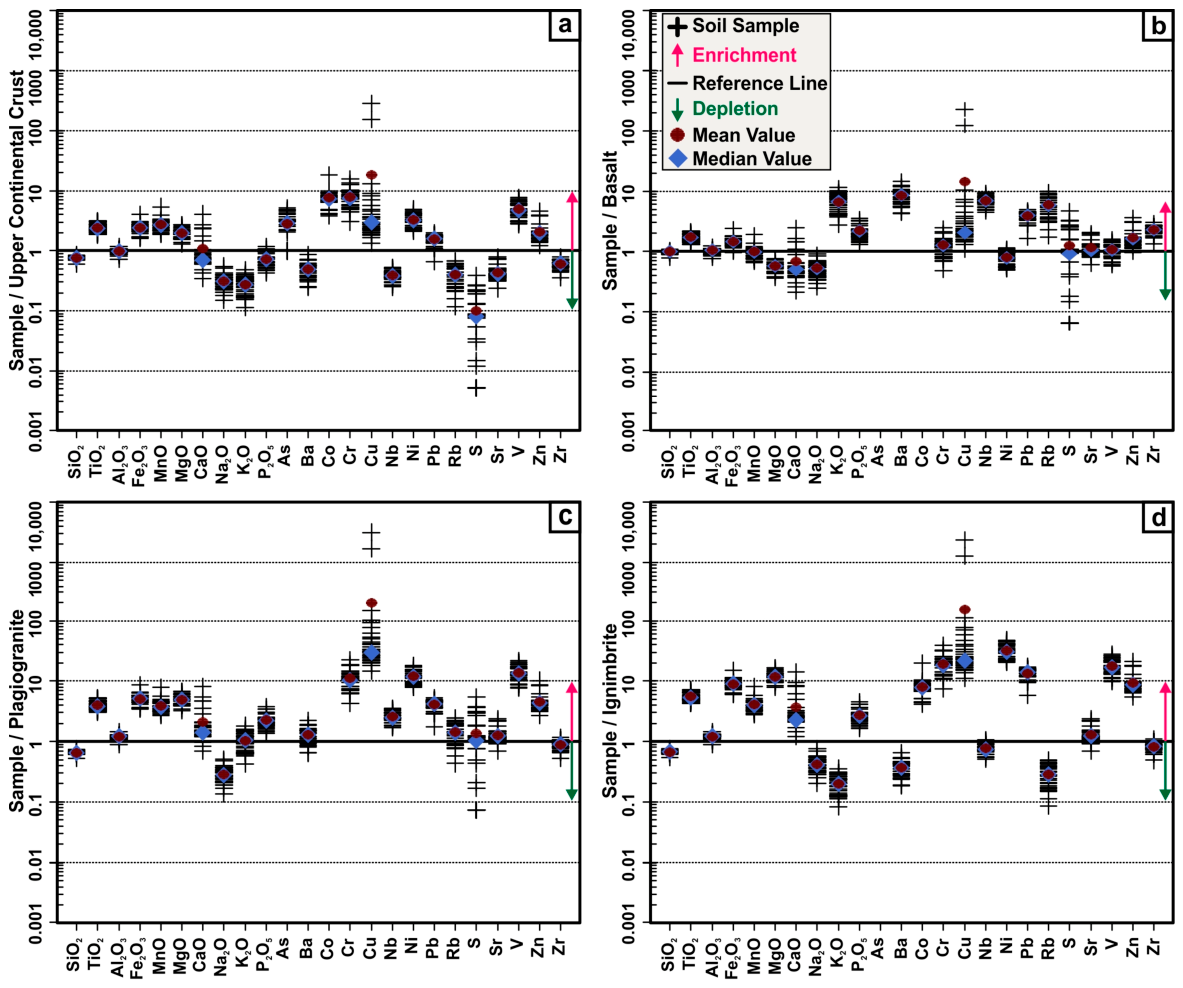
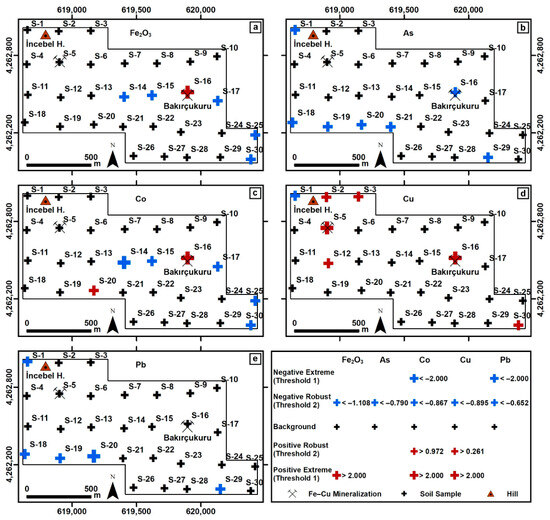
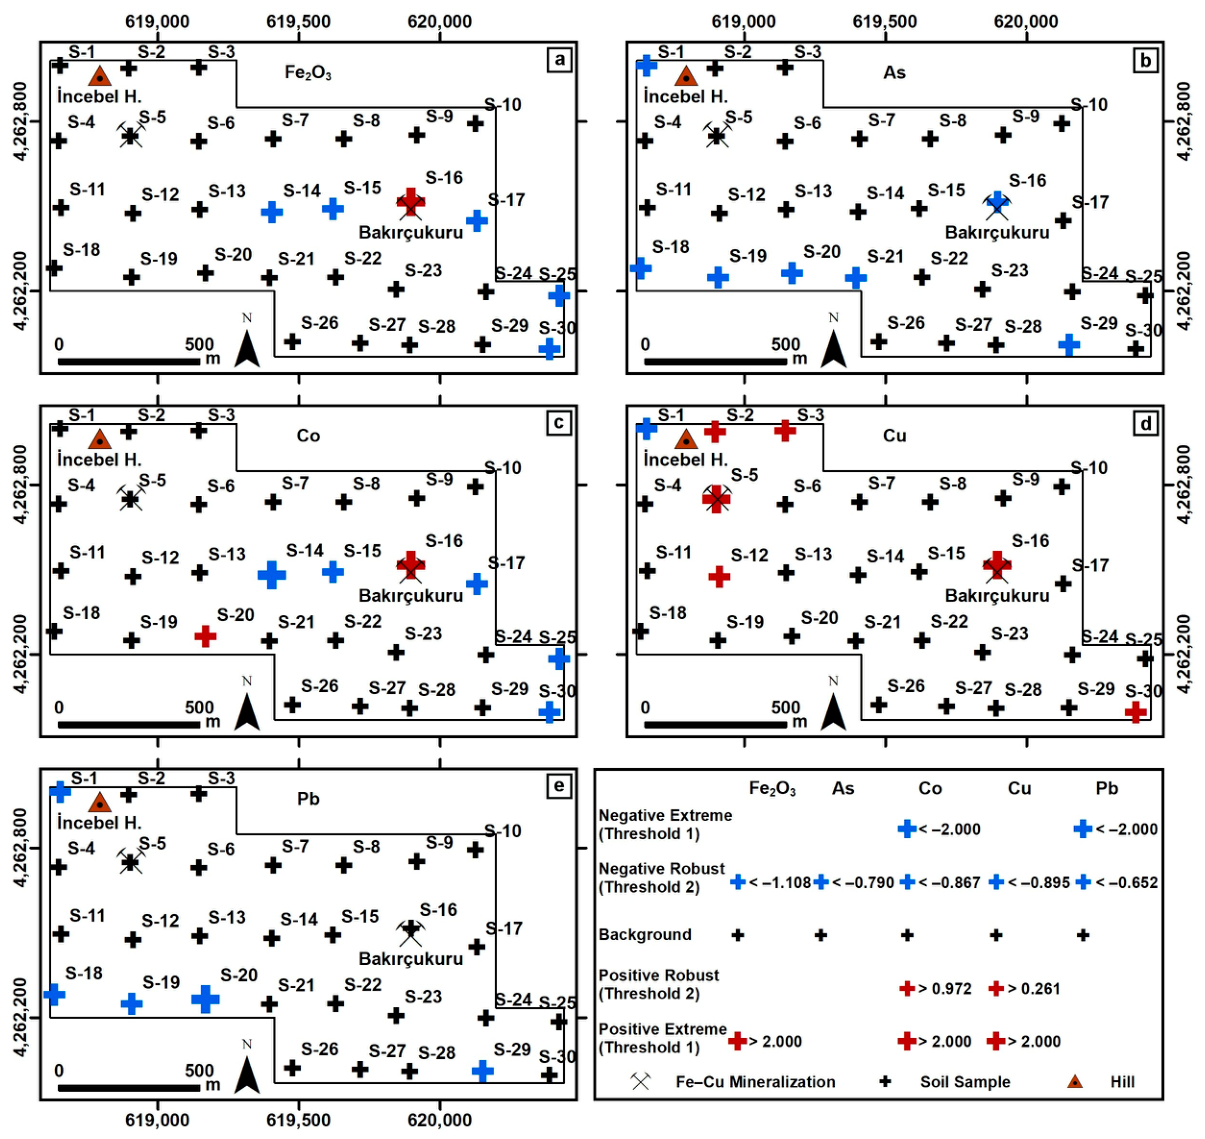
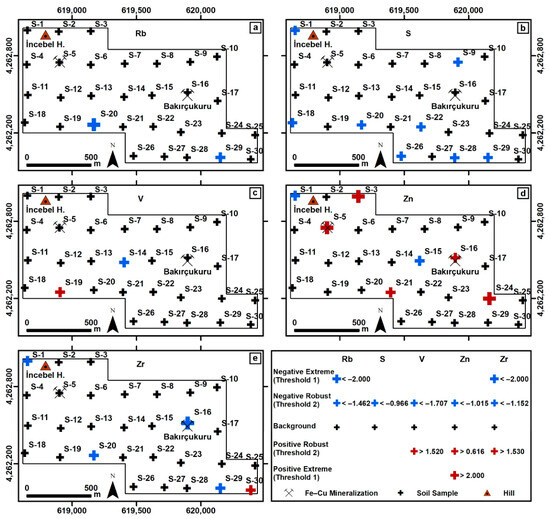
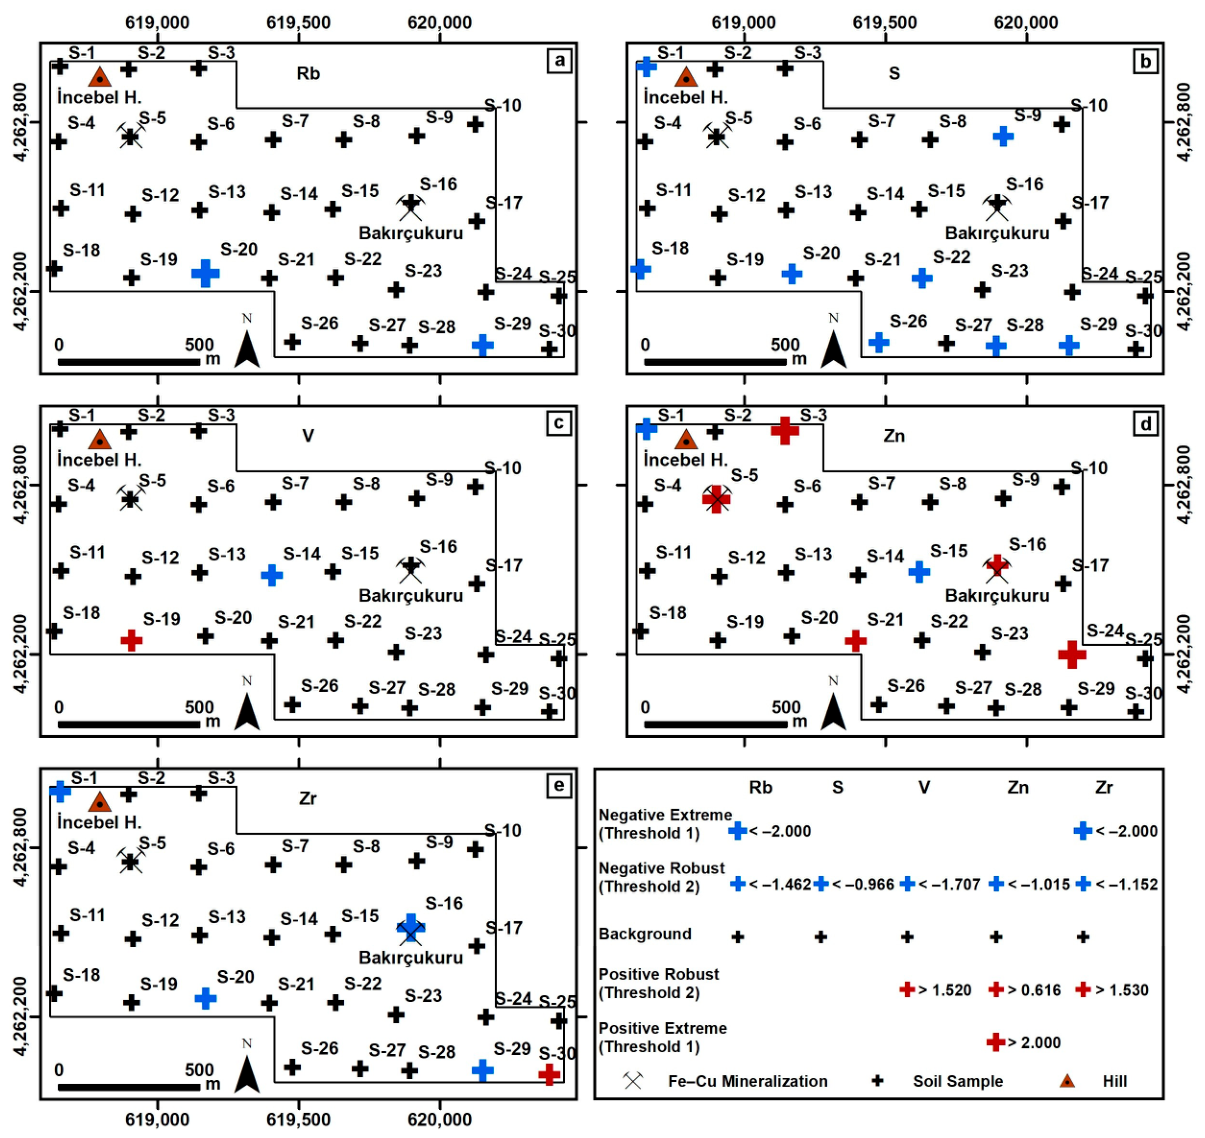
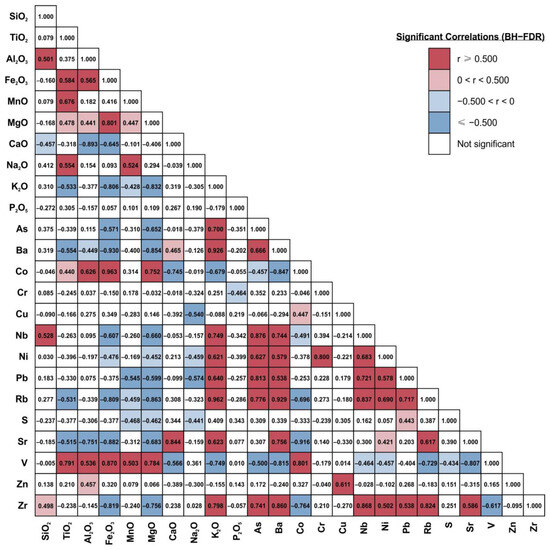
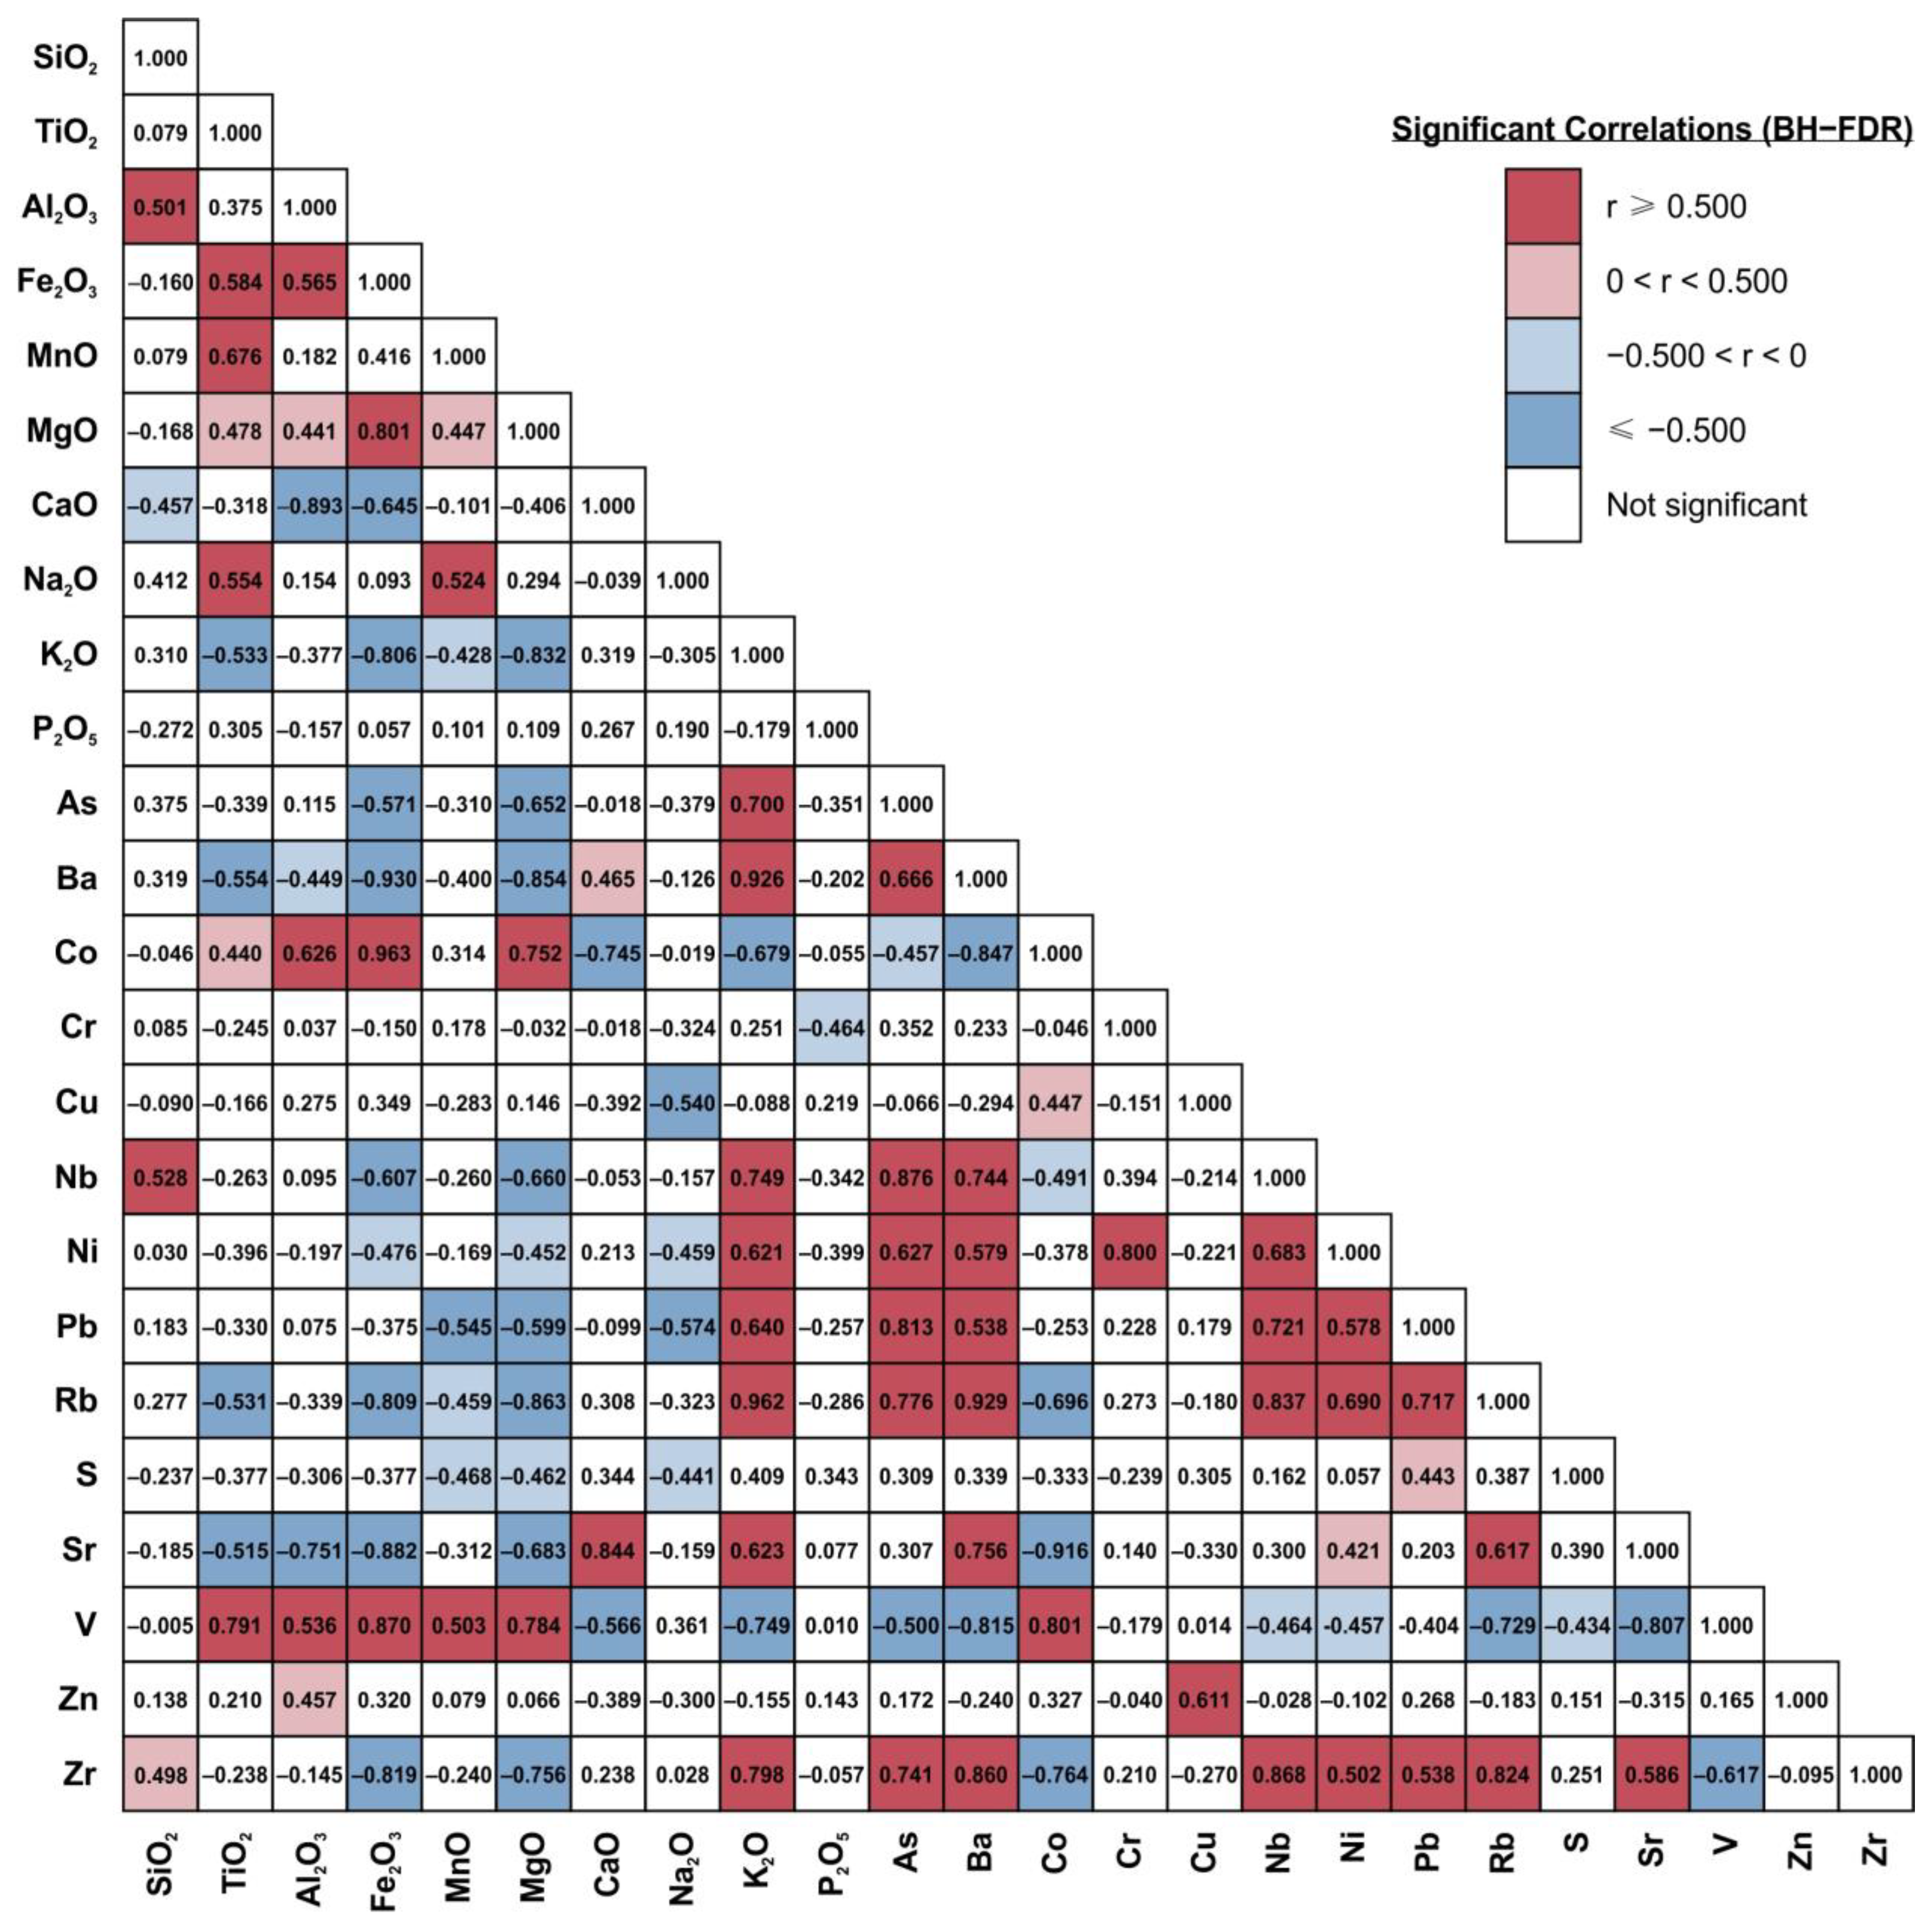
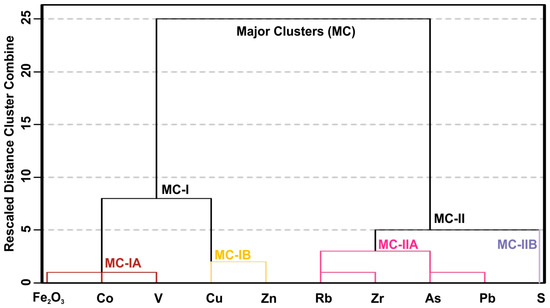
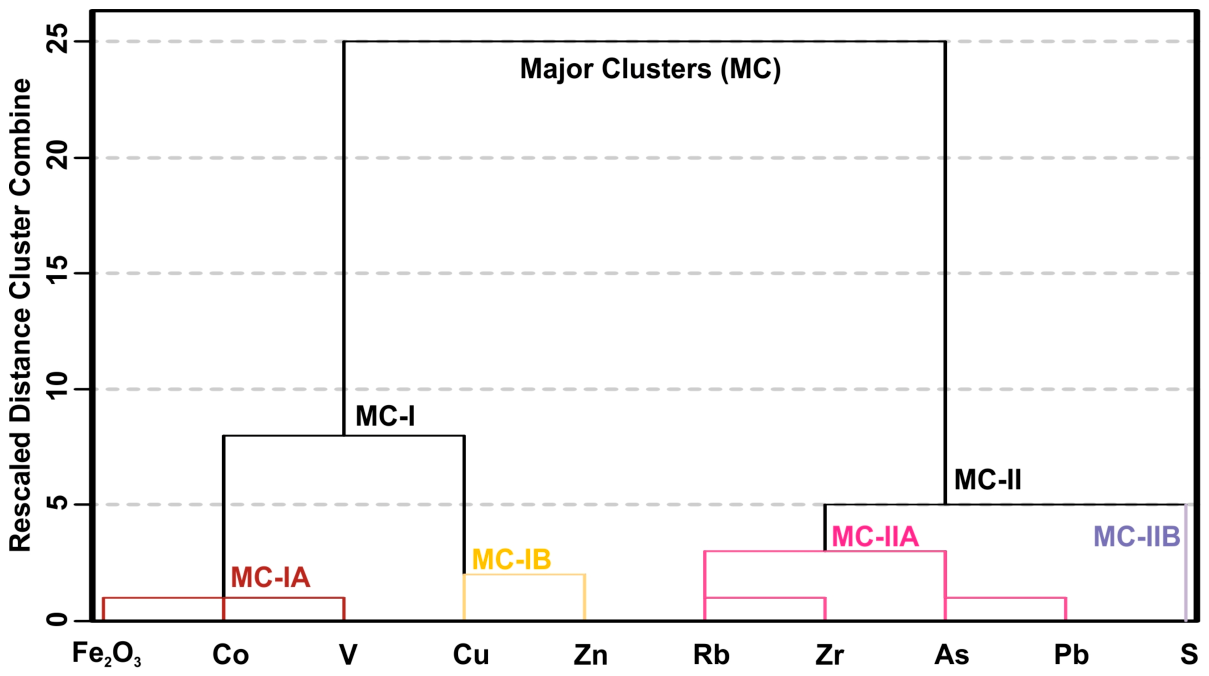
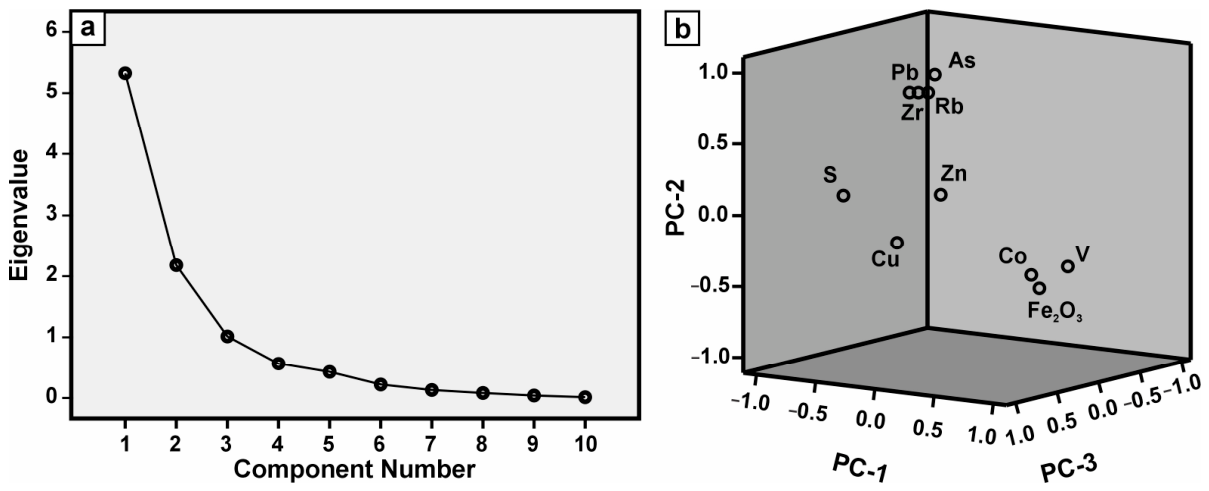
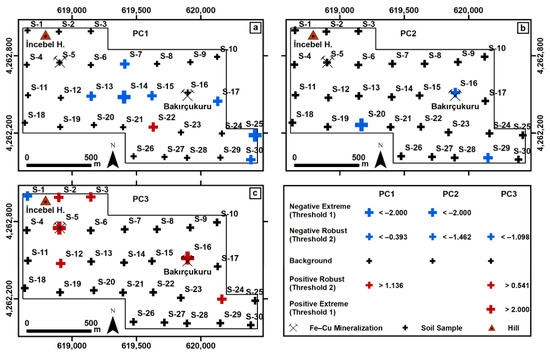
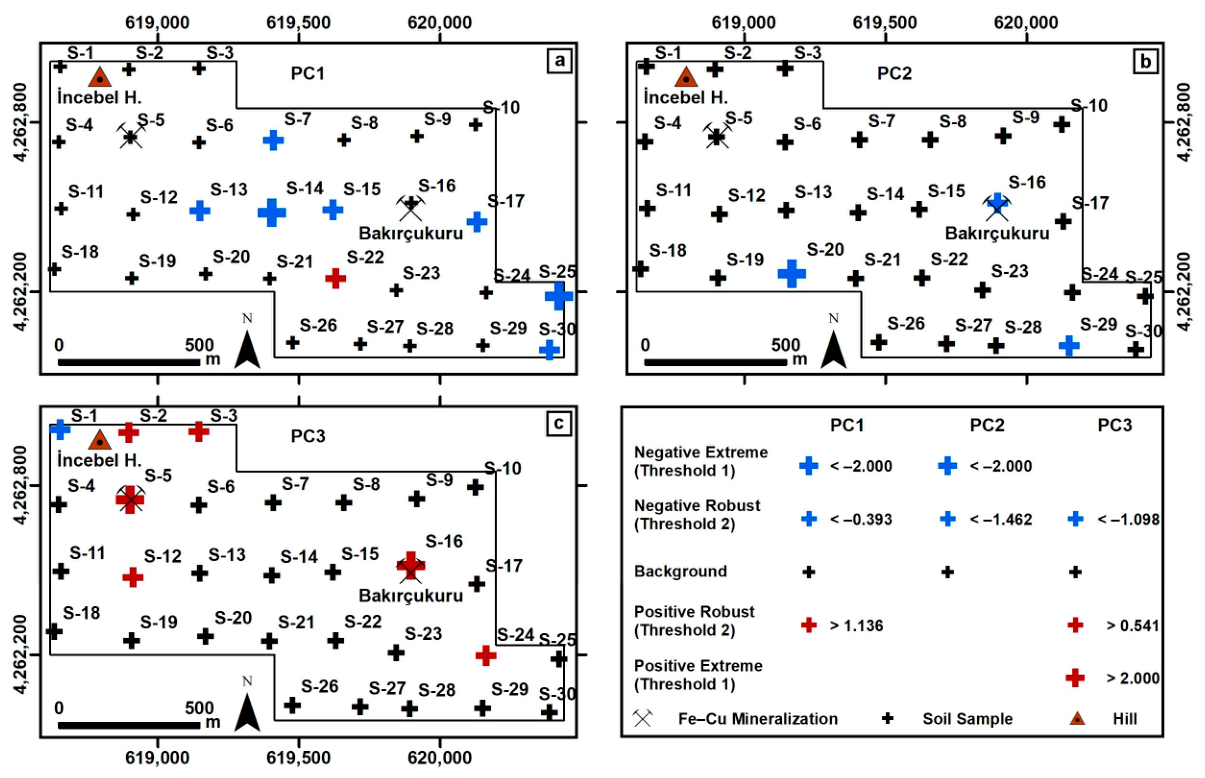

Disclaimer/Publisher’s Note: The statements, opinions and data contained in all publications are solely those of the individual author(s) and contributor(s) and not of MDPI and/or the editor(s). MDPI and/or the editor(s) disclaim responsibility for any injury to people or property resulting from any ideas, methods, instructions or products referred to in the content. |
© 2026 by the authors. Licensee MDPI, Basel, Switzerland. This article is an open access article distributed under the terms and conditions of the Creative Commons Attribution (CC BY) license.