


Abstract
The Lower Cambrian Yurtus Formation along the northwestern margin of the Tarim Basin has commonly been regarded as a regionally developed marine source-rock interval. However, the formation features strong internal source-rock heterogeneity, and the paleogeographic mechanism governing its thin organic-poor intervals remains to be further clarified, which constrains a more comprehensive understanding and evaluation of the Yurtus Formation. This study integrated whole-well source-rock geochemical data with major- and trace-element records from Well K1 in the Keping area to evaluate the geochemical background of the Yurtus Formation, its contrast with adjacent strata, and the internal differentiation of a thin and organic-poor interval at 5269–5274 m. The whole-well dataset of analytical results shows that the deep Yurtus-related section occurs within an overall low-TOC and low-S2 background. The 5269–5274 m interval is represented by only approximately 5 m of source-rock-bearing strata and is compositionally distinct from the adjacent carbonate-dominated strata. Compared with the adjacent intervals, the target interval has higher mean Al, Si, K, Ti, Fe, V, Cr, Zr, Rb, Sr, and U values, but lower Ca and Mg values. Elemental profiles and ratio data further define three first-order meter-scale geochemical subunits: an upper carbonate-rich subunit with high Ca and Ca/Al values, a middle aluminosilicate-rich subunit with higher Al, Si, K, Ti, and Fe values, and a lower chemically enriched subunit marked by elevated V, Cr, U, Sr, P/Ti, Sr/Ca, V/Cr, and S/Fe values. Mo enrichment is weak, and the available Mo–U and Mo/Al evidence does not support a definitive interpretation of persistent euxinic conditions. Therefore, the lower subunit is interpreted as recording relatively stronger reducing and chemically reactive conditions rather than a stable euxinic water column. Elevated P/Ti in the lower subunit is treated as phosphorus enrichment associated with redox-sensitive chemical fixation and/or early diagenetic redistribution, rather than as direct evidence for increased primary productivity alone. Regional comparison with published Yurtus sections and wells indicates that the thin, low-TOC, and compositionally differentiated interval in Well K1 represents a local expression of source-rock heterogeneity. The results suggest that slope-break-related paleogeographic differentiation controlled accommodation, sediment supply, hydrodynamic disturbance, preservation efficiency, and early diagenetic modification, thereby governing the heterogeneous development of the Yurtus Formation along the northwestern Tarim margin.
1. Introduction
The Tarim Basin is one of the most important superimposed petroliferous basins in western China, and its deep to ultra-deep Paleozoic successions have become a major target for current hydrocarbon exploration. Recent deep-structure mapping has shown that the basin contains a complex framework of uplifts, depressions, inherited faults, and deeply buried Cambrian–Precambrian structural units, providing the fundamental geological basis for evaluating deep source-rock systems and hydrocarbon accumulation [1]. Within this framework, the Keping faulted uplift in the northwestern Tarim Basin represents a structurally sensitive transition zone between uplifted paleogeomorphic highs and adjacent depressions. Its tectonic configuration, fault system, and slope-related architecture have been regarded as key factors controlling Cambrian stratigraphic distribution and hydrocarbon exploration potential [2]. More recently, the discovery of subsalt Cambrian hydrocarbons in the Keping uplift further demonstrated that this area has significant exploration value and that the source-rock system beneath the Cambrian carbonate succession requires more detailed geological and geochemical evaluation [3].
The Lower Cambrian source rocks in the Tarim Basin have long been considered a major contributor to the basin’s deep hydrocarbon system. The discovery of high-quality Lower Cambrian source rocks and their relationship with ultra-deep petroleum accumulation has emphasized the importance of the Yurtus Formation and equivalent basal Cambrian black shale intervals in regional petroleum generation [4]. Oil–source correlation studies based on biomarkers and organic geochemistry have further confirmed that Lower Paleozoic source rocks, especially the Lower Cambrian marine source-rock interval, played an important role in charging deep oil and gas reservoirs in the Tarim Basin [5]. Therefore, identifying the distribution, thickness, organic matter abundance, and controlling factors of the Lower Cambrian source rocks is essential for understanding deep hydrocarbon accumulation in northwestern Tarim.
Previous studies have shown that organic matter enrichment in the Lower Cambrian source rocks of the Tarim Basin was controlled by multiple environmental and sedimentological factors rather than by a single redox or productivity condition. Li et al. [6] demonstrated that organic matter enrichment in Lower Cambrian source rocks was governed by the coupling of primary productivity, redox condition, sedimentary dilution, and preservation efficiency. Deng et al. [7] further showed that different basin-margin settings in the Tarim Basin recorded different organic matter accumulation mechanisms, indicating that the Lower Cambrian black shale system was spatially heterogeneous. Geochemical evidence revealed that organic matter enrichment was associated with favorable preservation conditions, relatively high productivity, and reduced dilution in a deep or slope-related setting [8]. Trace element, iron speciation, and Mo isotope evidence also suggested that Early Cambrian black shale–chert deposition was controlled by changing redox states, hydrographic restriction, and local depositional conditions [9].
Elemental geochemical studies of basal Cambrian black shales and cherts have provided further constraints on depositional setting and tectonic history, showing that elemental enrichment patterns can record the combined effects of water-mass restriction, terrigenous input, hydrothermal influence, and sedimentary environment [10]. Trace element and stable isotope data from the lower Yurtus Formation indicated that chert–phosphorite deposition was closely related to nutrient supply, redox fluctuation, and chemical sedimentation during the earliest Cambrian transgression [11]. Tectono-sedimentary studies further suggested that Late Ediacaran to Early Cambrian basin reorganization controlled the spatial distribution of Lower Cambrian black shales through accommodation differentiation, slope-break development, and facies partitioning [12]. Depositional environment analysis of Early Cambrian marine shales also showed that organic matter accumulation was affected by the combined influence of lithofacies, water-column restriction, redox condition, and sediment supply [13].
Recent studies have further refined the understanding of Yurtus source-rock heterogeneity. Geochemical work on the Yurtus Formation along the northwestern margin of the Tarim Basin indicated that organic matter enrichment and depositional environment varied significantly among different lithofacies and stratigraphic positions [14]. Research on different-lithofacies source rocks in the Lower Cambrian Yurtus Formation emphasized that source-rock quality is strongly controlled by lithological composition, mineral assemblage, and depositional microfacies, which has direct implications for ultra-deep hydrocarbon exploration [15]. Hydrocarbon-generation restoration of deeply buried Early Cambrian Yurtus source rocks also showed that present-day TOC values may underestimate original generation potential, especially where deep burial and high thermal maturity have altered primary organic geochemical signals [16]. Previous investigations further suggested that organic matter accumulation in the Lower Cambrian Yurtus Formation was controlled by the interaction of productivity, preservation, and sedimentary dilution [17]. Regional tectonic analysis indicated that the Ediacaran–Cambrian structural framework exerted a first-order control on Cambrian source-rock distribution in the Tarim Basin [18]. Bitumen and source-rock geochemistry from the Keping area also demonstrated that Cambrian source rocks are closely related to deep hydrocarbon generation and migration in this structurally complex area [19]. In addition, evidence for hydrothermal activity in Early Cambrian black rocks suggests that local metal enrichment may be influenced by non-detrital chemical input, which should be considered when interpreting trace-element signals [20].
From a methodological perspective, black shale accumulation and source-rock evaluation require an integrated framework combining sequence stratigraphy, lithofacies, organic geochemistry, and inorganic geochemical proxies. Studies of the Lower Cambrian Yurtus Formation in the Tarim Basin demonstrated that organic matter enrichment is governed by the interplay of hydrothermal activity, upwelling currents, paleoproductivity, and redox conditions, rather than by a single factor [21]. Trace metals such as U, V, Mo, Ni, Cr, and Co have been widely used as paleoredox and paleoproductivity proxies, but their interpretation requires careful consideration of detrital input, water-mass restriction, and diagenetic redistribution [22]. Mo–U covariation has been proposed as an effective tool for distinguishing euxinic, anoxic, suboxic, and unrestricted marine conditions, especially when Mo enrichment is sufficiently developed [23]. Later applications of Mo–U systematics further emphasized that trace-metal covariation must be interpreted in relation to basin restriction, sedimentation rate, and organic carbon accumulation [24]. Mo–TOC covariation in modern anoxic marine environments also provides an important reference for reconstructing paleohydrographic restriction and trace-metal drawdown in ancient black shale systems [25].
Elemental proxy studies have also shown that redox interpretation should be based on multiple indicators rather than isolated elemental ratios. Trace-element behavior in cyclic shale successions indicates that enrichment of U, Mo, V, and related elements depends on both redox facies and sedimentary setting [26]. A reassessment of elemental paleoredox proxies further suggested that commonly used indices such as U/Th, V/Cr, Ni/Co, and Mo enrichment should be calibrated carefully against lithology, detrital background, and diagenetic alteration [27]. Redox classification and threshold calibration in sedimentary systems also showed that different proxies may respond to different chemical processes and should not be interpreted as direct equivalents of water-column redox state [28]. Studies of Mo cycling in euxinic and non-euxinic sediments refined the use of Mo as a paleoredox proxy and emphasized that weak Mo enrichment cannot be used alone to infer persistent euxinia [29]. Modern sediment studies on redox-sensitive metals further indicated that trace-metal enrichment can be influenced by sediment–water interface reactions, organic matter association, and early diagenesis [30]. Reviews of redox-sensitive trace metals have likewise stressed that U, V, Mo, and related elements must be interpreted in a multi-proxy framework [31].
The formation of organic-rich black shale also depends on broader depositional and biogeochemical conditions. A marine biogeochemical perspective on black shale deposition showed that productivity, water-column stratification, bottom-water oxygenation, and sedimentation rate jointly regulate organic matter preservation [32]. The trace-metal composition of recent organic-rich sediments provides modern analogues for interpreting ancient black shale formation and shows that enrichment of redox-sensitive elements is controlled by both environmental and diagenetic factors [33]. Classic work on anoxic environments and oil source-bed genesis established the fundamental link among restricted circulation, oxygen deficiency, organic matter preservation, and source-rock development [34]. Organic geochemical proxies have also been widely used to reconstruct paleoceanographic and paleoclimatic processes, although their reliability may be affected by thermal maturity and diagenetic alteration [35]. Early diagenesis of organic matter can modify primary carbon and nitrogen isotope signals, demonstrating that post-depositional processes should be considered when interpreting paleoenvironmental records from fine-grained sediments [36].
The Lower Cambrian Yurtus Formation developed during a critical interval of oceanic and biological transition from the late Neoproterozoic to the early Paleozoic. Multiproxy studies of ancient ocean euxinia have shown that redox stratification, sulfur cycling, and trace-metal enrichment varied strongly through time and space in Proterozoic and early Paleozoic oceans [37]. Evidence for late Neoproterozoic deep-ocean oxygenation suggests that changes in ocean redox structure may have influenced the rise of early animal life and the expansion of habitable marine environments [38]. Other studies have shown that ferruginous conditions remained widespread in later Neoproterozoic deep waters, indicating that ocean oxygenation was incomplete and heterogeneous [39]. The Neoproterozoic oxygenation event involved complex environmental perturbations and biogeochemical cycling, rather than a simple monotonic oxygen increase [40]. Statistical analysis of iron geochemical data has also suggested that late Proterozoic oxygenation was limited and spatially variable [41]. More broadly, Proterozoic ocean redox and biogeochemical stasis provide a background for understanding why early Cambrian marine environments could remain highly heterogeneous even during intervals of biological innovation [42].
Early Cambrian marine systems were characterized by strong spatial heterogeneity in redox structure and biogeochemical cycling. In the Yangtze Platform of South China, redox proxy data revealed a highly heterogeneous ocean during the early Cambrian, implying that local depositional environments could differ substantially even within the same broad marine system [43]. Oxygen-minimum-zone-like conditions at Chengjiang (Kunming, Yunnan Province, southwestern China) further indicate that low-oxygen settings were locally developed and may have influenced early Cambrian ecosystems [44]. Possible links between oxygen perturbations and the Cambrian radiation of animals suggest that environmental instability had broad biological and sedimentological significance [45]. Nitrogen and organic carbon isotope records from the southern margin of the Yangtze Platform revealed coupled marine redox variation and nitrogen cycling during the early Cambrian [46]. Paired carbon isotope records from the Meishucun section further documented carbon-cycle perturbations and environmental changes across the Ediacaran–Cambrian transition [47]. Nitrogen and organic carbon isotope stratigraphy of the Yangtze Platform also showed that nutrient cycling and redox structure varied during this transition, providing important analogues for interpreting early Cambrian marine systems in other cratonic basins [48].
Although these studies have substantially improved understanding of Lower Cambrian black shale deposition, several problems remain unresolved for the Keping area and the northwestern Tarim margin. First, most previous work has emphasized thick and organic-rich Yurtus source-rock intervals, whereas thin and organic-poor intervals have received less attention. Second, the relationship between slope-break-controlled paleogeography and source-rock heterogeneity remains insufficiently constrained at the well-section scale. Third, many studies interpret organic matter enrichment mainly through productivity and redox proxies, but the roles of carbonate dilution, aluminosilicate input, phosphorus redistribution, and early diagenetic overprint require more explicit evaluation. Fourth, thin intervals with low TOC may still preserve important geochemical signals, even if they do not represent high-quality source rocks.
The Yurtus Formation in Well K1 from the Keping area, northwestern Tarim Basin, was investigated using whole-well source-rock geochemical data together with major and trace element records from the Yurtus Formation and adjacent strata. Rather than treating the 5269–5274 m interval as an isolated thin bed, this study first established the whole-well geochemical background of the formation and then identified the anomalously thin and organic-poor interval within its broader stratigraphic context. On this basis, elemental proxies related to depositional end members, redox structure, sulfidic preservation, and nutrient supply were used to characterize the vertical geochemical differentiation of the target interval and to evaluate its relationship with adjacent strata. The aim was not simply to characterize a thin, local section with low Total Organic Carbon (TOC) content., but to determine whether this anomalous interval represented the depositional response to slope-break-controlled paleogeographic differentiation, and thereby to clarify how such differentiation contributed to the heterogeneous development of the Lower Cambrian Yurtus source rocks along the northwestern margin of the Tarim Basin.
2. Geological Background
2.1. Regional Tectonics and Sedimentary Patterns
The Tarim Basin is a large superimposed petroliferous basin in western China and records a prolonged history of tectonic reactivation, differential subsidence, and multi-stage sedimentary infilling [49]. Its first-order structural architecture, as illustrated in Figure 1, is commonly described as an alternating framework of uplifts and depressions [50]. Within this framework, the northwestern margin formed a tectonically transition between uplifted paleogeomorphic highs and adjacent depocenters [51]. The Keping area lies within this northwestern marginal domain and forms part of a structurally differentiated belt in which the Keping faulted uplift, the Wensu uplift, and the Awati sag jointly produced pronounced paleotopographic relief [52,53]. This inherited relief governed accommodation partitioning, sediment routing, and water-mass exchange along the basin margin.
Figure 1.
Geological setting of the Keping area and stratigraphic context of the Yurtus Formation. (a) Structural division map of the Tarim Basin showing the location of Well K1 in the Keping faulted uplift; (b) tectono-stratigraphic cross-section across the Keping area showing the position of the Lower Cambrian Yurtus Formation near the slope-break setting.
During the Early Cambrian, regional marine transgression established a depositional profile that graded from platformal carbonate settings into slope and more distal basinward environments [54]. This profile did not evolve across a uniformly gentle shelf. Instead, inherited tectonic relief imposed strong lateral segmentation on the depositional system, and slope-break geometries developed as key boundaries separating areas with contrasting hydrodynamic regimes, sediment supply, and preservation potential [55]. Across these slope transitions, carbonate contribution, terrigenous input, depositional continuity, and bottom-water ventilation could vary over short distances [56]. As a result, the northwestern Tarim margin did not sustain a single laterally persistent mode of black shale accumulation, but preserved a mosaic of depositional microenvironments in which source-rock thickness and organic matter abundance varied with paleogeomorphic position.
The structural and seismic information available for the Keping sector, as illustrated in Figure 2, suggests that Early Cambrian depositional architecture was strongly conditioned by pre-Cambrian tectonic inheritance. In particular, inherited extensional troughs and associated depth trends influenced the geometry of the lower stratigraphic succession, the spatial distribution of accommodation, and the position of slope transitions. Under such circumstances, Yurtus source-rock development cannot be assumed to have been laterally uniform even within the same regional tectonic belt. Instead, it likely responded to local variations in topographic gradient, depositional confinement, sediment supply, hydrodynamic energy, and bottom-water renewal, all of which were especially sensitive near slope-break zones.
Figure 2.
The east-west spliced prestack time profile of the eastern part of the south area of Keping (The colored lines mark contacts between different formations). (a) Seismic profile oriented to the northwest of well K1; (b) seismic profile oriented to the southeast of well K1; (c) spliced seismic profile in the southeast direction of well K1.
2.2. Sequence Strata and Lithological Assemblage of the Yurtus Formation
The Lower Cambrian Yurtus Formation represents the earliest fine-grained marine transgressive succession above the terminal Ediacaran strata in the northwestern Tarim Basin and forms one of the principal marine source-rock intervals of the region. Stratigraphically, it underlies the overlying Cambrian carbonate-dominated platform succession and records a major depositional transition from pre-Cambrian tectonically inherited substrates to an expanding Lower Cambrian marine system. This stratigraphic position is significant because the formation captured the earliest response of the basin margin to marine flooding, enhanced accommodation, and changing sedimentary circulation.
Regionally, the formation consists predominantly of black mudstone and shale, locally interbedded with siliceous and phosphatic intervals and, in some sectors, carbonate-bearing lithologies. Such lithological associations indicate that deposition was controlled by fine-grained siliciclastic settling, episodic chemical or biochemically mediated silica accumulation, nutrient-related phosphogenesis, and variable carbonate input from adjacent platformal domains. In more favorable depocenters or relatively distal slope settings, these processes produced comparatively thick and organic-rich black shale intervals. In contrast, in paleogeographically elevated or slope-break-controlled settings, the formation became thinner, more heterogeneous, and more susceptible to end-member switching, reflecting unstable accommodation, rapid facies migration, and greater hydrodynamic disturbance.
From the sequence-stratigraphic perspective, the Yurtus Formation generally corresponds to an early transgressive fine-grained depositional interval, commonly linked to transgressive system tracts and, in some cases, to the vicinity of maximum flooding conditions. Under such settings, organic matter enrichment depended not only on primary productivity, but also on the persistence of water-column stratification, the degree of bottom-water renewal, and the extent to which siliciclastic or carbonate dilution was suppressed. Where accommodation expanded and stratification remained stable, relatively thick organic-rich intervals could accumulate. Where slope instability, topographic relief, or enhanced lateral transport intensified carbonate influx, terrigenous dilution, or bottom-water ventilation, the same formation could become condensed, discontinuous, and comparatively poor in organic matter. The Yurtus Formation therefore represents not a single depositional facies, but a tectonically and sedimentologically partitioned source-rock system.
2.3. Overview of the Studied Well Section
This study focuses on Well K1 in the Keping area, located within a structurally transitional sector along the northwestern margin of the Tarim Basin. The well is positioned in a setting jointly influenced by uplift-related paleotopography and adjacent sag-controlled accommodation, making it suitable for evaluating the effects of inherited relief and slope-break development on source-rock architecture. Against the whole-well geochemical background and the regional stratigraphic framework of the Yurtus Formation, particular attention was given to the interval between 5269 and 5274 m, where the formation is represented by only approximately 5 m of source-rock-bearing strata and relatively low TOC values. This interval differs from the thicker and more organic-rich Yurtus sections previously reported from the Keping area and adjacent regions. It is therefore treated in this study as a thin, organic-poor, and compositionally differentiated local expression of the formation, rather than as an organic-rich anomaly.
3. Materials and Methods
3.1. Sample Information
This study investigated the Lower Cambrian Yurtus Formation and its associated strata in Well K1 from the Keping area along the northwestern margin of the Tarim Basin. Two datasets were integrated. The first comprised whole-well source-rock geochemical data spanning depths of 610–5375 m, including lithology, TOC, Volatile Hydrocarbons (S0), Free Hydrocarbons (S1), Pyrolyzable Hydrocarbons (S2), Peak Pyrolysis Temperature (Tmax), Hydrocarbon Generation Potential (PG), Pyrolyzable Carbon (PC), Gas Production Index (GPI), Oil Production Index (OPI), Total Production Index (TPI), Hydrocarbon Potential Index (HPI) and Light-Heavy Hydrocarbon Ratio (PS). The second comprised elemental geochemical data from Well K1 spanning depths of 202–5300 m and including both major and trace elements. These datasets were matched by burial depth and jointly used to establish the whole-well geochemical background, characterize the vertical evolution of the Yurtus Formation, and identify anomalous intervals.
Against this well-scale framework, the Yurtus interval between 5269–5274 m was selected for detailed analysis because it represented an unusually thin source-rock-bearing section with relatively low TOC values compared with previously reported Yurtus sections from the Keping area and adjacent regions. Six elemental samples from this interval were used for detailed evaluation of major elements, trace elements, and derived geochemical proxies.
The six elemental samples across the 5269–5274 m interval correspond to an approximately meter-scale sampling resolution. This resolution is sufficient for identifying first-order vertical geochemical differences within the target interval, but some sub-decimeter-scale intra-bed variability may be undersampled. Consequently, the three-subunit subdivision proposed in this study is interpreted as a meter-scale geochemical architecture rather than a complete high-frequency depositional record. Additional high-resolution sampling, petrographic observation, and mineralogical analysis would be required to further verify the finer sub-interval architecture. Layout diagram of the test instruments is shown in Figure 3.
Figure 3.
Layout diagram of the test instruments. (a) Sample weighing (the samples enclosed in the red box on the right are those analyzed in this study); (b) constant volume; (c) atomic fluorescence test; (d) XRF; (e) ICPOES; (f) ICPMS.
3.2. Analytical Items and Experimental Procedures
The analytical program included major elements, trace elements, TOC, and selected characteristic elements. Major elements were determined using ICP-OES 5800 (Agilent, in Wuhan, China) and X-ray fluorescence spectrometry, trace elements were determined using ICPMS 7850 (Agilent, in Wuhan, China), selected characteristic elements were analyzed using AFS8500 (Beijing Haiguang, in Wuhan, China) where required, and TOC was determined by combustion–infrared absorption. All analyses were conducted in accordance with laboratory analytical protocols and relevant standard procedures.
3.2.1. Major Element Analysis
Major elements were determined using ICP-OES 5800 in combination with XRF. First, the samples were dried and ground to a homogeneous powder. The powders were then prepared either by fusion or pelletization, depending on the analytical requirement. The resulting solutions or prepared discs were subsequently analyzed by ICP-OES 5800 and XRF to obtain concentrations of major elements, including Al, Si, Ca, Ti, Fe, P and S. This combined analytical approach provided robust bulk-composition data and ensured adequate support for subsequent evaluation of depositional end members and dilution effects.
3.2.2. Trace Element Analysis
Trace elements were determined using ICPMS 7850. First, the known mass of powdered sample was placed into a sealed digestion vessel. The sample was then digested using an acid mixture under high-temperature sealed conditions until complete decomposition was achieved. After digestion, the solution was evaporated, re-dissolved, and diluted to a fixed volume. Calibration blanks and multi-level standard solutions were subsequently used to establish external calibration curves, and the final concentrations of trace elements, including V, Cr, Co, Ni, Cu, Zn, Rb, Sr, Zr, Nb, Mo, Pb, Th and U, were measured using ICPMS 7850. Instrumental interference correction and analytical quality control were applied throughout the procedure.
3.2.3. Characteristic Element Analysis
Selected characteristic elements were analyzed using AFS8500 atomic fluorescence spectrometry where applicable. First, the samples were digested and converted into an appropriate analytical solution. The target elements were then transformed into volatile hydride species under reductive conditions and introduced into the atomizer. Fluorescence signals were subsequently measured and converted into elemental concentrations using standard calibration curves. This method served as a complementary approach for trace-level determination of characteristic elements.
3.2.4. Total Organic Carbon Analysis
Total organic carbon was determined by the combustion-infrared absorption method. First, the samples were crushed to the required grain-size range. The powders were then treated with hydrochloric acid to remove inorganic carbon. After repeated rinsing to neutrality, the samples were dried at low temperature. The treated material was subsequently combusted under an oxygen atmosphere, converting organic carbon into CO2. The evolved gas was then quantified by infrared detection, and the TOC content was calculated from the calibrated signal. These measurements were used to establish the whole-well source-rock geochemical background and to define the organic matter abundance of the Yurtus Formation.
3.3. Indicator System
To characterize the whole-well geochemical background of the Yurtus Formation and constrain environmental variations within the key interval, four groups of indicators were established: source-rock geochemical parameters, depositional end-member and dilution proxies, redox and sulfidic preservation proxies, and nutrient- and phosphorus-related indicators.
Source-rock geochemical parameters included TOC, S0, S1, S2, PG, PC, Tmax, and related derivative indices. These parameters were used to evaluate organic matter abundance, hydrocarbon-generation potential, and thermal maturity. Depositional end-member and dilution proxies included Ca/Al, Si/Al, Sr/Ca, Rb/Sr, Al/(Al+Fe), Fe/Ti, and major-element concentrations such as Al, Si, Ca, Ti, and Fe. These indices were used to distinguish carbonate input, aluminosilicate contribution, sedimentary dilution, and possible diagenetic modification.
Redox and sulfidic preservation proxies included U/Th, V/Cr, Ni/Co, S/Fe, Mo/Al, U/Al, and Mo-U covariation. These ratios were used to evaluate relative redox-sensitive element behavior and to assess whether the lower interval records a shift toward more reducing and chemically reactive conditions. Because no single proxy can fully resolve depositional redox conditions, these indices were interpreted collectively and conservatively. In particular, Mo-related proxies were used to avoid over-assigning the lower subunit to persistent euxinic conditions.
Nutrient- and phosphorus-related proxies included Ba/Ti, P/Ti, P/Al, and P/Fe. These normalized ratios were used to evaluate phosphorus enrichment while minimizing distortion caused by shifts in bulk sediment composition. Because phosphorus can be remobilized and reprecipitated during early diagenesis under reducing conditions, P/Ti was not treated as a direct productivity proxy. Instead, P-related proxies were used to evaluate possible coupling among phosphorus enrichment, redox-sensitive chemical fixation, and early diagenetic redistribution.
3.4. Data Processing and Calculations
To ensure comparability among datasets, major and trace element data were first standardized to a consistent unit basis. Major elements were reported in wt%, whereas trace elements were reported in ppm. For all normalized ratios involving both major and trace elements, major-element concentrations were converted to ppm according to:
where is the concentration expressed in ppm and is the concentration expressed in wt%. Ratios between major elements were calculated directly from wt% values:
Redox-sensitive trace-element ratios were calculated directly from ppm values:
Normalized trace-element and nutrient-related ratios were expressed in ppm/ppm form:
The sulfur-to-iron ratio and diagenetic screening indices were calculated as:
External calibration for ICPMS measurements followed a linear model:
where is the concentration, is the instrumental response intensity, and and are calibration coefficients. Potential interference was corrected according to
where is the corrected concentration, is the measured concentration, is the concentration contributed by the interfering species, and is the corresponding interference coefficient.
For TOC determination, infrared quantification followed the Lambert–Beer relationship:
where is absorbance, is the molar absorption coefficient, is the optical path length, and is the gas concentration.
4. Results
4.1. Whole-Well Source-Rock Geochemical Background
The whole-well source-rock geochemical dataset includes 528 samples from depths of 610–5375 m. As shown in Table 1, TOC values range from 0.1800% to 1.0000%, with a whole-well mean of 0.2218%. S2 values range from 0.0132 to 3.4115 mg/g, with a mean of 0.1722 mg/g. Tmax values range from 311 °C to 500 °C, with a mean of 401.28 °C.
Table 1.
Whole-well source-rock geochemical statistics of Well K1.
The deep interval between 5208 and 5274 m includes 19 source-rock geochemical samples. TOC values in this interval range from 0.1981% to 0.2148%, with a mean of 0.2051%, remaining below the whole-well mean of 0.2218%. S2 values range from 0.0827 to 0.1434 mg/g, with a mean of 0.1083 mg/g. Tmax values range from 384 °C to 455 °C, with a mean of 401.74 °C. Figure 4 shows the vertical profiles of TOC, S1, S2, and Tmax in Well K1. It should be noted that samples with Tmax values below 400 °C are commonly coupled with extremely low S2 yields that are close to or below the detection limit of the Rock-Eval pyrolysis instrument. These low Tmax data are therefore not reliable for assessment, and we have excluded them from subsequent discussion.
Figure 4.
Whole-well source-rock geochemical profiles of Well K1.
The 5269–5274 m target interval occurs within the lower part of the 5208–5274 m deep interval. In the whole-well source-rock profile, this target interval corresponds to a low-TOC and low-S2 section. The relationship among the whole-well dataset, the 5208–5274 m deep interval, and the 5269–5274 m target interval is shown in Figure 4.
4.2. Geochemical Contrast Between the Target Interval and Adjacent Strata
As shown in Table 2, the 5269–5274 m target interval differs from the adjacent strata in both major- and trace-element composition. Relative to the adjacent mean, Al and Si are elevated approximately fivefold and threefold, respectively, whereas Ca and Mg are depleted.
Table 2.
Statistical comparison of the target interval and adjacent strata.
Mean Al increases from 0.5293% in the adjacent intervals to 2.6340% in the target interval. Mean Si increases from 3.0514% to 9.7805%. Mean Ca declines from 18.0994% in the adjacent intervals to 12.0144% in the target interval, and mean Mg declines from 9.6014% to 6.6963%. Mean K, Ti, and Fe increase from 0.7611%, 0.1840%, and 0.5756% in adjacent strata to 2.7410%, 0.4517%, and 1.7829% in the target interval, respectively.
Selected trace elements also show different mean values between the target interval and adjacent strata. Mean V increases from 199.7373 ppm to 388.2062 ppm, Cr from 20.5316 ppm to 39.0883 ppm, Zr from 72.3640 ppm to 187.6576 ppm, Rb from 24.2702 ppm to 63.0382 ppm, Sr from 272.2458 ppm to 488.2420 ppm, and U from 2.4195 ppm to 3.6194 ppm. Mean Mo changes from 1.5926 ppm in adjacent strata to 1.4474 ppm in the target interval. Figure 5 presents the vertical comparison between the upper adjacent interval, the target interval, and the lower adjacent interval.
Figure 5.
Geochemical comparison of the Yurtus interval and adjacent strata in Well K1.
4.3. Detailed Geochemical Characteristics of the Anomalous 5269–5274 m Interval
4.3.1. Major and Minor Elements
As shown in Table 3, the 5269–5274 m interval displays internal variability in major and minor elements over 5 m of stratigraphic thickness. Al ranges from 0.7501% to 3.8512%, Si from 4.5801% to 12.7686%, and Ca from 8.7711% to 17.3554%.
Table 3.
Major element data of the target interval of Well K1.
At 5269 m, Al, Si, and Ca are 1.5012%, 9.4106%, and 12.8931%, respectively. At 5270 m, Ca reaches 17.3554%, whereas Al and Si decrease to 0.7501% and 4.5801%, respectively. At 5271–5272 m, Al and Si are higher than those at 5270 m. Al increases to 2.5645% at 5271 m and 3.8512% at 5272 m. Si increases to 9.5392% at 5271 m and 12.7686% at 5272 m. Ca decreases to 11.1317% at 5271 m and 8.7711% at 5272 m. At 5273–5274 m, Al remains above 3.5%, Si remains above 10%, and Ca ranges from 10.1576% to 11.7775%.
P and S show their highest values in the lower part of the interval. P increases from 0.1466% at 5272 m to 0.6088% at 5273 m and 1.6010% at 5274 m. S increases from 0.3122% at 5272 m to 1.2476% at 5273 m and 1.5750% at 5274 m. Ti also increases downward, from 0.2636% at 5269 m and 0.1591% at 5270 m to 0.7577% at 5273 m and 0.8949% at 5274 m. Figure 6 presents the integrated elemental profiles of the 5269–5274 m interval.
Figure 6.
Integrated elemental profiles of the target 5269–5274 m interval in the Yurtus Formation.
4.3.2. Trace Elements
As shown in Table 4, trace-element concentrations vary within the 5269–5274 m interval. V ranges from 155.81 ppm to 868.77 ppm, Cr from 19.57 ppm to 71.07 ppm, U from 2.50 ppm to 7.75 ppm, Mo from 1.10 ppm to 1.69 ppm, Ba from 549.93 ppm to 1103.71 ppm, and Sr from 188.75 ppm to 1334.12 ppm.
Table 4.
Trace-element data of the target interval of Well K1.
V remains between 155.81 ppm and 217.49 ppm from 5269 m to 5272 m, and then increases to 767.28 ppm at 5273 m and 868.77 ppm at 5274 m. Cr ranges from 19.57 ppm to 32.64 ppm from 5269 m to 5272 m, and then increases to 62.12 ppm at 5273 m and 71.07 ppm at 5274 m. U ranges from 2.50 ppm to 2.70 ppm from 5269 m to 5272 m, increases to 3.66 ppm at 5273 m, and reaches 7.75 ppm at 5274 m.
Mo shows a narrower range than V, Cr, and U. Mo is 1.69 ppm at 5269 m, 1.59 ppm at 5270 m, 1.356 ppm at 5271 m, 1.35 ppm at 5272 m, 1.577 ppm at 5273 m, and 1.10 ppm at 5274 m. Sr shows a strong increase in the lower part of the interval, from 192.26 ppm at 5272 m to 755.85 ppm at 5273 m and 1334.12 ppm at 5274 m. Figure 7 shows the detailed trace-element profiles of the 5269–5274 m interval.
Figure 7.
Detailed trace-element profiles of the 5269–5274 m interval.
4.4. Calculated Geochemical Ratios of the 5269–5274 m Interval
Calculated geochemical ratios of the 5269–5274 m target interval are listed in Table 5. Ca/Al ranges from 2.27 to 23.13. The highest Ca/Al value occurs at 5270 m, whereas lower values occur at 5271–5274 m. Si/Al ranges from 2.99 to 6.26, with higher values at 5269–5270 m and lower values at 5273–5274 m.
Table 5.
Calculated geochemical ratios of the 5269–5274 m target interval.
Redox-sensitive ratios show vertical variation within the interval. U/Th ranges from 0.28 to 1.48. It remains between 0.28 and 0.33 from 5269 m to 5272 m, increases to 0.48 at 5273 m, and reaches 1.48 at 5274 m. V/Cr ranges from 5.4239 to 12.3500. The lowest V/Cr value occurs at 5271 m, whereas the highest values occur at 5273–5274 m. Ni/Co ranges from 2.3990 to 11.5940, with higher values at 5270 m and 5273–5274 m. S/Fe ranges from 0.0828 to 1.1243. It is lowest at 5271–5272 m and increases to 0.6537 at 5273 m and 1.1243 at 5274 m.
Element-normalized and phosphorus-related ratios also vary with depth. Ba/Ti ranges from 0.1233 to 0.3987 and reaches its maximum at 5270 m. P/Ti ranges from 0.4038 to 1.7890, with the highest value at 5274 m. Mo/Al remains low throughout the interval, ranging from 0.0000 to 0.0002. Zr/Ti decreases downward from 0.1243 at 5269 m to 0.0258 at 5274 m. Rb/Sr ranges from 0.04 to 0.46 and reaches its maximum at 5272 m. Sr/Ca ranges from 10.87 to 113.27 and reaches its highest values at 5273–5274 m.
The ratio data show three depth-related patterns. First, Ca/Al reaches a clear maximum at 5270 m. Second, U/Th, V/Cr, S/Fe, Sr/Ca, and P/Ti show higher values in the lower part of the interval, especially at 5273–5274 m. Third, Mo/Al remains low and does not show a corresponding enrichment trend. These ratio profiles are shown in Figure 8.
Figure 8.
Calculated geochemical-ratio profiles and first-order vertical segmentation of the 5269–5274 m interval.
4.5. Neutral Summary of Measured Features
The measured results show that the 5269–5274 m target interval differs from adjacent strata in both elemental composition and calculated geochemical ratios. Compared with adjacent strata, the target interval has higher mean Al, Si, K, Ti, Fe, V, Cr, Zr, Rb, Sr, and U values, and lower mean Ca and Mg values. Within the target interval, Ca/Al reaches its highest value at 5270 m, Al and Si reach their highest values at 5272 m, and V, Cr, U, Sr, P/Ti, Sr/Ca, V/Cr, and S/Fe show higher values at 5273–5274 m. Mo/Al remains low throughout the interval. These measured features provide the data basis for the subsequent discussion of depositional end-member variation, redox-sensitive element behavior, phosphorus enrichment, early diagenetic modification, and regional source-rock heterogeneity.
5. Discussion
5.1. Meter-Scale Geochemical Architecture of the 5269–5274 m Interval
Although the 5269–5274 m interval is thin and overall poor in organic matter, the integrated elemental and ratio profiles show that it is not geochemically homogeneous. The measured Ca/Al, Si/Al, U/Th, V/Cr, S/Fe, Sr/Ca, and P/Ti values define a first-order vertical architecture that can be divided into three meter-scale subunits: an upper carbonate-rich subunit, a middle aluminosilicate-rich subunit, and a lower chemically enriched subunit.
The upper subunit, represented mainly by 5269–5270 m, is characterized by relatively high Ca and Ca/Al values. Ca/Al reaches its maximum at 5270 m, while Al and Si remain comparatively low at the same depth. This pattern indicates a stronger carbonate contribution relative to aluminosilicate input. The middle subunit, represented by 5271–5272 m, is marked by higher Al, Si, K, Ti, and Fe contents and lower Ca/Al values. This pattern indicates increased aluminosilicate contribution and stronger clay- or silt-related dilution. The lower subunit, represented by 5273–5274 m, is characterized by higher V, Cr, U, Sr, P/Ti, Sr/Ca, V/Cr, and S/Fe values. This pattern indicates a discrete interval of chemical enrichment relative to the overlying middle subunit.
This threefold architecture is important because it shows that the target interval should not be treated as a single depositional unit in paleoenvironmental interpretation. Bulk averages would obscure the internal transition from chemically enriched deposition, through aluminosilicate-rich deposition, and to carbonate-rich deposition. The interval therefore records short-scale changes in sediment supply, redox-sensitive element behavior, phosphorus enrichment, carbonate-related chemical modification, and early diagenetic processes.
However, the subdivision must be interpreted conservatively. The six elemental samples across the 5269–5274 m interval provide approximately meter-scale sampling resolution. This resolution is sufficient to identify first-order vertical geochemical differences, but it cannot fully resolve sub-decimeter-scale intra-bed variability. Some geochemical changes, such as the Ca/Al maximum at 5270 m and the P/Ti increase at 5273–5274 m, are captured by a small number of samples. Therefore, the three-subunit model should be regarded as a meter-scale geochemical framework rather than a complete high-frequency depositional record. Additional high-resolution sampling, thin-section observation, XRD mineralogy, and petrographic evidence would be required to further verify the finer sub-interval architecture.
5.2. Depositional End-Member Switching and Sedimentary Dilution
The reciprocal behavior of Ca, Al, and Si indicates rapid depositional end-member switching within the 5269–5274 m interval. The upper subunit has high Ca and Ca/Al values, suggesting stronger carbonate input. In contrast, the middle subunit has higher Al, Si, K, Ti, and Fe values and lower Ca/Al values, suggesting increased aluminosilicate input. This shift from carbonate-rich to aluminosilicate-rich composition indicates that the target interval was affected by unstable sediment supply and short-scale facies variation.
In a slope-break-controlled setting, hydrodynamic energy, sediment transport pathways, accommodation, and water-mass exchange can vary sharply over short distances. Carbonate input may increase during phases of platform-derived sediment supply or local winnowing, whereas aluminosilicate input may increase during phases of stronger clay- or silt-bearing influx. These processes can produce rapid lithochemical alternations over a thin stratigraphic interval. The 5269–5274 m interval therefore records not a gradual monotonic change, but a short depositional package in which carbonate input, aluminosilicate dilution, and chemical enrichment alternated over only a few meters.
This end-member switching also helps explain the weak organic matter enrichment of the interval. Organic matter accumulation is controlled by the balance among organic matter supply, sedimentary dilution, preservation efficiency, and depositional residence time. From the base upward, the lower subunit exhibited stronger redox-sensitive and phosphorus-related signals, although this chemically favorable interval was limited in thickness from the very beginning of its deposition. The middle subunit experienced enhanced aluminosilicate input, which diluted organic matter and may have increased sedimentation instability. In the upper subunit, carbonate-rich deposition increased the proportion of non-organic sediment and further diluted bulk organic matter. Therefore, the interval did not develop into a thick high-TOC source-rock package.
The target interval should therefore be interpreted as a thin, organic-poor, and compositionally differentiated interval formed under alternating depositional end members. Its low TOC does not mean that paleoenvironmental signals are absent. Instead, it indicates that geochemical differentiation occurred under conditions where dilution, limited thickness, and unstable preservation prevented substantial organic matter accumulation.
5.3. Redox Variation Constrained by U/Th, V/Cr, S/Fe, Mo–U, and Mo/Al
The redox-sensitive proxies show that redox-related chemical behavior varied within the 5269–5274 m interval. U/Th remains relatively low from 5269 m to 5272 m and increases at 5273–5274 m, reaching its maximum at 5274 m. V/Cr also shows higher values in the lower subunit, with the highest values occurring at 5273–5274 m. S/Fe is lowest in the middle subunit and increases markedly in the lower subunit. These patterns indicate that the lower subunit experienced relatively stronger reducing and chemically reactive conditions than the overlying middle subunit.
Nevertheless, the Mo evidence requires a conservative interpretation. Mo ranges only from approximately 1.10 ppm to 1.69 ppm across the target interval and does not show strong enrichment. The Mo–U relationship shows that U increases strongly at 5274 m, whereas Mo remains within a narrow range and does not increase synchronously. Mo/Al also remains low throughout the interval and does not define a strong Mo-enrichment trend comparable to U/Th, V/Cr, or S/Fe. Therefore, the available Mo-related evidence does not support a definitive interpretation of persistent euxinic conditions.
This distinction is critical. U/Th, V/Cr, and S/Fe can indicate relative redox variation, but they should not be used alone to assign a stable euxinic water-column state. U enrichment can be affected by adsorption onto organic matter or mineral surfaces, reduction at the sediment–water interface, and early diagenetic fixation. V enrichment can be influenced by redox conditions, clay minerals, organic association, and authigenic mineral formation. S/Fe depends not only on reducing conditions, but also on sulfate supply, reactive iron availability, and pyrite formation efficiency. Mo is generally more diagnostic for persistent euxinia when strongly enriched, but such enrichment is weak in the present interval.
Accordingly, the lower subunit is interpreted as recording relatively stronger reducing and chemically reactive conditions rather than persistent euxinia. This interpretation is also consistent with the low TOC background. In thin and organic-poor intervals, redox-sensitive trace elements may preserve local chemical signals without corresponding to a thick organic-rich black shale. The lower subunit therefore records local redox-sensitive enrichment and early authigenic fixation, but not a sustained euxinic and high-TOC depositional system.
5.4. Phosphorus Enrichment, Productivity, and Early Diagenetic Redistribution
P/Ti increases in the lower part of the 5269–5274 m interval and reaches its highest value at 5274 m. P/Al and P/Fe also increase in the lower subunit. These patterns indicate phosphorus enrichment relative to relatively immobile detrital or bulk-sediment components. The coincidence of high P/Ti with high U/Th, high Sr/Ca, and high S/Fe suggests that phosphorus enrichment is linked to the lower-interval chemical event recorded by redox-sensitive and carbonate-related proxies.
However, P/Ti should not be interpreted as a direct and exclusive productivity proxy. Phosphorus can be remobilized, regenerated, adsorbed, and reprecipitated during early diagenesis, especially under reducing conditions. Under such conditions, phosphorus may be released from organic matter or Fe-bound phases and then re-fixed as authigenic phosphate or carbonate-associated phosphate. Therefore, elevated P/Ti may reflect increased nutrient availability, enhanced phosphorus retention at the sediment–water interface, authigenic phosphate formation, and/or early diagenetic redistribution.
The P/Ti–U/Th relationship provides a useful but not definitive constraint. The highest P/Ti value occurs where U/Th is also highest, especially at 5274 m. This association indicates that phosphorus enrichment is more closely linked to redox-sensitive chemical conditions than to organic matter enrichment alone. Because TOC remains low in the target interval, the lower P-enriched subunit cannot be interpreted simply as a high-productivity and high-organic-matter interval. Instead, it is more appropriate to interpret it as a phosphorus-enriched and chemically reactive interval affected by redox-sensitive fixation and early diagenetic redistribution.
This revision reduces the interpretive strength of the productivity argument. The lower subunit may have experienced improved nutrient retention or local phosphorus concentration, but the data do not prove a sustained increase in primary productivity. The available evidence supports relative phosphorus enrichment, not a direct productivity maximum. Therefore, productivity is treated here as one possible contributing factor, whereas early diagenetic redistribution and redox-sensitive chemical fixation are regarded as necessary components of the interpretation.
5.5. Diagenetic Overprint and Proxy Reliability
Several geochemical proxies used in this study may be influenced by early diagenetic modification. U, V, S/Fe, Sr/Ca, P/Ti, and P/Fe can respond not only to primary depositional conditions, but also to pore-water evolution, mineral transformation, authigenic precipitation, and post-depositional redistribution. Therefore, the lower chemically enriched subunit should not be interpreted as a purely primary depositional signal.
The high Sr/Ca values at 5273–5274 m require particular caution. Sr/Ca may reflect carbonate-related chemical processes, but it can also be affected by carbonate mineralogy, selective preservation, aragonite-to-calcite recrystallization, dolomitization, and evolved pore-water conditions. Therefore, the high Sr/Ca values in the lower subunit are interpreted as evidence of carbonate-related chemical enrichment and possible diagenetic modification, rather than as a direct primary salinity or seawater signal.
The Fe/Ti–Al/(Al+Fe) relationship provides a simple screening framework for evaluating detrital versus non-detrital contributions. If Fe/Ti and Al/(Al+Fe) vary together with aluminosilicate-sensitive elements, the signal may largely reflect detrital input. If Fe enrichment is decoupled from Al and Ti, authigenic or diagenetic iron phases may be involved. In the present interval, the available data suggest that both detrital input and non-detrital chemical processes may have contributed to the observed patterns. However, the magnitude of diagenetic modification cannot be quantified with the current dataset.
The absence of rare-earth-element data further limits proxy discrimination. REE patterns, Ce anomalies, Eu anomalies, and shale-normalized distributions could help distinguish terrigenous, hydrothermal, hydrogenous, and diagenetic sources, especially in the lower chemically enriched subunit where V, Cr, U, P, and Sr are jointly elevated. Without REE data, the source of chemical enrichment cannot be fully separated into primary seawater, detrital, hydrothermal, or diagenetic components.
Despite these limitations, the lower subunit shows a coherent multi-proxy enrichment pattern rather than isolated single-element anomalies. The co-occurrence of elevated V, Cr, U, Sr, P/Ti, Sr/Ca, V/Cr, and S/Fe suggests that the lower subunit records a real chemical differentiation event. The most defensible interpretation is that this event was shaped by combined depositional redox variation, sediment–water interface reactions, and early diagenetic fixation. It should not be attributed to a single primary depositional process.
5.6. Regional Comparison and Paleogeographic Control on Source-Rock Heterogeneity
The 5269–5274 m interval in Well K1 differs markedly from many published Yurtus sections and wells in the Tarim Basin. In several basinal or more favorable margin settings, the Yurtus Formation contains thicker black shale intervals and higher TOC values. In contrast, the K1 target interval is only approximately 5 m thick and remains organic-poor. This contrast indicates that Yurtus source-rock development along the northwestern Tarim margin was heterogeneous rather than uniformly organic-rich.
To strengthen the regional comparison, Table 6 summarizes representative Yurtus sections and wells from the Tarim Basin. The comparison includes source-rock interval thickness, TOC characteristics, lithology, and paleoenvironmental interpretation. These data show that Well K1 represents a thin, condensed, and low-TOC expression of the Yurtus Formation, whereas other sections and wells record thicker and more organic-rich source-rock intervals. The difference lies not only in TOC, but also in interval thickness, lithological architecture, sedimentary dilution, and preservation efficiency.
Table 6.
Regional comparison of representative Lower Cambrian Yurtus source-rock intervals in the Tarim Basin.
The regional contrast supports a paleogeographic control model. In deeper or more stable depositional settings, accommodation was greater, stratification was more persistent, sedimentary dilution was weaker, and preservation efficiency was higher. Under these conditions, thicker and more organic-rich Yurtus intervals could form. In slope-break or paleogeographically elevated settings, however, hydrodynamic disturbance, condensation, reworking, end-member switching, and bottom-water renewal were stronger. These processes reduced the continuity and organic richness of the source-rock interval.
Well K1 belongs to the latter type. Its thin and organic-poor target interval reflects local slope-break-related differentiation rather than a basin-wide absence of source-rock-forming conditions. The K1 interval therefore should not be taken as contradicting the regional importance of the Yurtus Formation as a source-rock unit. Instead, it records one local expression of a heterogeneous source-rock system, in which thickness, TOC, lithology, redox-sensitive element behavior, and preservation potential varied with paleogeographic position.
This interpretation also explains why the K1 interval contains both chemical enrichment and weak organic matter enrichment. Local reducing conditions and phosphorus enrichment developed in the lower subunit, but the depositional window was too short and dilution was too strong to produce a thick high-TOC interval. Therefore, slope-break-controlled differentiation governed not only the elemental composition of the target interval, but also the failure of that interval to develop into a laterally continuous organic-rich source rock.
5.7. Why Chemically Enriched Conditions Did Not Produce Strong Organic-Matter Accumulation
The target interval illustrates that chemical enrichment and organic matter enrichment are not equivalent. The lower subunit records elevated V, Cr, U, Sr, P/Ti, Sr/Ca, V/Cr, and S/Fe values, yet the interval as a whole remains low in TOC and S2. This mismatch can be explained by the combined effects of sedimentary dilution, limited stratigraphic thickness, short accumulation window, and early diagenetic redistribution.
First, carbonate input in the upper subunit and aluminosilicate input in the middle subunit both diluted organic matter in the bulk sediment. Carbonate-rich deposition increased the proportion of inorganic carbonate material, whereas clay- and silt-rich input increased detrital dilution. Both processes reduced the apparent concentration of organic matter.
Second, the chemically enriched lower subunit was very thin. Even if reducing conditions improved locally, the duration or thickness of favorable preservation was limited. A short-lived reducing event can produce clear enrichment in redox-sensitive elements without generating a thick organic-rich source rock. This explains why the lower subunit shows stronger U/Th, V/Cr, S/Fe, P/Ti, and Sr/Ca signals but does not show strong TOC enrichment.
Third, part of the chemical enrichment may have been produced or modified during early diagenesis. Redox-sensitive element fixation, phosphorus redistribution, and carbonate-related recrystallization can enhance specific elemental signals without requiring high organic productivity. Therefore, the lower subunit may record a chemically reactive sediment–water interface and early pore-water processes rather than a sustained organic-matter accumulation system.
The formation of the 5269–5274 m interval was therefore controlled by the balance between favorable and unfavorable processes. Reducing and chemically reactive conditions improved locally in the lower subunit, but carbonate dilution, aluminosilicate dilution, hydrodynamic disturbance, limited thickness, and short accumulation windows prevented the development of a sustained high-TOC source-rock interval.
5.8. Limitations and Implications
This study provides well-scale evidence for heterogeneous development of the Lower Cambrian Yurtus Formation in the Keping area, but several limitations must be recognized. First, the six elemental samples from the 5269–5274 m interval provide only meter-scale resolution. This sampling density is sufficient for identifying first-order geochemical differentiation, but it cannot resolve high-frequency intra-bed variability. Some short-scale changes may therefore be undersampled or aliased.
Second, the absence of REE data limits discrimination among terrigenous, hydrothermal, hydrogenous, and diagenetic sources. This limitation is important for the lower chemically enriched subunit, where V, Cr, U, P, and Sr are jointly elevated. Third, petrographic observation, XRD mineralogy, Fe speciation, sulfur isotope data, and carbonate mineralogical data are not available in the current dataset. These data would be needed to quantify authigenic mineral formation, pyrite fixation, carbonate recrystallization, and the degree of early diagenetic modification.
These limitations do not invalidate the observed geochemical differentiation, but they require a cautious interpretation. The three-subunit model should be regarded as a meter-scale geochemical framework. The lower chemically enriched subunit should be interpreted as a combined depositional–diagenetic signal rather than a purely primary depositional record. Future work should combine higher-resolution sampling, petrographic analysis, mineralogical testing, Fe speciation, sulfur isotopes, and REE analysis to further verify the sub-interval architecture and improve proxy reliability.
The broader implication is that thin and organic-poor Yurtus intervals can still preserve valuable paleoenvironmental information. Such intervals should not be dismissed solely because of low TOC. Instead, they can reveal how paleogeographic position, sedimentary dilution, hydrodynamic disturbance, preservation efficiency, and early diagenetic modification interacted to control source-rock heterogeneity. In slope-break settings, poor organic enrichment may represent not the absence of source-rock-forming processes, but an unfavorable balance among competing depositional and diagenetic controls.
6. Conclusions
The target interval of the Yurtus Formation in the studied well exhibits pronounced thinning and low organic carbon content. The effective source rock interval is restricted to 5269–5274 m, with a thickness of approximately 5 m. Available TOC data indicate generally low organic carbon values, markedly contrasting with the commonly recognized thick and relatively high TOC intervals reported from Keping and adjacent areas.
Major-element end-member signals indicate strong carbonate dilution in the upper part of the interval. At 5269–5270 m, Ca concentrations increase markedly and Ca/Al reaches maximum of entire section, whereas Al and Ti remain low. This geochemical association indicates enhanced carbonate end member contribution and significant compositional dilution, providing direct lithological constraint on organic matter impoverishment.
Redox and sulfidic proxies reveal clear vertical partitioning in preservation conditions, with the middle interval representing the least favorable environment. At 5271–5272 m, U/Th and V/Cr remain at low levels and S/Fe reaches minimum values, indicating relatively oxic bottom water conditions or intensified ventilation and therefore reduced preservation efficiency. In contrast, 5273–5274 m is characterized by synchronous increases in U/Th, V/Cr, and S/Fe, reflecting strengthened reducing conditions and stage level development of sulfidic preservation.
The lower part of the interval records multi-element co-enrichment, yet without the development of a sustained, thick enrichment system. At 5273–5274 m, V, Cr, U, Ba, and Sr increase markedly, and P is simultaneously elevated, resulting in high P/Ti values. These features indicate episodic material enrichment or enhanced nutrient input. However, an extremely short depositional window, strengthened detrital supply, and rapid end member switching collectively prevented development of a laterally continuous, thick, high-TOC source-rock interval.
The formation of a thin and low-organic-carbon interval is therefore primarily governed by enhanced dilution and reduced preservation efficiency, under the control of slope-break processes. Integration of end member and redox proxies suggests that organic matter impoverishment resulted from combined influence of carbonate dilution and ventilation enhanced preservation loss. Considering seismic evidence for slope break or steep slope background, hydrodynamic disturbance, variable material input, and shortened depositional window associated with slope break setting likely constitute key geomorphic and sediment dynamic framework controlling thin and low TOC development of the Yurtus Formation in this sector.
These findings provide transferable proxy combinations for the identification of discontinuous source-rock development in slope-break settings. Under conditions of limited sampling and the absence of rare-earth-element data, Ca/Al and Si/Al can be used to constrain end-member dilution, U/Th, V/Cr, and S/Fe to delineate preservation segmentation, and P/Ti to detect nutrient enrichment signals. Integrated application of these proxies offers practical approach for well scale depositional environment comparison and thin source rock risk assessment.
Author Contributions
Conceptualization, P.W., M.M. and K.J.; Methodology, P.W.; Validation, P.W.; Formal analysis, P.W. and M.M.; Investigation, P.W. and Z.B.; Resources, P.W. and M.M.; Data curation, P.W., M.M. and K.J.; Writing—original draft, P.W. and M.M.; Writing—review & editing, Z.B., Y.Z., T.B., Y.L., Q.X. (Qiuchen Xu) and H.Z.; Visualization, M.M. and Y.L.; Supervision, Z.B., Y.Z., T.B., Q.X. (Qiuchen Xu) and J.C.; Project administration, K.J., Z.B., Y.Z., Jie Cao, H.Z., Q.X. (Qiufeng Xu) and W.P.; Funding acquisition, K.J., Z.B., Y.Z., Y.L. and J.C. All authors have read and agreed to the published version of the manuscript.
Funding
This research was funded by China Geological Survey: DD202402003 and Science and Technology Program of Xinjiang Uyghur Autonomous Region: 2025A01010.
Data Availability Statement
Data are contained within the article.
Conflicts of Interest
The authors declare no conflict of interest.
References
- Bai, Z.; Wang, M.; Gao, Y.; Zhang, J.; Zhou, X.; Han, M.; Yang, Y.; Cheng, M.; Sun, Z.; Hu, B.; et al. Atlas of Deep Geological Structures in the Tarim Basin; Petroleum Industry Press: Beijing, China, 2023. [Google Scholar]
- Zhang, J.; Gao, Y.; Liu, Y.; Zhou, X.; Cheng, M.; Jiang, K.; Han, M.; Yang, Y.; Miao, M.; Li, Q. Tectonic characteristics and hydrocarbon exploration potential of Keping fault-uplift in Tarim Basin. Acta Pet. Sin. 2023, 44, 1041–1057. [Google Scholar] [CrossRef]
- Yin, C.; Xu, D.; Liu, L.; Cheng, M.; Bai, Z.; Zhang, Y.; Li, Q.; Liu, Y.; Miao, M.; Tian, Y.; et al. Significant discovery of subsalt Cambrian hydrocarbons in Keping uplift of the northwestern Tarim Basin and its exploration implications. Acta Pet. Sin. 2026, 47, 538–553. [Google Scholar] [CrossRef]
- Zhu, G.; Chen, F.; Wang, M.; Zhang, Z.; Ren, R.; Wu, L. Discovery of the Lower Cambrian high-quality source rocks and deep oil and gas exploration potential in the Tarim Basin, China. AAPG Bull. 2018, 102, 2123–2151. [Google Scholar] [CrossRef] [Scilit]
- Chen, Z.; Wang, T.-G.; Li, M.; Yang, F.; Cheng, B. Biomarker geochemistry of crude oils and Lower Paleozoic source rocks in the Tarim Basin, western China: An oil-source rock correlation study. Mar. Pet. Geol. 2018, 96, 94–112. [Google Scholar] [CrossRef] [Scilit]
- Li, T.; Zhang, Y.; Zhu, G.; Chen, Z.; Li, X. Environmental controls on organic matter enrichment of the Lower Cambrian source rocks in the Tarim Basin, Northwest China. Mar. Pet. Geol. 2023, 158, 106539. [Google Scholar] [CrossRef] [Scilit]
- Deng, Q.; Wang, H.; Wei, Z.; Li, S.; Zhang, H.; Liu, H.; Faboya, O.L.; Cheng, B.; Liao, Z. Different accumulation mechanisms of organic matter in Cambrian sedimentary successions in the western and northeastern margins of the Tarim Basin, NW China. J. Asian Earth Sci. 2021, 207, 104660. [Google Scholar] [CrossRef] [Scilit]
- Deng, Q.; Zhang, H.; Wang, H.; Wei, Z.; Cheng, B.; Li, S.; Wang, Y.; Faboya, O.L.; Liao, Z. Organic matter accumulation mechanism in the Lower Cambrian strata from Well Luntan 1 in the Tarim Basin, NW China. Geofluids 2021, 2021, 6668707. [Google Scholar] [CrossRef] [Scilit]
- Zhu, B.; Yang, T.; Wang, J.; Chen, X.; Pan, W.; Chen, Y. Multiple controls on the paleoenvironment of the early Cambrian black shale-chert in the northwest Tarim Basin, NW China: Trace element, iron speciation and Mo isotopic evidence. Mar. Pet. Geol. 2022, 136, 105434. [Google Scholar] [CrossRef] [Scilit]
- Yu, B.; Dong, H.; Widom, E.; Chen, J.; Lin, C. Geochemistry of basal Cambrian black shales and cherts from the northern Tarim Basin, Northwest China: Implications for depositional setting and tectonic history. J. Asian Earth Sci. 2009, 34, 418–436. [Google Scholar] [CrossRef] [Scilit]
- Yao, C.; Ma, D.; Ding, H.; Zhang, X.; Huang, H. Trace elements and stable isotopic geochemistry of an Early Cambrian chert-phosphorite unit from the lower Yurtus Formation of the Sugetbrak section in the Tarim Basin. Sci. China Earth Sci. 2014, 57, 454–464. [Google Scholar] [CrossRef] [Scilit]
- Wu, L.; Zhu, G.; Yan, L.; Feng, X.; Zhang, Z. Late Ediacaran to Early Cambrian tectonic–sedimentary controls on Lower Cambrian black shales in the Tarim Basin, Northwest China. Glob. Planet. Change 2021, 205, 103612. [Google Scholar] [CrossRef] [Scilit]
- Zhang, C.; Guan, S.; Wu, L.; Ren, R.; Wang, L.; Wu, X. Depositional environments of early Cambrian marine shale, northwestern Tarim Basin, China: Implications for organic matter accumulation. J. Pet. Sci. Eng. 2020, 194, 107497. [Google Scholar] [CrossRef] [Scilit]
- Cheng, W.; Wang, R.; He, T.; Sun, C.; Tian, H.; Zhao, J.; Zhao, Y.; He, J.; Zeng, Q.; Liu, J.; et al. Geochemical Evidence of Organic Matter Enrichment and Depositional Dynamics in the Lower Cambrian Yurtus Formation, NW Tarim Basin: Insights into Hydrothermal Influence and Paleoproductivity Mechanisms. Minerals 2025, 15, 288. [Google Scholar] [CrossRef] [Scilit]
- Zeng, Q.; He, T.; Zhao, Y.; Zhang, K.; Wen, Z.; Xu, Y.; He, J.; Tian, W.; Lu, S.; Cheng, W.; et al. Geochemical characteristic of different-lithofacies source rocks and its implications for ultradeep hydrocarbon exploration in the lower cambrian Yuertus formation, Tarim basin. Sci. Rep. 2025, 15, 24071. [Google Scholar] [CrossRef] [Scilit] [PubMed]
- Hu, Y.; Jia, C.-Z.; Chen, J.-Q.; Pang, X.-Q.; Jiang, L.; Wang, C.-X.; Xiao, H.-Y.; Li, C.-J.; Jin, Y.-J. Restoration of hydrocarbon generation potential of the highly mature Lower Cambrian Yuertusi Formation source rocks in the Tarim Basin. Pet. Sci. 2025, 22, 588–606. [Google Scholar] [CrossRef] [Scilit]
- Wang, Y.; Chen, J.; Shen, W.; Li, M. Mechanism of Organic Matter Accumulation in Black Shales of the Yuertusi Formation in the Tarim Basin: Insights from Paleoenvironmental Variation During the Early Cambrian. Front. Earth Sci. 2022, 10, 879658. [Google Scholar] [CrossRef] [Scilit]
- Yuan, H.; Chen, S.; Dai, K.; Guo, X.; Kong, L.; Feng, N.; Zhao, H.; Yang, W. Distribution of Cambrian Source Rock Controlled by the Inherited Paleotopography on the Precambrian Basement in the Tarim Basin, NW China. Front. Earth Sci. 2022, 10, 864082. [Google Scholar] [CrossRef] [Scilit]
- Xu, S.; Wang, J.; Wu, N.; Xu, Q. Geochemical characteristics of Cambrian bitumen and Cambrian-Ordovician source rocks in the Keping area, NW Tarim Basin. Front. Earth Sci. 2023, 11, 1323705. [Google Scholar] [CrossRef] [Scilit]
- Wang, H.; Sun, Y.; Wang, D.; Shu, X.; Cheng, C.; Qian, P. Hydrothermal activities contribute to the strong metal enrichments during early Cambrian: Evidence from the comparison between black rock series in Tarim and South China. Front. Earth Sci. 2024, 12, 1343441. [Google Scholar] [CrossRef] [Scilit]
- Zhu, G.; Hu, J.; Chen, Y.; Xue, N.; Zhao, K.; Zhang, Z.; Li, T.; Chen, Z. Geochemical Characteristics and Formation Environment of Source Rock of the Lower Cambrian Yuerutsi Formation in Well Luntan 1 in Tarim Basin. Acta Geol. Sin. 2022, 96, 2116–2130. [Google Scholar] [CrossRef]
- Tribovillard, N.; Algeo, T.J.; Lyons, T.; Riboulleau, A. Trace metals as paleoredox and paleoproductivity proxies: An update. Chem. Geol. 2006, 232, 12–32. [Google Scholar] [CrossRef] [Scilit]
- Algeo, T.J.; Tribovillard, N. Environmental analysis of paleoceanographic systems based on molybdenum–uranium covariation. Chem. Geol. 2009, 268, 211–225. [Google Scholar] [CrossRef] [Scilit]
- Tribovillard, N.; Algeo, T.J.; Baudin, F.; Riboulleau, A. Analysis of marine environmental conditions based on molybdenum–uranium covariation—Applications to Mesozoic paleoceanography. Chem. Geol. 2012, 324–325, 46–58. [Google Scholar] [CrossRef] [Scilit]
- Algeo, T.J.; Lyons, T.W. Mo–total organic carbon covariation in modern anoxic marine environments: Implications for analysis of paleoredox and paleohydrographic conditions. Paleoceanography 2006, 21, PA1016. [Google Scholar] [CrossRef] [Scilit]
- Algeo, T.J.; Maynard, J. Trace-element behavior and redox facies in core shales of Upper Pennsylvanian Kansas-type cyclothems. Chem. Geol. 2004, 206, 289–318. [Google Scholar] [CrossRef] [Scilit]
- Algeo, T.J.; Liu, J. A re-assessment of elemental proxies for paleoredox analysis. Chem. Geol. 2020, 540, 119549. [Google Scholar] [CrossRef] [Scilit]
- Algeo, T.J.; Li, C. Redox classification and calibration of redox thresholds in sedimentary systems. Geochim. Cosmochim. Acta 2020, 287, 8–26. [Google Scholar] [CrossRef] [Scilit]
- Scott, C.; Lyons, T.W. Contrasting molybdenum cycling and isotopic properties in euxinic versus non-euxinic sediments and sedimentary rocks: Refining the paleoproxies. Chem. Geol. 2012, 324–325, 19–27. [Google Scholar] [CrossRef] [Scilit]
- Morford, J.L.; Emerson, S. The geochemistry of redox sensitive trace metals in sediments. Geochim. Cosmochim. Acta 1999, 63, 1735–1750. [Google Scholar] [CrossRef] [Scilit]
- Bennett, W.W.; Canfield, D.E. Redox-sensitive trace metals as paleoredox proxies: A review and analysis of data from modern sediments. Earth-Sci. Rev. 2020, 204, 103175. [Google Scholar] [CrossRef] [Scilit]
- Piper, D.Z.; Calvert, S.E. A marine biogeochemical perspective on black shale deposition. Earth-Sci. Rev. 2009, 95, 63–96. [Google Scholar] [CrossRef] [Scilit]
- Brumsack, H.-J. The trace metal content of recent organic carbon-rich sediments: Implications for Cretaceous black shale formation. Palaeogeogr. Palaeoclimatol. Palaeoecol. 2006, 232, 344–361. [Google Scholar] [CrossRef] [Scilit]
- Demaison, G.J.; Moore, G.T. Anoxic environments and oil source bed genesis. Org. Geochem. 1980, 2, 9–31. [Google Scholar] [CrossRef] [Scilit]
- Meyers, P.A. Organic geochemical proxies of paleoceanographic, paleolimnologic, and paleoclimatic processes. Org. Geochem. 1997, 27, 213–250. [Google Scholar] [CrossRef] [Scilit]
- Freudenthal, T.; Wagner, T.; Wenzhöfer, F.; Zabel, M.; Wefer, G. Early diagenesis of organic matter from sediments of the eastern subtropical Atlantic: Evidence from stable nitrogen and carbon isotopes. Geochim. Cosmochim. Acta 2001, 65, 1795–1808. [Google Scholar] [CrossRef] [Scilit]
- Lyons, T.W.; Anbar, A.D.; Severmann, S.; Scott, C.; Gill, B.C. Tracking euxinia in the ancient ocean: A multiproxy perspective and Proterozoic case study. Annu. Rev. Earth Planet. Sci. 2009, 37, 507–534. [Google Scholar] [CrossRef] [Scilit]
- Canfield, D.E.; Poulton, S.W.; Narbonne, G.M. Late-Neoproterozoic deep-ocean oxygenation and the rise of animal life. Science 2007, 315, 92–95. [Google Scholar] [CrossRef] [Scilit] [PubMed]
- Canfield, D.E.; Poulton, S.W.; Knoll, A.H.; Narbonne, G.M.; Ross, G.; Goldberg, T.; Strauss, H. Ferruginous conditions dominated later Neoproterozoic deep-water chemistry. Science 2008, 321, 949–952. [Google Scholar] [CrossRef] [Scilit] [PubMed]
- Och, L.M.; Shields-Zhou, G.A. The Neoproterozoic oxygenation event: Environmental perturbations and biogeochemical cycling. Earth-Sci. Rev. 2012, 110, 26–57. [Google Scholar] [CrossRef] [Scilit]
- Sperling, E.A.; Wolock, C.J.; Morgan, A.S.; Gill, B.C.; Kunzmann, M.; Halverson, G.P.; Macdonald, F.A.; Knoll, A.H.; Johnston, D.T. Statistical analysis of iron geochemical data suggests limited late Proterozoic oxygenation. Nature 2015, 523, 451–454. [Google Scholar] [CrossRef] [Scilit] [PubMed]
- Reinhard, C.T.; Planavsky, N.J.; Robbins, L.J.; Partin, C.A.; Gill, B.C.; Lalonde, S.V.; Bekker, A.; Konhauser, K.O.; Lyons, T.W. Proterozoic ocean redox and biogeochemical stasis. Proc. Natl. Acad. Sci. USA 2013, 110, 5357–5362. [Google Scholar] [CrossRef] [Scilit] [PubMed]
- Jin, C.; Li, C.; Algeo, T.J.; Planavsky, N.J.; Cui, H.; Yang, X.; Zhao, Y.; Zhang, X.; Xie, S. A highly redox-heterogeneous ocean in South China during the Early Cambrian (∼529–514 Ma): Implications for biota-environment co-evolution. Earth Planet. Sci. Lett. 2016, 441, 38–51. [Google Scholar] [CrossRef] [Scilit]
- Hammarlund, E.U.; Gaines, R.R.; Prokopenko, M.G.; Qi, C.; Hou, X.-G.; Canfield, D.E. Early Cambrian oxygen-minimum-zone-like conditions at Chengjiang. Earth Planet. Sci. Lett. 2017, 475, 160–168. [Google Scholar] [CrossRef] [Scilit]
- He, T.; Zhu, M.; Mills, B.J.W.; Wynn, P.M.; Zhuravlev, A.Y.; Tostevin, R.; von Strandmann, P.A.E.P.; Yang, A.; Poulton, S.W.; Shields, G.A. Possible links between extreme oxygen perturbations and the Cambrian radiation of animals. Nat. Geosci. 2019, 12, 468–474. [Google Scholar] [CrossRef] [Scilit] [PubMed]
- Wang, D.; Struck, U.; Ling, H.-F.; Guo, Q.-J.; Shields-Zhou, G.A.; Zhu, M.-Y.; Yao, S.-P. Marine redox variations and nitrogen cycle of the Early Cambrian southern margin of the Yangtze Platform, South China: Evidence from nitrogen and organic carbon isotopes. Precambrian Res. 2015, 267, 209–226. [Google Scholar] [CrossRef] [Scilit]
- Zhang, X.; Zhou, X.; Hu, D. High-resolution paired carbon isotopic records from the Meishucun section in South China: Implications for carbon cycling and environmental changes during the Ediacaran—Cambrian transition. Precambrian Res. 2020, 337, 105561. [Google Scholar] [CrossRef] [Scilit]
- Cremonese, L.; Shields-Zhou, G.A.; Struck, U.; Ling, H.-F.; Och, L.M. Nitrogen and organic carbon isotope stratigraphy of the Yangtze Platform during the Ediacaran–Cambrian transition in South China. Palaeogeogr. Palaeoclimatol. Palaeoecol. 2014, 398, 165–186. [Google Scholar] [CrossRef] [Scilit]
- Jia, C.Z.; Zhang, S.B.; Wu, S.Z. Stratigraphy of the Tarim Basin and Adjacent Areas; Science Press: Beijing, China, 2004; 513p. (In Chinese) [Google Scholar]
- Bai, Z.; Cheng, M.; Chen, C.; Huo, J.; Zhang, J.; Zhou, X.; Gao, Y.; Zhao, B.; Qiu, H.; Han, M.; et al. Distribution Features of the Nanhua-Sinian Rifts and their Significance to Hydrocarbon Accumulation in the Tarim Basin. Acta Geol. Sin. Engl. Ed. 2020, 94, 501–515. [Google Scholar] [CrossRef] [Scilit]
- YaLei, L.; YongJin, G.; JunFeng, Z.; ZhongKai, B.; MingHua, C.; YuanYin, Z.; YouXing, Y. New understanding of tectonic characteristic of the Wensu salient in Tarim Basin. Acta Petrol. Sin. 2022, 38, 2665–2680. [Google Scholar] [CrossRef] [Scilit]
- Zhang, J.; Zhang, Y.; Gao, Y. Silurian hydrocarbon exploration breakthrough and its implications in the Shajingzi structural belt of Tarim Basin, NW China. Pet. Explor. Dev. 2022, 49, 233–246. [Google Scholar] [CrossRef] [Scilit]
- Zhu, Y.; Zheng, J.; Chu, C.; Lyu, Q.; Tian, H.; Kang, T.; Zhang, T.; Huang, L. New Understanding of the Early Cambrian Uplift–Depression Framework and the Large-Scale Source–Reservoir Distribution along the Margin of the Awati Sag in Tarim Basin, NW China. Minerals 2024, 14, 646. [Google Scholar] [CrossRef] [Scilit]
- Yan, W.; Wu, G.H.; Zhang, Y.Q.; Yang, G.; Lou, H.; Wang, X.M. Sinian-Cambrian tectonic framework in the Tarim Basin and its influences on the paleogeography of the Early Cambrian. Geotecton. Metallog. 2018, 42, 455–466. [Google Scholar]
- Shiwei, Y.; Mingpeng, L.; Xujie, G.; Tuzhi, F.; Fan, Y.; Hui, F.; Weidong, M.; Shiguo, L.; Yang, G.; Dejiang, L. Control of the Nanhua paleo-rift on Cambrian sedimentation and its exploration significance in Tarim Basin. Acta Petrol. Sin. 2020, 41, 1293–1308. [Google Scholar] [CrossRef]
- Yang, Z.; Luo, P.; Liu, B.; Liu, C.; Ma, J.; Chen, F. The difference and sedimentation of two black rock series from Yurtus Formation during the earliest Cambrian in the Aksu area of Tarim Basin, Northwest China. Acta Petrol. Sin. 2017, 33, 1893–1918. [Google Scholar]
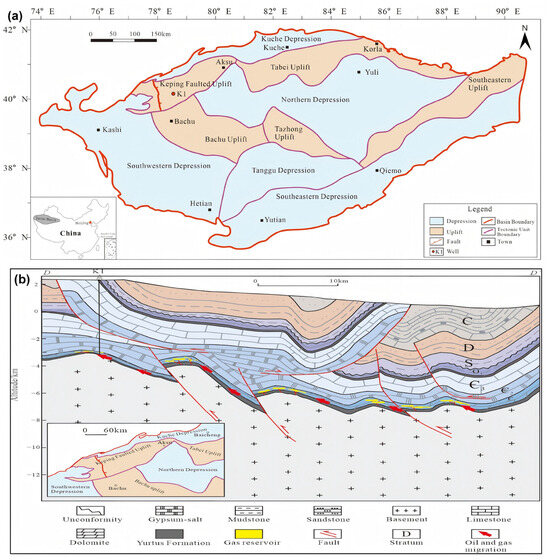
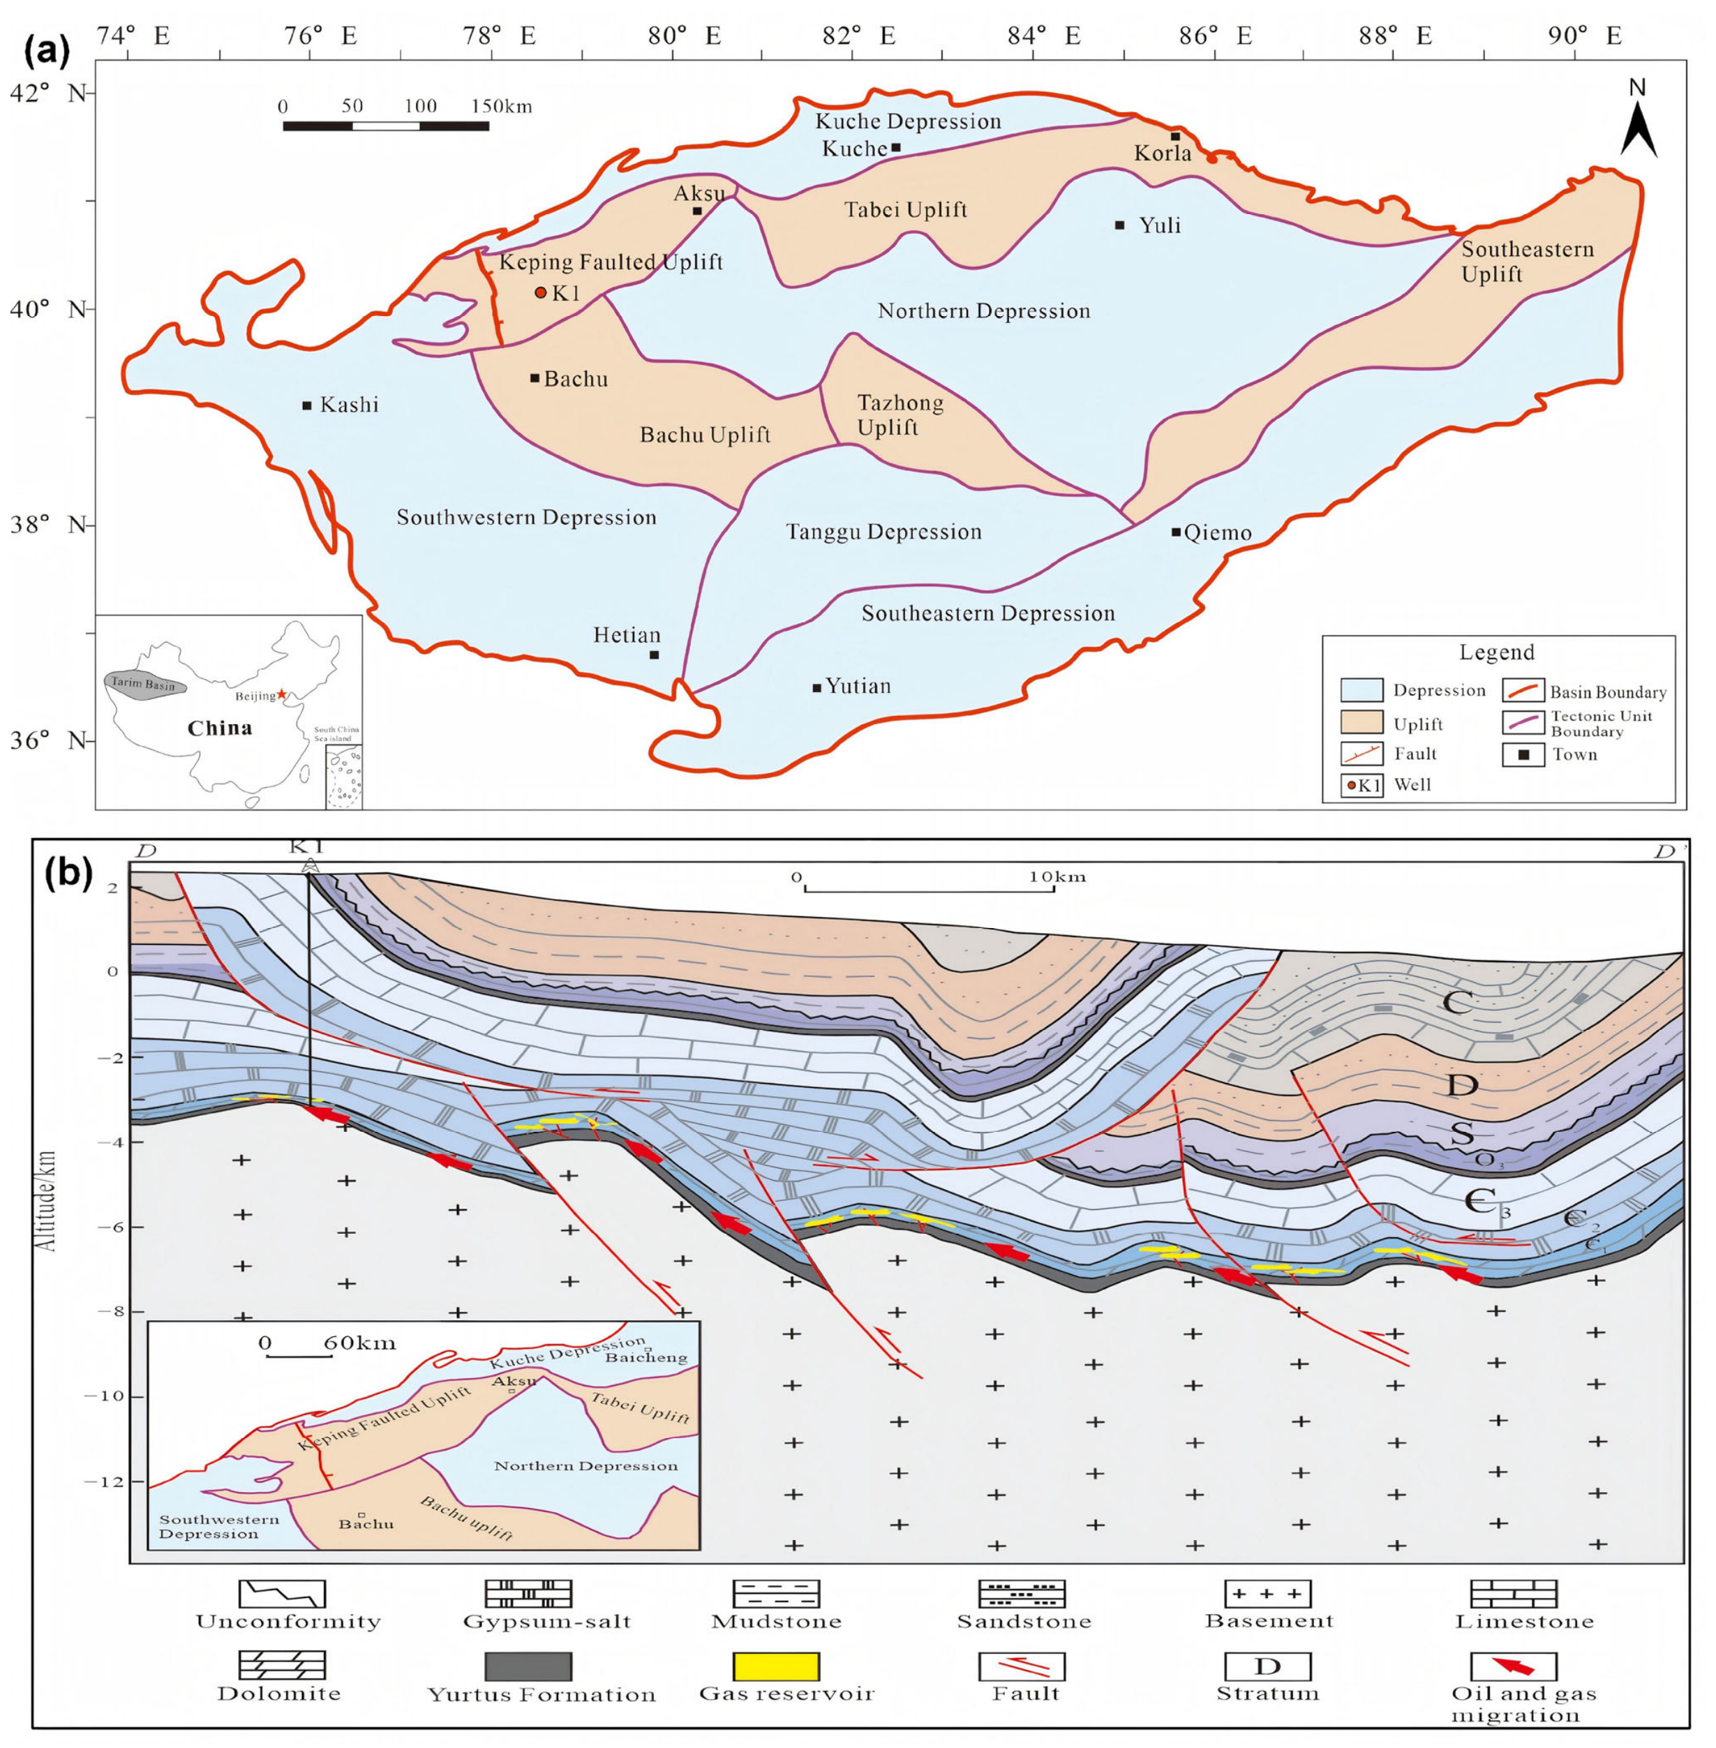
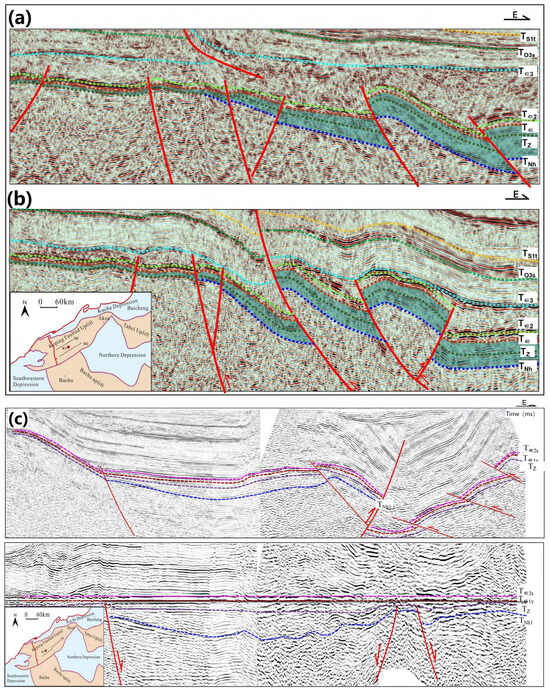
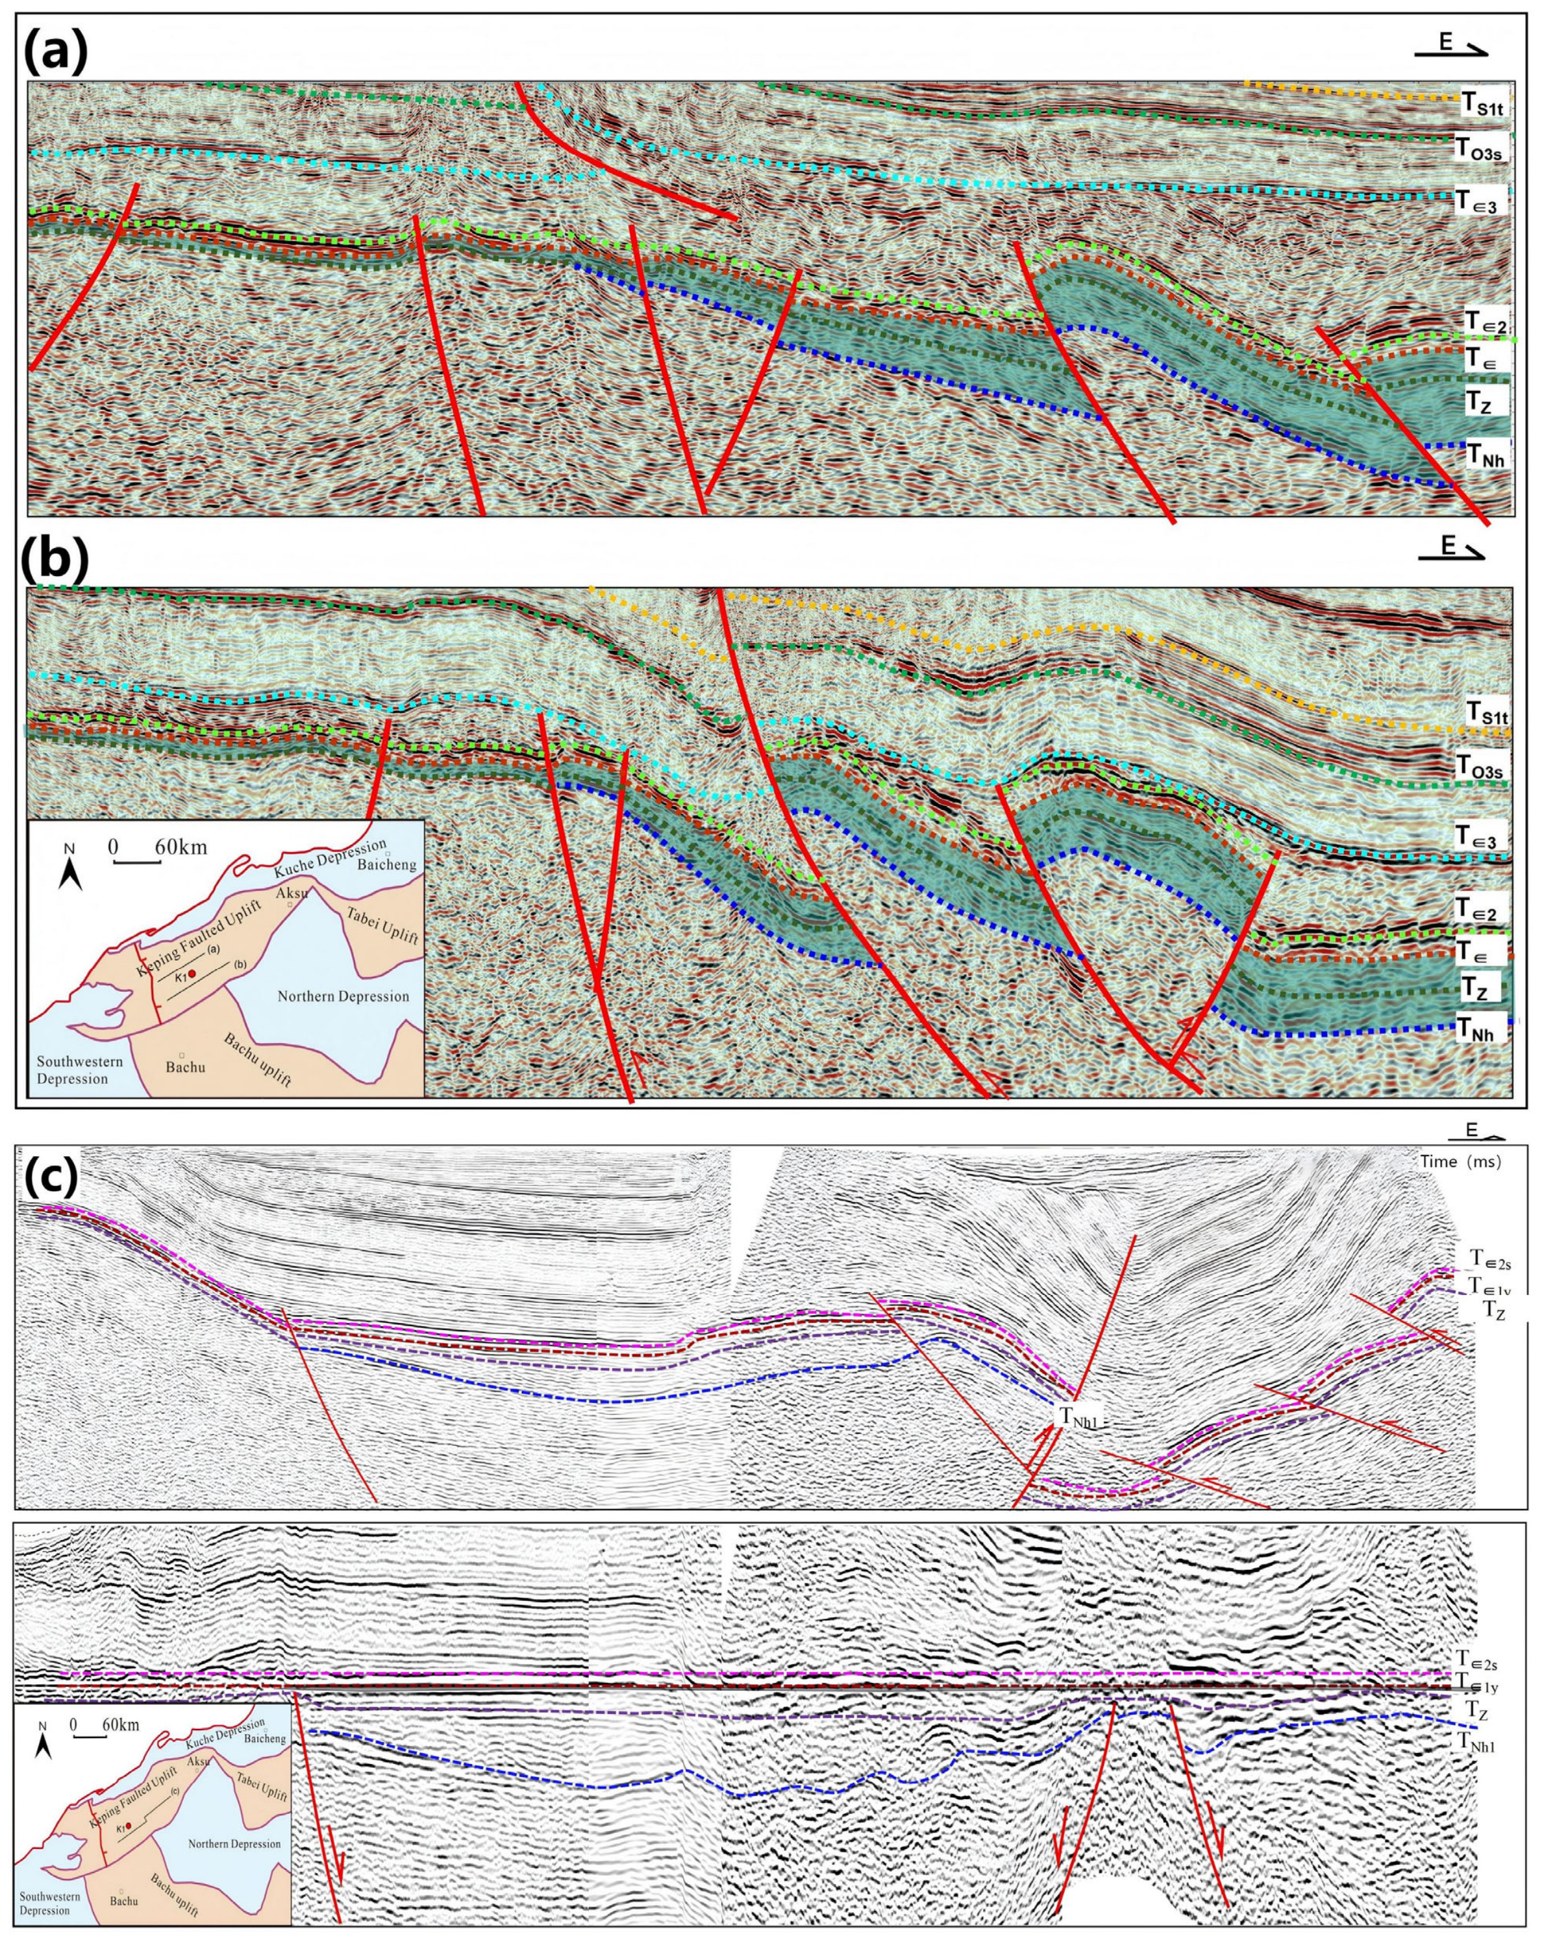
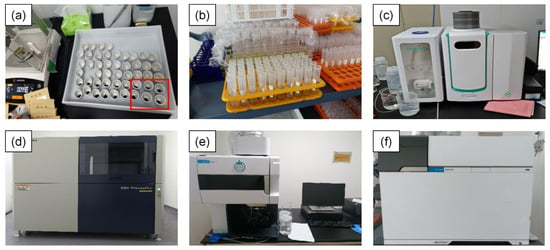
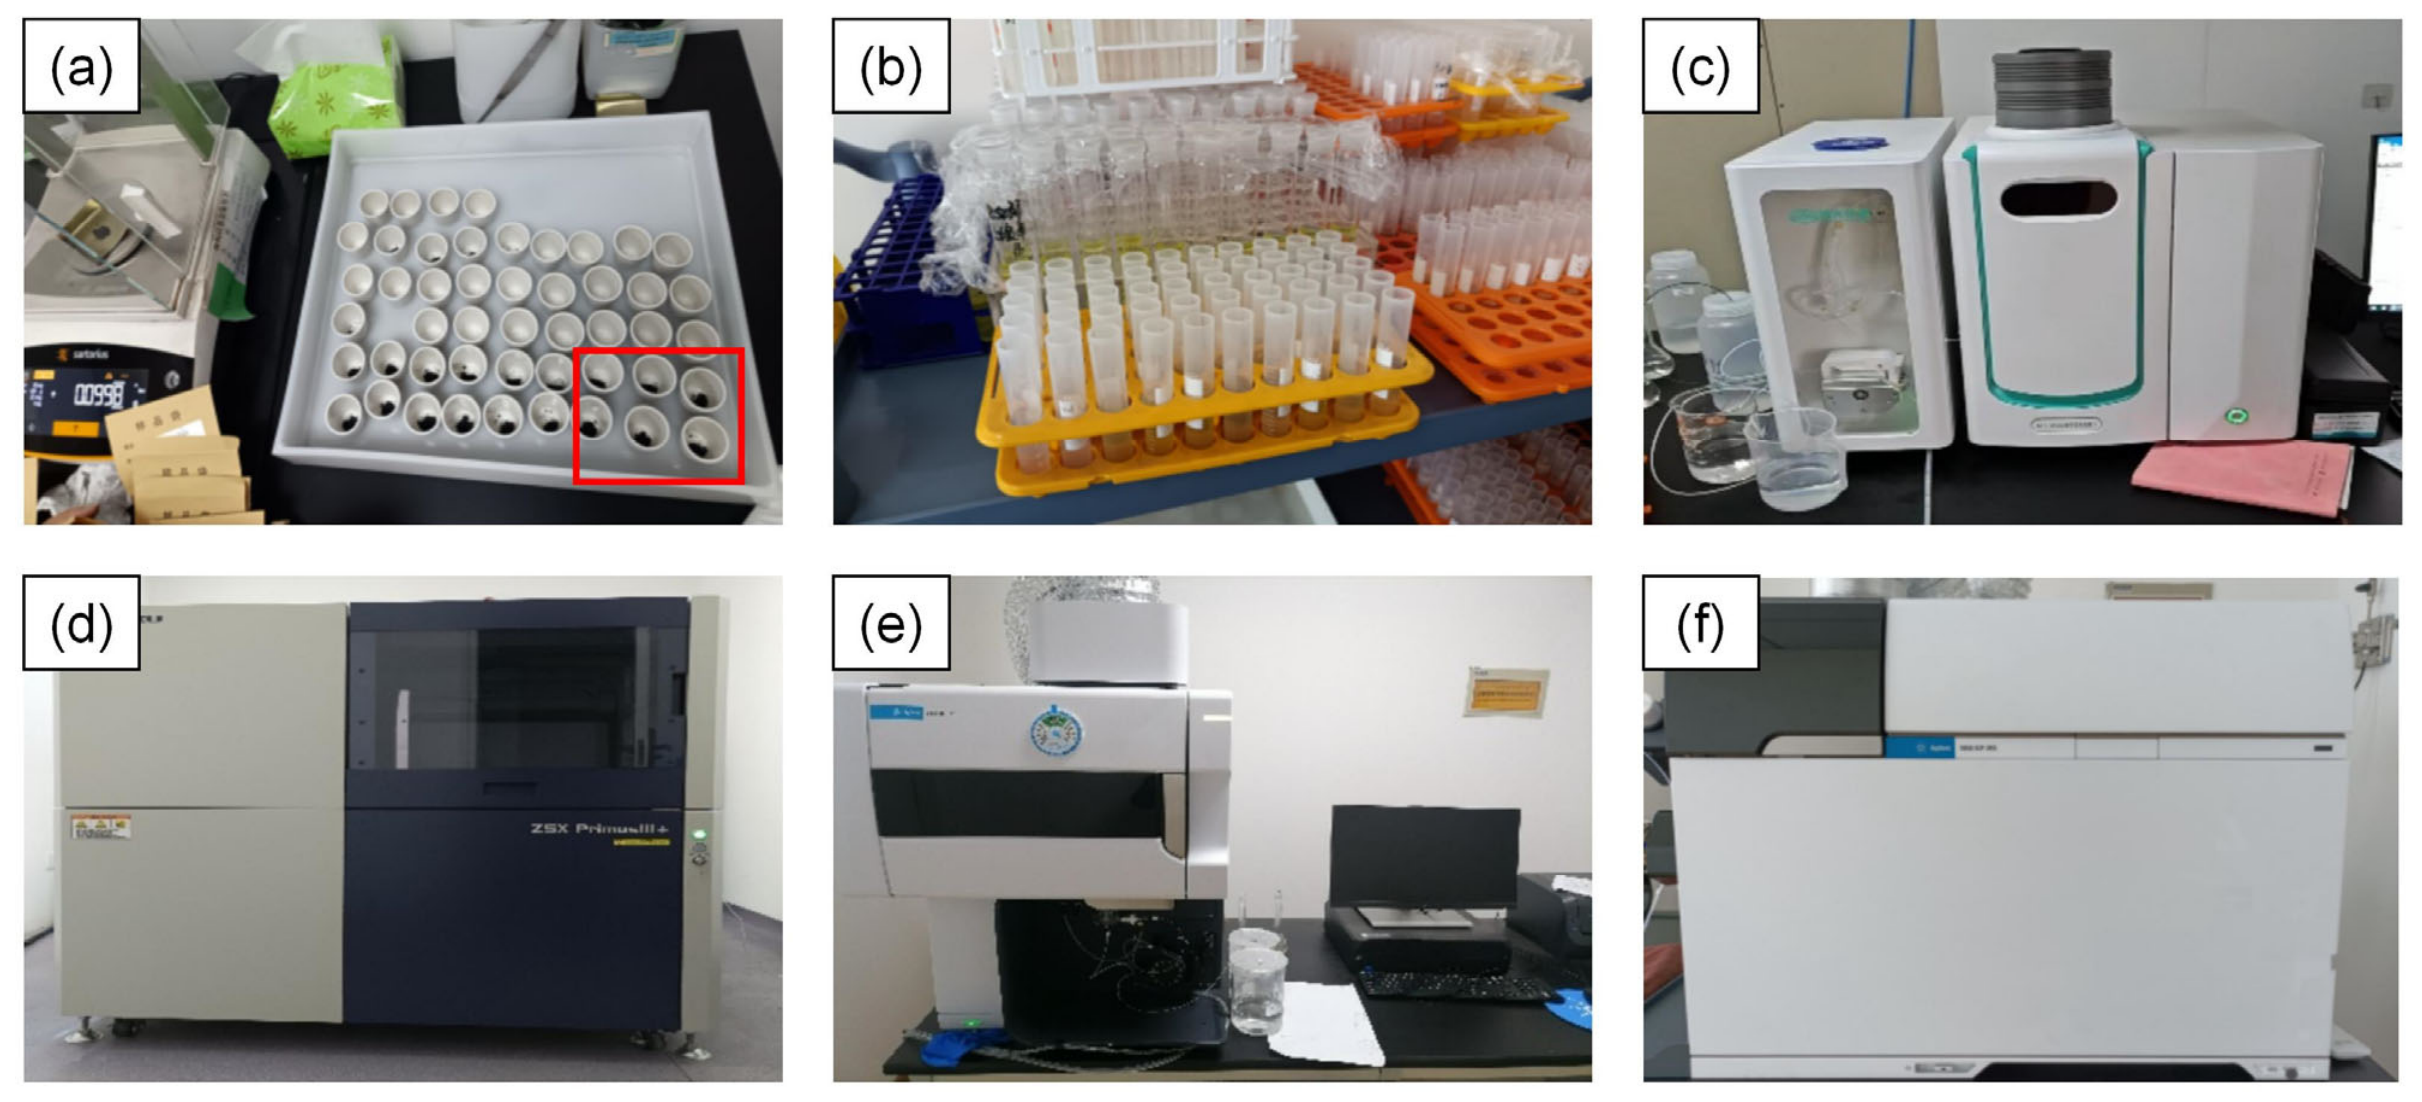
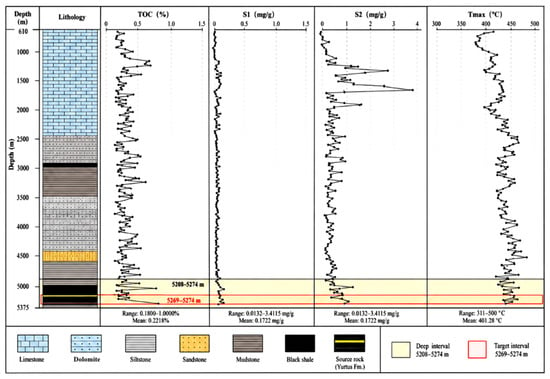
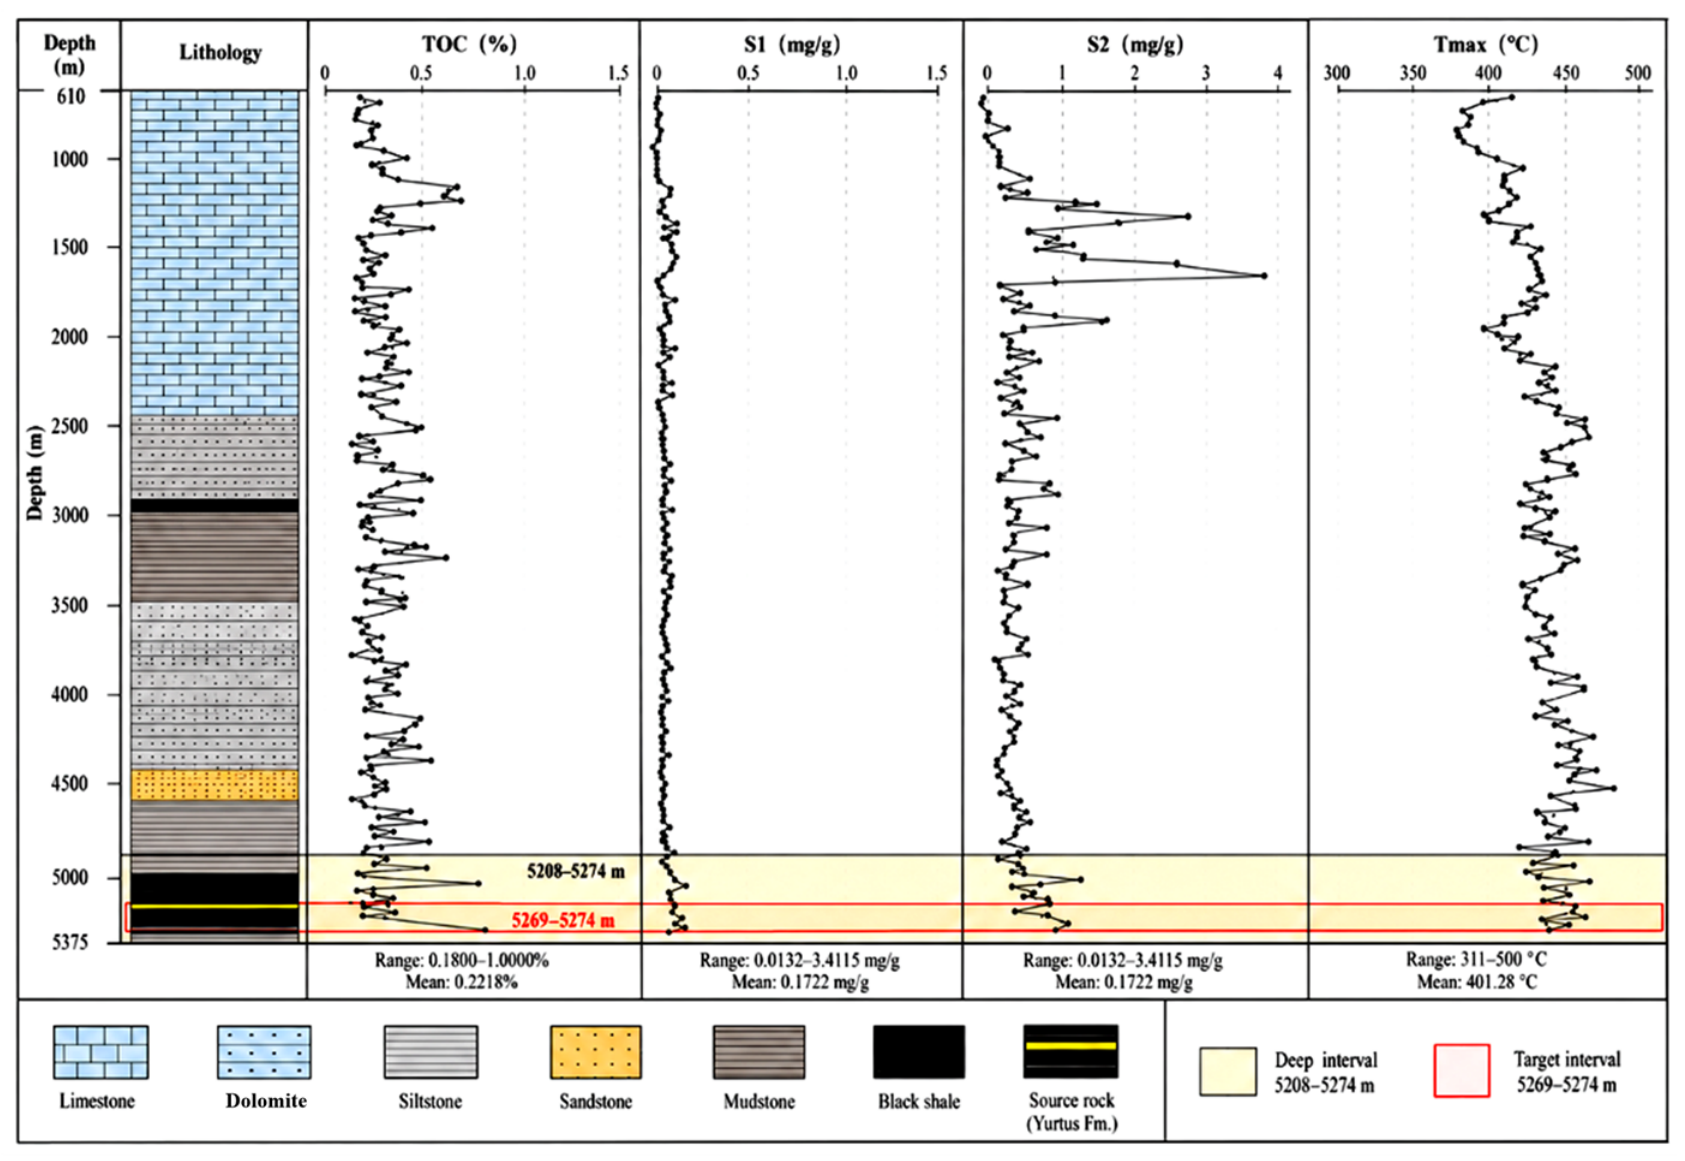
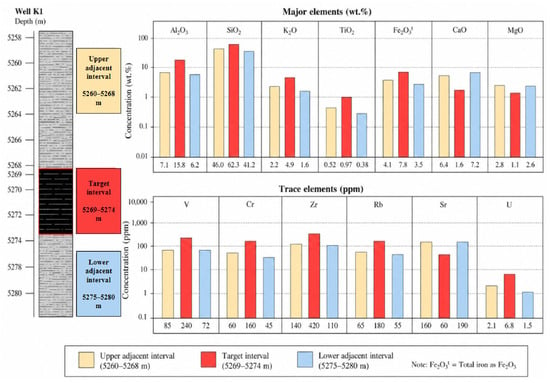
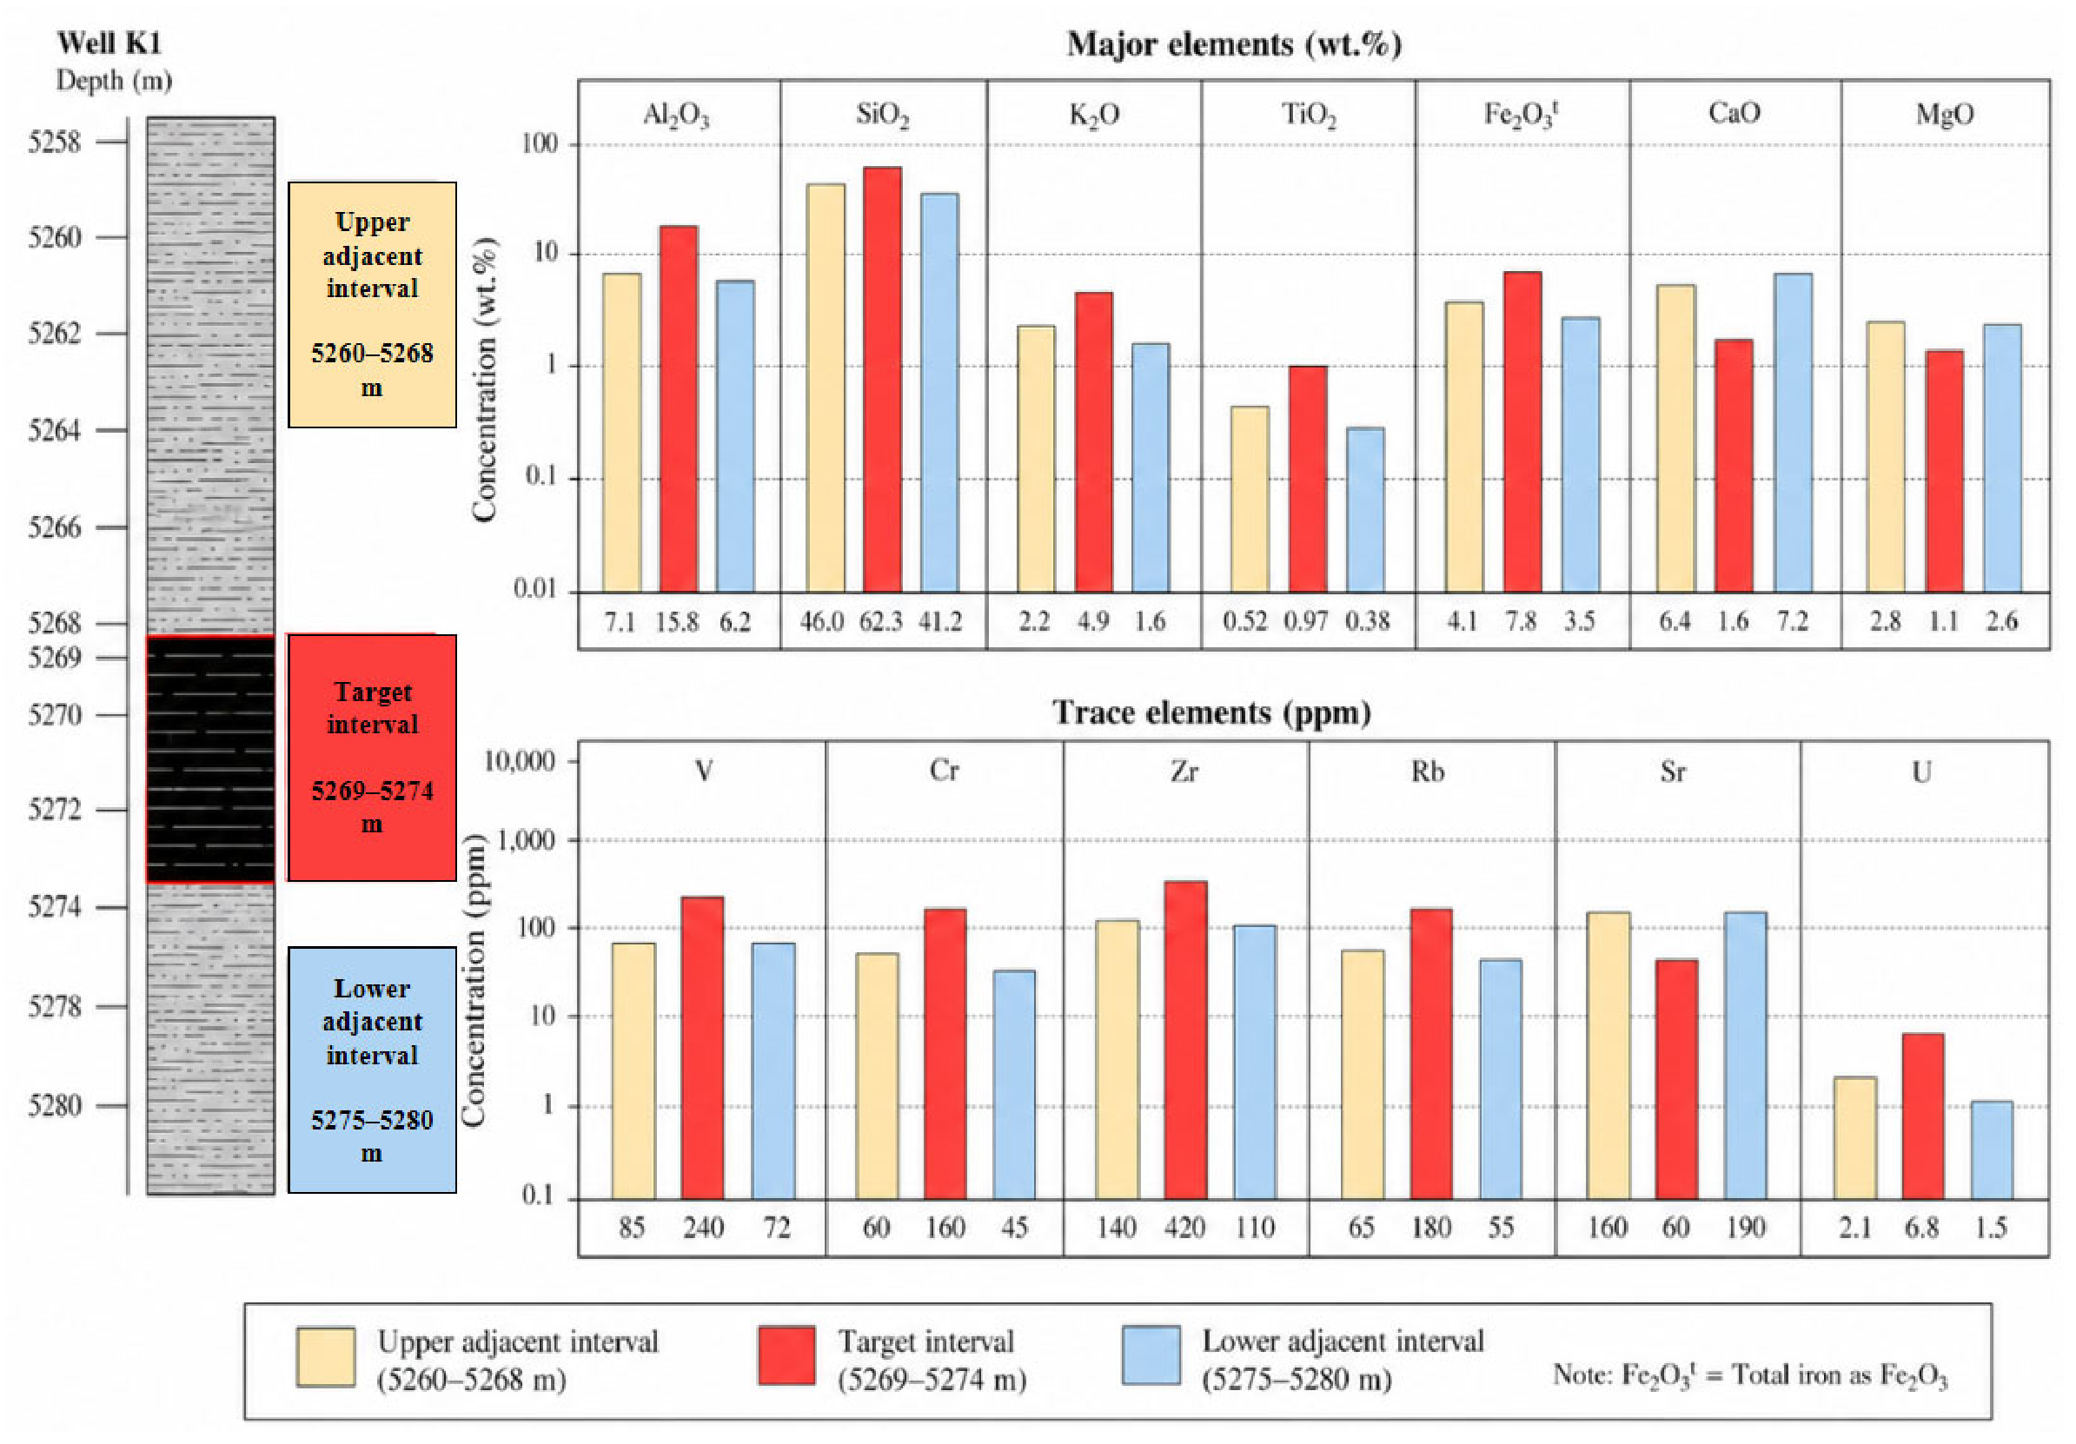
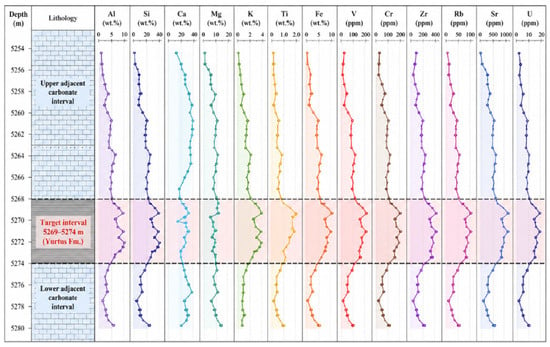
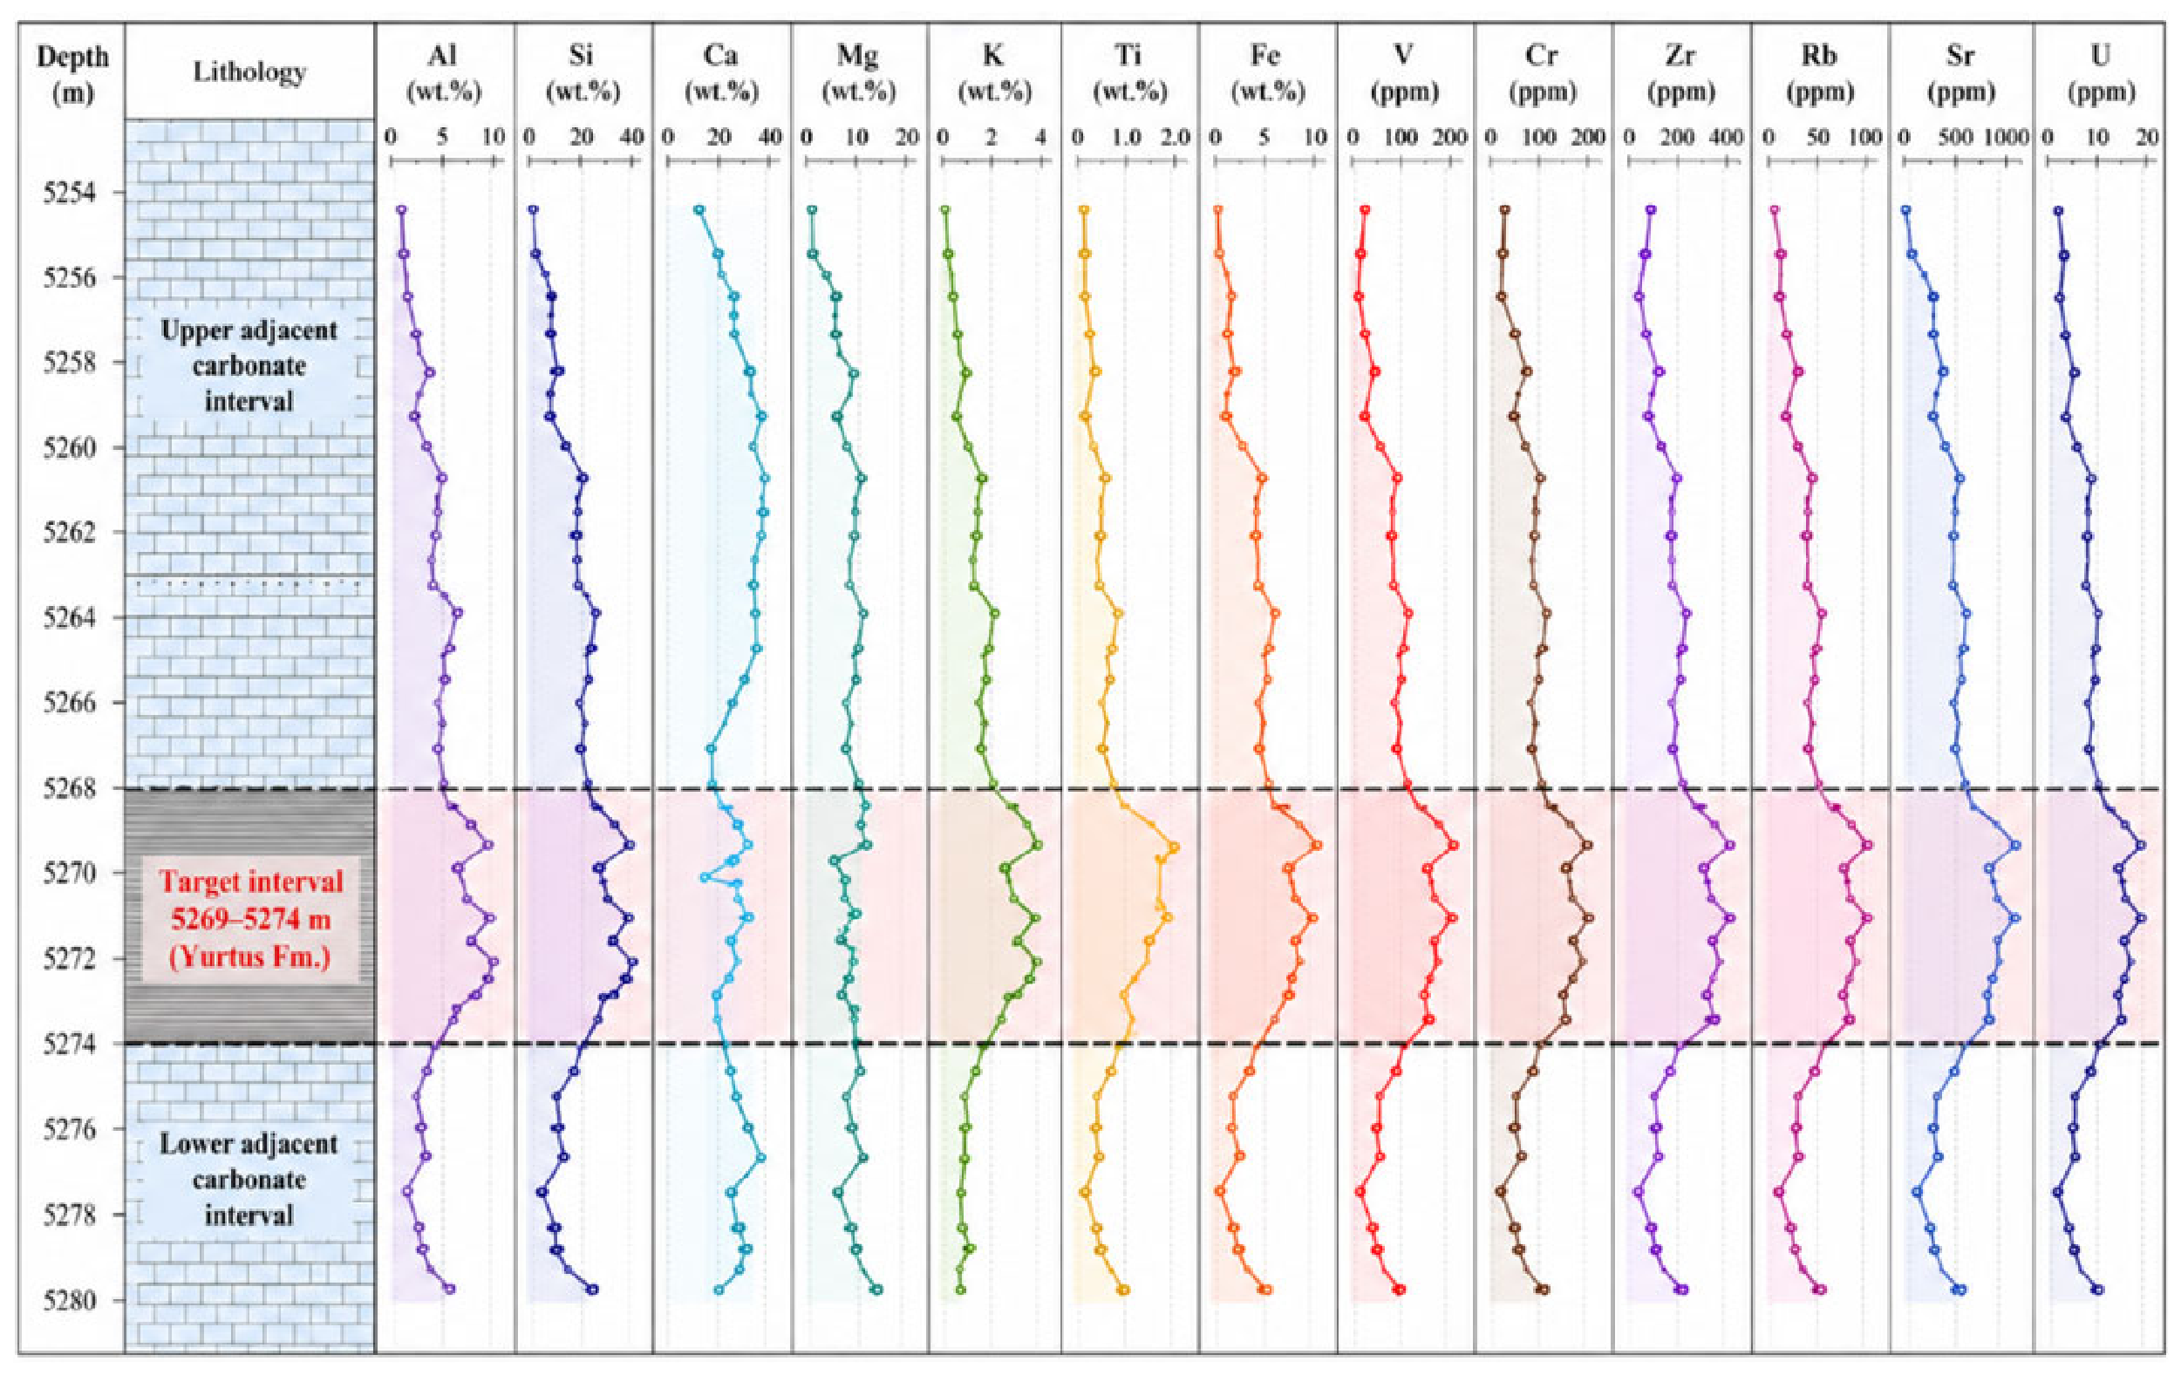
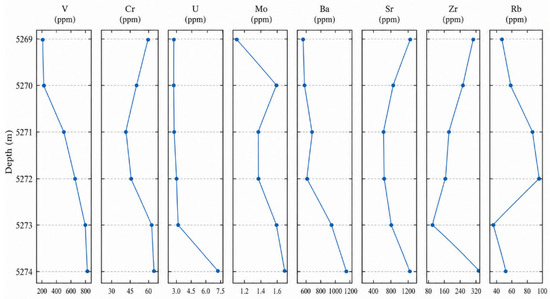
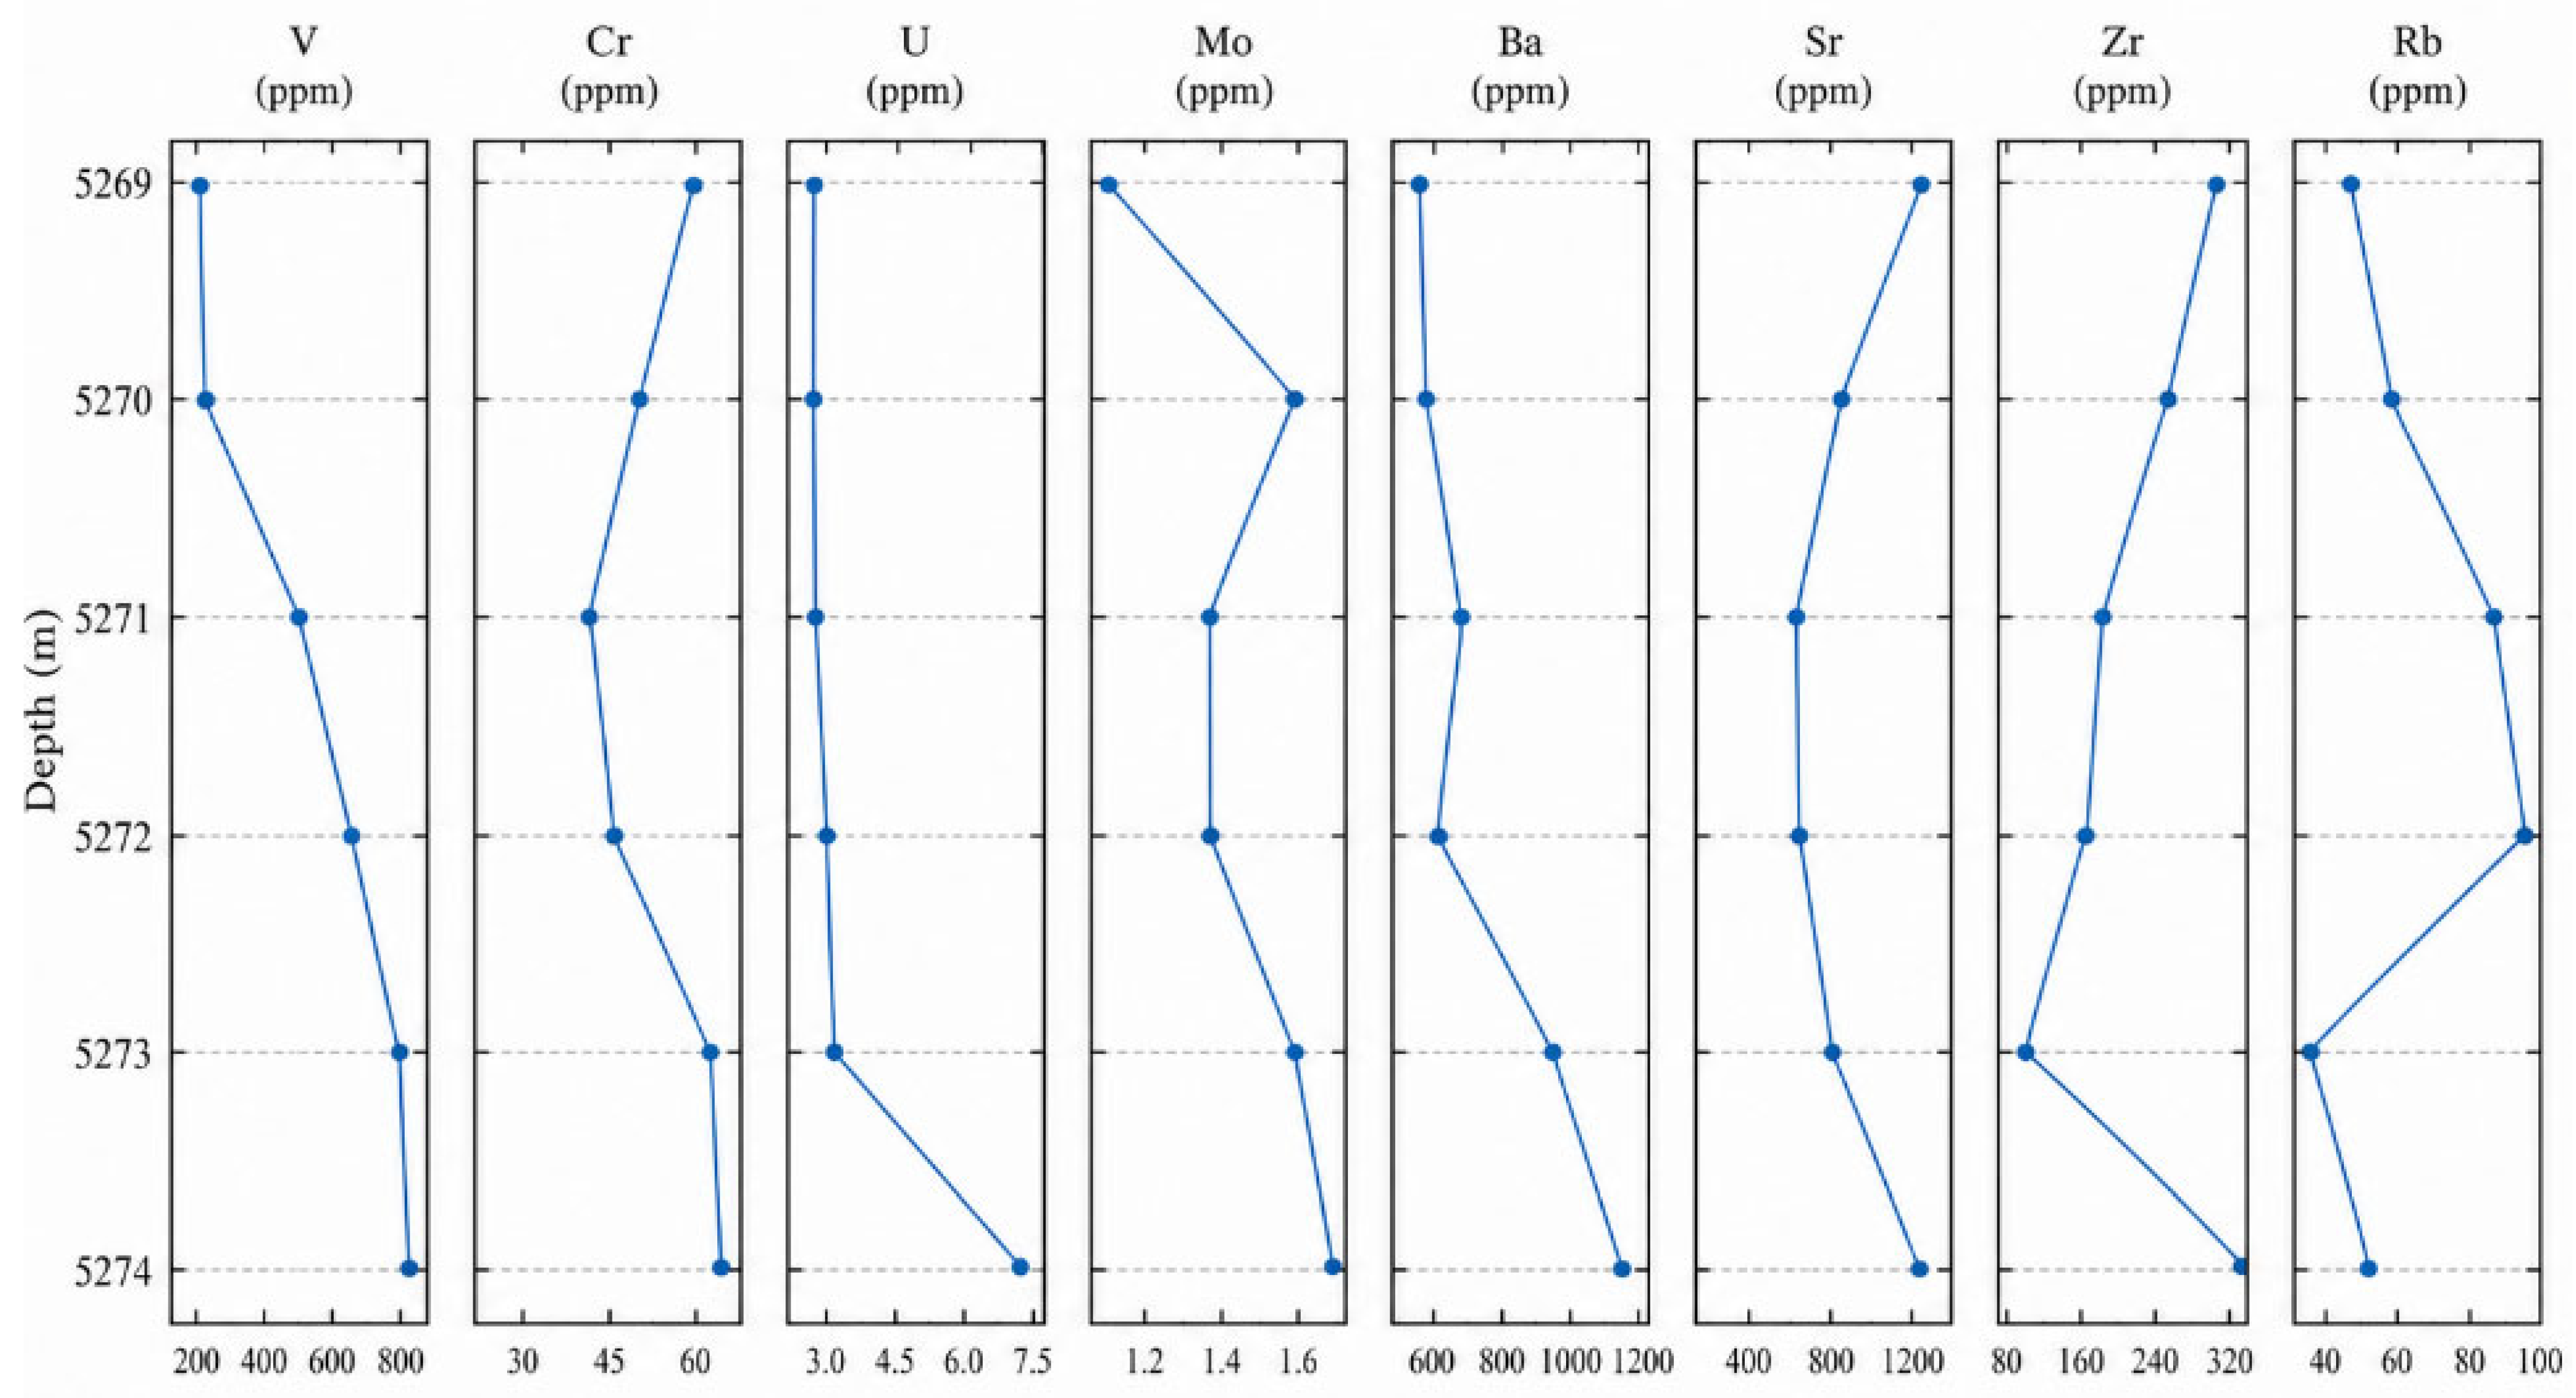
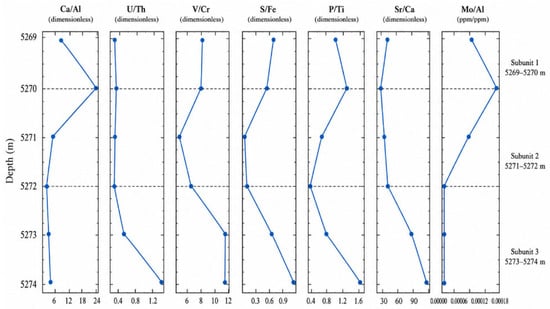
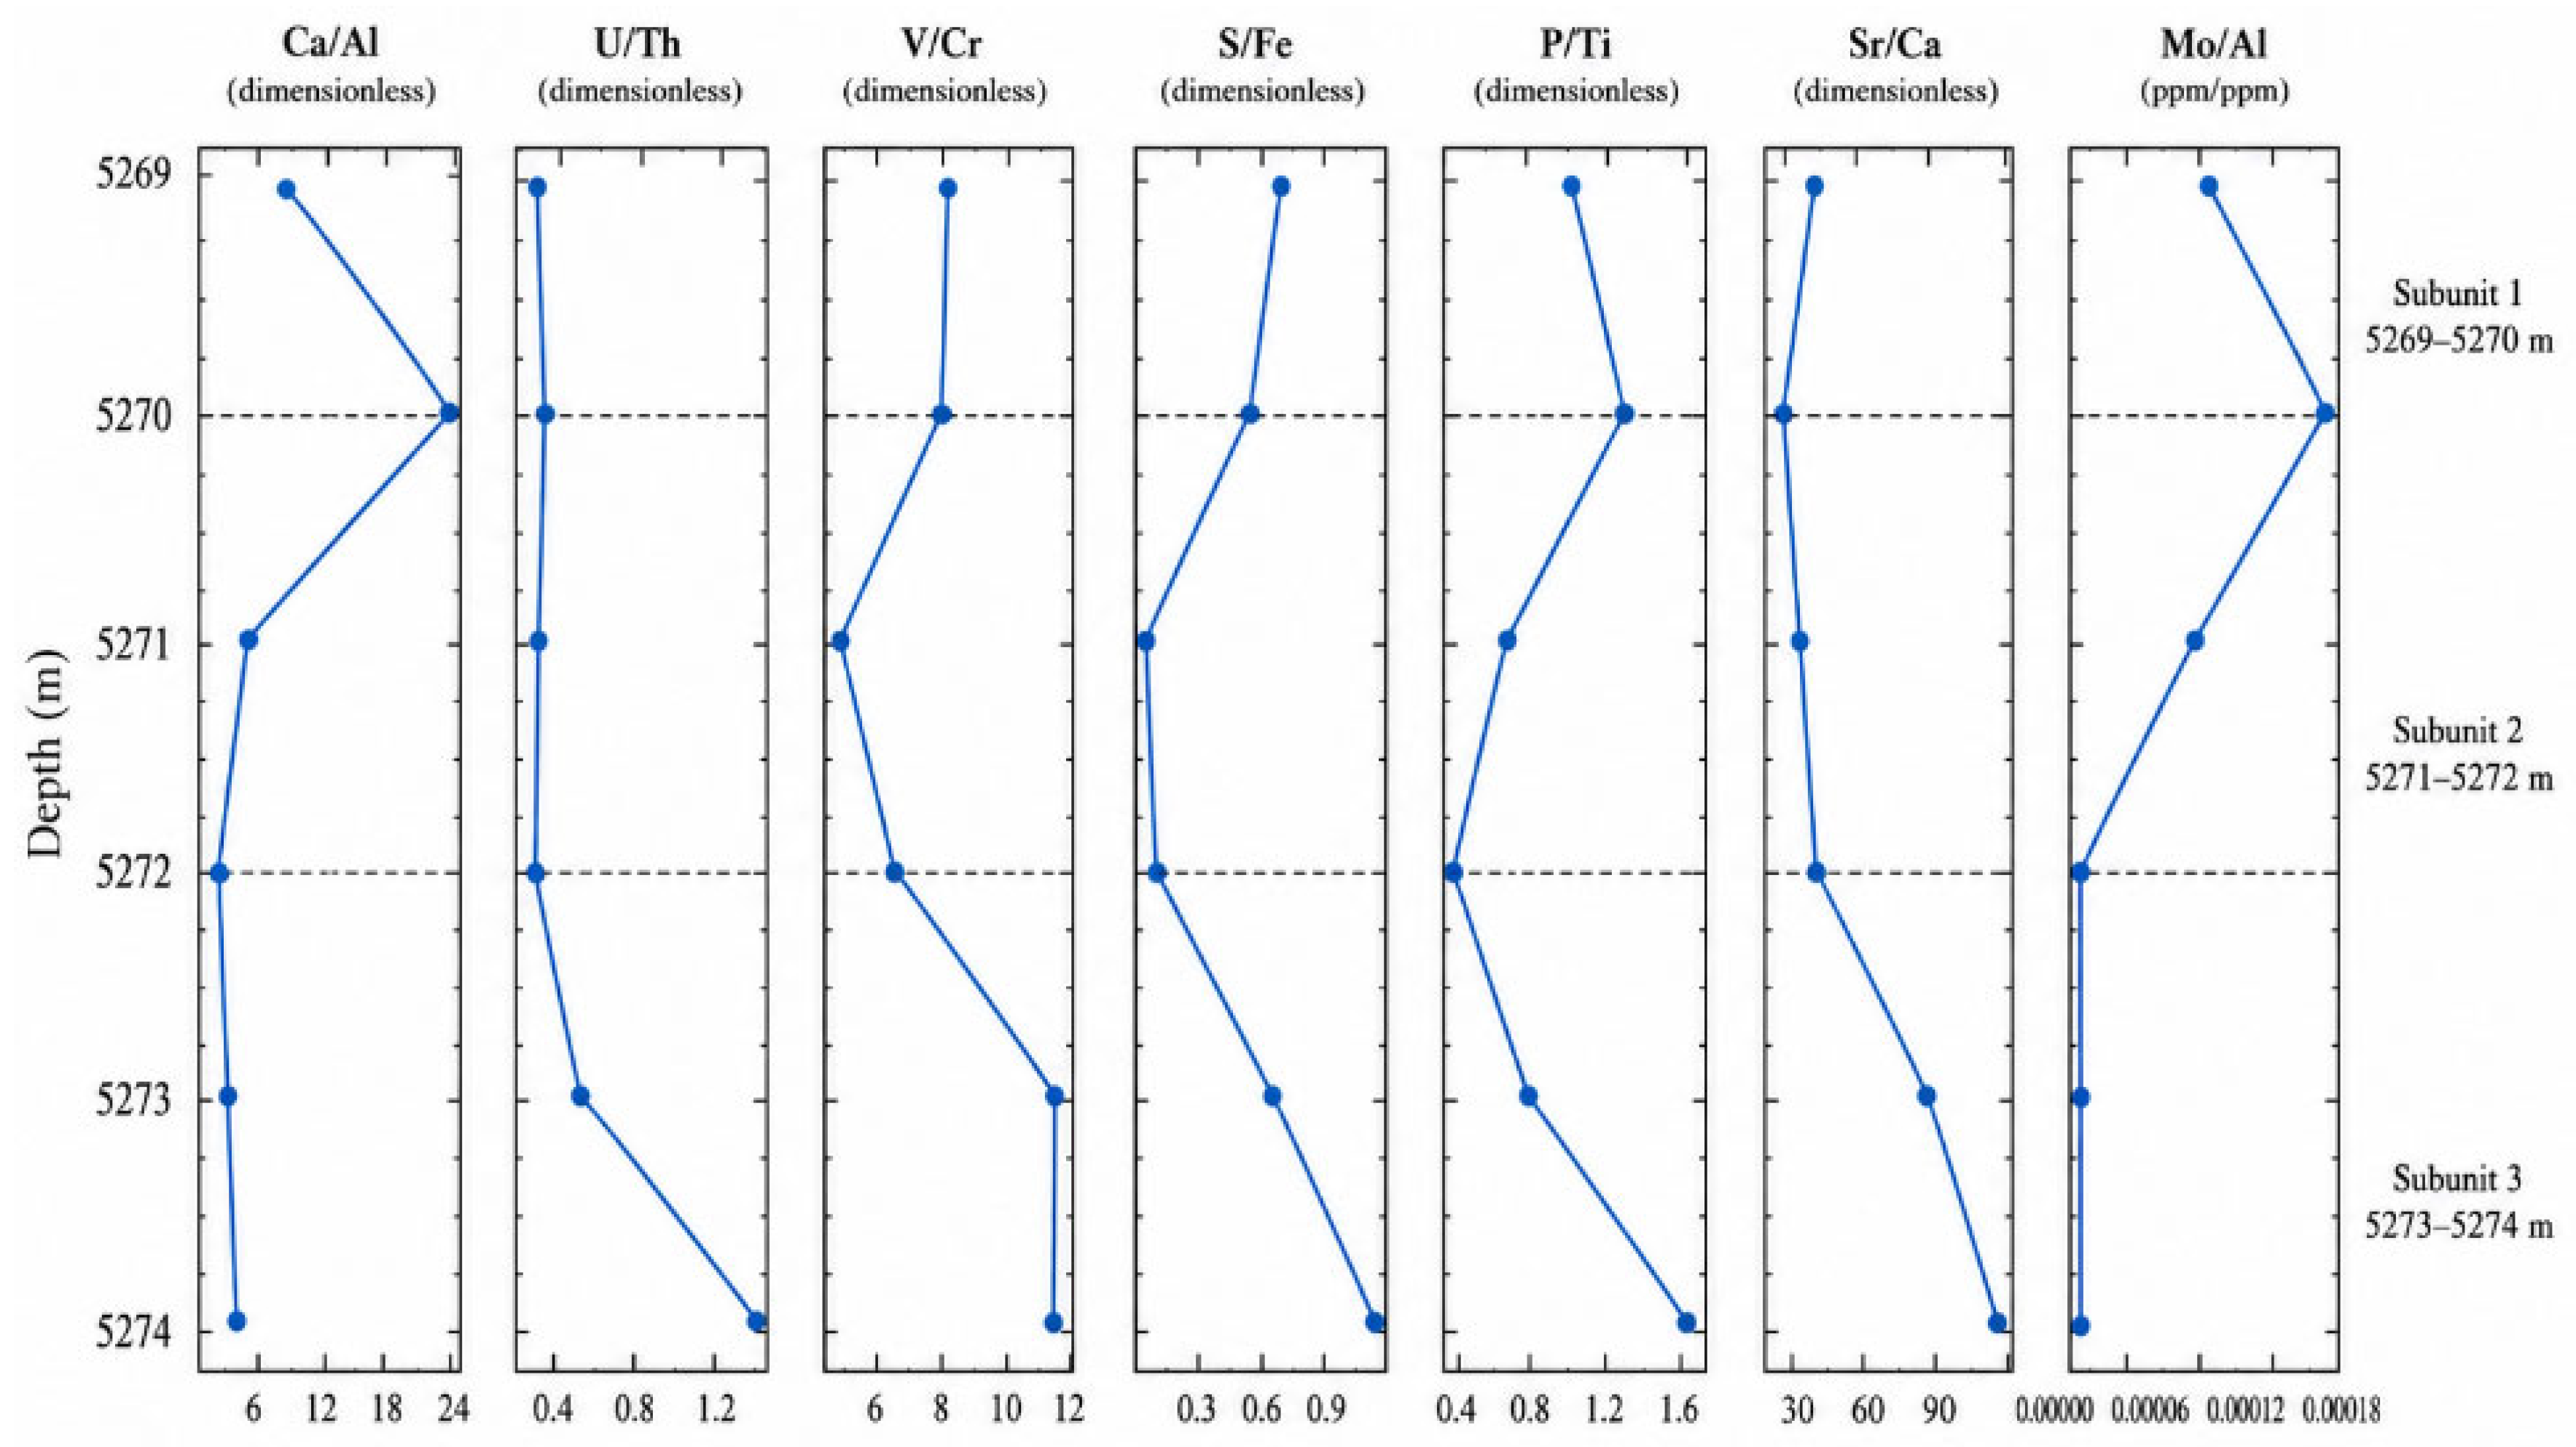

Disclaimer/Publisher’s Note: The statements, opinions and data contained in all publications are solely those of the individual author(s) and contributor(s) and not of MDPI and/or the editor(s). MDPI and/or the editor(s) disclaim responsibility for any injury to people or property resulting from any ideas, methods, instructions or products referred to in the content. |
© 2026 by the authors. Licensee MDPI, Basel, Switzerland. This article is an open access article distributed under the terms and conditions of the Creative Commons Attribution (CC BY) license.