


Abstract
Re-establishing native plant communities is critical for restoring post-mine influenced sites. A major challenge is that mining activity can result in poor soil quality that is not conducive to plant growth. Various soil amendments can provide organic material and nutrients that assist plant growth. Biosolids, treated solids recovered from municipal wastewater, can be used as a soil amendment to improve soil quality of mine-influenced landscapes and provide the nutrients for plant growth. The objectives of this study were (1) to determine an appropriate rate of biosolid application to promote the colonization of native plants and (2) to determine the effects of the biosolids on soil properties. In 2021, a field study was devised that tested four biosolid application rates (0, 125, 250, and 375 dry Mg/ha). The site was located in a mining area in the southern interior of British Columbia, Canada, with six replicates per experimental combination. This study demonstrated that biosolids significantly increased the productivity and diversity of the plant community. Biosolids reduced soil pH and increased soil organic matter, carbon and nitrogen concentrations. Receiving soils were either similar to or marginally high in arsenic (As) and molybdenum (Mo). In contrast, biosolids tended to significantly increase Cu levels compared to the control soils. Higher rates of biosolids did not lead to significantly higher plant productivity or diversity than the lower rates. The results of this study suggest that biosolids may significantly help restore sustainable grassland ecosystems in post-mining environments even at a lower application rate of 125 dry Mg/ha.
1. Introduction
Biosolids are treated solids recovered from municipal wastewater. They are high in organic matter and can be used to improve soil properties and vegetative cover on disturbed and degraded soils, such as mine sites [1,2,3]. Biosolids also contain macronutrients and micronutrients that can improve soil fertility and physical properties [2,4,5]. Using biosolids as an amendment in mine site reclamation is particularly effective since such soils usually lack organic matter and have nutrient deficiencies and imbalances [2,5,6,7]. Biosolids enhance soil quality and fertility by increasing soil organic matter and nutrients such as carbon and nitrogen, making them effective for building soil. Biosolids also have been shown to improve mine tailings contaminated with heavy metals by increasing soil aggregate stability and decreasing the availability of heavy metal concentrations in plant tissues [8].
While the land application of biosolids has potential benefits to soils and plant communities, it is important to manage biosolids in an appropriate manner to mitigate potential risks, such as overapplication of nutrients and exceeding acceptable metal quality standards. Biosolids are high in nutrients and can also contain heavy metals [2]. As such, biosolids need to be managed to limit groundwater contamination or elevated metal uptake by the plant community [9]. One method to mitigate risks to the receiving environment is to limit the amounts of biosolids applied to the land. Biosolids in most field studies were applied below 100 Mg/ha, but some studies applied between 100 to 404 Mg/ha [10]. When biosolids are applied at higher rates it is typically for a one-time, long-term land restoration and reclamation purpose [11].
The wide variability in biosolid application rates leads to uncertainty in their practical use, posing a significant challenge for environmental managers. Consequently, evaluating suitable application rates that meet the nutritional needs of ecosystems is essential. Furthermore, the evaluation must also include ecosystem considerations (for example, grasslands vs. forests). Therefore, appropriate application rates need to be studied before widespread use to reclaim an ecosystem. Our study fills this gap by testing the impacts of different biosolid application rates in the context of mine reclamation in a semi-arid ecosystem. We examine how different rates of biosolid application impacts ecosystem characteristics (such as plant diversity, productivity, carbon and nitrogen content, and elemental composition). We compare the impacts of biosolid application rates with those of the control (i.e., the absence of biosolids) to assess their efficacy in mine-impacted areas in a semi-arid region. This three-year-study (2021–2023) examined the effects of a one-time land application of biosolids at four different application rates on a post-mine site in the southern interior of British Columbia, Canada.
The objective of this study was to investigate the effects of biosolid application at four different rates (0, 125, 250, and 375 dry Mg/ha) on (i) total plant productivity and diversity of the plant community, native plants and other plant functional groups and (ii) soil properties, including soil pH, organic matter, carbon and nitrogen content, and macronutrients, micronutrients, and trace elements.
2. Materials and Methods
2.1. Site Description
The site was in south-central British Columbia (BC), Canada (49°19′25″ N; 120°33′08″ W; New Ingerbelle South Storage Area), at Copper Mountain Mine (CMM), which is an open pit mine approximately 15 km south of the town of Princeton, BC. The experimental area was located on a soil heap, a collecting point for mine soils; i.e., waste rock and soil removed during the mining process.
The CMM site is in the Cascade Dry Cool Interior Douglas-Fir (IDF) Zone Variant IDFdk2 [12]. The IDF zone has a cool temperate climate with a mean annual temperature of 4.2 °C, mean annual precipitation of 503 mm and mean summer precipitation of 203 mm [13]. The growing season of the IDF zone is warm, dry, and relatively long (3–5 months), and winters are cool with little snow [13].
2.2. Experimental Design—Field Study
Four soil treatments (Table 1) were replicated twelve times for a total of 48 experimental plots. Each plot measured 3 m (m) × 3 m (9 m2), and there was a one-meter buffer between plots.
Table 1.
Soil composition breakdown by percentage by volume.
The four soil treatment groups in this study were:
- (1)
- The ‘Control’ soil treatment group receiving no biosolids, 30 cm of subsoil and 10 cm woodchips;
- (2)
- The ‘Low’ biosolid treatment group receiving 30 cm of subsoil, 10 cm woodchips and 5 cm biosolids;
- (3)
- The ‘Medium’ biosolid treatment group receiving 30 cm of subsoil, 10 cm woodchips and 10 cm biosolids;
- (4)
- The ‘High’ biosolid treatment group receiving 30 cm of subsoil, 10 cm woodchips and 15 cm biosolids.
The depth of each plot was 40 cm for the ‘Control’, 45 cm for the ‘Low’ biosolid treatment group, 50 cm for the ‘Medium’ group, and 55 cm for the ‘High’ group. The application rates of biosolids in ‘Low’, ‘Medium’ and ‘High’ biosolid treatment groups were 125, 250 and 375 dry Mg/ha, respectively (Table 1).
Each of the four soil treatments was prepared on site within four separate treatment piles, containing the appropriate percentage of soil medium. Each pile was then mixed thoroughly using heavy machinery and distributed into pre-assigned test plots. The source for biosolids was ‘Class A’ biosolids from the Annacis Island Wastewater Treatment Plant in Delta. Woodchips were sourced by Arrow Transportation Systems Inc. (Kamloops, BC, Canada). The study site was on flat ground. The ‘3 m × 3 m’ plots were excavated and refilled in situ.
All the plots were seeded (Table 2). The sowing method was direct broadcast seeding and no tillage. Annual ryegrass (Lolium multiflorum) is a commonly used agronomic grass in BC and is extensively used for quick ground cover in post-wildfire and other rehabilitation contexts [14]. Sandberg bluegrass (Poa secunda), and fireweed (Chamaenerion angustifolium) are native early successional species. Bluebunch wheatgrass (Pseudoroegneria spicata) and arrowleaf balsamroot (Balsamorhiza sagittata) are native late successional species.
Table 2.
Seeded plant species.
2.3. Data Collection and Analysis
2.3.1. Plant Productivity and Diversity
Within a 2 m × 2 m area at the center of every plot, three of the potentially 16, 50 cm × 50 cm quadrats were randomly selected for a plant coverage survey. Plant cover percentage for each species was determined using the Daubenmire canopy cover method [15]. All the aboveground vegetation in the three surveyed quadrat sites were clipped and stored in bags individually at the end of the second growing season, 2022, and the third growing season, 2023. At the end of the 2023 growing season, sampling quadrats were randomly selected for each plot, excluding the three quadrats sampled in 2022. The aboveground biomass from all sampled quadrats in both years was oven-dried at 65 °C for at least 48 h until a constant weight was achieved, then weighed.
2.3.2. Soil Physicochemical Tests
Soil samples were collected from each plot before any seed application (May, 2021) and at the end of the experiment (mid-August, 2023). From every quadrat of each plot, three soil samples were collected within the 0–10 cm depth and below the litter by using a soil probe 2.5 cm in diameter. All soil samples were air-dried and 2 mm sieved).
2.3.3. Soil Testing
Measurements of 20 g of every soil sample were used to measure soil pH [16].
A gravimetric loss on ignition (LOI) method was used to estimate soil organic matter (SOM) [17]. Soil samples taken from the quadrats were homogenized according to each plot. SOM of every homogenized soil sample was determined by placing 2 to 5 g of dry soil in the oven and evaporating the organic matter at 540 °C for at least four hours. The weight difference from before to after drying in the oven was calculated and recorded as the SOM.
Total carbon and nitrogen of every dried and homogenized sample (approximately 10 mg) were determined using a CHNS elemental analyzer (Thermo Fisher ScientificTM FlashSmartTM, Milan, Italy), then the % carbon and nitrogen of each plot were calculated and recorded.
Approximately 0.5 g of each soil sample were processed by hot acid digestion process as USEPA 3051A [18]. Pulverized soil samples were placed in a Teflon tube with 9 milliliters of nitric acid (HNO3) and 3 milliliters of hydrogen chloride (HCl), then the samples were heated to 175 °C and held at that temperature for 4.5 min in a microwave oven. Inductively coupled plasma mass spectrometry (ICP-MS) (Agilent 7900 ICP-MS, Agilent, Santa Clara, CA, USA) was then used to measure concentrations of a suite of trace elements for all digested and diluted soil samples. Tested macronutrients were potassium (K), calcium (Ca), and magnesium (Mg); iron (Fe), manganese (Mn), zinc (Zn), copper (Cu), and molybdenum (Mo); and some potentially toxic elements sodium (Na), aluminum (Al), lead (Pb), chromium (Cr), cadmium (Cd), and arsenic (As).
2.3.4. Statistical Analysis
Biomass in this experiment was defined as the dry weight of aboveground plant tissue of non-litter plants within the sampling quadrat, and the biomass data analysis had unit transformation to kilograms per hectare (kg/ha). Species richness was defined as the number of plant species within the sampling quadrat (0.25 m2). Biomass and species richness of each species within every quadrat were summed for the entire plant community and plant functional groups for multiple data analysis. The plant functional groups were further grouped according to the growth form as grasses and forbs as well as status as natives, exotics, invasives, early successional species, and the cover crop (annual ryegrass). Groups of natives and early successional species included non-sown native species. Details of functional groups are listed in Table 2 and Table 3.
Table 3.
All species found at the Copper Mountain Mine site in 2022 and 2023 and their functional groups (growth form and status).
Statistical analyses were conducted using R for Statistical Computing [19]. The R package Tidyverse was used for data sorting and visualization [20]. All field experiment data were tested for significance at the 5% probability level. Normality was checked for all field data by plotting residuals and histograms using the Shapiro–Wilk test. Using a ‘vegan’ package, the species richness was calculated for each quadrat based on plant canopy coverage data [21]. Original data did not pass the assumption of a normal distribution of parametric analysis, so the non-parametric aligned rank-transformed (ART) models of align-and-rank data (species richness and biomass) were developed and analyzed with the analysis of variance (ANOVA) [22]. The ‘ARTool’ R package allows for non-parametric testing of interactions and main effects using standard ANOVA techniques [23]. The ART method ranks the data and aligns the ranks across tested factors, preserving the structure of the data and allowing valid statistical inference. Then, two-way ANOVA on ARTool Linear Mixed-effect models of non-2021 plant biomass and species richness were conducted separately for the analysis of plant productivity and diversity, with ‘soil treatment’ and ‘sowing treatments’ as fixed effects, and ‘year’ and ‘block’ as random effects, which is for accounting the variation in the data due to the sampling year and block positioning. The hypothesis for the study is that the application of biosolids has a positive impact on biomass and species richness.
2.3.5. Biomass
Effects of soil and sowing treatments on total biomass of the quadrat (0.25 m2) plant community and the biomass of quadrat native plants were analyzed using the ART model and ANOVA, while the model had ‘year’ and ‘block’ as random effects on total living biomass and the biomass of native plant groups. Post hoc tests for pairwise comparisons between groups were conducted using the Tukey honestly significant difference (HSD) method.
In addition to the native plant group, there were other functional groups. The total biomass was grouped and analyzed by plant functional groups based on the growth form and the status of the plants, respectively. Therefore, Spearman’s correlation analysis was conducted for each experimental year to investigate the trend of biomass changes among plant functional groups under different growth forms and different states, for example, an analysis of plant growth form and an analysis of plant status. Details of plant functional groups are listed in Table 3.
2.3.6. Plant Canopy Coverage
Species richness, the number of unique species, was calculated from the canopy cover data for each quadrat. Species richness of each quadrat (0.25 m2) was used as an index of the community alpha diversity level [24,25]. The intragroup (alpha) and intergroup (beta) diversity of plant communities were analyzed using ART species richness data.
The beta diversity between plant communities of different soil groups/treatments were analyzed by using Principal Coordinate Analysis (PCoA) and total coverage of each species within every quadrat. Data were first standardized using the ‘decostand’ function and the ‘presence–absence’ method. Then, a distance matrix of Bray–Curtis dissimilarity was calculated using the ‘vegdist’ function from the standardized data. A PCoA was conducted using the ‘pcoa’ function from the package ‘ape’ [26]. The other two functions come from the ‘vegan’ package.
2.3.7. Soil Characterization and Elemental Analysis
Data analyses for various soil parameters included ANOVAs for ART soil pH, SOM, total carbon, total nitrogen, and C/N ratios, with ‘soil treatments’ as fixed effects. The ANOVA with soil treatments as fixed effects and block as a random effect was used. Tukey’s post hoc tests were used to test the effect of the significant fixed effects on the soil parameters with the ‘art.con’ function of the ‘ARTool’ package Version 0.11.2.
Principal component analysis (PCA) was used to analyze the elemental composition between soil treatments. A PERMANOVA analysis was conducted to test the differences between soil treatments (biosolid application versus control) with the ‘adonis’ function of the ‘vegan’ package.
3. Results
3.1. Vegetation Response
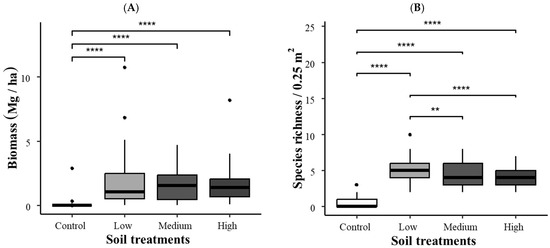
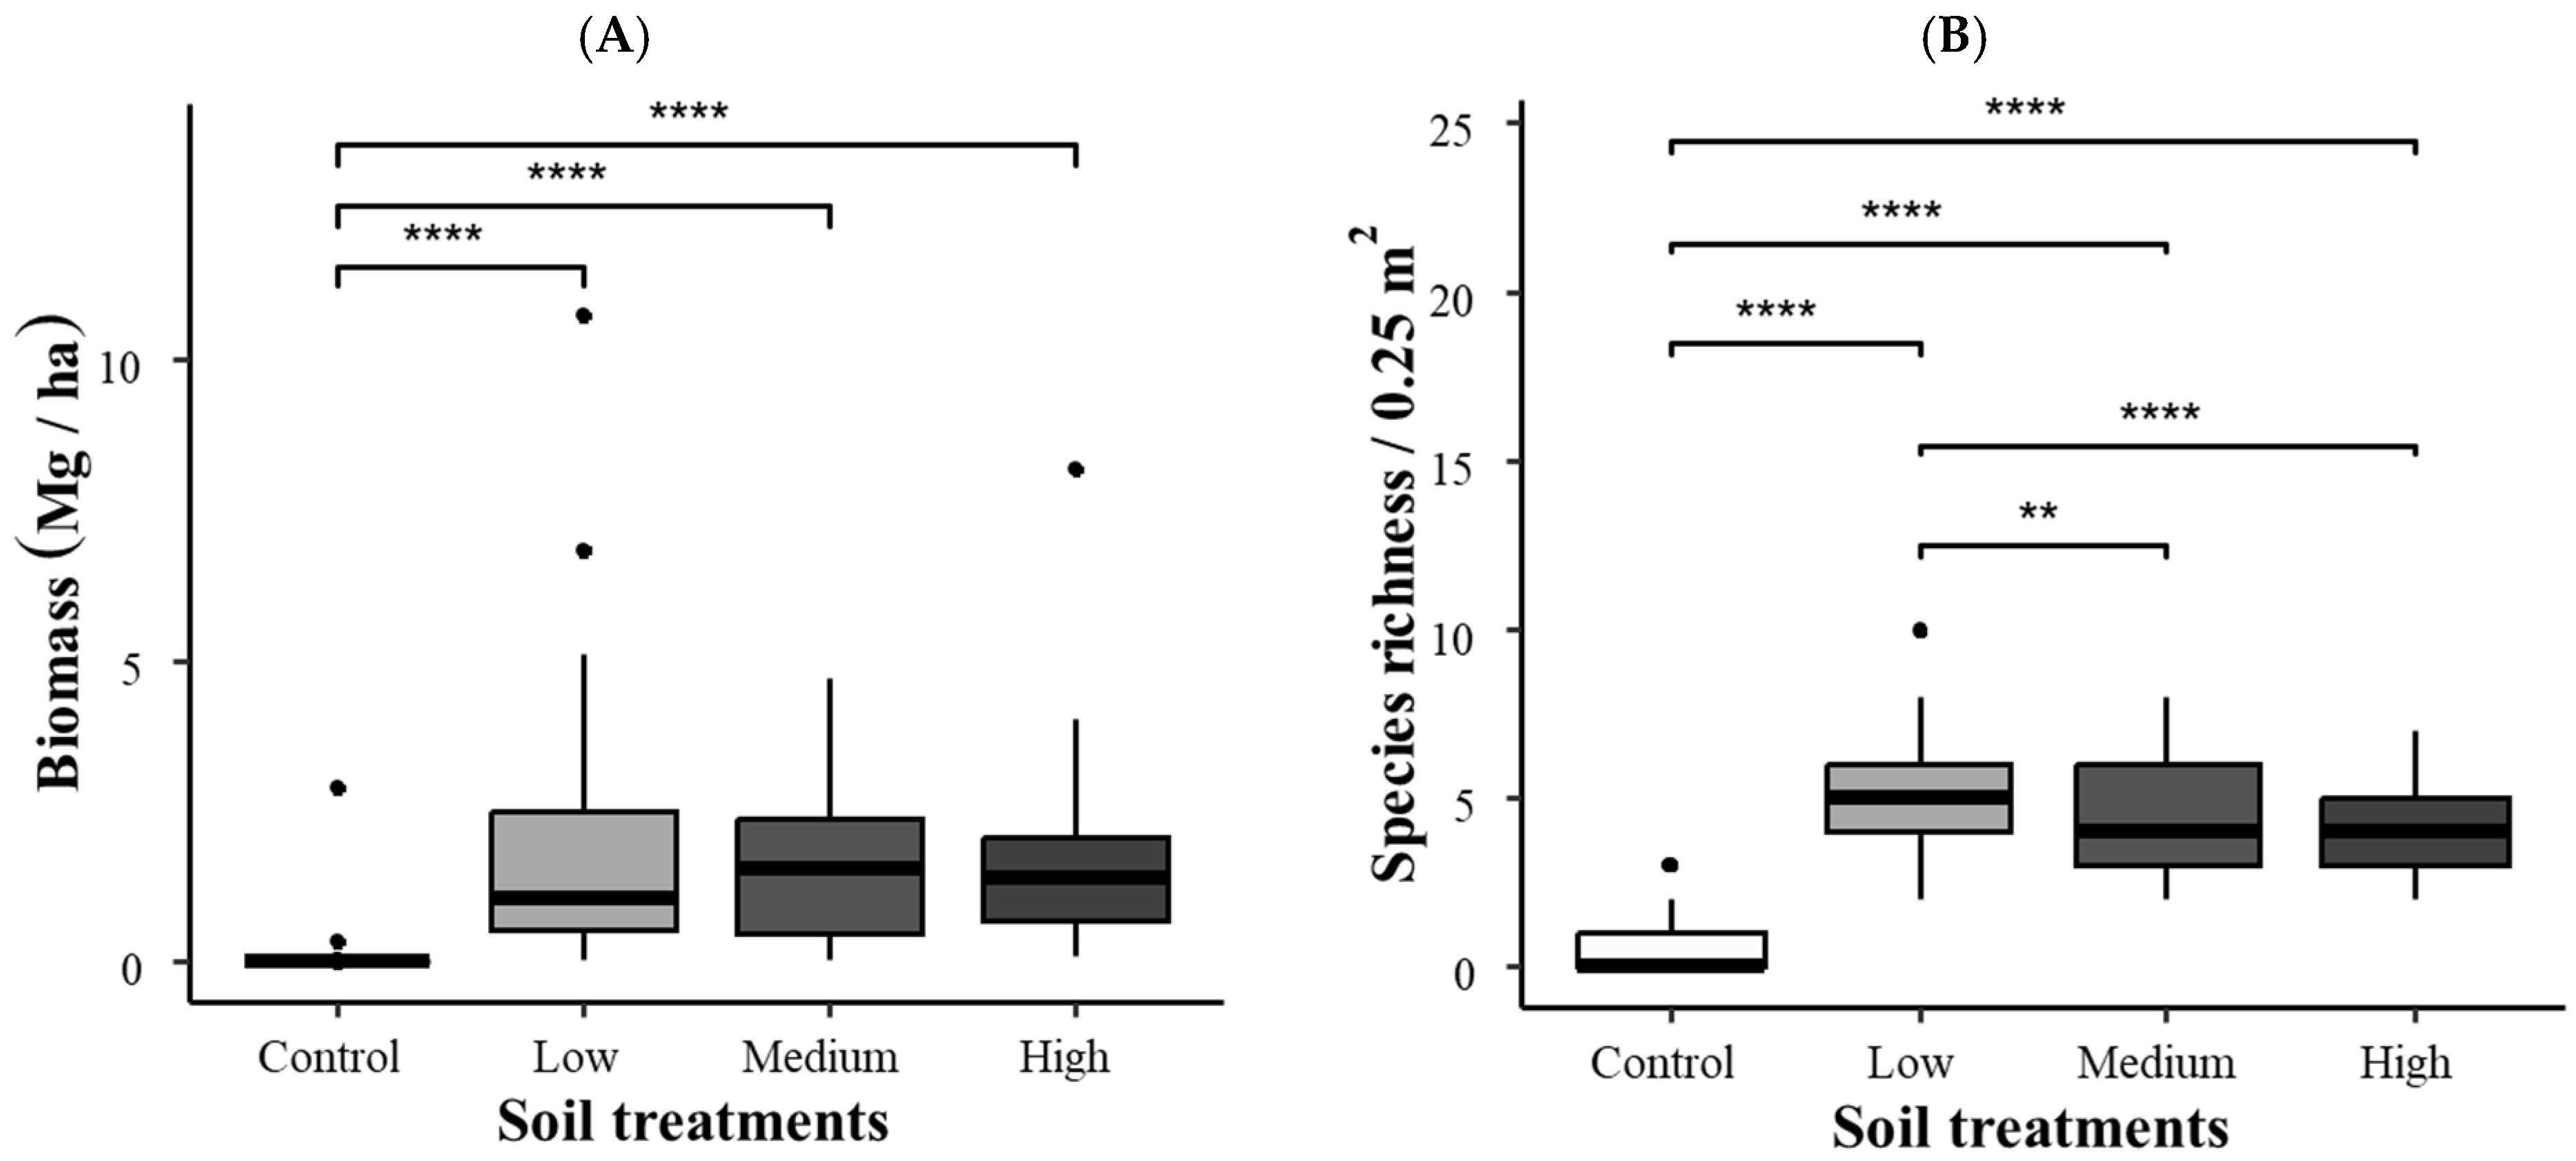
The ART model showed that the biomass (F statistics = 169.5; p < 0.001) and the species richness (F = 113; p < 0.001) were significantly impacted by biosolid treatment. The post hoc analysis showed that the plots with control treatment (0 dry Mg/ha biosolids) had the lowest biomass (Figure 1A) and observed species richness (Figure 1B). As shown in Figure 1A, there was no significant difference in the biomass of total plant communities among the three biosolid treatment groups amended with biosolids, but the species richness of the ‘Low’ (125 dry Mg/ha) biosolid treatment group was significantly different from that of the ‘Medium’ (250 dry Mg/ha) and ‘High’ (375 dry Mg/ha) treatments at the CMM site. The ‘Low’ biosolid treatment had the highest species richness (Figure 1B), when the data from both years were consolidated.
Figure 1.
Biomass (A) and species richness (B) of plant communities in different soil treatments at Copper Mountain Mine site. Asterisks above brackets denote significant pairwise comparisons between soil treatments as determined by Tukey HSD with aligned rank-transformed data, ** p < 0.01, **** p < 0.0001.
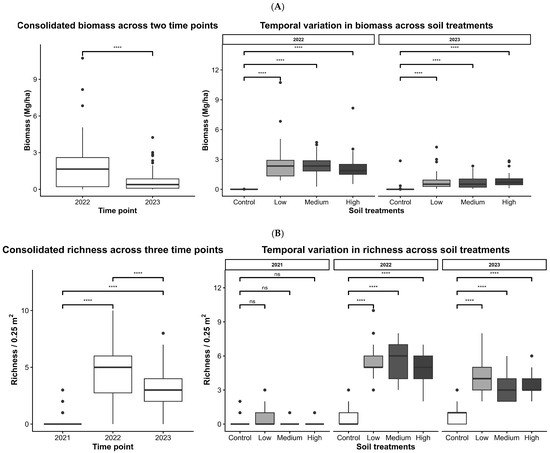
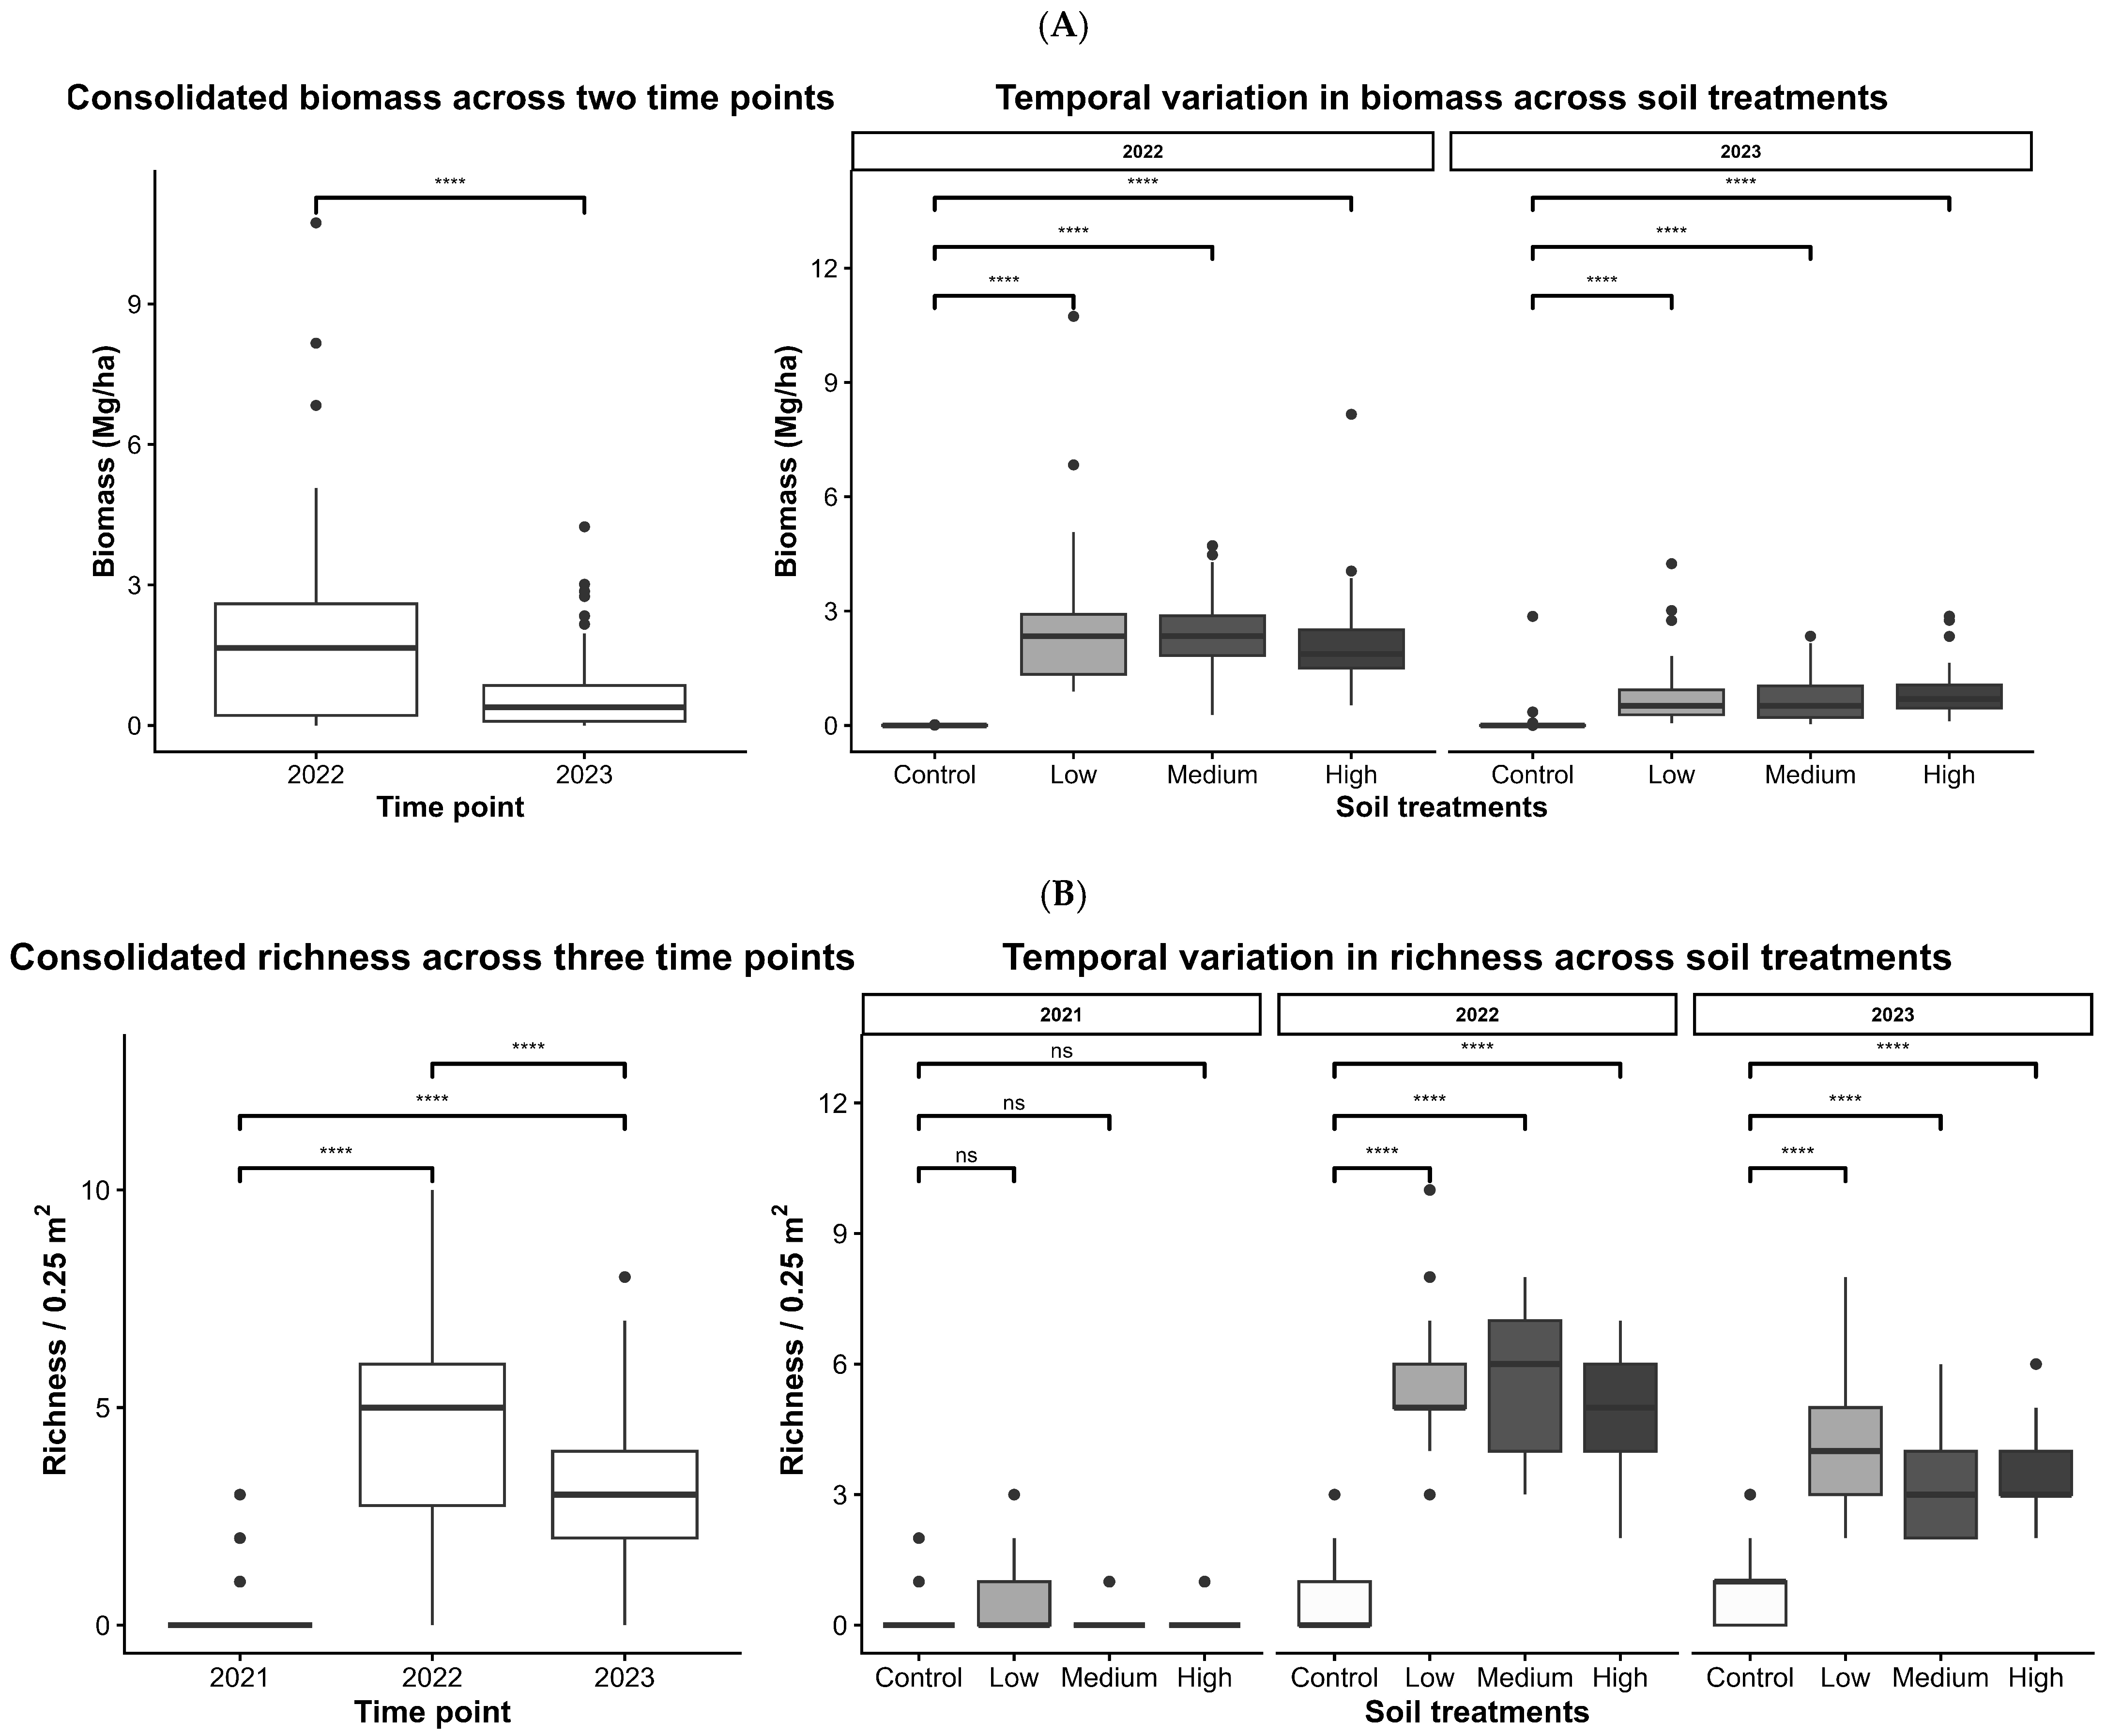
The biomass (F statistics = 49; p < 0.001) and species richness (F statistics = 208.7, p < 0.001) of plant communities have temporal variations as shown in Figure 2. There were significant differences between years, indicating notable changes in the biomass. Among them, 2022 always had the highest biomass and species richness.
Figure 2.
Biomass (A) and species richness (B) of plant communities at Copper Mountain Mine site in every experimental year. Asterisks above brackets denote significant pairwise comparisons between experimental years by Tukey HSD with aligned rank-transformed data, **** p < 0.0001. ns non-significant.
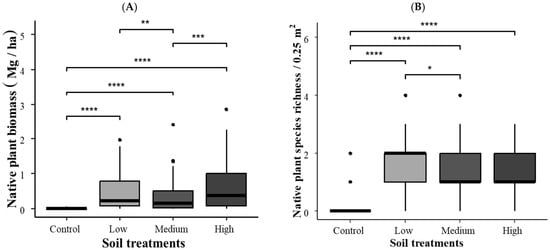
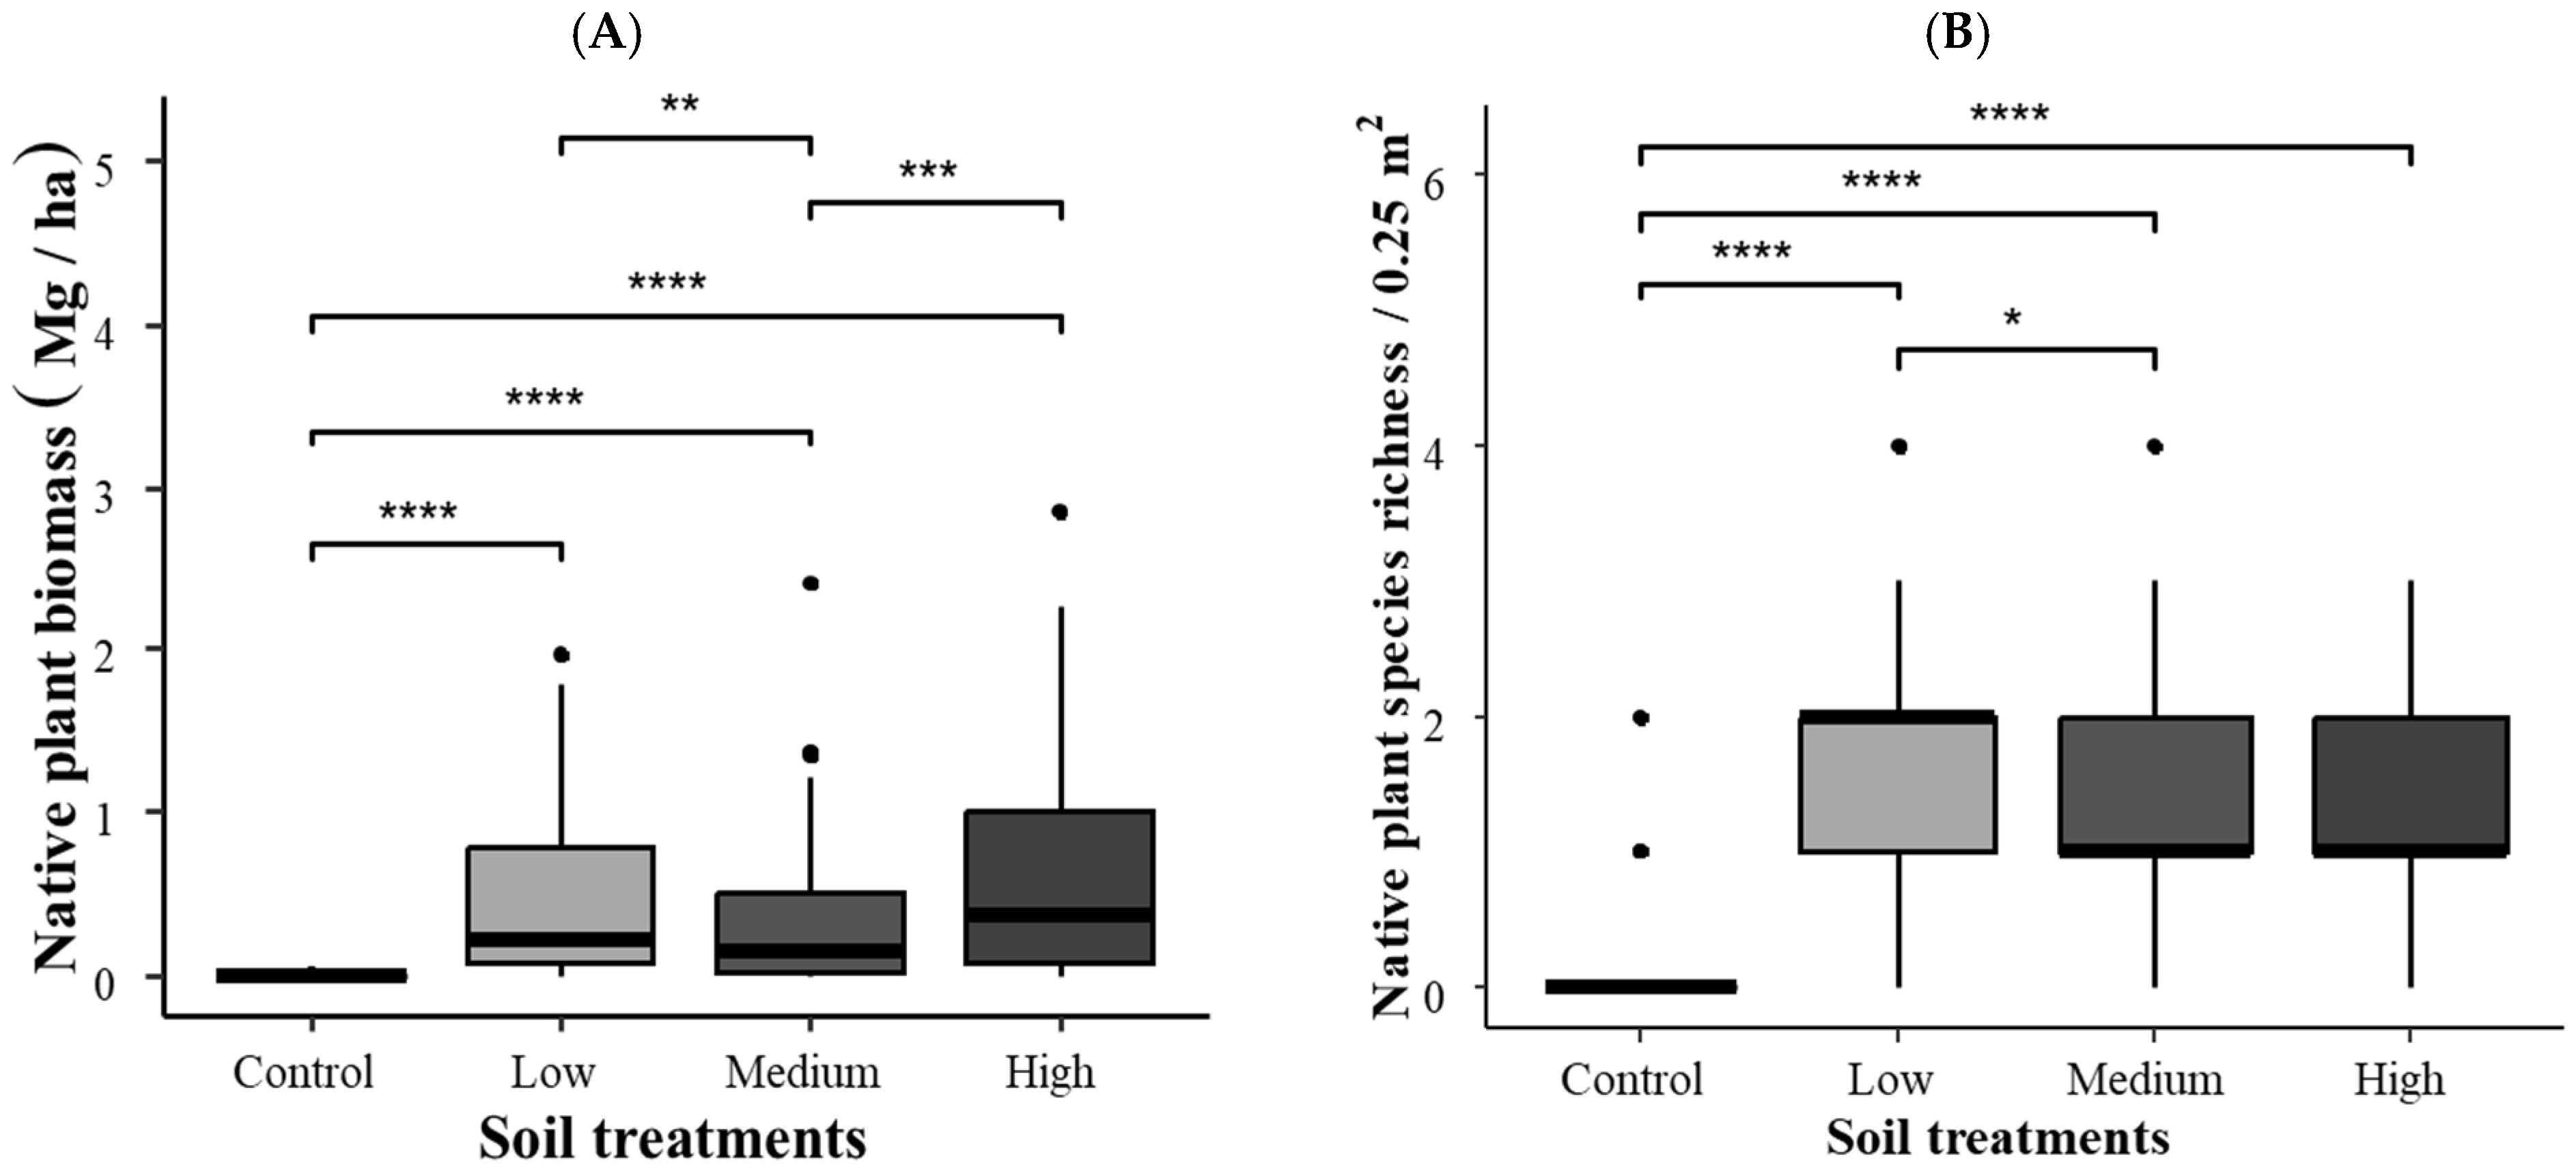
The ART model showed that the biomass (F statistics = 94.4; p < 0.001) and the species richness (F statistics = 127.5; p < 0.001) of native species were significantly affected by biosolid treatment. Post hoc analysis showed that the plots with control treatment had the lowest biomass (Figure 3A) and observed species richness (Figure 3B). There were also significant differences in the biomass and species richness among the other three soil groups in the native plant communities at the CMM test site. The ‘Low’ biosolid treatment group had a significantly higher native plant biomass and species richness than the ‘Medium’ biosolid treatment (Figure 3A,B), and the ‘High’ biosolid treatment had a significantly higher biomass than the ‘Medium’ group (Figure 3A).
Figure 3.
Biomass (A) and species richness (B) of native plant groups in different soil treatments at the Copper Mountain Mine site. Asterisks above brackets denote significant pairwise comparisons between soil treatments as determined by Tukey HSD with aligned rank-transformed data, * p < 0.05, ** p < 0.01, *** p < 0.001, **** p < 0.0001.
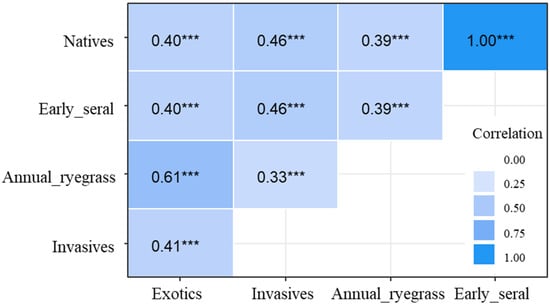
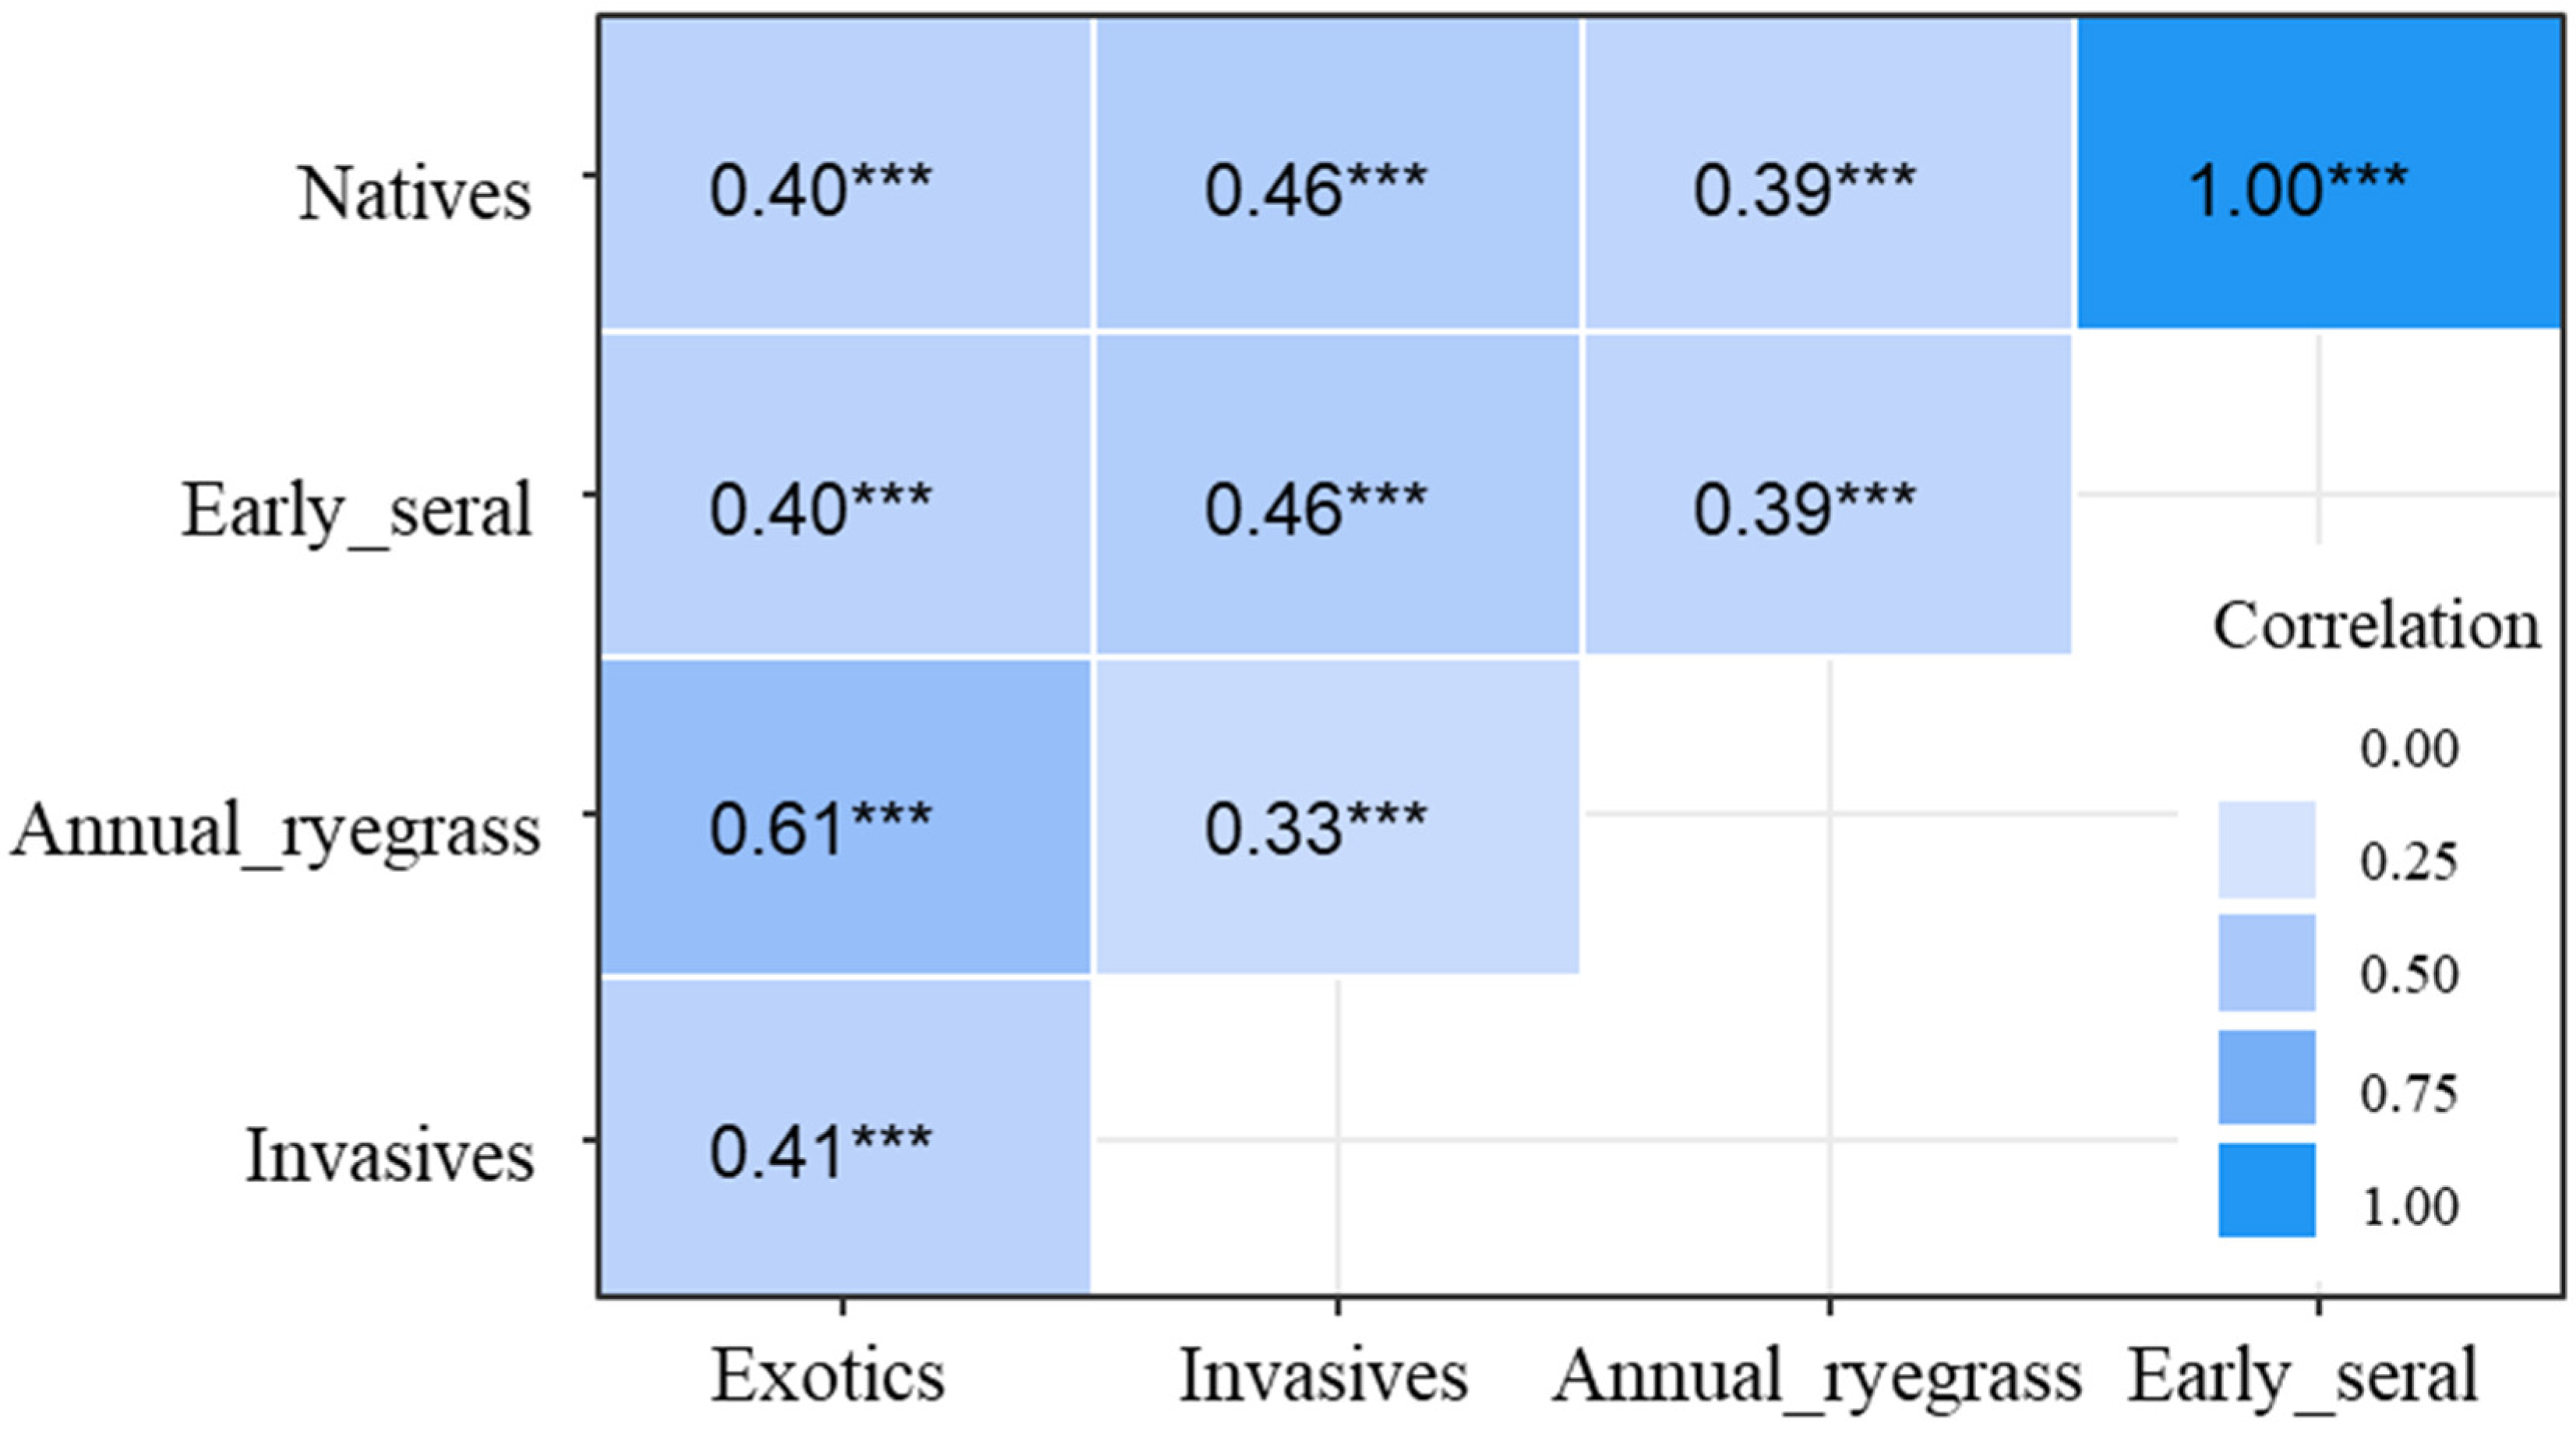
As shown in Figure 4, correlations between biomass of all plant functional groups were ‘positive’ and significant for all plant groups at the CMM site in 2022. Based on the biomass of another set of functional groups of grasses and forbs in 2022, there is a positive trend (correlation coefficient = 0.51; p < 0.001) between the biomass of grass group and forb group at the CMM site.
Figure 4.
Correlation matrix showing spearman correlation statistics for relationships between the biomass of plant functional groups in all plots of the Copper Mountain Mine site in 2022. ‘Annual ryegrass’ denotes the cover crop group. ‘Early_seral’ denotes a group of early successional plants. ‘Natives’ plant group includes early successional species. Asterisks on correlation coefficients denote significance level, * p < 0.05, *** p < 0.001. Colors show the direction of the correlation; blue shows a positive correlation.
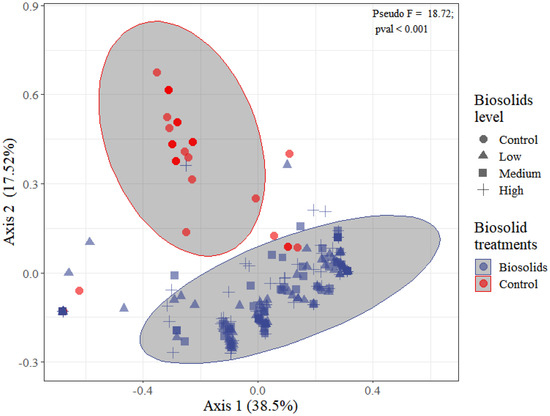
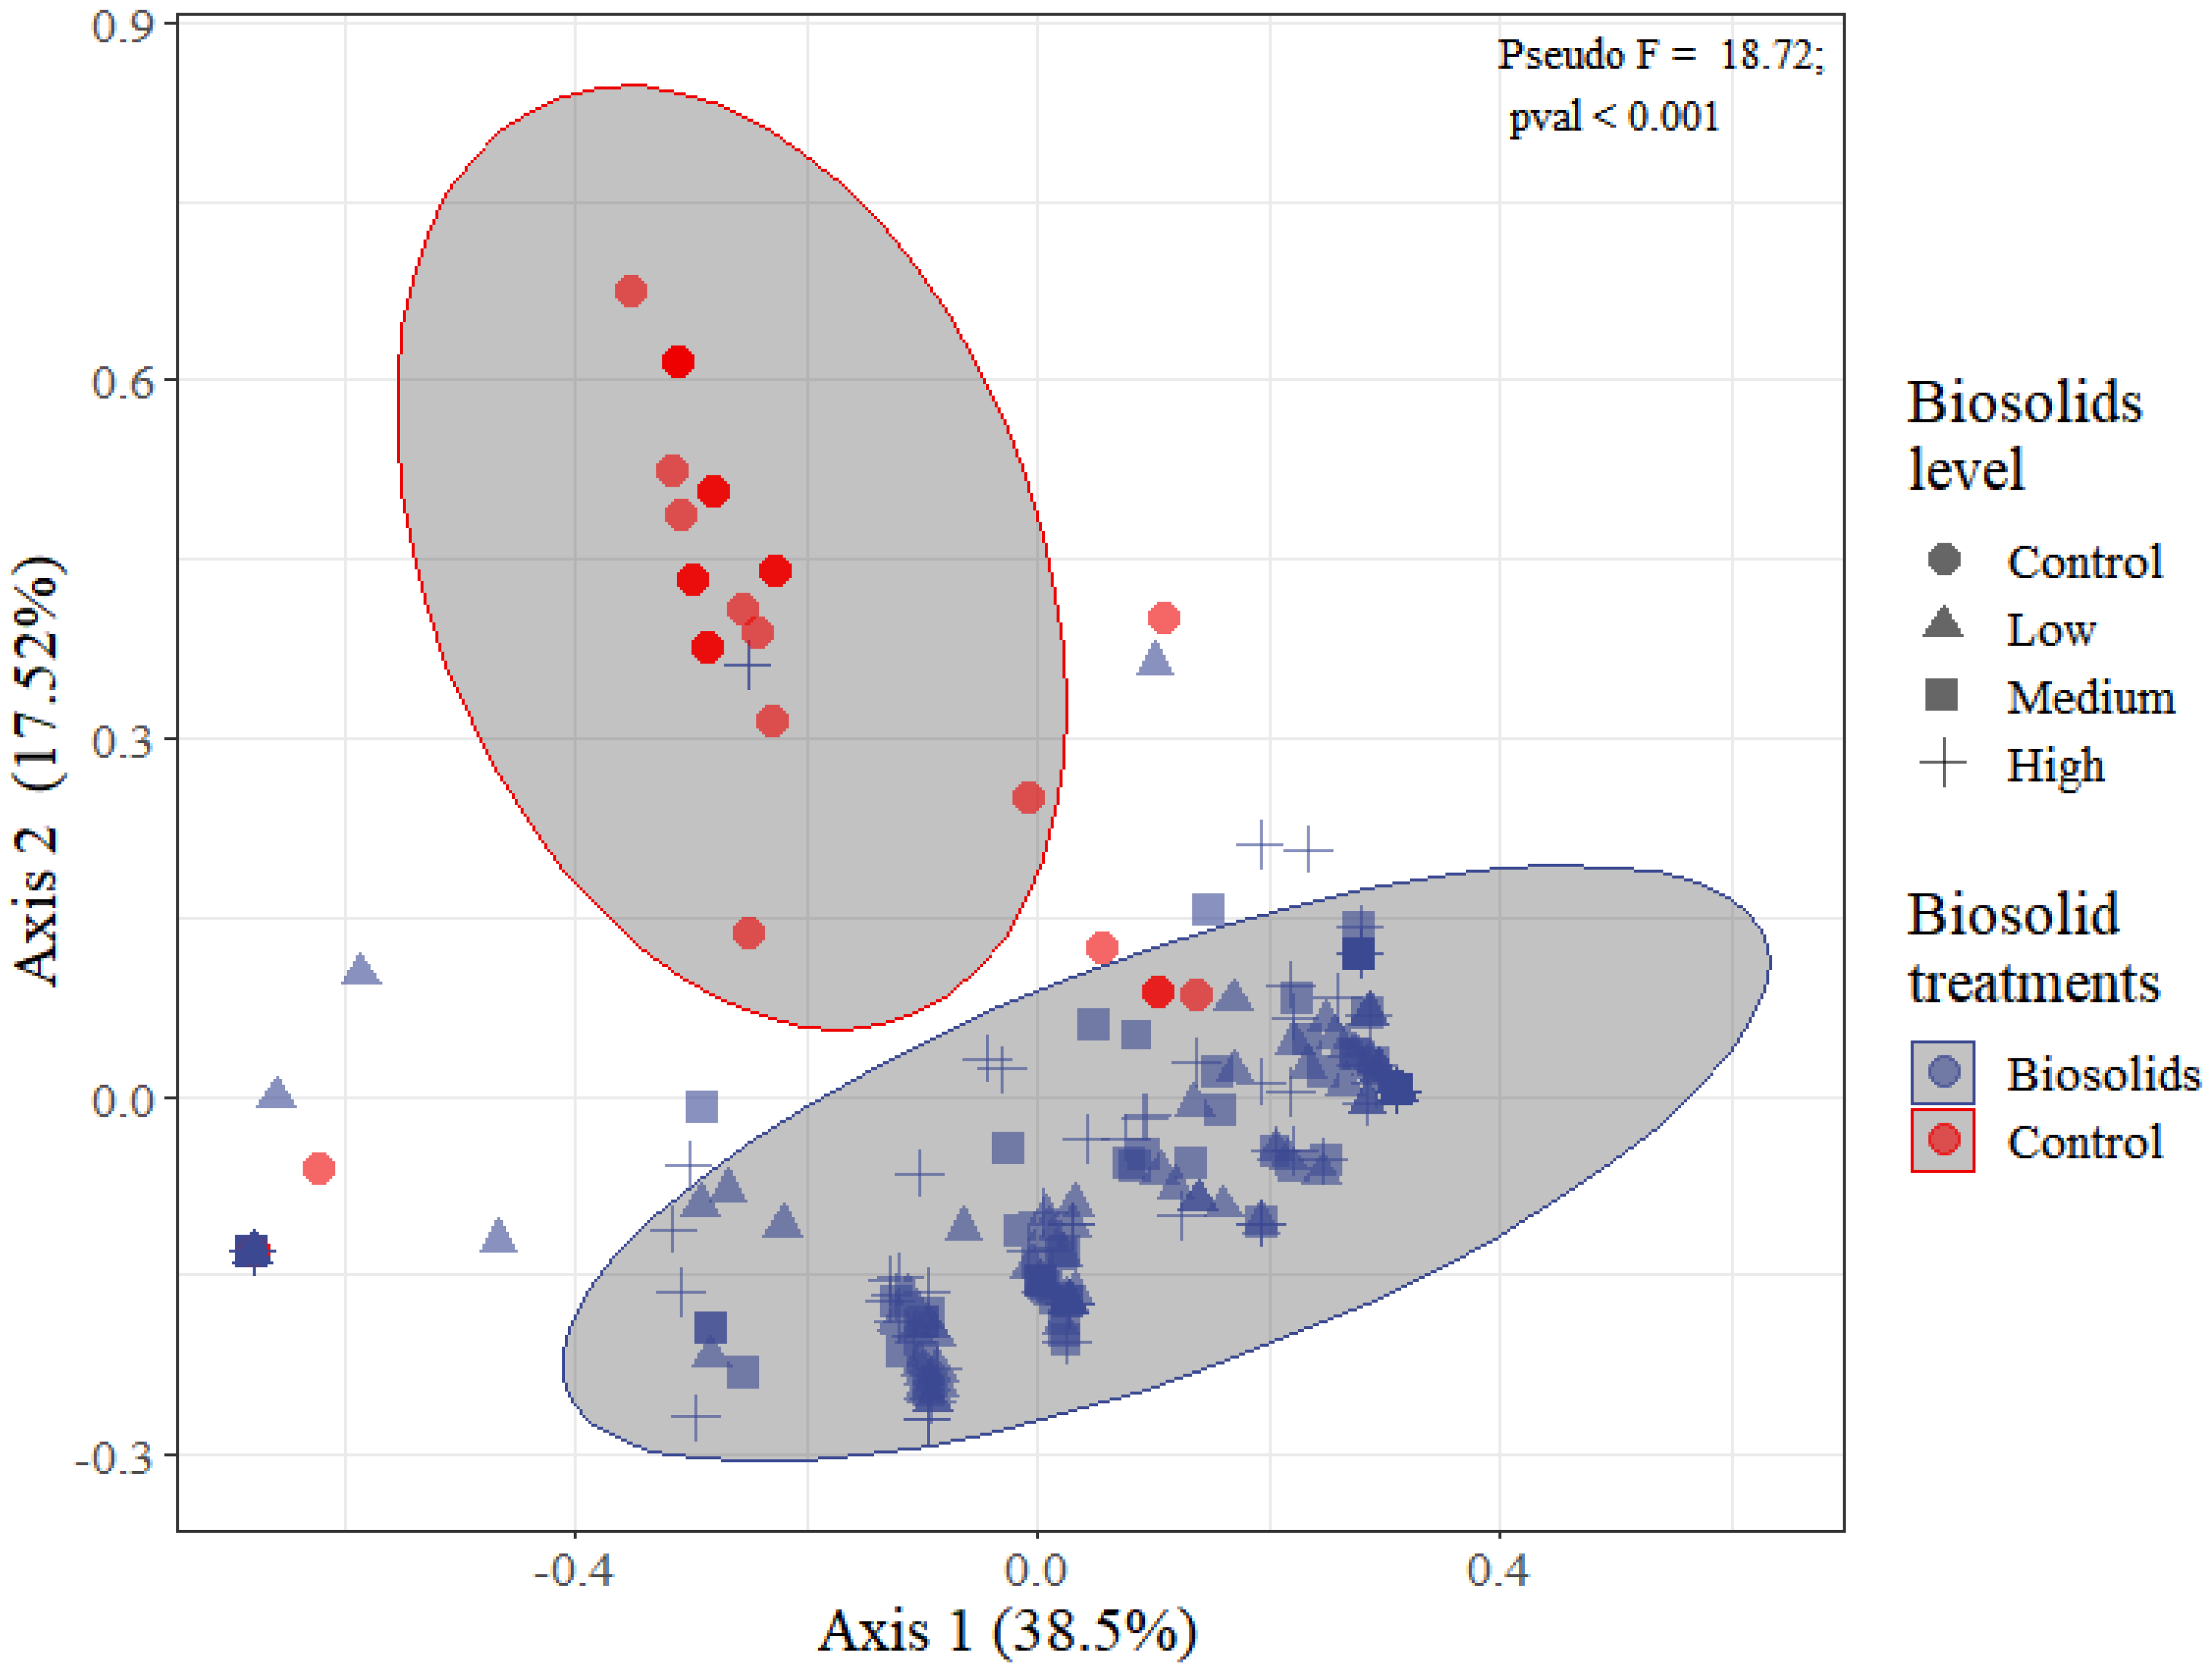
Principal Coordinate Analysis (PCoA) captured over 55% of the total variation in plant community composition (Figure 5). Furthermore, the PCoA revealed that the biosolids treated sites and control sites had distinct clusters. PERMANOVA analysis showed that the plant community composition in the ‘Control’ plots was significantly different from the biosolids treated plots (Figure 5).
Figure 5.
PCoA representing the differences in composition of plant communities among the quadrats at Copper Mountain Mine site in 2022 and 2023. Principal axes 1 and 2 (Axis 1 and Axis 2) explained 38.5% and 17.52% of the variation associated with the data, respectively.
3.2. Soil Properties
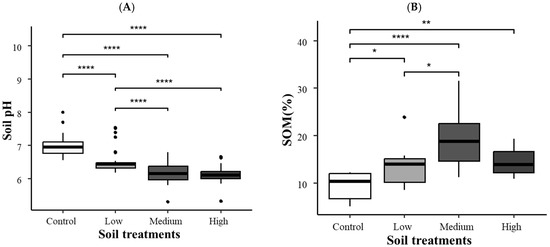
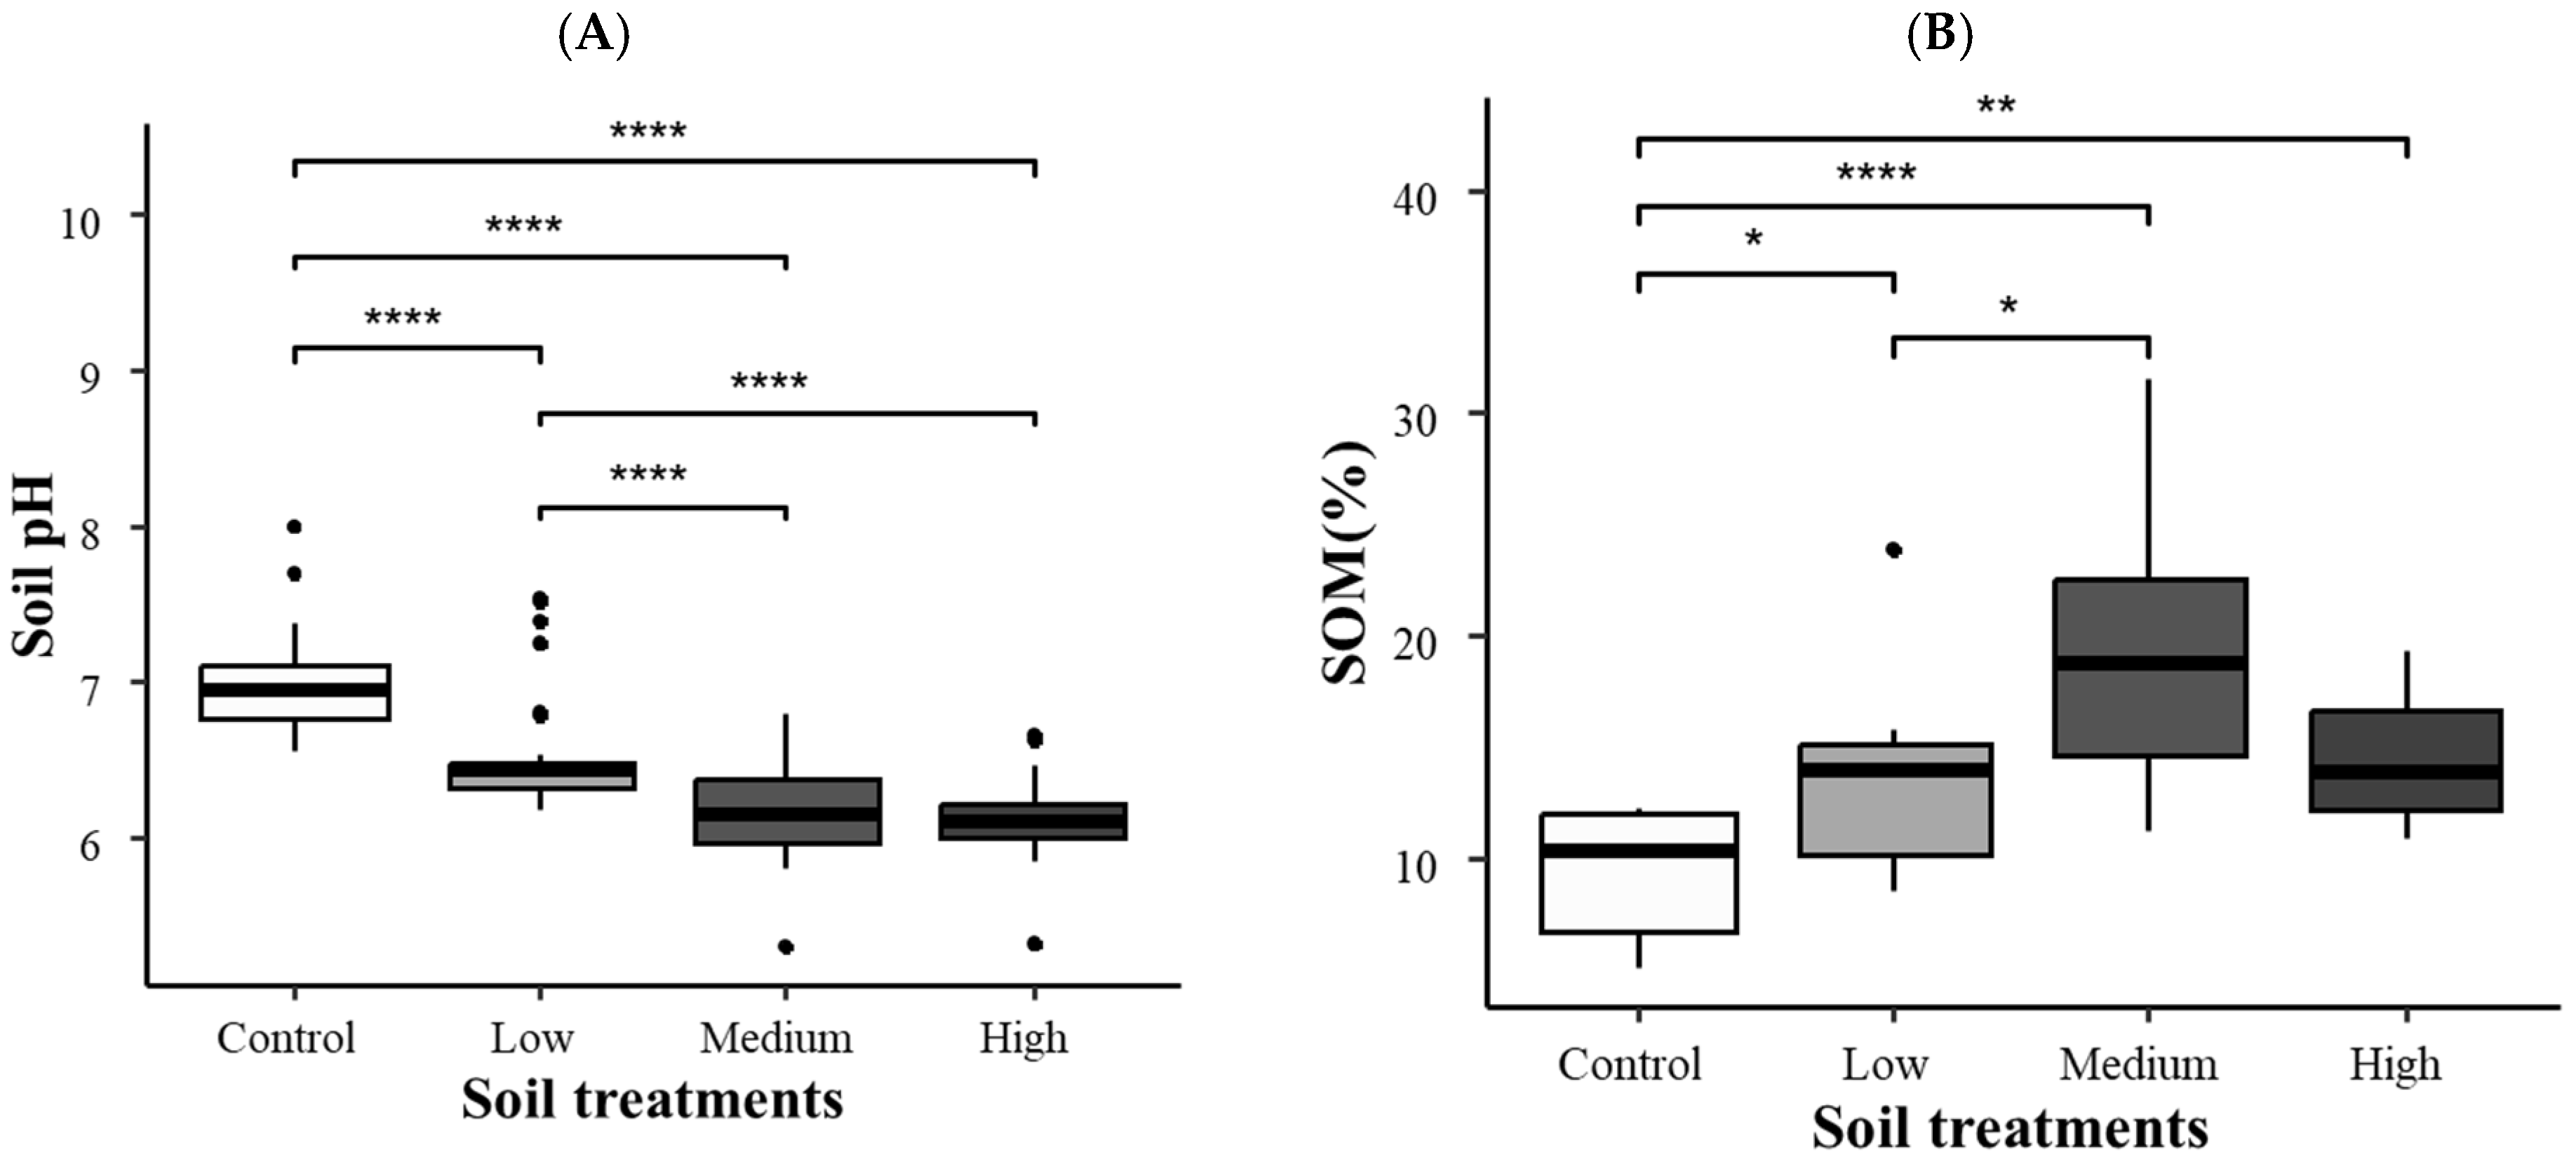
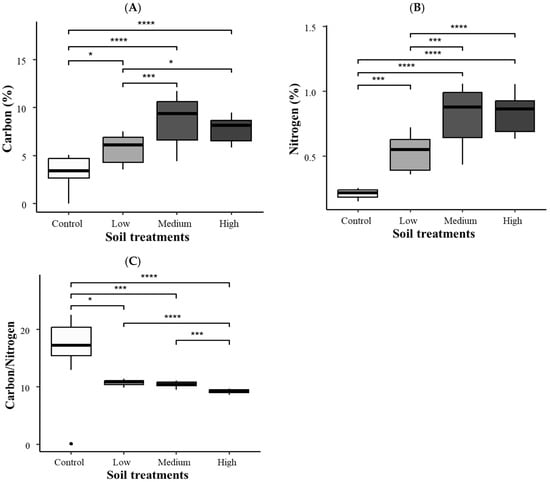
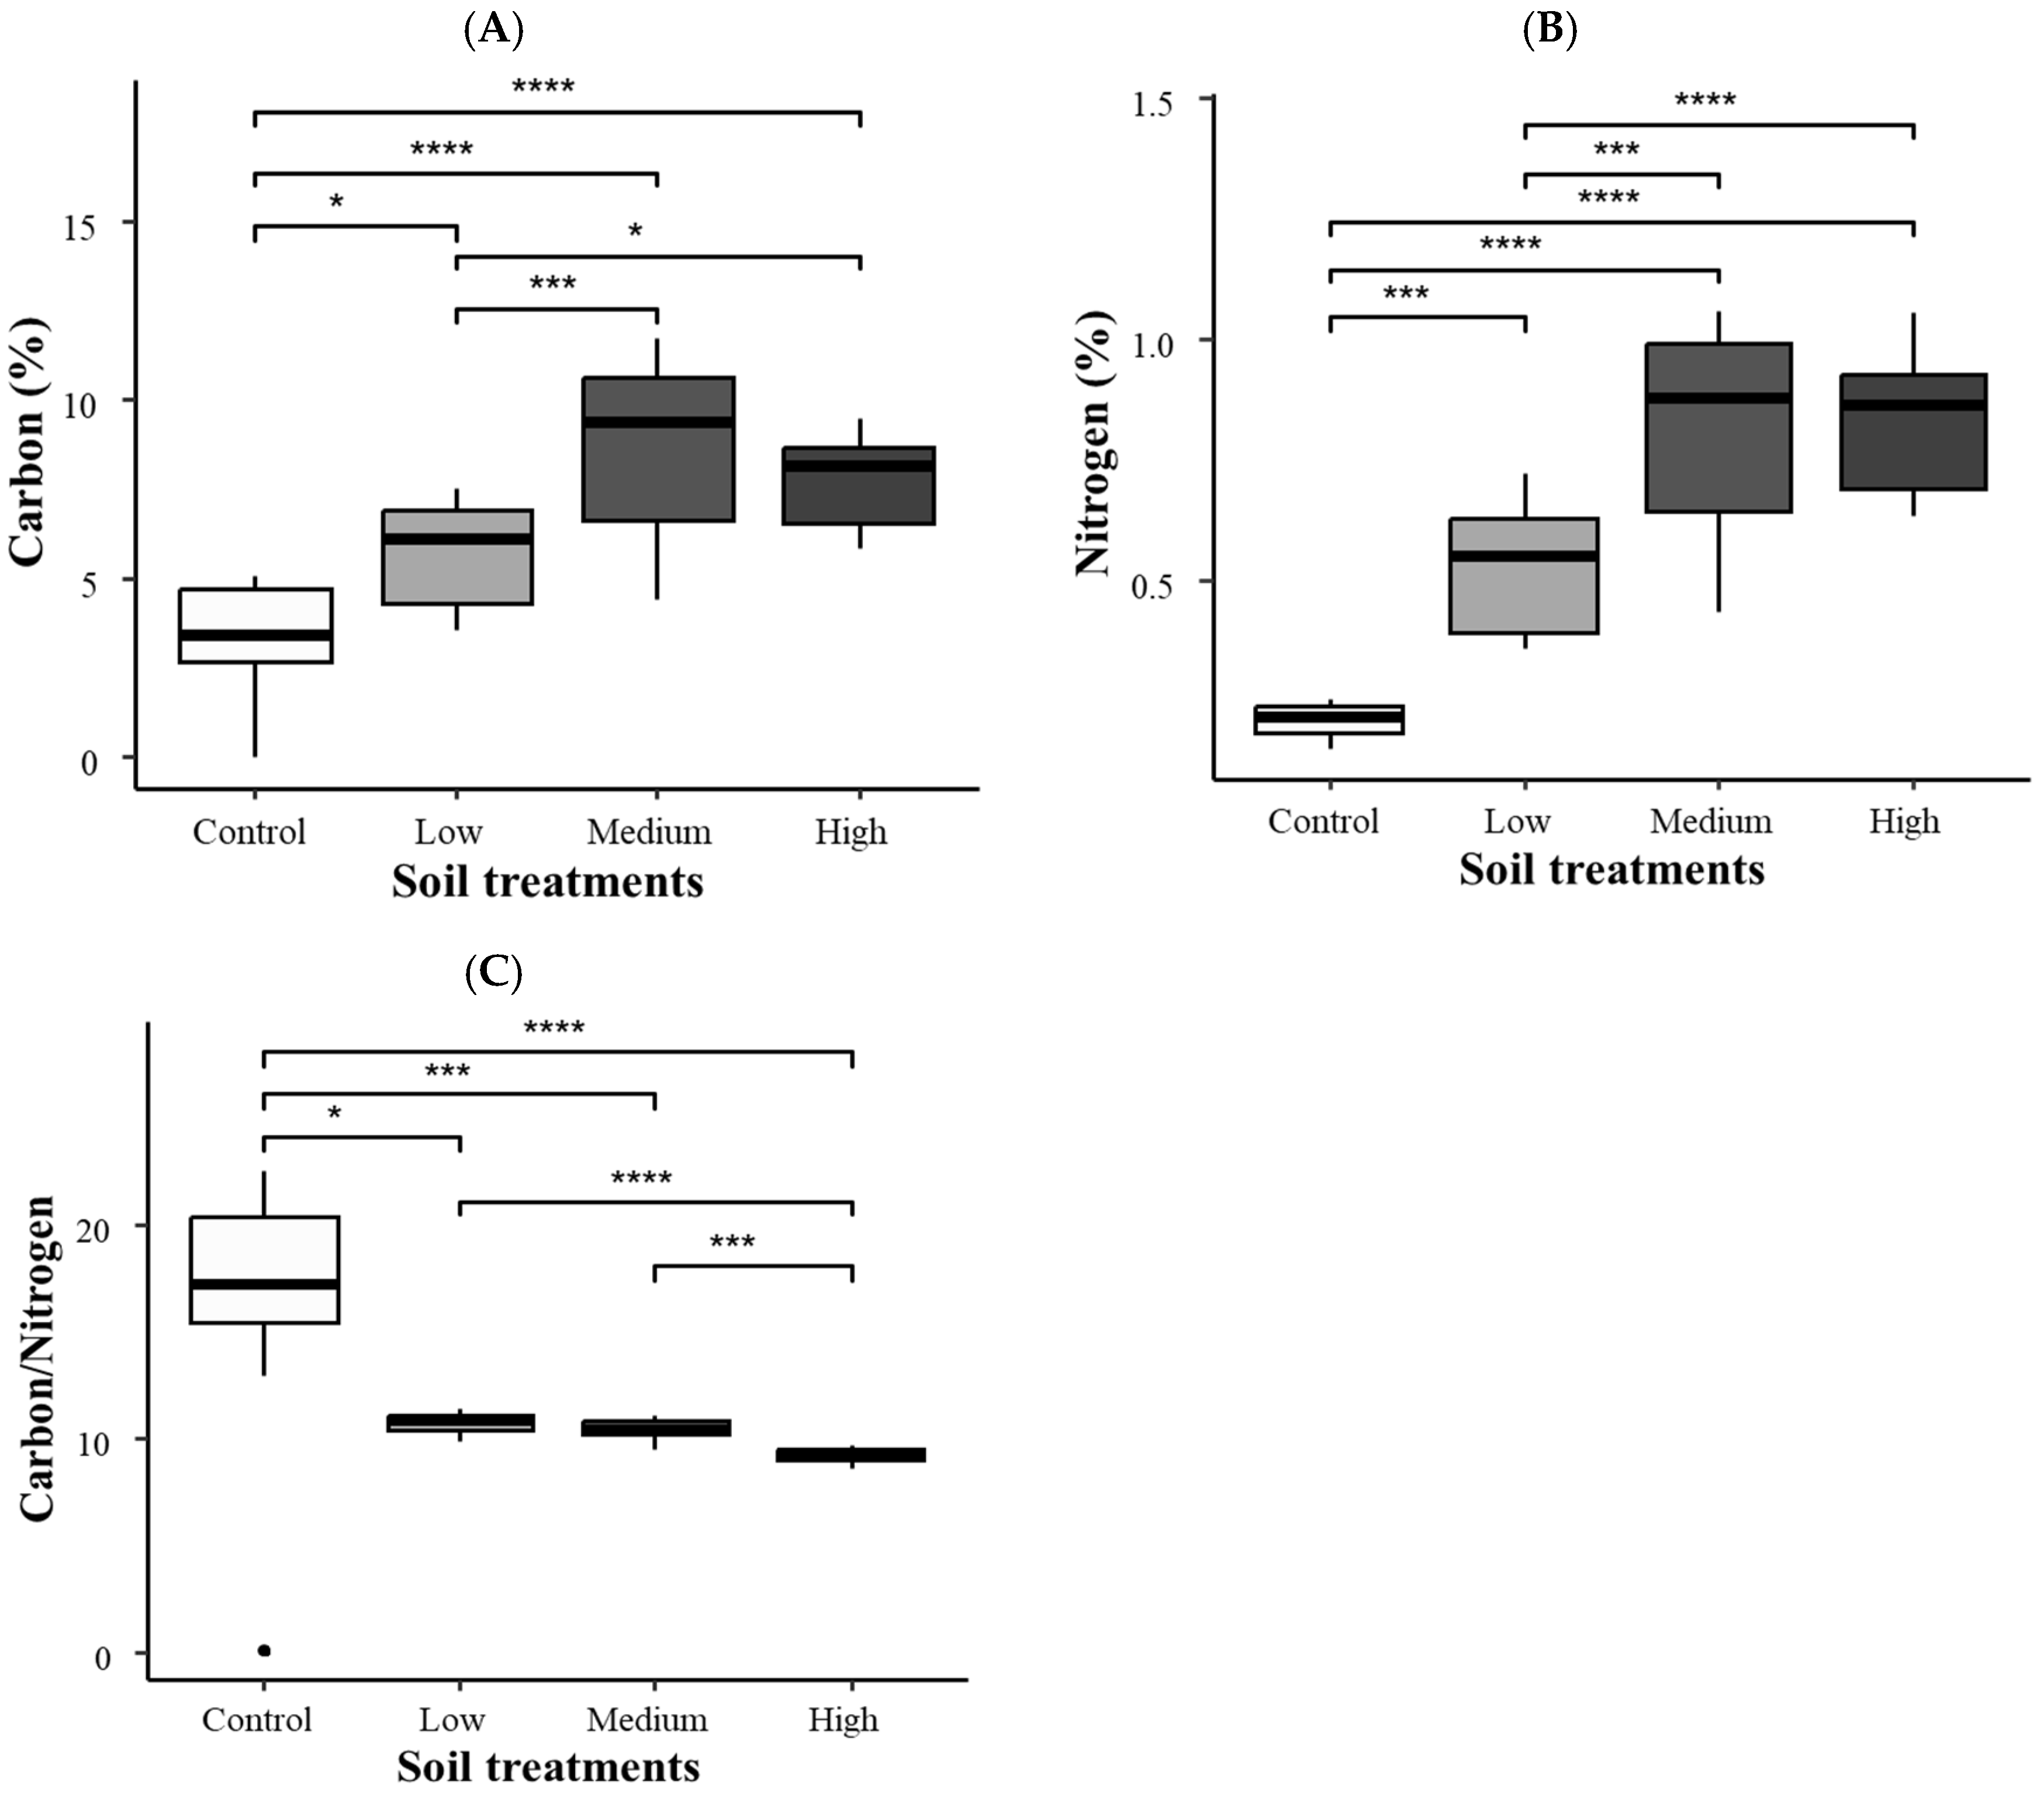
The ART two-way ANOVA revealed that soil treatments significantly affected all soil property parameters at the CMM site: pH (F statistics = 145.1; p < 0.001), SOM (F statistics = 12.3; p < 0.001), carbon (F statistics = 21.2; p < 0.001), nitrogen (F statistics = 40.6; p < 0.001) and C/N ratio (F statistics = 28.3; p < 0.001). Soil parameters of the ‘Control’ group significantly differ from the other three soil groups (Figure 6 and Figure 7), and the ‘High’ and ‘Medium’ biosolid treatment groups had lowest soil pH (Figure 6A), and highest SOM (Figure 6B), carbon (Figure 7A) and nitrogen (Figure 7B) concentrations. The ‘High’ biosolid treatment had the lowest C/N ratio (Figure 7C). Similar to the vegetation responses, the ‘Control’ soil group at the CMM site was always significantly different from the other three groups, for example, higher soil pH and C/N ratio, and lower SOM and C/N content (Figure 6 and Figure 7).
Figure 6.
Soil pH (A) of soils within 0–10 cm depth and soil organic matter (SOM) (B) in different soil treatments at Copper Mountain Mine site. Asterisks above brackets denote significant pairwise comparisons between soil treatments as determined by Tukey HSD with aligned rank-transformed data, * p < 0.05, ** p < 0.01, **** p < 0.0001.
Figure 7.
Total carbon (A), nitrogen (B), and C/N ratios (C) of soils within 0–10 cm depth in different soil treatments, and C/N ratios in 2023. Asterisks above brackets denote significant pairwise comparisons between soil treatments as determined by Tukey HSD with aligned rank-transformed data, * p < 0.05, *** p < 0.001, **** p < 0.0001.
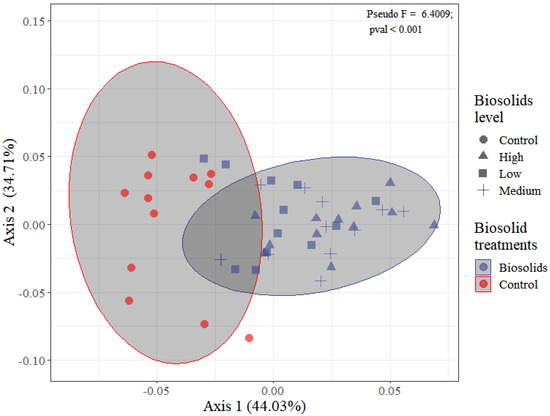
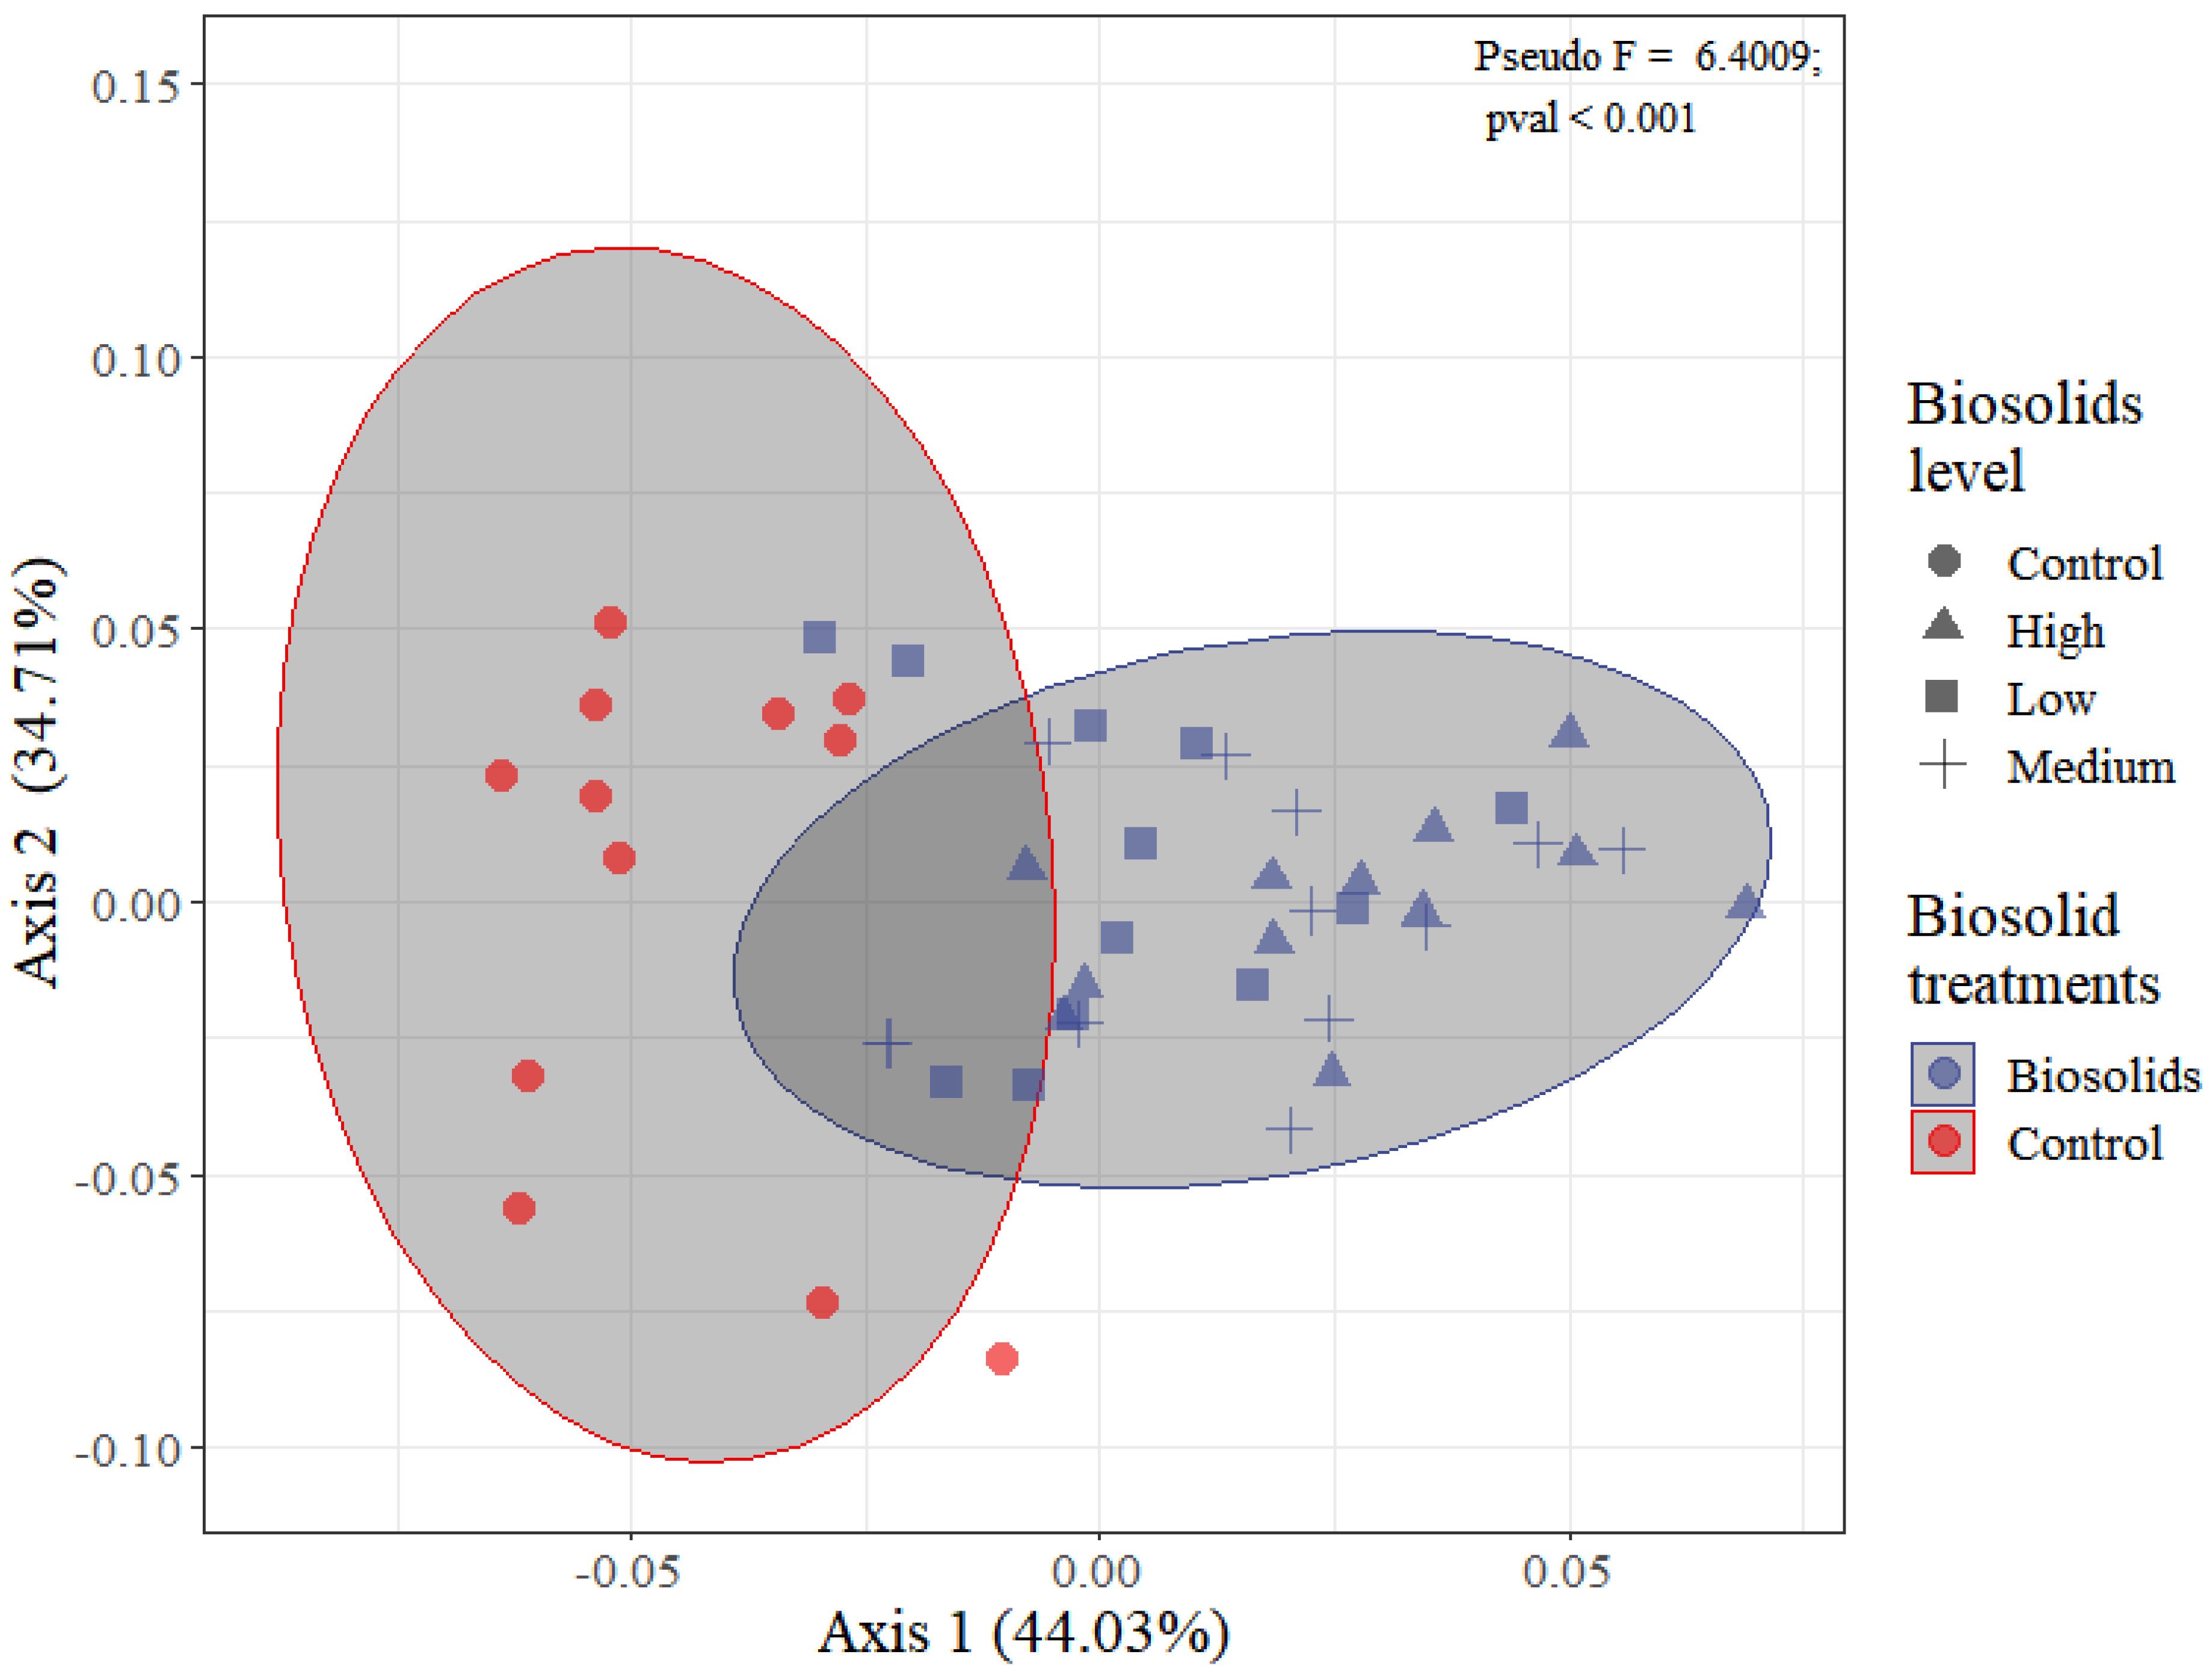
As shown in Figure 8, there were significant differences in soil elemental composition between the ‘Control’ soil group and soil groups with biosolids applied (pseudo F statistics = 6.4; p < 0.001).
Figure 8.
Principal component analysis (PCA) of 14 elements in soils at Copper Mountain Mine site in 2022. The first and second axes explained 44.03% and 34.71% of the variance, respectively.
As shown in Table 4, the soil content of As, Cu, Mo, and Zn in in some soil and seeding group exceeded the limits of agricultural land use of Canadian Council of Ministers of the Environment (CCME) soil quality guidelines for the Protection of Environmental and Human Health, and the soil content of As and Cu also exceeded the CCME guidelines for industrial land use, except for As in the ‘High’ soil group and Zn in the ‘Control’.
Table 4.
Concentrations (mg/kg dry weight) of metals and trace elements in soils of different soil and sowing treatments at Copper Mountain Mine site. Values are compared to the Canadian Council of Ministers of the Environment soil quality guidelines (CCME, 1999) guidelines for agricultural and industrial uses. Bolded values are in exceedance of at least one of the referenced guidelines.
4. Discussion
4.1. Vegetation Response
The addition of biosolids appeared to increase the biomass and species richness of plant communities as the ‘Control’ group had significantly lower biomass and diversity than the other three groups with biosolids added in the CMM site, and the composition of plant communities of the ‘Control’ group was different from the other three groups with biosolid addition. These beneficial effects of biosolids not only promoted the growth of native plants and cover crops but also that of other exotic species, and there were no significant negative associations among plant groups. The nutrient input from biosolids are generally beneficial for plant growth but can also be used by unintended species, allowing invasive and exotic plants from the surrounding environment and/or soil seed banks to establish mixed plant communities with intended species (selected native successional plants and the cover crop) [27].
This study found that biosolids had a positive effect on plant productivity, probably due to the increased organic matter content improving the physicochemical conditions of the mine soils [28]. Consistent with the results of a related long-term experiment, this study observed a significant increase in biomass with biosolid application, but no further significant increases in biomass and species richness were observed beyond an application rate of 125 Mg/ha of biosolids (‘Low’ soil group), and there were no significant differences between the three biosolid-applied soil groups [5]. This may explain the fact that the application of biosolids at any rate in this experiment enhanced plant biomass and species richness (Figure 1A and Figure 2). Differences in how these three biosolid-applied soil groups were associated in total (Figure 1) and native plant (Figure 3) communities suggest that the rates of biosolid application have varying effects on different plant species; for instance, the ‘Medium’ biosolid treatment group has significantly lower native plant biomass than the other two biosolid-applied soil groups (Figure 3). Increasing the rate of biosolid applications either had a negative effect (i.e., a reduction in species richness) or a marginally positive impact (biomass) (Figure 1). Higher biosolid rates did not benefit native plant biomass or richness in the experiment (Figure 3). The clearest benefit was observed in increasing soil carbon and nitrogen content, but this resulted in an imbalanced C/N ratio (Figure 7), which may affect ecosystem function [29,30]. Therefore, the minimal differences in measured parameters across the various biosolid application rates suggest that lower biosolids input rates (125 Mg/ha) will benefit reclamation efforts. Increasing the biosolid application rates will make ecosystem reclamation expensive while providing limited to no benefit.
Furthermore, climatic variables can play a critical role in plant diversity, establishment, and growth in grasslands [31], especially in reclaimed grasslands. Moreover, the productivity and diversity of plant communities can be affected by differences in climate, soil conditions, or other environmental factors between years [32]. We notice a similar pattern at our site, where changes in climate conditions over the three years of the experiment seem to have substantially affected plant diversity and productivity (Figure 2). The reduced diversity in 2021 and 2023 is likely due to elevated drought conditions during those years (Supplementary Table S1). Additionally, the mean annual precipitation and temperature were unfavorable (Supplementary Table S2), with lower precipitation and elevated temperatures in 2021 and 2023, which likely resulted in reduced overall species richness. Similarly, overall biomass productivity declined in 2023, following the pattern of species richness. Despite the detrimental effects of the climatic conditions, biosolid application enhanced both plant diversity and productivity, suggesting it may alleviate some of the negative effects of unfavorable climatic conditions.
4.2. Soil Response
Previous studies have reported that biosolids have positive effects on soil fertility and function [33,34,35,36]. This would be consistent with the results of this study as the ‘Control’ group had lowest SOM, carbon, and nitrogen, the C/N ratio was the highest among soil groups. In addition, the carbon and nitrogen concentrations were always significantly higher in the ‘Medium’ and ‘High’ biosolid treatment groups than in the ‘Low’ treatment, and the SOM in the ‘Medium’ biosolid treatment group was also significantly higher than that in the ‘Low’ treatment. This result concurs with a previous short-term study: soil nutrients and organic matter were positively correlated with the amounts of biosolids applied [37]. Furthermore, the plots of the ‘Control’ group at the CMM site had soil elemental compositions different from that of other three soil groups amended with biosolids.
As microbial activity increases, soil carbon is depleted faster than nitrogen, resulting in a decrease in the C/N ratio, which is consistent with the similar trend of the soil C/N ratio [38]. The soil nitrogen content was poor (total nitrogen < 0.15%) only in the ‘Control’ soil group [39], and the soil C/N ratio was lower than the normal grassland C/N ratio range (13.4–14.2) for all soil groups except the ‘Control’ soil group [40]. The results show that the application of biosolids mitigated soil nitrogen deficiency. Moreover, biosolids were rich in nitrogen [41], which likely resulted in an imbalance in the soil C/N ratio. While the C/N ratio was reduced in biosolid-treated plots, it closely resembled that of a grassland with a low SOM decomposition rate [42].
Native plants are often not adapted to excess nitrogen, which may be one of the reasons why exotic plants have higher productivity and diversity in this study, as well as other reported studies [43,44,45]. ‘Medium’ and ‘High’ biosolid treatment groups of both sites had the lowest soil pH and C/N ratio among the soil treatments though will probably have better performance in long-term research (Figure 6 and Figure 7). The soil concentrations of As, Cu, Mo, and Zn were high compared to CCME agricultural guidelines. However, barring copper, the mean concentrations of the other elements were either lower than or similar to the industrial CCME. Mean As concentration was within the CCME industrial guideline, but in some soil samples, it exceeded the guideline by a narrow margin, indicating high heterogeneity across samples. Compared with both the baseline soil and the control, the As and Mo concentrations decline marginally in the medium and high biosolid treatment groups, likely due to the dilution effect of biosolid application. Copper was consistently higher than the CCME industrial guideline, as expected, given that the region is rich in copper ore. However, there was a marked increase in copper concentrations above baseline in biosolid-amended treatments. This increase is likely due to the presence of copper in biosolids [46] (Supplementary Table S3). While the control plots provide the most appropriate experimental reference for evaluating the effects of biosolids, the baseline data indicate that the mine soil was initially characterized by low levels of organic matter, total carbon, and nitrogen (Figure 7; Supplementary Table S3). Relative to both the baseline soil conditions and the control treatment, biosolid application increased soil carbon, nitrogen, and organic matter, indicating substantial improvement in soil quality and reclamation potential (Figure 7; Supplementary Table S3).
In addition to providing nutrients, biosolids can influence the geochemical behavior of metals within mine soils. Organic matter introduced through biosolids contains functional groups capable of binding metal ions through adsorption, complexation, and chelation reactions [47,48,49]. Despite the increase in some heavy metals (e.g., Cu and Zn), the aforementioned processes can reduce metal mobility and bioavailability by promoting the formation of organo-mineral complexes and increasing sorption sites within the soil [50]. Consequently, the ecological effects of biosolids are not solely attributable to nutrient enrichment but also to their modification of mineral-surface processes that influence metal stability and nutrient retention.
Furthermore, the observed increases in soil organic matter, carbon, and nitrogen have implications for long-term soil development on mine soils. Soil organic matter can become associated with mineral particles, contributing to the formation of stable carbon pools [51] and improving aggregate formation [52]. Such organo-mineral interactions represent an important early step in the transformation of mine-impacted soils into a functioning soil capable of sustaining vegetation. From a reclamation perspective, the effectiveness of biosolids may therefore be understood not only through their short-term fertilization effects but also through their role in accelerating soil-forming processes on mining-impacted landscapes.
5. Conclusions
Biosolid application improved the soil quality in mining-impacted soil by boosting plant growth, species diversity, and key soil physicochemical parameters. Over three years, plots treated with biosolids consistently showed more biomass and higher plant diversity than untreated controls. These plant responses were linked to higher soil organic matter levels and increased carbon and nitrogen, indicating that biosolids effectively supplied nutrients that are usually deficient in mining-impacted soil. Additionally, biosolids influenced plant community composition, encouraging the development of more diverse and productive vegetation communities, which persisted even during drought.
Importantly, increasing biosolid application rates beyond 125 dry Mg ha−1 showed mixed results, with only marginal gains in plant productivity and nutrient content (e.g., carbon, nitrogen, and total organic matter). In several cases, higher application rates were associated with reduced native plant species richness, suggesting that 125 dry Mg ha−1 is the optimal rate to support reclamation. Furthermore, these findings suggest that the benefits of biosolid application plateau at relatively low application rates, and that excessive additions may offer limited benefits while increasing reclamation costs.
Although biosolid treatments increased concentrations of some elements, particularly copper and zinc, most exhibited differences reflected existing site conditions and the elemental composition of the biosolids. The elevated soil organic matter associated with biosolid application may further reduce metal bioavailability through adsorption and complexation processes. Nevertheless, long-term monitoring of metal mobility and plant uptake remains an important consideration for future studies to ensure the sustainability of reclamation outcomes. Overall, our results demonstrate that a one-time biosolid application can be an effective tool for restoring semi-arid grassland ecosystems on mine-impacted lands.
Supplementary Materials
The following supporting information can be downloaded at: https://www.mdpi.com/article/10.3390/min16080768/s1, Table S1: Drought conditions of study sites from 2016 to 2020 and experimental years (2021 to 2023). The median of drought levels from 2016 to 2020 is the long-term normal. Experimental years are boldfaced. Level of drought: 0—no adverse impacts to socio-economic or ecosystem values, 1—adverse impacts rare, 2—adverse impacts unlikely, 3—adverse impacts possible, 4—adverse impacts likely, 5—adverse impacts almost certain; Table S2: Weather conditions of study sites from 1991 to 2020 and experimental years (2021 to 2023), data collected from Climate BC (Center for Forest Conservation Genetics, 2024). Experimental years are boldfaced; Table S3: pH and elemental composition of baseline biosolids, the soil substrate, and treatments used in the experiment.
Author Contributions
Conceptualization, L.H.F. and M.X.; methodology, M.X., W.G. and L.H.F.; validation, M.X. and L.H.F.; formal analysis, M.X., J.S. and L.H.F.; investigation, M.X. and L.H.F.; resources, L.H.F.; data curation, L.H.F.; writing—original draft preparation, M.X. and L.H.F.; writing—review and editing, M.X., J.S., W.G. and L.H.F.; visualization, L.H.F.; supervision, L.H.F.; project administration, L.H.F.; funding acquisition, L.H.F. All authors have read and agreed to the published version of the manuscript.
Funding
This research was funded by Natural Sciences and Engineering Research Council of Canada, IRC Ecosystem Reclamation.
Data Availability Statement
The original contributions presented in this study are included in the article/Supplementary Material. Further inquiries can be directed to the corresponding author.
Acknowledgments
This paper has been extracted from the first author, Meiyi Xiao’s Master thesis: Meiyi Xiao, The Use of Biosolids to Restore Native Plant Communities in Semi-Arid Grasslands, MSc Thesis, Thompson Rivers University, British Columbia, Canada, 2024. There is no issue with regard to the author university’s policies.
Conflicts of Interest
The authors declare no conflict of interest.
References
- Brown, S.; Beecher, N.; Carpenter, A. Calculator Tool for Determining Greenhouse Gas Emissions for Biosolids Processing and End Use. Environ. Sci. Technol. 2010, 44, 9509–9515. [Google Scholar] [CrossRef] [Scilit] [PubMed]
- Gardner, W.C.; Anne Naeth, M.; Broersma, K.; Chanasyk, D.S.; Jobson, A.M. Influence of Biosolids and Fertilizer Amendments on Element Concentrations and Revegetation of Copper Mine Tailings. Can. J. Soil. Sci. 2012, 92, 89–102. [Google Scholar] [CrossRef] [Scilit]
- Wijesekara, H.; Bolan, N.S.; Thangavel, R.; Seshadri, B.; Surapaneni, A.; Saint, C.; Hetherington, C.; Matthews, P.; Vithanage, M. The Impact of Biosolids Application on Organic Carbon and Carbon Dioxide Fluxes in Soil. Chemosphere 2017, 189, 565–573. [Google Scholar] [CrossRef] [Scilit] [PubMed]
- Kim, K.-R.; Owens, G. Potential for Enhanced Phytoremediation of Landfills Using Biosolids—A Review. J. Environ. Manag. 2010, 91, 791–797. [Google Scholar] [CrossRef] [Scilit] [PubMed]
- Harris, M.E.; Gardner, W.C.; Pypker, T. Influence of a One-Time Biosolids Application on Elemental and Nutrient Concentrations on Mine Tailings. Can. J. Soil. Sci. 2021, 101, 703–716. [Google Scholar] [CrossRef] [Scilit]
- Brown, S.; Henry, C. Using Biosolids for Reclamation/Remediation of Disturbed Soils. White Pap., 23 Pages, 2001. Available online: https://19january2021snapshot.epa.gov/sites/static/files/2015-05/documents/biosolidswhitepaper-uwash.pdf (accessed on 22 June 2026).
- Gardner, W.C.; Broersma, K.; Naeth, A.; Chanasyk, D.; Jobson, A. Influence of Biosolids and Fertilizer Amendments on Physical, Chemical and Microbiological Properties of Copper Mine Tailings. Can. J. Soil. Sci. 2010, 90, 571–583. [Google Scholar] [CrossRef] [Scilit]
- Ippolito, J.A.; Ducey, T.F.; Diaz, K.; Barbarick, K.A. Long-Term Biosolids Land Application Influences Soil Health. Sci. Total Environ. 2021, 791, 148344. [Google Scholar] [CrossRef] [Scilit] [PubMed]
- Boyter, M.J.; Brummer, J.E.; Leininger, W.C. Growth and Metal Accumulation of Geyer and Mountain Willow Grown in Topsoil versus Amended Mine Tailings. Water Air Soil Pollut. 2009, 198, 17–29. [Google Scholar] [CrossRef] [Scilit]
- Ploughe, L.W.; Akin-Fajiye, M.; Gagnon, A.; Gardner, W.C.; Fraser, L.H. Revegetation of Degraded Ecosystems into Grasslands Using Biosolids as an Organic Amendment: A Meta-analysis. Appl. Veg. Sci. 2021, 24, e12558. [Google Scholar] [CrossRef] [Scilit]
- Pepper, I.L.; Zerzghi, H.G.; Bengson, S.A.; Glenn, E.P. Revegetation of Copper Mine Tailings Through Land Application of Biosolids: Long-Term Monitoring. Arid. Land Res. Manag. 2013, 27, 245–256. [Google Scholar] [CrossRef] [Scilit]
- BC Ministry of Forests. Biogeoclimatic Ecosystem Classification Program. Available online: https://www.for.gov.bc.ca/hre/becweb/ (accessed on 22 June 2026).
- Chourmouzis, C.; Yanchuk, A.D.; Hamann, A.; Smets, P.; Aitken, S.N. Forest Tree Genetic Conservation Status Report 1 In Situ Conservation Status of All Indigenous British Columbia Species; Technical Report 053; Ministry of Forests and Range Forest Science Program: Columbia, UK.
- Dobb, A.; Burton, S. Rangeland Seeding Manual for British Columbia. In British Columbia Rangeland Seeding Manual; B.C. Ministry of Agriculture: Victoria, BC, Canada, 2013. Available online: https://www2.gov.bc.ca/assets/gov/farming-natural-resources-and-industry/rangelands/bc_rl_seeding_manual_web_single_150dpi0904.pdf (accessed on 22 June 2026).
- Daubenmire, R.F. Canopy Coverage Method of Vegetation Analysis. Northwest Sci. 1959, 33, 39–64. [Google Scholar]
- Singh, J.P.; Vaidya, B.P.; Goodey, N.M.; Krumins, J.A. Soil Microbial Response to Metal Contamination in a Vegetated and Urban Brownfield. J. Environ. Manag. 2019, 244, 313–319. [Google Scholar] [CrossRef] [Scilit] [PubMed]
- Hoogsteen, M.J.J.; Lantinga, E.A.; Bakker, E.J.; Groot, J.C.J.; Tittonell, P.A. Estimating Soil Organic Carbon through Loss on Ignition: Effects of Ignition Conditions and Structural Water Loss. Eur. J. Soil Sci. 2015, 66, 320–328. [Google Scholar] [CrossRef] [Scilit]
- Da Silva, Y.J.A.B.; Do Nascimento, C.W.A.; Biondi, C.M. Comparison of USEPA Digestion Methods to Heavy Metals in Soil Samples. Environ. Monit. Assess. 2014, 186, 47–53. [Google Scholar] [CrossRef] [Scilit] [PubMed]
- R Core Team. R: A Language and Environment for Statistical Computing. 2026. Available online: https://www.R-project.org/ (accessed on 22 June 2026).
- Wickham, H.; Averick, M.; Bryan, J.; Chang, W.; McGowan, L.; François, R.; Grolemund, G.; Hayes, A.; Henry, L.; Hester, J.; et al. Welcome to the Tidyverse. J. Open Source Softw. 2019, 4, 1686. [Google Scholar] [CrossRef] [Scilit]
- Oksanen, J. Vegan: Community Ecology Package. 2025. Available online: https://CRAN.R-project.org/package=vegan (accessed on 22 June 2026).
- Wobbrock, J.O.; Findlater, L.; Gergle, D.; Higgins, J.J. The Aligned Rank Transform for Nonparametric Factorial Analyses Using Only Anova Procedures. In Proceedings of the CHI Conference on Human Factors in Computing Systems (CHI ‘11), Vancouver, BC, Canada, 7–12 May 2011; pp. 143–146. [Google Scholar]
- Durner, E. Effective Analysis of Interactive Effects with Non-Normal Data Using the Aligned Rank Transform, ARTool and SAS® University Edition. Horticulturae 2019, 5, 57. [Google Scholar] [CrossRef] [Scilit]
- Lira-Noriega, A.; Soberón, J.; Navarro-Sigüenza, A.G.; Nakazawa, Y.; Peterson, A.T. Scale Dependency of Diversity Components Estimated from Primary Biodiversity Data and Distribution Maps. Divers. Distrib. 2007, 13, 185–195. [Google Scholar] [CrossRef] [Scilit]
- Mahaut, L.; Fort, F.; Violle, C.; Freschet, G.T. Multiple Facets of Diversity Effects on Plant Productivity: Species Richness, Functional Diversity, Species Identity and Intraspecific Competition. Funct. Ecol. 2020, 34, 287–298. [Google Scholar] [CrossRef] [Scilit]
- Paradis, E.; Schliep, K. Ape 5.0: An Environment for Modern Phylogenetics and Evolutionary Analyses in R. Bioinformatics 2019, 35, 526–528. [Google Scholar] [CrossRef] [Scilit] [PubMed]
- Newman, R.F.; Krzic, M.; Wallace, B.M. Differing Effects of Biosolids on Native Plants in Grasslands of Southern British Columbia. J. Environ. Qual. 2014, 43, 1672–1678. [Google Scholar] [CrossRef] [Scilit] [PubMed]
- Shrestha, R.K.; Lal, R.; Jacinthe, P.-A. Enhancing Carbon and Nitrogen Sequestration in Reclaimed Soils through Organic Amendments and Chiseling. Soil Sci. Soc. Am. J. 2009, 73, 1004–1011. [Google Scholar] [CrossRef] [Scilit]
- Li, J.; Han, G.; Wang, G.; Liu, X.; Zhang, Q.; Chen, Y.; Song, W.; Qu, W.; Chu, X.; Li, P. Imbalanced Nitrogen–Phosphorus Input Alters Soil Organic Carbon Storage and Mineralisation in a Salt Marsh. Catena 2022, 208, 105720. [Google Scholar] [CrossRef] [Scilit]
- Liao, J.; Dou, Y.; Wang, B.; Gunina, A.; Yang, Y.; An, S.; Chang, S.X. Soil Stoichiometric Imbalances Constrain Microbial-Driven C and N Dynamics in Grassland. Sci. Total Environ. 2024, 924, 171655. [Google Scholar] [CrossRef] [Scilit] [PubMed]
- Sebastià, M.; Kirwan, L.; Connolly, J. Strong Shifts in Plant Diversity and Vegetation Composition in Grassland Shortly after Climatic Change. J. Veg. Sci. 2008, 19, 299–306. [Google Scholar] [CrossRef] [Scilit]
- Harrison, E.Z.; Oakes, S.R.; Hysell, M.; Hay, A. Organic Chemicals in Sewage Sludges. Sci. Total Environ. 2006, 367, 481–497. [Google Scholar] [CrossRef] [Scilit] [PubMed]
- Nicholson, F.; Bhogal, A.; Taylor, M.; McGrath, S.; Withers, P. Long-Term Effects of Biosolids on Soil Quality and Fertility. Soil Sci. 2018, 183, 89–98. [Google Scholar] [CrossRef] [Scilit]
- Gilmour, J.T.; Cogger, C.G.; Jacobs, L.W.; Evanylo, G.K.; Sullivan, D.M. Decomposition and Plant-Available Nitrogen in Biosolids: Laboratory Studies, Field Studies, and Computer Simulation. J. Environ. Qual. 2003, 32, 1498–1507. [Google Scholar] [CrossRef] [Scilit] [PubMed]
- Bhogal, A.; Nicholson, F.A.; Chambers, B.J. Organic Carbon Additions: Effects on Soil Bio-physical and Physico-chemical Properties. Eur. J. Soil Sci. 2009, 60, 276–286. [Google Scholar] [CrossRef] [Scilit]
- Case, S.D.C.; Jensen, L.S. Nitrogen and Phosphorus Release from Organic Wastes and Suitability as Bio-Based Fertilizers in a Circular Economy. Environ. Technol. 2019, 40, 701–715. [Google Scholar] [CrossRef] [Scilit] [PubMed]
- Humphries, N.H.; Thornton, S.F.; Chen, X.; Bray, A.W.; Stewart, D.I. Response of Soil Bacterial Populations to Application of Biosolids under Short-Term Flooding. Environ. Sci. Pollut. Res. 2023, 30, 72978–72992. [Google Scholar] [CrossRef] [Scilit] [PubMed]
- Wang, Q.; Wang, S.; Feng, Z.; Huang, Y. Active Soil Organic Matter and Its Relationship with Soil Quality. Acta Ecol. Sin. 2005, 25, 513–519. [Google Scholar]
- Laekemariam, F.; Kibret, K. Explaining Soil Fertility Heterogeneity in Smallholder Farms of Southern Ethiopia. Appl. Environ. Soil Sci. 2020, 2020, 6161059. [Google Scholar] [CrossRef] [Scilit]
- Cleveland, C.C.; Liptzin, D. C:N:P Stoichiometry in Soil: Is There a “Redfield Ratio” for the Microbial Biomass? Biogeochemistry 2007, 85, 235–252. [Google Scholar] [CrossRef] [Scilit]
- Cogger, C.G.; Bary, A.I.; Kennedy, A.C.; Fortuna, A.-M. Long-Term Crop and Soil Response to Biosolids Applications in Dryland Wheat. J. Environ. Qual. 2013, 42, 1872–1880. [Google Scholar] [CrossRef] [Scilit] [PubMed]
- Blanco, J.A.; Durán, M.; Luquin, J.; San Emeterio, L.; Yeste, A.; Canals, R.M. Soil C/N Ratios Cause Opposing Effects in Forests Compared to Grasslands on Decomposition Rates and Stabilization Factors in Southern European Ecosystems. Sci. Total Environ. 2023, 888, 164118. [Google Scholar] [CrossRef] [Scilit] [PubMed]
- Lejeune, K.D.; Seastedt, T.R. Centaurea Species: The Forb That Won the West. Conserv. Biol. 2001, 15, 1568–1574. [Google Scholar] [CrossRef] [Scilit]
- Gaya Shivega, W.; Aldrich-Wolfe, L. Native Plants Fare Better against an Introduced Competitor with Native Microbes and Lower Nitrogen Availability. AoB Plants 2017, 9, plx004. [Google Scholar] [CrossRef] [Scilit] [PubMed]
- Lowe, P.N.; Lauenroth, W.K.; Burke, I.C. Effects of Nitrogen Availability on the Growth of Native Grasses Exotic Weeds. J. Range Manag. 2002, 55, 94. [Google Scholar] [CrossRef] [Scilit]
- Kumar, R.; Whelan, A.; Cannon, P.; Sheehan, M.; Reeves, L.; Antunes, E. Occurrence of Emerging Contaminants in Biosolids in Northern Queensland, Australia. Environ. Pollut. 2023, 330, 121786. [Google Scholar] [CrossRef] [Scilit] [PubMed]
- Adusei-Gyamfi, J.; Ouddane, B.; Rietveld, L.; Cornard, J.-P.; Criquet, J. Natural Organic Matter-Cations Complexation and Its Impact on Water Treatment: A Critical Review. Water Res. 2019, 160, 130–147. [Google Scholar] [CrossRef] [Scilit] [PubMed]
- Silveira, M.L.A.; Alleoni, L.R.F.; Guilherme, L.R.G. Biosolids and Heavy Metals in Soils. Sci. Agric. 2003, 60, 793–806. [Google Scholar] [CrossRef] [Scilit]
- Karna, R.R.; Luxton, T.; Bronstein, K.E.; Hoponick Redmon, J.; Scheckel, K.G. State of the Science Review: Potential for Beneficial Use of Waste by-Products for In Situ Remediation of Metal-Contaminated Soil and Sediment. Crit. Rev. Environ. Sci. Technol. 2017, 47, 65–129. [Google Scholar] [CrossRef] [Scilit] [PubMed]
- Nikolaidis, N.P.; Chheda, P. Heavy Metal Mobility in Biosolids-Amended Glaciated Soils. Water Environ. Res. 2001, 73, 80–86. [Google Scholar] [CrossRef] [Scilit] [PubMed]
- Tian, G.; Franzluebbers, A.J.; Granato, T.C.; Cox, A.E.; O’Connor, C. Stability of Soil Organic Matter under Long-Term Biosolids Application. Appl. Soil Ecol. 2013, 64, 223–227. [Google Scholar] [CrossRef] [Scilit]
- García-Orenes, F.; Guerrero, C.; Mataix-Solera, J.; Navarro-Pedreño, J.; Gómez, I.; Mataix-Beneyto, J. Factors Controlling the Aggregate Stability and Bulk Density in Two Different Degraded Soils Amended with Biosolids. Soil Tillage Res. 2005, 82, 65–76. [Google Scholar] [CrossRef] [Scilit]

Disclaimer/Publisher’s Note: The statements, opinions and data contained in all publications are solely those of the individual author(s) and contributor(s) and not of MDPI and/or the editor(s). MDPI and/or the editor(s) disclaim responsibility for any injury to people or property resulting from any ideas, methods, instructions or products referred to in the content. |
© 2026 by the authors. Licensee MDPI, Basel, Switzerland. This article is an open access article distributed under the terms and conditions of the Creative Commons Attribution (CC BY) license.