


Abstract
Sensor-based Particle Ore Sorting (POS) has gained significant acceptance as a unit process in mineral processing in recent years, particularly in the diamond, copper, tin, and tungsten sectors. The increased uptake has led to a steady increase in testwork volume since 2010. Testwork is the basis for all technical and financial evaluation of a potential business case for POS. To support the growing volume of POS testwork, this contribution develops standardized test methodologies and sampling requirements for different project stages. Our aim is to bridge the understanding and terminology between the various technical disciplines involved. This allows all stakeholders to enter the complex realm of POS with full transparency. Tests can be conducted using three different feed types: endmember samples, lithotype samples, and composite samples. Four testwork methods are presented for POS project development and optimization: Single Particle Test (SPT), Bench Scale Test (BST), Cascade Test (CT), and Process Test (PT). From the possible combinations, this results in ten POS testwork methods. Each test type serves a different purpose with regard to process effectiveness contributions and relationships to the project lot, serving specific roles during project stages from scoping to feasibility. Specific project parameters are recommended to be defined up front for future POS projects to improve clarity and interpretation of test objectives, limitations, and results.
1. Introduction and Rationale for This Paper
Sensor-Based Sorting (SBS) is an umbrella term for all physical separation processes where material properties are detected by a sensor technique and material units are physically separated by an amplified mechanical, hydraulic, or pneumatic process [1]. Sorting is a technology in mining and mineral processing that addresses mega trends such as decreasing grades and increasing effort to reduce the specific resource input per tonne of product produced [2].
Different sensors and positions in the production flow sheet make SBS broadly applicable to all segments of mineral production. Thereby, SBS becomes applicable for a variety of mineral commodities, such as ferrous metals, non-ferrous metals (including precious metals), industrial minerals, coal, and diamonds [3].
The use of sensor technology for sorting enables separation based on completely new criteria, which represent new opportunities for several industry sectors. SBS are physical separation processes that can be operated without process reagents and/or water, with significant energy-saving potentials when used to separate barren/ low-grade waste before energy- and water-intensive beneficiation processes [4,5].
There are three main types of sensor-based ore sorting processes depending on the functional principle of deployment: Particle Ore Sorting, Belt Bulk Ore Sorting, and Batch Bulk Ore Sorting.
Particle Ore Sorting (POS) has become a more recognized unit process in mineral processing. This has been driven by several industry trends, including changing requirements in obtaining a social license to operate and local public acceptance for operating a mine [6]. It is recognized that resource efficiency (land, water, energy, and mineral deposit consumption per unit output production) of a mine is a significant contributor to the social license to operate [7]. Deposition of wet mine tailings as both a potential hazard and consumer of land is driving the implementation of dry processing techniques and the preferential deposition of dewatered tailings and coarse waste [8]. Decreasing mined grades lead to an increase in specific energy per tonne of final product [9]. POS presents an opportunity to reject subeconomic material at coarse particle size from the mill feed. Therefore, it can decrease the quantity of tailings produced, optimize specific water, energy, and reagent consumption, and reduce the specific costs per tonne of product output.
Industry trends are driving POS technology development. This includes higher process effectiveness, design capacity, and availability. The increased interest has also led to a steady increase in testwork volume over the last 20 years. Testwork is a prerequisite for all technical and economic evaluations of the business case for POS.
However, despite this state-of-the-art technology’s unique value adding, there are still challenges, experienced as follows:
- POS is a coarse particle separation technology, usually applied in size ranges between 10 mm and 60 mm. Due to inherent sampling errors, large sample volumes are required to obtain statistically relevant testwork results that are able to meet stringent Total Measurement Uncertainty (MUTotal) requirements, especially for low grade and highly heterogeneous ores.
- There is only limited, smaller test or pilot POS equipment available. Laboratory testing is mostly conducted on production-scale equipment. Piloting at the site requires costly mobilization of a production-scale process island, including a full-scale POS unit and mobile loading equipment. An example is the XRT-based plant operated at the Boliden concentrator in Sweden [10].
- The pronounced sensitivity of the financial feasibility to the separation effectiveness imposes a relatively strict regime. Successful project delivery and long-term economic operation require diligent selection, development, and optimization of POS applications.
There exists a multitude of standard practices from different market players that lack explanation, which may be using different terminologies. This is confusing, especially for the less experienced stakeholders who will have difficulties assessing results obtained by a specific test in the appropriate context. This hinders due diligence and expert supervision and eventually introduces risks.
This status quo has led to the conceptualization of the present paper, which intends to summarize and structure the different testwork practices applied. We describe and further refine the many test methodologies and describe advantages and disadvantages, as well as the critical sampling requirements for different project stages. The rationale for this paper is to consolidate and further develop current industry practices. It is meant to serve as an industry standard for relevant test material sampling and testwork procedures, and as a comprehensive guideline in project development, balancing costs and efforts versus project risk. This overview paper draws on vast practical experience gained from hundreds of tests conducted over the last two decades. It further reflects constant engagement and discussions with different stakeholders in the industry about optimal procedures and requirements.
POS impacts stakeholders across many technical disciplines, creating the need for a common conceptual understanding and language/terminology. The objective for this paper is therefore also to bridge between the affected technical disciplines and to foster the necessary understanding for collaboration. Apart from technical and theoretical requirements, there are, of course, also financial implications and operational practicalities that need to be considered, but these are not the focus of this paper.
Professional risk management is an integral part of every POS project developed, and the coarse particle sizing of POS poses distinct challenges with respect to sampling variance and representativity.
A multitude of testwork methodologies have developed over time, often as best practices of the original equipment manufacturers (OEM) of a specific POS unit. Some of the knowledge and reasoning for the respective standard practice lies behind intellectual property walls and thus stays invisible to stakeholders trying to develop an understanding of how the process responds to mineralisation variability. Though undoubtedly there is deep experience and process knowledge with the vendors, this has led to a currently unsatisfying and confusing situation. An estimated 1000 to 1250 tests are undertaken annually, combined in about 500 test programs for project development conducted in the market, which are offered mainly by the OEMs. Commercial labs are also offering testwork, often in conjunction with other services of mineral laboratories. Capital markets and stakeholders evaluating asset values and project development strategies need more clarity on the procedures and what effects are within or outside the scope of a certain test program, as well as the risks involved. Accordingly, here we present a systematic overview of the major testwork methodologies available and necessary material sample requirements for POS project development, independent of specific vendors.
This paper covers the interdisciplinary approach necessary for a complete overview of relevant terminology and aspects. The following section describes the different types of SBS, before focusing on POS. The third section introduces the framework of the theoretical and practical advice that the Theory of Sampling (TOS) provides. Not least because SBS deals with relatively large particle sizes, TOS is an integral part of testwork methodologies. Section four describes the geometallurgical framework and strategies for project lot, feature definition, and heterogeneity characterization. Section five defines productivity parameters and the process island framework that POS is implemented in, linking the effectiveness contributions covered with testwork with plant performance.
Now the ground has been prepared for the definition of the test methods and test feed types in section six. The test methodologies are then described in detail in the core of the paper, section seven, before the summary and conclusions in section eight.
To support covering the interdisciplinary breadth of this paper, a glossary and list of abbreviations can be found at the end.
2. Sensor-Based Ore Sorting
SBS is a generic term for all physical separation processes in which particulate material properties are detected by a sensor system and the target material units are subsequently physically separated through an amplified mechanical, hydraulic, or pneumatic process [1]. It is the automation of the oldest mineral processing technique practiced since the Stone Age—hand sorting [11].
Contrary to all other physical separation processes, the separation criterion is decoupled from the separating force [1]. In gravity separation, for example, the probability of a particle reporting to a fraction is directly linked to its specific density, with only subordinate impacts from shape and size. Therefore, Total Process Effectiveness (TPE) of SBS, as introduced by Robben, Chieregati, and Condori [12], is the sum of the distinctively separate influences of Classification Effectiveness (CE) and Mechanical Effectiveness (ME).
CE describes how well the system classifies material relative to its true content, based on MUTotal, and assigns it to two classes according to a defined cut-grade. These classes may be described operationally as “drop” and “eject” fractions, or in terms of value as “product” (enriched) and “discard” (depleted), noting that the eject fraction, typically the smaller mass stream, may represent either depending on the application.
ME describes how effectively the physically classified material is separated into these two streams. The distinction between CE and ME arises because the classification criterion is decoupled from the physical separation force, making it useful to evaluate them independently.
While CE is the dominant factor governing TPE by defining the separation criterion, ME represents the execution of that decision and remains critical, as deficiencies in either component can negatively impact overall process performance and financial feasibility.
SBS is further separated into three types, categorized by the increment of material that can be physically separated by the process:
- Sensor-based Batch Bulk Ore Sorting;
- Sensor-based Belt Bulk Ore Sorting;
- Sensor-based Particle Ore Sorting.
The term bulk ore sorting includes batch ore sorting, which is employed on discontinuous haulage, as well as belt ore sorting, which is deployed on equipment of continuous haulage. Table 1 shows a comparison between these three principal types.
Table 1.
Comparison of types of Sensor-Based Sorting: Batch Bulk Ore Sorting, Belt Bulk Ore Sorting, Particle Ore Sorting.
2.1. Sensor-Based Batch Bulk Ore Sorting
Batch Bulk Ore Sorting addresses discontinuously moving batches of material, such as the content of a shovel or the load of a truck. With the emergence of industrial sensors in the 1980s, different sensor types have been applied. These include passive radiometric (RM), X-ray fluorescence (XRF), laser-induced fluorescence (LIF), and, recently, magnetic resonance (MR) sensor systems.
Measurement can be conducted as an additional step in an excavator’s, loader’s, or truck’s production cycle at a measurement station or conducted simultaneously within the cycle while shoveling or hauling. Where additional steps are required, cycle times are increased, while systems with real-time measurements do not significantly impact the productivity, but each machine requires its own measurement equipment.
Physical separation is achieved by loading measured batches in shovels to different trucks or other destinations, such as unloading a load-haul-dumper (LHD) into ore and waste passes underground (or a wheel loader to stockpiles of different qualities). When the batch is a truck load, physical separation is achieved by truck dispatch to different destinations for unloading [13].
Only XRF has been developed to be able to induce a significant reduction in MUTotal to an acceptable a priori level (please refer to Section 3 for an introduction to the framework of TOS and MUTotal). This includes increasing the number of measurements per batch to increase the ratio of measured surface to volume. Due to the dimensions and scale of the batch analyzed, these systems are usually not in compliance with the Fundamental Sampling Principle, the principle of equiprobability (see also Section 3.1). Only the surface of a three-dimensional volume is measured, and thus not all components of the lot, in this case the batch, have the same probability of contributing to the measurement. Strategies to counteract this shortcoming have been to apply mixing before measurement and to measure material during dynamic flow, so as to increase the probability that the measurement correlates with the true content of the batch. The interested industry companies are still in an early adopters phase with respect to assessing the minimum necessary total measurement uncertainty MUTotal to add economic value and how value materializes in different mining applications [13].
2.2. Sensor-Based Belt Bulk Ore Sorting
Sensor-based Belt Bulk Ore Sorting has been practiced for decades in the cement, coal, and iron ore sectors. Online analysers have been applied to measure run-of-mine material to dispatch, stack, and reclaim in a controlled manner, to blend and to stabilize cement kiln feed, smelter feed, or material shipments to customer specifications. Online analysers are in the sights of mining companies, where they are being further developed and promise acceptable measurement of base metal grades. A prominent example is the development of belt-based applications in the CRC ORE initiatives, aspects of which were developed further into the FutureSmartMiningTM program of Anglo American [14,15].
In Belt Bulk Ore Sorting, the online analyser measures a process flow that is usually moved on a conveyor belt. After the measurement is complete, a decision based on the measured properties of the material, which has passed the measurement station during the integration time, can be made and used for dispatching into various flow directions. In blending operations, these can be multiple dispatch directions, whereas for Belt Bulk Ore Sorting operations, material is predominantly directed in the two cardinal directions—ore and waste. Due to the scalability of this approach at relatively low capital investment, it can be applied to projects that mine tens of millions of tonnes per year [16].
With the analyser arrangement on the process flow, this complies with the general sampling principle of Lot Dimensionality Transformation (LDT), which stipulates the transformation of 3-D lots into 1-D lots as this eases physical access to the whole lot and thereby comes in full compliance with Fundamental Sampling Error (FSE; please refer to the introduction of the Theory of Sampling in Section 3) [17,18].
Detection technologies used include prompt-gamma-neutron-activation-analysis (PGNAA), near-infrared-spectrometry (NIR), X-ray fluorescence (XRF), magnetic resonance (MR), and laser-induced breakdown spectroscopy (LIBS). While LIBS, NIR, and XRF are surface detection principles, MR and PGNAA penetrate the full thickness of the target material, achieving the greatest theoretical compliance with the FSE (with some geometric distortions). The MUTotal of a specific analyser to one or multiple analytes is application-specific, due to the natural heterogeneity of ores and minerals, and must therefore be evaluated.
Physical separation is often achieved by applying fast-moving flaps [19]. Flaps can be designed with screen openings so that the underflow fraction can always report to one stream, as grade can preferentially report to finer size fractions [20]. On rare occasions, with a low relative discharge mass proportion, compressed air has been used.
2.3. Sensor-Based Particle Ore Sorting
The process of sensor-based Particle Ore Sorting (POS) detects single particles and separates them with compressed air or fast-moving mechanical flaps. It is a rather complex mineral processing technique with many operating variables (many degrees of freedom). In some segments of mineral production, such as diamonds and various industrial minerals, this technology is used for producing (close to) final products. In other segments, it is applied relatively early in the production flowsheet with the aim of separating sub-economic waste from valuable concentrator feeds.
Figure 1 shows the working principle of belt-type (left) and chute-type (right) sensor-based POS equipment, which differ in the mode of transport through the sensor imaging (detection) zone. Both machine types are typically fed by a vibratory feeder, which distributes the material across the full working width and feeds particles isolated in a monolayer into the equipment. The image acquired in the detection area is processed in real-time, and single particles are classified according to preset configurations. For adjusting the material separation cut-grade/cut-point, the multidimensional calibration is reduced to a single parameter called the Sorting Index. It is a single dimensionless parameter to which the multivariate image/signal information is reduced. A strong correlation of Sorting Index to financial feature(s) means a technically reliable and effective separation, as well as flexibility for setting different cut-grades of the POS separation. The particle classification then controls the physical separation step. Here, targeted air impulses from an array of singularly controlled air valves deflect single particles from the main falling stream (drop) across a splitter plate (eject).
Figure 1.
Side-view working principle of belt-type (left) and chute-type (right) sensor-based Particle Ore Sorting, dashed orange lines: field of view of detection; dashed grey lines: signal transfer to processing unit; dashed blue lines: diverted direction of eject fraction; courtesy of the Saskatchewan Research Council.
For understanding the characteristics of the process, it is important to not only focus on the equipment or POS process itself, but also on the supporting elements which together build what here is called the sensor-based POS ‘process island’. A process island includes POS and the necessary feed preparation with screening and potentially crushing, as well as materials handling and supporting infrastructure. Figure 2 shows a simplified process flowsheet for a POS process island. A feed stream, typically a run-of-mine ore, is crushed to −60 mm then screened at 20 mm to produce the particle size ranges applicable to sensor-based POS.
Figure 2.
Simplified typical process flow sheet of a POS process island, modified after Robben et al. [12].
POS feed sizing is executed using vibrating screens. The goal of this process is to separate suitable particle sizes from the crusher product stream (usually in the range of 10 mm to 60 mm). Based on engineering constraints, a maximum to minimum particle size ratio (ratio of top particle size d95 to bottom particle size d5) of approximately 3:1, maximum 5:1, is required. Elaborations on selecting the right particle size range for a desired process island are subject to many parameters, such as the intended sorting equipment, plant capacity, and economic drivers.
Recent technological developments in POS applications fall within three main fields:
- -
- Improved imaging sensors;
- -
- Increased equipment availability;
- -
- Increased capacity;
Foremost are improvements to the imaging sensors. The principal technologies X-ray transmission (XRT), color, near-to-shortwave-infrared spectrometry (NIR-SWIR), X-ray fluorescence (XRF), electromagnetic induction (EM), and laser diffraction (LASER) have been used in mining and adjacent bulk industries like food and recycling for almost two decades. Continuous improvements are obtained in spectral resolution, spatial resolution, signal-to-noise ratio, long-term operational stability, and specific investment and operating costs. Imaging sensors are the fundamental contribution to the TPE.
The second string of development is the increase in equipment availability by improving the mean time between failure of wear parts and the availability of spare parts. Ease and ergonomics of maintenance are also important factors. However, plant design is still the main contributor to the overall equipment effectiveness of a sorting plant.
The third development is the increase in sorting throughput capacity. An increase in capacity is achieved by smoothing out mass flow and distributing it evenly across the working width of the equipment. The Image Processing Effectiveness (IPE) of the software system plays a further role in enabling a higher number of particles to be processed and the segmentation of particle images that are touching or overlapping on the recorded image.
Detailed process flow diagrams of sorting islands in different mineral applications are provided in the literature; for example, Rutledge et al. [21] describe a POS process island with nine XRT sorting machines for flint removal from phosphate ore in three parallel particle size ranges (9 to 100 mm). Robben et al. [22] describe four XRT sorting machines in parallel size ranges for treating marginal tin ore at Mina San Rafael in Peru. An image of the process island at Mina San Rafael is shown in Figure 3. In Austria, two XRT units, operating in parallel size ranges, are applied to remove low-grade waste from run-of-mine tungsten ore [23]. An example of a single containerized XRT machine for the upgrading of gold ore at the Kensington gold mine is operated in one particle size range [24].
Figure 3.
Particle Ore Sorting process island for 3.400 t/d production, including crushing, screening, and Particle Ore Sorting at the San Rafael tin mine, Peru [21].
3. Sampling Framework
3.1. Theory of Sampling
TOS is the world’s only necessary and sufficient framework of Governing Principles, Sampling Unit Operations, and Sampling Error Management rules together with normative practices and skills needed to overcome adverse effects of material heterogeneity and non-representative sampling procedures.
Many decisions in industry, technology, and society are based upon data (analytical, monitoring, etc.), which are derived from sampling. This applies to both decisions on POS investments as well as on process optimization of an existing POS process island.
Data representing stationary or flowing heterogeneous materials are requested by different stakeholders and with a multitude of objectives. Stakeholders state acceptable MUTotal thresholds of the requested data and are therefore obliged to make available the necessary resources for appropriate sampling.
Sampling aims at extracting a small mass from a larger entity (stationary or dynamic), called the lot. The aim is to analyze and derive data about the composition and/or other properties of a sample that shall represent the original lot. The TOS offers a theoretical background and practical advice to ensure that the extracted sample represents the significant features of the original lot in a defensible way [25,26].
The main general principle, the Fundamental Sampling Principle, stipulates that all potential lot components must have the same probability of being extracted and aggregated as the composite sample—principle of equiprobability.
All natural materials are heterogeneous, and there will always be uncertainty in the data generated about them. The MUTotal or Total Measurement Error contains both the Sampling Uncertainty (MUSampling) and the Analytical Uncertainty (MUAnalysis) components, with the Sampling Uncertainty usually dominating. In sensor-based estimation, MUTotal also comprises the uncertainty introduced by sensing and the uncertainty introduced by signal processing.
TOS offers ample theoretical and practical advice [25,26] on how to evaluate the material heterogeneity and how to minimize Incorrect Sampling Errors (Delimitation, Extraction, Preparation, and Weighting Errors; DE, EE, PE, and WE) and Correct Sampling Errors (Fundamental and Grouping and Segregation Errors; FSE and GSE), which sum up to the Total Sampling Error (TSE).
TOS distinguishes lot geometries according to the dimensions that must be covered by correct increment extraction. This defines the concept of ‘lot dimensionality’, an attribute that is independent of the lot scale. Lot dimensionality is a characterization to help understand and optimize sample extraction from any lot at any sampling stage. Thus, there are four main lot types: 0-, 1-, 2-, and 3-dimensional lots (0-D, 1-D, 2-D, and 3-D lots). Lots can also be classified by subtracting the dimensions of the lot that are fully ‘covered’ by the salient sampling extraction tool in question. Thus, the higher the number of dimensions covered in a specific sampling operation, the easier it is to reduce TSE. By Lot Dimensionality Transformation, stationary 0-D, 2-D, and 3-D lots can advantageously be transformed into dynamic 1-D lots, enabling optimal practical sampling [27].
Sampling Error Management determines the priorities and tools for all sampling procedures in the following order:
- Elimination of Incorrect Sampling Errors (unbiased sampling);
- Minimization of the remaining Correct Sampling Errors;
- Application of the FSE (‘Gy’s formula’), which requires the complete elimination of all Incorrect Sampling Errors;
- Minimization of Process Sampling Errors.
All Incorrect Sampling Errors specified by TOS must be mitigated by correct sampling practices [25,26,27]. If not properly eliminated, Incorrect Sampling Errors are responsible for an inconstant sampling bias, for which no correction is possible (statistical or otherwise). Elimination of all ISE’s is always the first item on any sampling agenda before minimisation of the CSEs shall be effectuated.
Correct Sampling Errors depend on lot heterogeneity. The two errors comprise the inherent interparticle heterogeneity (FSE) and the always-present spatial segregation of different components (GSE). It must be noted that the FSE is the irreducible minimum of sampling errors, being the only error that can be estimated before performing the sampling [25].
The FSE can be expressed as per the modified equation proposed by François-Bongarçon [28], where IHL represents the Intrinsic Heterogeneity of the Lot, with Ms being the mass of the sample, ML the mass of the original lot, d the top particle size of the sample, and K and alpha material-specific constants. Please also see Section 4.4 on Heterogeneity Testing on how to derive these.
Because of the necessary minimisation of the Fundamental Sampling Error, it is possible to understand the criticality of primary sampling and subsampling stages in POS project development due to the relatively coarse particle size. This is relevant especially for mineralisation with low pay-element concentrations, such as gold [29].
The person fulfilling the role of the Responsible Sampling Manager is mandated to report the Sampling Quality Objective (SQO). The relevant procedure for estimation of the total sampling + analysis Measurement Uncertainty, MUTotal, for stationary lots is the Replication Experiment (RE), and for sampling of dynamic lots, Variographic Characterization [27].
3.2. Sampling for POS Process Testwork and Design
The task of the personnel involved in sorting project development, for example, geologists or metallurgists, is to minimize MUTotal to an acceptable level (Data Quality Objectives) and to increase the probability of financial success of the project.
Obtaining samples for the POS testwork is challenging due to the large particle sizes. This very often results in large (to very large) sample masses necessary to bring the Correct Sampling Errors to acceptable levels, especially for lower-grade base and precious metal ore applications.
Large particle size and large sample masses impose challenges on the ergonomics, methods, and procedures of sampling and POS testwork. It is of high importance that all bias-generating Incorrect Sampling Errors are eliminated. Any occurring bias, if even detected, cannot be corrected for (statistically or otherwise).
Unavoidable variance originating from the Correct Sampling Errors (FSE and GSE) shall not be suppressed or neglected, as it is an important indicator of associated project risk (please note in this context the cumulative nature of the Cascade Test, Section 7.4).
The practicalities impose constraints on sampling, and the involved professionals must find dedicated solutions for each case. It is important to underline the importance of sufficient sample sizes for reliable project development. Investing in the costs for obtaining correct primary sample masses, which result in a MUTotal acceptable for the respective project development phase, is a strict necessity.
3.3. POS Process Sampling
The most critical fraction is the depleted sorting fraction (usually waste), which has the lowest grade and/or the coarsest particle sizing. This is further aggravated by POS being a physical separation process. This means, given a high CE, that medium- and high-grade particles have a similar chance of being misplaced. There is, therefore, a chance of high-grade particles being misplaced due to ME; a “nuggety” case for sampling will require specialized protocols [12,29].
A recent advance in gold assay is the PhotonAssay technique [30]. PhotonAssay is a non-destructive method that places crushed (or pulverized) material into circa 500 g capacity jars. Multiple jars can be assayed if required, allowing many kilograms to be assayed. Novo Resources Corp. applied PhotonAssay to determine gold content in POS testwork concentrates and waste samples in a coarse gold mineralisation. The method also allows individual fragments to be assayed as they can be placed in a jar and backfilled with barren sand to ensure effective fill. As the method is non-destructive, sample material can be retained for additional testwork as required.
4. Geometallurgical Framework
4.1. Geometallurgy
Geometallurgy is a discipline that integrates geology, mining/geotechnical engineering, minerals engineering/metallurgy, mineral economics, and geoenvironmental derived parameters to maximize project economic value, reduce risk, build resilience, and demonstrate good management of the resource/reserve [31,32]. Resilience relates to the capability of a mine operation to respond and recover from a disruptive event. Geometallurgy allows such an event to be forecast and managed during planning. It may, for example, require a flexible process plant, engineered extra capacity, or a blending strategy. The defining outputs from geometallurgy are 3D spatial (e.g., visualization of drillholes, sample locations, domain boundaries, etc.) and block (e.g., interpolated parameters) models, where attributes from core logging, mineralogical/textural determination, and testwork serve to resolve grade, process parameters, and rock mass variability.
POS is a probabilistic process, and several factors underline the necessity to set it into a geometallurgical framework. Importantly, pay-element or financial features, such as metal grade, are often not directly linked to the actual separation criterion used (sensor signal). A disruptive event for an SBS operation may be the change in correlations or texture within the ore feed. The latter being unnoticeable when only looking at the core interval or block model grades. Elemental and mineral associations, texture, and mineralogical context of the pay-element grade within a particle are of even more importance than the pure pay-element grade itself. SBS is often further applied for waste rejection stages in the crushing section. The financial feasibility of those operations is often very sensitive to the pay-element recovery, or more accurately, to the waste grade of the rejected waste stream. This means that a stable and low waste grade below the specific cut-off is of critical importance for project success [3]. Ensuring that this is achieved for all variations in future ore feed to a POS process island is self-evident; however, it is often neglected.
Even orebodies considered to be ‘regular’ show a significant amount of heterogeneity at the scale of POS (particle sizing roughly 10–60 mm). It is impossible to cover the full variation in a deposit with stratified or random samples. Therefore, we advise selecting relevant pay-element financial and technical features, and testing comprehensively across this feature space, where principally each feature becomes the dimension of a high-dimensional mathematical space which can be sampled, for example, with geometallurgical software [33].
Experience shows that POS changes the characteristics of the resulting product fraction in comparison to the unsorted feed, not only in terms of pay-element grade, but also particle size distribution. An increase in feed grade to downstream processes is likely to increase the recovery therein by itself. In addition to this, preferential recovery of coarser ore minerals by the POS process island often leads to better flotation characteristics in terms of recovery, as coarser mineralization is easier to liberate and float (improved recovery and kinetics). For any kind of POS test method, the output fractions can be used for further metallurgical testing [32,34]. It is strongly recommended to integrate POS testwork into the larger context of metallurgical testing to evaluate and reveal the often-positive downstream effects.
The specific nature of an ore determines the heterogeneity that can be exploited through sorting. The heterogeneity of interest for physical separation is the underlying liberation after particle size reduction and screening, suitable for the process. Accordingly, we propose to describe heterogeneity as grade frequency distributions at given particle size classes. To differentiate important information from data, which is not of interest within the context of POS project development, we propose to take the following steps, guided by geometallurgical considerations: Definition of the Project Lot, Definition of the Principal Financial and Technical Features, and Heterogeneity Characterization.
4.2. Definition of the Project Lot
It is important to differentiate the limits of the scope, and within the context of the TOS, the lot is defined as the material in question to be sampled (also called the Focus Case [33]). This means defining the physical dimensional limits of the target, which will be subjected to POS during the project lifetime. This may be the volume of a certain stockpile, or it could be a section of the mine plan. It may even be outside the current reserve/mine plan in the case that resources are turned into reserves by changing the cost profile of a mining asset with the application of POS. In situ ore to be tested should include different proportions of planned and unplanned dilution, representing potential run-of-mine production compositions.
Prominent examples are marginal waste or low-grade stockpiles, common targets for POS installations. Refining the definition of the lot as a project progresses makes sure that the project’s feasibility relates back to the full volume of the lot with which the primary sampling and testwork must comply.
4.3. Definition of the Principal Financial and Technical Features
Financial features are the economic elements of interest. These characteristics are identified and prioritized as they determine the economic value generated by the separation process and thus drive the business case. The definition of financial metrics dominates in a commercial operation. It is primarily related to the grade of the pay-element(s) present, an equivalent grade aggregated from multiple elements, or a calculated net smelter return (NSR). Other aspects, such as concentrator recovery and the presence of deleterious or penalty elements, are also important financial features. Such features are not necessarily detectable with a POS sensor system. A prominent example is gold, where proxies correlating to the presence (or absence) of gold (e.g., pyrite) are detected and applied for particle classification into ore and waste [4,24,35].
Elements or minerals that, if present, have a significant influence on the POS sensor measurement, i.e., separation process in general, are called technical features. Other technical features could include elements or minerals that are of importance for process performance further downstream, and by definition, may overlap with financial features. Texture is a significant technical feature as it has a major influence on the Classification Effectiveness of a POS imaging system. Technical features may be correlated with financial features but could also mark the absence of valuable components. An approach applying the theory of sets of categorical features has proven a helpful approach to address a complex calibration challenge [12].
In the context of POS, features are usually quantitative characteristics and include rational numbers as grades (i.e., elemental or mineralogical concentrations). Important categorical features often used to define the cut-off grade of a mining operation are ore and waste. Other important categorical features are lithology and domain, which are usually mine-specific.
Categorical features are a good start for characterizing a lot, a mineralization type, or for selecting appropriate sub-lots to divide a complex project into more manageable parts. In addition, to define key financial features and technical features, it is important to assign the concentration ranges expected during operation [36].
4.4. Heterogeneity Characterization
All mined geological materials are heterogeneous at varying scales when considering a range of characteristics, such as mineralogy, texture, metal grade, density, hardness, and so on. Accordingly, for all POS projects, it is important to consider this heterogeneity in the context of designing a program that will yield useful and actionable results. Granulochemical analysis and heterogeneity analysis deliver valuable information about the nature and composition of a project lot or its comminuted derivatives.
Based on that, certain size fractions of ore components may be significant for process design, final product quality, or similar. For example, a specific interval in a feature space may show extraordinary behavior on POS and will need to be studied in isolation.
Properly defining the domains or relevant sub-lots will have cascading effects on testwork programs and the interpretation of results. It separates and untangles complex heterogeneity and process behavior challenges into more manageable parts. This falls directly within the field of geometallurgy.
Heterogeneity characterization can be conducted using engineered solutions to specific project cases and may draw information from various sources, including:
- Granulochemical Analysis;
- Heterogeneity Testing for Sampling Calibration;
- Heterogeneity Testing for Physical Separation.
These methods interlink with each other, and synergies in ore characterization should be used whenever possible for POS project development. For example, heterogeneity analysis in the context of physical separation (i.e., liberation analysis) has synergies with heterogeneity testing in the context of sampling. Other forms of characterization can also provide insight into heterogeneity at varying scales, such as estimations on external and internal mine dilution, concentrator reporting, and metal reconciliation efforts. An integrated approach is suggested, which delivers valuable output for both disciplines as described by Robben et al. [12], where data derived in POS testwork is applied for sampling calibration (derivation of the constants K and α), and where testwork is carried out on sample masses with determined and acceptable MUTotal.
4.4.1. Granulo-Chemical Analysis
The process of POS is applied to a specific particle size range. Understanding the particle size distribution and composition of size fractions is fundamental for selecting appropriate size ranges for POS. Flowsheet design and the option of concentration with screening are enabled by granulo-chemical characterization (grade-by-size deportment). It is therefore an integral part of heterogeneity characterization. Table 2 shows the example of a granulo-chemical distribution of a secondary-crushed tin ore.
Table 2.
Granulo-chemical analysis of an exemplary tin ore secondary crusher product [12].
Size reduction processes like blasting and crushing can be applied to optimize the selective breakage of specific components. Sizing for POS is the only necessary feed preparation, thereby becoming an influential beneficiation process. Characterization and exploitation of granulo-chemical distribution is not exclusively linked to POS but can simply be exploited by the application of screening [20].
4.4.2. Heterogeneity Testing for Sampling
Heterogeneity Testing (HT) in the context of sampling is what Chieregati et al. [19] call the optimal approach, “sampling for sampling” or “sampling calibration”. The aim of heterogeneity testing is to derive the constants K and α in Gy’s original formula for estimating the FSE (see Equation (1)).
Heterogeneity tests are critical for optimizing sampling protocols to contribute to a variogram with a low to medium nugget effect (<50%) so that estimation variances are minimized [28,29,37]. To achieve lower nugget variances, larger primary sample masses may be required, and subsequent sample splitting must be optimized with regard to the FSE [37]. Such optimization may be difficult at low grades and, for example, in the presence of coarse gold [38].
The derivation of K and α allows for the estimation of the variance originating from one of the two Correct Sampling Errors, the FSE only. As this is the theoretical minimum, it presents a solid baseline determination for estimating necessary sample masses at various particle sizes.
Experimental determination of K and α helps define the size of the lot required for robust sampling. The values also indicate how the intrinsic heterogeneity of the lot (IHL) for a given element varies with particle size, including across the range suitable for POS.
Generally, higher K and α values indicate a higher Constitutional Heterogeneity (CH). Mazhary, Klein, and Bamber [39,40] explored the use of Constitutional Heterogeneity (CH) and Distributional Heterogeneity (DH) as proxies for an ore being suitable for POS. They showed that higher CH values are indicative of better amenability to POS on a rock-by-rock basis but cautioned that CH and sortability are affected by numerous parameters. Notably, this included particle size, analytes considered, liberation characteristics, sorting use case, and the relationships between parameters of interest (the technical and financial features defined in this paper) to sensor responses.
IHL does not specifically describe the suitability of a particular mineralized body to POS as it reduces the grade-frequency distribution of single particles (see Section 4.4.3) to a value according to the following Equation (2). IHL of a material, as per the original definition, can also be expressed as the weighted variance of each particle, where is the average concentration of the lot, is the mass of the lot, ai is the concentration of the particle, Mi is the mass of the particle, and i =1, 2, … N, the total number of particles.
The HT data in Chieregati et al. [37] can be consolidated (Figure 4) as a series of modeled lines. The parameter K affects the position of the line along the y-axis, while α dictates the slope of the line. A flatter slope indicates that variance does not change substantially with decreases in particle size and that mineralization is fairly well distributed even at small grain sizes (i.e., disseminated). A steeper slope indicates that variance decreases more notably as particle size decreases.
Figure 4.
All Heterogeneity Test plots from Chieregati et al. [37] consolidated, with labels for Mine 5 (K = 11.49, α = 3.10), Mine 6 (K = 210.12, α = 0.41), and Mine 9 (K = 23.31, α = 1.65).
In Figure 4, we see that the Au system represented by Mine 6 (ROM grade of 0.7 g/t Au) shows the highest K values and a low α (flat slope), suggesting that this ore deposit could be amenable to POS. In contrast, the high-grade gold system (Mine 9) shows a moderate K but higher α. The Nb system (Mine 5) shows lower K than the gold system, but considerably higher α, suggesting that it might be a suitable candidate for POS.
In summary, we can conclude that IHL does not specifically describe the suitability of a particular mineralized body, similar to the very informative grade-frequency distribution. However, it is an important input for informed decisions on selecting appropriate sample sizes. Where the constants K and α are available, they can be used as a further indication of the amenability of the mineralization to POS, but no conclusions can be drawn solely on them.
In reverse, information obtained with a Single Particle Test (see Section 7.2) can be processed for heterogeneity analysis to obtain the constants K and α. Please note that the disproportional selection of particles to their occurrence in the lot needs to be corrected for by the proportion of occurrence in the project lot.
Object statistics from operating POS machines have also been successfully used to derive the constants K and α for the feed, product, and waste fractions [12].
4.4.3. Heterogeneity Testing for Physical Separation by Particle Ore Sorting
The intrinsic heterogeneity, also called liberation, of a particulate material describes the theoretical maximum possible separation result that can be achieved by physical separation. It has also been defined as the intrinsic particle properties [41]. Only particle size reduction alters the heterogeneity and allows for further improving the theoretical maximum possible physical separation results. In that sense, intrinsic heterogeneity describes the maximum possible liberation that can be exploited by a physical separation process on a particulate level. Understanding this underlying fundamental condition allows for benchmarking and optimization of actual physical process results achieved.
Heterogeneity testing with regard to physical separation processes results in frequency distributions of the defined technical and financial features. An important and well-known description of a feature is the grade-frequency distribution (GFD), which must be estimated on particle-by-particle level for the particle size range relevant for the physical separation process.
The sorter feed heterogeneity (SFH) is introduced as a term to describe the intrinsic heterogeneity of the feed material to a POS process. The SFH for a tin POS project is shown in Figure 5. It is expressed as the GFD of the financial feature tin grade on a particle-by-particle level. This GFD reveals that in the 14 mm to 22 mm fraction, we have the lowest amount of medium grades between 0.5% Sn and 5% Sn. In comparison to the other particle size fractions, the 14 mm to 22 mm fraction shows the highest proportion of liberated high-grade particles > 10% Sn. We therefore have liberation behavior, which is also visible by the fact that we have about 85% of particles in the two smaller size fractions which do not contain any tin (<0.05% Sn) in comparison to 60% of the mass in the +32 mm fraction. The heterogeneity analysis, therefore, shows that we can reject significant amounts of sub-economic waste, and it shows something about the liberation characteristics which may direct crushing activities to reduce the particle size of the +32 mm size fraction.
Figure 5.
Grade-frequency distribution analysis in fractionated/screened fractions, modified after Moslemiyekan et al. [42].
The project-relevant heterogeneity as GFD is transferred, for example, the particle size fraction 22–32 mm, into an adapted Mayer II diagram (Figure 6). The Mayer II diagram was originally introduced for describing liberation as a cumulative distribution function [42]. It shows the underlying liberation function enabling physical separation at 100% TPE. For the specific project, 0.1% Sn in the rejected waste fraction is marked as the process goal. The ore heterogeneity would allow rejection of 85% waste (i.e., 15% product yield), upgrading the feed from 0.6% Sn to about 3.1% Sn in the product under (unrealistic) ideal conditions [12].
Figure 6.
Heterogeneity-based liberation function for the 22–32 mm fraction of secondary crusher product, expressed as a modified Mayer-II diagram, with the product mass yield on the horizontal axis, with Sn-recovery on the primary vertical axis, and product and waste fraction grades on the secondary vertical axis, yellow dashed lines mark operating point at target waste grade of 0.1% Sn; modified after Moslemiyekan et al. [42].
5. Productivity Parameters and the Process Island Framework
5.1. Productivity and Overall Equipment Effectiveness
Testwork is critically important as it delivers the financial return on investment based on the metallurgical design performance, which is expected from an operating system’s Overall Equipment Effectiveness (OEE). Establishing achievable and realistic benchmarks with appropriate, fit-for-purpose testwork across the project lot is important for establishing reliable project expectations and risk management.
There are three main effective contributions to the OEE, which characterize the deviation of the actual performance of a system versus its theoretical maximum: Availability (A), Performance (P), and Quality (Q) [43]. For mineral processing systems, we here adopt the concept with its three main effectiveness contribution factors as follows.
Availability refers to the measure of time that a POS process island is in a functioning condition and can be used for its intended purpose. It is a key metric in maintenance and operational efficiency, indicating the proportion of total time that a process island is operational and not under repair.
Performance is related to the mass flow management and the capacity of the process island. If the system operates at full nominal design capacity for all the available time, the Performance effectiveness contribution is 100%. If not, losses are proportionally deducted from the actual capacity versus the design capacity. If the design capacity is surpassed, this factor can actually be greater than 100%. Availability and performance are mainly functions of plant or process island design.
Quality refers to the metallurgical performance, or effectiveness, of the process island. Here, the benchmark is the metallurgical performance (i.e., the separation result) established with testwork. If the actual effectiveness is equal to the process design criterion, the testwork performance, this factor is 100%. Quality Losses are again deducted in proportion to the actual separation result versus the testwork result; for example, as product recovery at a fixed yield.
Quality Loss, Performance Loss, and Availability Loss are the three big losses in defining the Overall Equipment Effectiveness, a key performance indicator used in manufacturing to measure and optimize productivity [44]. They have been further subdivided into the so-called six big losses for analysis and improving the productivity of manufacturing systems.
Table 3 introduces a methodological framework for applying the concept of OEE by transferring the parameters from manufacturing into the context of mineral processing. Both Performance Loss and Quality Loss are (negative) deviations from the benchmark derived from testwork. It must be noted that there are interdependencies between the Availability Losses, Performance Losses, and Quality Losses. A poorly maintained piece of equipment will most likely suffer from Quality Losses as well as from reduced operating time. Similarly, equipment operated to minimize Performance Loss with increasing feed capacity will produce Quality Losses as well.
Table 3.
Overall Equipment Availability and Six Big Losses in Manufacturing [44,45], and Mineral Processing with emphasis on the criticality of testwork.
5.2. Process Island Separation Result
The POS Process Island Separation Result in production or during testwork combines the characteristics of the feed material with the effectiveness of the process. We here use the term effectiveness contribution as the actual separation results versus the theoretically achievable maximum. The theoretical maximum is determined by the material heterogeneity encountered. As described by Robben et al. [12], the effectiveness of a process is a factor between 0% and 100%, which is multiplied by the theoretically achievable recovery to obtain the practically achieved recovery at a specific yield. The process effectiveness contributions have been introduced in detail for all defined sub-processes of POS [2].
Figure 7 shows an overview of all contributions to the process island separation results. The effect of granulo-chemical distribution (preferential breakage) defines what material is reported to the sorter feed stream and how much is bypassing the system and is usually recombined with the product stream. TPE of POS, multiplied by the SFH of the POS feed, combines into the POS process result. SFH is the underlying prerequisite for the amenability of POS. Importantly, the SFH as well as the granulo-chemical distribution are both results of previous size reduction processes and can thus be influenced.
Figure 7.
Overview of process effectiveness, granulochemical and sorter feed heterogeneity contributions to a POS process island, modified after Robben et al. [12].
TPE contributions are divided into two main groups, which are Mechanical Effectiveness (ME) and Classification Effectiveness (CE) contributions.
CE is the determining differentiation process, describing the probability of correct particle classification. It is a product of the Detection Effectiveness of the sensing system supplying the raw data and the Image Processing Effectiveness of the image, data processing pipeline, and the “discrimination potential” of the defined “classes” based on the sensing system(s).
ME is the physical execution. It describes the physical ability of the system to properly apply acceleration forces to the appropriate particles so that they end up in the correct output, and is impacted by design choices such as air pressure, valve response time, and nozzle placements.
While CE is the dominating factor for TPE as it defines the separation criterion, ME is sensitive to the parametrisation of the physical separation system and operational care and maintenance procedures. Both combined effectiveness contributions produce the separation result, and both have the power to negatively impact the TPE (i.e., technical feasibility) needed for financial feasibility.
ME contributions are up-scalable and transferable between applications to a certain degree, while CE is not. They are more a result of feed capacity and ejected mass than of the processed ore.
TPE is of a probabilistic nature, and the POS process result is highly dependent on the specific characteristics, the heterogeneity, and the variability of the feed. Both CE and ME can be further subdivided into more granular effectiveness contributions, and more information on these can be found in the literature [2].
6. Principal Test Methods and Feed Types
6.1. Testwork Strategy and Project Study Phases
The definition of the testwork strategy includes appropriate heterogeneity analysis, reliable sampling, and testing programs for the project under investigation. Five criteria govern the design of any POS sampling and testwork strategy:
- The first is heterogeneity of the general ore type or commodity in question, with emphasis on liberation characteristics. Industrial minerals applications, usually require a different and less extensive project approach than base metal ores, with precious metal POS projects often being the most complex.
- Second is the heterogeneity of the specific ore in question. The presence of significant intrinsic heterogeneity in particle sizes relevant for POS is the necessary precondition for physical separation at this scale. Heterogeneity is typically the limiting factor in a potential POS implementation. In circumstances where there is sufficient heterogeneity, there is a high probability of technical success in the application of POS.A structured assessment of heterogeneity is therefore an important aspect in assessing the amenability of POS. A Heterogeneity Test from sampling can be a first indicator, but only the grade-frequency distribution will be sufficient to draw definitive conclusions.
- Third is the accessibility of the project lot for sampling. When the ore is accessible from open pit or underground faces of an operating mine or exploration trenches, sample masses of the relevant size (tonnes scale) can be obtained cost-effectively. Where underground development is necessary for obtaining bulk samples, significantly higher budgets may be required. When the project lot is not accessible for bulk sampling, samples may be obtained from drill core, which are then generally restricted to ½ or ¼ core composites, ideally from larger diameter drill core.
- Fourth is the underlying business case. A project, which has a high probability of technical and financial success, and a low project failure risk, respectively, may accept a higher MUTotal or fast-track certain project phases to achieve earlier implementation.
- Fifth is the stage of the POS project. It is acceptable that the precision of the results is lower in an earlier phase of a project in comparison to a feasibility stage. Figure 8 shows an overview of different test types and in which project development phases are typically applied.Figure 8. Overview of principal test methods and generalized progression of study phases towards Process Tests with Lithotypes and Composite Feed Types to support Feasibility Studies.
6.2. Test Methods
This section presents a comprehensive test methodology, which sets a structure and framework for testing in different project phases and with different types of feed samples (Table 4). It elaborates on aspects of criteria for selecting appropriate test methods according to project study phases.
Table 4.
Overview of principal testwork methodologies.
There are four principal test methods: Single Particle Test (1, SPT), Bench Scale Test (2, BST), Cascade Test (3, CT), and Process Test (4, PT). These test methods can be applied to three principally different feed types that represent different components of an overall project lot: Endmember (A), Lithotype (B), and Composite (C).
Each combination of test method and feed type offers analysis of different process parameters with varying accuracy, according to the type of ore, the amount and quantity of material, and the project development stage. These tests are crucial for understanding the heterogeneity characteristics of the ore and for determining the most effective sorting strategies and process optimization.
Effects contributing to the TPE are often not well distinguished, and this is a common source of misinterpretation of testwork results. Importantly, we emphasize that:
- I.
- SPT is the only test separating SFH and CE.; it excludes ME contributions.
- II.
- BST and CT only include the CE contributions in combination with SFH and not the ME contributions. When only testing for CE, it is a strict requirement to apply upscaling factors when estimating TPE.
6.3. Test Feed Types
There are three categories of sample feed type which can be subjected to these testwork methods, as follows:
- A.
- Endmember;
- B.
- Lithotype;
- C.
- Composite.
Depending on the maturity and ambition of the project, an appropriate test strategy is selected. Projects usually start with testing significant endmembers or lithotypes.
6.3.1. Endmember Test Samples
The samples of the endmember feed variation only cover the extreme brackets of the relevant economic and technical features within the lot of the focus case. It is therefore a non-probabilistic, non-representative representation of the full target project lot, and in simplest terms, could comprise only high-grade and low-grade materials. However, it is important to note that the utilization of these two groups in isolation is likely to result in an underrepresentation of the financial and technical feature endmembers. It is a priority to find an optimal separation criterion to separate these extremes, as they have the highest impact on the total separation result when pricing the NSR value of tonnes of this material [46].
Endmember test samples are usually manually pre-classified by a project geologist through visual inspection of the surficial mineralisation. These hand samples can either originate from the face, be selected from bulk, or be derived as fragments from drill core. Manual classification can be erroneous, especially for non-ferrous base and precious metal ores. Therefore, reference data should also be obtained, especially (but not only) for the SPT. This also relates to the fact that the human eye can only inspect the surface of a specimen, whereas some of the detection systems, such as XRT, penetrate through the full volume of particles.
Figure 9 shows the simplified example of an endmember SPT. The lithotypes are organized in rows from an optical sorting program and their associated gray level histograms—a function of mineralogy and texture.
Figure 9.
Example simplified end-member lithotypes organized in rows from an optical sorting program and their associated gray level histograms—a function of mineralogy and texture. Colored boxes correspond to the color of the histograms.
Only when fragments of ½ or ¼ drill core are used are exploration and/or resource development grades (reference analysis) available. However, on a particle level, there will be larger or smaller deviations from the true content between the two halves or quarters of a drill core, which can bring significant uncertainty into a project. Reference analysis after a test is therefore needed to obtain information about the composition of single particles or groups of particle levels, for example, with destructive sample preparation and geochemical analysis.
When SPT is not conducted for calibration and validation, endmember samples are used for manual or automated training of POS equipment. However, manual selection and classification of the endmembers by the project geologist can lead to misclassified training samples, due to deviation from the expected composition as manually estimated and the true elemental or mineralogical content. This leads to a suboptimal CE and, in the worst case, to a suboptimal, financially unfeasible process island separation result. Reference analysis, especially on a single particle level, is the only way to optimize CE to a full extent.
Training POS equipment with endmembers holds the risk that mixtures compositionally between the features’ extremes and feature intervals between the endmembers are not optimally separated. Calibrating for the extreme feature classes only relies on the assumption of linearity of the calibration between the extremes. An assumption, which in the case of multivariate image analysis conducted in POS, often does not hold true (e.g., [47]).
6.3.2. Lithotype Test Samples
Lithotype feed samples are not mass proportional to future POS process island feed but represent a certain narrower lithology than the entire deposit. Lithotypes divide the (continuous) significant feature space into categorical sub-groups. These sub-groups are classified according to compositional or textural sub-groups relevant for the project. Test feed samples of this type are chosen to assess the response of the POS process to specific lithologies. Mathematical recombination of results from different Lithotype tests needs to be conducted with care, as ME contributions are especially dependent on the mass yield.
It is important that the lot is completely divided into relevant sub-lots and that the sub-lots sum up to the total project lot. Each item is then sampled according to the Fundamental Sampling Principle and the principles of sampling correctness. This ensures that all relevant feature variations are represented in the sample set, enabling separate analysis of the response of each Lithotype to the effectiveness contributions of POS.
6.3.3. Composite Test Samples
Composite samples cover the full space of the significant technical and financial features. They combine the lithotypes present in the future process island feed proportionally to their occurrence in the geological domains, including all transitions and contact zones between them. In the simplest geological case, there is only one Composite sample, which represents the entire project lot in one proportional, representative sample. While in principle true, this is absolutely not an easy solution to effectuate without a comprehensive command of the total geology of a deposit.
Therefore, it may often be advisable to subdivide a project lot into multiple sub-lots; for example, representing different mineralized bodies, geological domains, or life-of-mine periods. It is vital to test for variability in relation to the sequence of mining, as a processing plant will never see the total average of the deposit at any given time. Composites, therefore, need to be defined in the context of the mining schedule.
7. Standard Test Methodologies
7.1. Baseline Granulo-Chemical Analysis
Granulo-chemical analysis is suggested as a cost-effective component of each of the tests for all feed types. For all but the SPT, it is achieved by screening the bulk of the primary sample. For the SPT, the mass is obtained either by passing the particle through screens or by obtaining the particle weight (ideally both).
7.2. Single Particle Test
The only testwork that decouples the heterogeneity characteristics of the ore from the effects/effectiveness of the sorting process is the SPT—the most detailed procedure for analyzing Detection Effectiveness (DE) and separately Image Processing Effectiveness (IPE) on particle level [12].
While the SPT has been applied historically for the selection of the most appropriate sensor, this aim has lost significance. With the experience gained by the professional community, prioritizing technically mature and cost-effective sensing technology can be confidently completed without engaging in large-scale testwork programs, which need to be executed on large enough particle numbers to become statistically relevant. A thorough characterization of the technical and financial features (see Section 4.3) combined with other factors (vendor base, capital, and operating costs) will, in most cases, be sufficient for selecting the appropriate sensor, more seldomly a second and/or third one to compare.
7.2.1. Objectives of Single Particle Test
The objective of an SPT is to assess the interaction of the detection system and single particles, to optimize calibration activities, and to validate them. The parametrisation of POS equipment software is based on many variables, each of which offers considerable degrees of freedom. Costs for SPT are significantly higher than those for other procedures, primarily due to labor costs associated with scanning each individual particle, individual sample preparation, and assaying. Therefore, they are less commonly used, but when invoked, it is with one of the following aims:
- Optimization of CE using calibration and validation on the particle scale;
- Evaluation and comparison of different sensors and sensor response to each pay-element feature and correlation of technical features to financial features;
- Analysis of elemental and mineralogical composition and associations at the scale of particles tested (usually 20–60 mm);
- Determination of technical potential, suitable project development, and testing strategies;
- Comparison of the CE of similar proprietary sensors;
- Assessment of the influences of particle orientation on the detection system and implications on CE;
- Comparison of the CE of two or three preselected sensors.
Single particle testwork is the only methodology that enables isolated analysis and optimization of the CE contribution, and which gives full clarity of the proportions from the SFH, ME, and CE to the POS process result.
7.2.2. Sample Acquisition for Single Particle Test
Particles should cover and represent the particle size distribution of the future equipment feed. This is because detection is also a function of particle size (and thickness), where a standard sizing range is between 20 mm and 60 mm. Samples are selected to cover the significant features’ space in equal amounts and are therefore specifically not taken in compliance with TOS.
The point made here is that an equiprobabilistic sample would deliver a high number for some mineralization in a feature space in the case of it occurring over-proportionately in the ore. However, for SPT calibration and validation, it is desirable to spend equal efforts for all relevant species occurring in the ore body and in the future POS feed; their true relative proportions will always be quantified by well-calibrated (and validated) prediction models of the proportions of these species occurring in future POS feed [12].
Samples are either obtained from the endmembers or from lithotypes, as the geological context from where the particles originate contributes contextual information. In contrast, composite sample sources are utilized less frequently and are employed in less complex mineralisation contexts, where the number of principal lithotypes is limited and their distinction may be straightforward.
7.2.3. Test Procedure for Single Particle Test
Figure 10 shows the workflow for an SPT procedure. The activities are described in the following paragraphs, apart from feature definition and aspects of sampling. The minimum number of particles depends on complexity and scope of the project, but too few samples may lead to under-representation and false assessments (positive or negative), while too many samples can be cost-prohibitive and draw out the testing process.
Figure 10.
Single Particle Test procedure.
Particle Registration
Particle registration is the first step of the experimental work. A unique identification number (ID) is assigned to each particle, which is then photographed under controlled conditions, weighed, and packed individually in marked and sealed bags. A geological description should be added, describing the spatial origin, mineralogy, and texture following the terminology and classification used for drill core logging.
Image Acquisition
Image acquisition is the second step. Particles are fed to the sensor imaging (detection) system. For XRT image acquisition, particles can be fixed in their plastic bags onto a plastic test sheet, which allows passing multiple particles at the same time (Figure 11). The plastic does not notably influence the X-ray attenuation and is consistent across all particles.
Figure 11.
Test-sheets prepared for image acquisition with XRT.
An extended version of the test includes image acquisition multiple times per particle. It covers the aspect of particle orientation in the scanning area. Particles on a belt-type sorter may have multiple stable resting positions when traveling through image acquisition or tumble through image acquisition in a chute-type POS machine. This influence can thus be included with multiple images per particle.
Image acquisition may be with industrial-scale POS equipment or in specifically designed test rigs that either move the detection system or the samples. Ideally, image acquisition is conducted at similar exposure times and geometry compared to the setup in industrial POS equipment and environments. Transfer from other imaging systems not designed for sorting applications and running under different conditions, assuredly adds bias that cannot be reliably corrected for. This is, therefore, not recommended.
Reference Analysis and Assaying
The particles then undergo reference analysis that is often destructive and includes crushing, milling, representative mass reduction, and geochemical and mineralogical analysis. Extended assaying packages for multielement analysis are recommended, and sample pulps and rejects can be kept for re-analysis if necessary. As noted previously, the PhotonAssay method provides a non-destructive approach for the assaying of gold, silver and/or copper [30], with the advantage that particles remain available as a reference for future image acquisition and analysis.
For coal, iron ore, and other ferrous metals, it is a cost-effective strategy to apply heavy liquid separation (HLS) for determining particle characteristics. This has the advantage that the analysis is non-destructive and that particles remain available as a reference for future image acquisition and analysis.
Separation of Calibration and Validation Sample Set
It is important to separate samples into a calibration and a validation set. Checking the calibration with a validation sample set prevents overfitting the calibration model and reduces the risk that calibration is not applicable to future POS process feed.
While a 1:1 split is optimal, a practical ratio of 3:1 or 4:1 of calibration to a validation sample set is often used. The issues surrounding calibration vs. validation are equally relevant and treated in full depth within the discipline of chemometrics [47]. Separation of calibration and validation samples is conducted after reference analysis to ensure that both the calibration and the validation set span the technical and financial feature spaces of interest. An additional, completely independently collected set of sample particles can also be used during validation to assess impacts from primary sampling.
Equipment Calibration
The assay results obtained for the calibration particle set can now be used for parameterization of the image processing and classification software. Predefined generic calibrations can also be applied. In principle, only a binary classification into product and waste particle classes is necessary for enabling separation. The distinguishing criterion is the Sorting Index cut-point.
However, creating a Sorting Index that correlates with the pay-element features enables adjustment and control of the cut-grade of the separation.
Calibration can be optimized iteratively, but there is a risk of overfitting the calibration model to the calibration data set. Overfitting is a common problem in multivariate data analysis and machine learning. It occurs when a model learns the training data ‘too well’, for example, modeling random fluctuations and noise, instead of identifying the underlying systematic patterns only. This results in the model performing very well on the calibration data but poorly on new, unseen data (validation data set or data from feed in future production). Expert supervision and interpretation of the detected technical features is important for due diligence, ensuring that the calibration is robust across the project lot.
The unwanted result of underperforming classification is Quality Losses in operation.
Validation
The particle-based data of the validation sample set is used to validate the calibration and thereby determine the CE. Results of validation are reported as the results of this testwork stage.
Cross-validation is discouraged. Variants or schemes of the cross-validation type are by necessity inferior because no total sampling error contributions from any future data set are ever included in the validation [47,48].
7.2.4. Single Particle Test—Summary and Results
The SPT is the most detailed test for POS project development and process optimization. It focuses on the CE only, connecting the sensor images with the reference analysis. Figure 12 shows an overview of the process effectiveness contributions and the explanation which effects are studied with the SPT. An example of a SPT result is displayed in Figure 13.
Figure 12.
Effectiveness contributions studied with the Single Particle Test.
Figure 13.
Example table extract of Single Particle Test responses and their characteristics relevant to the project’s technical and financial features within a geometallurgical framework, translated from Robben et al. [21].
Results of SPTs are reported as scatterplots with a technical or financial feature on the x-axis and a Sorting Index on the y-axis. The Sorting Index reduces the multivariate, image-based data for one particle into one, often dimensionless, value, usually following the steps of Pixel Classification, Image Classification, and Object Segmentation. It is then used for setting classification thresholds between drop and eject particle classes. A typical and relatively simple example is to use the area percentage of a pixel class in a segmented object in relation to the total surface. This can correspond to the presence of a technical or financial feature. For example, in a case where the ore mineral shows high atomic density and the gangue minerals show low atomic density, an XRT sensor may easily discriminate between these two classes (e.g., Figure 13, Sample 1 with cassiterite associated mostly with quartz). After calibration, the goal is to validate and evaluate if the application of the Sorting Index as a separation criterion enables a feasible separation.
Figure 14 shows a gold ore example, where the cut-grade was defined at 0.5 g/t Au and the Sorting Index cut point is set at 0.01 [12]. POS for gold ores is challenging as the technical features have varying correlations to the financial feature, the gold grade. We see, in traditional terms of regression analysis, a weak correlation between Sorting Index and gold grade. However, in an application that is based on object classification, a weak correlation may still enable a sufficient classification to achieve the objectives of the process.
Figure 14.
Result of a Single Particle Test for a gold ore showing assayed particle gold grade in g/t vs. unitless Sorting Index [12]. The orange lines divide the graph into four quadrants based on correct and incorrect classifications of product and waste.
Confusion matrices are used as well to evaluate the effectiveness of the classification [49]. They report false-false and true-true, or product-to-product and waste-to-waste as probabilities in percent.
A disadvantage of the simple confusion matrix is that classification results are evaluated by weighing all particles identically, independent of the net-smelter-return value. Table 5 shows an exemplary simple confusion matrix derived from the Single Particle Test displayed in Figure 14. In this case, 92% of the product particles are classified as product (229/229 + 19) while 64% of the waste particles are properly classified as waste (48/48 + 27). Raising or lowering the cut point of the Sorting Index directly impacts performance metrics, as expected, and optimization would be dictated by project objectives. For example, is it more important to keep more ore in the product class by lowering the Sorting Index cut off, or is it more important to keep waste out of the product class by raising the Sorting Index cut off?
Table 5.
Exemplary confusion matrix derived from the Single Particle Test.
SPT provides full information for optimizing DE and IPE. Fundamental calibration and validation activities are possible by correlating and comparing sensor imaging data and data interpretation to the true assayed elemental and mineralogical composition. The SPT is especially suited for projects where the image recorded for one particle does not correlate directly to the pay element(s). An example is the POS of orogenic gold ore, where the presence of quartz veins and stringers is detected using Laser diffraction. Respective particles diffracting light are classified as product and recovered. However, the presence of gold is not always reliably correlated to the presence of quartz, and penalties on gold recovery may make or break financial feasibility [50].
SPT only gains greater significance when carried out in conjunction with heterogeneity characterization of the ore, as this will allow prediction of the sorting result. Furthermore, SPT is especially suited to complex ores with multiple financial and technical features across an orebody or multiple orebodies. Complexity for sorting is less likely with polymetallic sulphide ores, which are traditionally named complex ores due to the complexity of the beneficiation processes to recover all elements. Instead, it is rather the variation in sensor response, i.e., sensor technical features, which is usually associated with the value-bearing and non-value-bearing lithologies [36]. Here, the calibration of the sensor image to the economic value of a specific particle is multivariate. There are several aspects of SPT in which the discipline of multivariate data analysis (chemometrics) is empowering [49].
7.2.5. Limitations of the Single Particle Test
The main limitation is the number of particles that can be scanned and subjected to reference analysis, which is limited by cost. Usually, only a few hundred, more seldomly in the thousands of particles, are subjected to an SPT. This is obviously a low number considering that these particles are selected to represent a project lot, a resource or reserve containing millions of tonnes of mineralization plus waste.
The effect of particle orientation is usually not incorporated in an SPT program but can be addressed by scanning each particle more than once.
Another limitation is that the study of the relation between sensor response and the content determined by reference analysis is at the full particle level. A further level of detail, the response to different compositions on the pixel level, is usually conducted in the context of research and development.
Variants of the SPT can be applied in all phases of project development, except in bankable feasibility stages, where all effects contributing to the process result need to be included.
7.3. Bench Scale Test
A Bench Scale Test (BST) separates feed samples into two resulting fractions while excluding ME contributions. It is a validation stage for determining the CE combined with the sorter feed heterogeneity (SFH) with higher sample masses. A previously prepared calibration is subjected to more particles under idealized conditions, reducing the ME contributions to a minimum by reducing the feed capacity to a minimum (trickle-feed). The calibration and machine parameters can be handed over from previous, comparable projects or from SPTs.
This delivers combined information on the feed heterogeneity of the material and the exploitation achieved by CE. In contrast to the SPT, analysis is not done on the level of single particles, but on groups of particles, separated into intervals of Sorting Index, so a level of detail is lost.
7.3.1. Objectives of Bench Scale Test
The BST Method is conducted with one or several of the following objectives:
- Validation of the CE with a higher number of particles;
- Information on the SFH of the material (as detectable with the CE);
- First estimations of potential POS process results (scale-up factorization necessary);
- Opportunity to further analyze particle image data from the POS test equipment;
- Opportunity to calibrate and verify the classification algorithm with a larger sample set than possible by SPT.
7.3.2. Sample Acquisition for Bench Scale Test
Sample masses for BST will be larger than SPT; however, the material can still represent end-member, lithotype, and composite materials depending on the questions being posed and the change in scale and scope from SPT to BST. Because BST results are derived from higher masses, they are assumed to carry greater significance than SPT results. Accordingly, primary sample acquisition must adhere to aspects specified by TOS as it pertains to underlying assumptions and risks. For example, if the BST is to be performed on a composite feed type, it is important that the composites include planned and unplanned mining dilution, as this will ultimately end up in the sorter feed.
Sample masses are usually in the range of 10’s to 100’s of kilograms per BST, so the total mass in a BST program is typically a few 100’s of kilograms up to a few tonnes when testing multiple calibrations in different particle size ranges, and potentially for multiple endmembers or lithotypes.
7.3.3. Test Procedure of Bench Scale Test
Once samples arrive in a laboratory, they are subjected to all unit processes of a typical sorting island: size reduction by crushing, screening, and POS (Figure 15). The BST idealizes the process conditions of POS by reducing the feed capacity to a minimum, where ME is optimal and does not negatively impact the POS process result.
Figure 15.
Bench Scale Test procedure.
Where a calibration is not available from SPT or cannot be transferred from a closely comparable project, the equipment is manually set up using training particles or groups of particles for training (with the risk of calibration applied manually to misclassified materials).
Crushing
The test procedure includes particle size reduction. As sample masses are relatively small and some POS technology is usually not applied for particle sizes larger than 60 mm, this size is chosen as the recommended standard top size for BST work.
Screening
After reducing the top size to d95 of 60 mm, the sample is then screened into four particle size fractions:
- (a)
- 40–60 mm;
- (b)
- 20–40 mm;
- (c)
- 10–20 mm;
- (d)
- –10 mm.
Further particle size ranges below 10 mm can be screened and analyzed individually in the context of a specific project. A simplified variation of the BST is focused on one particle size range only, which may be potentially wider; for example, 15–50 mm. These particle size ranges are suggestions only and can be adapted to screen availability.
Equipment
BSTs are usually conducted on production equipment or with a sensing and separation setup operated under similar conditions to production. The main directive for the BST is the reduction in feed capacity to a practical minimum so that ME is optimized and practically excluded.
BSTs can also be conducted on laboratory units. However, the operating conditions like traveling speed/exposure time, sensing geometry, and configuration must be comparable to production units and conditions.
Particle Ore Sorting
The equipment used is usually production-scale equipment, or a similar setup, which inherits all effects contributing to the CE. Due to the low feed capacity during the test, all ME contributions are minimized. Additionally, due to the low area occupancy in the particles in the sensing zone and the resulting good isolation of particles against the background in the resulting image (object segmentation), CE is also idealized.
Multistage POS process islands are very rarely built and operated as the costs and operational complexity usually prevent feasibility. Therefore, it is advised to focus on rougher POS stages.
Multistage sorting can be conducted, but not more than two stages are advised due to particle degradation through material handling. Other influences also come into effect, such as the probability that the particle has multiple chances, resulting in an overall increased probability of reporting to the correct fraction. Therefore, it is recommended to operate rougher runs only, or rougher-scavenger, or rougher-cleaner stages, or rougher-scavenger-cleaner stages as the maximum scope for a BST.
In a standard single-stage rougher POS test, three coarser particle size ranges of 10–20 mm, 20–40 mm, and 40–60 mm are each subjected to one POS separation stage, producing two result fractions of product and waste each. In addition to this is the undersized fraction. Thus, a standard BST results in seven fractions, which are subjected to assay.
Material Analysis and Assaying
These seven fractions then undergo analysis, which, similar to PST, is often destructive in nature. Depending on the capabilities of the BST facilities, the fractions (>10’s kg) could be subsampled prior to elemental and mineralogical assays. Extended assaying packages for multielement analysis are again recommended, and sample pulps and rejects can be kept for re-analysis if necessary.
7.3.4. Bench Scale Test—Summary and Results
The BST is a method applied for studying POS process results under idealized conditions. It is often applied in early project development stages, due to the ability to predict POS process result information when upscaling is applied. The uncertainty connected to the results achieved may meet the objectives of earlier project development stages.
Figure 16 gives an overview of the effectiveness contributions and aspects analyzed with a BST. ME contributions are minimized, and CE is optimized by operating the process under optimal conditions. Thereby, it is possible to obtain ideal process results, which are a combination of the SFH and the CE. Due to the idealized conditions and the exclusion of ME contributions, the output of the test is an idealized result, which may be subjected to upscaling to estimate the production process island separation result.
Figure 16.
Effectiveness contributions studied with the Bench Scale Test.
When reporting test results, their origin from BSTs must be clearly stated due to the idealized nature of the results and the often relatively low sample masses involved, which means a potentially high variance contribution from the FSE. The responsible sampling manager needs to ensure that the variance introduced does not disqualify the test results entirely, based on a relevant heterogeneity test. A detailed analysis is required from the primary sample collection stage to the final results to quantify the FSE and thus the degree of risk involved. BSTs are often reported as data tables, as per the example in Table 6. In this case, “yield” is defined as the relative amount of mass reporting to the product fraction, and “recovery” is defined as the total valuable content (e.g., Sn or Cu content in %) of the product as compared to the feed grade and starting mass in the particle size range. In each fraction subjected to POS, the product grade is higher, and the waste grade is lower than the feed grade, indicating a positive outcome for a given set of classification parameters.
Table 6.
Exemplary Bench Scale Test results.
7.3.5. Limitations of the Bench Scale Test
The BST often is the entry into a project development roadmap and an applicable tool to study the combination of SFH and CE. The decisive limitation and a potential risk for misunderstanding of the BST is that the capacity is very low and that the results reported do not include ME contributions. BSTs can also be combined with a process test program on representatively split samples (riffle splitting or rotary splitting) to assess contributions from ME as the differential between the two tests.
An additional risk of BSTs lies in the low sample masses, which can also be viewed as an advantage, as BST is a relatively cost-effective test. When applied in earlier stages of project development, the sample masses are often in the 10s to 100s of kgs, which potentially introduces a significant FSE to the MUTOT of the end results, due to the low masses in the resulting fractions.
7.4. Cascade Test
The Cascade Test (CT) is a variation of the BST, which is also usually applied in earlier phases of project development with relatively low sample masses. The CT applies the starting concept of a BST and then refeeds the product fraction through the POS process with changes to the cut point. CTs are often misinterpreted and create positively biased results. The bias originates from the additional chance of correct classification with each additional POS pass. Mathematically recombining fractions in a cumulative manner does not represent the results, but only for the first two passes.
This bias leads to overoptimistic project feasibility assumptions and eventually to non-performing installations. However, when reported transparently, the CT serves a rational purpose and is therefore included here as a standard testwork methodology.
7.4.1. Objectives of Cascade Test
The CT is recommended when the correlation of a Sorting Index to a technical or financial feature needs to be established.
When relatively low mass is available for testwork, for example, in early project development stages, the CT is often used to establish yield-recovery relationships (i.e., POS process result). These need to be interpreted and reported with caution as they are positively biased, but, crucially, the extent to which the results are biased cannot be estimated. Reporting a CT as a cumulative yield-recovery function falsely implies a smooth relationship, while significant FSE contributions and probabilistic TSE effects may take place. The resulting variance is covered by the cumulative nature of the grade-recovery function, presenting a high reliability of the results.
As a general rule, the magnitude of the positive bias in a BST result is connected to the quality of the correlation between the Sorting Index and the technical or financial feature of interest.
7.4.2. Sample Acquisition for Cascade Test
The acquisition of samples must comply with all the demands specified by the TOS. As with the BST, the questions for each material for which the test shall deliver answers require full attention to geological comprehension and stringent clarity in reporting.
As for the other tests, lithotype and composite sample feeds cover the full technical and financial feature space, whereas end-member test feed samples focus and prioritize on the extremes only. Sample masses are usually in the range of 10s to 100s of kg per CT.
7.4.3. Test Procedure of Cascade Test
The CT refeeds one sample multiple times while stepwise changing the Sorting Index cut point from high recovery through to high concentration (Figure 17). The CT can be viewed as one scavenger step followed by a cleaner and multiple recleaning stages.
Figure 17.
Procedure of the Cascade Test.
Where a calibration is not available from SPT or cannot be transferred from a comparable project, the equipment is manually set up using training particles or groups of particles. These are usually specimens manually selected by the project geologist.
Crushing
The test procedure includes particle size reduction. As sample masses are relatively small and some POS technology is not applicable for particle sizes +60 mm, this size is chosen as the recommended standard top size for CT work. As a CT is an extended version of the BST, it is recommended to synchronize the top size to allow for comparison between the results.
Screening
After reducing the top size to d95 of 60 mm, the sample is then screened into four particle size fractions:
- (a)
- 40–60 mm;
- (b)
- 20–40 mm;
- (c)
- 10–20 mm;
- (d)
- –10 mm.
In early phases of project development, a single particle size range may be chosen to reduce the test program scope; typically, this would be 10–40 mm.
Further particle size ranges below 10 mm can be screened and analyzed individually in the context of a specific project. Between each POS step of the CT, there is a screening step to scalp off the fines generated by degradation through material handling and POS.
Equipment
The CT is conducted on production-scale POS equipment or on laboratory units with a scanning mechanism that is identical in construction to production-scale equipment. The physical separation setup may be different from a production unit, as long as it is operated with high ME.
Particle Ore Sorting
There are multiple steps of POS, and the concentrated product fraction is refed multiple times to POS after scalping off the fines generated during the process. A rougher POS step is followed by a cleaner and multiple recleaner steps. The parametrization of the POS equipment, the Sorting Index, is stepwise changed from maximum recovery to high concentration.
The feed capacity is kept at a minimum level with the aim of including CE and to reduce negative ME contributions to an absolute minimum.
Screening the feed to each POS step ensures that particle degradation/comminution is transparently accounted for.
7.4.4. Cascade Test—Summary and Results
The CT is an extended variation of the BST. The waste fraction of each separation step and the final product fraction are assayed. The test delivers blended and aggregated information about the SFH and the DE. By refeeding the resulting product fraction of the previous POS separation multiple times, a correlation between the Sorting Index and a technical or financial feature can be established and studied.
Figure 18 shows example CT results for a tin ore as a correlation of Sorting Index to average tin grade of each separated depleted, and the final concentrate fraction. For this ore, there is a strong correlation between the Sorting Index and the assayed tin grade for each of the fractions resulting from the CT. In this case, the Sorting Index was defined as the proportion of pixels in a particle that showed high atomic density (above the set attenuation threshold), as per the XRT sensor utilized in the testwork.
Figure 18.
Exemplary Cascade Test results [42].
Most POS islands installed are operated with the duty to reject subeconomic waste and achieve higher recoveries [3]. Therefore, analyzing the fractions produced with parameters to achieve high concentration is of less relevance for the project’s feasibility. However, the test is a valuable tool to study the SFH and the CE in relation to it, which is expressed as the correlation between one significant feature and the Sorting Index. The stronger the correlation is, the more flexible the POS can be applied to the ore, and the lower the technical and, consequently, the financial risk is.
The results of the first two stages, rougher and cleaner, can also be reported as a BST.
7.4.5. Limitations of the Cascade Test
The main disadvantage of the test is the repetitive nature, where particles experience multiple chances to report to the intended fraction. Though ME contributions are minimized, CE has a probabilistic nature, and repetition skews the results with a positive bias. This has more effect the weaker the correlation of the Sorting Index and the technical or financial feature is.
Secondly, sample degradation during rehandling may introduce an issue, as there may be preferential breakage behavior that influences the results of successive steps. More brittle material will report to fines. To isolate and evaluate this effect, screening is inserted between the POS stages.
Especially, the effects of Presentation Effectiveness (particle orientation) have a major influence on the DE and also a cross-effect on the ME. In the context of Duncan’s six-stage methodology [41], two aims can be achieved with a CT. Firstly, to produce an “idealized sensor” grade-recovery function when more than Endmember single particle samples are available (lithotype or composite samples). Secondly, to produce an “industrial sensor” grade-recovery function when enough sample is available for parallel test runs. To reduce the influence of ME, the tests must be run trickle-fed, particle by particle. It needs to be considered that each stage’s drop fraction shall be re-run several times to reduce (measure) the effect of the particle orientation on the DE. This way, one could achieve an “ideal sensor” grade-recovery function. Without quantifying the effect of the particle orientation, the results of CT are not interpretable and are between an “idealized sensor” (SPT) and an industrial process (PT).
CT is the most misapplied and misinterpreted test in the context of POS. All stakeholders must be aware of the adverse technical effects originating during the test and apply diligent care when reporting results.
7.5. Process Test
The Process Test (PT) assesses the combination of SFH with ME and CE and is therefore the only test simulating production conditions. It is therefore the most important and decisive test in POS project development as it is the foundation for investment decisions.
7.5.1. Objectives of Process Test
The aim of the PT is the determination of all relevant process parameters necessary for assessing feasibility. These include yield, recovery, product grade, and waste grade for multiple tests under production conditions. The determination of project-specific particle size ranges for the process island flowsheet is a further goal, as well as the selection of the optimum equipment for the project.
The PT is applied when calibration and validation exercises are completed and optimized. Furthermore, the lot heterogeneity is analyzed and estimated, and the framework of the project business case is completed, setting clear targets and expectations for the PT Program.
7.5.2. Sample Acquisition for Process Test
The acquisition of testwork samples and their splitting must comply with all requirements specified by TOS and emphasize with clarity the question, for which material and for which lot the test shall deliver the answers.
A single composite sample is often preferred due to the perceived advantage of limiting the amount of sample necessary, the test runs, and the created fractions, which directly translates into the number of assays needed. However, creating data points only for one summarized representation of future ore feed is only recommended for ores showing a low degree of variability across the resource. When combining all future ore feeds into one representation, all information about deposit variability is lost and cannot be constructed at a later stage.
Sample masses are usually in the range of 3–5 t for one composite, or for each Lithotype sample individually in the size range 10–60 mm. A PT program can therefore comprise approximately between 3 and 20 t of sample. Should the test program be conducted for an ore body that is not yet accessible for bulk samples, drill core can be crushed and used for the test program. Due to the limited availability of mass from drill core, lower sample masses are acceptable as a compromise.
For a standard PT program, the initial feed sample is separated through testwork into 19 resulting fractions (Figure 19) depending on the particle-size distribution and the yield of POS. Multistage flowsheets are mostly tested as rougher-scavenger combinations, but multistage production plants are seldom implemented. The resulting fractions are a determining factor for feed sample mass selection, as the FSE needs to be acceptable for each of the produced fractions. It is usually the sorted fraction in the coarsest particle size range of 40–60 mm that is critical to determine the total feed mass. Input information to select appropriate levels of variance is derived from a heterogeneity analysis (see Section 4.4).
Figure 19.
Process Test procedure.
When multiple-stage tests are conducted, the total number of resulting fractions increases, and the mass per resulting fraction for assaying decreases. This means that the test feed sample needs to be increased accordingly to maintain an acceptable level of variance induced by the FSE.
The above-mentioned mass indications are generalizations only. The necessary masses needed for a specific project depend on the specific heterogeneity of the project lot material, which needs to be determined in advance.
7.5.3. Test Procedure of Process Test
The PT procedure is the most extensive test amongst the methods because multiple parameters are tested across multiple size ranges, but the PT includes all effectiveness contributions to the total process.
Crushing
The test procedure includes particle size reduction. Even though sample masses would appear to be generous (3–5 tones), some POS technology is usually not applied for particle sizes bigger than 60 mm, so this size is chosen as the recommended standard top size for PT work. As a PT often follows a BST, it is recommended to synchronize the top size to allow for comparison between the results.
Screening
After reducing the top size to d95 of 60 mm, the sample is then screened into four particle size fractions:
- (a)
- 40–60 mm;
- (b)
- 20–40 mm;
- (c)
- 10–20 mm;
- (d)
- –10 mm.
Equipment
The equipment applied for PT is full-scale production equipment, and no further scale-up is necessary. To enable relatively low sample masses on equipment with higher design capacity, the process working width can be decreased, enabling full specific design capacity per meter.
Representative Mass Reduction and Sample Splitting
To establish representatively split material for multiple test runs on the same particle size fraction, riffle splitting or rotary sample dividers are the only acceptable options [26,27]. If possible, TOS suggests using riffle splitting independent of scale and laboratory equipment, following the governing principle of Sampling Scale Invariance. For PT work, representative primary sampling as well as all sub-sampling mass reductions constitute non-negotiable demands.
Particle Ore Sorting
Test runs are conducted on each representatively split sub-sample in multiple size ranges.
In earlier project development stages, more options can be tested, such as different sensors or machine types, though these options are usually tested on the Bench Scale Test level prior to a Process Test.
Three test runs are conducted per particle size range to enable the derivation of a yield-recovery function. Three tests per screen sizing is recommended as a balance between completeness and budget. This could still be increased or decreased depending on the specifics of the program, be it budget, sorter configuration, feed complexity, or otherwise. More seldomly, rougher-cleaner and rougher-scavenger combinations are also tested.
The test runs are conducted mimicking as closely as possible the intended production conditions. A specific capacity in metric tonnes per hour and meter [t/(h×m)] aligned with the intended project capacity should be used in order to include all effectiveness contributions to the POS process result.
All resulting 19 fractions are subjected to appropriate particle-size reduction and representative mass reduction steps before assaying. Duplicate analyses should cover the full pathway from the sorted fraction to the assay to evaluate all sampling and analysis contributions.
7.5.4. PT—Summary and Results
The PT is the only method that includes all effectiveness contributions (Figure 20). It delivers the most accurate approximation to the full-scale Process Island Separation Result and is therefore suited for more mature stages on the project development roadmap.
Figure 20.
Effectiveness contributions studied with the Process Test.
7.5.5. Limitations of the PT
The PT can mimic production conditions on the laboratory scale. However, the process conditions can only be established for ~1 min, including a ramp-up and ramp-down phase. This is enough to stabilize the process; however, studying process behavior over time is not possible.
Secondly, sample masses are still relatively low, and the inherent heterogeneity can have a significant effect on the coarsest particle size range. This means that, depending on the strength of the correlation of the pay element feature to the Sorting Index and the robustness of the business case, a pilot plant operation may be advisable.
Thirdly, feed conditions vary significantly from production conditions, where ineffective and insufficient feed screening is often experienced as the highest contribution to Quality Loss and Availability Loss. Upscaling from PT includes considering the effects of varying SFH and feed-screening effectiveness.
8. Summary & Recommendations
POS has gained significant acceptance as a unit process in mineral processing in recent years, particularly in the diamond, industrial minerals, gold, tin, and tungsten sectors. The increased uptake has led to a steady increase in testwork volume since 2010. This testwork is the basis for all technical and financial evaluation of a potential business case for POS and comes with unique challenges:
- Probabilistic separation with many operating variables;
- Versatile applicability to various mineral commodities and deposit types;
- Large particle sizing requiring substantial masses to meet data quality standards.
To support the growing volume of POS testwork, we outlined different industry practices and developed a standardized set of test methodologies and sampling requirements for different project stages, with consideration for different sample types. These are:
- Single Particle Test (SPT): Focuses on detection effectiveness (DE) on a particle level, optimizing calibration and validation activities;
- Bench Scale Test (BST): Validates the classification effectiveness (CE) combined with sorter feed heterogeneity (SFH) under idealized conditions;
- Cascade Test (CT): Establishes Sorting Index to significant feature relationships by refeeding samples multiple times while changing the Sorting Index cut-point;
- Process Test (PT): Assesses all relevant process parameters under production-like conditions, including yield, recovery, product, and waste grades;
- A.
- Endmember Samples: Represent extreme brackets of significant economic and technical features;
- B.
- Lithotype Samples: Represent specific lithologies of the deposit;
- C.
- Composite Samples: Combine all significant features and lithotypes proportional to the focus case/ project lot.
From the possible combinations (4 × 3), the practically realizable result is ten methods of POS testwork (Table 4) of varying levels of effort, where each have their own strengths and limitations. Accordingly, it is imperative that the parameters of all testwork are well defined and communicated. We propose the following to be included in all POS test program reports to improve confidence and interpretability of POS results. Table 7 is aligned with this paper’s sections and includes Project Scope and Definition (Section 1, Section 2, Section 3, Section 4 and Section 5), Test Type Selection and Execution (Section 6 and Section 7), and Project Results and Reporting (Section 7 and Section 8).
Table 7.
Recommended project parameters for definition in all POS studies.
Standardizing terminology can enhance communication among stakeholders and improve their understanding of efficient testing methods. Making POS testwork accessible to non-experts can further contribute to reducing project development costs by standardizing tests. Additionally, this approach provides a basis for rational risk management in POS projects.
Author Contributions
Conceptualization, C.R.; writing—original draft preparation, S.C.D.; writing—review and editing, K.H.E.; writing—review and editing, M.-C.H.; writing—review and editing, M.M.; writing—review and editing, D.T.; project administration—writing and editing. All authors have read and agreed to the published version of the manuscript.
Funding
This research received no external funding.
Data Availability Statement
Data are contained within the article.
Acknowledgments
We acknowledge and appreciate the professional exchange with many industry professionals, who are also reflected in this paper and in the reference list where applicable.
Conflicts of Interest
Authors Christopher Robben; Marie-Claude Halle; David Turner were employed by the company SIX-S Consulting. Author Kim H. Esbensen was employed by the company KHE Consult. Author Mike McCubbing was employed by the company Saskatchewan Research Council. The remaining author declares that the research was conducted in the absence of any commercial or financial relationships that could be construed as a potential conflict of interest.
Glossary
The following terms and abbreviations are used in this manuscript:
| Analysis Uncertainty | Analytical uncertainty refers to the degree of variability in measurement results that arise during an analytical process. It encompasses factors such as instrument precision, calibration accuracy, sample heterogeneity, and operator variability, all of which can affect the reliability of the data obtained. |
| Area Occupancy | The proportion of the projected area in the sensor image in POS, which is covered with particles, in relation to the total projected area, is defined as area occupancy. |
| Bench Scale Test | Also known as First Inspection, Basic Test, Variability Test, and Sighter Test |
| Calibration | Calibration is the process of adjusting a model or instrument to align its outputs with a known standard or set of reference values. |
| Classified Image | A classified image is an image that has undergone pixel classification, reflecting the spatial distribution of assigned pixel categories. Classified images usually have undergone image processing techniques, such as filters to enhance certain characteristics. Classified images are presented in false colors, representing the different categorical pixel classes assigned to pixel classification. |
| Classified Particle | A classified particle is usually defined based on pixel classification, image classification, and object segmentation. It is then categorized, using the Sorting Index, which sets a threshold on a dimensionless numerical scale. A minimum of two categories is needed for POS: drop and eject. When particles are classified as eject, the separation mechanism activates with the aim of individually diverting these particles from the material stream. |
| Classified Pixel | A classified pixel is an image pixel that has been assigned to predefined labels or categories. In pixel classification, each pixel is analyzed independently to determine its properties, such as color, intensity, or spectral information, and is then labeled according to predefined classes. A classified pixel is usually marked with a so-called ‘false’ color, where each category is represented by a color of choice. Basic categories in POS are ‘foreground’ and ‘background’, representing the presence and absence of rock, respectively. Foreground pixels are then further categorized into different material classes. |
| Composite | A sample that combines all significant features and lithotypes proportional to the project lot, i.e., the future sorting process island feed. |
| Confusion Matrix | In the context of classification, the confusion matrix (also called a contingency table) compares the predicted classes with the actual classes and provides insights into how well the classification model is performing. A downside of the confusion matrix can be that classification results are evaluated by weighting all particles the same, independent of the grade or value, unless a weighting is purposefully applied. |
| Cut Grade | The cut grade is defined as the grade of the relevant feature that has 50% probability of reporting to the product fraction (p50) |
| Cut Point | The cut point is the threshold setting chosen for the Sorting Index, which classifies particles into the drop and eject fraction. |
| Detection Effectiveness | The Detection Effectiveness in the context of SBS describes the effectiveness of the sensor detection system versus the true analytical content. |
| Detection System | The detection system of a sensor-based particle ore sorter usually comprises a generator of electromagnetic radiation and an imaging sensor. |
| Drop | In the context of POS, drop refers to the fraction or particle that is not diverted by the ejection mechanism (air impulse or mechanical paddle) and follows the unaffected traveling path. It can also be referred to as ‘Accept’, ‘Non-Eject’, or ‘Pass’. Usually, a POS machine is parameterised to drop the fraction that represents more weight in the machine’s feed. |
| Eject | In the context of POS, eject refers to the fraction or particle, which is diverted by the ejection mechanism (air impulse or mechanical paddle) and is diverted. Usually, a POS machine is parameterised to eject the fraction which represents less weight in the machine’s feed. |
| Financial Feature | The financial feature denotes a distinct attribute of net value specific to a tonne of ore. This is usually the grade of the pay-elements in the ore, multiplied by the process recovery and the net smelter return. |
| Geometallurgy | Geometallurgy is an interdisciplinary field that integrates geological, mining, metallurgical, and environmental information to optimize the extraction and processing of minerals. It aims to improve resource efficiency and economic returns by understanding and predicting the variability in ore characteristics and their behavior during mining and processing operations. The key output of any geometallurgy program is a 3D predictive model. |
| Grade Frequency Distribution | A grade-frequency distribution represents the pattern of how frequently each value of a variable appears in a dataset, in this case, the financial feature of pay-element grade. Pay element grade concentrations are divided between different intervals known as class intervals, and then their frequencies are counted for each class interval. In some mineral applications, the frequency distribution can be approximated with a probability density function. |
| Heterogeneity | Heterogeneity refers to the quality or state of being diverse or varied in composition. It describes the presence of different elements, characteristics, or types within a system, group, or environment. In a broad sense, heterogeneity can apply to various contexts, such as populations, materials, ecosystems, or data sets, where multiple distinct components coexist. It is often contrasted with homogeneity, which implies uniformity or similarity among components. In the context of POS, heterogeneity is the description of the nature of a lot according to the mass frequency distribution of relevant technical or financial features on the particle level, also called liberation. |
| Heterogeneity Test | The method for determining the intrinsic heterogeneity of a lot. |
| Imaging Sensor | The imaging sensor is an arrangement that transforms captured electromagnetic radiation into electric signals and outputs them as (endless) images. The recorded images include both the spatial information (x, working width position; y, time) and the property information (e.g., brightness) |
| Inherent Heterogeneity | A limit case of the Heterogeneity of the lot, which does not display any grouping or segregation, so only the Fundamental Sampling Error has an influence. |
| Liberation Function | The liberation function describes the heterogeneity of a lot as the probability density function (frequency distribution) of a significant feature. |
| Lithotype | A lithotype is a specific type of rock that is characterized by its specific physical and mineralogical properties. Lithotypes are used to classify and describe geological materials based on features or attributes such as elemental concentrations, mineralogy, grain size, texture, composition, color, and formation environment. |
| Lot | The Theory of Sampling defines the lot as the material in question to be sampled by defining the physical dimensional limits of the mass. Lot sizes can range greatly, from a mine pit (Mt), stockpile (tonnes), or big bag (kg) to sample pulps (g) and smaller. |
| Lot Dimensionality Transformation | A sampling unit operation defined by the Theory of Sampling |
| Mechanical Effectiveness | Contributions to the Total Process Effectiveness originating from the physical separation mechanism (e.g., air ejectors) as well as general geometry, traveling speed, separation chamber geometry, and splitter geometry. |
| Object Segmentation | Feed to the POS always creates clusters of particles, which are located close to each other and touch or overlap in the image. Object segmentation in image processing is the task of dividing an image into multiple segments, or regions, by identifying and isolating specific objects within that image. For POS, it is necessary to identify the presence and exact location of every single particle to allow for object-based classification and mechanical separation. |
| Overall Equipment Effectiveness | Overall Equipment Effectiveness (OEE) is a metric and key performance indicator used to measure the productivity and efficiency in manufacturing and mineral processing. It combines three key factors: availability, performance, and quality, indicating how well a machine is being utilized compared to its full potential. An OEE score of 100% means the equipment is producing according to the testwork specification at design capacity, with no unscheduled downtime. |
| Process Test | Also known as Standard Test, Advanced Test, Performance Test, and Bulk Test |
| Replication Experiment | Replication of a series of independent complete ‘lot-to-aliquot’ analytical determinations, made under identical conditions. The number of replications is termed Q. |
| Responsible Sampling Manager | The Responsible Sampling Manager is the individual accountable for ensuring that all sampling activities are conducted in accordance with scientifically valid principles to achieve the results according to the objectives of the project sponsor. They are responsible for managing the design, implementation, and evaluation of sampling protocols while balancing constraints such as material heterogeneity, logistics, and resource limitations. This role requires expertise in the Theory of Sampling, leadership, and stakeholder communication to ensure the integrity of the sampling process and its alignment with project objectives. |
| Sampling Uncertainty | Sampling uncertainty is the variability or error associated with the process of selecting a subset (sample) from a larger population. It arises because a sample may not perfectly represent the population due to factors such as sample size, selection bias, and inherent variability within the population. Understanding sampling uncertainty is essential for assessing the reliability of conclusions drawn from the sample and for making inferences about the broader population, called the lot. |
| Sensor | A sensor is a device that detects physical phenomena (like temperature, pressure, light, or motion) and converts these measurements into electrical signals or data that can be interpreted. |
| Single Particle Test | Also known as Rock-by-Rock Test, Particle -by-Particle Test, Sensor Amenability Test, Foundation Test. Sometimes referred to as “Bench Scale Test”, but distinct from what is defined in this paper. |
| Sorting Index | The Sorting Index is a single dimensionless parameter to which the multivariate image/signal information is reduced for altering the cut-grade/cut-point of the separation. A strong correlation of Sorting Index to financial feature(s) means a technically reliable and effective separation, as well as flexibility for setting different cut-grades of the POS separation. |
| Technical feature | The technical feature denotes a distinct attribute, characteristic, or property of the ore which may be related to elemental composition, mineralogy, or texture. |
| Test Program | A test program combines multiple tests and potentially also test methodologies into a program for a specific project. |
| Test/ Test Run | A test or test run is a single stage, or multiple sorting stages combined for one test, which is applied to one feed sample. |
| Theory of Sampling | The Theory of Sampling (TOS) is a statistical framework originally developed by the French statistician and chemist Pierre Maurice Gy. It focuses on selecting a representative subset (sample) of a larger population, called the lot, to draw inferences about the entire population. |
| MUTotal Total Uncertainty | Total Uncertainty comprises Sampling and Analytical Uncertainty. It is not enough to optimize Analytical Uncertainty only. The Total Uncertainty threshold must include contributions from both sampling and analysis. The Total Uncertainty must be balanced with respect to all necessary costs and resources. For sensor-based estimation of the content, MUTotal comprises the Sensing and Signal Processing Uncertainty. |
| Validation | Validation is the process of evaluating a calibration model’s performance on a separate dataset that was not used during the training phase. This helps to assess how well the model generalizes to new, unseen data. Validation ensures that the model performs consistently and accurately across different datasets, indicating its robustness and reliability. |
| Variographic Characterization | Variography is a variability characterization of dynamic 1-dimensional lots. A variogram describes variability as a function of Increment pair spacing (in time). Variography is also applied in geostatistics in a different context. |
| Yield | In physical separation, yield refers to the proportion of the mass(flow), which is reported to the product fraction in relation to the mass(flow) of the feed. |
| Abbreviations | |
| BST | Bench Scale Test |
| CT | Cascade Test |
| CE | Classification Effectiveness |
| CSE | Correct Sampling Error |
| EM | Electromagnetic induction |
| HT | Heterogeneity Test |
| FSE | Fundamental Sampling Error |
| IHL | Intrinsic Heterogeneity of the Lot |
| IPE | Image Processing Effectiveness |
| ISE | Incorrect Sampling Error |
| LA | Liberation Analysis |
| LDT | Lot Dimensionality Transformation |
| LIBS | Laser Induced Breakdown Spectroscopy |
| LIF | Laser Induced Fluorescence |
| ME | Mechanical Effectiveness |
| MR | Magnetic Resonance |
| MUAnalysis | Analysis Measurement Uncertainty |
| MUSampling | Sampling Measurement Uncertainty |
| MUTotal | Total Measurement Uncertainty |
| NIR | Near-Infrared Spectrometry |
| NSR | Net Smelter Return |
| OEE | Overall Equipment Effectiveness |
| OEM | Original Equipment Manufacturer |
| PE | Process Errors |
| PGNAA | Prompt Gamma Neutron Activation Analysis |
| POS | Sensor-Based Particle Ore Sorting |
| PSE | Process Sampling Errors |
| PT | Process Test |
| RE | Replication Experiment |
| SBS | Sensor-based Ore Sorting |
| SFH | Sorter Feed Heterogeneity |
| SPT | Single Particle Test |
| SQO | Sampling Quality Objectives |
| TOS | Theory of Sampling |
| TSE | Total Sampling Error |
| TPE | Total Process Effectiveness |
| VAR | Variographic Characterization |
| XRF | X-ray Fluorescence |
| XRT | X-ray Transmission |
References
- Wotruba, H.; Harbeck, H. Sensor-Based Sorting. In Ullmann’s Encyclopedia of Industrial Chemistry; Wiley-VCH: Hoboken, NJ, USA; Wiley, 2010; ISBN 978-3-527-30385-4. [Google Scholar]
- Robben, C. Characteristics of Sensor-Based Sorting Technology and Implementation in Mining. Ph.D. Thesis, RWTH Aachen University, Aachen, Germany, 2014. [Google Scholar]
- Robben, C.; Wotruba, H. Sensor-Based Ore Sorting Technology in Mining—Past, Present and Future. Minerals 2019, 9, 523. [Google Scholar]
- Nielsen, B.; Rohleder, J.; Lehto, H.; Robben, C. Sensor-Based Ore Sorting to Maximise Profit in a Gold Operation. AusIMM Bull. 2018, 62–65. [Google Scholar]
- Ballantyne, G.R.; Hilden, M.; Bartram, K.; Souto, V. Characterising Energy Efficiency of Particle Sorting. In Proceedings of the 14th AusIMM Mill Operators’ Conference, Brisbane, Australia, 29–31 August 2018; pp. 1–12. [Google Scholar]
- Mitchell, P. Top 10 Business Risks and Opportunities for Mining and Metals in 2024, EY; EYGM Ltd.: Nassau, Bahamas, 2023; p. 63. [Google Scholar]
- Spuerk, S.; Drobe, M.; Lottermoser, B.G. Evaluating Resource Efficiency at Major Copper Mines. Miner. Eng. 2017, 107, 27–33. [Google Scholar] [CrossRef] [Scilit]
- Punkkinen, H.; Juvankoski, M.; Kaartinen, T.; Laine-Ylijoki, J.; Merta, E.; Mroueh, U.-M.; Mäkinen, J.; Niemeläinen, E.; Wahlström, M. Co-Disposal of Waste Rock with Tailings. Mine Closure. 2026. Available online: https://mineclosure.gtk.fi/co-disposal-of-waste-rock-with-tailings/ (accessed on 22 September 2025).
- Calvo, G.; Mudd, G.; Valero, A.; Valero, A. Decreasing Ore Grades in Global Metallic Mining: A Theoretical Issue or a Global Reality? Resources 2016, 5, 36. [Google Scholar] [CrossRef] [Scilit]
- Robben, C.; Noelte, S.; Rånman, K.E.; Rantamäki, M.P.; Takala, A. Sensor-Based Sorting Project Development and Semi-Mobile Processing for Hard Rock Metal Ores. In Proceedings of the XXVIII International Mineral Processing Congress (IMPC 2016), Quebec City, QC, Canada, 11–15 September 2016. [Google Scholar]
- Agricola, G. De Re Metallica Libri XII; Fourier Verlag GmbH: Wiesbaden, Germany, 2003. [Google Scholar]
- Robben, C.; Chieregati, A.C.; Condori, P. Embrace Heterogeneity—Create Value with Separation: Elaborations on Single Particle Analyses for Calibration and Validation Test Work and Sensor-Based Heterogeneity Testing. In Proceedings of the 11th World Conference on Sampling and Blending, Muldersdrift, South Africa, 21–23 May 2024; pp. 25–44. [Google Scholar]
- Dominy, S.C.; O’Connor, L.; Glass, H.J.; Purevgerel, S.; Xie, Y. Towards Representative Metallurgical Sampling and Gold Recovery Testwork Programmes. Minerals 2018, 8, 193. [Google Scholar] [CrossRef] [Scilit]
- Redwood, N.; Scott, M. Application of Enterprise Optimisation Considering Grade Engineering® Strategies; CRC ORE & Whittle Consulting: Surrey Hills, Australia, 2016; p. 59. [Google Scholar]
- AngloAmerican. Integrated Annual Report 2025; Anglo American: London, UK, 2025; 395p. [Google Scholar]
- Reple, A.; Chieregati, A.C.; Valery, W.; Prati, F. Bulk Ore Sorting Cut-off Estimation Methodology: Phu Kham Mine Case Study. Miner. Eng. 2020, 149, 105498. [Google Scholar] [CrossRef] [Scilit]
- Esbensen, K.H. The Fundamental Sampling Principle (FSP) for PAT. Sampl. Sci. Technol. 2025, 4, 42–53. [Google Scholar] [CrossRef] [Scilit]
- Kurth, H. Process Analytical Technologies for Representative Real Time Measurement of Conveyed Flows. Sampl. Sci. Technol. 2025, 4, 54–69. [Google Scholar] [CrossRef] [Scilit]
- Duffy, K.A.; Valery, W.; Jankovic, A.; Holtham, P.; Valle, R. Bulk Ore Sorting for Pre-Concentration: What, How, and Why? In Proceedings of the 11th International Mineral Processing Conference (Procemin 2015), Santiago, Chile, 21–23 October 2015; Available online: https://www.researchgate.net/profile/Walter-Valery-2/publication/309722479_Bulk_ore_sorting_for_pre-concentration_what_how_and_why/links/581f0e8e08ae12715af600cd/Bulk-ore-sorting-for-pre-concentration-what-how-and-why.pdf (accessed on 1 December 2025).
- Carrasco, C.; Keeney, L.; Walters, S.G. Development of a Novel Methodology to Characterise Preferential Grade by Size Deportment and Its Operational Significance. Miner. Eng. 2016, 91, 100–107. [Google Scholar] [CrossRef] [Scilit]
- Robben, C.; Condori, P.; Pinto, A.; Machaca, R.; Takala, A. X-Ray-Transmission Based Ore Sorting at the San Rafael Tin Mine. Miner. Eng. 2020, 145, 105870. [Google Scholar]
- Rutledge, J.; Robben, C.; Bergmann, J. Victories and Lessons Learned at Ma’aden: The Largest Sensor-Based Sorting Plant in the World. In Proceedings of the MINEXCHANGE 2020 SME Annual Conference & Expo, Phoenix, AZ, USA, 23–26 February 2020. [Google Scholar]
- Robben, C.; Mosser, A. X-Ray-Transmission-Based Sorting at the Mittersill Tungsten Mine. In Proceedings of the 27th International Mineral Processing Conference IMPC, Santiago, Chile, 20–24 October 2014. [Google Scholar]
- Robben, C.; Girard, D.; Cline, H.; Takala, A.; Hahn Str, O. X-Ray-Transmission Sorting at the Kensington Gold Mine. In Proceedings of the COM2017, The Conference of Metallurgists Hosting World Gold & Nickel Cobalt Proceedings, Vancouver, BC, Canada, 27–30 August 2017; pp. 27–30. [Google Scholar]
- Gy, P. Sampling of Particulate Materials Theory and Practice; Elsevier: Amsterdam, The Netherlands, 1982; ISBN 978-0-444-41609-4. [Google Scholar]
- Pitard, F.F. Theory of Sampling and Sampling Practice; Chapman and Hall/CRC: Boca Raton, FL, USA, 2019. [Google Scholar]
- Dansk Standard. Representative Sampling–Horizontal Standard (Standard No. DS 3077:2024). 2024. Available online: https://webstore.ansi.org/standards/ds/ds30772024 (accessed on 24 April 2026).
- François-Bongarçon, D. Theory of Sampling and Geostatistics: An Intimate Link. Chemom. Intell. Lab. Syst. 2004, 74, 143–148. [Google Scholar] [CrossRef] [Scilit]
- Dominy, S.C. Predicting the Unpredictable—Evaluating High-Nugget Effect Gold Deposits. In Mineral Resource and Ore Reserve Estimation; Australasian Institute of Mining and Metallurgy: Melbourne, VIC, Australia, 2014; pp. 659–678. [Google Scholar]
- Dominy, S.C.; Graham, J.C.; Esbensen, K.H.; Purevgerel, S. Application of PhotonAssayTM to Coarse-Gold Mineralisation—The Importance of Rig to Assay Optimisation. Sampl. Sci. Technol. 2024, 2, 2–30. [Google Scholar] [CrossRef] [Scilit]
- Tusa, L.; Frenzel, M.; Pereira, L.; Thiele, S.; Tolosana-Delgado, R.; Gutzmer, J. Geometallurgy: Future Directions. In Geology and Mining: Evolution of Best Practice; Wood, D.A., Hedenquist, J., Eds.; Society of Economic Geologists: Littleton, CO, USA, 2025; ISBN 978-1-62949-432-6. [Google Scholar]
- Dominy, S.C.; O’Connor, L.; Parbhakar-Fox, A.; Glass, H.J.; Purevgerel, S. Geometallurgy—A Route to More Resilient Mine Operations. Minerals 2018, 8, 560. [Google Scholar] [CrossRef] [Scilit]
- Johnston, A. Geomet with Cancha Stocholm 2026; Training Documentation; Transmin Cancha Geometallurgy: Lima, Peru, 2026. [Google Scholar]
- Hanks, J.; Barratt, D. Sampling a Mineral Deposit for Metallurgical Testing and the Design of Comminution and Mineral Separation Processes. In Proceedings of the Mineral Processing Plant Design, Practice and Control, Vancouver, BC, Canada, 20–24 October 2002; pp. 99–116. [Google Scholar]
- Robben, C.; Wotruba, H.; Robben, M.; Von Ketelhodt, L.; Kowalczyk, M. Potential of Sensor-based Sorting for the Gold Mining Industry. CIM J. 2013, 4, 191–200. [Google Scholar]
- Robben, C.; Dumont, J.A.; Lemos, M. Sensor-Based Ore Sorting Methodology Investigation Applied to Gold Ores. In Proceedings of the Procemin-Geomet 2017, Santiago, Chile, 4–6 October 2017; pp. 596–603. [Google Scholar]
- Chieregati, A.C.; Prado, G.C.; Fernandes, F.L.; Villanova, F.L.; Dominy, S.C. A Comparison between the Standard Heterogeneity Test and the Simplified Segregation Free Analysis for Sampling Protocol Optimisation. Minerals 2023, 13, 680. [Google Scholar] [CrossRef] [Scilit]
- Dominy, S.C.; Xie, Y. Optimising Sampling Protocols via the Heterogeneity Test: Challenges in Coarse Gold Mineralisation. Min. Technol. 2016, 125, 103–113. [Google Scholar] [CrossRef] [Scilit]
- Klein, B.; Bamber, A. Mineral Sorting. In Mineral Processing and Extractive Metallurgy Handbook; Society for Mining, Metallurgy & Exploration (SME): Englewood, CO, USA, 2019; pp. 763–786. [Google Scholar]
- Mazhary, A. Amenability of Low-Grade Ore Stockpiles to Sensor-Based Ore Sorting Technology. Ph.D. Thesis, University of British Columbia, Vancouver, BC, Canada, 2017. [Google Scholar]
- Duncan, M.; Deglon, D. A Methodology to Determine the Potential for Particulate Ore Sorting Based on Intrinsic Particle Properties. Minerals 2022, 12, 630. [Google Scholar] [CrossRef] [Scilit]
- Moslemiyekan, A.; Robben, C.; Condori, P.; Beckmann, M. Simulation of XRT-sorting total process efficiency and evaluation of flow-sheet options for the San Rafael cassiterite ore. Proceedings of Physical Separation ’22, MEI Conferences, Virtual, 9–11 May 2022. [Google Scholar]
- Nakajima, S. Introduction to TPM: Total Productive Maintenance; Productivity Press, Inc.: Cambridge, MA, USA, 1988. [Google Scholar]
- Kennedy, R.K. Understanding, Measuring, and Improving Overall Equipment Effectiveness: How to Use OEE to Drive Significant Process Improvement; Productivity Press: New York, NY, USA, 2017; ISBN 978-1-315-16695-7. [Google Scholar]
- OEE. Vorne Industries Six Big Losses in Manufacturing. Available online: https://www.oee.com/oee-six-big-losses/ (accessed on 24 April 2026).
- Downie, W. Application of a Net Smelter Return Model within a Polymetallic Base Metal Processing Plant. In Proceedings of the MetPlant 2019, Perth, Australia, 9–10 September 2019; Australasian Institute of Mining and Metallurgy: Perth, Australia, 2019; pp. 339–354. [Google Scholar]
- Esbensen, K.H.; Geladi, P. Principles of Proper Validation: Use and Abuse of Re-sampling for Validation. J. Chemom. 2010, 24, 168–187. [Google Scholar] [CrossRef] [Scilit]
- Geladi, P.; Grahn, H. Multivariate Image Analysis; John Wiley & Sons: Hoboken, NJ, USA, 1997. [Google Scholar]
- Esbensen, K.H.; Swarbrick, B. Multivariate Data Analysis: An Introduction to Multivariate Analysis, Process Analytical Technology and Quality by Design; Camo: Oslo, Norway, 2018. [Google Scholar]
- Noren, B. Mandalay Resources Björkdalsgruvan. In Proceedings of the Euro Mine Expo, Skelleftea, Sweden, 14–16 June 2016. [Google Scholar]
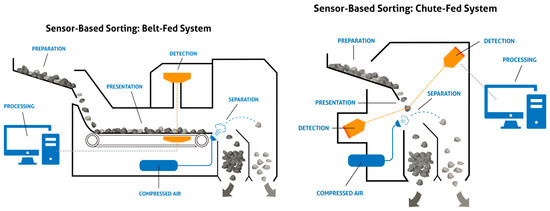
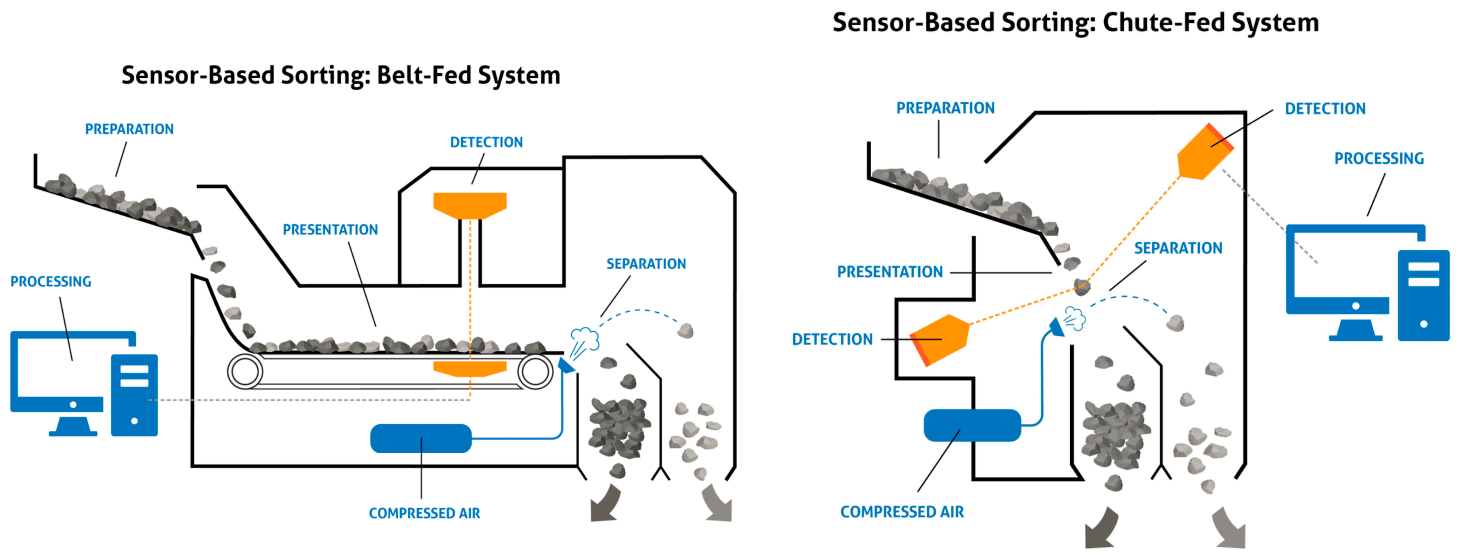
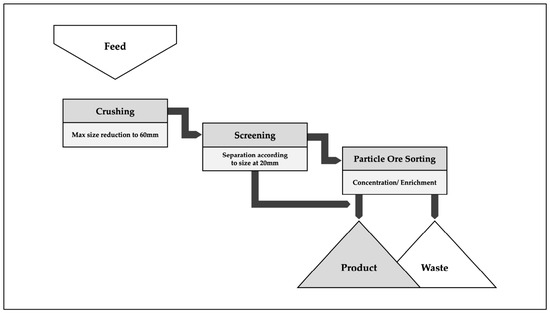
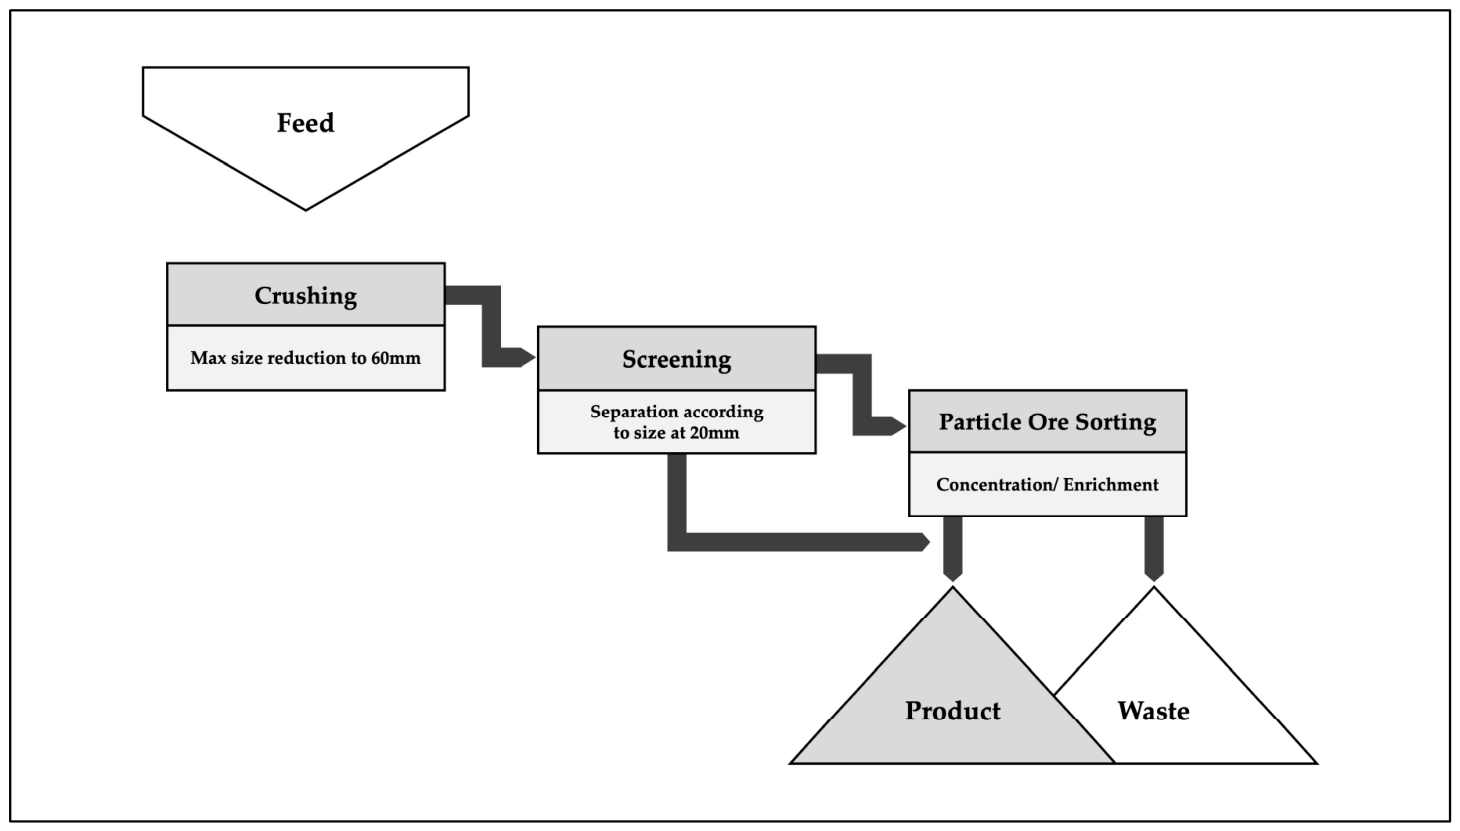
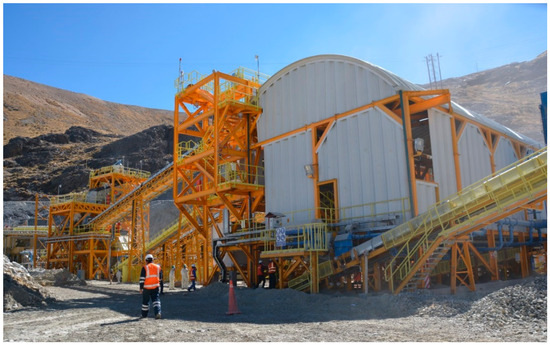
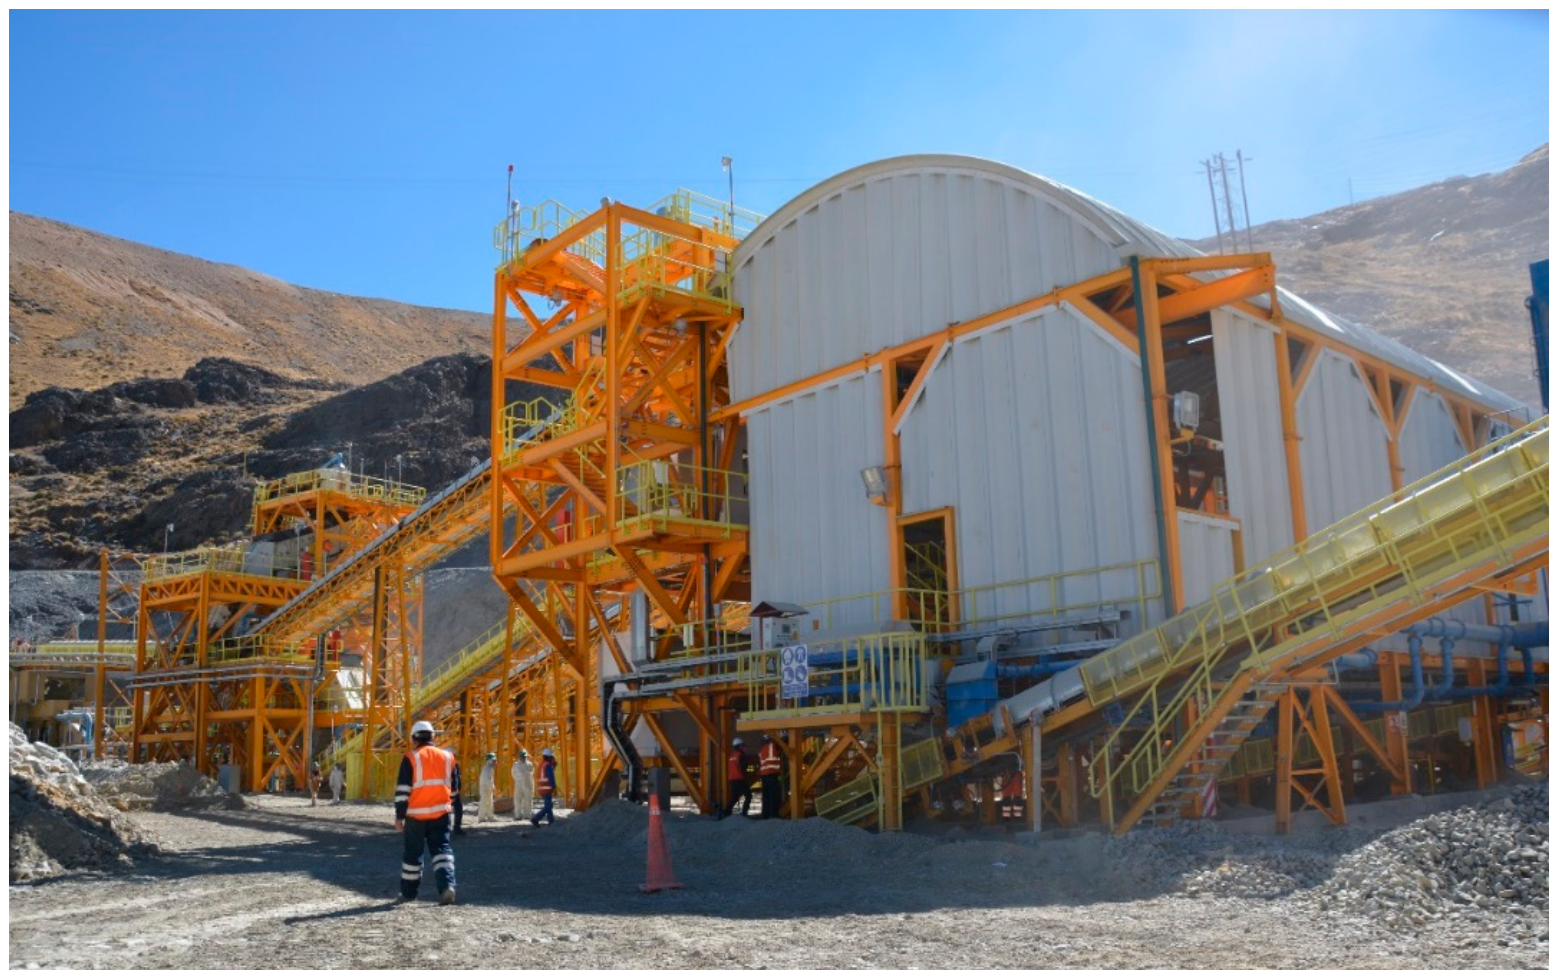
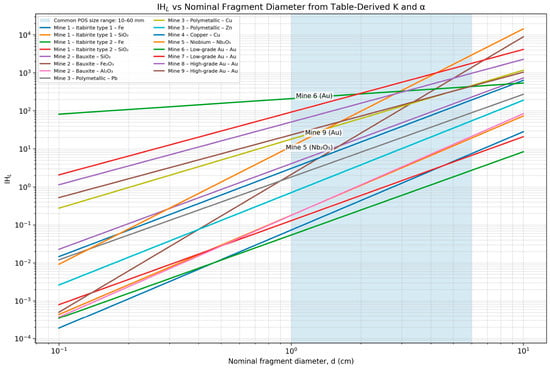
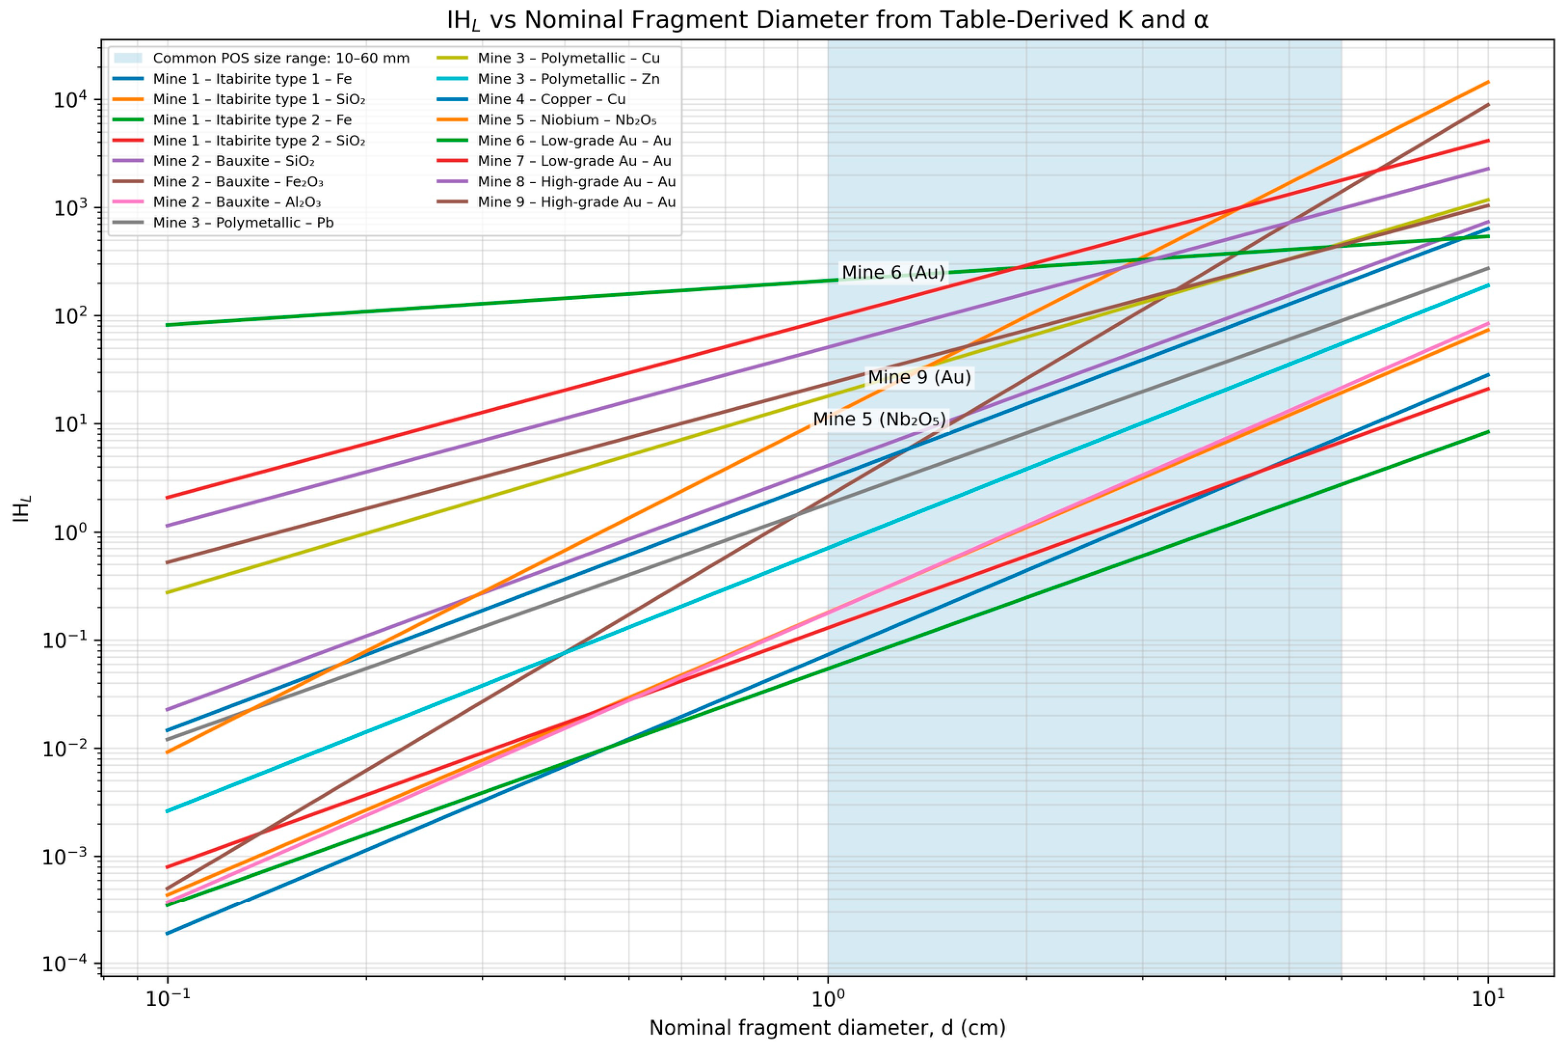
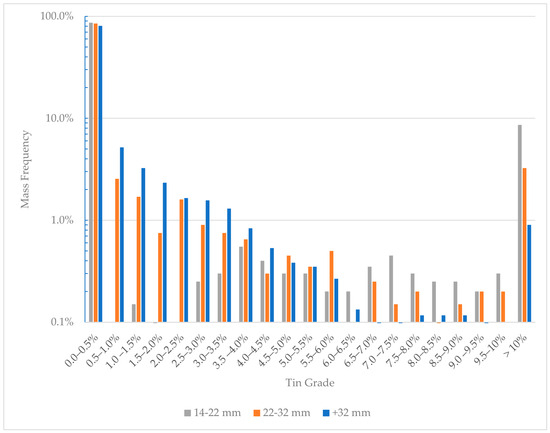
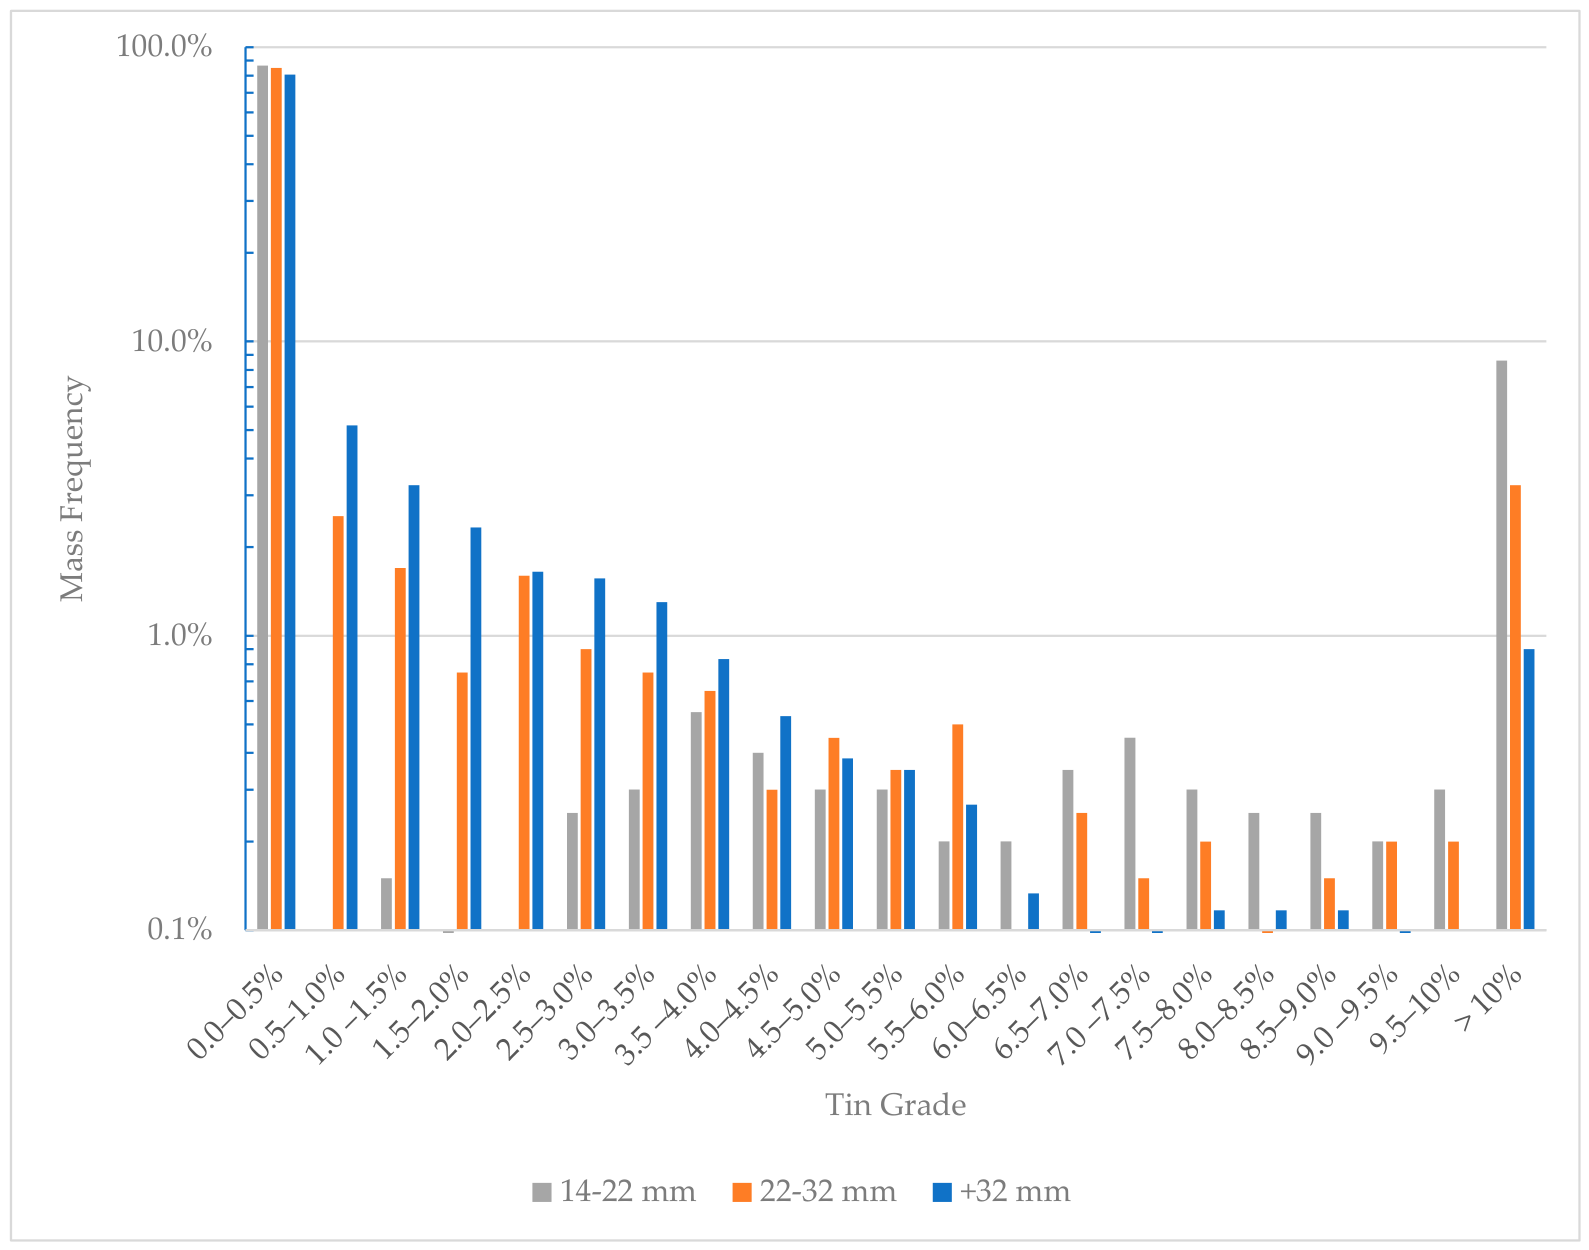
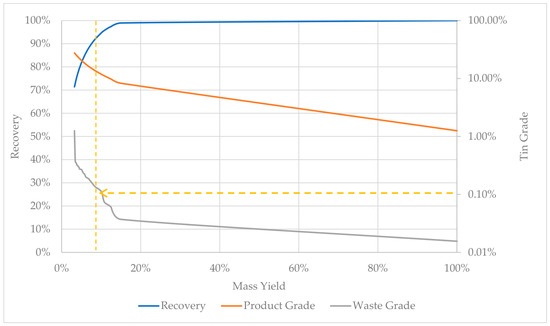
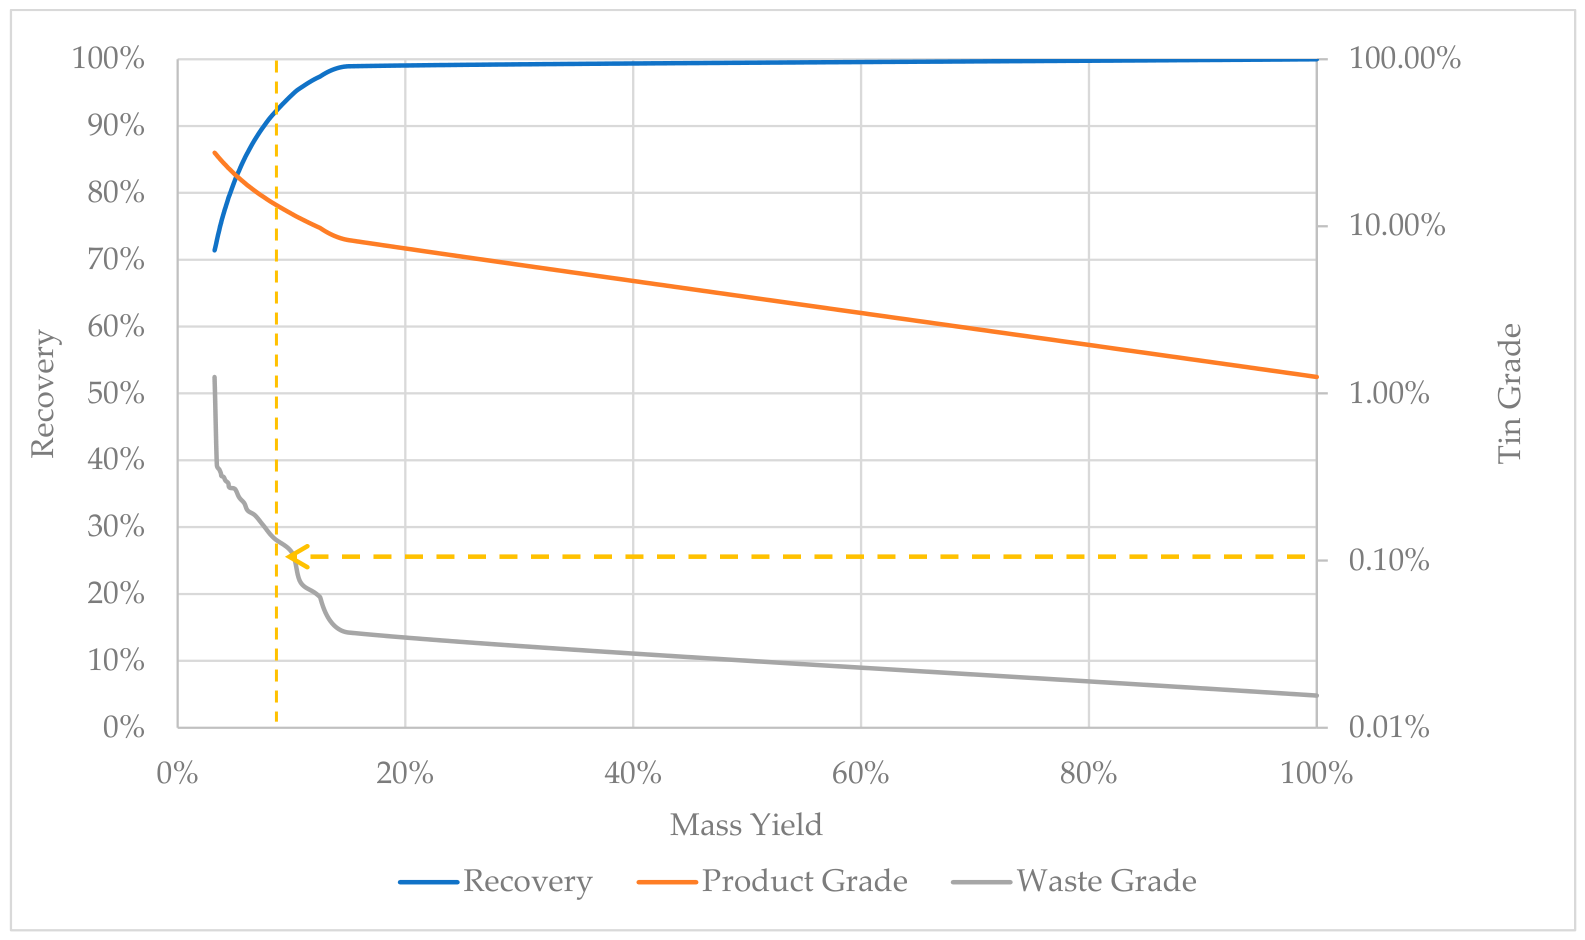
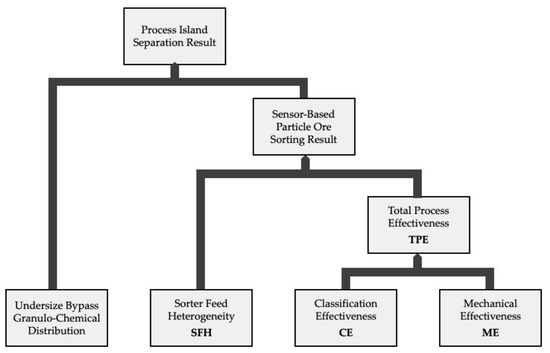
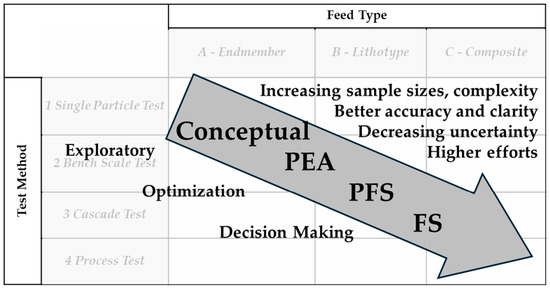
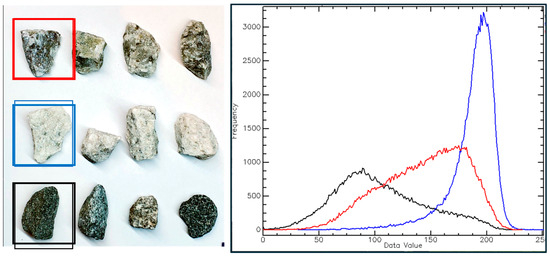
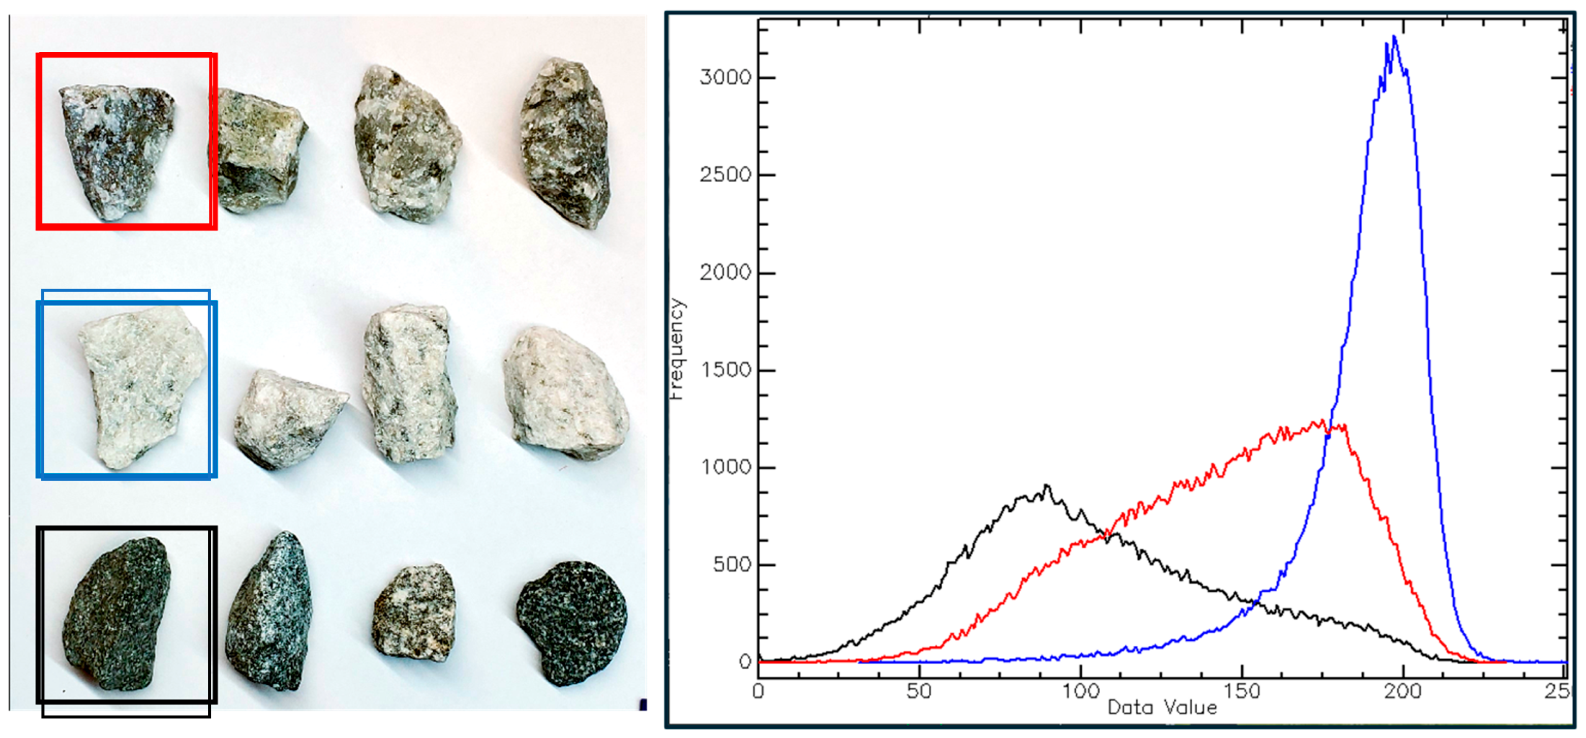
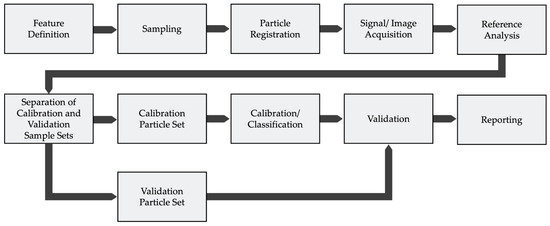
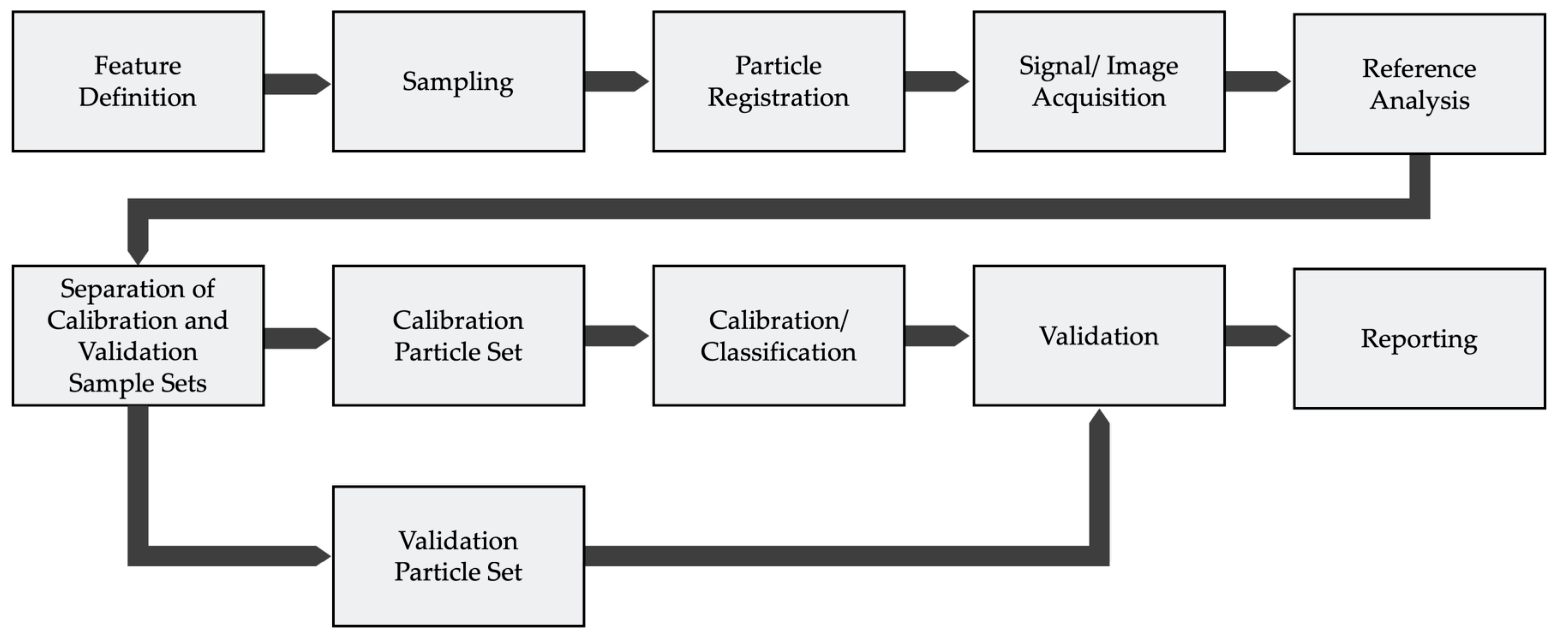
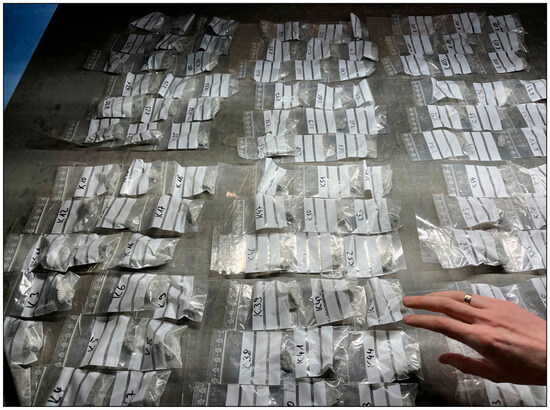
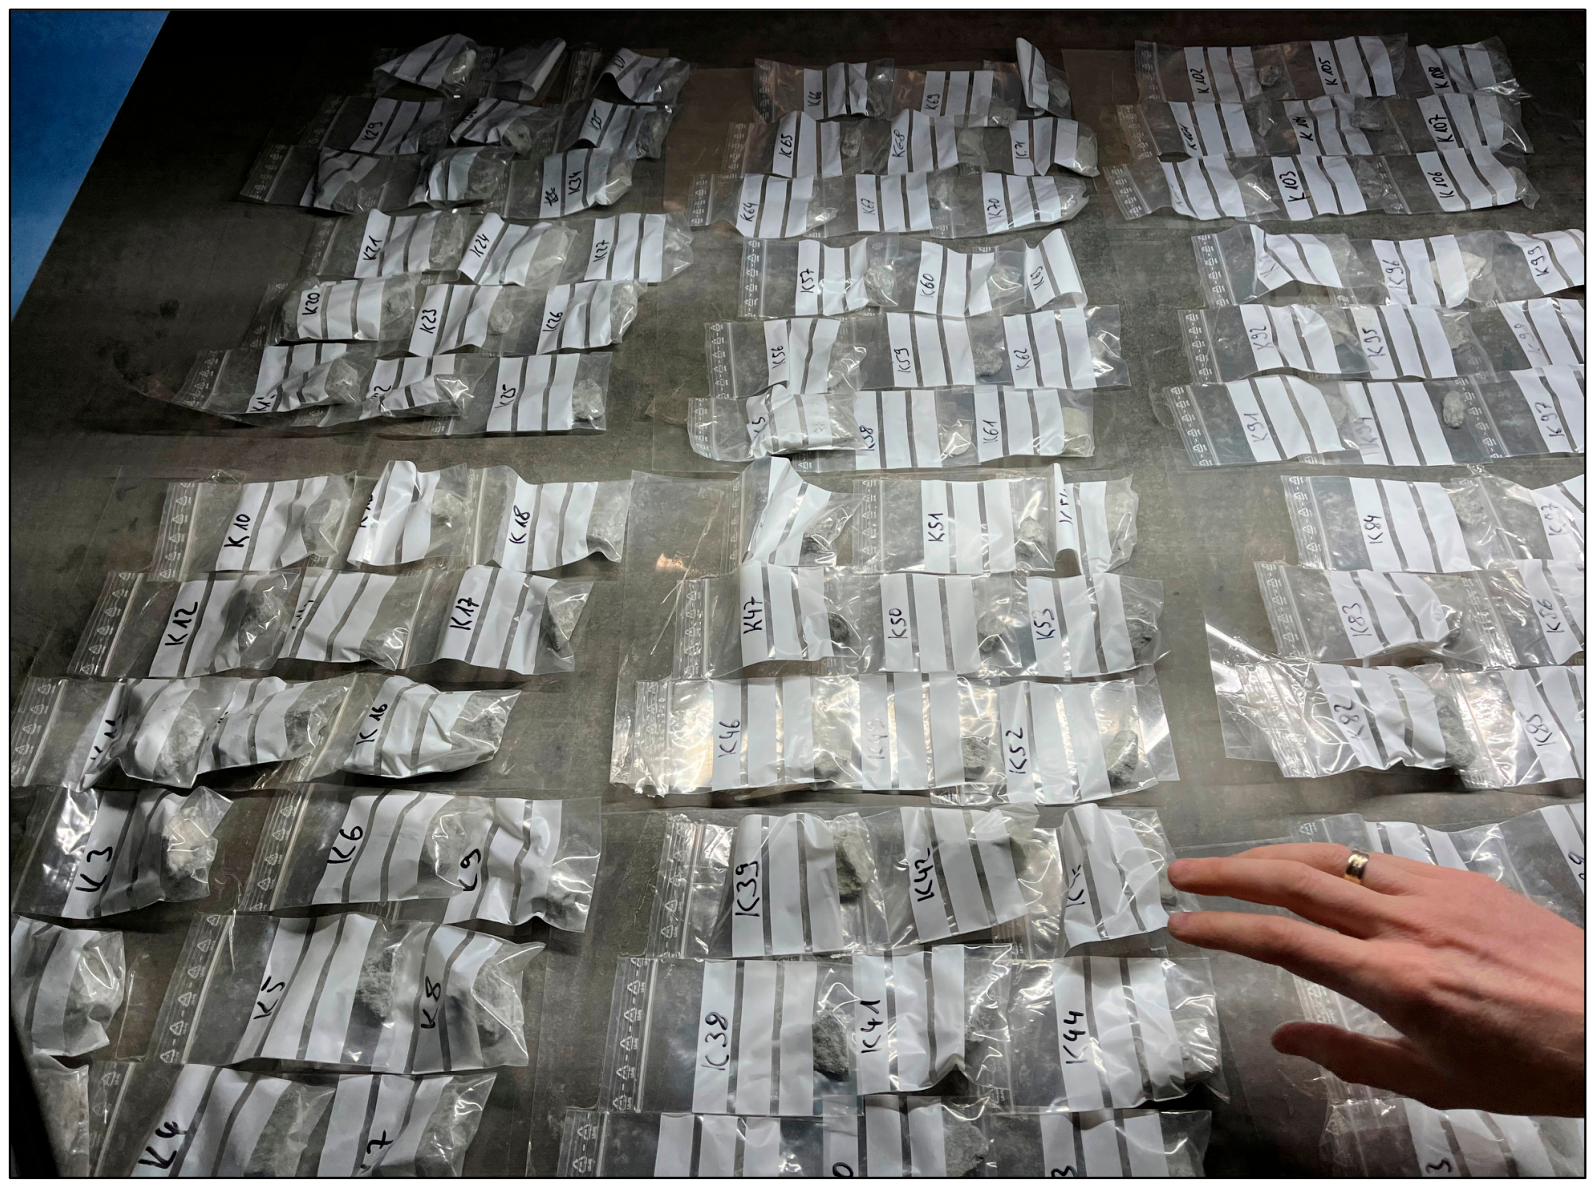
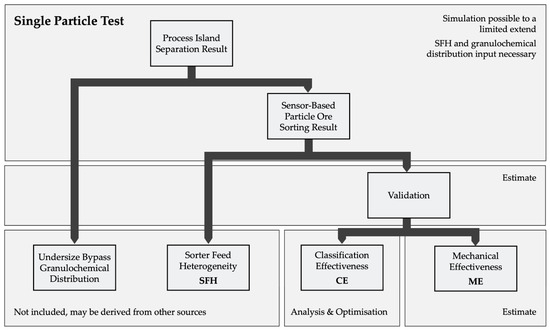
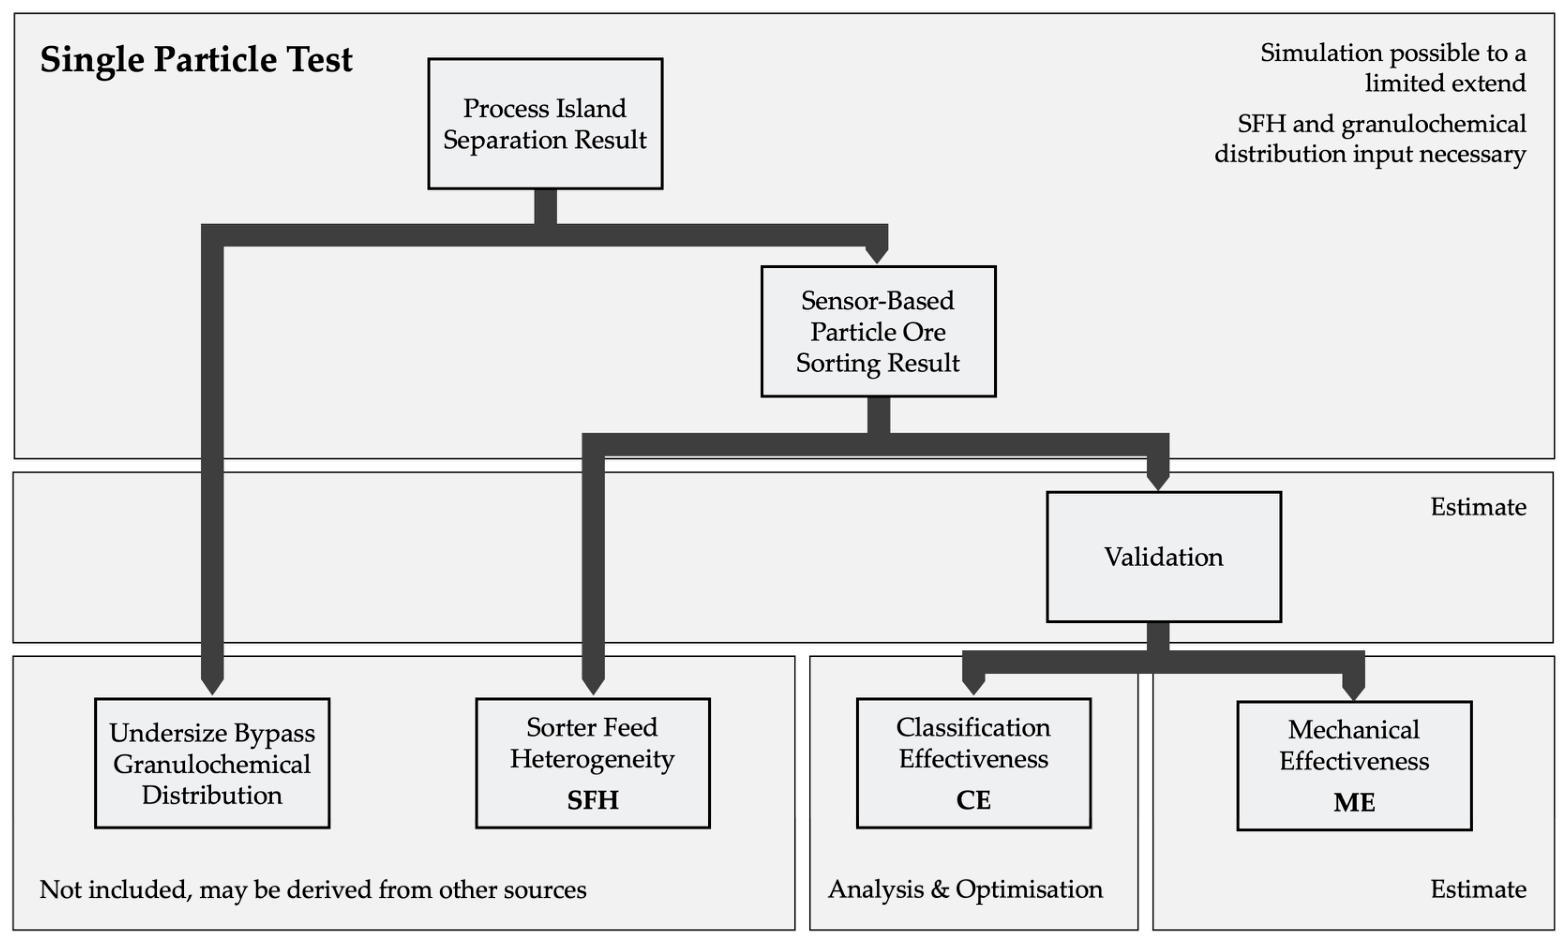
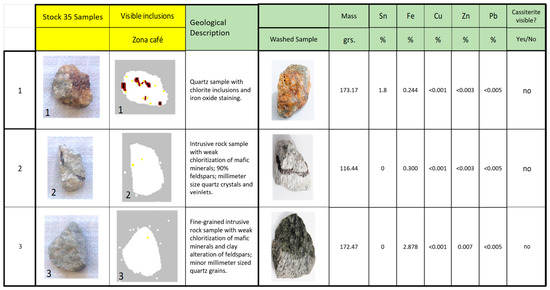
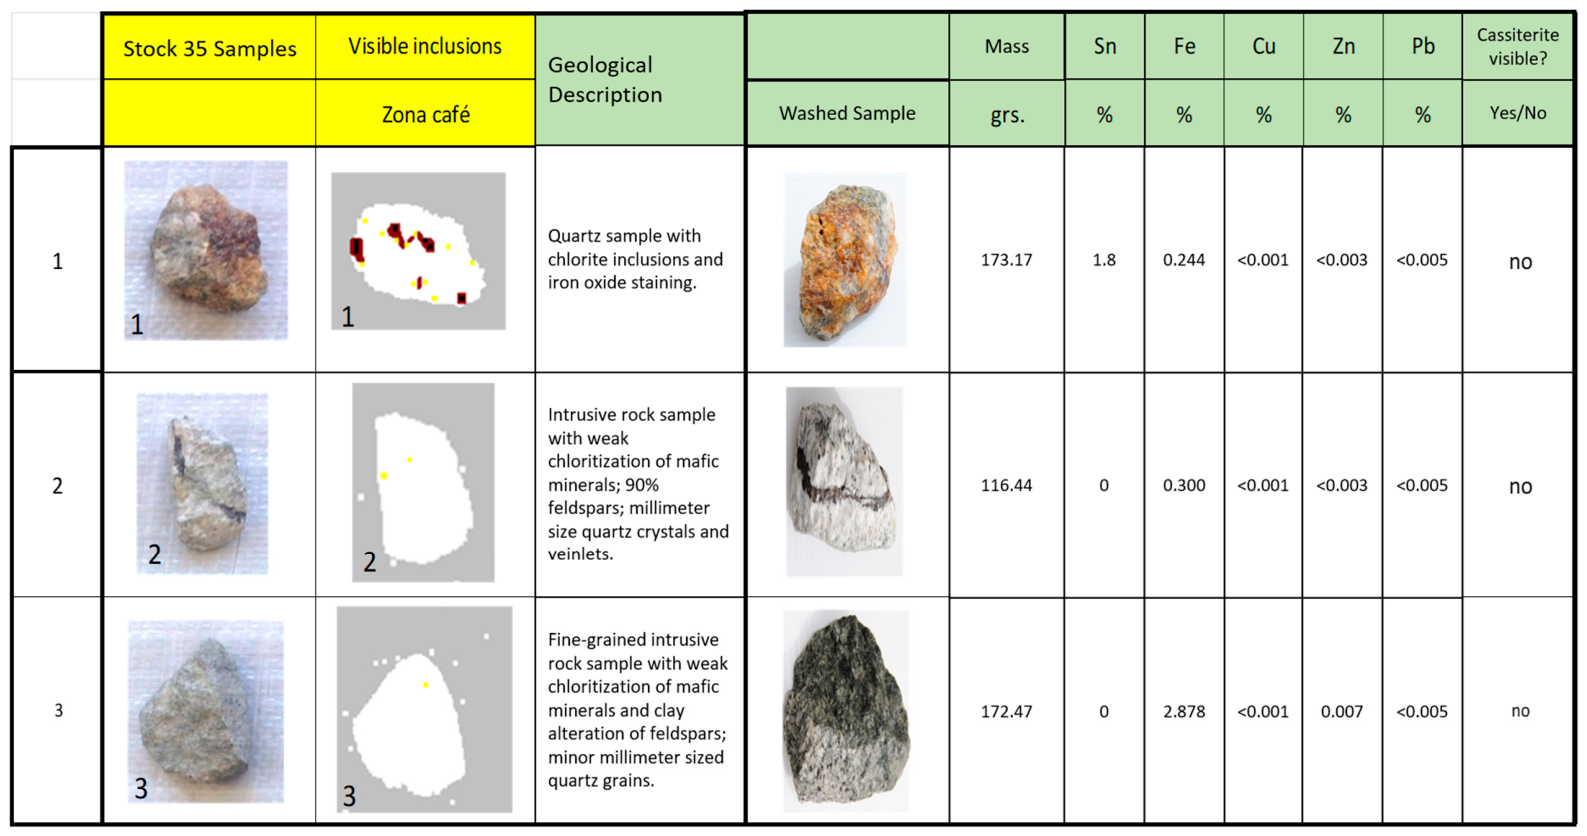
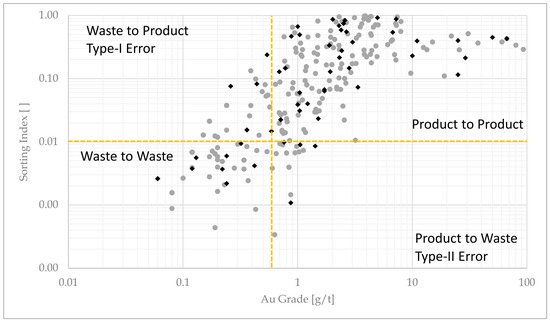
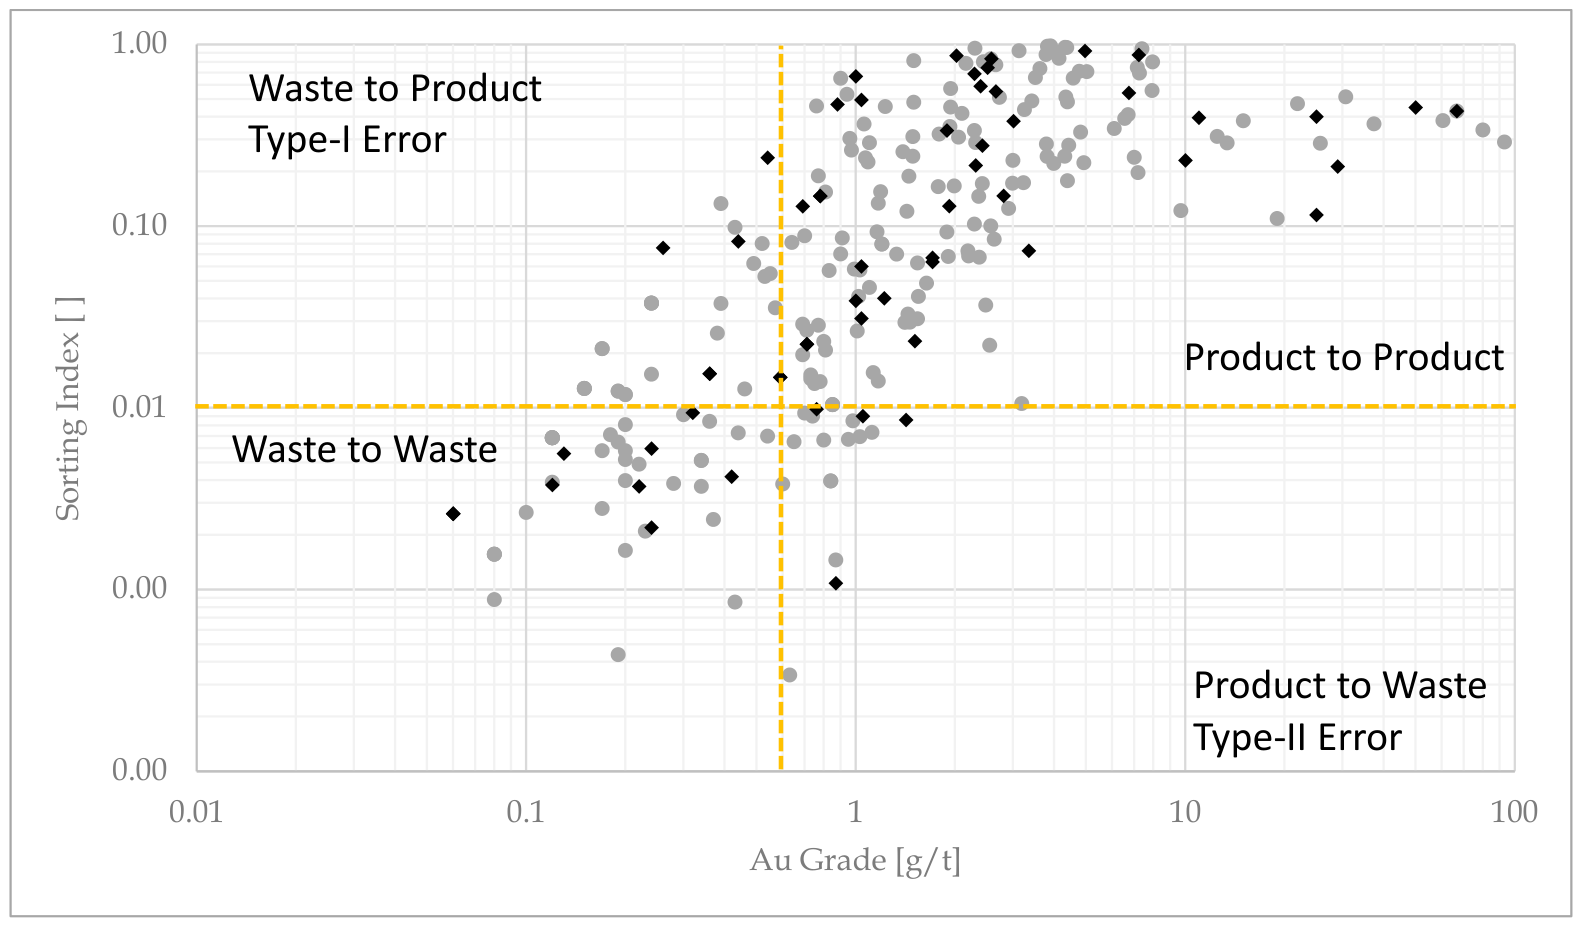
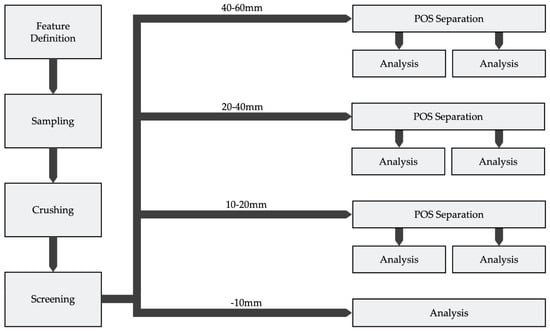
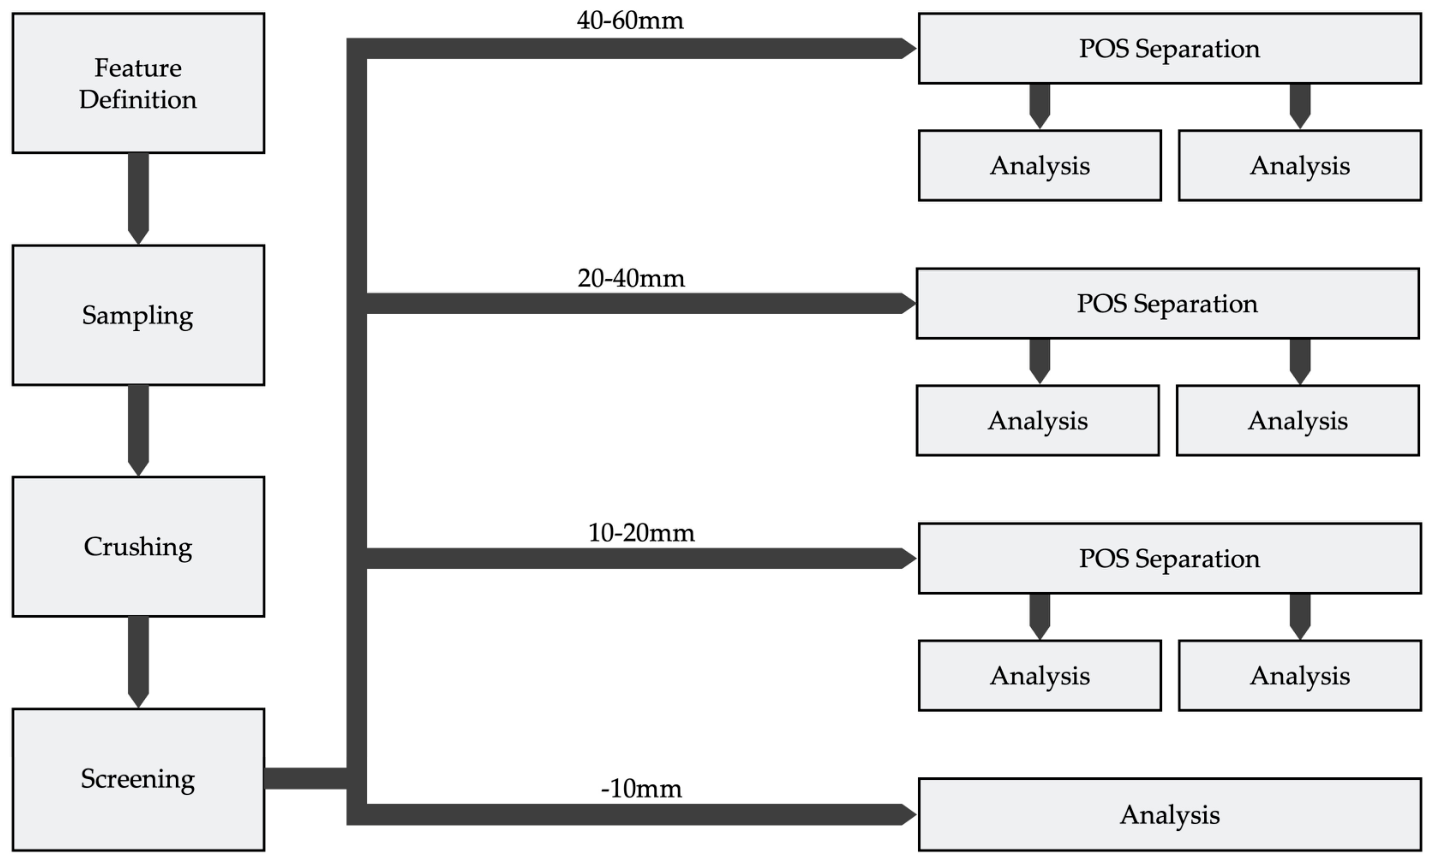
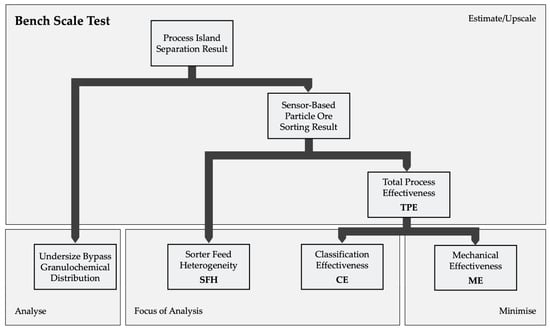
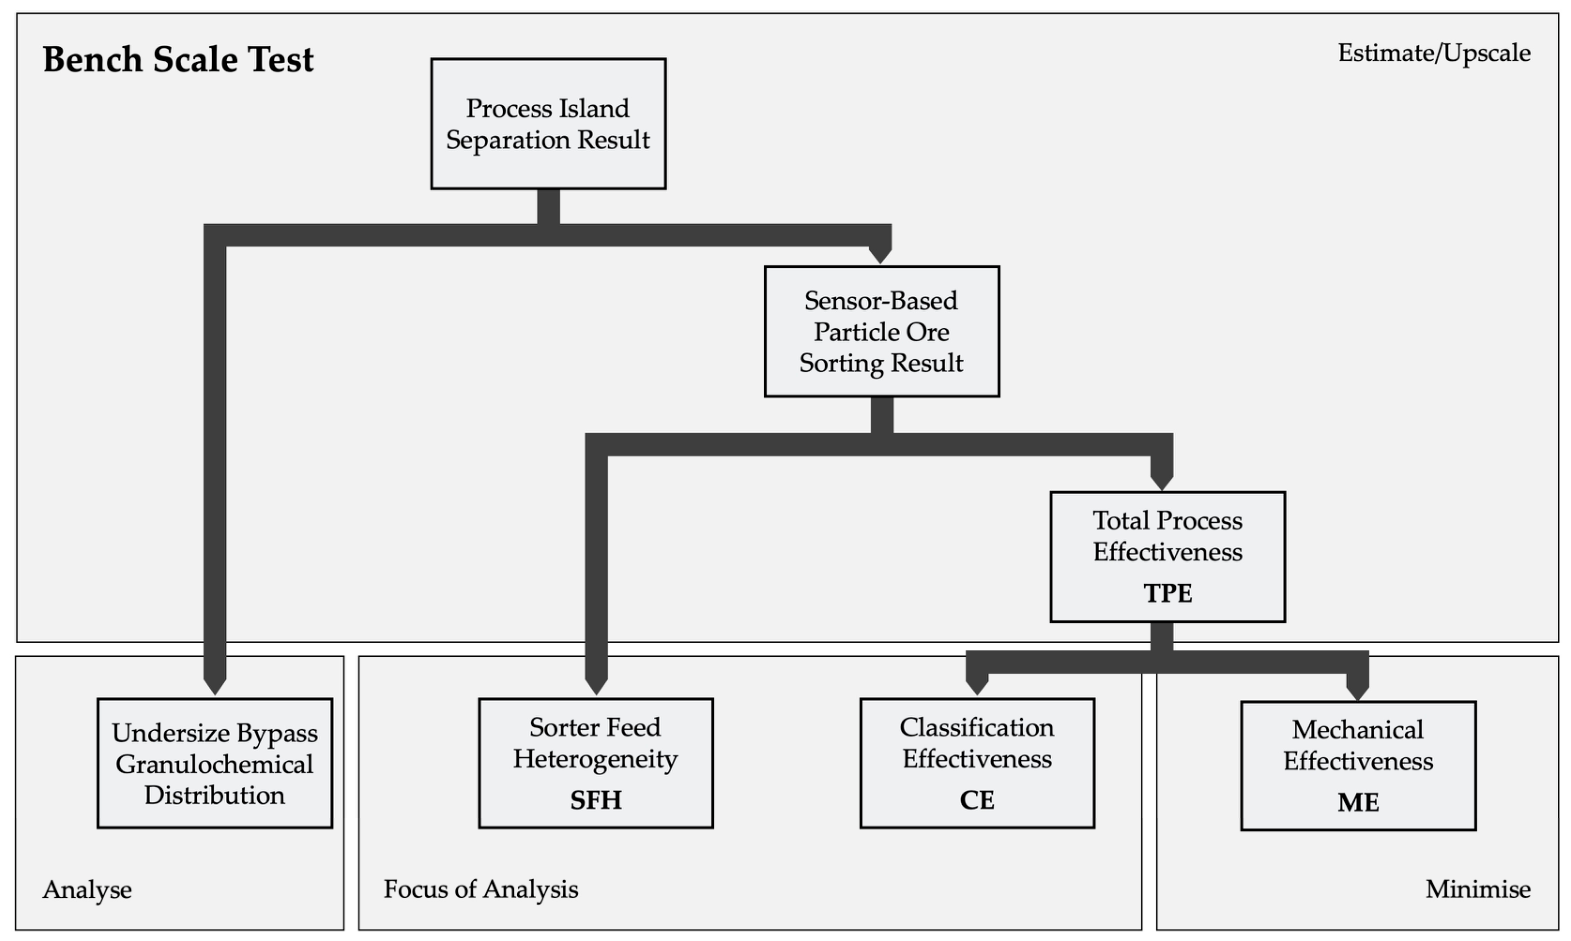
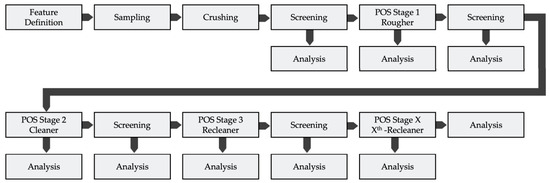
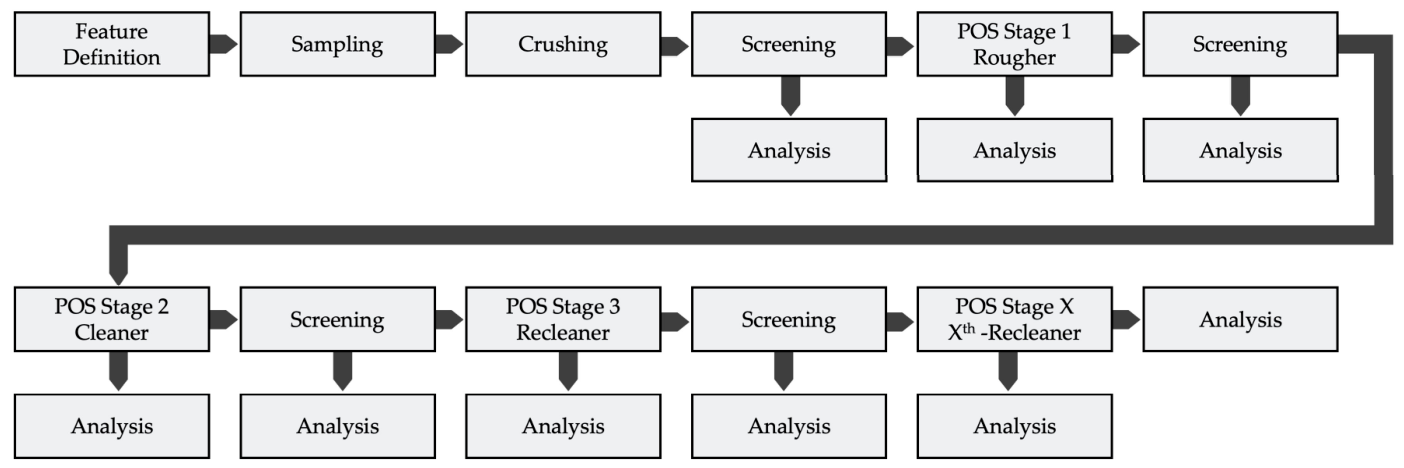
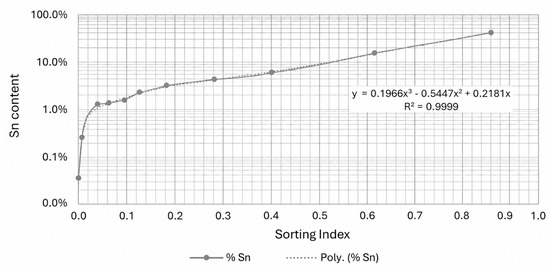
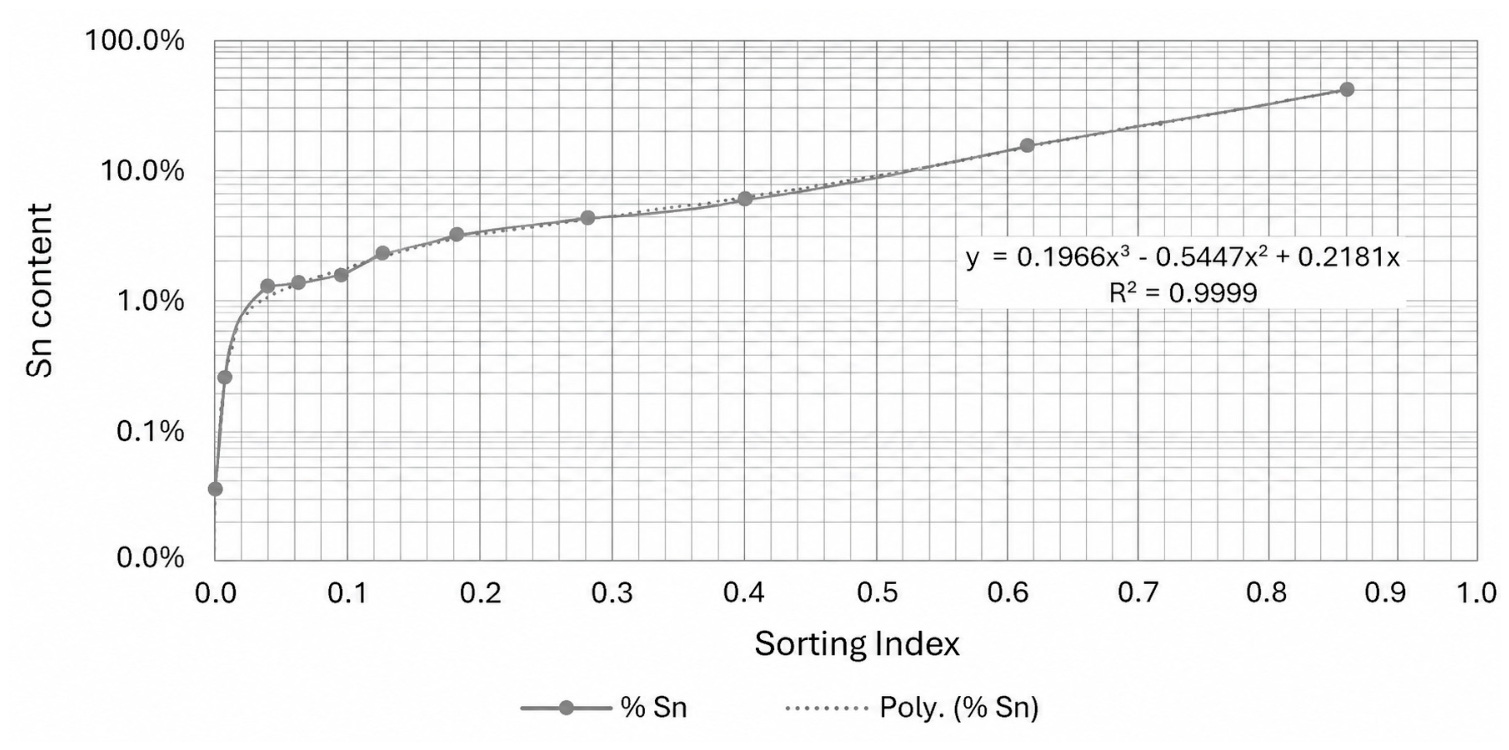
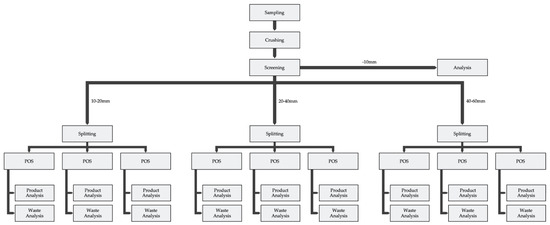
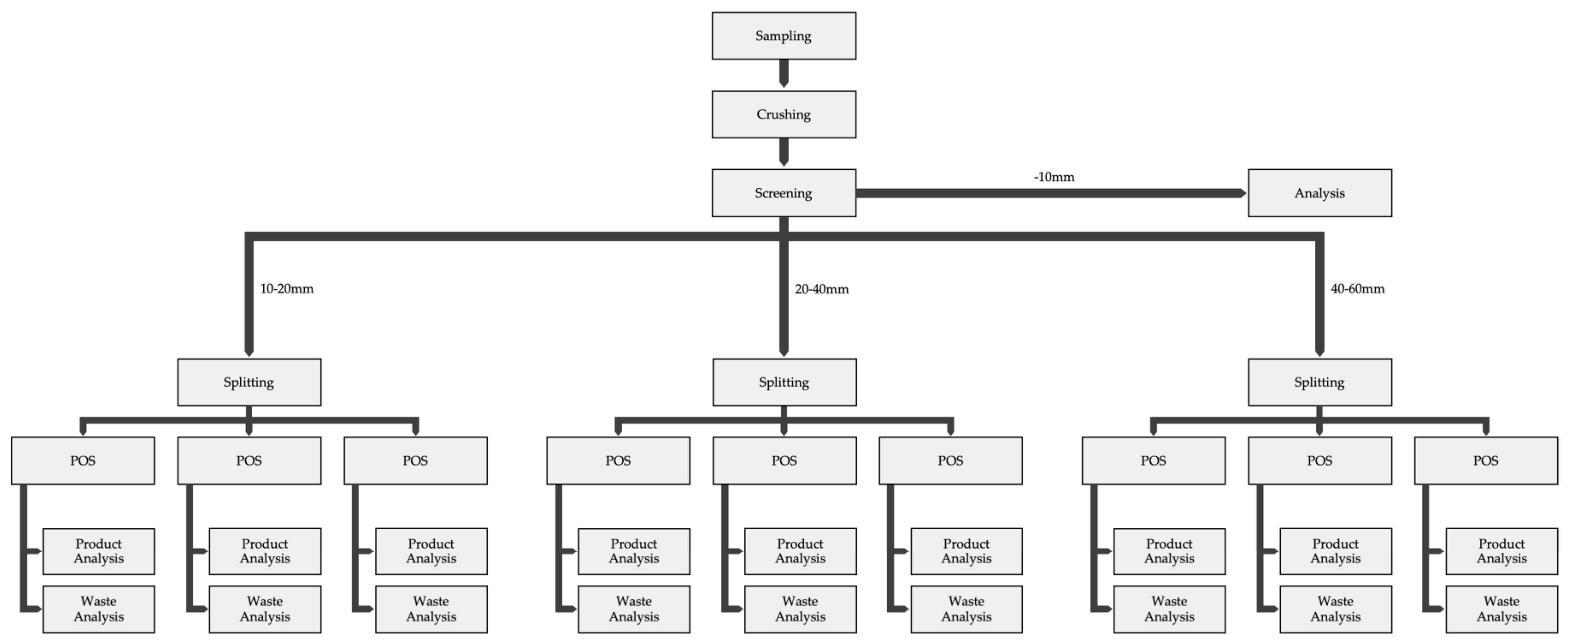
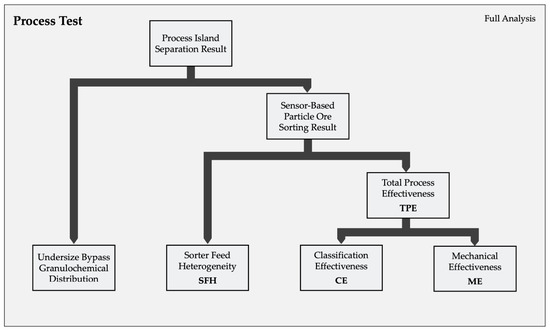
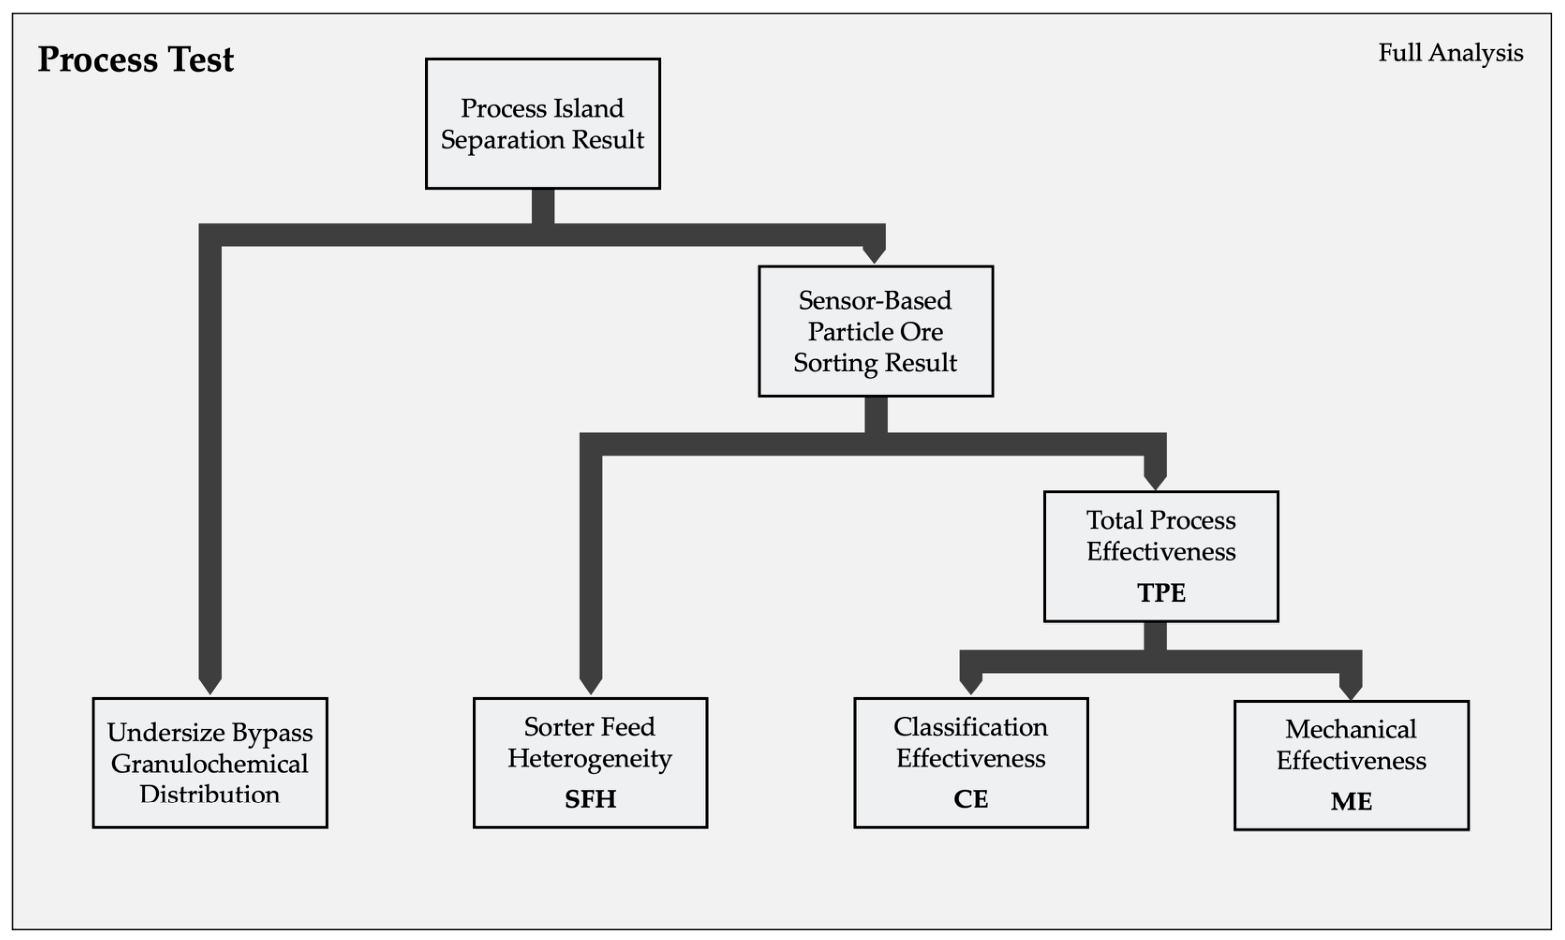

Disclaimer/Publisher’s Note: The statements, opinions and data contained in all publications are solely those of the individual author(s) and contributor(s) and not of MDPI and/or the editor(s). MDPI and/or the editor(s) disclaim responsibility for any injury to people or property resulting from any ideas, methods, instructions or products referred to in the content. |
© 2026 by the authors. Licensee MDPI, Basel, Switzerland. This article is an open access article distributed under the terms and conditions of the Creative Commons Attribution (CC BY) license.