


Abstract
Crystal size distributions (CSDs) of metamorphic minerals provide quantitative constraints on nucleation-growth kinetics and metamorphic thermal regimes. Early interpretations linked CSD shape to type of metamorphism, associating near-linear CSDs with rapid-contact metamorphism and bell-shaped CSDs with prolonged regional metamorphism. Subsequent works showed that diffusion-controlled nucleation and growth can also produce bell-shaped CSDs without annealing, leaving unresolved how contrasting thermal regimes are expressed in interface-controlled systems. The Fangshan tectonic dome at the northern margin of the North China Craton comprises multiple metamorphic zones, recording Mesozoic contact metamorphism of Fangshan plutons and a concealed pluton in the Nanjiao area. We employed high-resolution X-ray micro-computed tomography (micro-CT) to quantify the 3D crystal size distributions of garnets of contact metamorphic samples from the Nanjiao area and the Fangshan contact aureole. Integrated 3D CSDs with spatial statistics, reconstructed nucleation curves, garnet compositional zoning, and thermodynamic phase equilibrium modeling were used to decipher crystallization kinetics in interface-controlled systems. Nucleation and growth of garnets from the Nanjiao area, and one sample from the Fangshan contact aureole, which is separated from the main heat source by an earlier intruded magma body, are interface-controlled, and display bell-shaped CSDs together with sigmoidal nucleation curves that record a progressive increase followed by a gradual decline in nucleation rate. Phase equilibrium modeling and garnet compositional profiles of a sample from Nanjiao demonstrate that the late-stage deceleration of nucleation in interface-controlled systems is fundamentally driven by whole-rock constituents’ exhaustion rather than the geometric impingement of diffusion halos. In contrast, another contact sample, which is collected near the main heat source, is diffusion-controlled, and displays a steep J-shaped nucleation curve with a delayed, broad peak nucleation rate followed by rapid late-stage suppression. The 3D textures of these metamorphic rocks suggest that contact and regional thermal regime alone do not determine garnet population characteristics; bell-shaped CSDs can be produced in contact metamorphic environments. We propose that heating rate is the primary control on the resulting crystal size distributions.
1. Introduction
The crystal size distributions of metamorphic minerals provide fundamental constraints on the nucleation and growth kinetics of these minerals and have been widely used to infer metamorphic reaction progress, the efficiency of chemical constituent transport through the intergranular medium, and thermal regimes during metamorphism [1,2,3,4,5,6]. Cashman and Ferry [2] suggest that different thermal regimes result in distinct crystal size characteristics. They propose that the short, high-temperature contact metamorphism produces a linear CSD curve dominated by small crystals. In contrast, regional metamorphism involves prolonged cooling where annealing and Ostwald ripening cause smaller crystals to dissolve and their constituents to be incorporated into larger-growing grains, shifting the peak frequency to intermediate sizes and generating a bell-shaped CSD curve.
The formation of a new mineral phase can be simplified into three steps of reaction: (1) breakdown of the reactant minerals to release constituents for new minerals to nucleate and grow, (2) transport of constituents via the intergranular fluid to the nucleation and growth sites, (3) constituents attached at the surface of the product mineral through nucleation and growth processes [7,8]. The overall rate of mineral growth is determined by the slowest process [9]. Interfacial and diffusional controlled nucleation and growth are the two major crystallization mechanisms [7]. Thus, diffusional-transport of constituents through the medium and interface reactions on the mineral production site are the two main rate-limiting mechanisms for nucleation and growth of new minerals [3,7,10]. In diffusion-controlled nucleation and growth, crystallization is hindered by the transport of constituents through a medium. For interface-controlled nucleation and growth, the nucleation and growth rates of new minerals are primarily controlled by the rate of chemical reactions occurring at the crystal surface [11].
Diffusion-controlled growth of crystals creates constituent depletion zones around them [3,11,12]. Within this depletion region, the nucleation concentration probability drops to zero and gradually recovers to background levels outwardly [3,11]. Carlson [3] used this discovery to explain the spatial ordering of crystals and the typical bell-shaped CSDs observed in many metamorphic rocks formed by regional or contact metamorphism, where nucleation is forced to cease in the late metamorphic stage due to the mutual impingement of diffusion domains. Carlson argued that Ostwald ripening is not feasible in natural systems, because bell-shaped CSD curves had also been observed in diffusion-controlled rock systems without Ostwald ripening [3,13]. Furthermore, metamorphic environments characterized by high pressure and relatively low temperature (<350 °C) also uniquely influence crystallization kinetics. In such cold regimes, sluggish kinetics and limited thermal budgets tend to favor the continuous nucleation of small-sized minerals along the prograde path rather than extensive grain growth [14,15]. Despite these advances in understanding diffusion-controlled and high-pressure low-temperature systems, it remains unclear how different thermal regimes (i.e., regional and contact metamorphism) influence the CSD characteristics of interface-controlled systems.
The Fangshan dome in the northern margin of the North China Craton provides a natural laboratory to address this problem. The dome comprises a zoned earlier contact metamorphic envelope overprinted by contact aureoles around a diorite pluton in the Nanjiao area, and a contact aureole around the Fangshan pluton [16,17,18]. In this study, high-resolution X-ray micro-computed tomography (μ–CT) was employed to conduct quantitative 3D textural analysis of garnets from the Nanjiao area and Fangshan contact aureole. By combining crystal size distribution, spatial statistics, nucleation curve, mineral chemistry, and thermal dynamic modeling, we aim to decipher the crystallization kinetics in interface-controlled systems.
2. Geological Settings
The North China Craton (NCC) is bounded by the Qinling-Dabie orogenic belt to the south, and by the Central Asian orogenic belt (Mongolo-Okhotsk accretionary belt) to the north. The NCC was formed by collision of the Western Block (Ordos Block) and Eastern Block (Yanliao Block) along the Trans North China Orogen (also known as the Central Orogenic Belt), and finally amalgamated to become a stable craton at ~1.85 Ga [19,20,21].
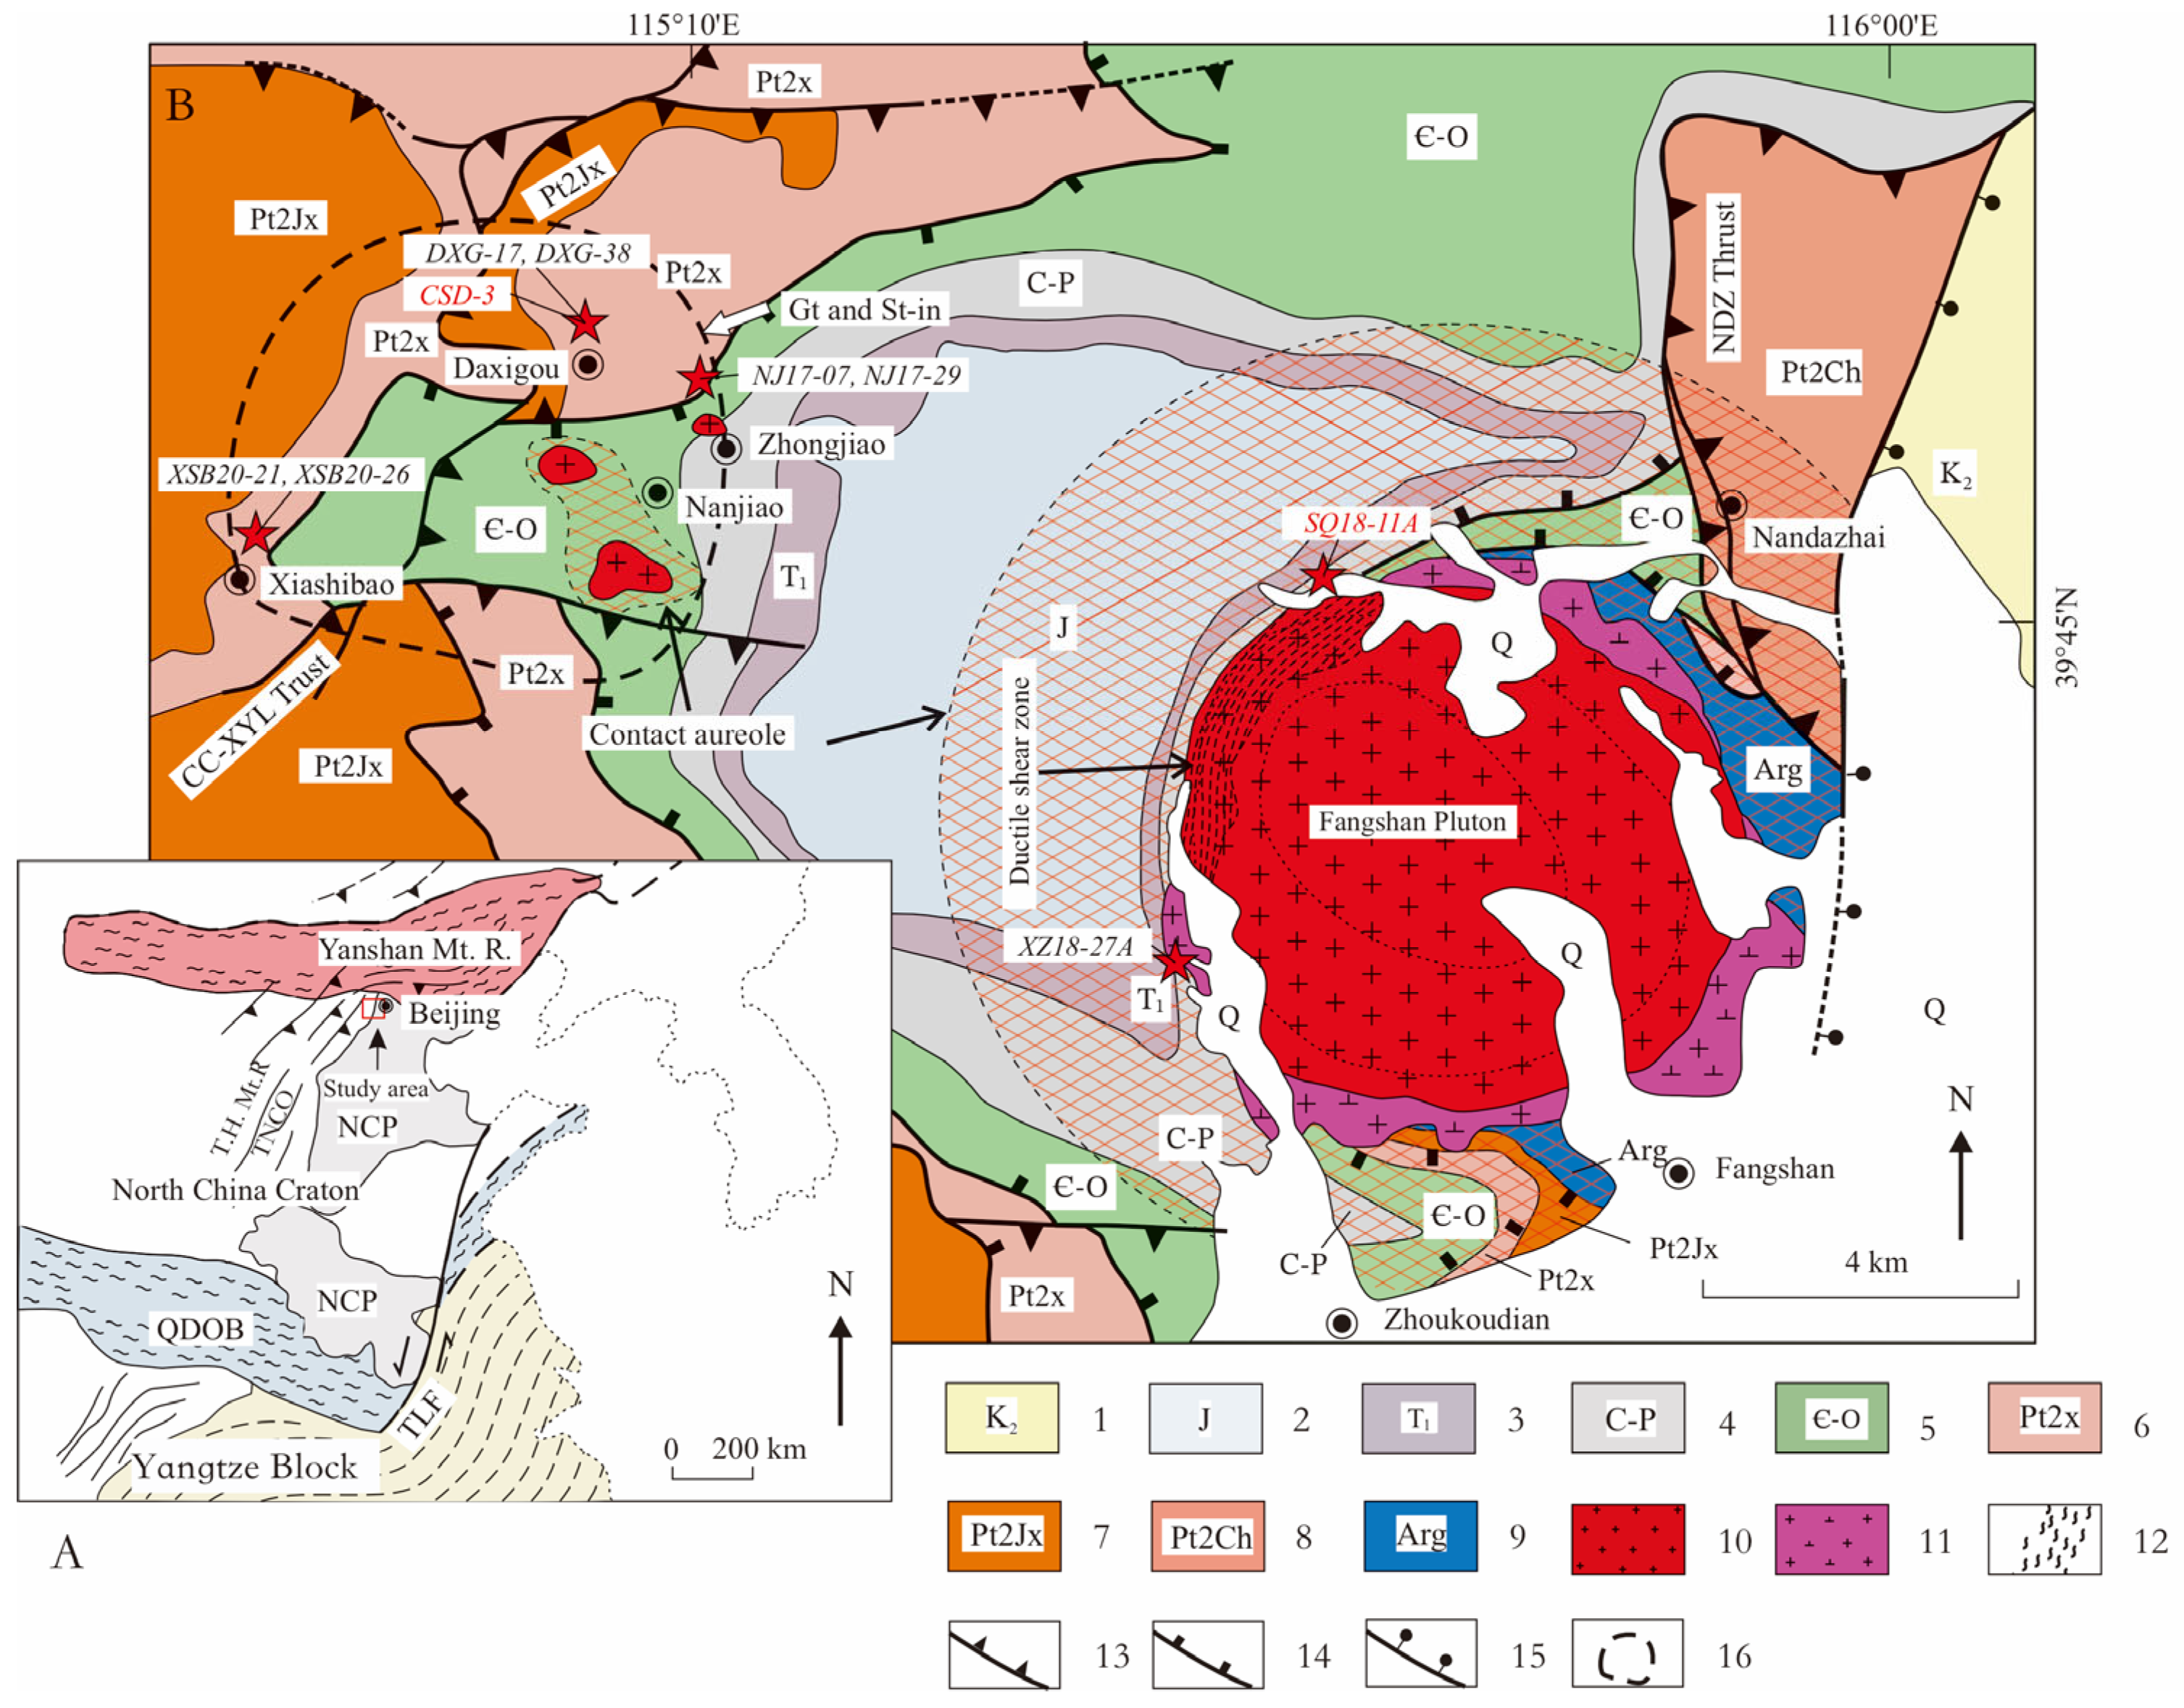
The Fangshan dome, which is located on the junction of the Yanshan mountain, Taihang mountain, and the North China plain (Figure 1), exposes rocks similar to those in the rest of the NCC (Table 1). The basement rocks consist of the Archaean (~2.54 Ga) Guandi complex with amphibolite and TTG and other granitic gneisses that were metamorphosed at ~2.5 Ga [22,23]. The Mesoproterozoic strata include the Changcheng, Jixian Groups, and the Xiamaling Formation, which structurally overlie the Guandi complex [24,25]. The Xiamaling Formation structurally overlies the Tieling Formation of the Jixian Group, with local relics of outcrop showing disconformity between the Xiamaling Formation and the Tieling Formation (Table 1). The Xiamaling Formation consists of dominant fine-grained clastic rocks with minor sandstone. The Mesoproterozoic Xiamaling Formation is conformably overlain by the Neoproterozoic Qingbaikou Group, Paleozoic and Mesozoic strata. The Neoproterozoic and Lower Paleozoic strata are composed of clastic rocks with minor carbonates. Coarse-grained clastic rocks make up most of the Upper Paleozoic, Triassic and Jurassic sequences, and the latter contains some interlayered coal beds. Felsic pyroclastic materials appear in the Triassic and basalt-dacite-rhyolite association at the base of Jurassic strata (Table 1).
Table 1.
Summary of stratigraphic units in the Fangshan dome of Beijing [22,23,26].


Previous studies by various researchers [16,17,18,27,28] have revealed that the metamorphic evolution of the Fangshan dome mainly comprises three distinct phases. The earliest observation was made by Wang [27], who discovered a distinct NNE-SSW trending chloritoid belt in the Western Hills of Beijing. The entire Fangshan dome is located within this chloritoid belt. He noted that chloritoid crystals are radial and do not coexist with garnet or staurolite, suggesting that this belt is a product of Mesozoic regional metamorphism under suitable chemical conditions rather than being closely related to igneous intrusions. However, detailed studies on the metamorphic processes and characteristics were lacking at that time.
Later, Wang [18] and Shan et al. [17] discovered the characteristic metamorphic mineral kyanite in the Xiamaling Formation in the Nanjiao area of Fangshan. This metamorphic phase was accompanied by the formation of garnet and staurolite, although their occurrences are highly restricted to the Xiamaling Formation near Nanjiao. They also found that this kyanite-related metamorphism caused the appearance of chloritoid in many geological layers, affecting strata up to the Permian Hongmiaoling Formation. Three metamorphic zones, including chloritoid, biotite, and garnet-staurolite zones, were identified from the Xiamaling Formation, with temperatures sequentially estimated to be 350–450 °C, 450–550 °C, and 550–660 °C and pressure over 5.5 kbar for all zones [18]. Regarding the age of this kyanite-related metamorphism, early geochronological evidence was based on a K-Ar age of approximately 210 Ma for hornblende from the involved dioritic dikes, leading Wang [18] to propose an Indosinian or earlier age. However, subsequent studies of high-precision zircon dating yielded crystallization age of ca.130 Ma [21,29] for the same dike and 134 + 1/−2 Ma for other granitic dikes [30]. Furthermore, 40Ar/39Ar dating for the muscovite from the Xiamaling Formation also yielded ages of 123–132 Ma [31]. However, the spatial distribution of these garnet- and staurolite-bearing metamorphic rocks is highly restricted. As shown in Figure 1, their exposed area is less than 100 km2, which is significantly smaller than the typical scale expected for regional metamorphism. Considering that this region is not located within an active plate tectonic margin, these index minerals are more likely the products of local contact metamorphism induced by underlying concealed intrusions.
Subsequently, the emplacement of magmatic rocks in this region at ca. 130 Ma superimposed contact metamorphism around the intrusions. The Fangshan plutons intruded in an obliquely diapiric formation rising northwestward into the early regional chloritoid zone [32] of Wang [18]. The plutons are composed of two intrusions formed with a mixing magma at 130~135 Ma [29,30,32,33,34]. The early intrusion consists of fine-grained dioritic and monzodiorite units, occurring as several large xenolithic blocks sporadically on margins of the late intrusion (Figure 1). The late intrusion consists of sequentially formed coarse-grained monzodiorite, coarse-porphyritic quartz monzonite and mega-porphyritic monzogranite units, as nearly concentric ellipses with the youngest unit inside the core. The intrusion caused a contact aureole superimposed on the surrounding Guandi complex (Arg in Figure 1) and the cover strata. This aureole features progressive metamorphic zones of andalusite, staurolite, sillimanite, and K-feldspar. These zones are especially well-documented in the Xiamaling Formation and Paleozoic and Mesozoic metapelites [16,18,28,35,36]. The temperature and pressure estimated are ~350–510 °C/~2 kbar, 470–580 °C/~2–3.3 kbar, 580–600 °C/~3.8 kbar and 670 °C/~3.5 kbar for the andalusite, staurolite, sillimanite, and K-feldspar zones, respectively [36]. The latest central-phase mega-porphyritic monzogranite unit was situated relatively far from the country rocks, resulting in a heat flux too low for prograde metamorphism, but reactivated the metamorphic system and triggered retrograde metamorphism of the sillimanite zone and K-feldspar zone [28,36]. Outward, it gradually transitions into a regional metamorphic chloritoid zone, where only the characteristic metamorphic mineral chloritoid is developed, without any garnet or staurolite [16]. The intense diapiric emplacement of the central phase also led to the formation of a crescent deformed zone with mylonite and cataclasite in the contact site of the coarse-porphyritic quartz monzonite unit [37,38]. Intrusion of small dioritic apophyses into the staurolite zone led to the formation of a narrow overprinted aureole and overgrowth of garnets on the edges of the pre-existing ones [18] and spongy biotite.
Figure 1.
Map A: shows the tectonic location of the Fangshan area within the North China Block (after Wang et al. [21]). Map B: Simplified geological map of the Fangshan dome (modified after Yan et al. [32]), showing the sample localities. Detailed sampling locations are marked with red stars; samples analyzed for garnet composition are highlighted in red text. 1: Upper Cretaceous conglomerate; 2: Jurassic volcanic and clastic rocks; 3: Triassic red beds and conglomerate; 4: Carboniferous-Permian continental clastic rocks; 5: Cambrian-Ordovician shallow-marine carbonates; 6: Mesoproterozoic Xiamaling Formation clastic rocks; 7: Mesoproterozoic Jixian System clastic rocks; 8: Mesoproterozoic Changcheng System carbonates; 9: Archean Guandi complex; 10: Quartz monzodiorite; 11:Monzodiorite; 12: Ductile shear zone; 13: Thrust fault; 14: Low-angle normal fault; 15: High-angle normal fault; 16: stability fields of garnet and staurolite. CC-XYL Thrust: Xiayunling-Changcao thrust fault, NDZ Thrust: Nandazhai thrust fault. T.H. Mt.: Taihang Mountain Range; Yanshan Mt. R.: Yanshan Mountain Range; QDOB: Qinling-Dabie Orogenic Belt; TNCO: Trans North China Orogen; TLF: Tan-Lu Fault; NCP: North China Plain.
3. Sampling
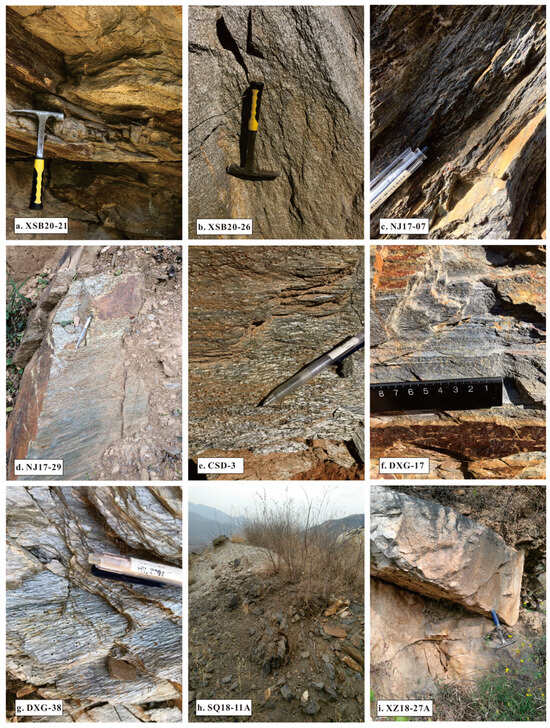
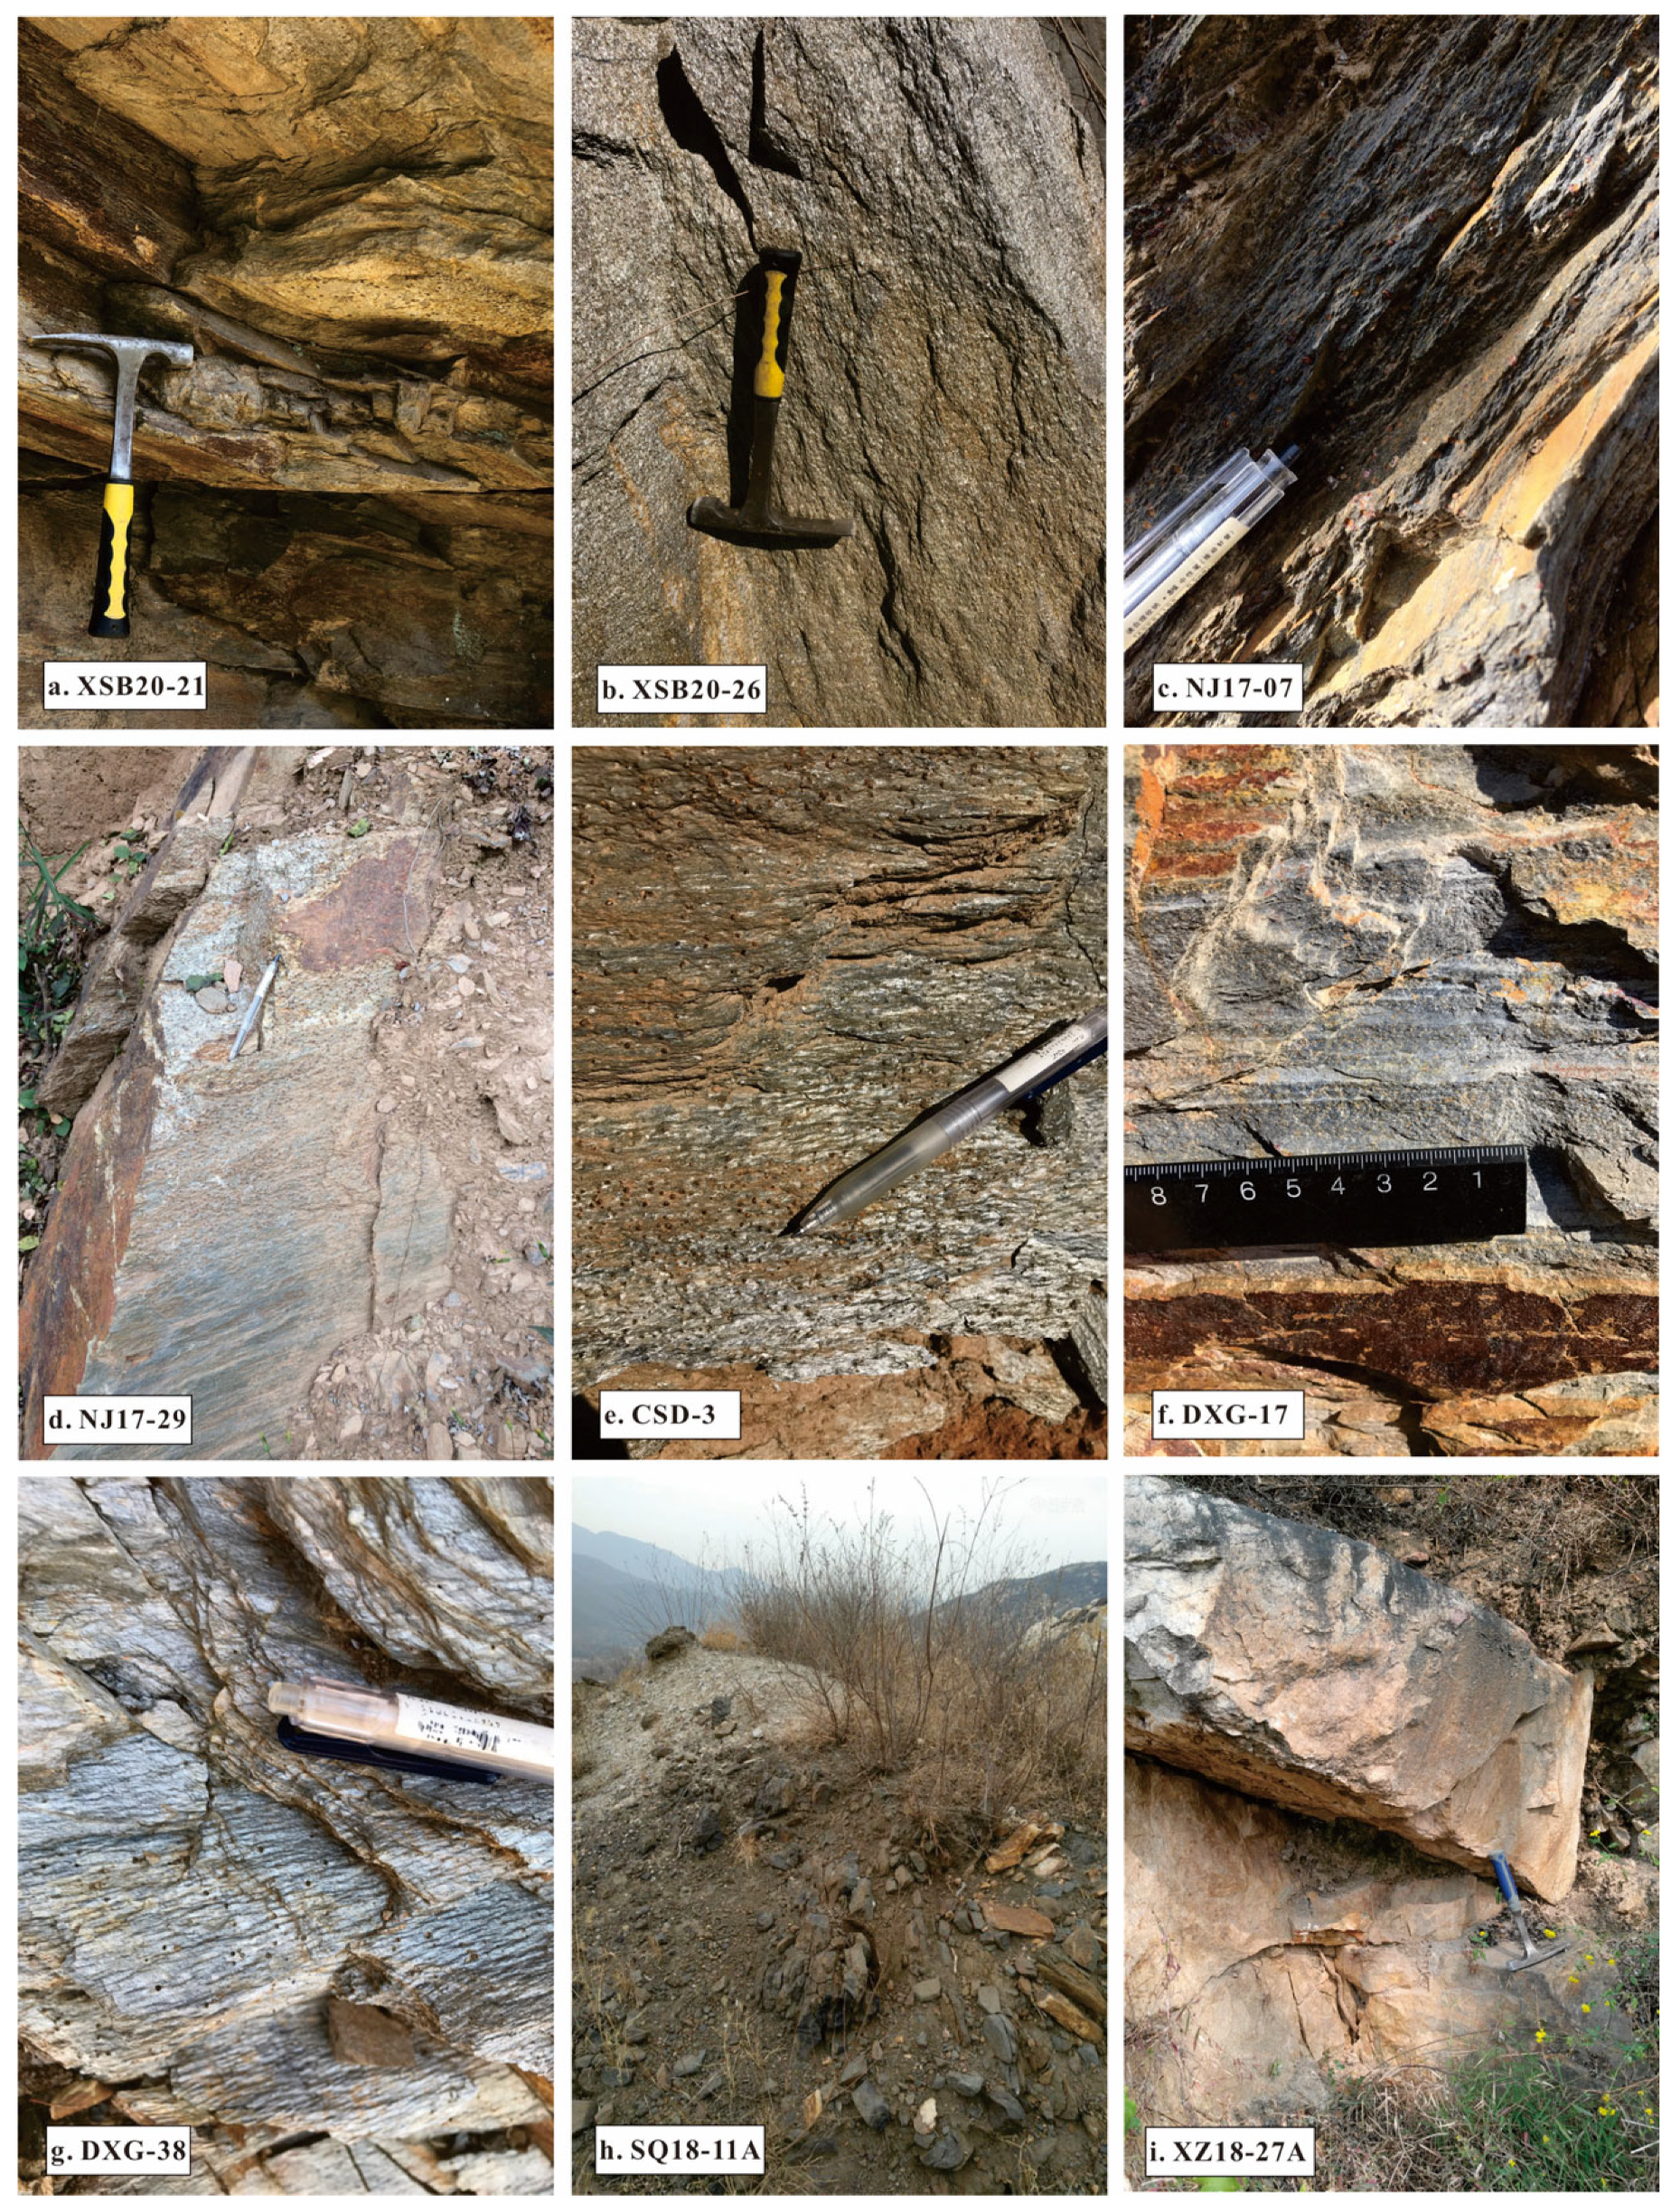
Seven samples of garnet mica schists were collected in the Xiamaling Formation from the staurolite zone from the Nanjiao area (delineated by the black dashed line in the western part of Figure 1) of the Xiamaling Formation in the Zhongjiao (NJ17-07 and NJ17-29), Daxigou (CSD-3, DXG-17, and DXG-38), and Xiashibao areas (XSB20-21 and XSB20-26). These sample localities are situated outside the superposed Nanjiao contact aureole (indicated by the red cross-hatching in the western part of Figure 1). Two samples of garnet-andalusite hornfels (SQ18-11A and XZ18-27A) of the sillimanite zone from the Paleozoic (Permian) strata from the Fangshan contact aureole were collected. The sample XZ18-27A was collected from an outcrop less than 10 m from the early fine-grained monzodiorite of the Fangshan pluton, and sample SQ18-11A was collected ~40 m away from the contact of the late porphyritic quartz monzonite of the Fangshan pluton. Outcrops of samples from the Xiamaling Formation in the staurolite zone from the Nanjiao area show strong foliation and lineation with porphyroblastic texture, while two contact samples display massive to weak foliated structure with porphyroblastic texture (Figure 2). To obtain the microstructures and internal fabrics, oriented thin sections were cut in the X-Z plane. For two hornfels samples, the thin sections were cut primarily perpendicular to the bedding.
Figure 2.
Field photographs of the studied metamorphic samples.
4. Analytical Methods
4.1. Crystal Size Distribution
The samples studied were collected in hand specimen size, then cut into near cuboid shapes using a circular saw for scanning. High-resolution micro-CT scanning was carried out using a 225 kV micro-computerized tomographer housed at the Key Laboratory of Vertebrate Evolution and Human Origins. Scanning was conducted using a 160 kV/120 μA X-Ray source with a 1 mm aluminum filter and using a rotation step size of 0.5 for 360. A total of 720 projections were reconstructed in a 2048 × 2048 matrix of 1536 slices using a two-dimensional reconstruction software IVPP_IHEP developed by the Institute of High Energy Physics, CAS. For a detailed description of the operation, see Wang et al. [39]. DXG-17 and DXG-38 are stacked and scanned within the same run. Scanning of other samples is performed individually.
The scan results are used to survey the spatial, shape, and size distributions of garnets within the samples. Due to ring artifacts in μ-CT, the garnets from the first and last 100 to 200 slices could not be appropriately separated, and thus were not used in rendering and following analysis. The images were processed using the software VGstudio 3.3 to convert RAW images into TIFF files to conduct further analysis. Garnet grains were primarily distinguished from other minerals by their grayscale values in the CT slices. The computational software Blob3D 2.0.1 [40] was then utilized to reconstruct the garnets, followed by manual grain-by-grain identification and the separation of touching particles. Finally, the software was used to quantify the size, shape, and spatial coordinates of the in situ garnet crystal centers; all samples were analyzed with a uniform size bin of 0.1 mm. The measurements are subsequently processed using the software Reduce3D 3.35 [41] to navigate the spatial distributions of garnets. As shown in Table 2, the pixel resolution for our measurements is 30–45 um, which gives the resultant measurement a resolution ten times higher than the lowest size limit of the measurement samples of about 0.03 mm, as pointed out by Higgins [42].
Table 2.
Measurements and statistical analysis results of garnet crystals. R: random distribution; C: clustering distribution; O: ordering distribution. The 95% Minimum and 95% Maximum indicate the 2-sigma envelope bounds for the interface-controlled null hypothesis of random distribution.
Three single-value statistics, ordering index (OI), impingement index (II), and clustering index (CI), and two scale-dependent statistics, pair correlation function (PCF) [43], and unbiased mark correlation function (MCF’) [11], are employed to discriminate crystallization mechanisms. The ordering index evaluates the mean distance to the nearest neighbor of each crystal, comparing it to the mean distance expected for a spatially random distribution of crystals with the same number density [11]. The clustering index valuates the mean distance to the nearest crystal center from a random point in the sample, comparing it to the value expected for a random distribution [11]. The impingement index compares the overlap between spherically idealized crystal shapes with the amount of overlap expected in a random distribution [11,41,44]. The PCF evaluates the probability density of finding a crystal center at a given distance from another center. It tests whether the spatial distribution of crystals exhibits ordering. The MCF’ evaluates the correlation of crystal sizes at a given separation distance; rather than the number of crystals, it tests whether closely spaced crystals compete for constituents. An improved unbiased MCF’ (using arithmetic means) was proposed to quantify size–isolation relationships [11,41]. The data of scale-dependent statistics are plotted against test distance and compared with a 95% confidence interface-controlled 2-sigma envelope [11]. For further discussion on the statistics, see Daniel and Spear [45], Hirsch et al. [11], Ketcham et al. [44], Hirsch [41], and Petley-Ragan et al. [10].
4.2. Whole-Rock Chemistry
Whole-rock major element analysis is conducted on a representative sample CSD-3 from Daxigou, as the garnets within it contain the most complex inclusions and the rock exhibits the most complete mineral assemblage, for thermodynamic phase equilibrium modeling and effective bulk composition calculations. Whole-rock major elements were analyzed by X-ray fluorescence spectrometry at Sample Resolution in Wuhan. The sample preparation for whole-rock major element analysis was conducted using the fusion method. The flux consisted of a mixture of lithium tetraborate, lithium metaborate, and lithium fluoride in a 45:10:5 ratio. Ammonium nitrate was employed as an oxidizing agent, while lithium bromide served as a release agent. The melting process was carried out at 1050 °C for 15 min. A Zsx Primus II wavelength-dispersive X-ray fluorescence (XRF) spectrometer, manufactured by RIGAKU in Tokyo, Japan, was used to analyze the major elements in the whole rock. The X-ray tube utilized a 4.0 kW end-window Rh target. The test conditions included a voltage of 50 kV and a current of 60 mA, with all major element analysis lines using ka radiation. National standard materials were used to establish the calibration curve, including rock standard samples (GBW07101-14), soil standard samples (GBW07401-08), and stream sediment standard samples (GBW07302-12). Data corrections were applied using the theoretical coefficient method, and the relative standard deviation (RSD) was maintained below 2%.
4.3. Garnet Composition
Garnet composition analysis is carried out on CSD-3 and SQ18-11A to obtain detailed chemical zoning profiles. Garnet composition analyses and element mapping were conducted using a JEOL JXA-8230 electron probe microanalyzer (EPMA, Tokyo, Japan) equipped with four wavelength-dispersive spectrometers (WDSs) at the Center for Global Tectonics, School of Earth Sciences, China University of Geosciences (Wuhan). For mineral analyses, the instrument operated at an accelerating voltage of 15 kV, a probe current of 20 nA, and a focused beam diameter of 1 um. Each element peak was measured for 10 s, while background counts were collected for half that duration. Data correction was performed using the ZAF method (atomic number, absorption, fluorescence). Both natural and synthetic SPI standards were employed, selected according to the specific minerals analyzed. For EPMA mapping, the conditions were set to 15 kV accelerating voltage, 100 nA probe current, and a pixel size of 1 μm × 1 μm, with the stage operated in scan mode. A higher probe current was used during mapping to offset the shorter dwell time per pixel, thereby achieving higher spatial resolution. All mapping was conducted at the WDS X-ray peak positions.
4.4. Thermodynamic Modeling
Phase equilibrium modeling of sample CSD-3 was carried out between 450 and 650 °C and 1.0–10.0 kbar using Theriak/Domino 11.02.2015 software [46,47] and the internally consistent dataset of Holland and Powell [48] (datafile tcdb55-p07, converted from THERMOCALC to Theriak/Domino format by Douglas K. Tinkham) to calculate phase diagrams and investigate the stability of mineral assemblages under varying pressure and temperature conditions. The MnNCKFMASHT (MnO-Na2O-CaO-K2O-FeO-MgO-Al2O3-SiO2-H2O-TiO2) system was selected for phase equilibrium modeling. As the protoliths of the samples are pelitic rocks, H2O was assumed to be present in excess under solidus conditions. References for the solid solution models are: biotite, cordierite, garnet, clinozoizite [49], staurolite, chloritoid, chlorite, plagioclase [48], muscovite [50]. The thermodynamic properties of the end-member phases utilized in our calculations are derived from Holland and Powell [48].
The automated P-T path-fitting method based on garnet zoning proposed by Moynihan and Pattison [51] was employed to constrain the metamorphic history of the sample. This approach matches the radial compositional profile of garnet with predictions from thermodynamic forward models point by point, dynamically correcting the effective bulk composition (EBC) at each step, and by applying the Nelder–Mead optimization algorithm to minimize the misfit of key thermodynamic parameters, the model iteratively adjusts multiple variables to establish appropriate starting conditions, thereby accurately reproducing the chemical variations observed in the sample data [51,52]. The garnet zoning data used for the simulation is listed in Table 2. The starting P-T condition is set out of the garnet stability field and close to the core isopleth intersection at 530 °C and 3.665 kbar. In the forward modeling of this study, we disabled the grossular component (Ca3Al2Si3O12) in the garnet by turning off its a-x model. This decision rests on extremely low bulk Ca content with whole-rock CaO at 0.09 wt.% (Table 3). If all P is sequestered into apatite, the calculation 0.06 × (55.8/42.3) = 0.079 wt.% CaO shows that only about 0.011 wt.% Ca remains available for silico-aluminous reactions. This treatment also prevents early exhaustion of Ca that would otherwise force the modeling run to terminate prematurely.
Table 3.
Bulk composition of sample CSD-3.
5. Results
5.1. Petrography
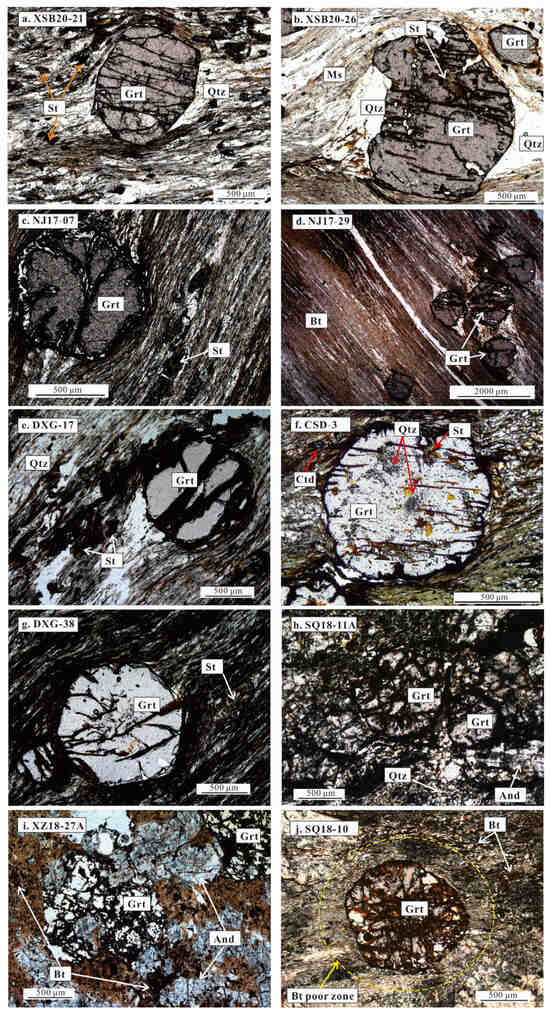
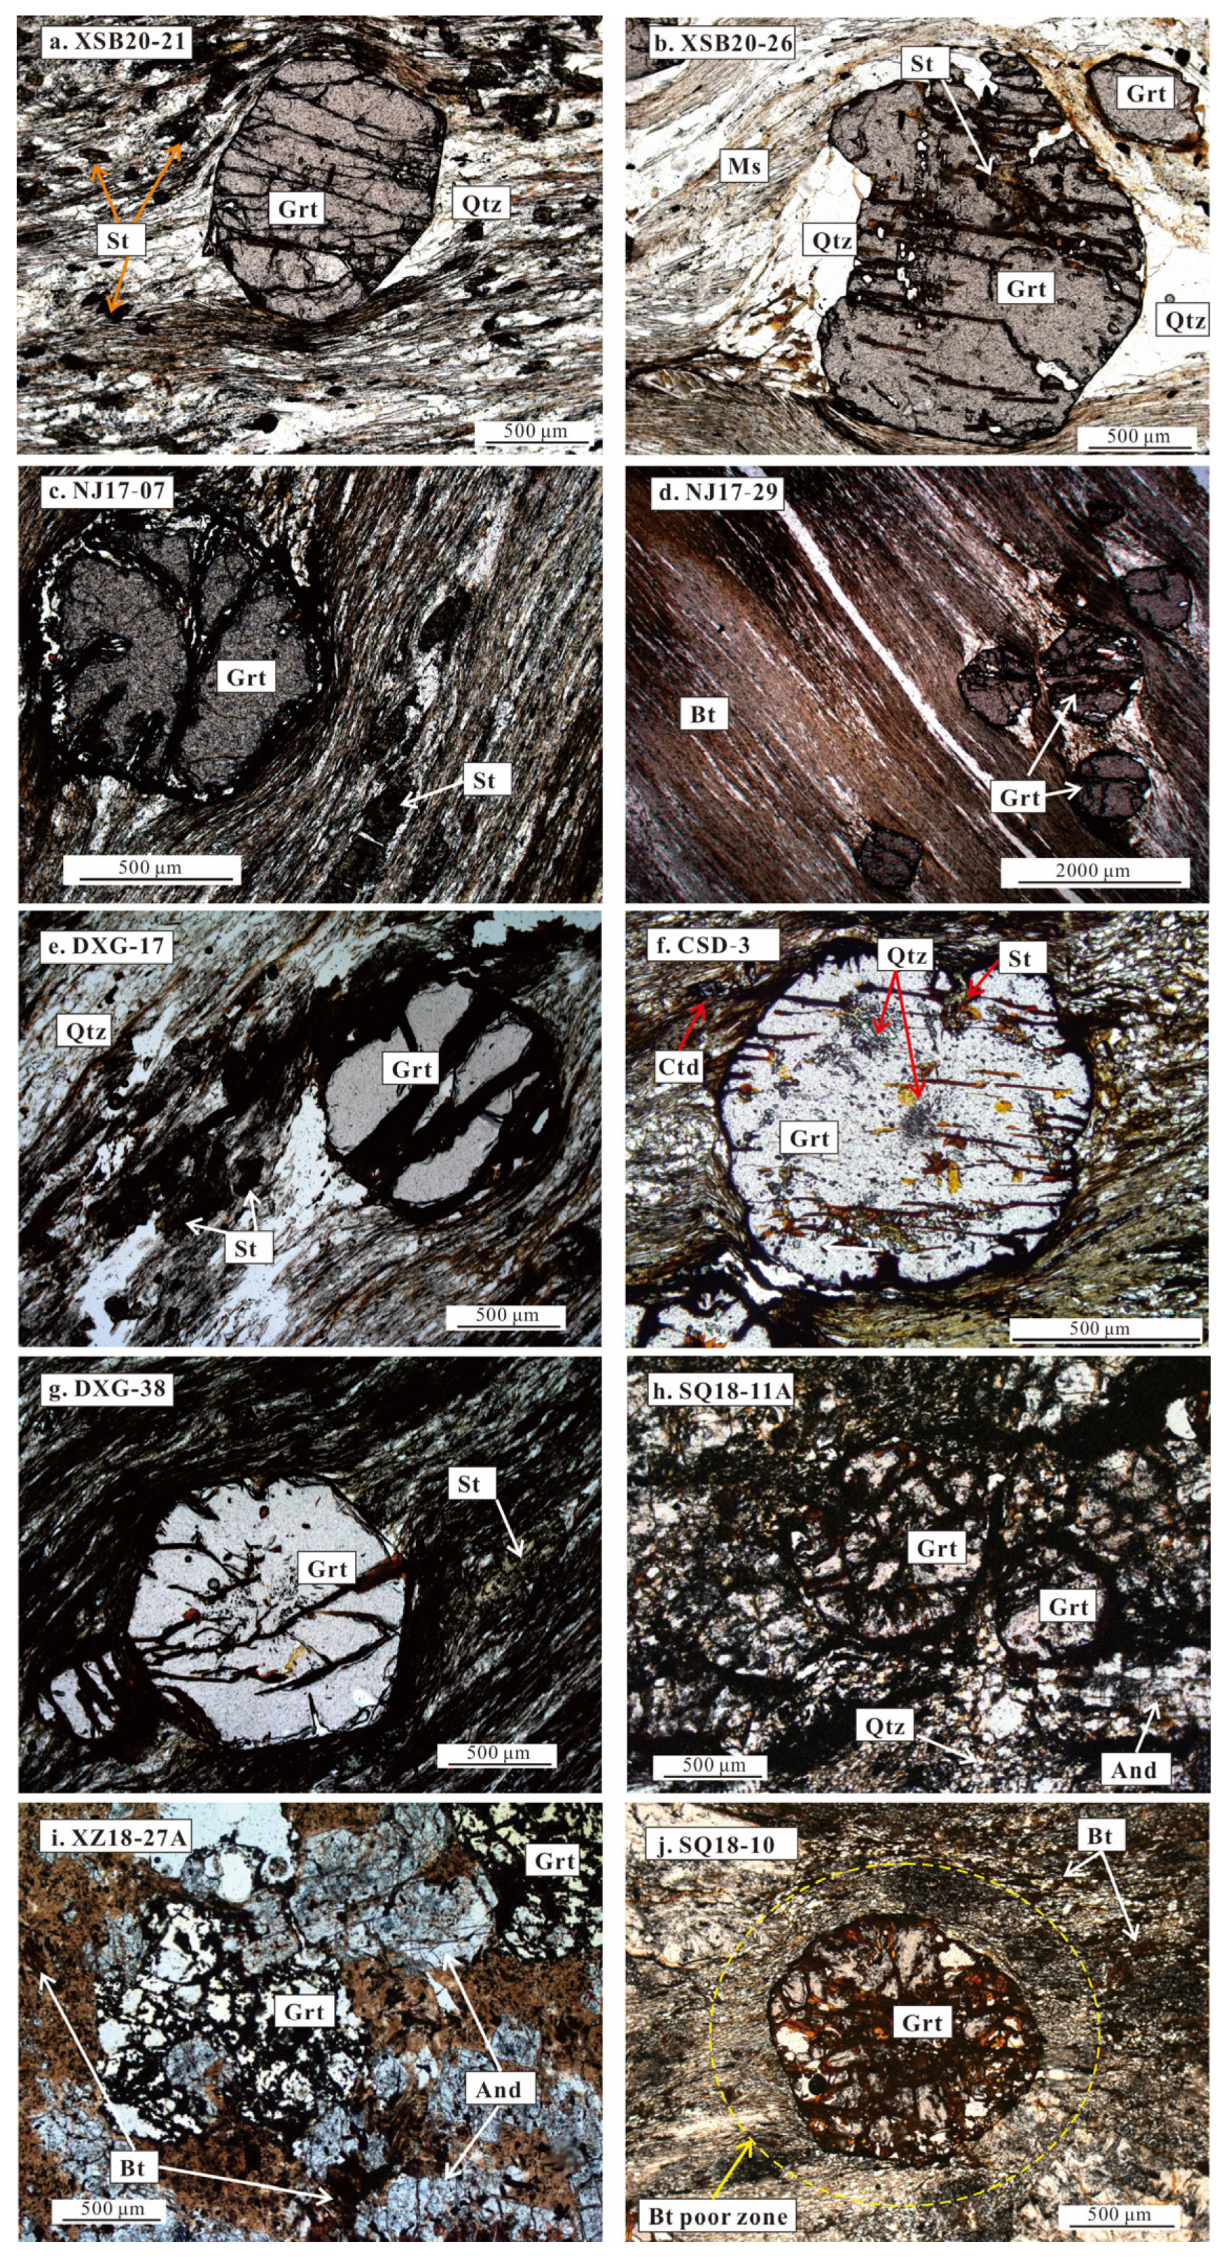
Samples XSB20-21 and XSB20-26 were collected north of the Xiashibao village (Figure 2). Sample XSB20-21 has subhedral garnets (~1.5 mm to ~0.4 mm) and smaller staurolite (~0.3 mm) and matrix minerals of muscovite, quartz, biotite, and chlorite. The garnet porphyroblast contains inclusions of quartz (Figure 3a,b). Sample XSB20-26 has the same major mineral compositions as sample XSB20-21, but the porphyroblastic garnet contains inclusions of staurolite, biotite and quartz with minor opaque minerals. The inclusion minerals show weak foliation that is obliquely crosscut by the matrix lineation and foliation. Strong shearing resulted in some garnet and staurolite porphyroblasts developing an asymmetrical sigmoidal shape strain shadow (Figure 3a,b).
Figure 3.
Photomicrographs (plane-polarized light) of representative metamorphic assemblages. And: andalusite, St: staurolite, Grt: garnet, Qtz: quartz, Ms: muscovite, Bt: biotite.
Samples NJ17-07 and NJ17-29 were collected to the north of Zhongjiao village. Sample NJ17-07 has subhedral garnets and smaller staurolite porphyroblasts (Figure 3c). The garnets are ~1.0 mm and inclusion-free. The staurolites are prismatic, ~0.7 × 0.1 mm. The matrix minerals are muscovite, biotite, and quartz. Sample NJ17-29 only contains porphyroblastic garnets and matrix minerals of muscovite and quartz (Figure 3d). The garnet porphyroblasts are 0.6~1.8 mm in diameter, subhedral, full of cracks, and rimmed by limonite. Both samples appear as mica phyllonite due to strongly ductile shearing.
Samples DXG-17, CSD-3, and DXG-38 were collected near the Daxigou village. Sample DXG-17 is composed of porphyroblastic garnet and matrix staurolite, muscovite, biotite, quartz, and minor ilmenite (Figure 3e). The garnet porphyroblasts are subhedral and ~1 mm in diameter and without inclusions but with a usually developed asymmetrical sigmoidal strain shadow (Figure 3e). The matrix staurolites are short prismatic crystals, usually developed geniculate twins and frequently weakly sigmoidal inclusion trails. Sample CSD-3 contains porphyroblastic garnet and matrix minerals of chloritoid, muscovite and quartz and accessory ilmenite. The garnet porphyroblasts are ~1 mm in diameter, usually are subhedral with embayed edges. They contain fine-grained inclusions of quartz, chloritoid and staurolite. The quartz inclusion cluster in the core and sporadically in the rim, occasionally with chloritoid in the core and staurolite in the rim (Figure 3f). It is notable that in some porphyroblastic garnets, the quartz inclusions occur as curved trails. Sample DXG-38 consists of porphyroblastic garnet and staurolite and matrix muscovite, biotite, quartz, chloritoid, graphite and minor opaque ilmenite (Figure 3g). The garnet porphyroblasts are euhedral, ~1 mm in diameter. They contain quartz and opaque ilmenite inclusions with near-planar trails. The matrix staurolites are short prismatic, usually developed geniculate twins but frequently weakly sigmoidal inclusion trails. The chloritoids are subhedral to euhedral pale blue slabs, randomly distributed to preferential orientation.
Sample SQ18-11A is dominated by andalusite, garnet, and quartz, with minor amounts of biotite and muscovite. The garnets are mostly idioblastic with abundant syn-growth inclusion of quartz. The inclusion quartz occurs as micro tubes arranged outward from the core perpendicular to the crystal faces, a typical texture frequently observed in the Xiamaling Formation in the Fangshan contact aureole [36]. The andalusites are generally colorless, and some have a pinkish core. Most andalusites developed re-entrance angles displaying chiastolite structure, with characteristic cross-shaped carbonaceous inclusions. A nearby sample (SQ18-10), collected from the same outcrop and sharing an identical major mineral assemblage (andalusite, garnet, biotite, muscovite, and quartz) with SQ18-11A, developed a biotite-depleted halo around some garnet porphyroblasts (Figure 3j).
Sample XZ18-27A is primarily composed of garnet, andalusite, quartz, biotite, and minor sillimanite. The garnets are euhedral to subhedral and generally devoid of obvious inclusions and develop extensive limonitization along fractures. The andalusite appears as subhedral short prismatic crystals, containing abundant opaque inclusions concentrated in the core and mantle. The sillimanite appears as fibrolite bundles within the matrix. The biotite is only observable as pseudomorph-clouded flakes of limonitization chlorites (Figure 3i).
5.2. Whole-Rock Chemistry
The bulk major element composition of sample CSD-3 is presented in Table 3. This sample is characterized by a high SiO2 content (52.19 wt.%), accompanied by elevated Al2O3 (22.13 wt.%) and Fe2O3 (15.39 wt.%). K2O is relatively low at 3.81 wt.%. The concentrations of Na2O (0.28 wt.%), CaO (0.09 wt.%), and MgO (1.17 wt.%) are low. TiO2 (0.95 wt.%), MnO (0.04 wt.%), and P2O5 (0.06 wt.%) are present in minor amounts. The high Al2O3 and Fe2O3 contents, together with abundant K2O and SiO2, are consistent with the mineral assemblage dominated by high Al + Fe phases such as staurolite, chloritoid, and garnet.
5.3. Crystal Size Distribution
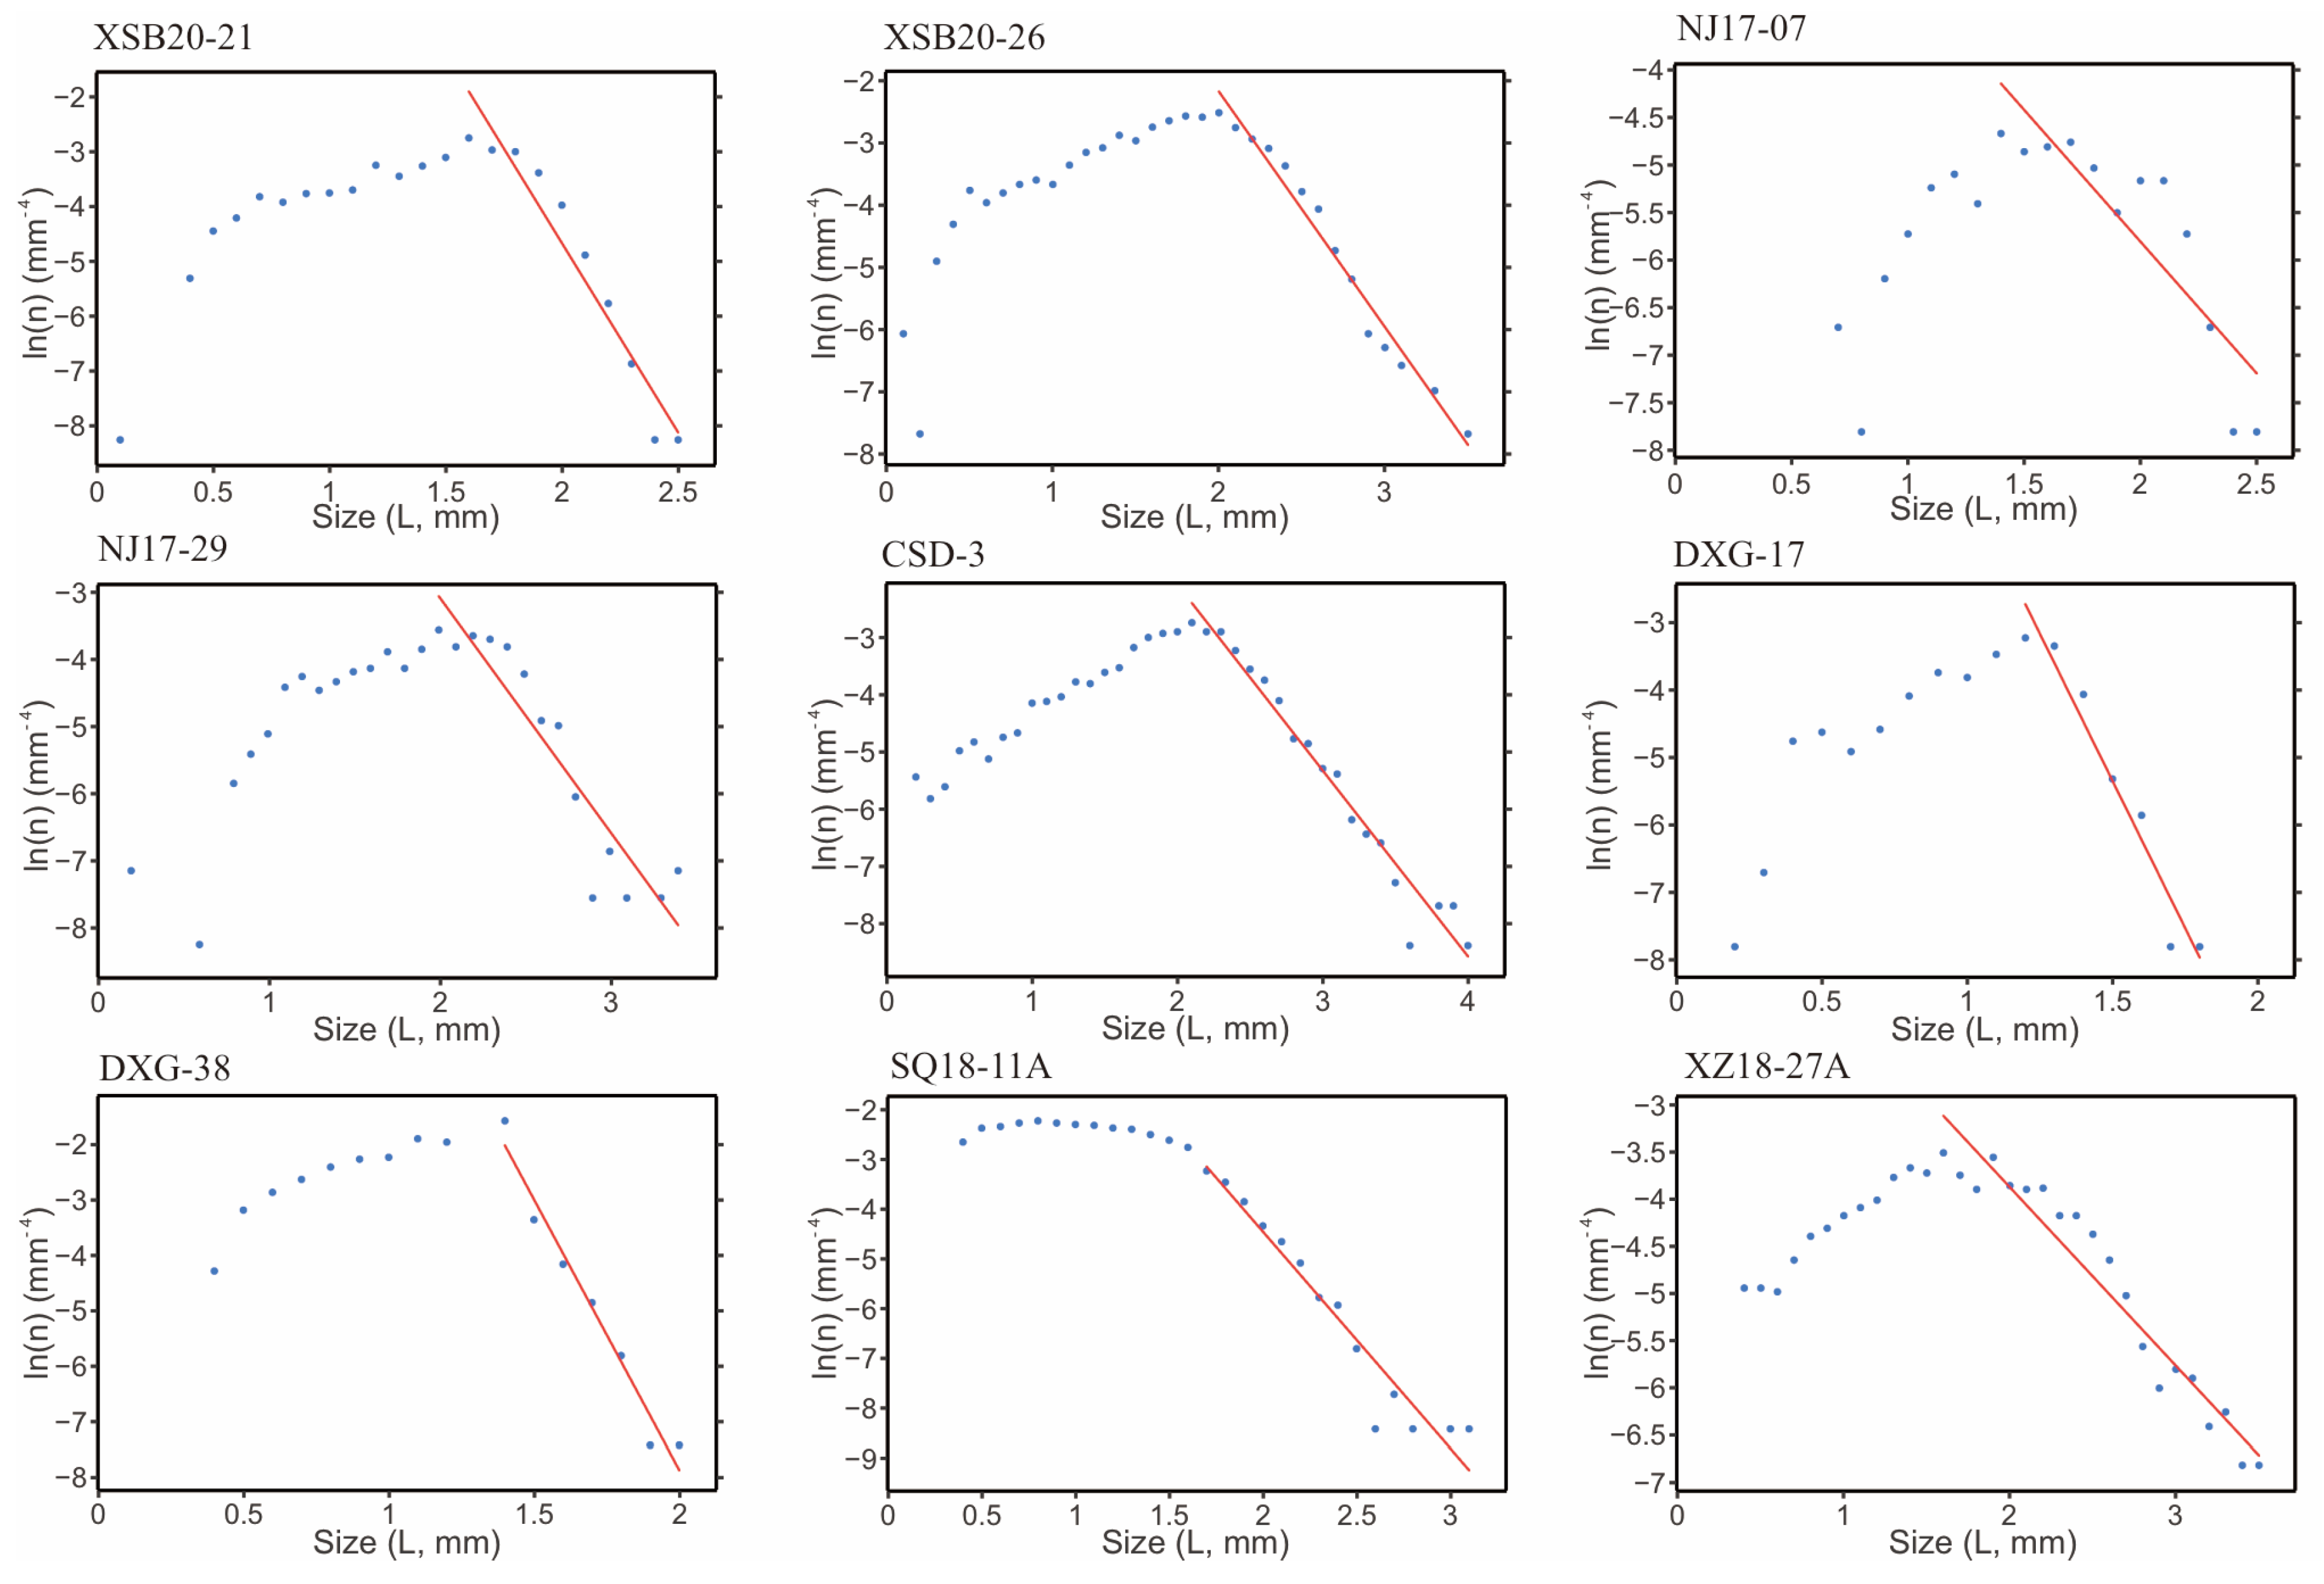
The X-ray CT 3D reconstruction of garnet within the samples is illustrated in Figure 4. Measurements of general parameters and single-value statistics for the garnet crystals are listed in Table 2, and the scale-dependent statistics are given in Figure 5. The histograms of the crystal size are shown in Figure 6. The CSD diagrams (ln(n) vs. L) are shown in Figure 7.
Figure 4.
Three-dimensional rendering of garnets within the samples.
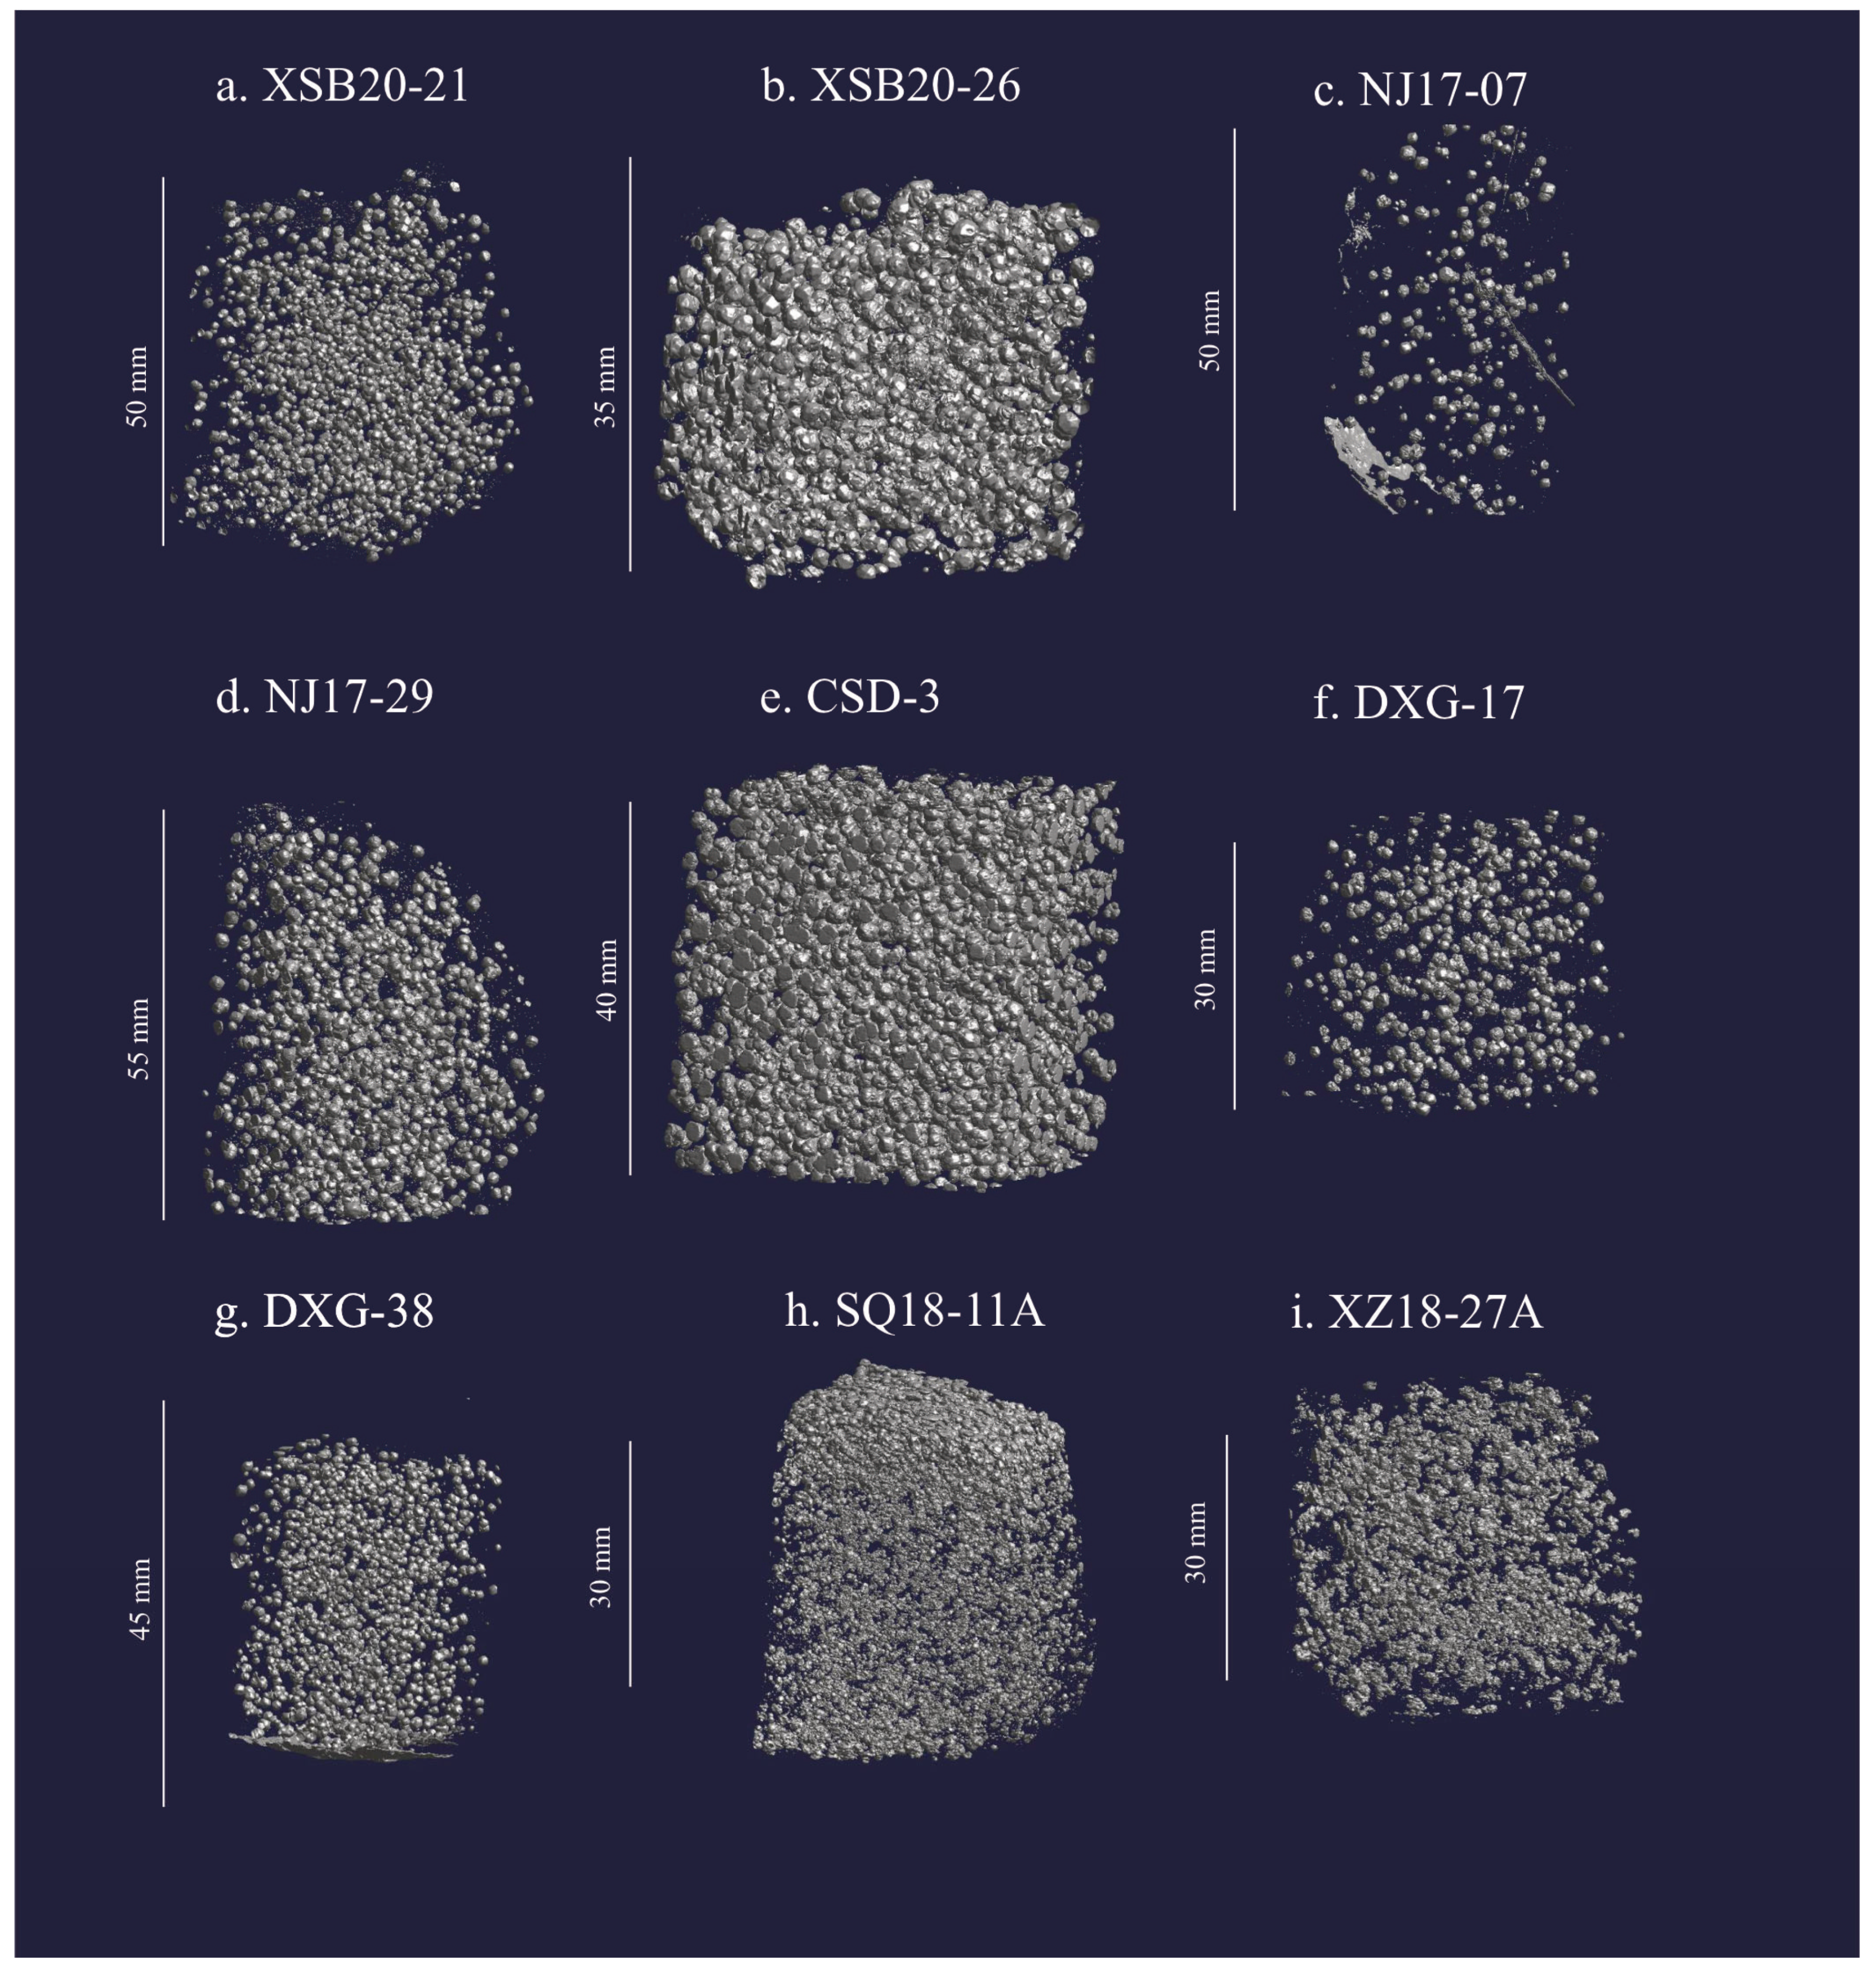
Figure 5.
Spatial correlation functions of pair correlation function (PCF) and the mark correlation function (MCF’) calculated using Reduce3D [41]; the x-axis represents test distance, the top x-axis represents the value in mm, while the bottom x-axis indicates the mean radii. The solid lines with dots represent the measured data. The yellow shaded areas indicate the 2-sigma envelope for a random distribution (null hypothesis). The purple vertical bars indicate the range of nearest-neighbor distances (1 sigma).
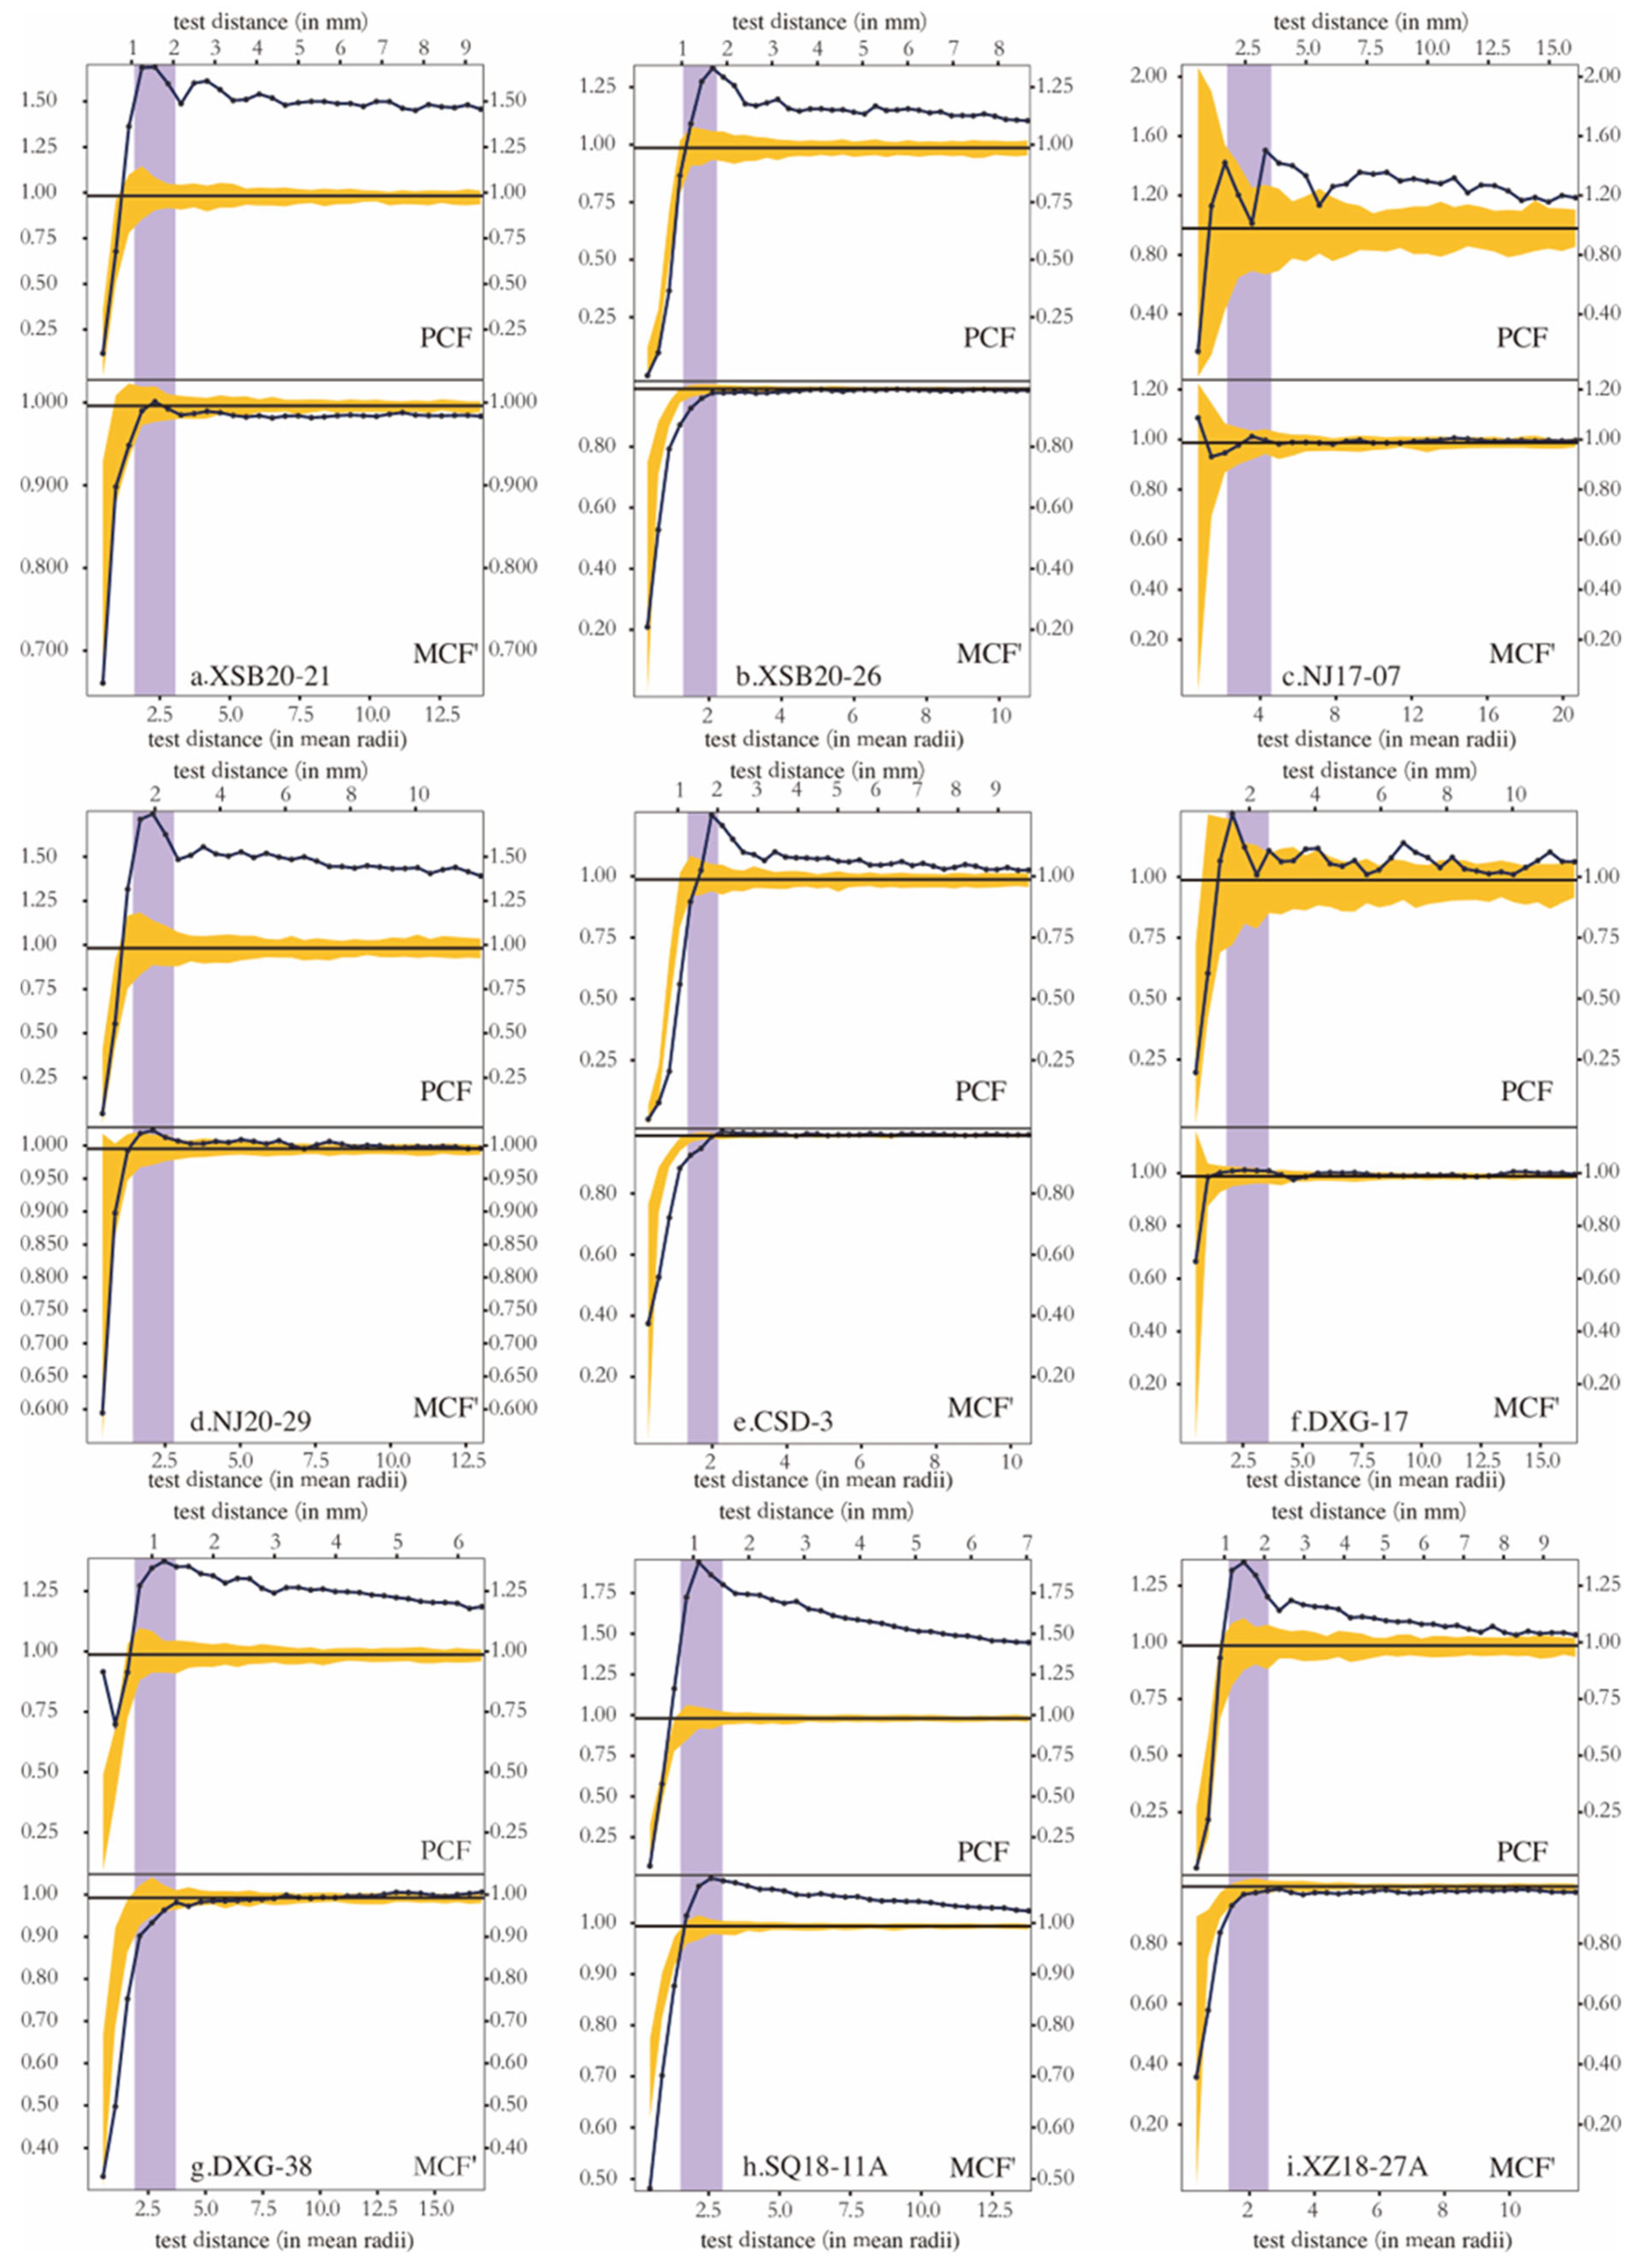
Figure 6.
Crystal size histograms of the studied samples were determined from extracted garnet volumes with an equal size bin of 0.1 mm.
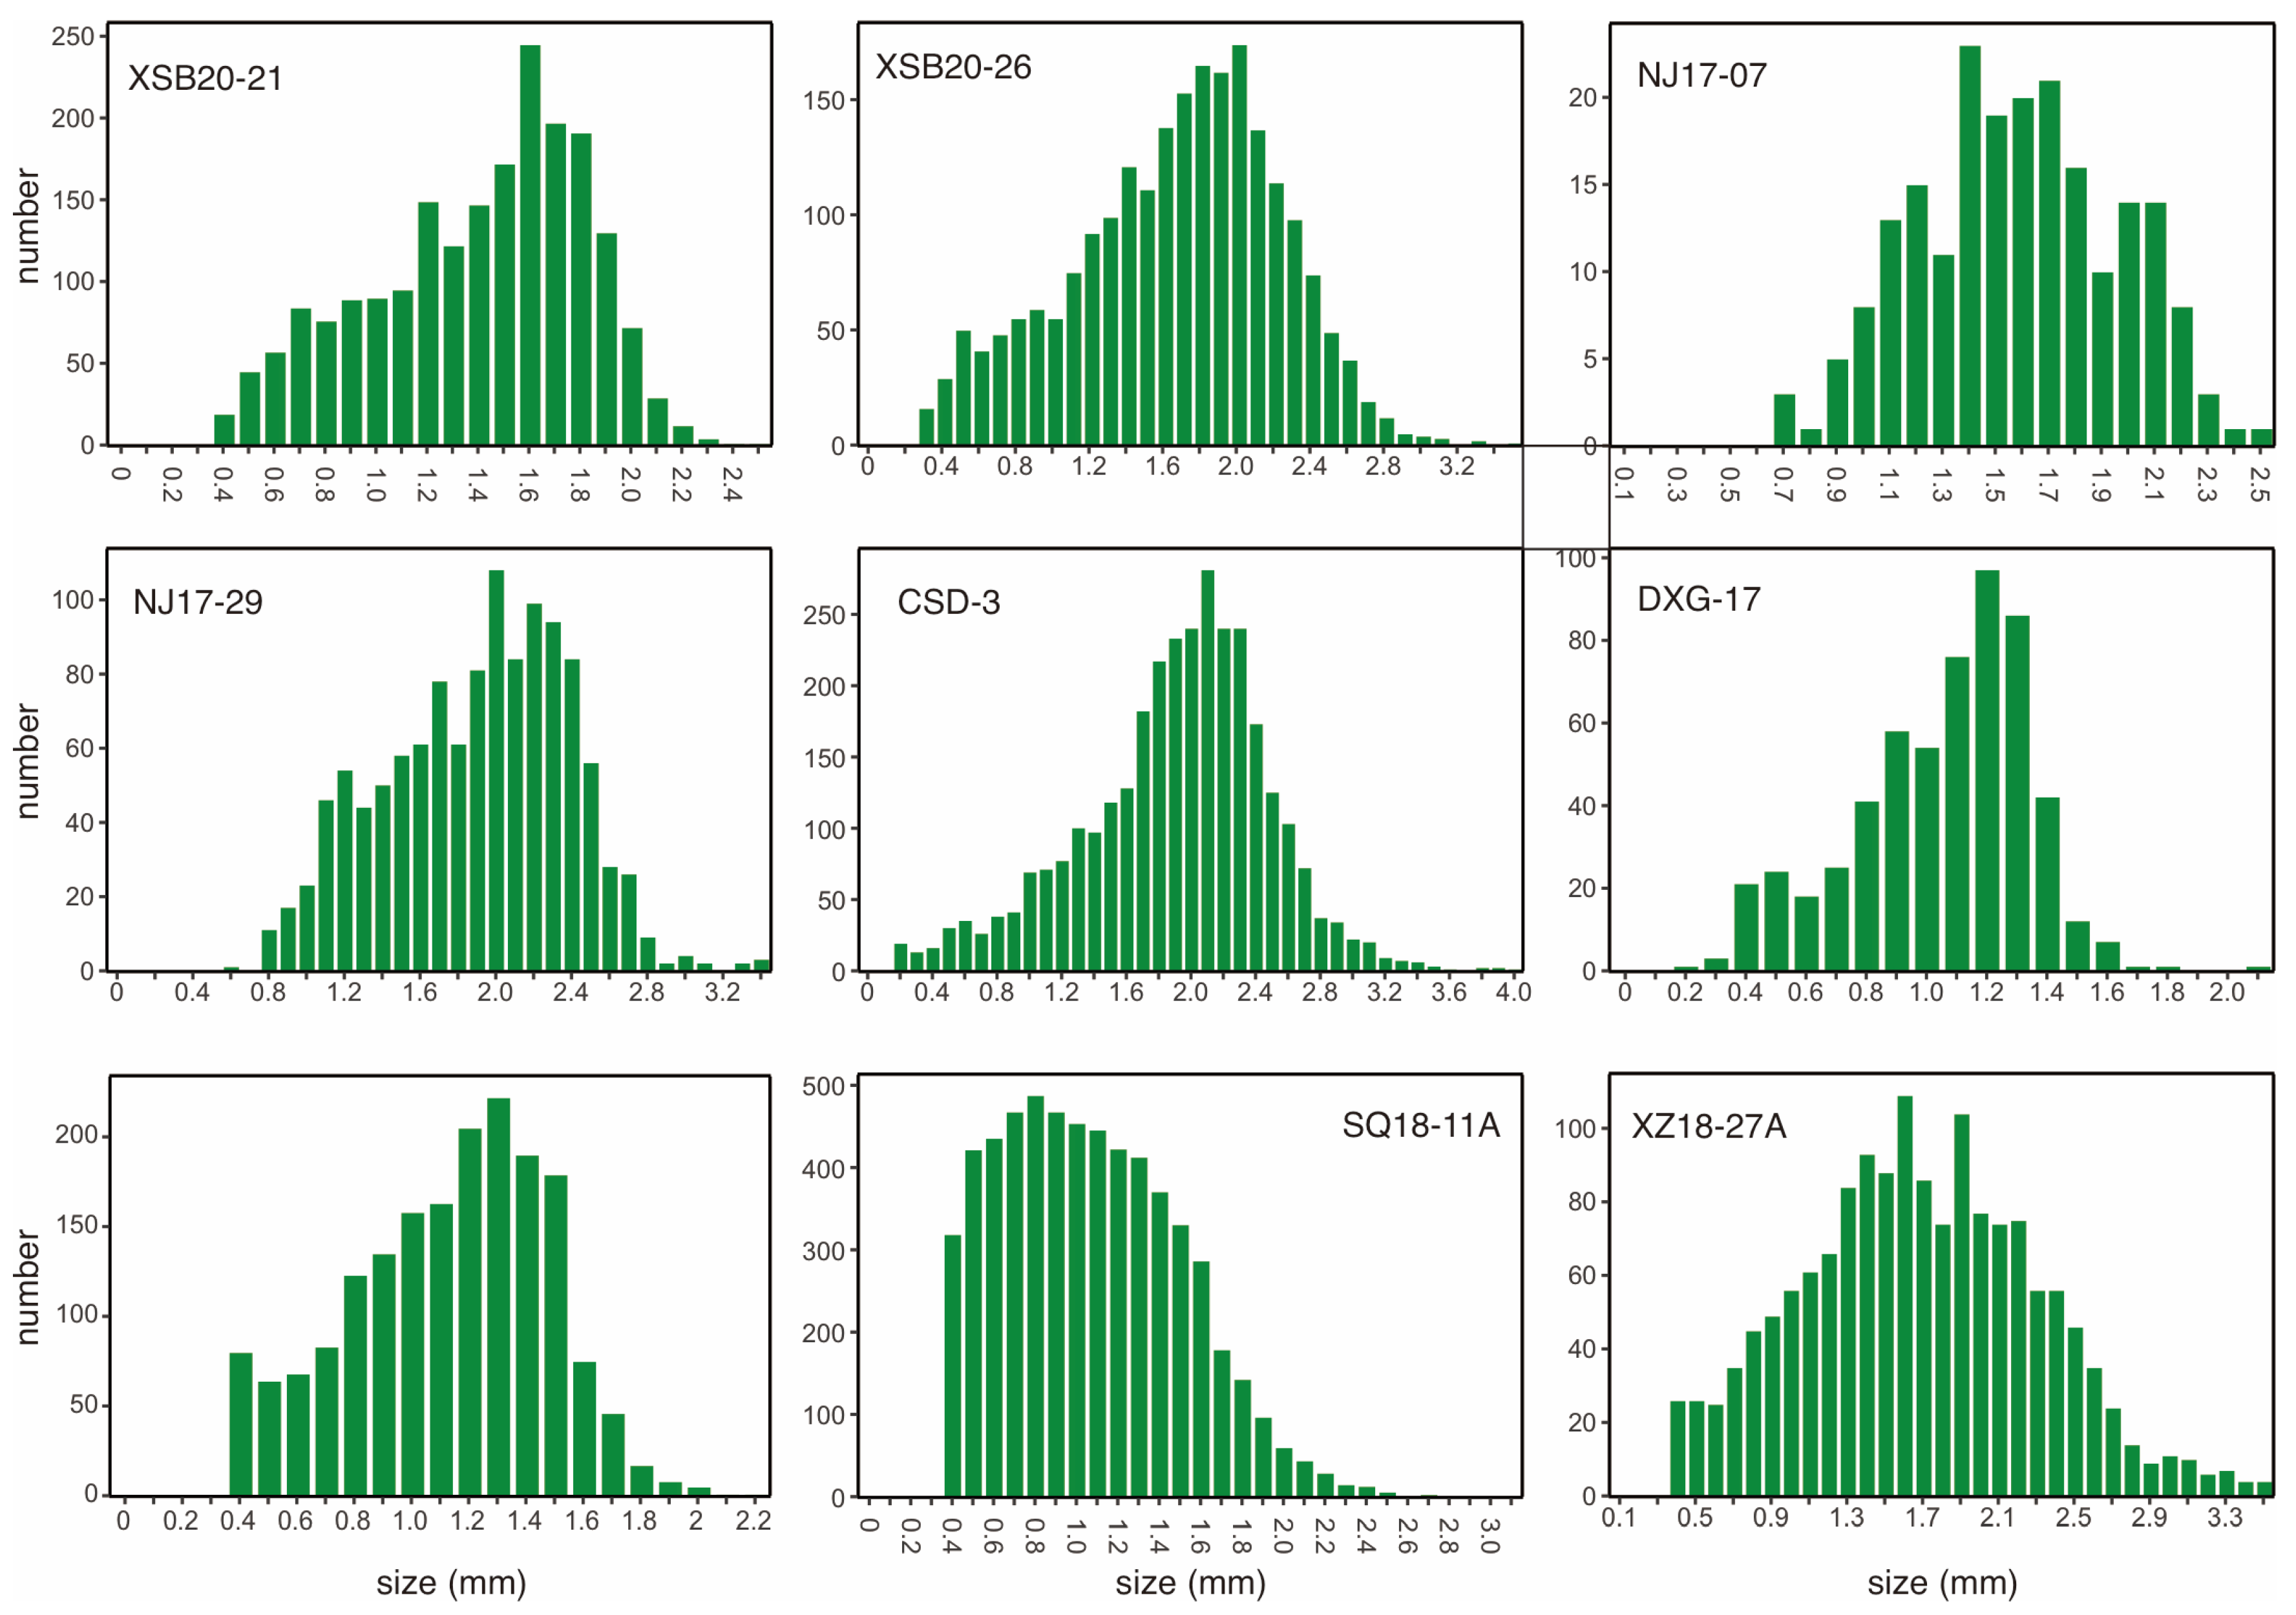
Figure 7.
Crystal size distribution (CSD) plots (ln(n) vs. L). The red lines represent the linear regression fits to the large (grain sizes exceeding the inflection point in the diagram) population of the distribution.
The measured nine samples have the maximum garnet crystal size from about 2.50 to 4.02 mm. Garnet grains from all samples have mean aspect ratios of ~1.1 (Table 2), suggesting that the garnet crystals are predominantly equant and are appropriate for crystal size distribution analysis. Crystal density for all samples greatly varies. Among the seven metamorphic samples from the Nanjiao area, the sample NJ17-07 has a garnet density lower than 10/cm3, whereas the remaining samples vary from 16/cm3 to 45/cm3. The crystal numbers vary from ~600 to ~6000 within the samples; these large counts improve the robustness of spatial statistics data for crystals’ spatial distribution [53].
The single statistic values such as the mean values of ordering index (OI), clustering index (CI) and impingement index (II) are 0.86–1.11, 0.64–1.2, and 0.93–1.02, respectively; they mostly and generally approximate 1.0, except for some results obviously deviating from 1.0 (Table 2). The calculated PCFs for all samples are high and plotted above the 2-sigma null hypothesis interface distribution envelope, and most MCFs are plotted within the 2-sigma null hypothesis interface distribution envelope (Figure 5).
The garnet crystal size vs. number histograms show a negatively skewed curve for six samples, whereas NJ17-07 is approximately normally distributed from the Nanjiao metamorphic samples, and displays a positively skewed curve for sample SQ18-11A and negatively skewed curve for sample XZ18-27A of the contact samples (Figure 6). The ln(n) vs. L diagrams display distinct nonlinear bell-shaped curve characteristics for all the Nanjiao metamorphic samples and the contact metamorphic sample XZ18-27A, but a pot-shaped CSD curve lacking a pronounced inflection for the contact sample SQ18-11A (Figure 7).
5.4. Garnet Composition
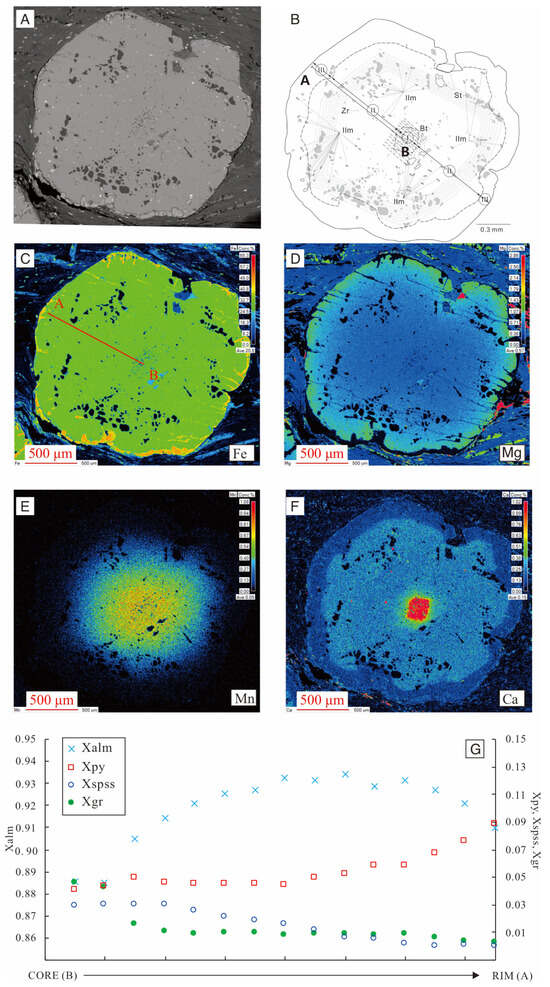
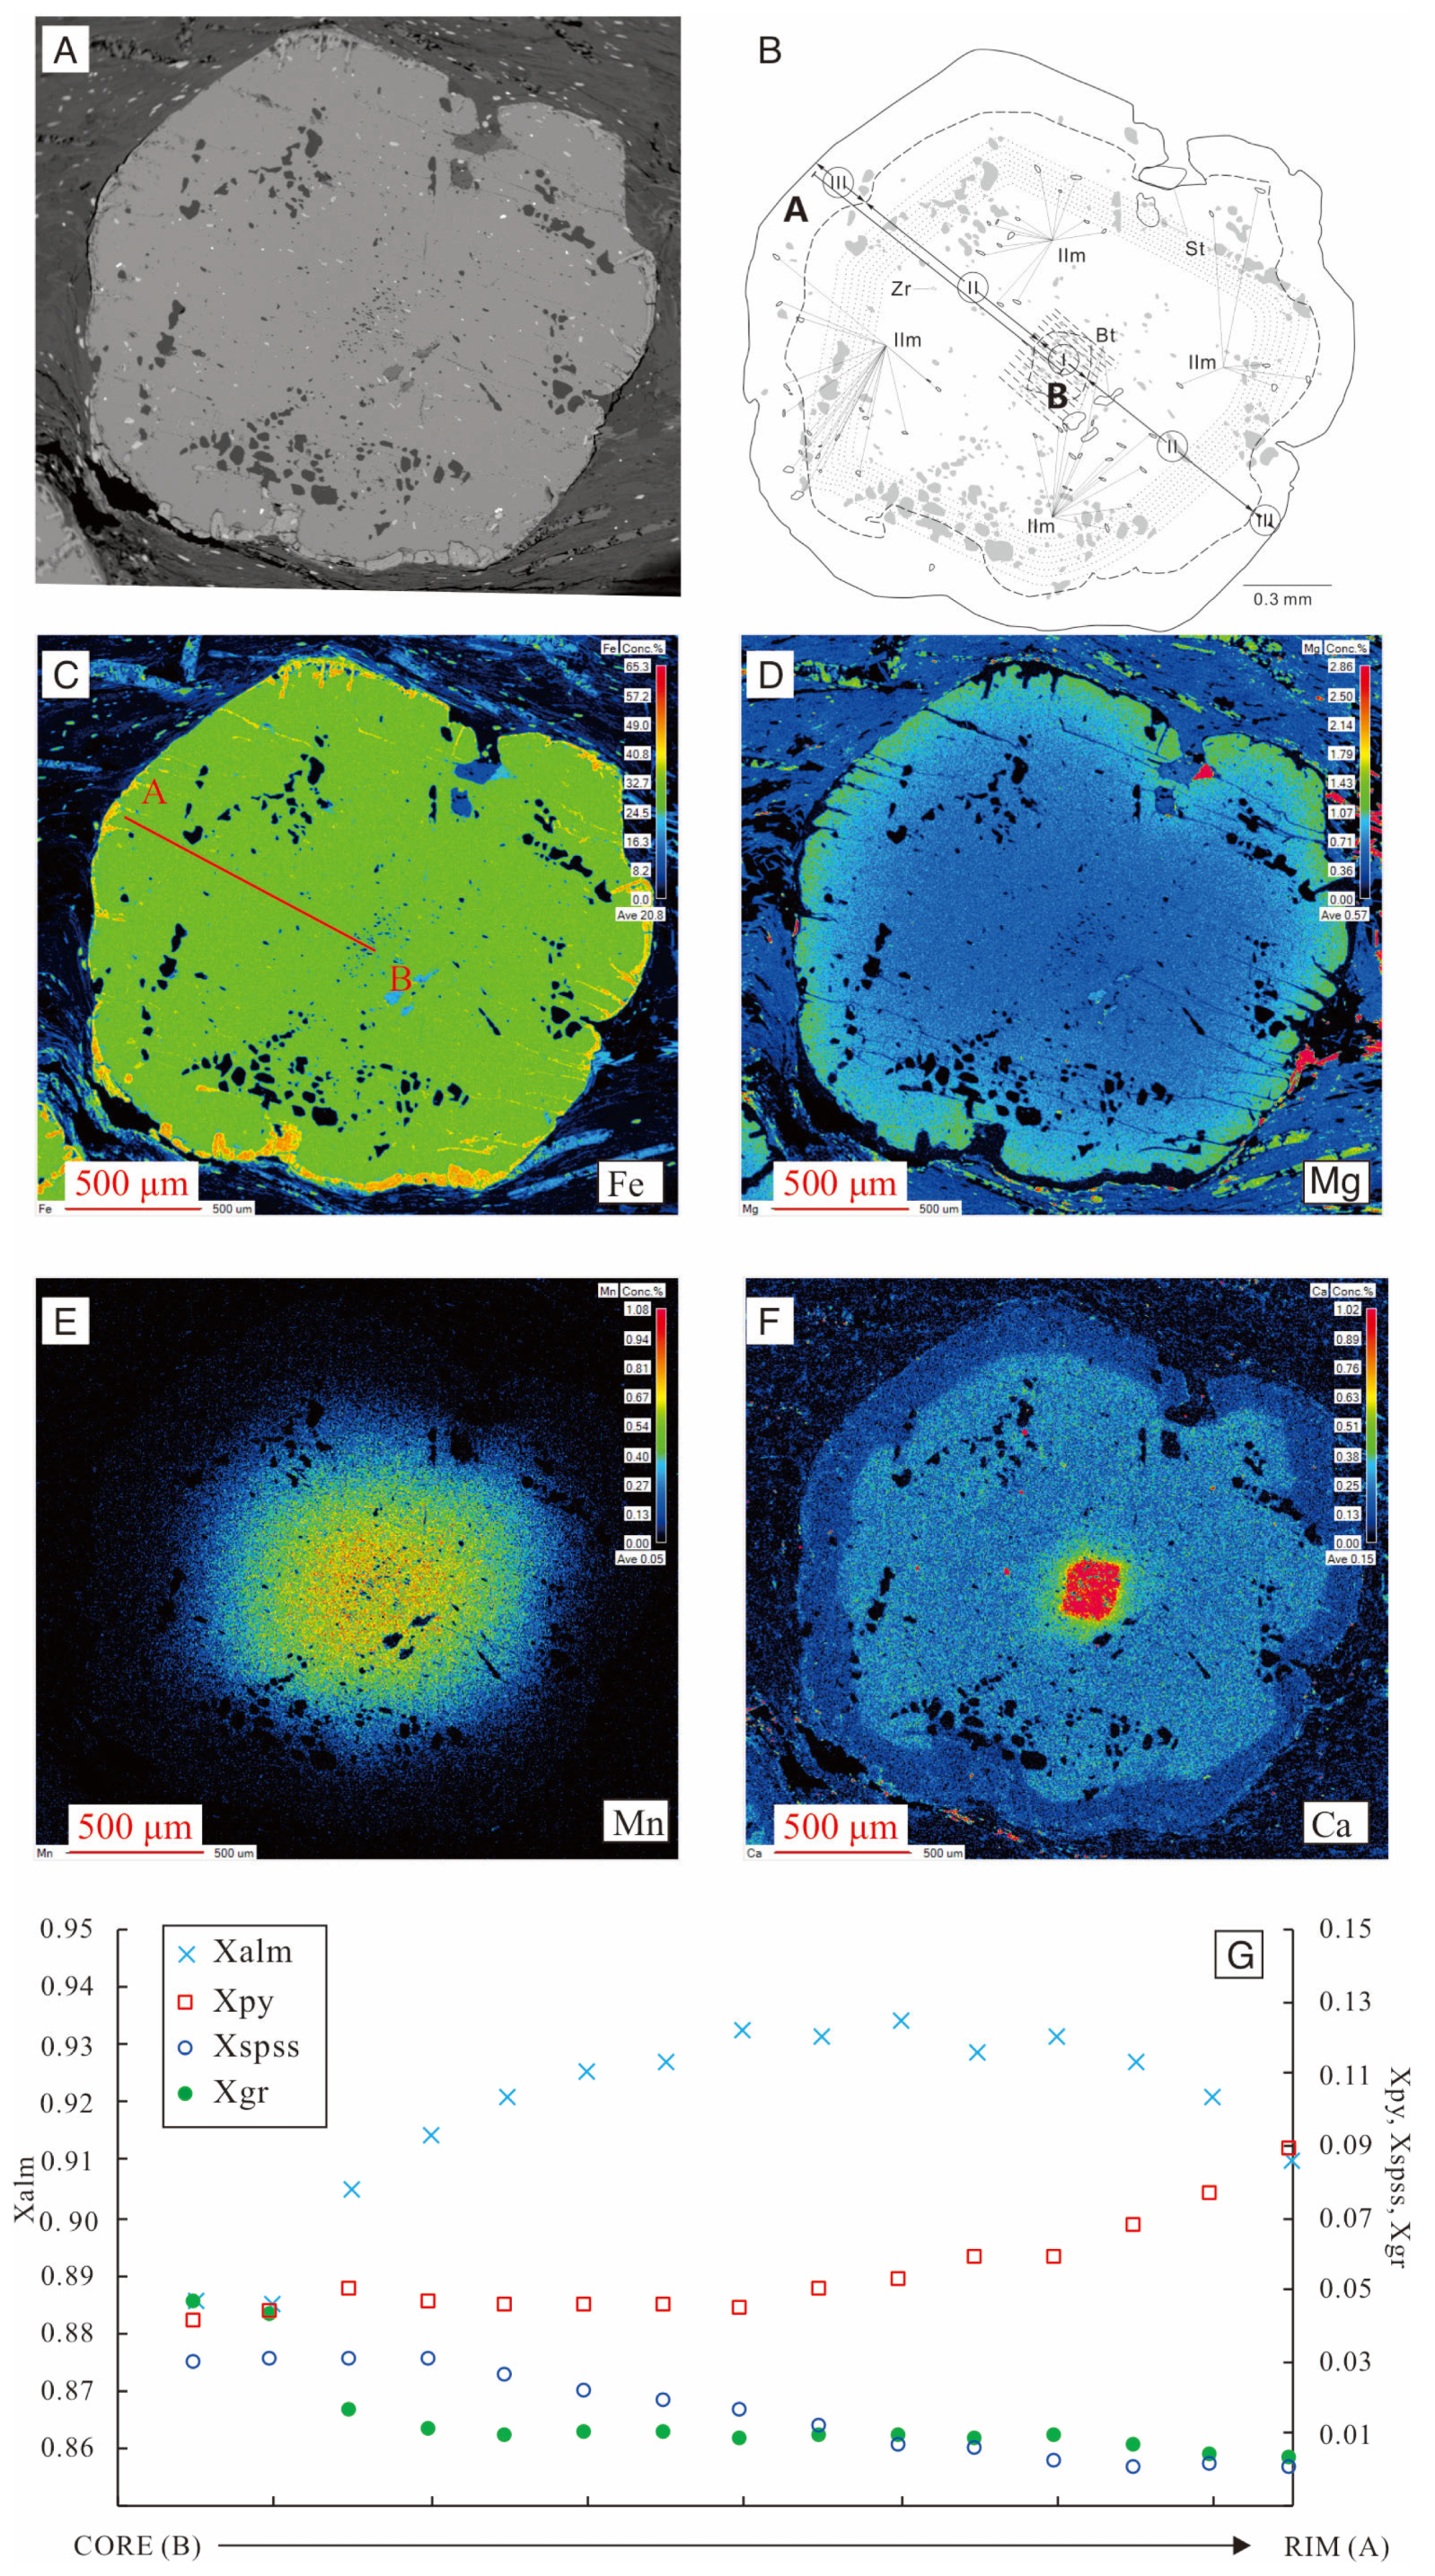
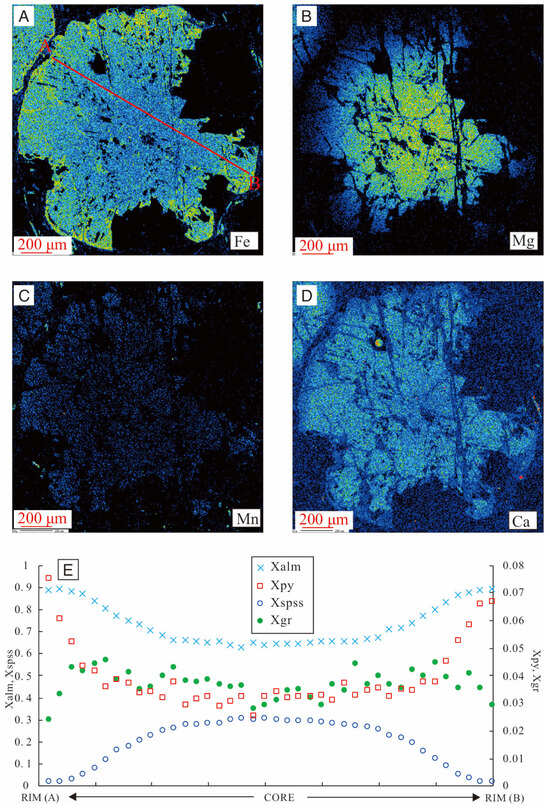
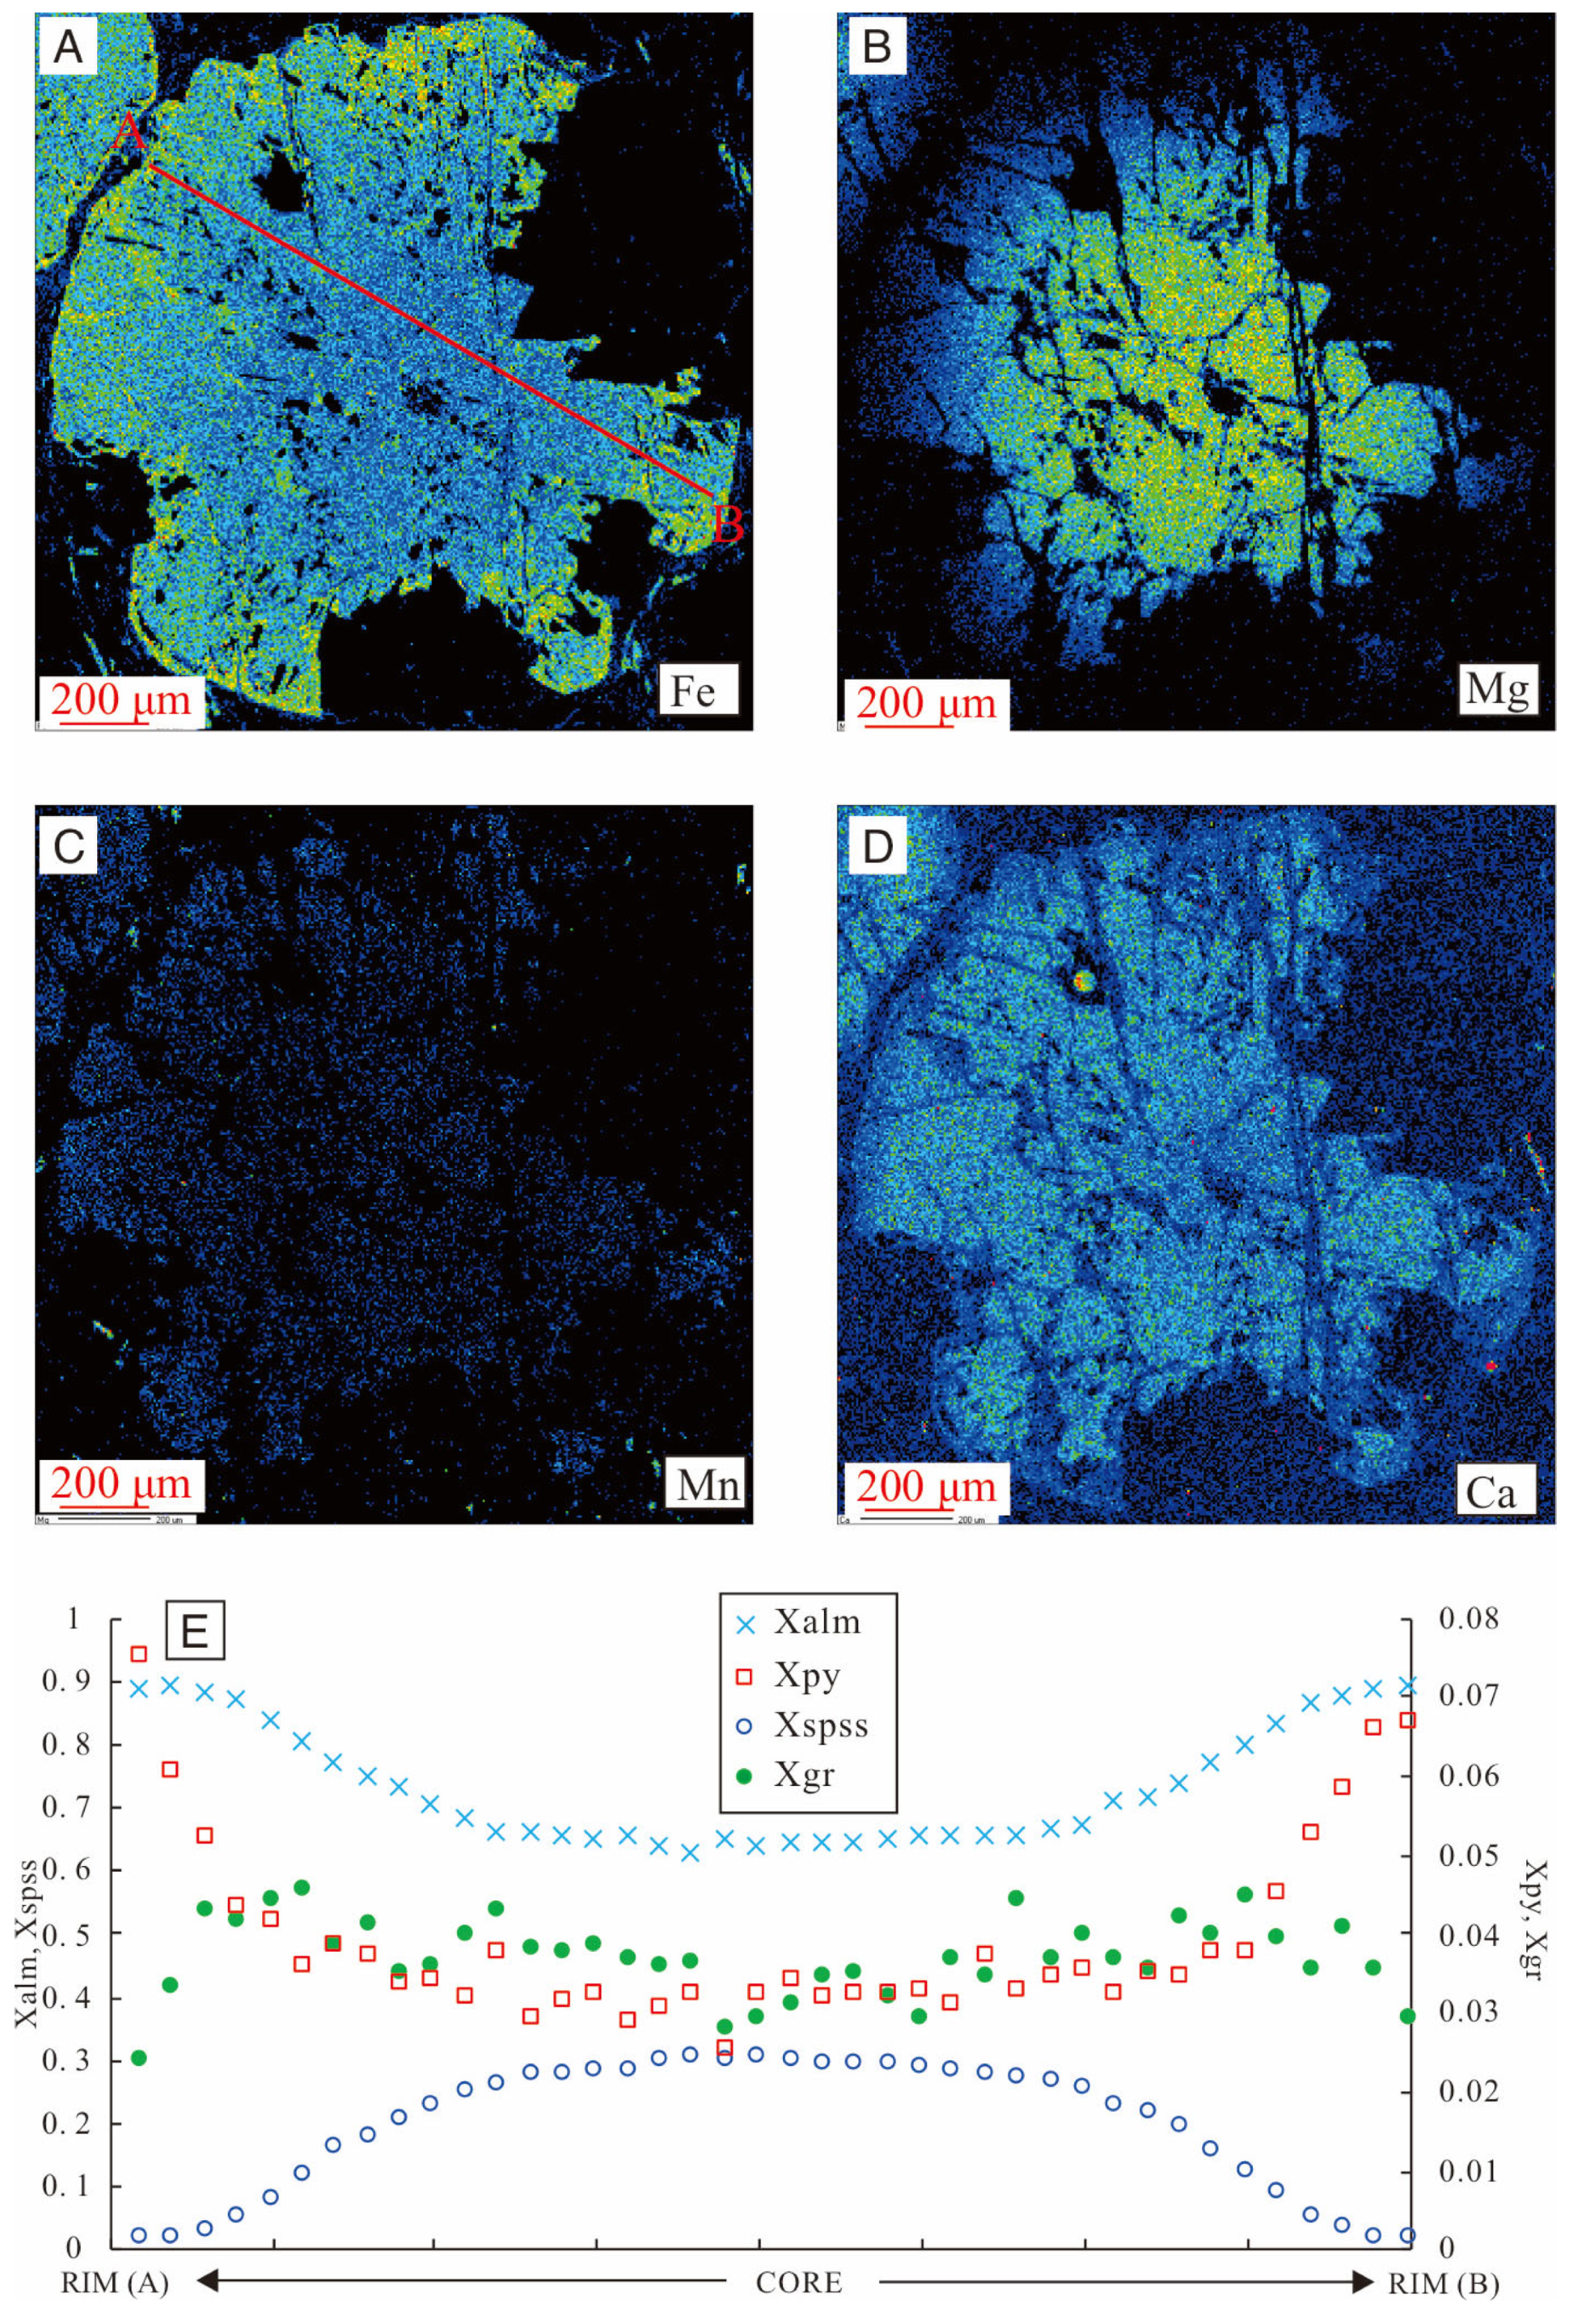
The representative garnet in sample CSD-3 is a euhedral crystal (~2 mm) showing a well-developed core–mantle–rim structure defined by inclusion distribution (Figure 8). The core hosts abundant fine quartz inclusions; the mantle contains fewer, but larger quartz inclusions whose arrangement approximately outlines a prograde garnet growth surface. The rim is inclusion-poor except for sparse staurolite inclusions. Concentric grossular (Xgr) bands on X-ray maps coincide with these inclusion-defined growth zones (Figure 8). The EPMA results show well-zoned prograde profiles from core to rim (Figure 8), with Xspss (spessartine) decreasing gradually from 0.029 to 0.01. The Xgr (grossularite) profile can be divided into three segments. In the core (the innermost two points), Xgr is nearly constant at about 0.045; in the mantle zone, Xgr decreases gradually from 0.016 to 0.006; and in the rim (the outermost two points), Xgr remains at a low level of about 0.002. The Xalm (almandine) increased from 0.89 to 0.93 from core to mantle and dropped to 0.90 in the rim. Xpy (pyrope) increases slightly from 0.040 to 0.066 from core to rim and increases to 0.088 in the rim (Table S1). The garnets in the contact metamorphic sample SQ18-11A are dominated by almandine, with end-member variations of Xalm = 0.62–0.89, Xspss = 0.02–0.31, Xpy = 0.03–0.07, and Xgr = 0.03–0.05, corresponding to FeO contents of 26.13–39.37 wt.%, MnO of 0.69–12.72 wt.%, MgO of 0.61–1.77 wt.%, and CaO of 0.79–1.54 wt.% (Table S1, Figure 9). From core to rim, almandine and pyrope display smooth, trough-shaped zoning profiles, with Xalm increasing from ~0.62 to ~0.89 and Xpy increasing from ~0.03 to ~0.07. X gr remains relatively flat and low (0.02–0.06). The continuous decrease in Mn coupled with the progressive increase in Fe and Mg from core to rim is a characteristic feature of Rayleigh fractionation during increasing temperature. The lack of any abrupt compositional discontinuities or reversals in these components indicates a single, continuous prograde growth event, effectively ruling out multiple/polyphase garnet growth.
Figure 8.
(A) Microscopic photo of the measured garnet of sample CSD-3. (B) Mineral inclusions in the central section of the measured garnet (quartz inclusions are illustrated in gray; dotted lines correspond to inclusion trails; dashed line refers to the Ca concentration difference between mantle and rim areas). Coarser quartz inclusions in the mantle roughly define pre-outline of the garnet. The compositional profile is marked by traverse from point A to B. (C–F) X-ray maps of garnet crystals from sample CSD-3 showing relative concentrations of the elements Fe, Mg, Ca, and Mn. (G) Compositional zoning profiles of garnet end-members from core to rim.
Figure 9.
(A–D) X-ray maps of garnet crystals from sample SQ18-11A showing relative concentrations of the elements Fe, Mg, Ca, and Mn. (E) Compositional zoning profiles of garnet end-members from rim to rim.
6. Discussion
6.1. Nucleation and Growth Mechanisms of the Garnets
Crystallization kinetics fundamentally dictate the spatial distribution of minerals. In interface-controlled systems, the initial chemical potential surrounding the crystals is relatively uniform. Because the overall reaction rate is limited by the attachment of constituents to the crystal surface rather than constituents’ transport, the spatial distribution of these crystals tends to be random [11], and inter-crystal spacing aligns with random expectations [3,41]. Conversely, in diffusion-controlled systems, constituents’ diffusion through the intergranular medium is slower than the surface reaction. This disparity creates chemical depletion zones around growing crystals that suppress nearby nucleation, pushing the spatial distribution toward ordering and causing inter-crystal spacing to exceed that of a random distribution [3,41]. These distinct kinetic mechanisms therefore produce quantifiable differences in spatial correlations and size–isolation relationships [11].
To quantify these spatial distributions, single-value statistics such as the ordering index (OI), clustering index (CI), and impingement index (II) were evaluated against a 95% confidence interval for a random distribution. As shown in Table 2, most single-value statistics of both contact samples (SQ18-11A and XZ18-27A) display clustering distributions. However, the seven Nanjiao samples yield highly inconsistent and ambiguous classifications among the OI, CI, and II. This ambiguity arises from the complex, combined effects of crystal volume fraction, number density, and localized clustering [11].
Due to the limitations of single-value statistics, scale-dependent spatial statistics (PCF and MCF’) are necessary to accurately decipher the crystallization mechanisms. The PCF values for all nine samples are approximately 1 and plot above the 2-sigma interface-controlled envelope (Figure 5), indicating an overall spatial clustering. The PCF evaluates the probability of finding crystal centers at a given distance from one another. In an ideal, homogeneous medium, diffusion-controlled growth creates local constituent depletion zones that force crystals to be uniformly spaced apart, generating a distinct spatial ordering signal. However, metamorphic protoliths often contain compositional heterogeneities, such as micro-banding or localized domains enriched in garnet-forming elements. In such inhomogeneous rocks, nucleation is chemically restricted to these fertile domains, causing the garnets to naturally form in pronounced spatial clusters. This primary clustering effect dominates the spatial distribution data, maintaining high PCF values and effectively overwhelming the smaller-scale ordering signal that would otherwise indicate diffusion-controlled depletion zones [11]. Consequently, macroscopic clustering masks the microscopic kinetic signature in the PCF, making it necessary to rely on the MCF’, which evaluates size–isolation relationships and is significantly less sensitive to the initial bulk inhomogeneity of the protolith [11]. For all Nanjiao metamorphic samples, the MCF’ curves fall within the interface-controlled null-hypothesis envelope, indicating an absence of significant growth suppression from constituent competition. This suggests their nucleation and growth are governed by interface-controlled processes. In contrast, the two contact samples exhibit divergent MCF’ results: sample XZ18-27A demonstrates interface-controlled growth, whereas sample SQ18-11A indicates diffusion-controlled growth. These statistical interpretations are corroborated by petrographic observations. Sample SQ18-10, collected from the same outcrop and compositionally identical to SQ18-11A, exhibits a distinct halo depleted in biotite and other Fe-Mg-bearing minerals around the garnet porphyroblasts (Figure 3j). Because garnet and biotite compete for the same chemical constituents, primarily iron and magnesium, this localized scarcity of Fe-Mg minerals indicates the formation of a chemical depletion zone. As the garnet grew, it consumed these elements in its immediate vicinity faster than they could be replenished by intergranular diffusion, which strongly supports a diffusion-controlled growth mechanism. Conversely, sample XZ18-27A features biotite flakes closely clustered around garnet porphyroblasts (Figure 3i), which is consistent with interface-controlled nucleation and growth.
6.2. Controlling Factors on Garnet Nucleation Mechanisim in Contact Metamorphism
The change in chemical affinity, the driving force for the reaction, within a rock depends on the rate of heat influx and crystallization [3]. When crystallization cannot keep up with the heat influx, the nucleation rate of crystals will begin to increase with the increase in temperature [3]. During metamorphism, nucleation requires the system to reach and maintain a high affinity [3,5,54,55]. When the crystals nucleate and begin to grow, they will continuously deplete the system’s affinity through compositional fractionation, reducing the driving force for subsequent nucleation; heating increases the reaction affinity; the higher the heating rate, the more affinity is supplied for more frequent or sustained nucleation events [3]. If the heating rate is low, affinity replenishment is insufficient and the nucleation rate will decline or cease [3,55]. Thermal overstepping dictates that garnet does not nucleate immediately at the equilibrium boundary, but instead requires excess temperature to overcome kinetic barriers, which leads to a substantial accumulation of chemical affinity [55]. Once nucleation is finally triggered, this stored affinity drives an initial, highly accelerated phase of garnet growth. As this rapid crystallization quickly consumes the accumulated affinity, the growth rate subsequently decelerates and becomes constrained by the ongoing heating rate and constituents’ transport [3].
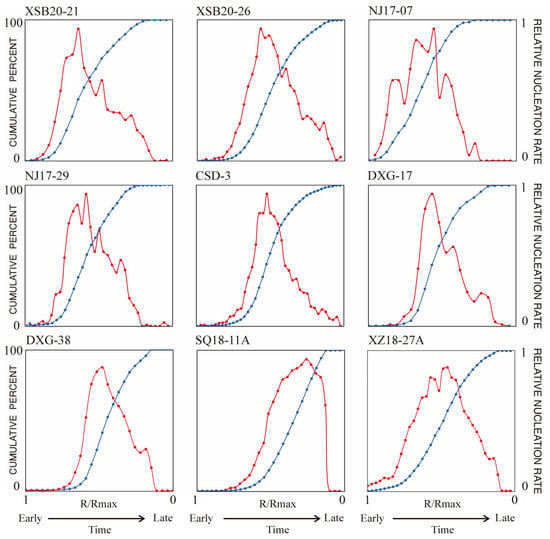
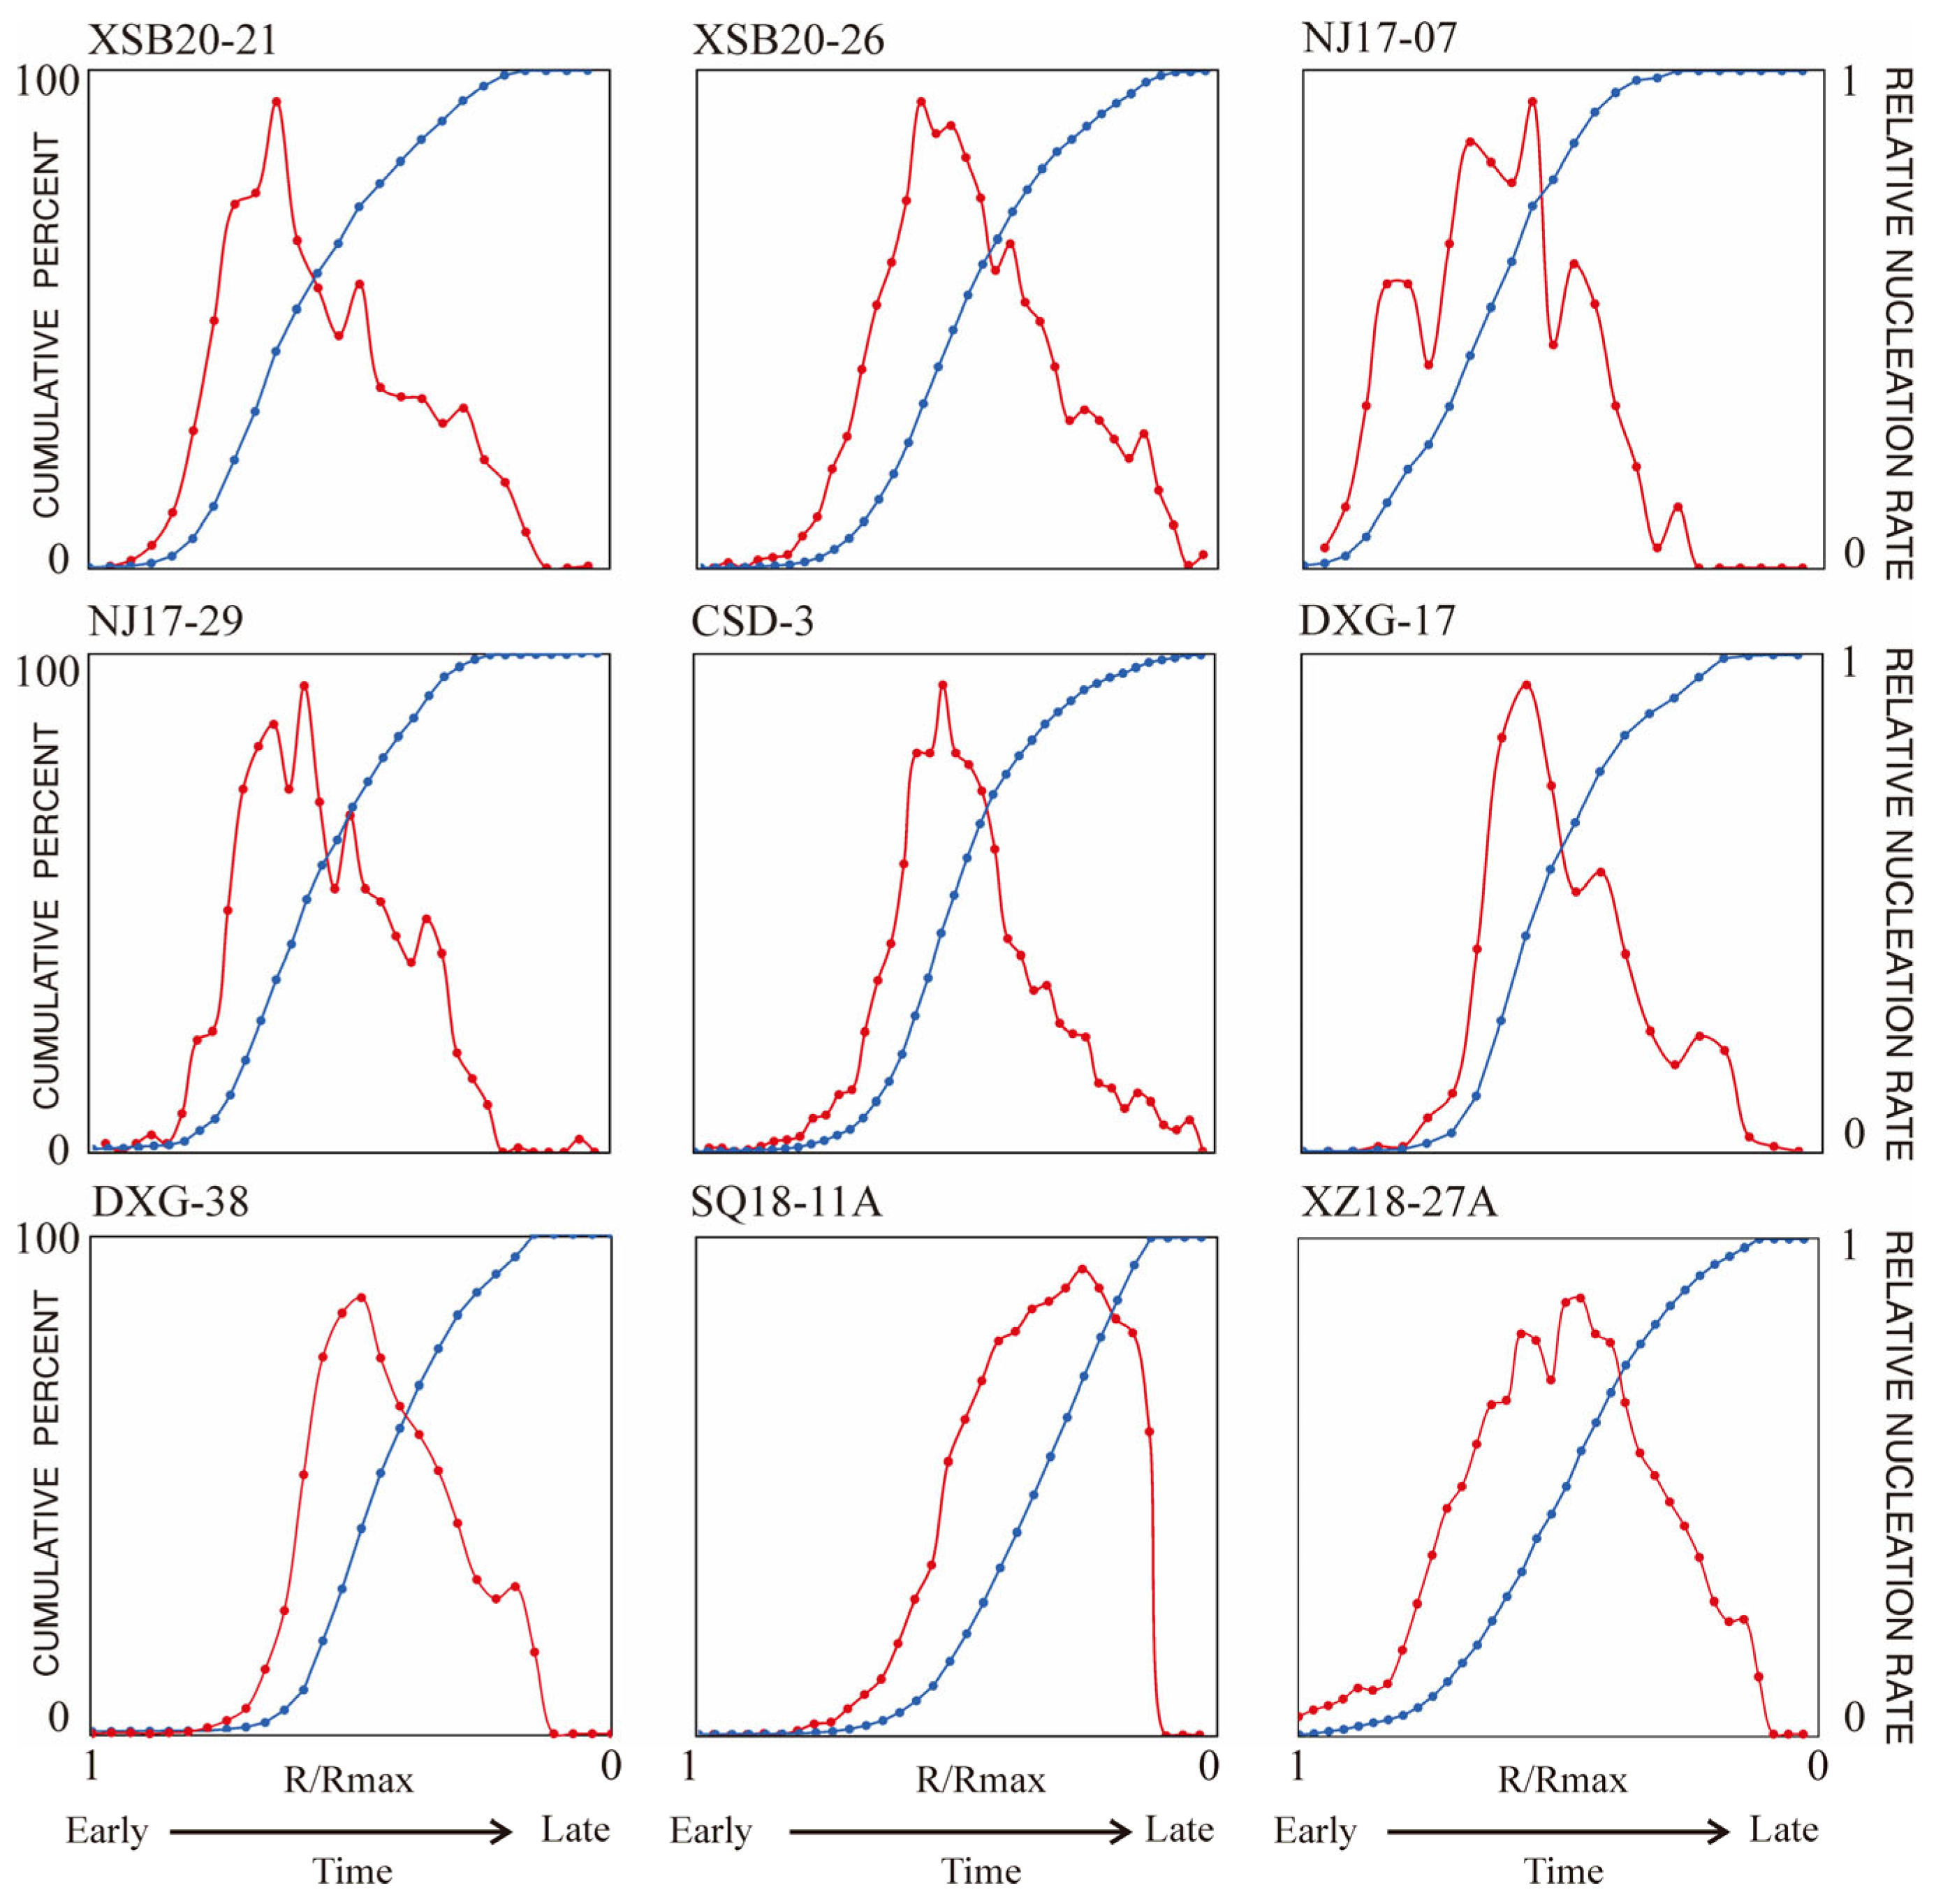
For any given sample, assuming that all of its garnets were generated by the same reaction and grew by the same radial increments within the same time interval regardless of their size, then the number of crystals of different sizes represents the number of crystals crystallized in different time intervals. Therefore, in all the nucleation and growth intervals of garnets, it can be simply considered that the rate of increase in total crystal numbers with decreasing size is the relative nucleation rate. A chart was adapted from Kretz [7,56] and Carlson [3] to illustrate the relationship between nucleation rate and relative time, as shown in the nucleation curve (blue line) in Figure 10; the x-axis represents the relative time from the beginning to termination of garnet nucleation, and the slope of any given point represents the relative nucleation rate at that time point (Figure 10, red line). It is worth noting that the heating and cooling rates of metamorphism may not be constant, that is the nucleation curve does not linearly correspond to time, but the slope change in the nucleation curve can still be a solid qualitative description of nucleation rate change over time.
Figure 10.
Nucleation curves (blue line) and relative nucleation rate curves (red line) for the studied samples. The relative nucleation rate curve is derived from the slope of the nucleation curve. Each sample was divided into 50 bins based on its maximum size.
The metamorphic garnets from Nanjiao exhibit characteristics of interface-controlled nucleation and growth (Figure 5). Their nucleation curves indicate that the accumulation of crystal numbers was slower at first, faster in the middle with a relatively constant nucleation rate, and then slowed down towards smaller size classes, displaying sigmoidal nucleation curves (Figure 10). Their associated relative nucleation rate curves display broad profiles, showing a gradual increase followed by a distinct gradual decline over time (Figure 10). These sigmoidal nucleation curves and changes in nucleation rates suggest that both the heating and cooling processes were relatively gentle. Under this circumstance, the difference between reaction affinity consumed by nucleation and affinity replenishment is not large. The initial nucleation rate increases gradually through slow heating and affinity accumulates.
Although the Fangshan contact metamorphic garnets were produced by the same intrusive complex, their metamorphic histories vary due to the pluton’s polyphase nature. The later quartz monzodiorite was the principal heat source [28]. Sample SQ18-11A, situated near this main heat source, experienced rapid, intense heating and pronounced thermal overstepping. This triggered a delayed, explosive nucleation burst in a diffusion-constrained system, producing a J-shaped nucleation curve dominated by small crystals before being suppressed by overlapping depletion zones [3,11]. In contrast, sample XZ18-27A was shielded from the main heat source by an earlier monzodiorite block, resulting in an attenuated, gradual heat flux. Consequently, XZ18-27A exhibits interface-controlled crystallization with bell-shaped CSDs and sigmoidal nucleation curves, remarkably similar to the Nanjiao metamorphic samples. This similarity challenges the traditional view that contact metamorphism inherently produces distinct textures like linear CSDs [2]. Because both samples share similar pelitic protoliths, this shift from diffusion-controlled to interface-controlled kinetics demonstrates that the localized heating rate may be the primary control on crystal size distributions.
In the diffusion-controlled systems, Carlson [3] attributed the late-stage deceleration to the progressive impingement of constituent depletion zones surrounding growing crystals. As these halos expand and overlap, they effectively reduce the volume of un-depleted matrix available for new nucleation events, thereby suppressing further nucleation due to the scarcity of viable sites. In contrast, in our samples where such diffusion gradients are absent, we propose that this decline is fundamentally driven by whole-rock constituents’ exhaustion [5,7,55], rather than by the geometric saturation of nucleation sites [3,11].
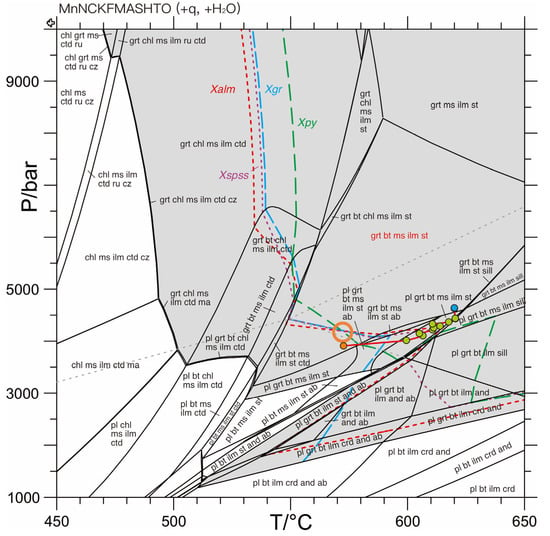
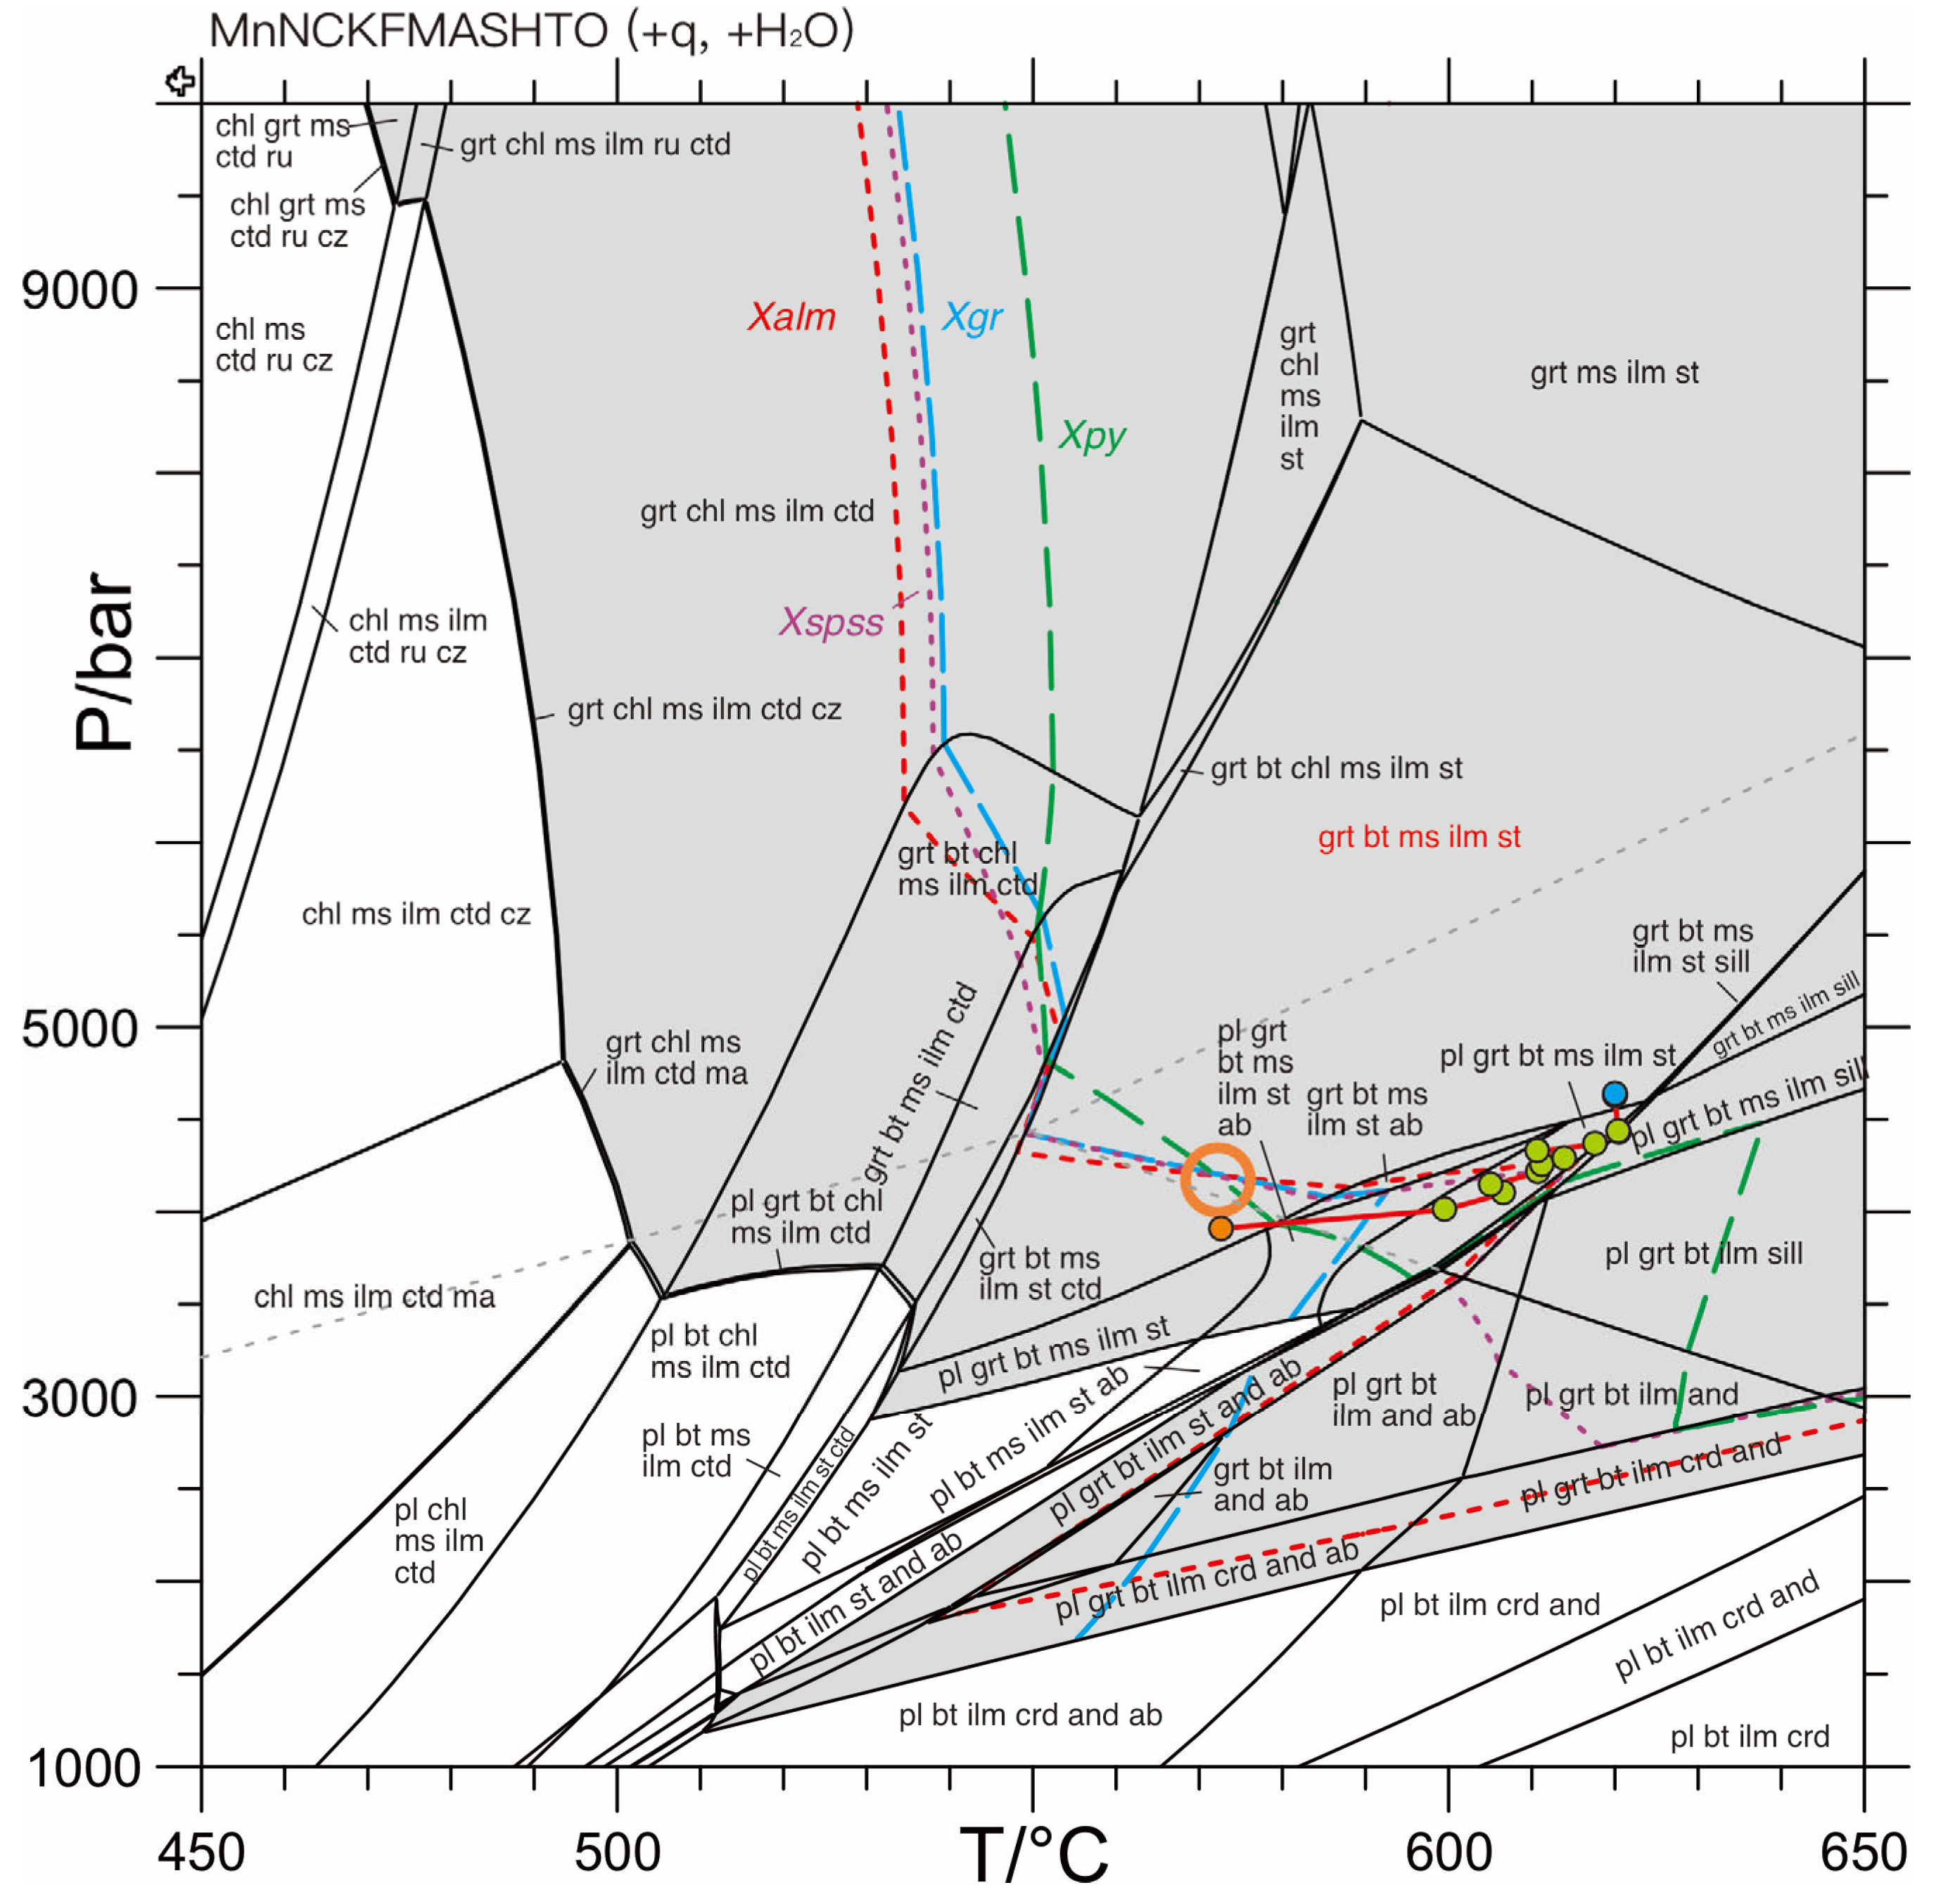
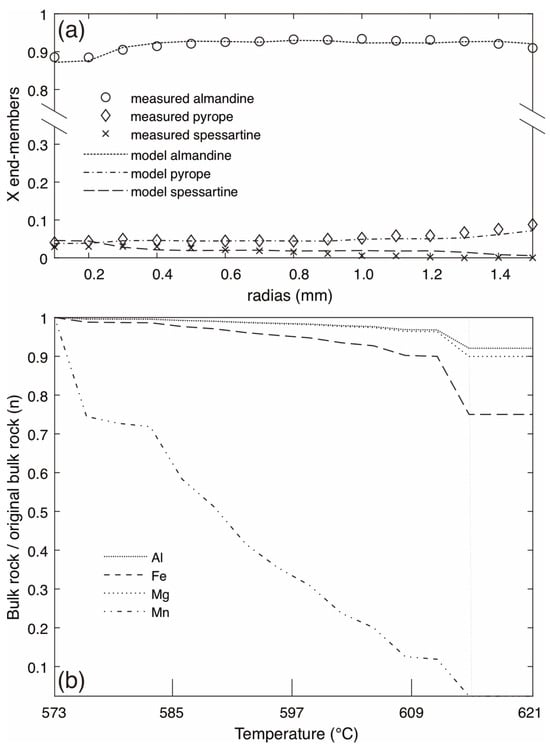
Thermodynamic phase equilibrium modeling of sample CSD-3 provides quantitative evidence for the decline of nucleation rates in interface-controlled systems. The pseudosection of sample CSD-3 indicates that the peak mineral assemblage (Grt-Bt-Ms-Ilm-St) is stable across a broad, wedge-shaped region in P-T space. This peak assemblage is predicted to persist over temperatures ranging from 550 to 650 °C and pressures between approximately 3.1 and 8.25 kbar (Figure 11). The isopleths corresponding to the garnet core (Xalm = 0.88, Xpy = 0.04, Xgr = 0.02, Xspss = 0.05) intersect tightly at a relatively low-temperature position within the stability field of the peak metamorphic assemblage, yielding P-T conditions of approximately 572 °C and 4.2 kbar (Figure 11). The selected garnet grain is among the largest in the thin section and displays the most distinct and complex zoning. Its core contains abundant fine-grained quartz inclusions, while the inner mantle zone hosts fewer inclusions. In contrast, the outer mantle is characterized by numerous large, anhedral quartz inclusions that broadly outline the former margin of the garnet. The rim is a zone with only sparse inclusions (Figure 3f and Figure 8). The resulting P-T path is characterized by an isothermal heating stage from 573 to 620 °C and followed by a compressional stage with a pressure increasement of 0.9 kbar (Figure 11), which are comparable to the 550–660 °C interval and >5.5 kbar pressure conditions recorded by Wang [18]. The heating stage corresponds to zones I and II of the measured garnet, and the compressional stage corresponds to the zone III. The effective bulk compositional change along the P-T path is shown in Figure 12b; the garnet-forming elements decrease due to garnet fractionation. Calcium is not shown in Figure 13 because grossularite was disabled during the modeling. The Mn concentration is depleted to zero after fractionation of step 13, and the EBC is retained in the next two steps because the misfit function based on Xalm, Xpy, and Xspss neglects the low Xspss cutoff.
Figure 11.
Pseudosection of sample CSD-3 in the MnNCKFMASHT system; the peak assemblage is marked with red label. Measured garnet core isopleths are shown for mole fraction of almandine (Xalm), pyrope (Xpy), grossular (Xgr), and spessartine (Xspss). Gray dashed line indicates univariant curve of Al2SiO5 polymorphs. Gray area is stable for garnet. The orange circle indicates intersection of the isopleths of Xalm, Xpy, and Xspss. The orange dot is calculated with the garnet core composition. The green dots are from the mantle regions, and the blue dots are from the rim. All labeled assemblages include quartz and H2O. Mineral abbreviations: grt: garnet; chl: chlorite; st: staurolite; ctd: chloritoid; ru: rutile; ilm: ilmenite; cz: clinozoizite; ma: margarite; pl: plagioclase; bt: biotite; ms: muscovite; crd: cordierite; ab: albite; sill: sillimanite; and: andalusite.
Figure 12.
(a) Observed compositional zoning and modeled garnet compositions calculated by the fractionation model along the best-fit P-T path. (b) Changes in the effective bulk composition along the P-T path. Note that manganese is completely consumed after step 13 in the simulation, and the bulk composition is retained in later steps.
Figure 13.
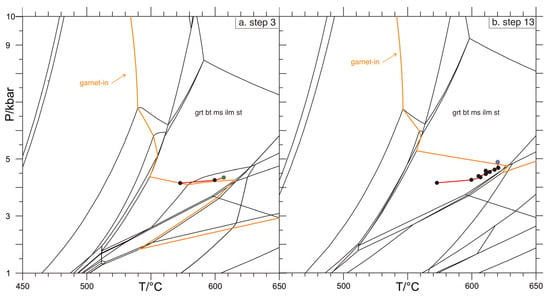
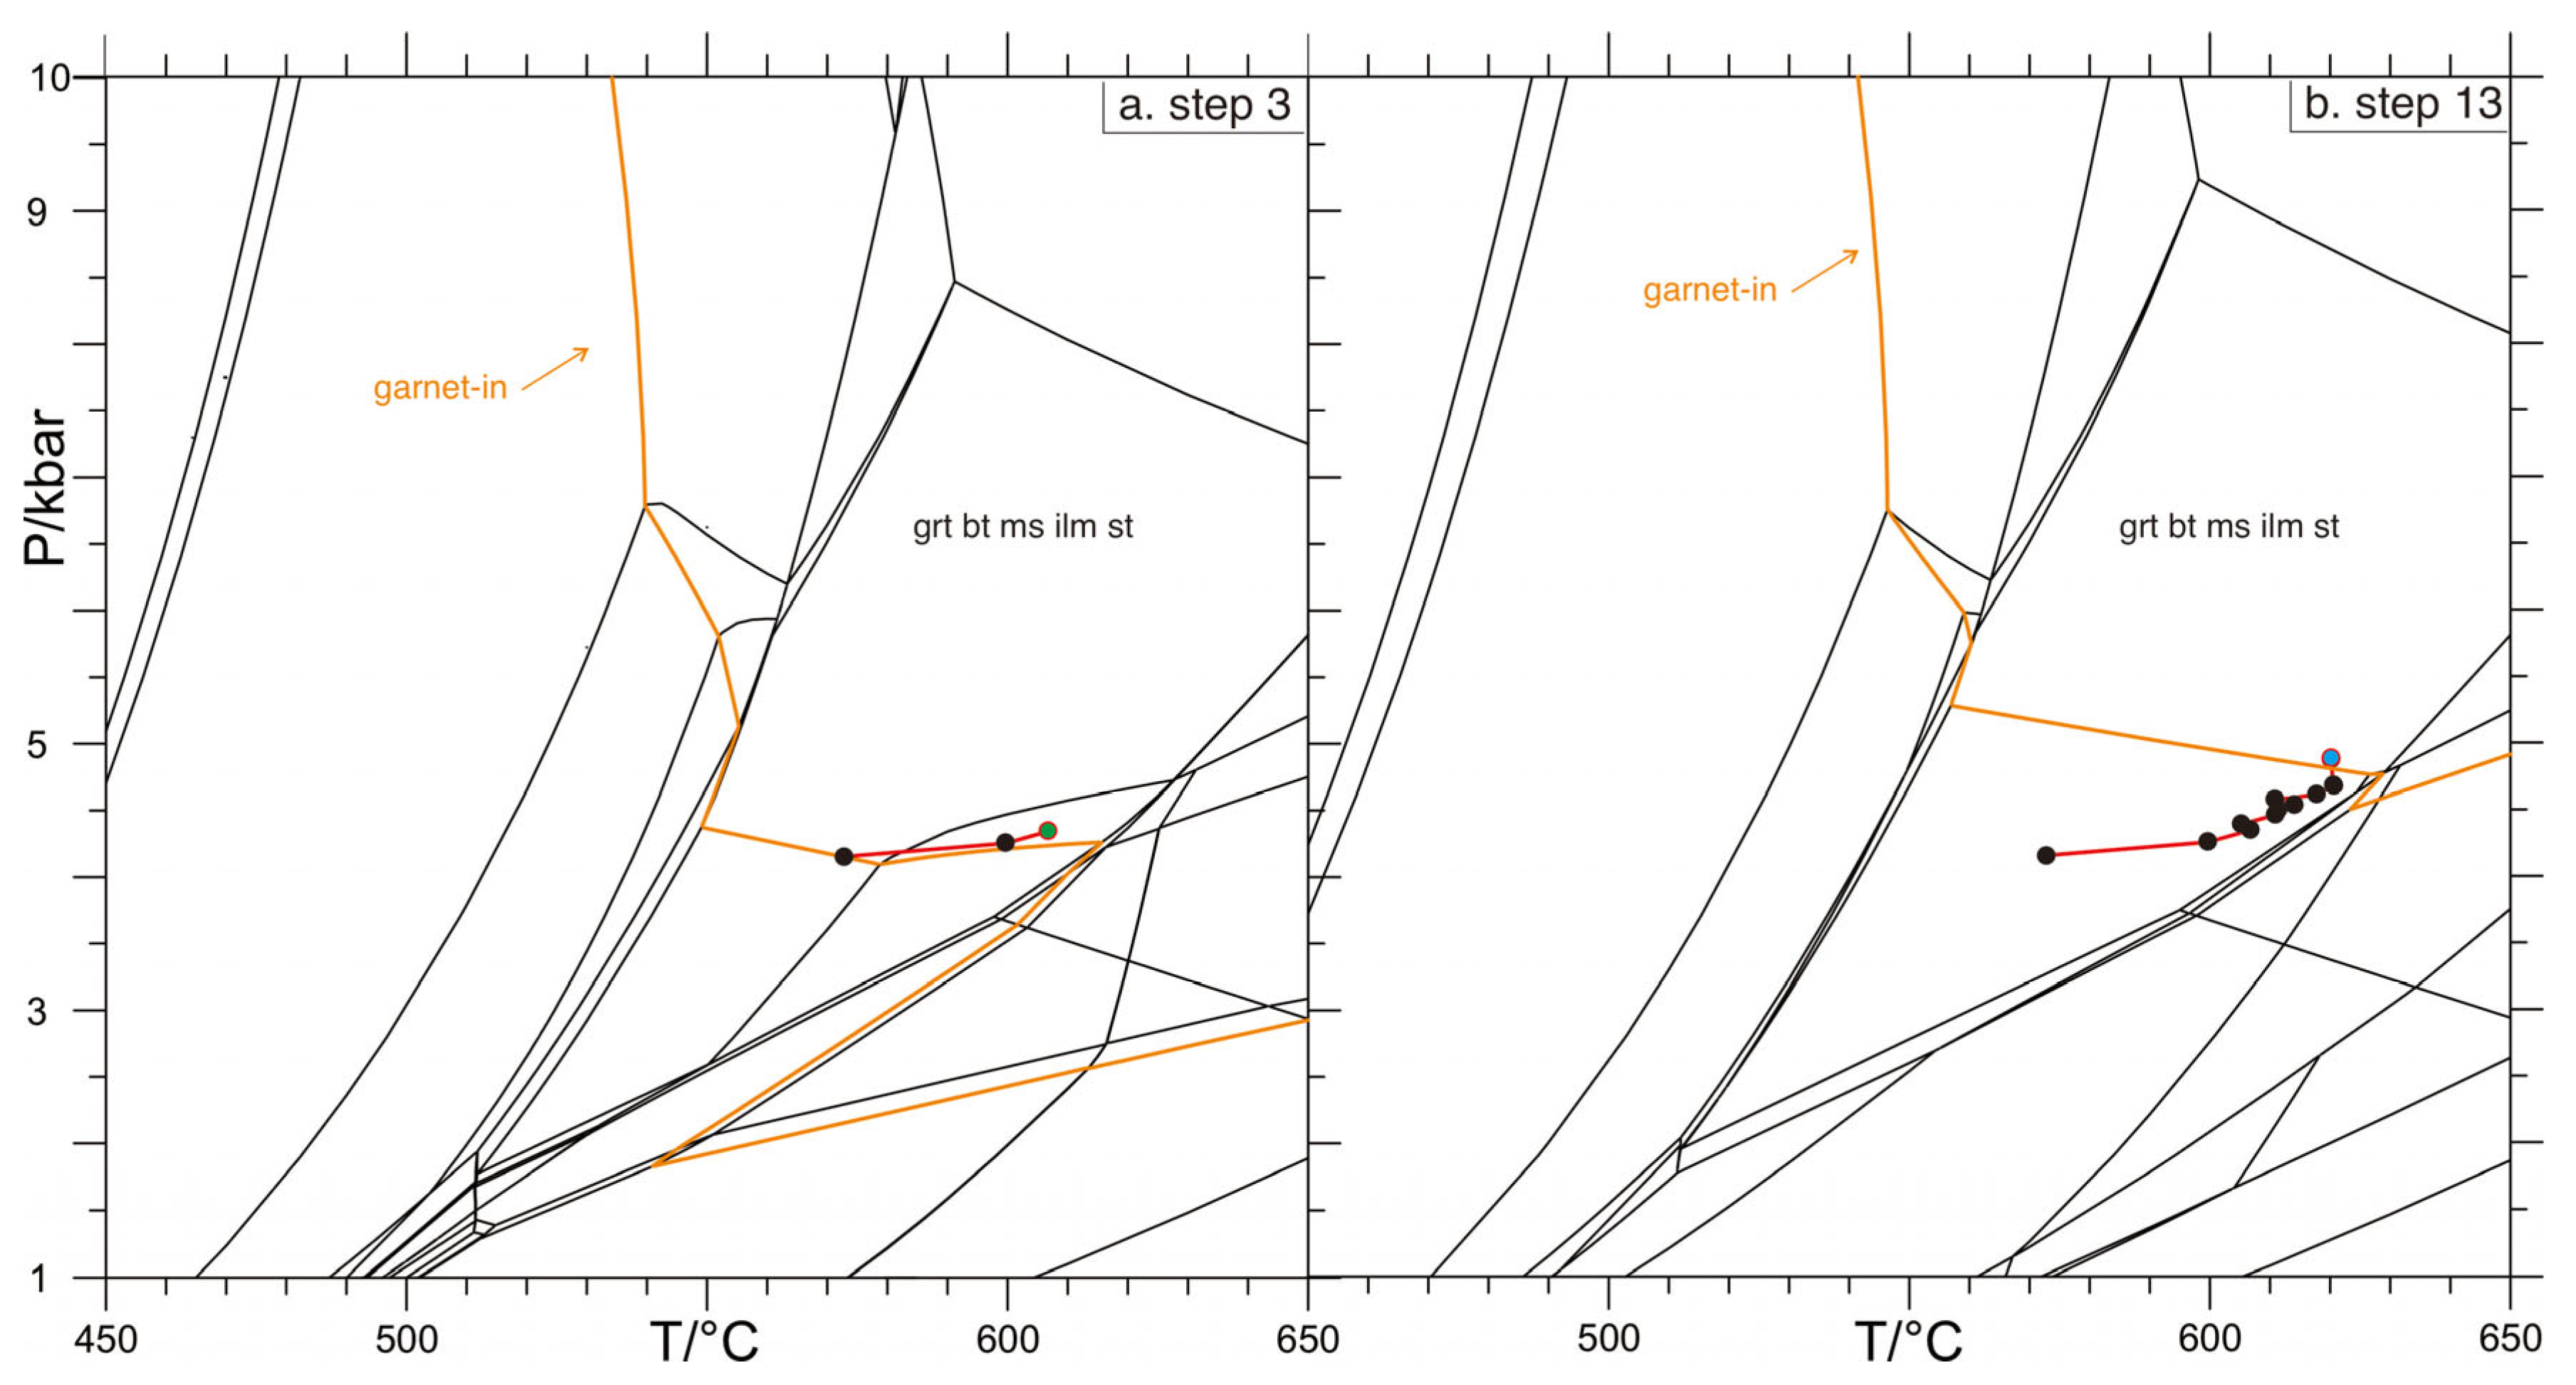
(a) Pseudosection of the effective bulk rock composition after removing the crystallized garnet at step 3 (corresponding to the third EPMA spot from core to rim). (b) Pseudosection of the effective bulk rock composition adjusted after removing the crystallized garnet at step 13 (corresponding to the 13th EPMA spot from core to rim). The black dots represent simulation steps before step 3 and step 13, while the green dots represent the simulations of step 3 in (a) and step 13 in (b), respectively.
The pseudosection adjusted by responding to the EBC adjustment, the stability fields of garnet, staurolite, etc., to shift to higher-temperature and pressure regions (Figure 13). The modeled and observed compositional profiles of garnet along this P-T path are shown in Figure 12, exhibiting a good correlation before reaching the crystal rim. Furthermore, the fractionation of garnet altered the effective bulk composition, causing the stability fields of some minerals, such as plagioclase, to disappear in the subsequent pseudosections (Figure 13b). Although plagioclases only take up to less than 1 mol% of the equilibrium mineral assemblage even without garnet fractionation, no plagioclase was found within the sample.
As the initial garnets nucleate and begin to grow following thermal overstepping, they strongly consume highly compatible elements from the matrix (Figure 12b). The stepwise EBC models reveal that this continuous fractionation drastically alters the thermodynamic topology of the remaining matrix (Figure 13). With progressive garnet growth, the garnet-in phase boundary shifts significantly towards higher temperatures and slightly higher pressures, which rapidly decreases the chemical affinity available for subsequent nucleation at any given temperature. By the time the reaction reaches the peak nucleation rate, the EBC is already severely depleted in garnet-forming chemicals. Consequently, even with continuous heat influx during prograde metamorphism, the thermodynamic driving force drops well below the kinetic threshold required to trigger new nucleation events. The phase equilibrium modeling quantitatively confirms that the late-stage deceleration of nucleation in these interface-controlled systems is fundamentally driven by the chemical evolution of the EBC and whole-rock constituents’ exhaustion, rather than the geometric impingement of diffusion halos.
7. Conclusions
In this study, we employed high-resolution X-ray μ-CT to conduct quantitative 3D textural analysis of garnets from contact metamorphic rocks in the Fangshan dome, combined with garnet compositional profile, and thermodynamic modeling; we reached the following main conclusions:
- The crystal size distribution of metamorphic minerals is not directly controlled by the macroscopic tectonic setting of contact or regional metamorphism. Even within contact aureoles, samples can develop bell-shaped CSD curves remarkably similar to those of regional metamorphic rocks. This indicates that the traditional dichotomous view associating contact metamorphism with linear CSDs and regional metamorphism with bell-shaped CSDs has limitations.
- Heating rate is likely the fundamental driving force determining the transition of crystallization kinetics from interface-controlled to diffusion-controlled regimes. Spatial proximity to the principal heat source directly dictates the variations in localized heat flux and heating rate. High heating rates lead to severe thermal overstepping and trigger explosive nucleation under diffusion control, whereas low heating rates correspond to a gentle nucleation and growth history under interface control.
- Thermodynamic phase equilibrium modeling demonstrates that in interface-controlled systems, the late-stage deceleration of nucleation rate is primarily controlled by the continuous chemical fractionation of the effective bulk composition and whole-rock constituents’ exhaustion. With the progressive growth of garnet, the relevant chemical constituents in the matrix are strongly consumed, causing the available chemical affinity to drop below the kinetic nucleation threshold, thereby terminating new nucleation events.
Supplementary Materials
The following supporting information can be downloaded at: https://www.mdpi.com/article/10.3390/min16070673/s1, Table S1: EPMA data of garnet of samples CSD-3 and SQ18-11A (wt.%).
Author Contributions
Conceptualization, N.C. and Z.Z.; methodology, Z.Z.; software, Z.Z.; validation, Z.Z. and N.C.; formal analysis, Z.Z.; investigation, N.C. and Z.Z.; resources, N.C.; data curation, Z.Z.; writing—original draft preparation, Z.Z.; writing—review and editing, N.C.; visualization, Z.Z.; supervision, N.C.; project administration, N.C.; funding acquisition, N.C. All authors have read and agreed to the published version of the manuscript.
Funding
This research was funded by the National Natural Science Foundation of China (No. 41672060), and by China University of Geosciences (Wuhan) Education Projects (Nos. ZL201610, 2018G36). The APC was funded by the authors.
Data Availability Statement
The data presented in this study are available on request from the first author due to internal policy.
Acknowledgments
The authors would like to thank associate Bing Xia, Binghan Chen, Tingting Yang, and Hai Li for their valuable support and help during the field sample collection. We are deeply grateful to the Editor-in-Chief, the handling editor, and the anonymous reviewers for their time, effort, and invaluable comments during the review process, which have fundamentally strengthened the presentation and conclusions of this paper.
Conflicts of Interest
The authors declare no conflicts of interest.
Abbreviations
The following abbreviations are used in this manuscript:
| Ab | albite |
| And | andalusite |
| BBGMR | Beijing Bureau of Geology and Mineral Resources |
| Bt | biotite |
| CAS | Chinese Academy of Sciences |
| Chl | chlorite |
| CI | clustering index |
| cm3 | Cubic centimeter |
| Crd | cordierite |
| CSD/CSDs | crystal size distribution(s) |
| Ctd | chloritoid |
| Cz | clinozoizite |
| EBC | effective bulk composition |
| EPMA | electron probe microanalyzer |
| Ga | Giga-annum |
| Grt | garnet |
| II | impingement index |
| Ilm | ilmenite |
| kV/μA | Kilovolt/Microampere |
| Ma | margarite |
| Ma | Mega-annum |
| MCF’ | mark correlation function |
| mm/μm | Millimeter/Micrometer |
| Ms | muscovite |
| NCC | North China Craton |
| OI | ordering index |
| P/T | pressure/temperature |
| PCF | pair correlation function |
| Pl | plagioclase |
| Qtz | quartz |
| RSD | relative standard deviation |
| Ru | rutile |
| Sill | sillimanite |
| St | staurolite |
| TTG | Tonalitic–trondhjemitic–granodioritic |
| WDS | wavelength-dispersive spectrometer |
| Xalm | mole fraction of almandine |
| Xgr | mole fraction of grossular |
| Xpy | mole fraction of pyrope |
| XRF | X-ray Fluorescence |
| Xspss | mole fraction of spessartine |
| μ-CT | micro-computed tomography |
References
- Marsh, B.D. Crystal Size Distribution (CSD) in Rocks and the Kinetics and Dynamics of Crystallization: I. Theory. Contrib. Mineral. Petrol. 1988, 99, 277–291. [Google Scholar]
- Cashman, K.V.; Ferry, J.M. Crystal Size Distribution (CSD) in Rocks and the Kinetics and Dynamics of Crystallization: III. Metamorphic Crystallization. Contrib. Mineral. Petrol. 1988, 99, 401–415. [Google Scholar]
- Carlson, W.D. The Significance of Intergranular Diffusion to the Mechanisms and Kinetics of Porphyroblast Crystallization. Contrib. Mineral. Petrol. 1989, 103, 1–24. [Google Scholar] [CrossRef] [Scilit]
- Skelton, A. The Effect of Metamorphic Fluid Flow on the Nucleation and Growth of Garnets from Troms, North Norway. J. Metamorph. Geol. 1997, 15, 85–92. [Google Scholar] [CrossRef] [Scilit]
- Gaidies, F.; Pattison, D.; De Capitani, C. Toward a Quantitative Model of Metamorphic Nucleation and Growth. Contrib. Mineral. Petrol. 2011, 162, 975–993. [Google Scholar] [CrossRef] [Scilit]
- Azpiroz, M.D.; Fernández, C. Characterization of Tectono-Metamorphic Events Using Crystal Size Distribution (CSD) Diagrams. A Case Study from the Acebuches Metabasites (SW Spain). J. Struct. Geol. 2003, 25, 935–947. [Google Scholar] [CrossRef] [Scilit]
- Kretz, R. Some Models for the Rate of Crystallization of Garnet in Metamorphic Rocks. Lithos 1974, 7, 123–131. [Google Scholar] [CrossRef] [Scilit]
- Carlson, W.D.; Pattison, D.R.; Caddick, M.J. Beyond the Equilibrium Paradigm: How Consideration of Kinetics Enhances Metamorphic Interpretation. Am. Mineral. 2015, 100, 1659–1667. [Google Scholar] [CrossRef] [Scilit]
- Fisher, G.W. Rate Laws in Metamorphism. Geochim. Cosmochim. Acta 1978, 42, 1035–1050. [Google Scholar] [CrossRef] [Scilit]
- Petley-Ragan, A.; Gaidies, F.; Pattison, D. A Statistical Analysis of the Distribution of Cordierite and Biotite in Hornfels from the Bugaboo Contact Aureole: Implications for the Kinetics of Porphyroblast Crystallization. J. Metamorph. Geol. 2016, 34, 85–101. [Google Scholar] [CrossRef] [Scilit]
- Hirsch, D.M.; Ketcham, R.A.; Carlson, W.D. An Evaluation of Spatial Correlation Functions in Textural Analysis of Metamorphic Rocks. Geol. Mater. Res. 2000, 2, 1–42. [Google Scholar]
- Denison, C.; Carlson, W.; Ketcham, R. Three-dimensional Quantitative Textural Analysis of Metamorphic Rocks Using High-resolution Computed X-ray Tomography: Part I. Methods and Techniques. J. Metamorph. Geol. 1997, 15, 29–44. [Google Scholar]
- Carlson, W.D. The Case against Ostwald Ripening of Porphyroblasts. Can. Mineral. 1999, 37, 403–413. [Google Scholar]
- Sanità, E.; Di Rosa, M.; Lardeaux, J.-M. Formation and Preservation of Carpholite in Low Blueschist Facies Assemblages: Implications for the H2O Budget at Seismogenic Zone Depth. J. Geol. Soc. 2026, 183, jgs2025-117. [Google Scholar]
- Sanità, E.; Di Rosa, M.; Lardeaux, J.M.; Marroni, M.; Tamponi, M.; Lezzerini, M.; Pandolfi, L. Deciphering the Pressure-temperature Path in Low-Grade Metamorphic Rocks by Combining Crystal Chemistry, Thermobarometry and Thermodynamic Modelling: An Example in the Marguareis Massif, Western Ligurian Alps, Italy. Mineral. Mag. 2025, 89, 203–224. [Google Scholar]
- Liu, G.; Wu, J. Metamorphic Zones of the Fangshan Area in Beijing. Bull. Chin. Acad. Geol. Sci. 1987, 16, 113–136. [Google Scholar]
- Shan, W.; Wang, F.; Fu, Z. On the Tectonic Evolution of Cover Rocks in the Southern Part of West-Hill, Beijing. Earth Sci. 1989, 14, 37–44. [Google Scholar]
- Wang, F.Z. The Discovery of Kyanite Metamorphic Belts and Its Geological Meaning on West-Hill, Beijing. In Geological Study of Western Hills, Beijing; China University of Geosciences Press: Wuhan, China, 1990; pp. 83–91. [Google Scholar]
- Kröner, A.; Wilde, S.A.; Zhao, G.; O’Brien, P.; Sun, M.; Liu, D.Y.; Wan, Y.; Liu, S.; Guo, J.H. Zircon Geochronology and Metamorphic Evolution of Mafic Dykes in the Hengshan Complex of Northern China: Evidence for Late Palaeoproterozoic Extension and Subsequent High-Pressure Metamorphism in the North China Craton. Precambrian Res. 2006, 146, 45–67. [Google Scholar] [CrossRef] [Scilit]
- Liu, S.; Zhao, G.; Wilde, S.A.; Shu, G.; Sun, M.; Li, Q.; Tian, W.; Zhang, J. Th–U–Pb Monazite Geochronology of the Lüliang and Wutai Complexes: Constraints on the Tectonothermal Evolution of the Trans-North China Orogen. Precambrian Res. 2006, 148, 205–224. [Google Scholar]
- Wang, Y.; Zhou, L.; Li, J. Intracontinental Superimposed Tectonics—A Case Study in the Western Hills of Beijing, Eastern China. Bulletin 2011, 123, 1033–1055. [Google Scholar]
- Yan, D.; Zhou, M.; Song, H.; Liu, D.; Wang, Y.; Wang, C.; Dong, T. A Geochronological Constraint to the Guandi Complex, Western Hills of Beijing, and Its Implications for the Tectonic Evolution. Earth Sci. Front. 2005, 12, 332–337. [Google Scholar]
- Zhong, Y.; He, C.; Chen, N.-S.; Xia, B.; Zhou, Z.; Chen, B.; Wang, G. Tectonothermal Records in Migmatite-like Rocks of the Guandi Complex in Zhoukoudian, Beijing: Implications for Late Neoarchean to Proterozoic Tectonics of the North China Craton. J. Earth Sci. 2018, 29, 1254–1275. [Google Scholar] [CrossRef] [Scilit]
- Gao, L.; Zhang, C.; Shi, X.; Song, B.; Wang, Z.; Liu, Y. Mesoproterozoic Age for Xiamaling Formation in North China Plate Indicated by Zircon SHRIMP Dating. Chin. Sci. Bull. 2008, 53, 2665–2671. [Google Scholar] [CrossRef] [Scilit]
- Tong, J.; Xu, R.; Yuan, Y. Lithostratigraphy and Reconstruction of Sedimentary Sequence and Environment in Zhoukoudian Area of Beijing. J. Earth Sci. Environ. 2013, 35, 15–23. [Google Scholar]
- Beijing Bureau of Geology and Mineral Resources (BBGMR). Regional Geology of Beijing Municipality; Ministry of Geology and Mineral Resources, Geological Memoirs, Series 1, No. 27; Geological Publishing House: Beijing, China, 1991.
- Wang, C. On the Chloritoid Belt in Western Hills of Peking. Bull. Geol. Soc. China 1951, 31, 23–30. [Google Scholar] [CrossRef] [Scilit]
- Chen, B.H. Study on Contact Metamorphism around Fangshan Pluton, Beijing. Ph.D. Thesis, China University of Geosciences (Wuhan), Wuhan, China, 2024. [Google Scholar]
- Davis, G.A.; Yadong, Z.; Cong, W.; Darby, B.J.; Changhou, Z.; Gehrels, G. Mesozoic Tectonic Evolution of the Yanshan Fold and Thrust Belt, with Emphasis on Hebei and Liaoning Provinces, Northern China; Geological Society of America: Boulder, CO, USA, 2001. [Google Scholar]
- Zhang, L.; Liu, B.; Chen, N.; Li, X.; Zhang, Z.; Liu, S.; Yuan, Y. Age of the Granitoid Pluton from Nanjiao, Zhoukoudian, Beijing and Iys Geological Implication. Geol. Sci. Technol. Inf. 2008, 27, 43–46. [Google Scholar]
- Zhang, S.M. Mesozoic Magmatism and Metamorphism in the Western Hills of Beijing and Their Constraints on Lithospheric Thickness Variations in Eastern North China; Geological Publishing House: Beijing, China, 2010. [Google Scholar]
- Yan, D.-P.; Zhou, M.-F.; Zhao, D.; Li, J.-W.; Wang, G.-H.; Wang, C.-L.; Qi, L. Origin, Ascent and Oblique Emplacement of Magmas in a Thickened Crust: An Example from the Cretaceous Fangshan Adakitic Pluton, Beijing. Lithos 2011, 123, 102–120. [Google Scholar] [CrossRef] [Scilit]
- Sun, J.-F.; Yang, J.-H.; Wu, F.-Y.; Li, X.-H.; Yang, Y.-H.; Xie, L.-W.; Wilde, S.A. Magma Mixing Controlling the Origin of the Early Cretaceous Fangshan Granitic Pluton, North China Craton: In Situ U–Pb Age and Sr-, Nd-, Hf-and O-Isotope Evidence. Lithos 2010, 120, 421–438. [Google Scholar]
- Xu, H.; Song, Y.; Ye, K.; Zhang, J.; Wang, H. Petrogenesis of Mafic Dykes and High-Mg Adakitic Enclaves in the Late Mesozoic Fangshan Low-Mg Adakitic Pluton, North China Craton. J. Asian Earth Sci. 2012, 54, 143–161. [Google Scholar] [CrossRef] [Scilit]
- Beijing Bureau of Geology and Mineral Resources; China University of Geosciences. Regional and Mineral Resource Geology of the Zhoukoudian Area; Unpublished Report; Beijing Bureau of Geology and Mineral Resources: Beijing, China; China University of Geosciences: Beijing, China, 1988. [Google Scholar]
- Chen, B.; Chen, N. PT Paths of Contact Metamorphism Constraints on Emplacement Mechanism of Magmas of the Zoned Fangshan Granitic Plutons, Zhoukoudian, Western Hills of Beijing, China. Lithos 2024, 482, 107685. [Google Scholar]
- Li, Z.Z. The Microstructure of Shear Zone of Fangshan Intrusion. In The Geological Study of Xishan, Beijing; China University of Geosciences Press: Wuhan, China, 1990; pp. 64–72. [Google Scholar]
- Zhang, J.S.; Li, Z.Z. Emplacement Deformations and Ballooning Mechanism about Fangshan Granodiorite Pluton, Beijing. In The Geological Study of Xishan, Beijing; China University of Geosciences Press: Wuhan, China, 1990; pp. 48–63. [Google Scholar]
- Yan-Fang, W.; Cun-Feng, W.; Jie-Min, Q.; Wen-Ding, Z.; Cui-Li, S.; Yan-Feng, S.; Ye-Mao, H.; Jiu-Chang, Z.; Rong-Jian, S.; Long, W. Development and Applications of Paleontological Computed Tomography. Vertebr. Palasiat. 2019, 57, 84. [Google Scholar]
- Ketcham, R.A. Computational Methods for Quantitative Analysis of Three-Dimensional Features in Geological Specimens. Geosphere 2005, 1, 32–41. [Google Scholar] [CrossRef] [Scilit]
- Hirsch, D.M. Reduce3D: A Tool for Three-Dimensional Spatial Statistical Analysis of Crystals. Geosphere 2011, 7, 724–732. [Google Scholar]
- Higgins, M.D. Quantitative Textural Measurements in Igneous and Metamorphic Petrology; Cambridge University Press: Cambridge, UK, 2006; ISBN 1-139-45814-0. [Google Scholar]
- Stoyan, D.; Stoyan, H. Fractals, Random Shapes and Point Fields: Methods of Geometrical Statistics; Wiley: Hoboken, NJ, USA, 1994. [Google Scholar]
- Ketcham, R.A.; Meth, C.; Hirsch, D.M.; Carlson, W.D. Improved Methods for Quantitative Analysis of Three-Dimensional Porphyroblastic Textures. Geosphere 2005, 1, 42–59. [Google Scholar] [CrossRef] [Scilit]
- Daniel, C.; Spear, F. The Clustered Nucleation and Growth Processes of Garnet in Regional Metamorphic Rocks from North-west Connecticut, USA. J. Metamorph. Geol. 1999, 17, 503–520. [Google Scholar] [CrossRef] [Scilit]
- de Capitani, C.; Brown, T.H. The Computation of Chemical Equilibrium in Complex Systems Containing Non-Ideal Solutions. Geochim. Cosmochim. Acta 1987, 51, 2639–2652. [Google Scholar] [CrossRef] [Scilit]
- De Capitani, C.; Petrakakis, K. The Computation of Equilibrium Assemblage Diagrams with Theriak/Domino Software. Am. Mineral. 2010, 95, 1006–1016. [Google Scholar] [CrossRef] [Scilit]
- Holland, T.; Powell, R. An Internally Consistent Thermodynamic Data Set for Phases of Petrological Interest. J. Metamorph. Geol. 1998, 16, 309–343. [Google Scholar] [CrossRef] [Scilit]
- Kelsey, D.; White, R.; Powell, R. Calculated Phase Equilibria in K2O-FeO-MgO-Al2O3-SiO2-H2O for Silica-undersaturated Sapphirine-bearing Mineral Assemblages. J. Metamorph. Geol. 2005, 23, 217–239. [Google Scholar] [CrossRef] [Scilit]
- Coggon, R.; Holland, T. Mixing Properties of Phengitic Micas and Revised Garnet-phengite Thermobarometers. J. Metamorph. Geol. 2002, 20, 683–696. [Google Scholar]
- Moynihan, D.; Pattison, D. An Automated Method for the Calculation of P–T Paths from Garnet Zoning, with Application to Metapelitic Schist from the Kootenay Arc, British Columbia, Canada. J. Metamorph. Geol. 2013, 31, 525–548. [Google Scholar] [CrossRef] [Scilit]
- Kelly, E.D.; Hoisch, T.D.; Wells, M.L.; Vervoort, J.D.; Beyene, M.A. An Early Cretaceous Garnet Pressure–Temperature Path Recording Synconvergent Burial and Exhumation from the Hinterland of the Sevier Orogenic Belt, Albion Mountains, Idaho. Contrib. Mineral. Petrol. 2015, 170, 20. [Google Scholar] [CrossRef] [Scilit]
- Gualda, G.A. Crystal Size Distributions Derived from 3D Datasets: Sample Size versus Uncertainties. J. Petrol. 2006, 47, 1245–1254. [Google Scholar] [CrossRef] [Scilit]
- George, F.R.; Gaidies, F. Characterisation of a garnet population from the Sikkim Himalaya: Insights into the rates and mechanisms of porphyroblast crystallisation. Contrib. Mineral. Petrol. 2017, 172, 57. [Google Scholar] [CrossRef] [Scilit]
- Spear, F.S. Garnet Growth after Overstepping. Chem. Geol. 2017, 466, 491–499. [Google Scholar] [CrossRef] [Scilit]
- Kretz, R. A Garnet Population in Yellowknife Schist, Canada. J. Metamorph. Geol. 1993, 11, 101–120. [Google Scholar] [CrossRef] [Scilit]

Disclaimer/Publisher’s Note: The statements, opinions and data contained in all publications are solely those of the individual author(s) and contributor(s) and not of MDPI and/or the editor(s). MDPI and/or the editor(s) disclaim responsibility for any injury to people or property resulting from any ideas, methods, instructions or products referred to in the content. |
© 2026 by the authors. Licensee MDPI, Basel, Switzerland. This article is an open access article distributed under the terms and conditions of the Creative Commons Attribution (CC BY) license.