


Abstract
Phosphatic deposits from the Lower Cambrian Pedroche Formation (Sierra de Córdoba, Spain) provide key insights into early diagenetic mineralization processes during the Cambrian radiation. This study applies an integrated multi-analytical approach combining Raman spectroscopy, SEM–EDS, LA-ICP-MS, and ToF-SIMS to investigate mineralogical, elemental, and molecular signatures of phosphatized bioclastic carbonates and associated siliciclastic facies from the Los Lagares-1 borehole. Results reveal a systematic phosphatization gradient from carbonate-dominated skeletal rims to phosphate-rich interiors composed of carbonate fluorapatite with variable carbonate and hydroxyl substitution. Trace-element systematics and REE patterns indicate seawater-influenced phosphogenesis under suboxic porewater conditions, coupled to iron reduction and early diagenetic clay mineral formation. In contrast, the siliciclastic siltstone facies preserves poorly crystalline phosphate phases associated with detrital aluminosilicates and chlorite, reflecting distinct porewater chemistry and crystallization kinetics. ToF-SIMS mapping demonstrates spatial coupling between fluorine and phosphate within fossil structures, confirming fluorapatite formation and localized organic matter entombment. These results highlight the strong control of host lithology on phosphate crystallization pathways and trace-element redistribution, and provide new constraints on microbially mediated phosphogenesis in restricted Early Cambrian reef–lagoon systems along the northern Gondwanan margin.
1. Introduction
The Lower Cambrian represents a pivotal period in Earth’s history, characterized by unprecedented biological diversification and the establishment of complex marine ecosystems during the Cambrian Explosion [1,2]. This critical interval witnessed not only the rapid evolution of metazoan life but also fundamental changes in ocean chemistry and biogeochemical cycling that profoundly influenced the preservation and mineralization of biological remains [3,4]. Among the most informative records of this transition are phosphatic deposits, which provide crucial insights into the interplay between biological productivity, ocean chemistry, and early diagenetic processes that governed fossil preservation [5,6]
Phosphatic materials from Cambrian sequences have long attracted scientific attention due to their exceptional preservation of early skeletal and soft-bodied organisms [7], their significance for understanding ancient nutrient cycling [8], and their role as archives of paleoenvironmental conditions [9]. The formation of these phosphatic deposits involves complex interactions between primary biological productivity, microbial metabolism, redox conditions, and the availability of dissolved phosphate in seawater [10]. However, the precise mechanisms controlling phosphate mineralization during the early Cambrian, particularly the relative contributions of abiotic geochemical processes vs. microbially mediated mineralization pathways, remain poorly understood [10,11].
Spain’s Lower Cambrian sequences, particularly those of the Pedroche Formation in the Sierra de Córdoba, offer exceptional opportunities to investigate these processes [12,13]. These deposits contain diverse phosphatic materials including nodular phosphorites, phosphatic fossil steinkerns, and phosphatized skeletal elements associated with calcimicrobial reef-lagoon systems [14,15]. Previous studies have established the broad stratigraphic and paleontological framework of these deposits [16,17,18,19], documenting their formation in the context of intense continental weathering [20,21], elevated nutrient fluxes [22], and the development of archaeocyath-calcimicrobial reef complexes [23]. However, detailed investigation of the mineralizing processes—particularly at the microscale where geochemical and microbial processes intersect—has remained limited [24].
This study employs a multi-analytical approach combining Raman spectroscopy, laser ablation inductively coupled plasma mass spectrometry (LA-ICP-MS), scanning electron microscopy with energy dispersive X-ray spectroscopy (SEM-EDS), and time-of-flight secondary ion mass spectrometry (ToF-SIMS) to investigate phosphatic materials from the Lower Cambrian Pedroche Formation. The primary objectives are to: (1) characterize the mineral phases, elemental compositions, and microscale spatial distributions of phosphatic, carbonate, and Fe–Mg phyllosilicate components across lagoonal facies; (2) resolve REE fractionation patterns and partitioning pathways from Fe(III)-oxyhydroxides to porewaters and ultimately into carbonate fluorapatite (CFA) [25]; (3) evaluate the role of microbial Fe reduction and localized sulfate reduction in mediating phosphate release, CFA precipitation, chlorite formation, and pyrite development under suboxic to micro-anoxic conditions [26,27,28]; and (4) reconstruct the sequence of early diagenetic reactions controlling CFA nucleation, REE incorporation, and mineral replacement within skeletal and matrix domains [29,30,31]. Beyond lithological control, this study also evaluates the role of depositional setting—reef vs. lagoon facies—as a secondary influence on phosphatization pathways, porewater redox gradients, and trace-element redistribution.
2. Geological and Sedimentary Settings
2.1. Regional Geology
The Los Lagares-1 borehole is located in the Sierra de Córdoba (southern Spain), in the Las Ermitas area [32] (Figure 1A–C). Geologically, the Sierra de Córdoba forms part of the Ossa-Morena Zone of the Iberian Massif, a tectonostratigraphic domain that records the late Neoproterozoic–early Cambrian transition along the northern margin of Gondwana [33]. During this interval, the region evolved from Cadomian arc-related magmatism to an extensional regime associated with continental rifting and the onset of shallow marine sedimentation [34]. In the study area, Neoproterozoic volcanic and volcaniclastic rocks of the San Jerónimo Formation are unconformably overlain by Lower Cambrian sedimentary successions of the Pedroche Formation, recording the establishment of carbonate-dominated platform and reef–lagoon systems [12] (Figure 1B).
Figure 1.
Geological setting and location of the Los Lagares-1 drill core. (A) Satellite image of the Iberian Peninsula showing the location of the study area near Córdoba in southern Spain (white rectangle). (B) Stratigraphic column of the Lower Cambrian succession in the Córdoba region, showing the position of the Los Lagares-1 borehole within the Pedroche Formation (red arrow). The succession comprises, from base to top: Neoproterozoic basement (San Jerónimo Formation), Terreneuvian Torreárboles Formation (Corduban), and Cambrian Series 2 consisting of the Pedroche Formation (Ovetian) and Santo Domingo Formation (Marianian), overlain by Cambrian Series 3 deposits including the Castellar and Los Villares formations. (C) High-resolution satellite image showing the location of the Lagares-1 borehole (37.923° N, −4.844° E) and the nearby Las Ermitas locality.
The Los Lagares-1 borehole preserves a continuous subsurface record of approximately 290 m, with its lower portion penetrating altered andesitic rocks of the San Jerónimo Formation [32] (Figure 2). A sharp lithological boundary at 105.80 m depth marks the transition from this volcanic basement to the overlying sedimentary succession. Above this contact, the Pedroche Formation is dominated by carbonate-rich facies interbedded with fine-grained siliciclastic sediments, recording sustained Lower Cambrian deposition [35].
Figure 2.
Simplified lithostratigraphic column of the Los Lagares-1 drill core showing the main lithological units and sedimentary facies of the Lower Cambrian Pedroche Formation. Polished slab photographs of the two analyzed samples are shown alongside the column: sample 101.8 m corresponds to a bioclastic phosphoritic carbonate; sample 102.6 m represents a greenish siltstone. The stratigraphic positions of the analyzed samples within the core are indicated by arrows.
2.2. Sedimentary Environments and Facies Interpretation
Sedimentation in the Los Lagares-1 section records the development of a shallow marine reef–lagoon system established on an irregular volcanic paleorelief [16,36]. The lower part of the sedimentary succession is dominated by green, purple, and ochre siltstones and marls, locally interbedded with nodular limestones, interpreted as lagoonal to marginal-lagoon deposits influenced by episodic siliciclastic input from adjacent continental areas [17].
Up-section, carbonate production increased significantly, leading to the development of nodular limestones and thick intervals of massive calcimicrobial limestone corresponding to reef-core and back-reef environments dominated by microbial communities and archaeocyathid frameworks [14,18,19]. The reef structures developed preferentially on elevated areas of the volcanic paleorelief and acted as semi-permeable barriers, partially isolating the lagoonal domain [37,38]. This geomorphological configuration restricted water circulation and favored the establishment of low-oxygen conditions within the lagoonal sediments [12] (Figure 2).
2.3. Phosphogenesis and Geochemical Context
The phosphatic deposits of the Pedroche Formation formed under the combined influence of elevated nutrient fluxes from continental weathering and microbially mediated diagenetic processes within the semi-restricted lagoonal environment [24,39]. Continental weathering under Early Cambrian elevated atmospheric CO2 conditions delivered Fe(III)-oxyhydroxides bearing adsorbed phosphate to the coastal zone [20,22], where subsequent microbial iron reduction in suboxic porewaters released dissolved phosphate that precipitated as carbonate fluorapatite [26,27]. This study examines two contrasting facies from the Los Lagares-1 core: a bioclastic phosphoritic limestone at 101.8 m depth representing carbonate-dominated reef-lagoon sedimentation, and a greenish siltstone at 102.6 m depth representing siliciclastic-dominated lagoonal deposition [12,13].
2.4. Fossil Context and Geobiological Significance
The fossil assemblage recorded in the Los Lagares-1 sedimentary succession closely matches that documented in the Las Ermitas outcrops and reflects a diverse Lower Cambrian benthic ecosystem. Reefal facies are dominated by calcimicrobes and archaeocyathids, forming boundstones and bioherms that constitute the main framework of the reef system. Lagoonal and back-reef deposits host abundant small shelly fossils, including hyoliths, chancellorids, mollusks, and other problematic skeletal taxa, many of which are preserved as phosphatic internal molds [16,25,40,41] (Figure 3A,B). The release of phosphate into pore waters was critically mediated by microbial iron reduction, whereby iron-reducing bacteria facilitated the reductive dissolution of Fe-oxyhydroxides, liberating adsorbed phosphate and promoting its local supersaturation and subsequent precipitation as carbonate fluorapatite within decaying organic substrates [24,42].
Figure 3.
Thin-section photomicrographs of representative lithologies from the Los Lagares-1 borehole. (A,B) Sample 101.8 m, bioclastic phosphoritic limestone. Phosphate (Ph) occurs both as internal molds filling skeletal cavities and as replacive phases affecting skeletal walls (W). Chlorite (Ch) is present within skeletal structures. In (A), the inset (white square) shows a magnified view of a skeletal wall preserving remnants of original calcitic microstructure. (C) Sample 102.6 m, greenish siltstone, composed of fine-grained siliciclastic matrix. The outlined square highlights an organic structure preserved within the siltstone.
The exceptional preservation of phosphatic steinkerns provides key insights into early Cambrian metazoan morphology and ecology and highlights the importance of biologically mediated phosphogenesis in shallow restricted marine settings. Together, the sedimentary, paleontological, and geochemical records of Los Lagares-1 document the strong coupling between paleotopography, reef development, nutrient cycling, and early diagenetic processes during the establishment of early Cambrian reef–lagoon ecosystems along the southwestern margin of Gondwana [24].
3. Materials and Methods
3.1. Sample Selection and Preparation
The samples analyzed in this study were obtained from the Los Lagares-1 borehole drill core, located in the municipality of Córdoba, Spain (37.923° N, 4.844° W; elevation 559 m) [32]. The borehole was drilled using rotary drilling techniques and reached a maximum depth of 292.5 m. Drilling operations were carried out between March 1981 and May 1982 within the framework of the Instituto Geológico y Minero de España (IGME), under the Ministerio de Industria y Energía, as part of the project “Investigación minera en la Reserva Estatal de Cerro Muriano (Fase II)”. The geological log and stratigraphic column were prepared by INGEMISA, drawn by E. Velasco, and finalized in September 1982, at an original working scale of 1:200 (Plano Nº 11-A-7) [32]. This continuous core provides a complete stratigraphic section through Lower Cambrian phosphatic deposits of the Pedroche Formation, offering exceptional preservation of mineralogical and paleontological features. Core samples were carefully extracted from specific intervals of interest identified during preliminary lithological logging, ensuring minimal contamination and preservation of primary textures [32].
The borehole intersects a complex volcano-sedimentary succession comprising alternating intervals of carbonates (limestones and dolostones), phyllosilicate-rich siltstones and shales, volcaniclastic deposits, and igneous rocks, locally affected by intense fracturing, brecciation, and hydrothermal alteration [24,36]. Carbonate units range from micritic to sparitic limestones, commonly brecciated and cross-cut by fracture-controlled calcite veins, and locally exhibit dolomitization, chloritization, and phosphatization, including phosphatized clasts and fossil fragments. Siliciclastic intervals are dominated by siltstones and fine-grained sandstones enriched in quartz, chlorite, and epidote, whereas volcanic and subvolcanic rocks are predominantly basaltic to andesitic, variably altered to low-grade hydrothermal assemblages of chlorite, epidote, albite, and calcite. Numerous fault zones, shear planes, and mineralized veins are recorded throughout the borehole, reflecting a prolonged history of tectonic reactivation and fluid circulation. All recovered core materials from the Los Lagares-1 borehole are archived and curated at the IGME Lithotheque (Litoteca del IGME), ensuring long-term preservation and accessibility of the borehole materials.
Selected core specimens from depths 101.8 and 102.6 m were prepared as standard petrographic thin sections (30 μm thickness) (Figure 2 and Figure 3A–C), representing two contrasting lithologies within the Pedroche Formation: bioclastic phosphoritic carbonates and greenish siltstones [24]. Sample preparation followed conventional petrographic protocols. Specimens were vacuum-impregnated with low-viscosity epoxy resin to stabilize friable materials, mounted on glass slides, and ground and polished using progressively finer abrasives to achieve optical clarity. Thin sections intended for Scanning Electron Microscopy with Energy-Dispersive X-ray Spectroscopy (SEM-EDS) were carbon-coated or sputter-coated with platinum, whereas uncoated sections were used for optical microscopy and Raman spectroscopy.
Optical microscopy was conducted using a Leica upright transmitted-light microscope model DM2700P coupled to a Basler acA1920-40uc (ace series) USB 3.0 digital camera equipped with a Sony IMX249 CMOS sensor enabling detailed examination of microtextures, phosphatized skeletal elements, internal molds, and sedimentary fabrics (Figure 3A–C). This preliminary petrographic inspection played a critical role in identifying texturally and mineralogically representative areas of interest. Specific zones exhibiting phosphatic infillings, calcimicrobial lamination, organic-rich domains, or distinct diagenetic features were carefully selected and spatially documented prior to targeted high-resolution analyses. These microscopically defined regions subsequently guided SEM-EDS elemental mapping, LA-ICP-MS spot analyses, and ToF-SIMS molecular imaging, ensuring that advanced geochemical and molecular measurements were performed on petrographically constrained and contextually meaningful domains.
These two lithologies were selected because they constitute the dominant sedimentary facies within the studied interval and record contrasting depositional and diagenetic conditions. Sample 101.8 corresponds to a bioclastic phosphoritic carbonate characterized by abundant phosphatic components and frequent phosphatic internal molds [24] (Figure 2 and Figure 3A,B). The fabric locally preserves fine laminar microstructures compatible with calcimicrobial accretion, indicating early phosphogenesis under carbonate-rich depositional conditions [24]. In contrast, sample 102.6 represents a greenish siltstone facies composed of fine-grained siliciclastic sediment with low carbonate content and more homogeneous textures (Figure 2 and Figure 3C), providing a distinct mineralogical and geochemical framework [24]. Together, these samples capture the principal pathways of fossil preservation and mineralization observed in the Los Lagares-1 succession. By targeting these two lithologies, the analytical dataset captures the principal compositional variability present in the section and allows for evaluation of the influence of lithology on phosphatization processes and elemental distributions.
3.2. Raman Spectroscopy
Thin sections were analyzed using confocal laser Raman spectroscopy (WITec alpha300 RA+, GmbH, Ulm, Germany) to identify mineral compositions and organic matter distributions [43] (Figure 4, Figure 5 and Figure 6). The Raman system was equipped with a 532 nm Nd:YAG laser operated at 20 mW, coupled to a UHTS 300 spectrometer with 600 grooves/mm grating and Peltier-cooled CCD detector. The excitation wavelength was set at 532 nm, with the spectrum centered at around 1700 cm−1. All images were acquired in reflected light mode using a Zeiss optical microscope (Zeiss, Jena, Germany) integrated with the Raman system. Single-point analyses were conducted with accumulation times of 10–20 s and integration times of 0.5 s per pixel to optimize the signal-to-noise ratio. Laser power was maintained at approximately 2–4 mW to enhance spectral signals while avoiding thermal damage or alteration to the samples.
Figure 4.
Raman mapping analysis of mineralized fossils from the phosphoritic bioclastic limestone at 101.8 m depth. (A) Transmitted light photomicrograph showing mineralized fossils within calcite matrix; the white rectangle indicates the area shown in (B) and the red square marks the location of the Raman spectrum displayed in (E). (B) Reflected light photomicrograph of the area outlined in (A); the red rectangle indicates the region shown in (C). (C) High-magnification image showing the spatial relationship between organic matter (green) and bioapatite (light blue). (D) False-color Raman map showing distribution of K-bearing silicate likely orthoclase (dark blue), apatite (blue), organic matter (green/red), and hematite (red). (E) Representative Raman spectra: K-bearing phyllosilicate, organic matter with apatite (peaks at 1243, 1331, 1485, and 1615 cm−1), hematite, and carbonate-substituted apatite (ν1 PO43− at 967 cm−1, carbonate substitution peaks at 1055 and 1087 cm−1, OH-related vibration at 3307 cm−1).
Figure 5.
Raman spectroscopic point analysis of mineralized fossils from the phosphoritic bioclastic limestone at 101.8 m depth. (A) Reflected light photomicrograph showing mineralized fossils within carbonate matrix; green cross indicates analytical point, white rectangle marks area shown in (C). (B) Transmitted light photomicrograph of the same region. (C) High-magnification image showing locations of point analyses: red cross on organic-rich domain, blue cross on phosphatized region. (D) Raman spectra: apatite (blue) with ν1 PO43− peak at 967 cm−1, organic matter (red) with peaks at 1246, 1527, 1617, 2097, 2525, 2577, and 3306 cm−1, and calcite (green) from surrounding matrix.
Figure 6.
Raman mapping analysis of mineralized fossils from the siltstone at 102.6 m depth. (A) Transmitted light photomicrograph showing mineralized structures within quartz-dominated matrix; red rectangle indicates region selected for Raman mapping. (B) Reflected light photomicrograph overlapped with false-color Raman map. (C) False-color Raman map showing distribution of rutile (red), quartz (blue), organic matter (green), and rubicline (yellow). (D) Representative Raman spectra: rutile (TiO2), quartz, organic matter with poorly crystalline phosphate (ν2 PO43− at 401 cm−1, ν4 PO43− at 556 cm−1, broadened ν4 at 630 cm−1, and organic peaks at 833, 1257, 1414, 1487, 1524, and 1614 cm−1), and rubicline [Rb(AlSi3O8)].
The instrument was calibrated using a silicon standard (520.7 cm−1) before each analytical session. Spectral acquisition employed 200 × 200-pixel grids using a 100× objective (NA 0.9) and 500 nm step size for mapping analyses. Identical spectral parameters were employed for both single-point and large-area mapping analyses. Large-area scan data were processed using WITec Project FIVE software, version 5.3 (WiTec GmbH, Ulm, Germany). Cosmic ray artifacts and background noise were removed through automated filtering routines, and the spatial distribution of different mineral phases and organic components was visualized using false-color composite maps generated by the software.
3.3. Scanning Electron Microscope-Energy Dispersive X-Ray Spectrometry (SEM-EDS) Analysis
Thin sections of Los Lagares-1 samples were examined using a JEOL JSM-IT500 scanning electron microscope equipped with an Oxford Ultim Max energy-dispersive X-ray spectrometer at the State Key Laboratory of Lunar and Planetary Sciences, Macau University of Science and Technology (MUST) (Figure 7). Samples were sputter-coated with a 10 nm layer of platinum before analysis to ensure conductivity and minimize charging effects. Mineralized fossils and microtextural features were characterized using secondary electron (SE) imaging and backscattered electron (BSE) imaging, acquired at an accelerating voltage of 15 kV, working distance of 8 mm, and probe current of approximately 1 nA. Elemental mapping was performed using EDS with silicon drift detectors and acquisition times of 100–300 s per field of view to confirm mineral compositions and spatial distributions of major and minor elements.
Figure 7.
SEM-EDS elemental mapping of phosphatized bioclastic structures from the limestone at 101.8 m depth. (A) BSE image and elemental maps of a phosphatized bioclast showing distribution of Al, C, Ca, Fe, Mg, N, O, P, Rb, Si, Sr, and Zr. P is concentrated along bioclast walls; Ca-C association marks carbonate matrix; Fe-Mg-Si-Al co-localization indicates authigenic chlorite; Rb-Sr correlates with Si-Al-rich phyllosilicate domains. (B) BSE image and elemental maps of intensely phosphatized bioclastic aggregates showing similar element-mineral associations, with additional mapping of Na, Cu, and Al. Note that Na, Cu, and Al exhibit highly similar distribution patterns within the phosphatized structures. Scale bars = 150 μm.
3.4. Laser Ablation Inductively Coupled Plasma Mass Spectrometry (LA-ICP-MS)
In situ trace element analyses were performed using laser ablation inductively coupled plasma mass spectrometry (LA-ICP-MS) at the State Key Laboratory of Lunar and Planetary Sciences, Macau University of Science and Technology (MUST) [44] (Figure 8, Figure 9, Figure 10, Figure 11, Figure 12 and Figure 13). The analytical system consisted of a COMPex 4.0 ArF 193 nm (Coherent Corp., Saxonburg, PA, USA) excimer laser coupled with a GeoLas optical system and an Agilent 7900 ICP-MS (Agilent Technologies, Santa Clara, CA, USA). Laser parameters included a spot size of 32 μm, a repetition rate of 3 Hz, and an energy density of 4 J/cm2. Each analysis comprised 45 s of background acquisition followed by 45 s of sample signal acquisition.
Figure 8.
Ternary diagram showing relative proportions of P (phosphate), C (carbonate), and Si (silicate) for microdomains analyzed in samples 101.8 m and 102.6 m. Data normalized to 100%. Sample 101.8 displays compositional spread from carbonate-dominated outer rim toward phosphatic inner domains. Sample 102.6 clusters toward the Si apex, indicating dominantly detrital signature.
Figure 9.
Petrographic context and LA-ICP-MS elemental variations for selected ablation spots in samples 101.8 and 102.6. (A) Thin-section microphotograph of the bioclastic phosphoritic carbonate (sample 101.8) showing a phosphatized skeletal fragment within fine-grained carbonate matrix. The arrow indicates a cluster of rounded microstructures associated with the phosphatized bioclast, highlighting localized textural heterogeneity and potential sites of enhanced phosphatization. Multi-plots display log-transformed elemental concentrations (log(x + 1)) from LA-ICP-MS ablation spots (101.8-2 to 101.8-6). (B) Thin-section microphotograph of the greenish siltstone (sample 102.6) with dispersed rounded grains. Corresponding LA-ICP-MS spot analyses (102.6-1 to 102.6-3) show comparatively homogeneous elemental distributions with higher Si, Al, and associated lithophile trace elements.
Figure 10.
LA-ICP-MS major, minor, and trace element geochemistry of bioclastic phosphoritic limestone (sample 101.8 m). (A) P vs. Ca plot showing the phosphate–carbonate relationship relative to ideal carbonate fluorapatite stoichiometry (CFA; Ca/P = 2.15) and calcite (CCA stoichiometric) reference lines. (B) Ti/Al vs. Fe/Ti plot distinguishing detrital from authigenic iron components; the Fe/Ti = 10 threshold separates detrital (left) from authigenic (right) fields. (C) Mn vs. Fe plot showing weak negative correlation (R2 = 0.179), indicating decoupled behaviour consistent with Mn mobility under suboxic conditions. (D) Si vs. Al plot demonstrating a strong positive correlation (R2 = 0.704) consistent with a coupled aluminosilicate framework. (E) K/Al vs. Mg/Al plot discriminating clay mineral assemblages, with compositional fields for illite, illite–chlorite, and chlorite shown. (F) Sr/Ca vs. Mn/Fe plot for redox-diagenetic discrimination; reference lines indicate marine carbonate Sr/Ca and suboxic Mn/Fe threshold (>0.1). (G) Mg vs. Fe plot showing moderate correlation (R2 = 0.547) consistent with Fe–Mg-rich chlorite (Fe = 1.9 × Mg reference line). Outer rim (carbonate-dominated): dark purple circles; Skeletal framework (intermediate zone): light purple circles; Skeletal interior (phosphate-dominated): gold circles.
Figure 11.
REE systematics of the limestone at 101.8 m (Los Lagares-1 borehole) showing geochemical variations across textural domains (outer rim, middle zone, inner core). (A) PAAS-normalized REE patterns. Thin lines represent individual analyses, whereas thick lines represent the mean PAAS-normalized pattern for each compositional domain displaying overall enrichment in LREEs relative to HREEs and subtle variations between domains, with slight negative slopes toward the heavy REEs. (B) ΣLREE vs. ΣHREE plot showing a positive correlation, indicating coupled behavior during diagenetic redistribution, with inner core samples tending toward higher total REE concentrations. (C) Ce/Ce* vs. Eu/Eu* anomalies illustrating predominantly near-neutral to slightly positive Ce anomalies and minor Eu variability, suggesting limited redox-driven fractionation. (D) (La/Yb)n vs. (Gd/Yb)n ratio plot showing variable REE fractionation, with inner core samples spanning the widest range of (Gd/Yb)n values. (E) (La/Gd)n vs. (Gd/Yb)n plot highlighting middle REE (MREE) enrichment trends and differential fractionation across domains. (F) Y/Ho vs. Ce/Ce* ratio plot is used to infer fluid sources, showing values close to seawater signatures with minor deviations, suggesting a dominant marine influence with possible diagenetic modification.
Figure 12.
LA-ICP-MS major, minor, and trace element geochemistry of the greenish siltstone (sample 102.6 m) illustrating compositional controls, mineral associations, and provenance signatures across three compositional groups. (A) Si vs. Al plot showing a strong linear correlation (R2 = 0.9975), consistent with a dominant detrital aluminosilicate framework. (B) Fe vs. Mg plot displaying a tight correlation (R2 = 0.9965) along the Fe = 1.9 × Mg reference line, indicative of Fe–Mg-rich phyllosilicates, interpreted as authigenic chlorite or chamosite. (C) Fe/Ti vs. Si plot highlighting authigenic iron enrichment; elevated Fe/Ti ratios (>10 threshold) in Si-poor samples indicate Fe addition beyond detrital input, whereas Si-rich Group 1 samples fall mostly below the threshold. (D) P vs. Ca plot showing decoupling between phosphorus and calcium, indicating that P is not primarily hosted in carbonate phases. (E) Th/Sc vs. Zr/Sc provenance discrimination diagram, with samples clustering in a field consistent with mixed felsic to intermediate detrital sources and limited sediment recycling. (F) Sr vs. Ca plot illustrating low Sr contents in most samples, consistent with the subordinate role of carbonate phases and dominance of siliciclastic material. Group 1 (Si-rich): blue circles; Group 2 (transitional): gold triangles; Group 3 (P-rich): red squares.
Figure 13.
REE systematics of the siltstone at 102.6 m (Los Lagares-1 borehole) showing compositional differences among Si-rich (Group 1), transitional (Group 2), and P-rich (Group 3) samples and their implications for detrital control and fluid interaction. (A) PAAS-normalized REE patterns. Thin lines represent individual analyses, whereas thick lines represent the mean PAAS-normalized pattern for each compositional group showing overall low REE concentrations relative to PAAS, with Group 1 (Si-rich) displaying higher and relatively flat patterns, Group 2 (transitional) showing moderate enrichment, and Group 3 (P-rich) exhibiting strongly depleted REE contents. (B) Ce/Ce* vs. Eu/Eu* anomalies indicating predominantly negative Eu anomalies and variable Ce behavior, with most samples clustering around or below Ce/Ce* = 1, suggesting limited redox-controlled Ce fractionation and absence of significant hydrothermal Eu input. (C) Y/Ho vs. Ce/Ce* ratio plots highlighting fluid signatures, with Group 1 samples clustering near the seawater field (elevated Y/Ho), while Groups 2 and 3 show lower ratios consistent with dominant detrital control. (D) ΣREE distribution by group showing higher REE concentrations in Si-rich samples and markedly lower values in P-rich samples. (E) (La/Gd)n vs. (Gd/Yb)n plot illustrating middle REE (MREE) fractionation, with Group 1 displaying greater variability and occasional MREE enrichment relative to Groups 2 and 3. (F) (La/Yb)n vs. (Gd/Yb)n plot highlighting differences in LREE–HREE fractionation, with Si-rich samples showing broader variability and P-rich samples remaining consistently depleted. Shaded fields represent typical seawater Y/Ho ratios.
Signal intensities were calibrated using NIST SRM 610 and NIST SRM 612 glass standards as external references, without applying an internal standard correction. Data reduction was performed using ICPMSDataCal software [44]. Ablation spots were positioned in transects perpendicular to laminated structures, enabling the reconstruction of fine-scale geochemical variations across individual laminae and providing insight into temporal changes in depositional chemistry. A total of 30 spots were analyzed for each sample, distributed across compositionally distinct domains identified during preliminary petrographic examination.
It should be noted that LA-ICP-MS is primarily optimized for trace element analysis, and major element concentrations derived from this technique carry higher uncertainties than trace element data due to matrix effects, elemental fractionation, and calibration uncertainties when using silicate glass standards for phosphatic and carbonate matrices (Figure 8, Figure 9, Figure 10, Figure 11, Figure 12 and Figure 13). Accordingly, major element ratios reported in this study (e.g., Fe/Al, Mg/Al, Ca/P, Fe/Ti) are used as semi-quantitative compositional indicators to discriminate between mineral domains rather than as absolute concentration measurements, and should be interpreted with this limitation in mind.
3.5. Time-of-Flight Secondary Ion Mass Spectrometry (ToF-SIMS)
Time-of-Flight Secondary Ion Mass Spectrometry (ToF-SIMS) analyses were performed using a TOF-SIMS IV instrument at the Service of Analysis and Characterization of Solids and Surfaces, Research Support Services, University of Extremadura, Spain [45,46] (Figure 14 and Figure 15). The instrument was equipped with a bismuth liquid metal ion gun (LMIG) as the primary ion source and dual sputtering sources (oxygen and cesium ion guns) for depth profiling. Analyses were conducted under ultra-high vacuum conditions (2 × 10⁻⁹ mbar) using Bi3++ cluster ions as the primary beam, operated in high-current bunched mode (HC-BUNCHED) to achieve optimal lateral resolution (~1 μm). The primary ion gun was operated at 25 kV with an extractor voltage of 10 kV and an emission current of 1.00 μA, resulting in a Bi3++ beam current of approximately 0.21 pA. Both the primary ion gun and sputtering gun were positioned at 40° relative to the sample surface normal.
Figure 14.
ToF-SIMS positive ion distribution maps of phosphatized skeletal structures from the Pedroche Formation, Los Lagares-1 core. (A) Transmitted light image; scale bar = 200 μm. (B) Total ion image of analyzed area (548 × 298 μm); scale bar = 100 μm, where the red square marks the analyzed target area. (C–E) Major cations: (C) ΣSi + +Al+ highlighting aluminosilicate-rich inter-skeletal matrix; (D) Fe+ enriched along skeletal walls and filamentous structures; (E) Mg+ strongly correlated with skeletal elements. (F) RGB overlay (ΣSi + +Al+ blue, Fe+ red, Mg+ green). (G–J) Alkali and alkaline earth elements: (G) Mn+, showing localized enrichment within fossil cavity interiors; (H) Na+, which is relatively uniform; (I) K+, which is concentrated in matrix areas; (J) Ca+, which is associated with carbonate fluorapatite. (K–M) Organic fragments: (K) C13H17+ and (L) C11H13O2+, which show different spatial distributions. (M) RGB overlay demonstrating spatial decoupling between aliphatic (fossil walls, green color) and oxygenated (matrix, red color) organic compounds.
Figure 15.
ToF-SIMS negative ion distribution maps of phosphatized skeletal structures from the Pedroche Formation, Los Lagares-1 core. (A) Transmitted light photomicrograph; scale bar = 200 μm. (B) Total ion image (548 × 298 μm); scale bar = 100 μm, where the red square marks the analyzed target area. (C–E) Major mineral phases: (C) PO2−, which is concentrated along skeletal walls; (D) SiO2−, which is enriched in inter-skeletal matrix; (E) CO3−, which is dominant in matrix. (F) RGB overlay (PO2− red, SiO2− green, CO3− blue) showing spatial separation of phosphate and carbonate domains. (G–I) Halogen and sulfur ions: (G) Cl−, which is enriched along skeletal structures; (H) F−, which is closely associated with phosphate-rich zones, confirming carbonate fluorapatite (francolite); (I) S−, which is diffusely distributed with localized enrichment. (J) RGB overlay (Cl− red, F− green, S− blue) highlighting halogen–sulfur relationships.
Mass spectra were acquired over a mass range of 0–12,000 u (unified atomic mass units) with a mass resolution of approximately 100 ns. Initial survey spectra were collected from analysis areas of 500 × 500 μm, 250 × 250 μm, or 25 × 25 μm at a pixel resolution of 128 × 128, with spectral acquisition continuing until an ion dose density of 1 × 10¹² ions/cm2 was reached to maintain static SIMS conditions and minimize surface damage. Cycle times of 105 μs or 120 μs were employed depending on the sample characteristics.
For depth profiling experiments, analyses were performed in non-interlaced mode with a sputtering time of 1 s, followed by acquisition of 2 analytical frames with no pause time between cycles. Sputtering was conducted using either the oxygen ion gun (for positive ion detection; Figure 14) or the cesium ion gun (for negative ion detection; Figure 15) at energies ranging from 250 to 2000 eV.
Positive ion mass spectra were calibrated using the following reference peaks: H+, H2+, H3+, C+, CH+, CH2+, CH3+, C2H3+, C3H5+, C5H5+, and C6H6+. Negative ion spectra were calibrated using H−, C−, CH−, CH2−, O−, OH−, F−, C2−, C3−, C4−, C5−, and C6−. Residual cesium contamination in the analysis chamber from previous profiling experiments resulted in detectable Cs-related peaks (e.g., 133Cs+ at 132.91 u, Cs2+ at 265.8 u) in the acquired spectra, particularly in positive ion mode. These peaks were not considered in the primary calibration but can serve as additional high-mass reference points when necessary.
Specific analysis locations on each thin section were identified using the integrated optical camera system prior to ToF-SIMS analysis (Figure 14 and Figure 15). Spectral processing and molecular mapping analyses were performed using SurfaceLab 6.7 software (ION-TOF GmbH, Münster, Germany). This software enabled comprehensive interpretation of the mass spectra, identification of molecular fragments, and generation of ion distribution maps to visualize the spatial heterogeneity of organic and inorganic compounds across the analyzed surfaces. All raw data files were archived for further analysis.
4. Results and Discussion
4.1. Mineralogical Framework from Raman Spectroscopy
4.1.1. Bioclastic Phosphoritic Limestone (101.8 m)
Raman spectroscopy of the bioclastic phosphoritic limestone at 101.8 m depth reveals a complex mineral assemblage dominated by carbonate fluorapatite within fossilized structures embedded in a calcite matrix (Figure 4A–E and Figure 5A–D). The calcite constitutes the primary matrix component, with numerous organic structures exhibiting varying degrees of phosphate mineralization distributed throughout the carbonate groundmass.
Carbonate fluorapatite represents the dominant mineral phase within these fossilized structures, characterized by diagnostic peaks at 433, 595, and 967–969 cm−1 corresponding to the ν2, ν4, and ν1 vibrational modes of the PO43− tetrahedra [47,48,49] (Figure 4E and Figure 5D). The presence of B-type carbonate substitution is indicated by peaks at 1055 and 1087 cm−1, where CO32− replaces PO43− in the crystal lattice [50,51]. A peak at 3307 cm−1 is assigned to OH-related vibrational modes, indicating mixed carbonate–hydroxyl–fluorapatite composition typical of marine diagenetic environments [47,50]. The well-defined spectral features indicate relatively well-crystallized CFA, consistent with diagenetic maturation in a carbonate-dominated porewater system where Ca2+ and CO32− activities were sufficiently high to promote crystal growth and Ostwald ripening [52,53,54].
The close spatial relationship between organic matter and apatite provides direct evidence for organically mediated phosphogenesis, where phosphate precipitation was driven by localized release of phosphorus during organic matter degradation [31,55] (Figure 4C,D and Figure 5C,D). This pattern is characteristic of early diagenetic phosphatization, supporting models of microbially mediated phosphogenesis whereby bacterial decomposition releases dissolved phosphate that subsequently precipitates as apatite in the immediate vicinity of degrading organic substrates [27,28,41].
Accessory phases identified in the limestone include K-bearing phyllosilicates, likely glauconite rather than orthoclase, as authigenic K-feldspar precipitation is thermodynamically unfavorable under low-temperature diagenetic conditions [56,57,58,59,60]. Localized hematite (Fe2O3) is also present, indicating that strongly reducing, sulfidic conditions were not pervasive during phosphatization, consistent with phosphogenesis occurring within the suboxic zone above the sulfate-methane transition [26]. The predominantly authigenic mineral assemblage reflects a relatively quiet depositional environment where in situ diagenetic processes dominated over clastic sedimentation [61,62].
4.1.2. Greenish Siltstone (102.6 m)
Raman mapping of the greenish siltstone at 102.6 m demonstrates fundamentally different mineralogical characteristics reflecting the siliciclastic-dominated nature of this facies (Figure 6A–C). Quartz constitutes the primary matrix component, with phosphate mineralization within organic structures indicated by broader, less well-defined peaks at 401, 556, and 833 cm−1, accompanied by a broad feature centered around 630 cm−1 [63]. These spectral characteristics are indicative of poorly crystalline or nanocrystalline apatite, representing an early stage of phosphogenesis where crystal ripening and Ostwald maturation have not progressed to completion [52,53].
The contrasting crystallinity between the two lithologies reflects the influence of host matrix composition on phosphate mineralization kinetics [64,65]. The silicate-dominated matrix provided fewer nucleation sites and different porewater chemistry compared to the carbonate-rich limestone, with lower Ca2+ and CO32− activities potentially inhibiting crystal growth and maturation [66]. The poorly crystalline nature of the phosphate phases in the siltstone suggests that diagenetic conditions were less favorable for CFA precipitation, possibly due to limited Ca availability, different pH buffering, or shorter residence time in the phosphogenesis zone.
The mineral assemblage of the siltstone includes significant detrital components that provide constraints on sediment provenance. Rutile (TiO2) is present, indicating derivation from medium- to high-grade metamorphic rocks in the source area [67,68] (Figure 6C,D). Rubicline [Rb(AlSi3O8)], a rare rubidium-bearing feldspar, was also identified, indicating derivation from highly evolved granitic or pegmatitic source rocks [69] (Figure 6C,D). The presence of these detrital minerals within organic-rich domains suggests that organic matter accumulation occurred concurrently with siliciclastic sedimentation, creating a mixed system where both detrital input and authigenic phosphogenesis contributed to the final assemblage [70,71]. The inverse relationship between clastic sedimentation rates and phosphogenesis efficiency is well documented: elevated detrital input typically dilutes porewater phosphate concentrations and reduces residence time at redox boundaries favorable for apatite precipitation [64].
4.2. Elemental Composition from SEM-EDS
SEM-EDS elemental mapping was concentrated on sample 101.8 because it exhibits substantially higher mineralogical and textural diversity than sample 102.6 (Figure 7A,B). Although phosphatic elements are present in the siltstone, the mineral assemblage observed at 102.6 m is fully represented within sample 101.8, whereas the latter additionally preserves a broader spectrum of phosphatic phases and multiple skeletal architectures with phosphatized walls and phosphatic internal molds. This expanded diversity provides a more complete geochemical framework to constrain phosphatization pathways and associated trace element redistribution.
The elemental mapping reveals two distinct modes of phosphate mineralization within the phosphoritic limestone. Along preserved bioclast walls, P concentrations correlate strongly with skeletal morphology, reflecting template-directed CFA precipitation on original organic substrates [41,72] (Figure 7A). The inverse relationship between P and C (carbonate) confirms progressive replacement of original calcitic shell material by phosphate phases during early diagenesis [73] (Figure 7A). Fe-Mg-Si-Al co-localization along skeletal features indicates contemporaneous formation of Fe-Mg phyllosilicates (chlorite/chamosite) with phosphate precipitation, suggesting both processes were controlled by the same redox gradient established during burial into the suboxic zone [40,74].
Phosphatic steinkerns filling internal molds show a different pattern, with P enrichment toward cavity centers and gradational decrease toward skeletal walls [11] (Figure 7B). This distribution indicates centripetal precipitation from cavity-filling porewaters that became progressively enriched in dissolved phosphate during organic matter degradation within the enclosed microenvironment [31,55] (Figure 7B). The strong correlation between Fe, Mg, Si, and Al within specific domains confirms authigenic chlorite/chamosite formation [40,75], with the spatial association of these phyllosilicates with phosphatic phases reflecting their formation under similar suboxic conditions during microbial Fe(III) reduction [42,76].
The Rb-Sr association with Si-Al-rich domains rather than carbonate or phosphate phases contrasts with the typical Sr affinity for carbonate phases [77] (Figure 7A), indicating incorporation into clay mineral structures rather than carbonate lattices during diagenesis. Nitrogen is detected in localized patches within the phosphatized walls, with a distribution that partially overlaps with P-rich zones, potentially indicating nitrogen incorporation into the silicate mineral structures or the presence of nitrogen-bearing organic compounds associated with the clay minerals (Figure 7A,B). Zirconium shows a spatial distribution that correlates well with phosphorus, with elevated concentrations within the phosphatized skeletal structures rather than occurring as isolated detrital grains in the matrix (Figure 7A,B).
The elevated Fe concentrations associated with Si-rich domains support the iron reduction mechanism, with released Fe2+ sequestered primarily in authigenic chlorite rather than incorporated into the phosphate structure [42] (Figure 7A,B). The strong Fe-Mg-Si-Al correlation indicates that chlorite authigenesis accompanied phosphate precipitation regardless of the specific phosphatization mechanism, suggesting both processes were driven by the same underlying redox gradient established during early diagenesis [40,78].
4.3. Trace Element Geochemistry from LA-ICPMS
4.3.1. Compositional Domains and Sample Discrimination
The P-Si-C ternary diagram effectively discriminates compositional differences between samples and reveals systematic relationships between mineralogy and diagenetic history (Figure 8). Sample 101.8 displays a pronounced compositional gradient where middle zone samples under more reducing conditions during phosphate precipitation occupy intermediate positions with variable P and C contributions, and inner core samples cluster toward the P corner (60%–90% P), demonstrating progressive replacement of original carbonate shell materials by CFA during diagenesis. Outer rim samples show variable compositions, with several plotting toward the Si apex rather than the C apex, reflecting aluminosilicate-bearing domains within the bioclast rim [10,11] (Figure 8). This compositional trajectory documents active carbonate-to-phosphate replacement characteristics of early diagenetic phosphogenesis in carbonate-rich marine sediments [39].
In contrast, sample 102.6 plots entirely within the silicate domain near the Si apex. Group 3 approaches pure silicate composition (~95%–100% Si), while Groups 1 and 2 show slightly lower Si proportions (70%–90% Si) with minor P and C contributions, reflecting the quartz-dominated detrital matrix of the siltstone and fundamentally different diagenetic conditions compared to the phosphoritic limestone [64,65] (Figure 8). This clear separation demonstrates that primary lithology exerts fundamental control on diagenetic mineral assemblages [9].
4.3.2. Bioclastic Phosphoritic Limestone (101.8 m)
LA-ICP-MS trace element analysis of a phosphatized bioclast from sample 101.8 m reveals distinct compositional zonation across 30 analytical spots distributed among three spatial domains: the outer rim (n = 7, carbonate-dominated), skeletal framework (n = 8, intermediate zone), and skeletal interior (n = 15, phosphate-dominated) (Figure 9A, Figure 10A–G and Figure S1). The elemental distributions demonstrate systematic variations reflecting progressive phosphatization of an originally carbonate bioclast.
The inverse relationship between Ca and P concentrations across compositional domains documents the centripetal phosphatization gradient. The outer rim preserves high Ca (321,246 ± 27,720 ppm) and minimal P (3814 ± 4139 ppm), while the skeletal interior shows elevated P (90,650 ± 42,036 ppm) and reduced Ca (85,333 ± 87,120 ppm) [11,79] (Figure 10A). The preservation of a distinct carbonate-dominated outer rim indicates that phosphatization was arrested before complete replacement, possibly due to changing porewater conditions or establishment of a diffusion barrier [80]. The skeletal framework occupies intermediate compositions (P = 81,184 ± 43,790 ppm; Ca = 155,831 ± 94,135 ppm), recording the transition zone where active replacement occurred (Figure 10A).
Fe/Ti ratios consistently exceed the authigenic threshold (>10) across all domains, indicating secondary Fe enrichment beyond detrital contributions [81,82] (Figure 10B). This pattern directly supports active iron cycling during diagenesis, with Fe2+ released during microbial Fe(III) reduction available for incorporation into authigenic phases. Mn concentrations decrease dramatically from outer rim (53,736 ± 11,864 ppm) to skeletal interior (13,429–17,708 ppm), reflecting preferential Mn incorporation into carbonate phases during progressive phosphatization [79,83] (Figure 10C). This Mn gradient is consistent with the crystal-chemical incompatibility of Mn2+ with the apatite structure and its favorable substitution for Ca2+ in the calcite lattice.
The strong Si-Al correlation (R2 = 0.704) and preferential enrichment in phosphatized interior zones indicates that aluminosilicate phases formed contemporaneously with phosphate precipitation [74] (Figure 10D). K/Al vs. Mg/Al relationships suggest K-bearing phases consistent with illite or glauconite composition [84] (Figure 10E), while the spatial association between phosphate and phyllosilicate phases reflects shared geochemical controls during early diagenesis. Both phosphogenesis and glauconite formation are favored in suboxic marine sediments with slow sedimentation rates, and the co-occurrence of these phases documents the redox conditions prevailing during mineral formation [61,62].
Strontium and redox-diagenetic systematics provide complementary constraints on carbonate preservation and diagenetic alteration. Sr/Ca ratios are highest in the outer rim (19.0 ± 5.4) and decrease toward the skeletal interior (15.5 ± 5.5), consistent with preferential Sr retention in residual carbonate phases and progressive Sr loss during phosphate replacement of the original calcitic skeleton [79,80]. The co-variation of Mn/Fe ratios across compositional domains, with elevated values in the outer rim (5.66 ± 6.26) relative to the skeletal interior (4.26 ± 5.52), reflects the preferential partitioning of Mn2+ into carbonate over phosphate phases under suboxic conditions, supporting porewater Mn/Fe > 0.1 as a diagenetic indicator of suboxic mineralization [80] (Figure 10F). The Mg vs. Fe relationship across all compositional domains shows a moderate positive correlation (R2 = 0.547) that tracks the chlorite stoichiometric reference line (Fe = 1.9 × Mg), indicating that Fe and Mg mobility during diagenesis was largely controlled by authigenic chlorite or chamosite precipitation rather than by carbonate or phosphate phases (Figure 10G).
The REE systematics of sample 101.8 record the interplay between seawater-derived and diagenetically modified signatures. The PAAS-normalised REE patterns show MREE-enriched profiles across all three compositional domains, with the skeletal interior displaying the highest absolute concentrations (Figure 11A). Total REE concentrations (ΣREE) increase from the outer rim (925 ± 1084 ppm) to the skeletal interior (2588–3321 ppm), consistent with preferential REE incorporation into the CFA lattice during phosphatization [25] (Figure 11B). Ce anomalies evolve from slightly negative in the outer rim (Ce/Ce = 0.91 ± 0.08), indicating inheritance from oxygenated seawater [85], to slightly positive in the interior (Ce/Ce = 1.09–1.14), recording more reducing conditions during phosphate precipitation [86] (Figure 11C). However, given the large standard deviations in Ce/Ce* within each compositional group, the difference between outer rim and interior values should be treated as a suggestive trend rather than a statistically robust distinction; both groups show considerable within-group variability and the confidence intervals overlap. Eu anomalies remain near unity across all domains (Eu/Eu* = 0.97–1.02), indicating that suboxic conditions did not reach Eu2+ stability and that REEs were sourced from seawater-dominated fluids rather than high-temperature hydrothermal input [87] (Figure 11C).
The (La/Yb)ₙ vs. (Gd/Yb)ₙ diagram illustrates LREE depletion relative to MREEs across all compositional domains, with inner core samples showing the broadest range of (Gd/Yb)ₙ values (Figure 11D). The (La/Gd)ₙ vs. (Gd/Yb)ₙ diagram confirms moderate MREE enrichment relative to both LREEs and HREEs, producing the bell-shaped pattern diagnostic of marine authigenic phosphates [25,86] (Figure 11E). Y/Ho ratios provide additional constraints on fluid sources, with the outer rim (36.5 ± 7.4) approaching seawater values (~44–74) [88,89] and decreasing progressively toward the inner core (31.7 ± 4.6), documenting a transition from seawater-influenced conditions during initial carbonate precipitation to porewater-dominated conditions during phosphatization [90,91] (Figure 11F).
4.3.3. Greenish Siltstone (102.6 m)
LA-ICP-MS analysis of sample 102.6 reveals fundamentally different geochemical characteristics reflecting the siliciclastic-dominated nature of this facies. Hierarchical cluster analysis identifies three compositional groups based on Si, P, and associated trace elements: Group 1 (Si-rich, n = 10), Group 2 (transitional, n = 10), and Group 3 (P-rich, n = 10).
Silicon and Al exhibit exceptionally strong correlation (R2 = 0.9975), establishing that virtually all silicate is structurally bound in aluminosilicate phases rather than occurring as free quartz [75] (Figure 12A). The near-perfect Mg-Fe correlation (R2 = 0.9965) follows the chlorite reference line (Fe = 1.9 × Mg), indicating syngenetic chlorite formation through coupled Fe2+-Mg2+ incorporation during diagenesis [40] (Figure 12B). This exceptional correlation provides compelling evidence that Fe2+ released during iron reduction was efficiently captured by growing phyllosilicate crystals, representing a major sink for reduced iron that effectively coupled the iron and silicate cycles during early diagenesis.
Fe/Ti ratios (55–1034) far exceed the authigenic threshold (>10), demonstrating substantial secondary Fe enrichment independent of detrital Ti-bearing phases [81] (Figure 12C). This pattern is diagnostic of microbial Fe(III) reduction, which released Fe2+ from oxyhydroxides for subsequent incorporation into authigenic chlorite [24,27,28]. The magnitude of Fe enrichment relative to Ti documents the intensity of iron cycling within this facies. The inverse relationship between P and Ca (Figure 12D) further reflects the replacement of primary carbonate by authigenic phosphate, though it is less pronounced than in the limestone facies [12,79]. Provenance discrimination using Th/Sc vs. Zr/Sc ratios indicates sediment derivation from highly evolved felsic source rocks, consistent with upper continental crust compositions [92,93] (Figure 12E). The coherent clustering of all three compositional groups along the passive margin array suggests a uniform detrital source, with geochemical variability driven by diagenetic overprinting rather than changes in provenance. Sr concentrations remain low across all groups (Figure 12F), consistent with limited marine carbonate input and dominance of siliciclastic material [80].
The REE patterns of the siltstone preserve much stronger detrital signatures than the limestone. Pronounced negative Eu anomalies across all groups (Eu/Eu* = 0.028–0.136) provide unequivocal evidence for derivation from felsic igneous rocks that underwent plagioclase fractionation [87,94] (Figure 13A,B). The magnitude of Eu depletion exceeds typical upper continental crust values, suggesting highly evolved granitic source rocks consistent with the rubicline identified by Raman spectroscopy [69]. Importantly, the preservation of these negative Eu anomalies, even in samples with extreme authigenic Fe enrichment, demonstrates that syngenetic chlorite formation did not fractionate REEs, which remained hosted in resistant detrital accessory phases [93,95].
Near-chondritic Y/Ho ratios (24–32) closely match crustal values rather than approaching seawater signatures (~44–74) [90], demonstrating that REEs were overwhelmingly sourced from detrital minerals rather than seawater-derived authigenic phases (Figure 13C). This contrasts markedly with the elevated Y/Ho ratios in the limestone outer rim and indicates that seawater had minimal influence on REE budgets in this siliciclastic facies. The systematic 10-fold to 100-fold REE depletion from silicon-rich (Group 1) through transitional (Group 2) to phosphate-rich (Group 3) compositions, while maintaining similar pattern shapes, indicates dilution by REE-poor authigenic phases rather than selective fractionation [25] (Figure 13D). The (La/Gd)ₙ vs. (Gd/Yb)ₙ and (La/Yb)ₙ vs. (Gd/Yb)ₙ diagrams confirm that the REE pattern shape is preserved across all groups despite the order-of-magnitude concentration decrease, consistent with a common detrital source and REE immobility during diagenesis [92,93] (Figure 13E,F).
4.4. Molecular and Ionic Mapping from ToF-SIMS
ToF-SIMS analysis provides complementary molecular-scale information that confirms and extends the mineralogical interpretations from other techniques. The integration of positive and negative ion modes reveals mineral compositions and spatial relationships at sub-micrometer resolutions [45,96].
4.4.1. Positive Ion Distributions
The distribution of aluminosilicate components, represented by the sum of Si+ and Al+ signals (Figure 14C), reveals a heterogeneous pattern with elevated intensities concentrated in the matrix surrounding the phosphatized structures and along discrete domains at structural boundaries. Iron shows overall low abundance (Figure 14D) with localized enrichments that partially overlap with the Si-Al-rich domains. Magnesium (Figure 14E) displays enhanced signals particularly in matrix areas and along the boundaries of skeletal elements. The RGB overlay combining Si+/Al+, Fe+, and Mg+ (Figure 14F) visualizes their co-localization in phyllosilicate-bearing domains occupying the spaces between and around phosphatized fossils. Manganese (Figure 14G) shows relatively uniform background levels with subtle enrichments tracing the structural outlines of the fossils. Sodium (Figure 14H) presents elevated signals in the surrounding matrix but notable depletion within the phosphatized skeletal interiors. Potassium (Figure 14I) shows moderate enrichment specifically in the aluminosilicate-rich domains. Calcium (Figure 14J) displays the highest intensities within the phosphatized skeletal structures, clearly delineating fossil morphology and confirming the calcium phosphate composition of these features. Aliphatic hydrocarbon fragments (C13H17+; Figure 14K) show moderate enrichments along the phosphatized fossil walls, while oxygenated organic fragments (C11H13O2+; Figure 14L) reveal a more structured pattern correlating notably with the phosphatized skeletal elements. The RGB overlay of these two organic species (Figure 14M) confirms that organic molecular components are preferentially associated with the phosphatized domains.
The integrated cation distributions allow for identification of the principal mineral phases present. The Ca+ enrichment sharply concentrated along the Y-shaped fossil wall (Figure 14J), combined with the PO2− and F− distributions discussed below, unequivocally establishes carbonate fluorapatite (francolite) as the dominant phosphate phase [9,24]. The sharp, structurally controlled nature of this enrichment demonstrates template-directed precipitation nucleating preferentially on the original biological substrate [41,72,97]. The Fe+ distribution (Figure 14D) reveals a complex dual iron mineralogy. Discrete hotspots showing spatial decoupling from the phosphate-enriched fossil walls reflect iron partitioning between multiple mineral phases [76]. The partial spatial correlation between Fe+, Mg+ (Figure 14E), and Si+/Al+ (Figure 14C), visible as co-enrichment zones in the RGB overlay (Figure 14F), strongly implicates chlorite-group minerals (chamosite) formed when Fe2+ released during microbial reduction of Fe(III)-oxyhydroxides interacted with aluminosilicate polymers under suboxic conditions [40,74,98]. Ferrous phyllosilicates form under suboxic conditions (Eh approximately −100 to +100 mV), while pyrite—confirmed by the Fe+/S− co-localization discussed in Section 4.4.2—requires more strongly reducing anoxic conditions [99].
This dual iron mineralogy reflects the redox-stratified nature of the early diagenetic environment, where microbial iron reduction released Fe2+ and PO43− that precipitated as both phosphate minerals and ferrous phyllosilicates, with localized sulfate reduction producing pyrite where conditions became sufficiently anoxic [26,78,99]. The pronounced Mn+ enrichment within fossil cavity interiors (Figure 14G), rather than in phosphatized walls or external matrix, indicates that more reducing and possibly more acidic microenvironmental conditions prevailed within the decomposing organism during early fossilization [83]. Manganese oxides can serve as electron acceptors for microbial respiration under suboxic conditions, and restricted exchange between internal cavity fluids and external porewaters would have allowed Mn2+ to accumulate [83,100]. The minimal Na+ incorporation into apatite (Figure 14H) is consistent with the crystal-chemical constraints of the fluorapatite structure. The K+ enrichment in aluminosilicate-rich domains (Figure 14I) reflects K-bearing phyllosilicate phases, consistent with the glauconite and illite assemblages identified by LA-ICP-MS. The distinct spatial patterns of C13H17+ (Figure 14K) and C11H13O2+ (Figure 14L) reflect two fundamentally different organic preservation pathways, as illustrated by the RGB overlay (Figure 14M). Aliphatic hydrocarbon fragments associated with the phosphatized fossil walls represent lipid-derived hydrocarbons from the fossilized organism’s original biomolecules, which were rapidly encapsulated within the CFA mineral matrix before extensive microbial degradation [31,101]. Their preservation through phosphate encapsulation reflects the rapid kinetics of phosphate precipitation that effectively seal organic matter within an impermeable mineral barrier [102,103]. The oxygenated organic fragments enriched throughout the matrix (Figure 14L) represent predominantly microbial biomarkers from heterotrophic bacteria and fungi that colonized and degraded organic tissues during early diagenesis, which were preserved through adsorption onto phyllosilicate surfaces and incorporation into carbonate minerals rather than phosphate encapsulation [55,101]. This dual preservation mechanism creates a composite organic geochemical record that captures both the fossilized organism’s original biochemistry and the diagenetic microbial ecosystem [31].
4.4.2. Negative Ion Distributions
The same target area was analyzed in negative ion mode (Figure 15A,B). The PO2− distribution (Figure 15C) provides the clearest delineation of the phosphatized skeletal structures, with highest signal intensities along well-defined fossil outlines revealing an elongate tubular structure with distinct wall boundaries and preserved internal features. SiO2− (Figure 15D) occupies domains spatially distinct from the phosphate-rich areas, with localized enrichments in the matrix rather than within the fossil structures. CO3− (Figure 15E) shows moderate signal intensity across the analyzed area with enrichment in matrix domains surrounding the phosphatized structures. The RGB overlay (Figure 15F) demonstrates their complementary spatial relationships: phosphate (red) dominates the fossil structures while silicate (green) and carbonate (blue) phases concentrate in the surrounding matrix with minimal overlap. Cl− (Figure 15G) displays relatively uniform background levels with subtle enrichment along skeletal and filamentous structures. F− (Figure 15H) presents the most striking correlation with the phosphate distribution, with highest signal intensities precisely tracing the fossil interiors and structural boundaries identified in the PO2− map. S− (Figure 15I) shows a heterogeneous distribution with localized enrichments along organic-rich filaments that do not correspond directly to either the phosphate or silicate domains. The RGB overlay of Cl−, F−, and S− (Figure 15J) illustrates the co-localization of F− with the phosphatized structures, appearing as bright green domains mirroring the fossil morphology, while Cl− and S− are more diffusely distributed.
The negative ion distributions confirm and extend the mineral identifications made from the positive ion mode. The tight spatial correspondence between F− (Figure 15H) and PO2− (Figure 15C) unequivocally confirms fluorapatite as the dominant phosphate phase [9,24]. The co-occurrence of CO3− with PO2− along the fossil walls—visible as purple zones in the RGB overlay (Figure 15F)—confirms significant carbonate substitution within the apatite crystal lattice, characteristic of carbonate fluorapatite precipitated from marine carbonate-rich porewaters [47,50]. The CO3− signal extending well beyond the phosphate-rich zones (Figure 15E) indicates additional calcite or Mg-calcite phases in the host sediment matrix. The strong spatial correlation between Fe+ hotspots (Figure 14D) and S− enrichment zones (Figure 15I) confirms pyrite (FeS2) formation under localized anoxic microenvironments [26,78], while the diffuse S− distribution along organic-rich filaments records early diagenetic sulfur cycling more broadly. The SiO2− distribution (Figure 15D) occupying domains distinct from the phosphate-rich areas, when combined with the Fe+-Mg+-Si+/Al+ co-localization seen in the positive ion mode, confirms that silicon and aluminum are structural components of authigenic phyllosilicates rather than passive detrital matrix. The Cl− enrichment along skeletal and filamentous structures (Figure 15G), co-localizing with F− in the RGB overlay (Figure 15J), is consistent with phosphatized microbial templates where both halogens trace the original biological framework [41,72]. Multivariate principal component analysis of the negative ion mode data resolved six statistically independent components (Figure S5). Components 1 and 2 are dominated by signals sharply concentrated along the filamentous fossil fabric, with Component 1 loading strongly positive for both CNO− and PO2−, and Component 2 capturing a spatial anti-correlation between these two ions—indicating that nitrogen- and phosphorus-bearing species occupy distinct sub-filament microenvironments, reflecting differential taphonomic preservation of phospholipid-derived phosphorus vs. proteinaceous nitrogen. Component 3 maps CO3− variance extending into the surrounding matrix, likely reflecting diagenetic carbonate phases associated with microbial activity. The diffuse F−-dominated Component 5 suggests a disseminated fluorapatite phase distributed independently of the primary organic-rich structures.
4.4.3. Halogen Isotopes and Diagenetic Fluid Composition
ToF-SIMS analyses reveal halogen systematics that provide constraints on diagenetic fluid compositions. Chlorine is detected as 35Cl and 37Cl, with integrated peak areas of 503,961 and 154,714, yielding a 35Cl/37Cl ratio of ~3.26. Bromine is detected as both 79Br and 81Br with peak areas of 34,181 and 37,763, respectively. Both halogens are consistently observed within the carbonate matrix and are not confined to discrete accessory phases, with comparable isotopic distributions and relative signal intensities obtained across all analyzed areas.
The 35Cl/37Cl ratio of ~3.26 is close to the natural terrestrial value of ~3.13 [104,105], indicating a common crustal chloride source without extreme isotope fractionation, consistent with the absence of highly fractionated or exotic chloride reservoirs. Although ToF-SIMS does not permit precise quantitative isotopic determination due to matrix effects, instrumental mass bias, and potential isobaric interferences—particularly 34SH− overlap with 35Cl− in sulfur-bearing systems [45,46]—the proximity of the measured ratio to natural abundance strongly argues against unusual fractionation. The consistent co-occurrence of Cl and Br, visible in the RGB overlay (Figure 15J), and the relative strength of the Br signal indicate that bromine-enriched saline fluids widely associated with evolved marine or connate brines were modified by evaporation or prolonged water–rock interaction during burial diagenesis [106,107,108]. Together, the near-natural chlorine isotopic distribution and appreciable bromine signal support saline diagenetic fluids of marine affinity, in agreement with established models for halogen behaviour in sedimentary basins [105,106,108].
5. Integrated Geochemical Model
5.1. Lithological Control on Phosphogenesis
The integrated datasets demonstrate that primary lithology exerted fundamental control on phosphatization pathways, producing distinct mineral assemblages and trace element signatures in the two studied facies [9,64]. These contrasting pathways reflect differences in substrate composition, porewater chemistry, and sediment permeability that directed diagenetic reactions along divergent trajectories.
The phosphoritic limestone at 101.8 m represents the optimal substrate for CFA precipitation [9,64]. High Ca2+ availability from carbonate dissolution, coupled with low siliciclastic dilution and slow sedimentation rates, allowed phosphate supersaturation to develop within porewaters during microbial Fe(III) reduction [10]. The centripetal replacement pattern—progressing from carbonate-dominated rim through intermediate framework to fully phosphatized interior—records the advancing reaction front where carbonate dissolution and phosphate precipitation occurred simultaneously [11] (Figure 10A). Template-directed nucleation on organic tissues facilitated exceptional preservation of fossil morphologies, with the phosphatized skeletal walls preserving original microstructural details [41,72] (Figure 7A and Figure 14J). The REE geochemistry reflects seawater-influenced phosphogenesis with diagenetic modification [25,86] (Figure 11). Y/Ho ratios indicate mixed seawater–porewater signatures [88,91] (Figure 11F), while consistent LREE/HREE fractionation across compositional domains, as illustrated by the (La/Yb)ₙ vs. (Gd/Yb)ₙ relationships, suggests equilibration with homogeneous diagenetic fluids [109] (Figure 11B,D). The Ce anomaly evolution from negative (seawater-derived) to variable positive (porewater-modified) values records redox boundary migration as the zone of active phosphogenesis moved through the sediment column [85,86] (Figure 11C).
In contrast, the greenish siltstone at 102.6 m records a fundamentally different diagenetic pathway [65]. Lower Ca2+ availability, stronger geochemical buffering by aluminosilicates, and different porewater composition limited CFA crystallization efficiency, producing only poorly crystalline phosphate phases [63,65]. The silicate-dominated mineralogy focused diagenetic processes toward authigenic chlorite formation rather than phosphate precipitation [40]. The exceptional Mg-Fe correlation (R2 = 0.9965) following the chlorite reference line documents efficient Fe2+ capture by growing phyllosilicate crystals, representing a major sink for reduced iron that effectively coupled the iron and silicate cycles during early diagenesis (Figure 12C). The REE systematics preserve much stronger detrital signatures than the limestone (Figure 13) where pronounced negative Eu anomalies inherited from felsic source rocks were not erased by diagenetic processes [110] (Figure 13B), and Y/Ho ratios cluster near chondritic values, indicating minimal seawater influence [90] (Figure 13C).
5.2. Redox Evolution and Microbial Mediation
The geochemical data record a consistent redox stratigraphy that controlled mineral formation and element redistribution during early diagenesis [78,82]. This redox evolution operated across three principal zones that developed within the upper sediment column. An oxic surface layer, where aerobic respiration maintained Fe(III)-oxyhydroxides stable, preserved seawater-derived REE signatures with minor negative Ce anomalies characteristic of oxygenated marine waters [85]. Below this, a suboxic zone represented the main phosphogenesis reactor where microbial Fe(III) reduction released both Fe2+ and adsorbed PO43− into porewaters [27,28,39], driving the phosphate supersaturation necessary for CFA precipitation. At greater depth or in localized microenvironments within organic-rich zones, anoxic conditions allowed sulfate reduction to produce H2S and promote pyrite formation [26].
Evidence for this three-tier redox zonation emerges from multiple independent proxies. Ce anomaly gradients record the transition from oxic (negative Ce/Ce) to suboxic-anoxic (positive Ce/Ce) conditions with depth [85,86] (Figure 11C and Figure 13B). Mn/Fe ratio variations document the sequential reduction of Mn(IV) and Fe(III) oxides during progressive burial [82] (Figure 10F). Fe/Ti ratios exceeding authigenic thresholds (>10) in both samples demonstrate secondary Fe enrichment beyond detrital contributions, directly supporting the microbial iron reduction mechanism [82] (Figure 10B and Figure 12C). The exceptional Mg-Fe correlation following chlorite reference lines confirms that released Fe2+ was captured by authigenic phyllosilicate precipitation rather than remaining mobile in porewaters [40] (Figure 12B). Discrete Fe-S hotspots in ToF-SIMS maps indicate that localized pyrite formation is restricted to specific microenvironments where sulfate reduction was particularly active [24,26], rather than basin-wide anoxia (Figure 14D and Figure 15I).
An additional control on the observed heterogeneity in authigenic mineral assemblages may be due to temporal or spatial shifts in porewater gradient depth. Changes in the depth at which the suboxic-anoxic redox boundary is established—driven by variations in organic matter flux, bottom-water oxygen levels, or sedimentation rate—could produce differences in mineral assemblages between and within both lithologies without requiring differences in primary sediment composition alone. For example, a shallowing of the redox boundary would expose skeletal material to phosphate-supersaturated porewaters for a shorter duration, potentially explaining arrested phosphatization at the bioclast rim (Figure 10A), while deepening of the boundary could explain the spatial heterogeneity in pyrite distribution and Mn enrichment documented by ToF-SIMS [9,26] (Figure 14D,G and Figure 15I).
5.3. Element Partitioning and the Fe-Oxyhydroxide Shuttle
LA-ICPMS trace element data reveal systematic partitioning governed by crystal-chemical controls on element incorporation. Three principal phases host trace elements: carbonate fluorapatite, calcite/Mg-calcite, and Fe-Mg phyllosilicates (chlorite/chamosite). Phosphorus concentrations increase systematically from the outer rim (3814 ± 4139 ppm) through the skeletal framework (81,184 ± 43,790 ppm) to the skeletal interior (90,650 ± 42,036 ppm) in sample 101.8, documenting the centripetal phosphatization gradient (Figure 10A). The REEs show similar enrichment patterns, with ΣREE increasing from 925 ± 1084 ppm in the outer rim to 2588–3321 ppm in phosphatized domains, consistent with preferential REE incorporation into the CFA lattice [25] (Figure 11B). The MREE enrichment characteristic of marine phosphorites ((Gd/Yb)ₙ = 2–8) reflects preferential complexation of middle REEs by carbonate ions in seawater and their subsequent incorporation into the B-type carbonate substitution sites of the apatite lattice [25] (Figure 11E).
Manganese exhibits the most pronounced partitioning into carbonate phases, with outer rim concentrations (53,736 ± 11,864 ppm) approximately four times higher than phosphatized interior values (13,429–17,708 ppm). This extreme Mn enrichment in the residual carbonate reflects the favorable substitution of Mn2+ for Ca2+ in the calcite lattice combined with Mn’s crystal-chemical incompatibility with the apatite structure [79] (Figure 10C). Strontium similarly partitions preferentially into carbonate (994 ± 293 ppm in outer rim vs. 299–329 ppm in interior) (Figure 10F).
Continental weathering under Early Cambrian elevated atmospheric CO2 conditions [20] produced Fe(III)-bearing oxyhydroxide complexes that scavenged phosphate and REEs from weathering fluids during fluvial transport to the shallow marine lagoon [24,39]. At the oxic water-sediment interface, these oxyhydroxides remained stable while FeOOH particles adsorbed additional PO43− and scavenged dissolved REEs from seawater, concentrating these elements within the reactive iron pool [42]. Upon burial into the suboxic zone, microbial Fe(III) reduction destabilized the oxyhydroxide complexes, releasing both Fe2+ and adsorbed PO43− into porewaters [9]. This coupled release drove phosphate supersaturation within carbonate-rich microenvironments where Ca2+ availability was high, promoting CFA nucleation on biological templates [72]. The REEs released during oxyhydroxide dissolution became available for incorporation into growing apatite crystals [25]. Simultaneously, released Fe2+ combined with silicate components and Mg2+ to form authigenic chlorite/chamosite under suboxic conditions [24,40]. This complete Fe-oxyhydroxide shuttle mechanism is summarized in Figure 16.
Figure 16.
Conceptual model of lithology-controlled phosphogenesis in the Early Cambrian reef–lagoon system. Fe–P–REE flux from continental weathering of volcanic felsic highlands entered a restricted lagoon where microbial Fe(III) reduction in suboxic porewaters released PO43− and Fe2+, driving microcrystalline CFA precipitation in phosphoritic limestone beds and authigenic chlorite/chamosite formation in greenish siltstones. Anoxic conditions were confined to localized fossil-cavity microenvironments; basin-wide anoxia was absent. Blue arrows indicate O2 diffusion from the water column, whereas black arrows represent geochemical fluxes and reaction pathways within the sediment. Colored shading highlights redox zonation and areas of PO43− and Fe2+ enrichment associated with phosphogenesis. The inset shows PAAS-normalized REE fractionation patterns contrasting lagoon CFA (high continental imprint) with greenish siltstones (seawater-influenced, negative Ce anomaly). Lower-right photomicrographs illustrate the three principal facies: ochre siltstone, greenish siltstone, and phosphoritic limestone.
5.4. Provenance and Organic Matter Preservation
Both samples preserve coherent provenance signatures in immobile element ratios despite extensive diagenetic modification. The Th/Sc vs. Zr/Sc relationships consistently indicate felsic to intermediate source compositions [92,94], with most samples plotting within or near the felsic composition field characterized by elevated Th/Sc ratios (10–80) and moderate Zr/Sc ratios (5–35) (Figure 12E). The identification of rubicline [Rb(AlSi3O8)] by Raman spectroscopy in sample 102.6 directly supports derivation from highly differentiated granitic or pegmatitic source rocks [69] (Figure 6C,D). The detrital heavy mineral assemblage—rutile (TiO2), quartz, and rubicline—provides additional provenance constraints, indicating derivation from medium- to high-grade metamorphic and highly evolved igneous rocks in the source area [67,68] (Figure 6C). The preservation of these detrital phases within the siltstone, in contrast to their virtual absence in the phosphoritic limestone, reflects the different depositional settings: proximal siliciclastic input to the siltstone vs. distal, clastic-starved conditions during limestone accumulation.
ToF-SIMS molecular mapping reveals multiple organic compound families preserved through different mineralization pathways, providing direct evidence for microbial involvement in phosphogenesis [31,101]. The spatial segregation between aliphatic hydrocarbon fragments (C13H17+) concentrated along phosphatized fossil walls and oxygenated organic fragments (C11H13O2+) distributed throughout the matrix documents two fundamentally different preservation mechanisms (Figure 14K–M). The aliphatic compounds represent primary organismal lipids rapidly encapsulated within the CFA matrix before extensive microbial degradation, while the oxygenated compounds likely represent microbial biomarkers distributed throughout the diagenetic mineral matrix [55,101]. The N enrichment patterns detected by SEM-EDS suggest that nitrogen released during organic matter decomposition was partitioned between residual organic N preserved within phosphatized structures and NH4+ incorporated into authigenic phyllosilicates through K+ substitution in interlayer sites (Figure 7A).
5.5. Implications for Early Cambrian Phosphogenesis
The Pedroche deposits demonstrate that Early Cambrian phosphogenesis was fundamentally controlled by microbial redox cycling operating within restricted platform environments, contrasting with modern upwelling-related phosphorites that develop under open-marine conditions with direct seawater signatures [9]. Several key implications emerge from this integrated study.
The strong lithological control on phosphatization efficiency and mineral texture explains the heterogeneous distribution of phosphatic facies within reef-lagoon systems. Carbonate substrates provided abundant Ca2+ and appropriate nucleation surfaces for well-crystallized CFA formation [64], whereas siliciclastic-dominated settings favored authigenic chlorite over phosphate precipitation [40] (Figure 10 and Figure 12). This lithological control also influenced the association of exceptional fossil preservation with specific depositional environments [9,27] (Figure 3).
Beyond lithology, the depositional setting itself influenced phosphatization pathways through its control on redox gradients and porewater exchange. Shallow reefal facies likely maintained oxic bottom waters that pushed the zone of active phosphatization deeper into the sediment column, favoring phosphate mineral preservation [12]. Deeper lagoonal facies may have experienced transient water-column anoxia that could dissolve orthophosphates back into the overlying water, potentially inhibiting phosphatization within the sediment column [37] (Figure 16, Figure 17 and Figure S6).
Figure 17.
Redox-stratified microbial and geochemical processes controlling phosphogenesis in phosphoritic limestone and greenish siltstone of the Early Cambrian lagoon. In the limestone, a suboxic main phosphogenesis zone drove microbial Fe(III) reduction, carbonate dissolution, and CFA precipitation on skeletal templates, with REE uptake, LREE enrichment, and minor Eu2+ incorporation. Anoxic microenvironments were restricted to fossil cavities. In the siltstone, higher detrital dilution and limited PO43− availability resulted in only poorly crystalline phosphate and dominant authigenic chlorite/chamosite formation. The lower panel illustrates the three-stage REE partitioning pathway: oxic Fe-oxyhydroxide scavenging → suboxic porewater mobilization → incorporation into the CFA lattice.
The multi-scale redox heterogeneity documented by this study—from basin-scale zonation through sediment-scale gradients to microenvironments within individual fossils [24,29]—emphasizes that Early Cambrian phosphogenesis operated through spatially and temporally variable processes rather than uniform basin-wide conditions (Figure 16, Figure 17 and Figure S6). This heterogeneity created diverse microenvironments for mineral precipitation and organic matter preservation, contributing to the exceptional fossil record of this critical interval in Earth history [7,23,111].
6. Conclusions
The integrated mineralogical, elemental, and molecular datasets from the Los Lagares-1 borehole demonstrate that phosphogenesis in the Lower Cambrian Pedroche Formation was controlled by the interaction between host lithology, redox stratification, and microbially mediated nutrient cycling within a semi-restricted reef–lagoon system. The alternation of phosphoritic limestones and greenish siltstones records facies-dependent diagenetic pathways rather than a uniform phosphogenic environment.
The phosphoritic limestone at 101.8 m preserves centripetal replacement of skeletal carbonate by carbonate fluorapatite during early diagenesis. Raman spectroscopy confirms mixed carbonate–hydroxyl–fluorapatite compositions [47,50], and SEM–EDS and LA-ICP-MS analyses document systematic elemental redistribution from carbonate-dominated rims to phosphate-enriched interiors. Trace-element gradients and Mn/Fe systematics indicate suboxic porewater conditions consistent with microbial Fe(III) reduction as a principal mechanism for phosphate release [27,28,82]. REE patterns reflect initial scavenging by Fe(III)-oxyhydroxides, subsequent mobilization during iron reduction, and final incorporation into the CFA lattice, producing seawater-inherited signatures modified by early diagenetic equilibration [25,86].
In contrast, the greenish siltstone at 102.6 m records siliciclastic-dominated sedimentation with stronger geochemical buffering by aluminosilicates. Phosphate occurs as less crystalline and less pervasive phases [63], and REE systematics retain a more pronounced detrital influence [110]. Although microbial redox cycling operated in both facies, lithological differences controlled Ca availability, porewater chemistry, CFA crystallinity, trace-element partitioning, and the degree of REE homogenization.
The combined datasets support a genetic model in which continental weathering supplied Fe(III)-oxyhydroxides bearing adsorbed phosphate and REEs to the lagoon [24,39]. Microbial degradation of organic matter triggered Fe reduction, porewater phosphate release, and localized CFA precipitation on skeletal and microbial templates under suboxic conditions [27,28]. Fully anoxic conditions were restricted to microenvironments within skeletal cavities, where limited sulfate reduction facilitated pyrite formation [26]. Coeval precipitation of ferrous phyllosilicates (chlorite/chamosite) further records redox stratification within the sediment column [74].
These results refine current models of Early Cambrian phosphogenesis by demonstrating that phosphate concentration and REE fractionation were primarily porewater-controlled and strongly modulated by lithological context, depositional setting, and microbial redox processes. The Pedroche system contrasts with open-marine upwelling phosphorites dominated by direct seawater signatures [9] and instead highlights the importance of restricted lagoonal settings in regulating nutrient recycling, trace-element redistribution, and exceptional fossil preservation during a critical interval of early metazoan ecosystem expansion [7,111].
Supplementary Materials
The following supporting information can be downloaded at: https://www.mdpi.com/article/10.3390/min16040405/s1, Figure S1: Box plots of LA-ICP-MS elemental concentrations (Log10 ppm) for major, trace, and rare earth elements (REEs) measured across three compositional domains of the phosphoritic bioclastic limestone at 101.8 m depth. Figure S2: Hierarchical cluster analysis (HCA) heatmap of Log10-transformed and z-score normalized LA-ICP-MS element concentrations for all analyzed spots in the 101.8 m phosphoritic limestone. Figure S3: Box plots of LA-ICP-MS elemental concentrations (Log10 ppm) for geochemically distinct groups identified in the siltstone at 102.6 m depth. Figure S4: Hierarchical cluster analysis (HCA) heatmap of Log10-transformed and z-score normalized LA-ICP-MS element concentrations for the 102.6 m siltstone. Figure S5: Negative ion mode ToF-SIMS imaging data and principal component analysis (PCA) of sample 101.8, showing ion distribution maps and PCA loadings for phosphorus-, sulfur-, carbonate-, silica-, and organic-related species. Figure S6: Conceptual flow diagram summarizing lithology-controlled biogeochemical pathways and resulting REE signatures in the Early Cambrian reef–lagoon system.
Author Contributions
Conceptualization, methodology, formal analysis, investigation, resources, writing—original draft preparation, writing—review and editing, visualization, and supervision, Y.X., T.H. and D.C.F.-R. Sample preparation and analysis, A.Z. and L.J. All authors have read and agreed to the published version of the manuscript.
Funding
This research was funded by the National Key Research and Development (grant number 2021YFA0716100) and Science and the Technology Development Fund (FDCT) (grant number 0052/2024/RIA1).
Data Availability Statement
The complete LA-ICP-MS geochemical datasets for samples 101.8 m and 102.6 m are archived in the PANGAEA Data Publisher and are publicly available at https://doi.pangaea.de/10.1594/PANGAEA.993263 (sample 101.8 m) and https://doi.pangaea.de/10.1594/PANGAEA.993262 (sample 102.6 m). All summarized data supporting the findings of this study are available in the Supplementary Materials.
Acknowledgments
All individuals included in this section have provided their consent to be acknowledged. The authors thank the personnel of the Lithoteca of the Instituto Geológico y Minero de España (IGME) for granting access to the Los Lagares-1 drill core materials and for their assistance during sample consultation and documentation. During the preparation of this manuscript, the authors used ChatGPT (OpenAI, GPT-5 series) and Claude Sonnet 4.6 (Anthropic) for the purposes of improving language clarity and refining the structure of the scientific text. The authors carefully reviewed and edited all generated content and assume full responsibility for the final version of the manuscript. Figure 16 and Figure 17 were generated using Figure Labs (Figure.ai platform) to assist in the graphical rendering of conceptual geochemical models. The scientific content, interpretation, and conceptual design of these figures were defined by the authors, who reviewed and validated the final graphical outputs. The authors assume full responsibility for the accuracy and integrity of the figures.
Conflicts of Interest
The authors declare no conflicts of interest.
References
- Marshall, C.R. Explaining the Cambrian “explosion” of animals. Annu. Rev. Earth Planet. Sci. 2006, 34, 355–384. [Google Scholar] [CrossRef] [Scilit]
- Na, L.; Kiessling, W. Diversity partitioning during the Cambrian radiation. Proc. Nat. Acad. Sci. USA 2015, 112, 4702–4706. [Google Scholar] [CrossRef] [Scilit]
- Lenton, T.M.; Boyle, R.A.; Poulton, S.W.; Shields-Zhou, G.A.; Butterfield, N.J. Co-evolution of eukaryotes and ocean oxygenation in the Neoproterozoic era. Nat. Geosci. 2014, 7, 257–265. [Google Scholar] [CrossRef] [Scilit]
- Knoll, A.H. The early evolution of Eukaryotes: A geological perspective. Science 1992, 256, 622–627. [Google Scholar] [CrossRef] [Scilit]
- Reinhard, C.T.; Planavsky, N.J.; Gill, B.C.; Ozaki, K.; Robbins, L.J.; Lyons, T.W.; Fischer, W.W.; Wang, C.; Cole, D.B.; Konhauser, K.O. Evolution of the global phosphorus cycle. Nature 2017, 541, 386–389. [Google Scholar] [CrossRef] [Scilit] [PubMed]
- Brasier, M.D. Paleoceanography and Changes in the Biological Cycling of Phosphorus across the Precambrian-Cambrian Boundary. In Origin and Early Evolution of the Metazoa; Lipps, J.H., Signor, P.W., Eds.; Topics in Geobiology; Springer: Boston, MA, USA, 1992; pp. 483–523. [Google Scholar]
- Butterfield, N.J. Exceptional Fossil Preservation and the Cambrian Explosion. Integr. Comp. Biol. 2003, 43, 166–177. [Google Scholar] [CrossRef] [Scilit] [PubMed]
- Creveling, J.R.; Johnston, D.T.; Poulton, S.W.; Kotrc, B.; März, C.; Schrag, D.P.; Knoll, A.H. Phosphorus sources for phosphatic Cambrian carbonates. GSA Bull. 2014, 126, 145–163. [Google Scholar] [CrossRef] [Scilit]
- Föllmi, K.B. The phosphorus cycle, phosphogenesis and marine phosphate-rich deposits. Earth-Sci. Rev. 1996, 40, 55–124. [Google Scholar] [CrossRef] [Scilit]
- Creveling, J.R.; Knoll, A.H.; Johnston, D.T. Taphonomy of Cambrian phosphatic small shelly fossils. Palaios 2014, 29, 295–308. [Google Scholar] [CrossRef] [Scilit]
- Briggs, D.E.G.; Kear, A.J.; Martill, D.M.; Wilby, P.R. Phosphatization of soft-tissue in experiments and fossils. J. Geol. Soc. 1993, 150, 1035–1038. [Google Scholar] [CrossRef] [Scilit]
- Creveling, J.R.; Fernández-Remolar, D.; Rodríguez-Martínez, M.; Menéndez, S.; Bergmann, K.D.; Gill, B.C.; Abelson, J.; Amils, R.; Ehlmann, B.L.; García-Bellido, D.C.; et al. Geobiology of a lower Cambrian carbonate platform, Pedroche Formation, Ossa Morena Zone, Spain. Palaeogeogr. Palaeoclimatol. Palaeoecol. 2013, 386, 459–478. [Google Scholar] [CrossRef] [Scilit]
- Xiao, S.; Schiffbauer, J.D. Microfossil Phosphatization and Its Astrobiological Implications. In From Fossils to Astrobiology: Records of Life on Earth and Search for Extraterrestrial Biosignatures; Seckbach, J., Walsh, M., Eds.; Springer: Dordrecht, The Netherlands, 2008; pp. 89–117. [Google Scholar]
- Moreno-Eiris, E. Los montículos arrecifales de Algas y Arqueociatos del Cámbrico Inferior de Sierra Morena. I: Estratigrafía y Facies. Boletín Geológico Min. 1987, 98, 295–317. [Google Scholar]
- Briggs Derek, E.G.; Wilby Philip, R. The role of the calcium carbonate-calcium phosphate switch in the mineralization of soft-bodied fossils. J. Geol. Soc. 1996, 153, 665–668. [Google Scholar] [CrossRef] [Scilit]
- Fernández-Remolar, D.C. The phosphoritic limestones of the Lower Ovetian from the Sierra de Córdoba, Spain. Bol. Real Soc. Española Hist. Nat. Secc. Geológica 1999, 95, 15–45. [Google Scholar]
- Zhuravlev, A.Y. Paleoecology of Cambrian Reef Ecosystems. In The History and Sedimentology of Ancient Reef Systems; Stanley, G.D., Ed.; Springer: Boston, MA, USA, 2001; pp. 121–157. [Google Scholar]
- Perejón, A.; Moreno-Eiris, E. Biostratigraphy and paleobiogeography of the archaeocyaths on the southwestern margin of Gondwana. Z. Dtsch. Ges. Geowiss. 2006, 157, 611–627. [Google Scholar] [CrossRef] [Scilit]
- Moreno-Eiris, E. Los montículos arrecifales de Algas y Arqueociatos del Cámbrico lnferior de Sierra Morena II: Las algas calcáreas. Boletín Geológico Min. 1987, 98, 449–459. [Google Scholar]
- Hearing, T.W.; Harvey, T.H.P.; Williams, M.; Leng, M.J.; Lamb, A.L.; Wilby, P.R.; Gabbott, S.E.; Pohl, A.; Donnadieu, Y. An early Cambrian greenhouse climate. Sci. Adv. 2018, 4, eaar5690. [Google Scholar] [CrossRef] [Scilit] [PubMed]
- Li, W.-P.; Zhao, Y.-Y.; Zhao, M.-Y.; Zha, X.-P.; Zheng, Y.-F. Enhanced weathering as a trigger for the rise of atmospheric O2 level from the late Ediacaran to the early Cambrian. Sci. Rep. 2019, 9, 10630. [Google Scholar] [CrossRef] [Scilit]
- Horton, F. Did phosphorus derived from the weathering of large igneous provinces fertilize the Neoproterozoic ocean? Geochem. Geophys. Geosystems 2015, 16, 1723–1738. [Google Scholar] [CrossRef] [Scilit]
- Zhuravlev, A.Y.; Mitchell, E.G.; Bowyer, F.; Wood, R.; Penny, A. Increases in reef size, habitat and metacommunity complexity associated with Cambrian radiation oxygenation pulses. Nat. Commun. 2022, 13, 7523. [Google Scholar] [CrossRef] [Scilit]
- Huang, T.; Fernández-Remolar, D.C. Geobiological and Biochemical Cycling in the Early Cambrian: Insights from Phosphoritic Materials of South Spain. Minerals 2025, 15, 203. [Google Scholar] [CrossRef] [Scilit]
- Reynard, B.; Lécuyer, C.; Grandjean, P. Crystal-chemical controls on rare-earth element concentrations in fossil biogenic apatites and implications for paleoenvironmental reconstructions. Chem. Geol. 1999, 155, 233–241. [Google Scholar] [CrossRef] [Scilit]
- Jørgensen, B.B.; Findlay, A.J.; Pellerin, A. The Biogeochemical Sulfur Cycle of Marine Sediments. Front. Microbiol. 2019, 10, 849. [Google Scholar] [CrossRef] [Scilit]
- Arning, E.T.; Birgel, D.; Brunner, B.; Peckmann, J. Bacterial formation of phosphatic laminites off Peru. Geobiology 2009, 7, 295–307. [Google Scholar] [CrossRef] [Scilit] [PubMed]
- Crosby, C.H.; Bailey, J. The role of microbes in the formation of modern and ancient phosphatic mineral deposits. Front. Microbiol. 2012, 3, 241. [Google Scholar] [CrossRef] [Scilit]
- Muscente, A.D.; Schiffbauer, J.D.; Broce, J.; Laflamme, M.; O’Donnell, K.; Boag, T.H.; Meyer, M.; Hawkins, A.D.; Huntley, J.W.; McNamara, M.; et al. Exceptionally preserved fossil assemblages through geologic time and space. Gondwana Res. 2017, 48, 164–188. [Google Scholar] [CrossRef] [Scilit]
- Briggs, D.E.G. The role of decay and mineralization in the preservation of soft-bodied fossils. Annu. Rev. Earth Planet. Sci. 2003, 31, 275–301. [Google Scholar] [CrossRef] [Scilit]
- Schiffbauer, J.D.; Wallace, A.F.; Broce, J.; Xiao, S. Exceptional Fossil Conservation through Phosphatization. Paleontol. Soc. Pap. 2014, 20, 59–82. [Google Scholar] [CrossRef] [Scilit]
- Instituto Geológico y Minero de España; Ingemisa. Sondeo Los Lagares nº 1: Columna Geológica y Registro Litológico; Ministerio de Industria y Energía: Madrid, Spain, 1982.
- Quesada, C. Geological constraints on the Paleozoic tectonic evolution of tectonostratigraphic terranes in the Iberian Massif. Tectonophysics 1991, 185, 225–245. [Google Scholar] [CrossRef] [Scilit]
- Álvaro, J.J.; Bellido, F.; Gasquet, D.; Pereira, M.F.; Quesada, C.; Sánchez-García, T. Diachronism in the late Neoproterozoic–Cambrian arc-rift transition of North Gondwana: A comparison of Morocco and the Iberian Ossa-Morena Zone. J. Afr. Earth Sci. 2014, 98, 113–132. [Google Scholar] [CrossRef] [Scilit]
- Fernandez-Remolar, D.C. Latest Neoproterozoic to Middle Cambrian body fossil record in Spain (exclusive of trilobites and archaeocyaths) and their stratigraphic significance. Gff 2001, 123, 73–80. [Google Scholar] [CrossRef] [Scilit]
- Liñan, E. Bioestratigrafia de la Sierra de Córdoba. Ph.D. Thesis, Universidad de Granada, Granada, Spain, 1978. [Google Scholar]
- Algeo, T.J.; Ingall, E. Sedimentary Corg:P ratios, paleocean ventilation, and Phanerozoic atmospheric pO2. Palaeogeogr. Palaeoclimatol. Palaeoecol. 2007, 256, 130–155. [Google Scholar] [CrossRef] [Scilit]
- Canfield, D.E.; Poulton, S.W.; Narbonne, G.M. Late-Neoproterozoic Deep-Ocean Oxygenation and the Rise of Animal Life. Science 2007, 315, 92–95. [Google Scholar] [CrossRef] [Scilit]
- Wang, R.; Lang, X.; Ding, W.; Liu, Y.; Huang, T.; Tang, W.; Shen, B. The coupling of Phanerozoic continental weathering and marine phosphorus cycle. Sci. Rep. 2020, 10, 5794. [Google Scholar] [CrossRef] [Scilit]
- Baldermann, A.; Banerjee, S.; Czuppon, G.; Dietzel, M.; Farkaš, J.; Löhr, S.; Moser, U.; Scheiblhofer, E.; Wright, N.M.; Zack, T. Impact of green clay authigenesis on element sequestration in marine settings. Nat. Commun. 2022, 13, 1527. [Google Scholar] [CrossRef] [Scilit]
- Xiao, S.; Knoll, A.H. Fossil preservation in the Neoproterozoic Doushantuo phosphorite Lagerstätte, South China. Lethaia 1999, 32, 219–238. [Google Scholar] [CrossRef] [Scilit]
- Konhauser, K.O. Diversity of bacterial iron mineralization. Earth-Sci. Rev. 1998, 43, 91–121. [Google Scholar] [CrossRef] [Scilit]
- Antonakos, A.; Liarokapis, E.; Leventouri, T. Micro-Raman and FTIR studies of synthetic and natural apatites. Biomaterials 2007, 28, 3043–3054. [Google Scholar] [CrossRef] [Scilit]
- Liu, Y.; Hu, Z.; Gao, S.; Günther, D.; Xu, J.; Gao, C.; Chen, H. In situ analysis of major and trace elements of anhydrous minerals by LA-ICP-MS without applying an internal standard. Chem. Geol. 2008, 257, 34–43. [Google Scholar] [CrossRef] [Scilit]
- Benninghoven, A.; Rüdenauer, F.G.; Werner, H.W. Secondary Ion Mass Spectrometry: Basic Concepts, Instrumental Aspects, Applications and Trends; John Wiley & Sons: New York, NY, USA, 1987. [Google Scholar]
- Vickerman, J.C.; Briggs, D. ToF-SIMS: Materials Analysis by Mass Spectrometry, 2nd ed.; IM Publications and SurfaceSpectra Limited: Chichester, UK, 2013. [Google Scholar]
- Wopenka, B.; Pasteris, J.D. A mineralogical perspective on the apatite in bone. Mater. Sci. Eng. C 2005, 25, 131–143. [Google Scholar] [CrossRef] [Scilit]
- Awonusi, A.; Morris, M.D.; Tecklenburg, M.M.J. Carbonate Assignment and Calibration in the Raman Spectrum of Apatite. Calcif. Tissue Int. 2007, 81, 46–52. [Google Scholar] [CrossRef] [Scilit]
- Pasteris, J.D.; Wopenka, B.; Valsami-Jones, E. Bone and Tooth Mineralization: Why Apatite? Elements 2008, 4, 97–104. [Google Scholar] [CrossRef] [Scilit]
- Xue, C.; Chen, Y.; Huang, Y.; Zhu, P. Hydrothermal synthesis and biocompatibility study of highly crystalline carbonated hydroxyapatite nanorods. Nanoscale Res. Lett. 2015, 10, 1018. [Google Scholar] [CrossRef] [Scilit] [PubMed]
- Shah, F.A. Towards refining Raman spectroscopy-based assessment of bone composition. Sci. Rep. 2020, 10, 16662. [Google Scholar] [CrossRef] [Scilit] [PubMed]
- Shemesh, A. Crystallinity and diagenesis of sedimentary apatites. Geochim. Cosmochim. Acta 1990, 54, 2433–2438. [Google Scholar] [CrossRef] [Scilit]
- Dal Sasso, G.; Maritan, L.; Usai, D.; Angelini, I.; Artioli, G. A universal curve of apatite crystallinity for the assessment of bone integrity and preservation. Sci. Rep. 2018, 8, 12025. [Google Scholar] [CrossRef] [Scilit] [PubMed]
- Pucéat, E.; Reynard, B.; Lécuyer, C. Can crystallinity be used to determine the degree of chemical alteration of biogenic apatites? Chem. Geol. 2004, 205, 83–97. [Google Scholar] [CrossRef] [Scilit]
- Sagemann, J.; Bale, S.J.; Briggs, D.E.G.; Parkes, R.J. Controls on the formation of authigenic minerals in association with decaying organic matter: An experimental approach. Geochim. Cosmochim. Acta 1999, 63, 1083–1095. [Google Scholar] [CrossRef] [Scilit]
- Kloprogge, J.T. Chapter 6—Raman Spectroscopy of Clay Minerals. In Developments in Clay Science; Gates, W.P., Kloprogge, J.T., Madejová, J., Bergaya, F., Eds.; Elsevier: Amsterdam, The Netherlands, 2017; Volume 8, pp. 150–199. [Google Scholar]
- Wang, A.; Freeman, J.J.; Jolliff, B.L. Understanding the Raman spectral features of phyllosilicates. J. Raman Spectrosc. 2015, 46, 829–845. [Google Scholar] [CrossRef] [Scilit]
- Baumgartner, R.J.; Cuadros, J.; Michalski, J.; Pejcic, B.; Laukamp, C.; Hu, S.; Bourdet, J. Chemistry-dependent Raman spectral features of glauconite and nontronite: Implications for mineral identification and provenance analysis. Am. Mineral. 2022, 107, 1080–1090. [Google Scholar] [CrossRef] [Scilit]
- Moretto, L.M.; Orsega, E.F.; Mazzocchin, G.A. Spectroscopic Methods for the Analysis of Celadonite and Glauconite in Roman Green Wall Paintings. J. Cult. Herit. 2011, 12, 384. [Google Scholar] [CrossRef] [Scilit]
- Nieto, F.; Abad, I.; Bauluz, B.; Reolid, M. Textural and genetic relationships between glauconite and celadonite at the nanoscale: Two different structural-compositional fields. Eur. J. Mineral. 2021, 33, 503–517. [Google Scholar] [CrossRef] [Scilit]
- López-Quirós, A.; Escutia, C.; Sánchez-Navas, A.; Nieto, F.; Garcia-Casco, A.; Martín-Algarra, A.; Evangelinos, D.; Salabarnada, A. Glaucony authigenesis, maturity and alteration in the Weddell Sea: An indicator of paleoenvironmental conditions before the onset of Antarctic glaciation. Sci. Rep. 2019, 9, 13580. [Google Scholar] [CrossRef] [Scilit] [PubMed]
- Chakraborty, A.; Srivastava, A.; Singh, B.; Punekar, J.; Dasgupta, S.; Chakrabarty, S.; Banerjee, S. Oxygen-depleted and ferruginous seawater composition imprinted in Early Cretaceous Fe-rich Al-glauconites in marginal marine deposits. Sci. Rep. 2025, 15, 37208. [Google Scholar] [CrossRef] [Scilit] [PubMed]
- Keenan, S.W. From bone toite: A synthesis of vertebrate fossil diagenesis. Palaeogeogr. Palaeoclimatol. Palaeoecol. 2016, 457, 168–183. [Google Scholar] [CrossRef] [Scilit]
- Glenn, C.R.; Föllmi, K.B.; Riggs, S.R.; Baturin, G.N.; Grimm, K.A.; Trappe, J.; Abed, A.M.; Galli-Oliver, C.; Garrison, R.E.; Ilyin, A.V.; et al. Phosphorus and phosphorites: Sedimentology and environments of formation. Eclogae Geol. Helv. 1994, 87, 747–788. [Google Scholar]
- Jahnke, R.A.; Emerson, S.R.; Roe, K.K.; Burnett, W.C. The present day formation of apatite in Mexican continental margin sediments. Geochim. Cosmochim. Acta 1983, 47, 259–266. [Google Scholar] [CrossRef] [Scilit]
- Jahnke, R.A. The synthesis and solubility of carbonate fluorapatite. Am. J. Sci. 1984, 284, 58–78. [Google Scholar] [CrossRef] [Scilit]
- Meinhold, G. Rutile and its applications in earth sciences. Earth-Sci. Rev. 2010, 102, 1–28. [Google Scholar] [CrossRef] [Scilit]
- Zack, T.; von Eynatten, H.; Kronz, A. Rutile geochemistry and its potential use in quantitative provenance studies. Sediment. Geol. 2004, 171, 37–58. [Google Scholar] [CrossRef] [Scilit]
- Černý, P.; Ercit, T.S. The classification of granitic pegmatites revisited. Can. Mineral. 2005, 43, 2005–2026. [Google Scholar] [CrossRef] [Scilit]
- Allison, P.A. Konservat-Lagerstätten: Cause and classification. Paleobiology 1988, 14, 331–344. [Google Scholar] [CrossRef] [Scilit]
- Weiner, S.; Dove, P.M. An Overview of Biomineralization Processes and the Problem of the Vital Effect. Rev. Mineral. Geochem. 2003, 54, 1–29. [Google Scholar] [CrossRef] [Scilit]
- She, Z.; Strother, P.; McMahon, G.; Nittler, L.R.; Wang, J.; Zhang, J.; Sang, L.; Ma, C.; Papineau, D. Terminal Proterozoic cyanobacterial blooms and phosphogenesis documented by the Doushantuo granular phosphorites I: In situ micro-analysis of textures and composition. Precambrian Res. 2013, 235, 20–35. [Google Scholar] [CrossRef] [Scilit]
- Dornbos, S.Q. Phosphatization through the Phanerozoic. In Taphonomy: Process and Bias Through Time; Allison, P.A., Bottjer, D.J., Eds.; Topics in Geobiology; Springer: Dordrecht, The Netherlands, 2011; Volume 32, pp. 435–456. [Google Scholar]
- Worden, R.H.; Griffiths, J.; Wooldridge, L.J.; Utley, J.E.P.; Lawan, A.Y.; Muhammed, D.D.; Simon, N.; Armitage, P.J. Chlorite in sandstones. Earth-Sci. Rev. 2020, 204, 103105. [Google Scholar] [CrossRef] [Scilit]
- Deer, W.A.; Howie, R.A.; Zussman, J. An Introduction to the Rock-Forming Minerals; Longman Scientific & Technical: Harlow, UK, 1992. [Google Scholar]
- Rodríguez, H.; Fraga, R. Phosphate solubilizing bacteria and their role in plant growth promotion. Biotechnol. Adv. 1999, 17, 319–339. [Google Scholar] [CrossRef] [Scilit]
- Banner, J.L. Radiogenic isotopes: Systematics and applications to earth surface processes and chemical stratigraphy. Earth-Sci. Rev. 2004, 65, 141–194. [Google Scholar] [CrossRef] [Scilit]
- Raiswell, R.; Canfield, D. The Iron Biogeochemical Cycle Past and Present. Geochem. Perspect. Lett. 2012, 1, 1–220. [Google Scholar] [CrossRef] [Scilit]
- Brand, U.; Veizer, J. Chemical diagenesis of a multicomponent carbonate system; 1, Trace elements. J. Sediment. Res. 1980, 50, 1219–1236. [Google Scholar] [CrossRef] [Scilit]
- Jarvis, I.; Burnett, W.C.; Nathan, Y.; Almbaydin, F.S.M.; Attia, A.K.M.; Castro, L.N.; Flicoteaux, R.; Hilmy, M.E.; Husain, V.; Qutawnah, A.A.; et al. Phosphorite geochemistry: State-of-the-art and environmental concerns. Eclogae Geol. Helv. 1994, 87, 643–700. [Google Scholar]
- Hayashi, K.-I.; Fujisawa, H.; Holland, H.D.; Ohmoto, H. Geochemistry of ~1.9 Ga sedimentary rocks from northeastern Labrador, Canada. Geochim. Cosmochim. Acta 1997, 61, 4115–4137. [Google Scholar] [CrossRef] [Scilit] [PubMed]
- Tribovillard, N.; Algeo, T.J.; Lyons, T.; Riboulleau, A. Trace metals as paleoredox and paleoproductivity proxies: An update. Chem. Geol. 2006, 232, 12–32. [Google Scholar] [CrossRef] [Scilit]
- Burdige, D.J. The biogeochemistry of manganese and iron reduction in marine sediments. Earth-Sci. Rev. 1993, 35, 249–284. [Google Scholar] [CrossRef] [Scilit]
- Meunier, A.; El Albani, A. The glauconite–Fe-illite–Fe-smectite problem: A critical review. Terra Nova 2007, 19, 95–104. [Google Scholar] [CrossRef] [Scilit]
- German, C.R.; Elderfield, H. Application of the Ce anomaly as a paleoredox indicator: The ground rules. Paleoceanography 1990, 5, 823–833. [Google Scholar] [CrossRef] [Scilit]
- Shields, G.A.; Stille, P. Diagenetic constraints on the use of cerium anomalies as palaeoseawater redox proxies: An isotopic and REE study of Cambrian phosphorites. Chem. Geol. 2001, 175, 29–48. [Google Scholar] [CrossRef] [Scilit]
- Sverjensky, D.A. Europium redox equilibria in aqueous solution. Earth Planet. Sci. Lett. 1984, 67, 70–78. [Google Scholar] [CrossRef] [Scilit]
- Nozaki, Y.; Zhang, J.; Amakawa, H. The fractionation between Y and Ho in the marine environment. Earth Planet. Sci. Lett. 1997, 148, 329–340. [Google Scholar] [CrossRef] [Scilit]
- Bau, M.; Dulski, P.; Moeller, P. Yttrium and holmium in South Pacific seawater: Vertical distribution and possible fractionation mechanisms. Chem. Erde—Geochem. 1995, 55, 1–15. [Google Scholar]
- Bau, M. Controls on the fractionation of isovalent trace elements in magmatic and aqueous systems: Evidence from Y/Ho, Zr/Hf, and lanthanide tetrad effect. Contrib. Mineral. Petrol. 1996, 123, 323–333. [Google Scholar] [CrossRef] [Scilit]
- Bau, M.; Dulski, P. Distribution of yttrium and rare-earth elements in the Penge and Kuruman iron-formations, Transvaal Supergroup, South Africa. Precambrian Res. 1996, 79, 37–55. [Google Scholar] [CrossRef] [Scilit]
- McLennan, S.M.; Hemming, S.; McDaniel, D.K.; Hanson, G.N. Geochemical approaches to sedimentation, provenance, and tectonics. GSA Spec. Pap. 1993, 284, 21–40. [Google Scholar] [CrossRef] [Scilit]
- Bock, B.; McLennan, S.M.; Hanson, G.N. Geochemistry and provenance of the Middle Ordovician Austin Glen Member (Normanskill Formation) and the Taconian Orogeny in New England. Sedimentology 1998, 45, 635–655. [Google Scholar] [CrossRef] [Scilit]
- Taylor, S.R.; McLennan, S.M. The Continental Crust: Its Composition and Evolution; Blackwell Scientific Publications: Oxford, UK, 1985. [Google Scholar]
- Rollinson, H.R. Using Geochemical Data: Evaluation, Presentation, Interpretation; Longman Scientific & Technical: Harlow, UK, 1993. [Google Scholar]
- Vickerman, J.C. Secondary ion mass spectrometry–basic concepts, instrumental aspects, applications and trends. A. Benninghoven, F.G. Rudenauer and H.W. Werner, Wiley, New York, 1987, 1277 pages. Surf. Interface Anal. 1987, 10, 435. [Google Scholar] [CrossRef] [Scilit]
- Addadi, L.; Weiner, S. Interactions between acidic proteins and crystals: Stereochemical requirements in biomineralization. Proc. Nat. Acad. Sci. USA 1985, 82, 4110–4114. [Google Scholar] [CrossRef] [Scilit]
- Worden, R.H.; Morad, S. Clay Minerals in Sandstones: Controls on Formation, Distribution and Evolution. In Clay Mineral Cements in Sandstones; Blackwell Science Ltd.: Oxford, UK, 1999; pp. 1–41. [Google Scholar]
- Berner, R.W.; Raiswell, R. Burial of organic carbon and pyrite sulfur in sediments over Phanerozoic time: A new theory. Geochim. Cosmochim. Acta 1983, 47, 855–862. [Google Scholar] [CrossRef] [Scilit]
- Canfield, D.E.; Thamdrup, B.; Hansen, J.W. The anaerobic degradation of organic matter in Danish coastal sediments: Iron reduction, manganese reduction, and sulfate reduction. Geochim. Cosmochim. Acta 1993, 57, 3867–3883. [Google Scholar] [CrossRef] [Scilit]
- Briggs, D.E.G.; Summons, R.E. Ancient biomolecules: Their origins, fossilization, and role in revealing the history of life. BioEssays 2014, 36, 482–490. [Google Scholar] [CrossRef] [Scilit] [PubMed]
- Donoghue, P.C.J.; Bengtson, S.; Dong, X.-p.; Gostling, N.J.; Huldtgren, T.; Cunningham, J.A.; Yin, C.; Yue, Z.; Peng, F.; Stampanoni, M. Synchrotron X-ray tomographic microscopy of fossil embryos. Nature 2006, 442, 680–683. [Google Scholar] [CrossRef] [Scilit] [PubMed]
- Hedges, J.I.; Keil, R.G. Sedimentary organic matter preservation: An assessment and speculative synthesis. Mar. Chem. 1995, 49, 81–115. [Google Scholar] [CrossRef] [Scilit]
- Godon, A.; Jendrzejewski, N.; Eggenkamp, H.G.M.; Banks, D.A.; Ader, M.; Coleman, M.L.; Pineau, F. A cross-calibration of chlorine isotopic measurements and suitability of seawater as the international reference material. Chem. Geol. 2004, 207, 1–12. [Google Scholar] [CrossRef] [Scilit]
- Eggenkamp, H.G.M. δ37Cl: The Geochemistry of Chlorine Isotopes. Ph.D. Thesis, Utrecht University, Utrecht, The Netherlands, 1994. [Google Scholar]
- Fontes, J.C.; Matray, J.M. Geochemistry and origin of formation brines from the Paris Basin, France: 1. Brines associated with Triassic salts. Chem. Geol. 1993, 109, 149–175. [Google Scholar] [CrossRef] [Scilit]
- Walter, L.M.; Stueber, A.M.; Huston, T.J. Br-Cl-Na systematics in Illinois basin fluids: Constraints on fluid origin and evolution. Geology 1990, 18, 315–318. [Google Scholar] [CrossRef] [Scilit]
- Worden, R.H. Controls on halogen concentrations in sedimentary formation waters. Mineral. Mag. 1996, 60, 259–274. [Google Scholar] [CrossRef] [Scilit]
- McLennan, S.M. Rare earth elements in sedimentary rocks: Influence of provenance and sedimentary processes. In Geochemistry and Mineralogy of Rare Earth Elements; Lipin, B.R., McKay, G.A., Eds.; Mineralogical Society of America: Washington, DC, USA, 1989; Volume 21, pp. 169–200. [Google Scholar]
- Cullers, R.L.; Graf, J.L. Rare earth elements in igneous rocks of the continental crust: Intermediate and silicic rocks—Ore petrogenesis. Dev. Geochem. 1984, 2, 275–316. [Google Scholar]
- Wood, R.; Liu, A.G.; Bowyer, F.; Wilby, P.R.; Dunn, F.S.; Kenchington, C.G.; Cuthill, J.F.H.; Mitchell, E.G.; Penny, A. Integrated records of environmental change and evolution challenge the Cambrian Explosion. Nat. Ecol. Evol. 2019, 3, 528–538. [Google Scholar] [CrossRef] [Scilit] [PubMed]
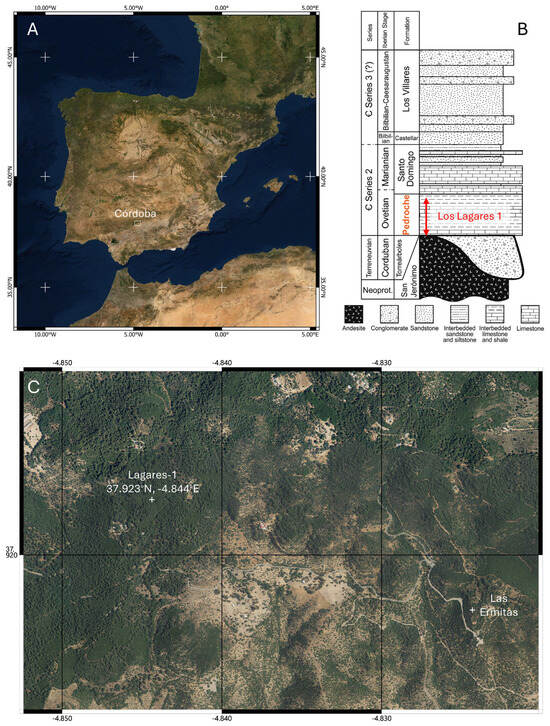
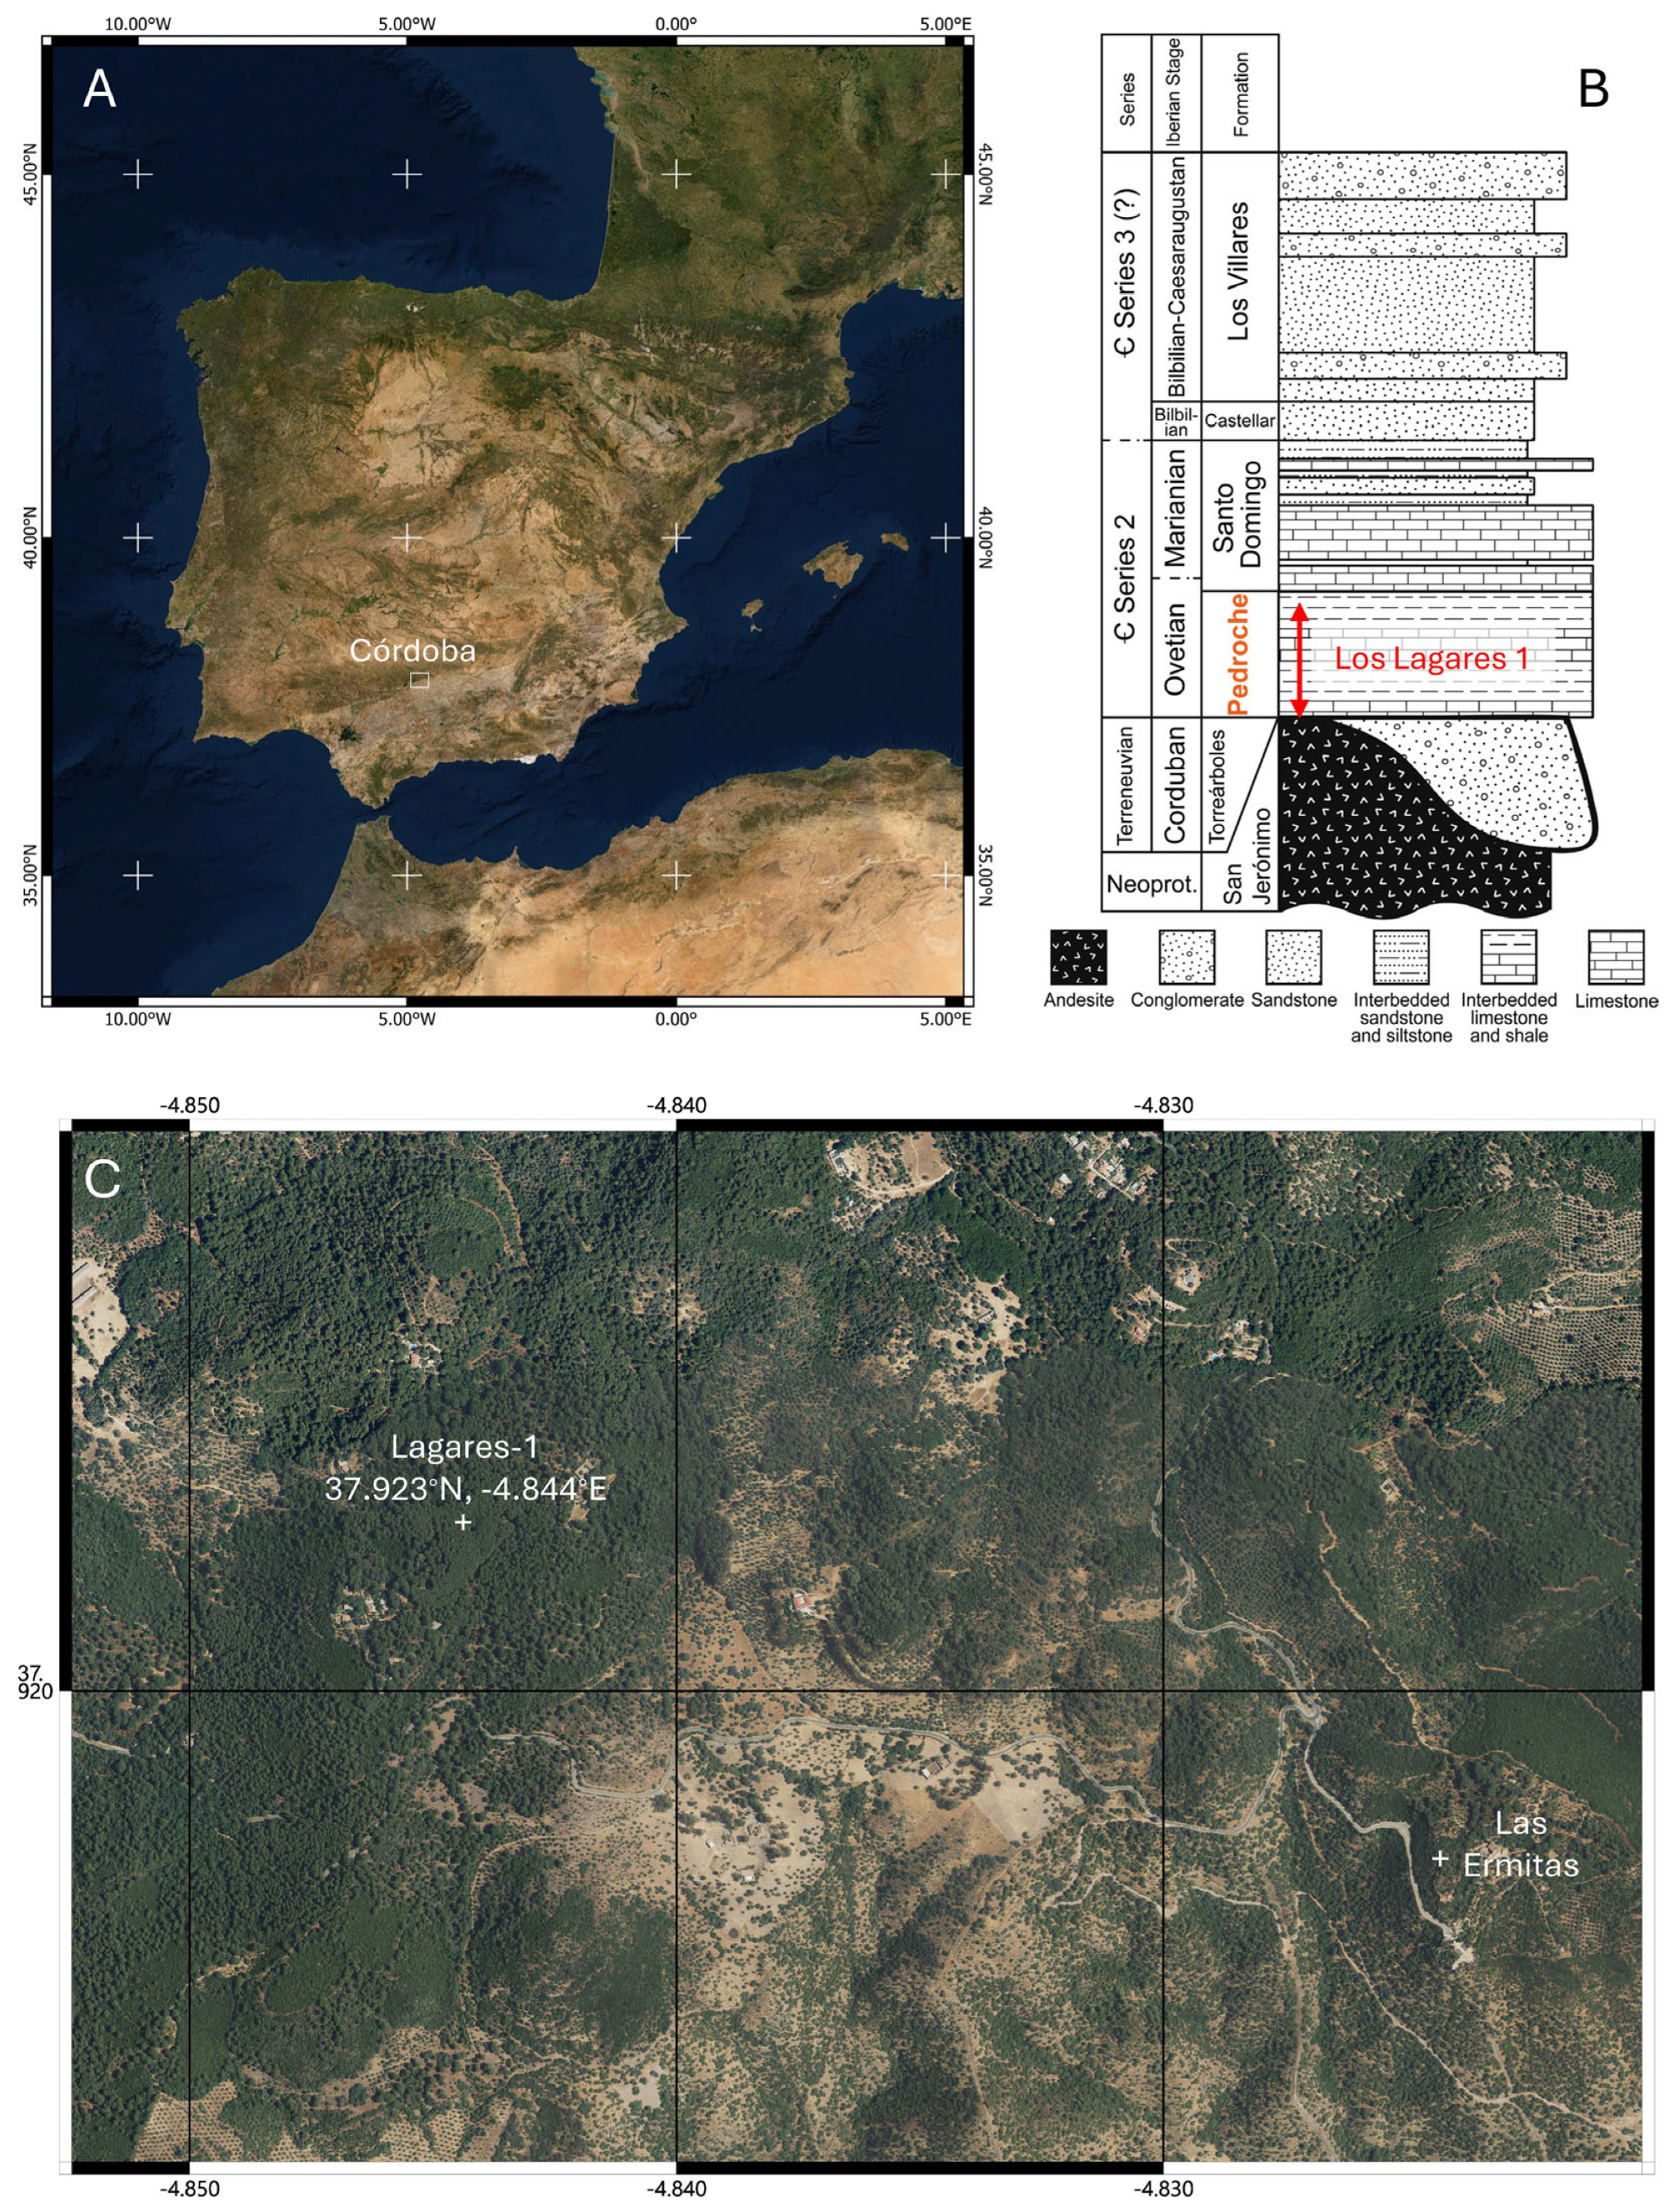
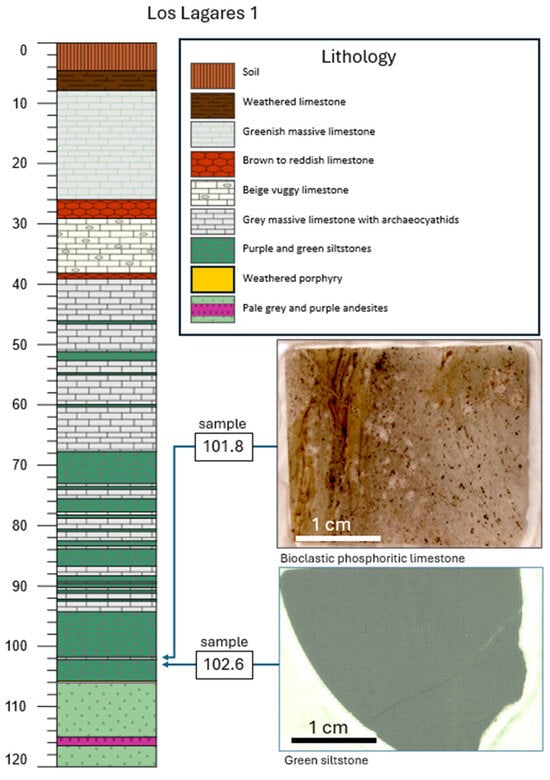
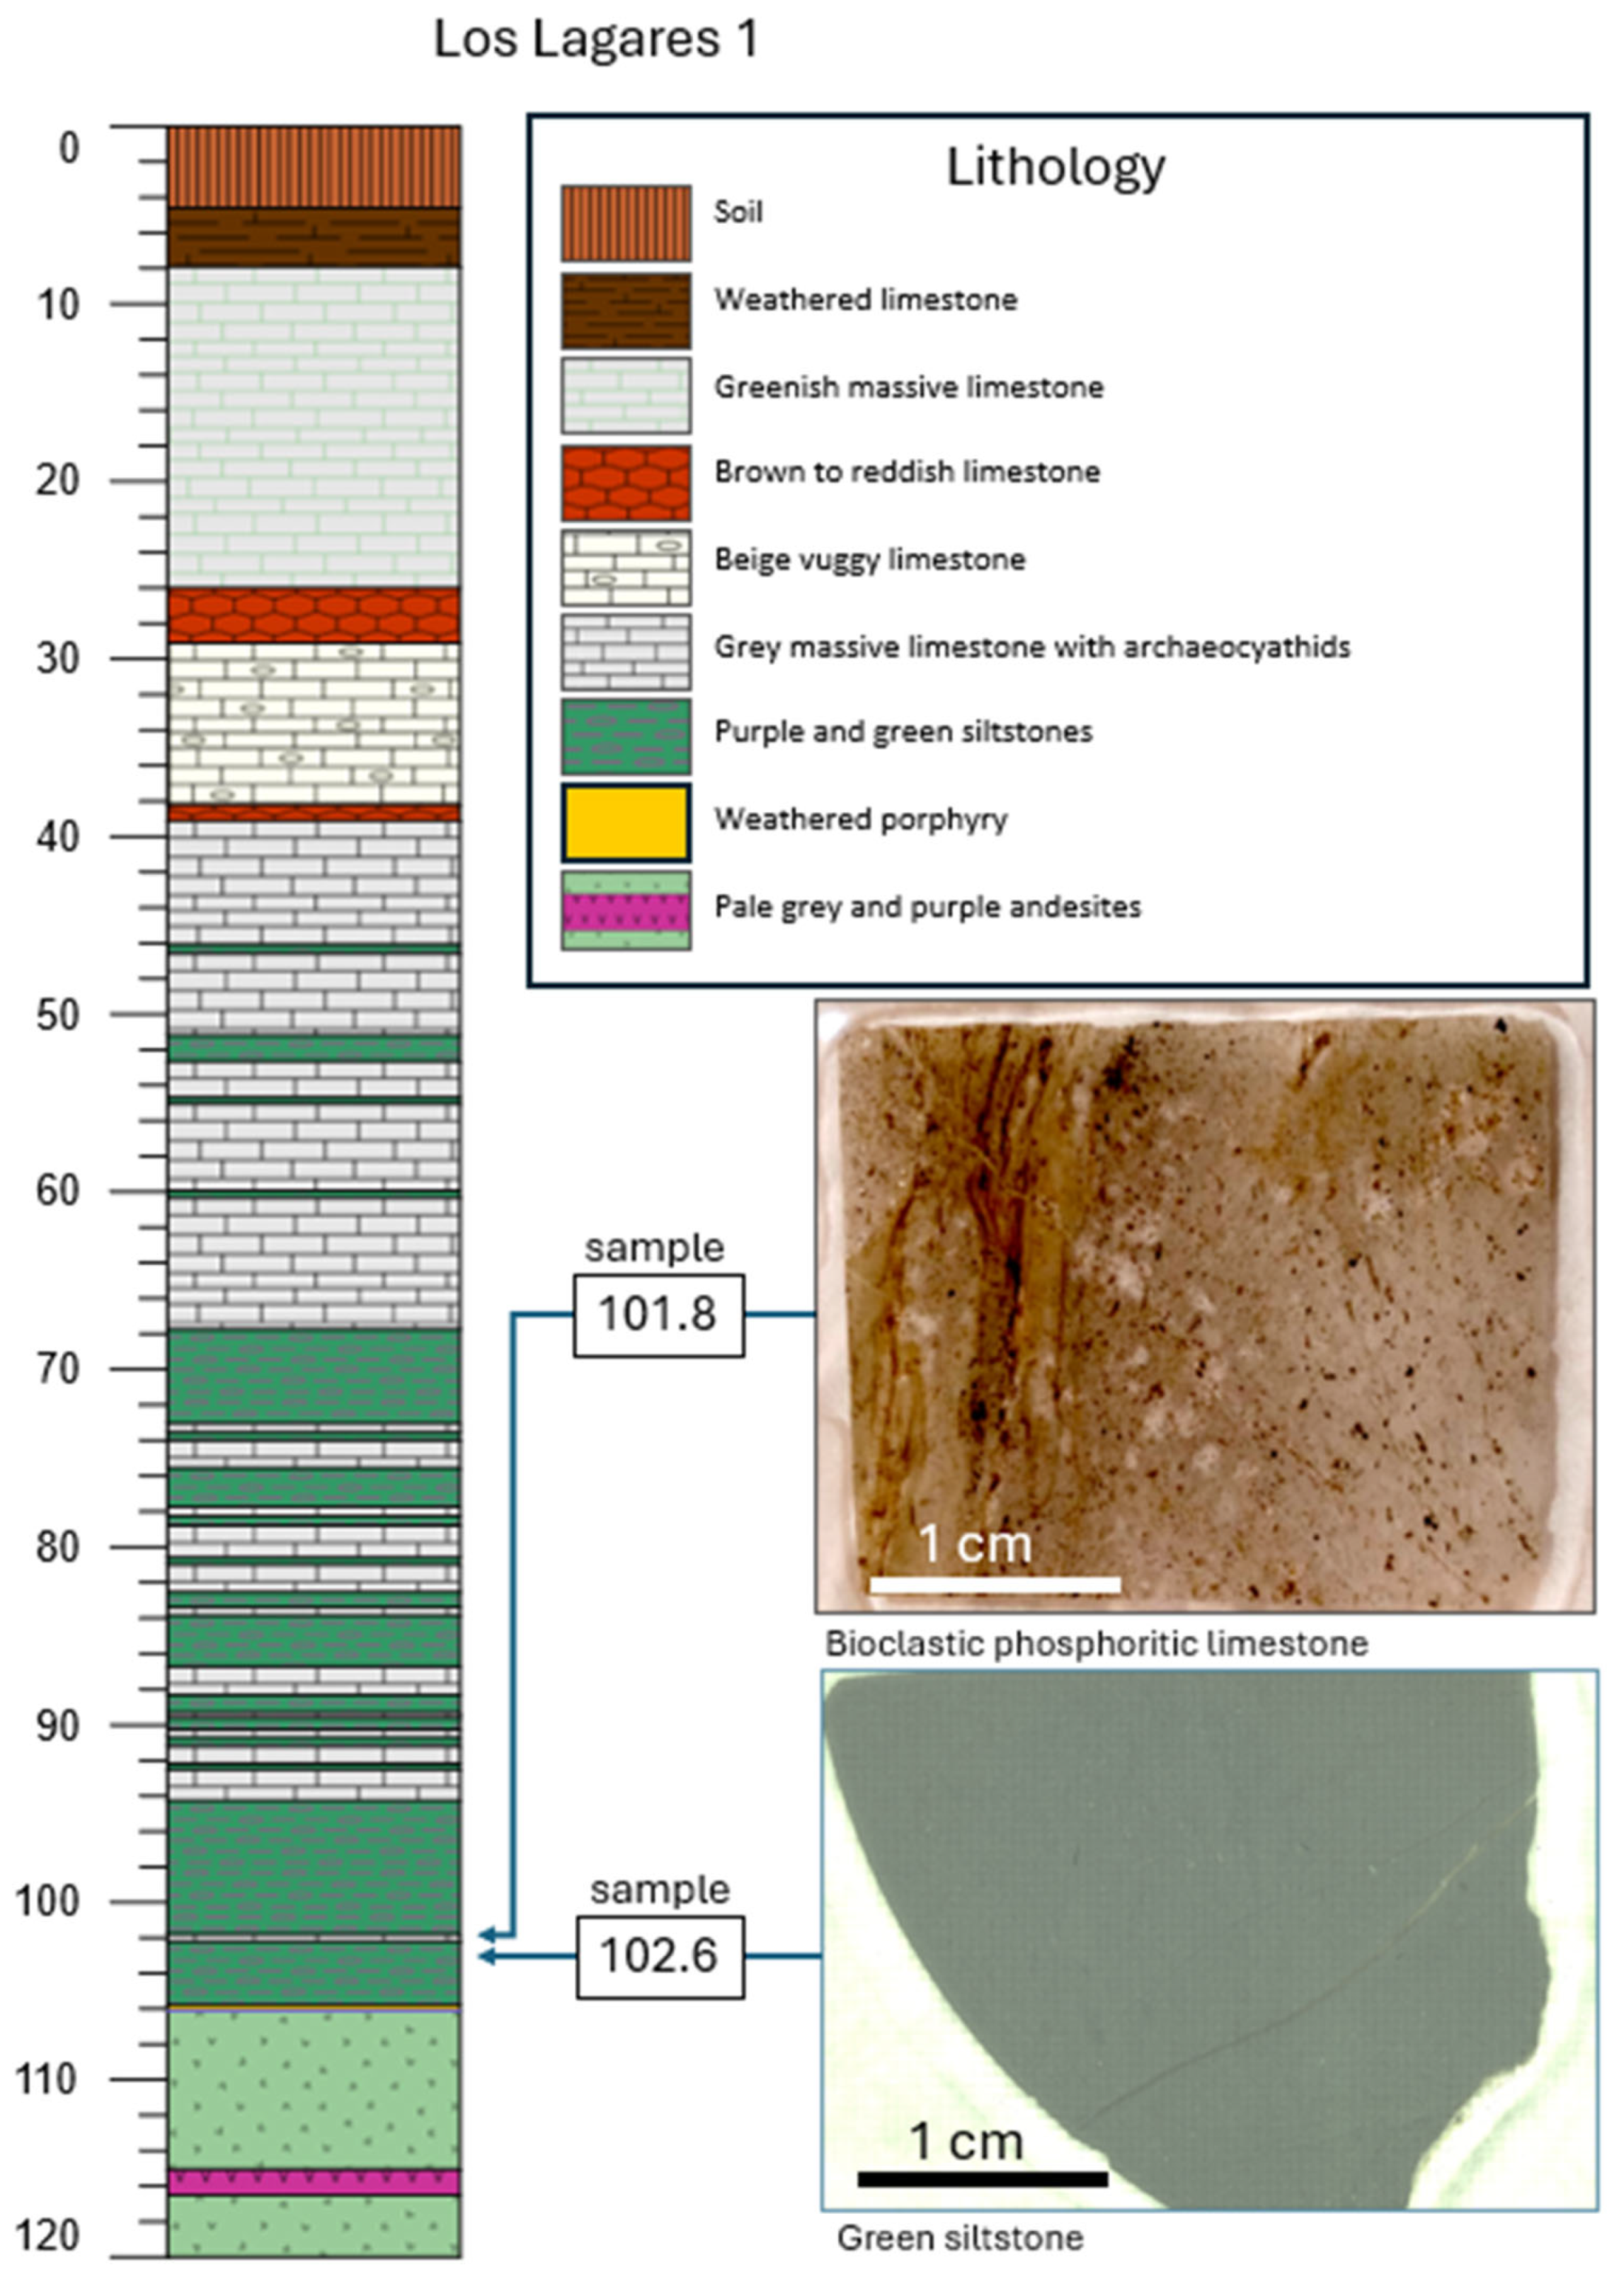
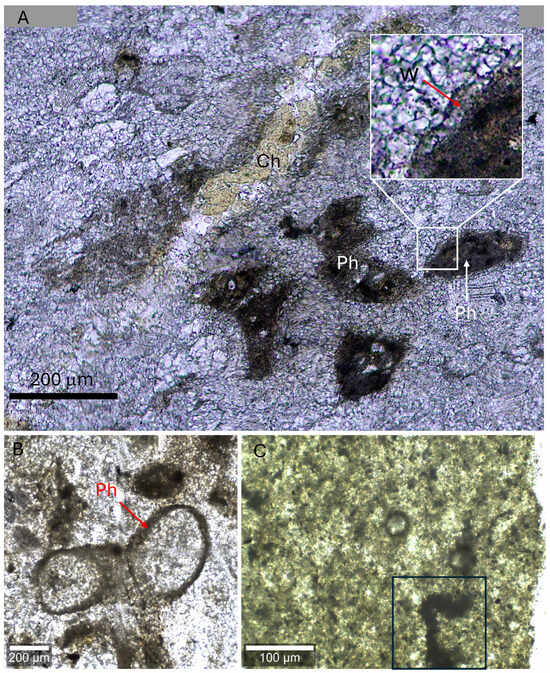
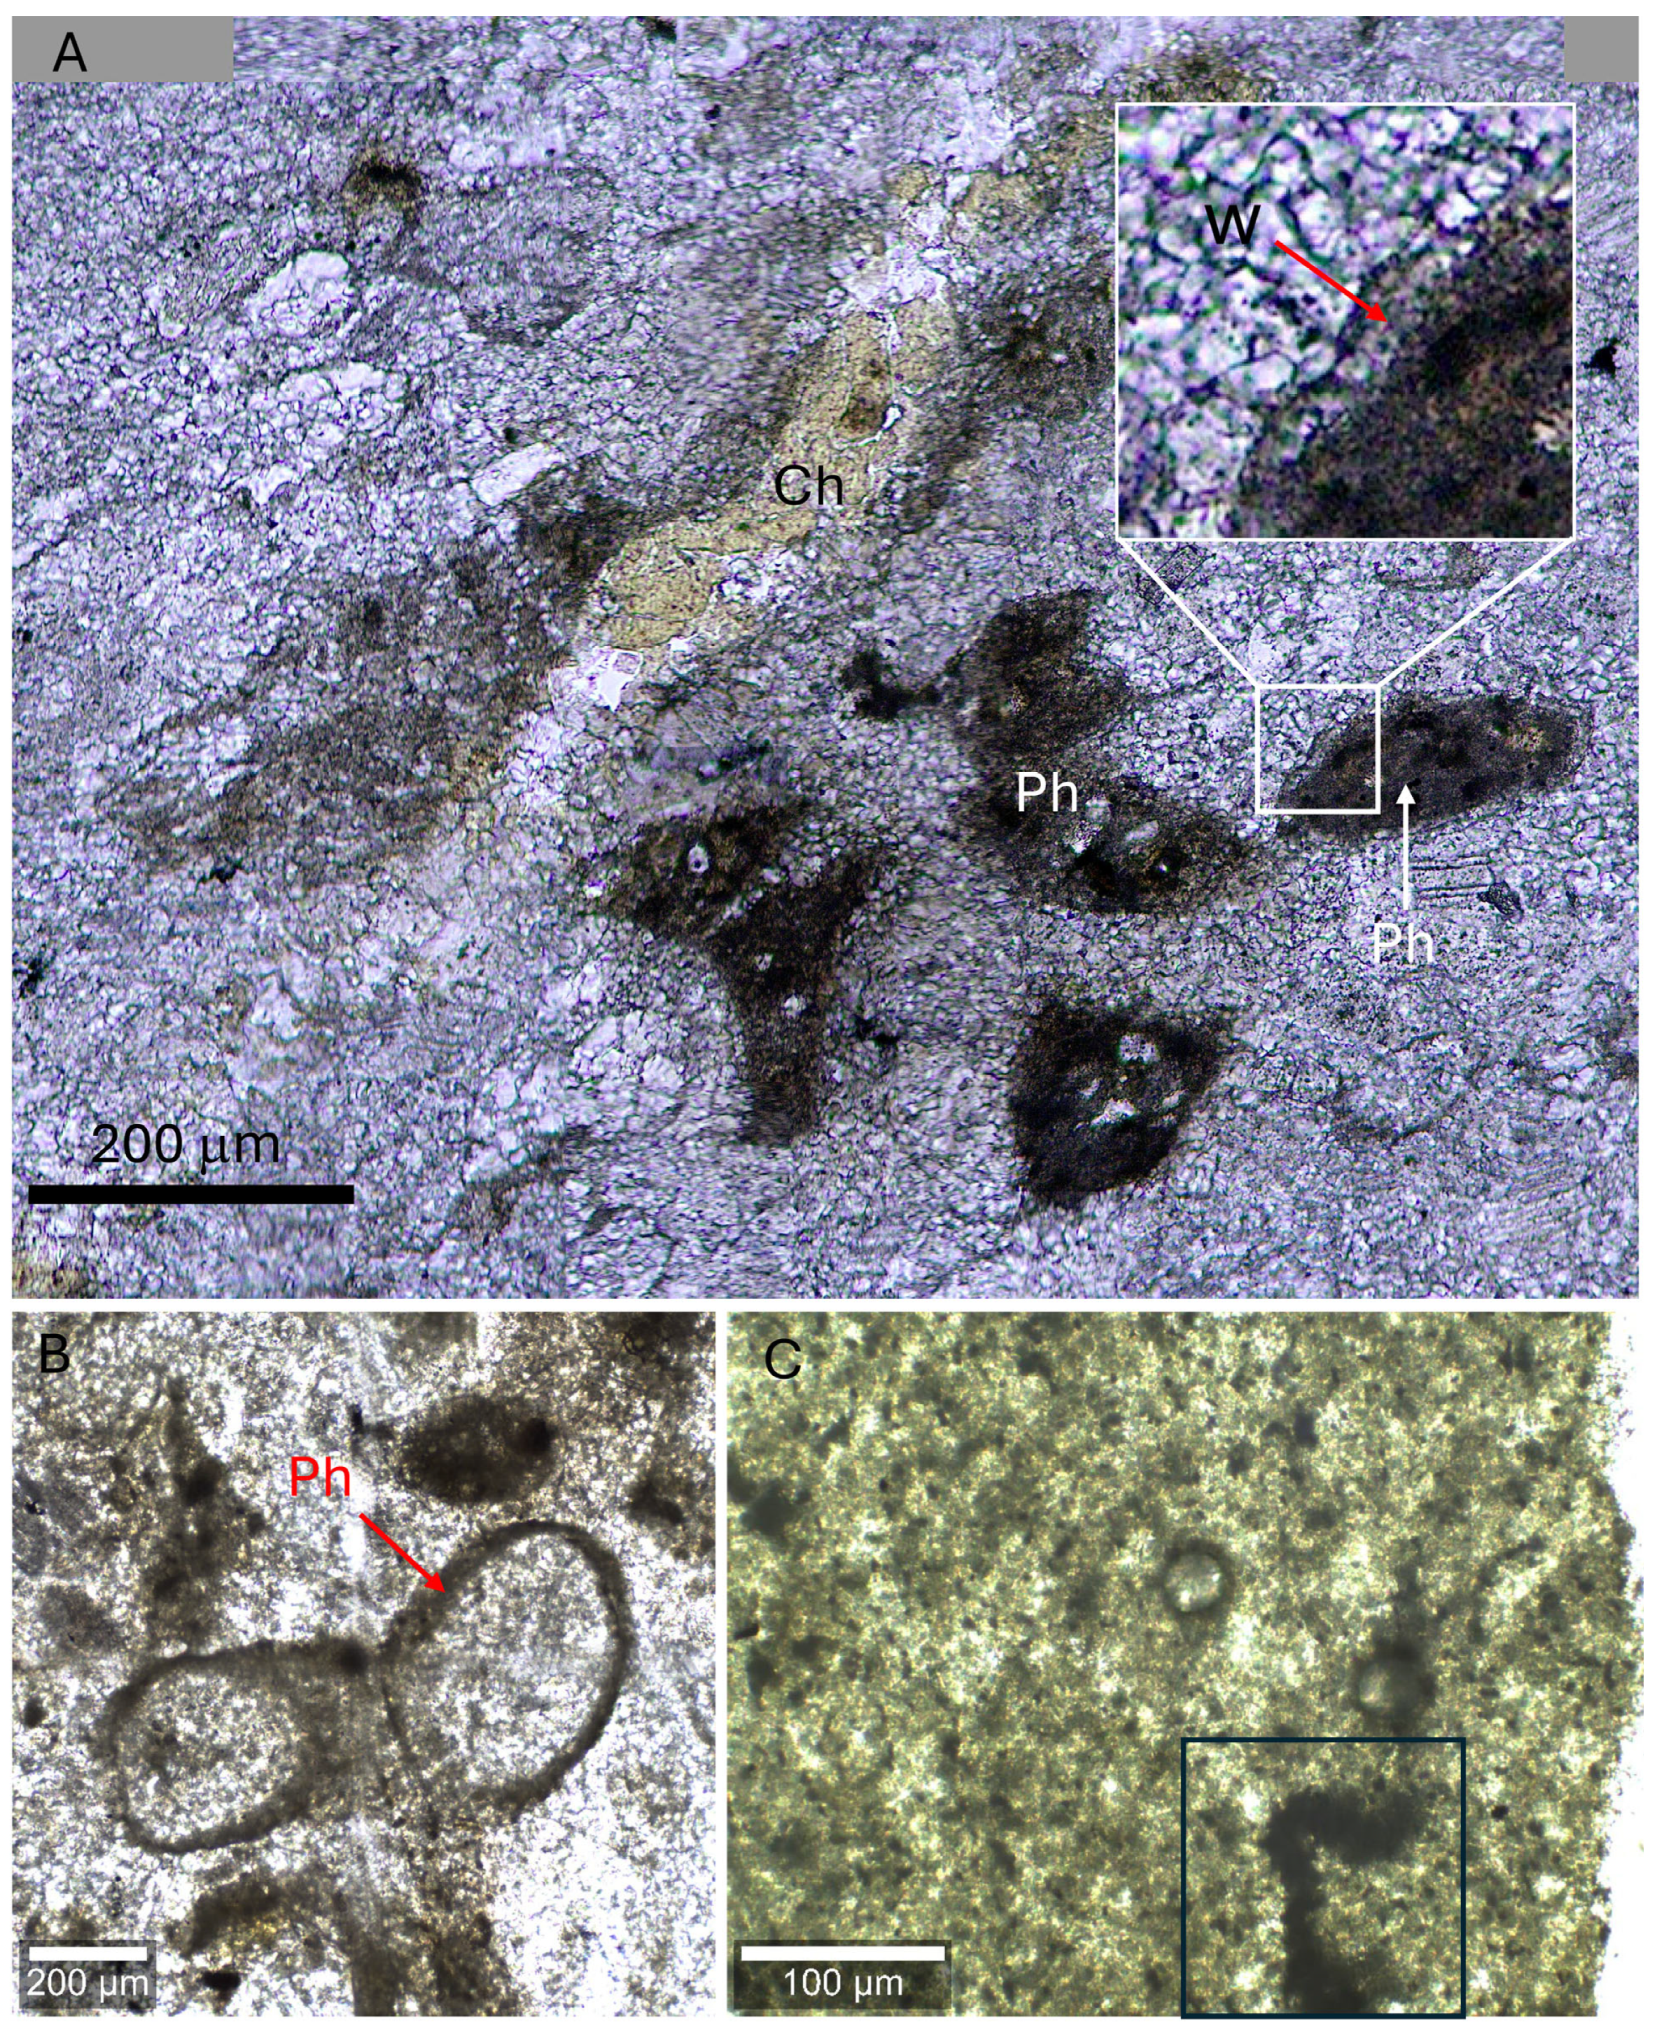
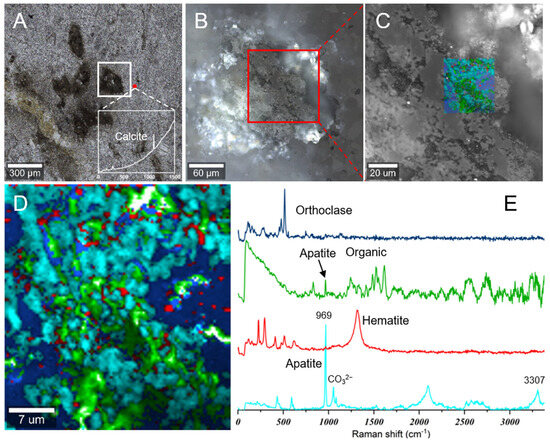
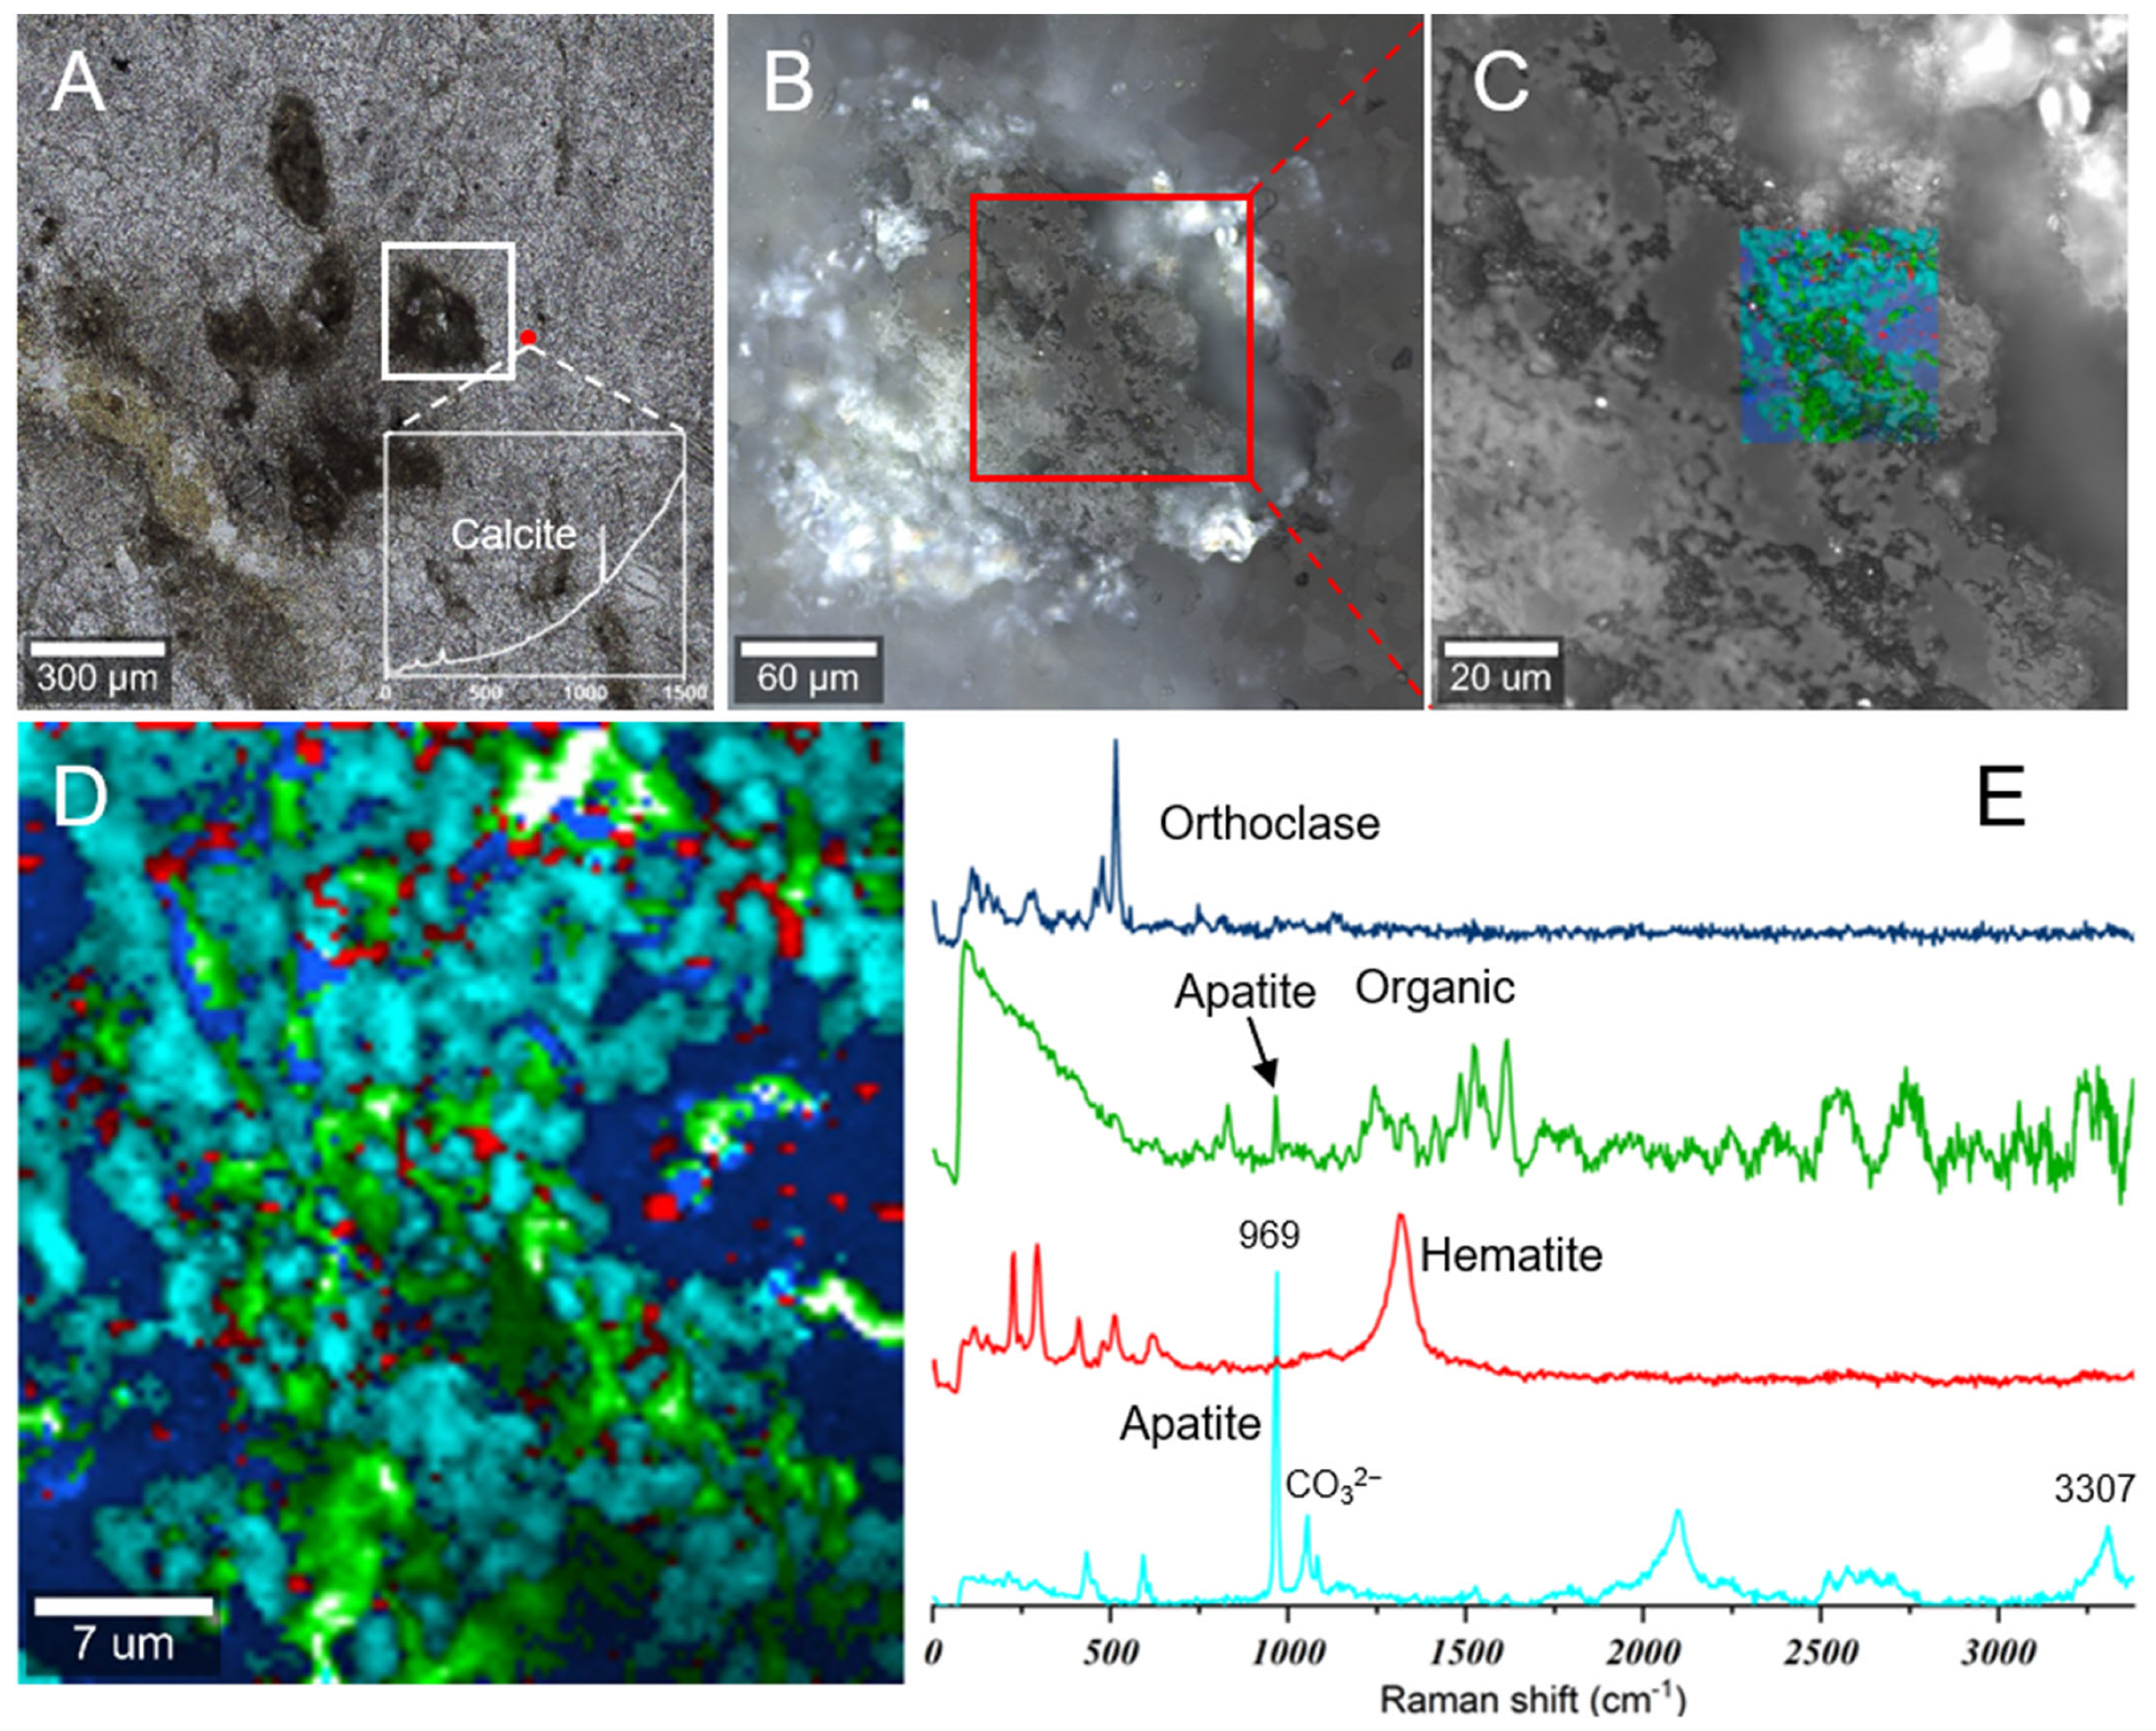
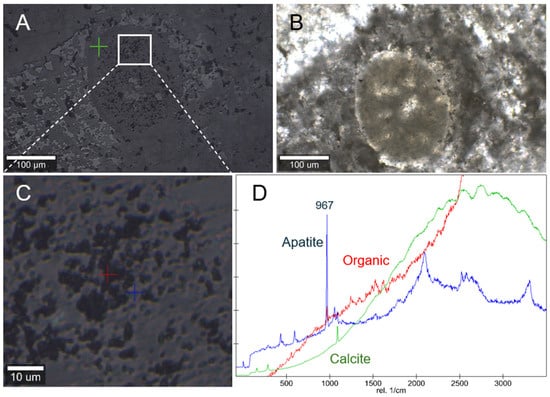
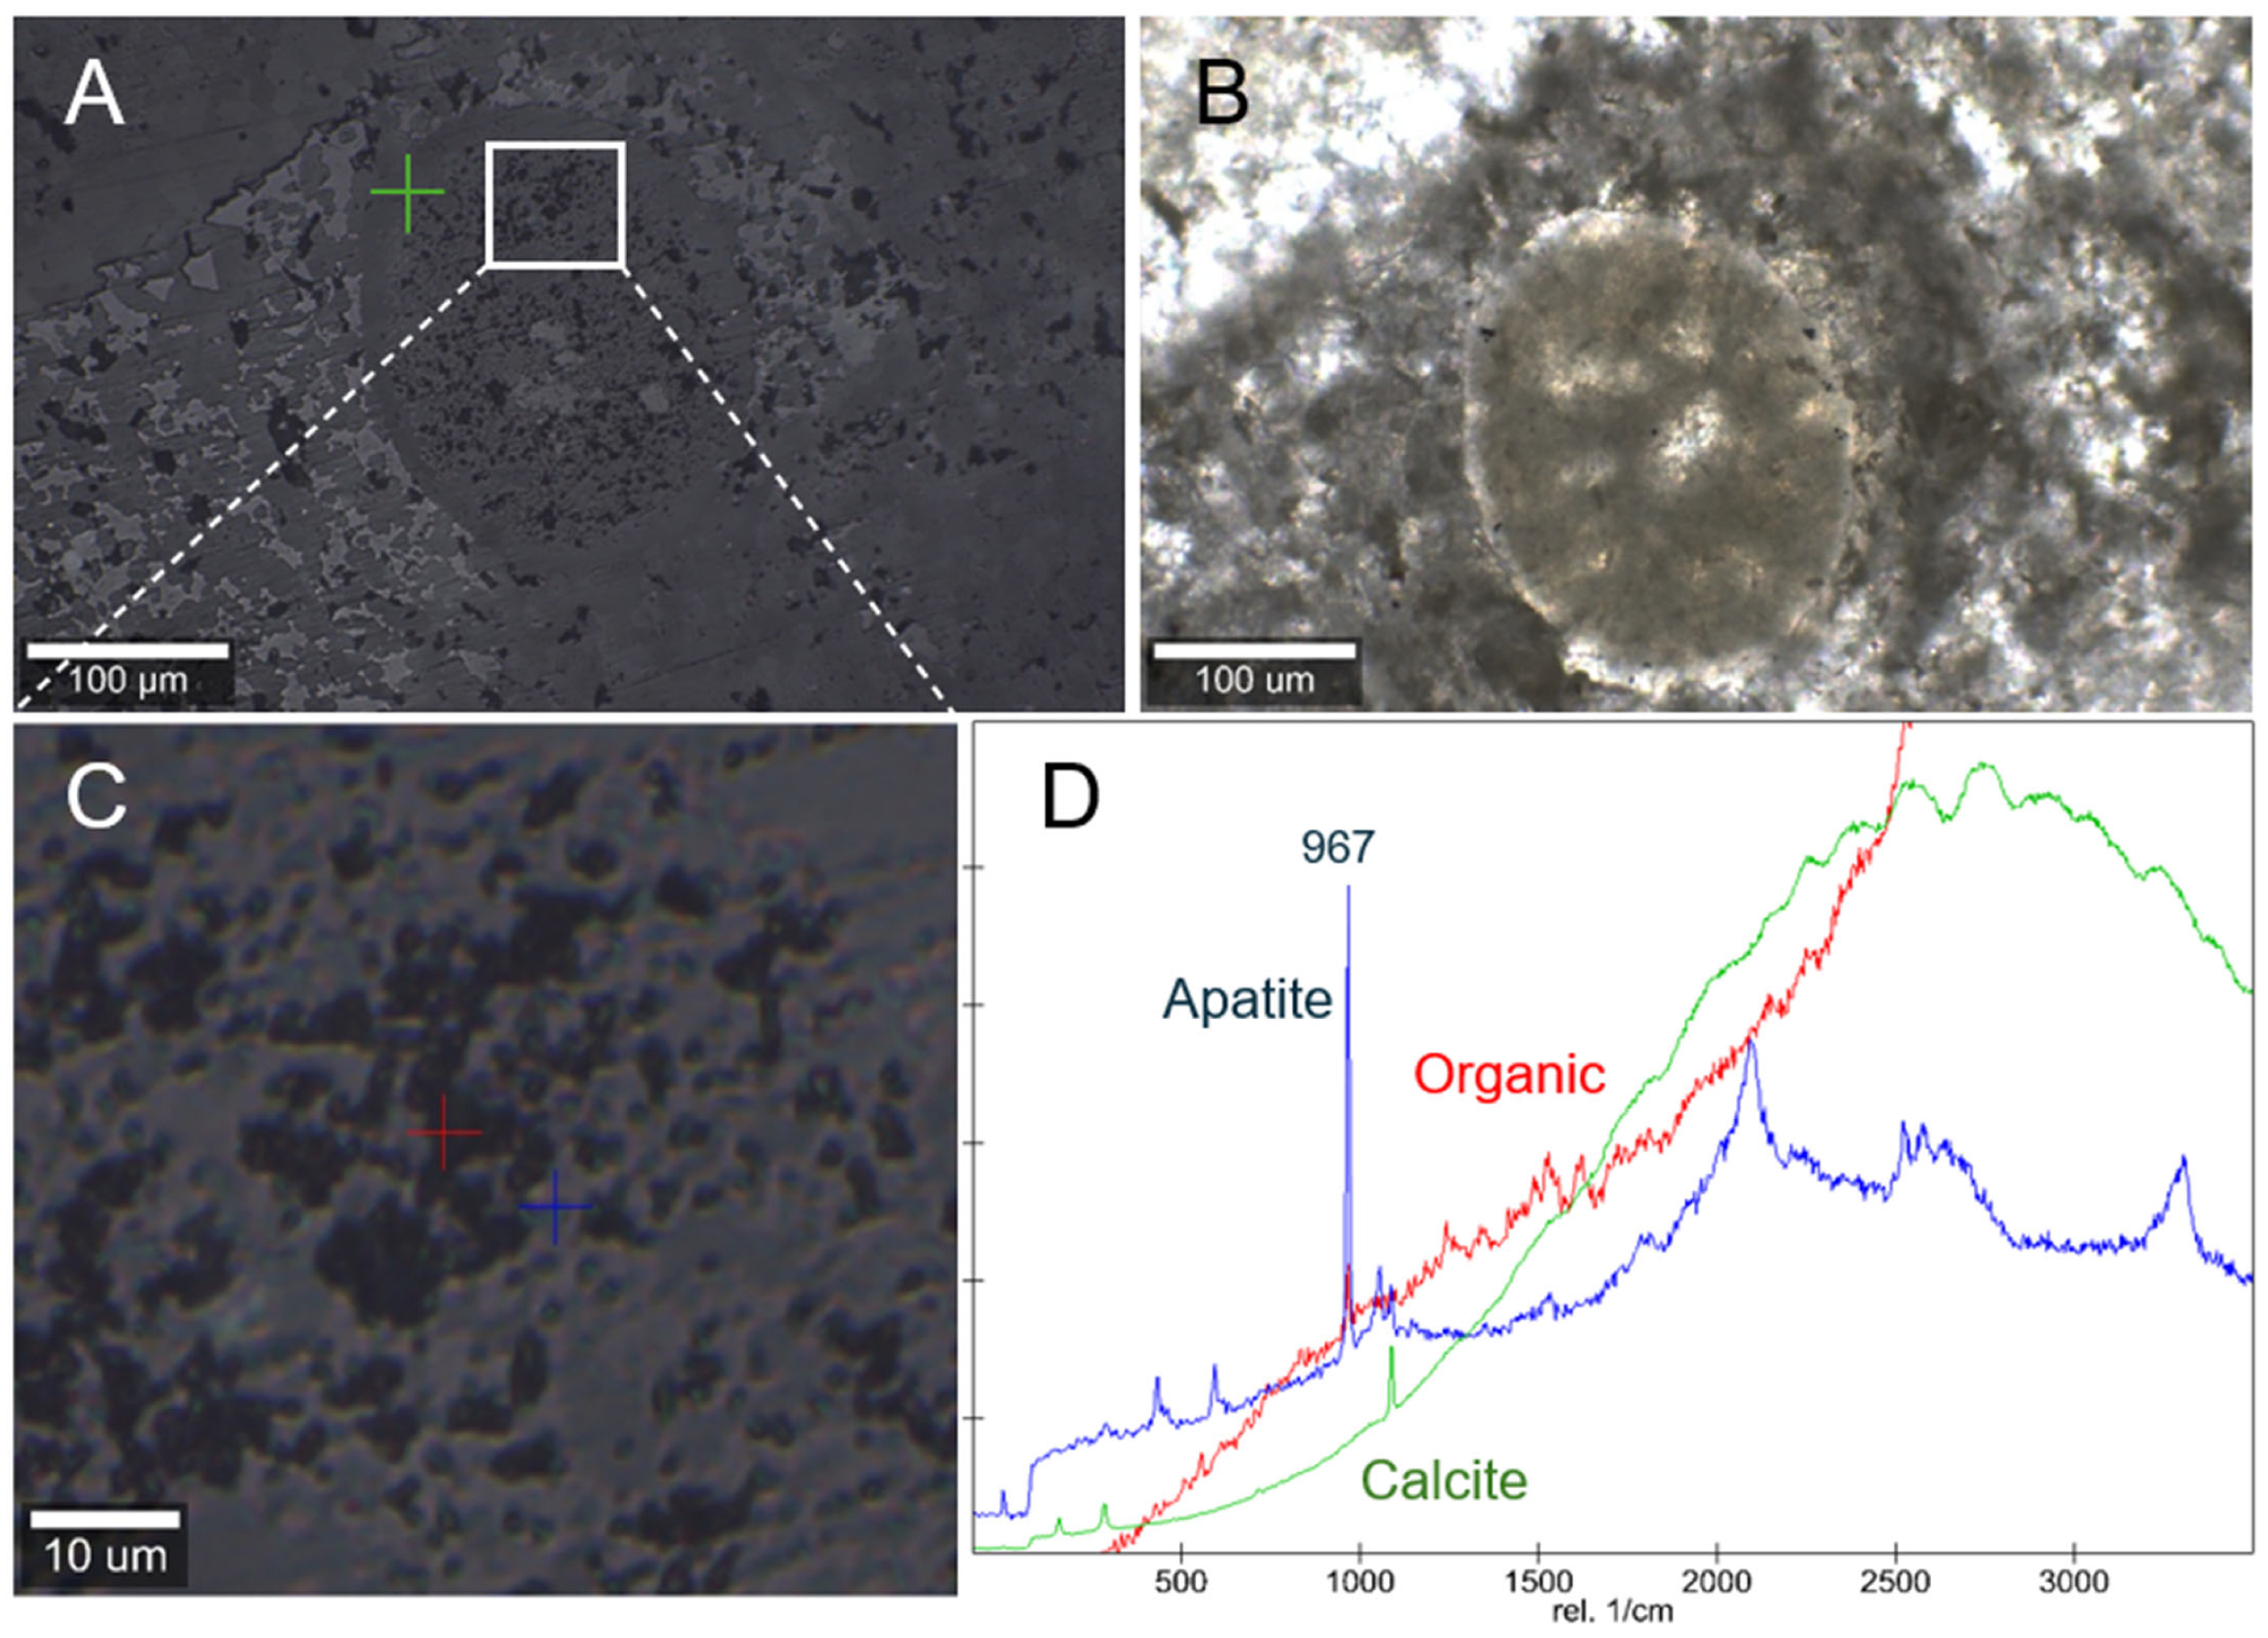
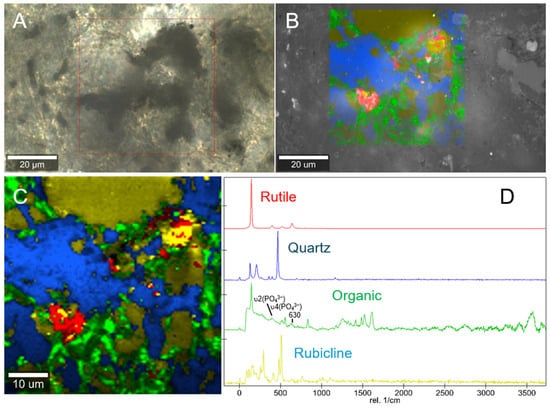
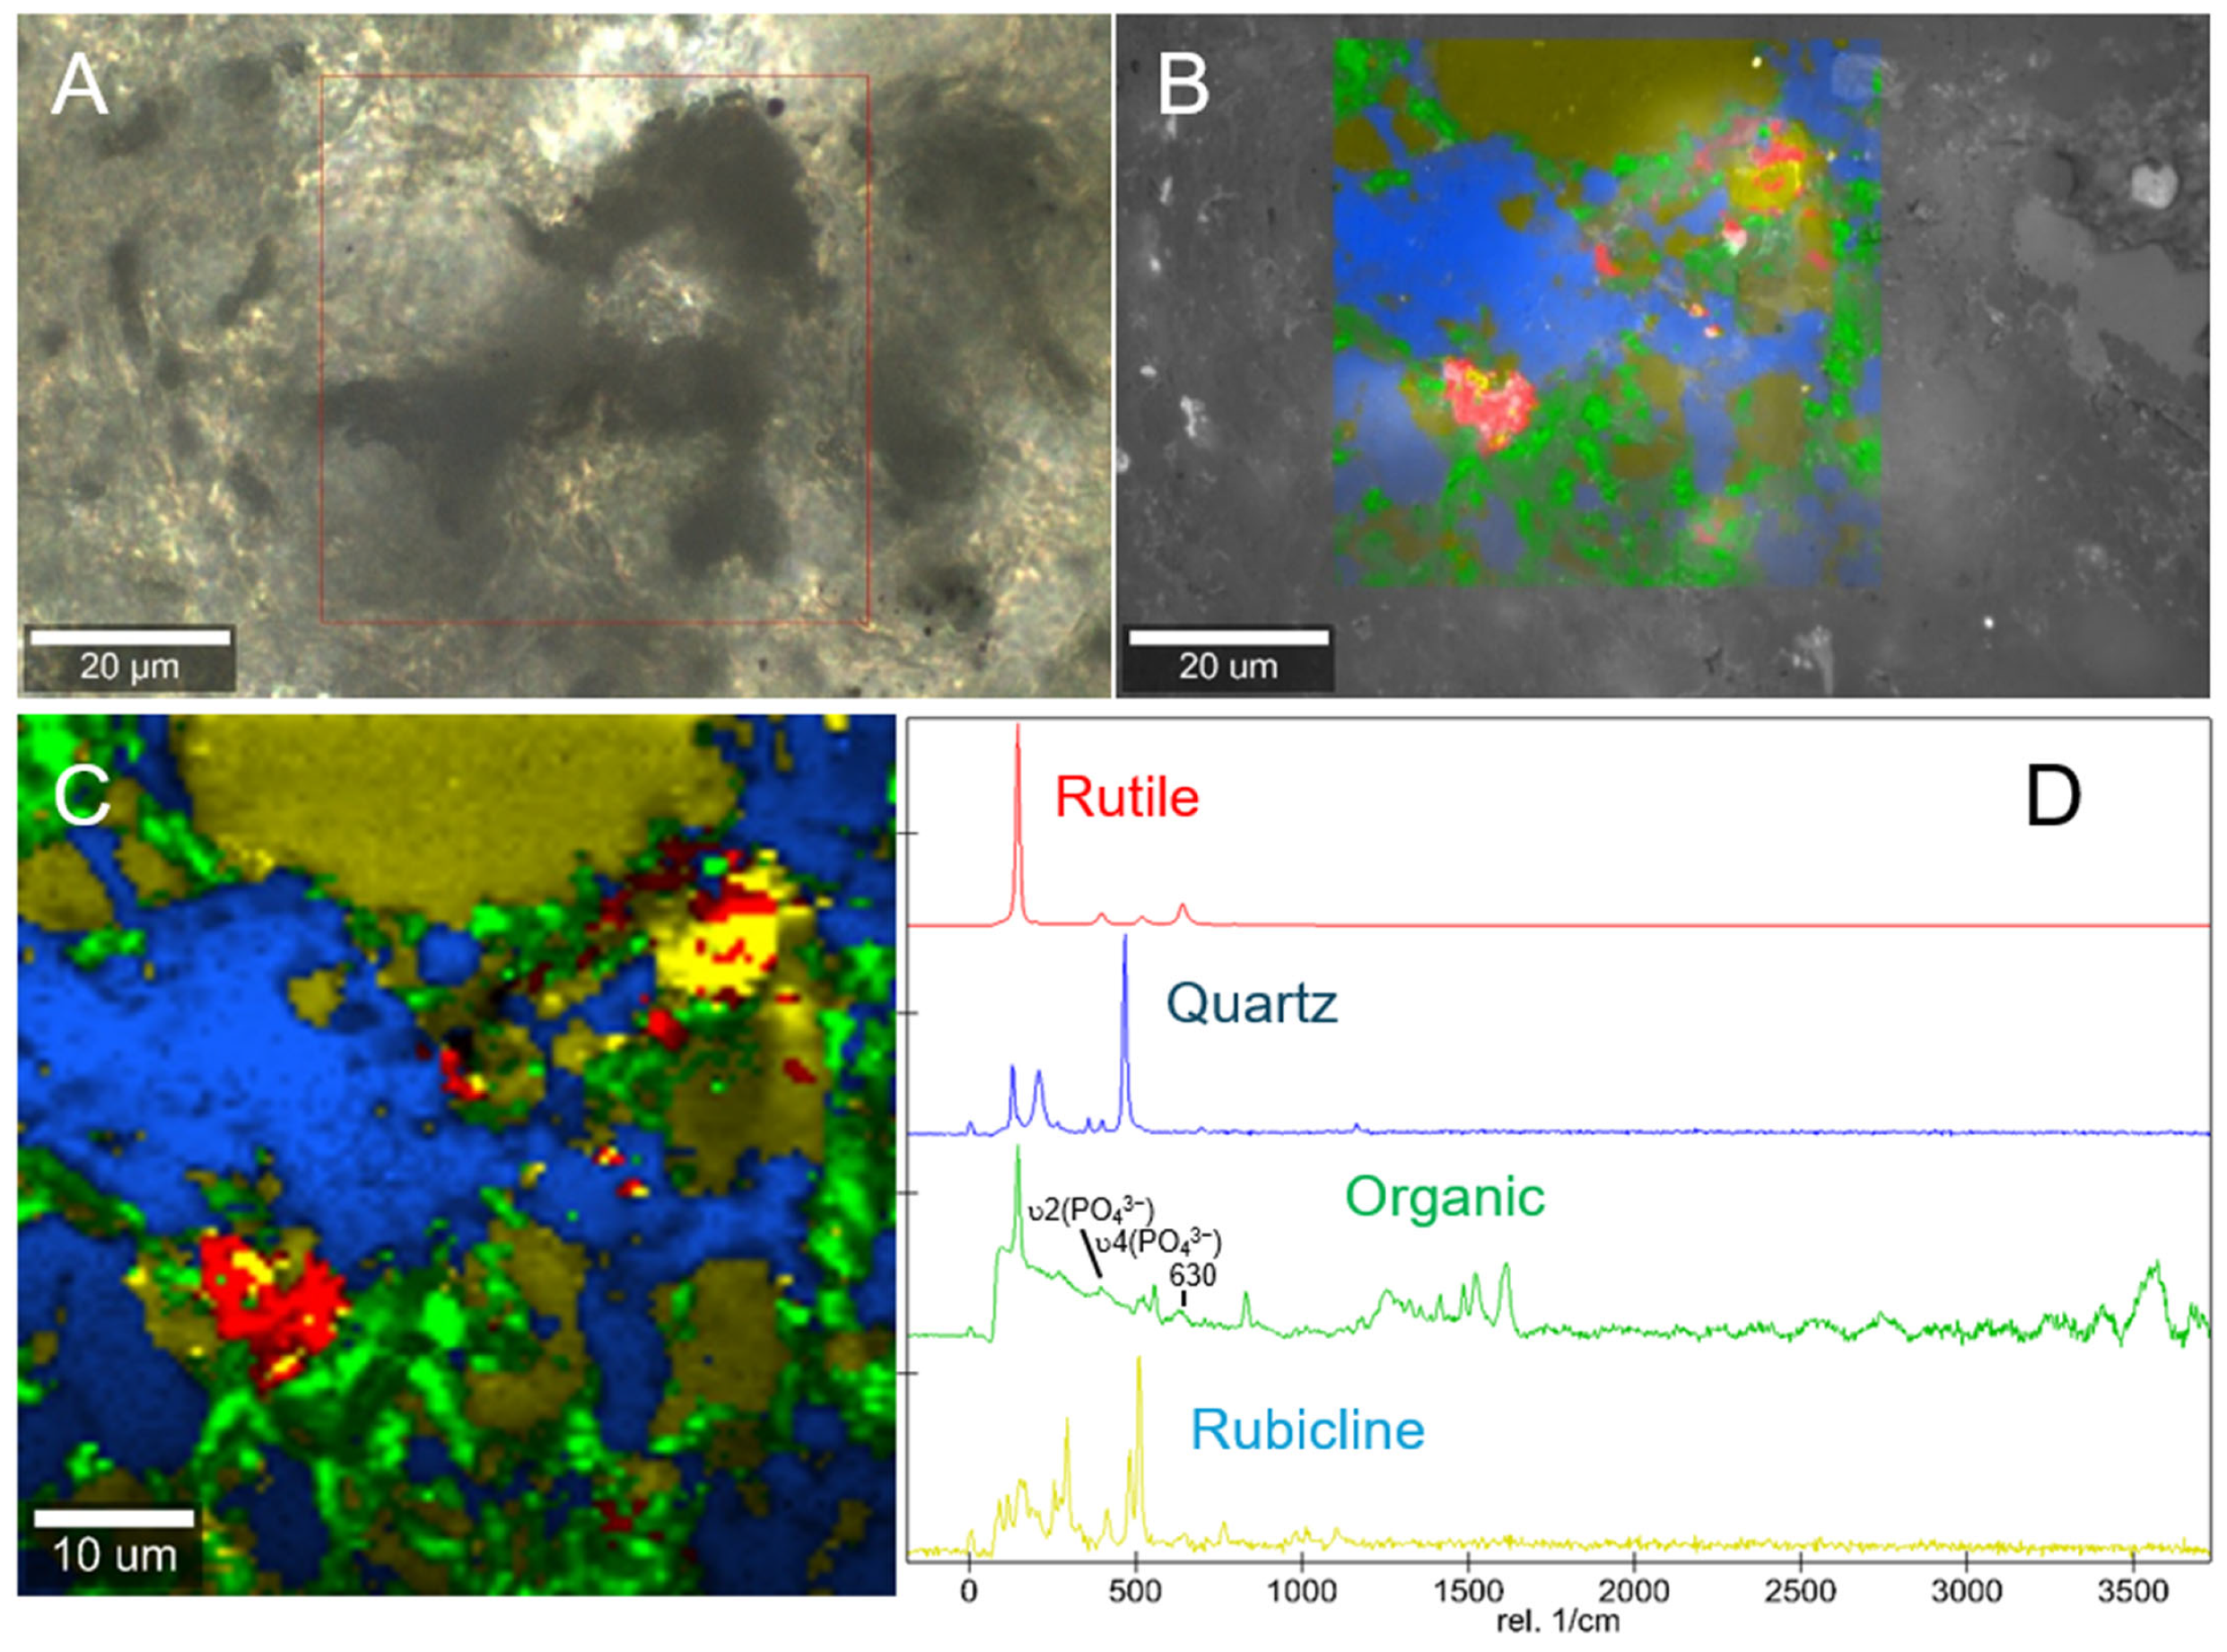
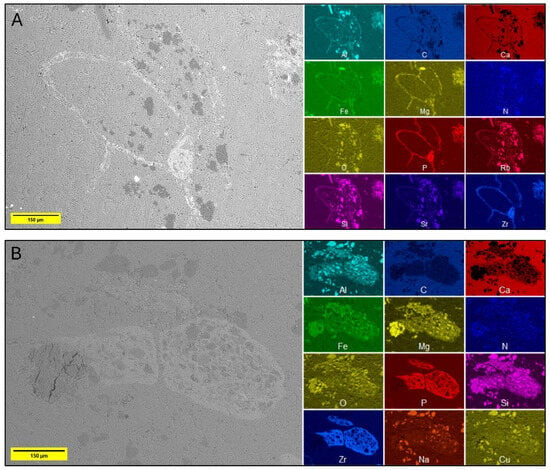
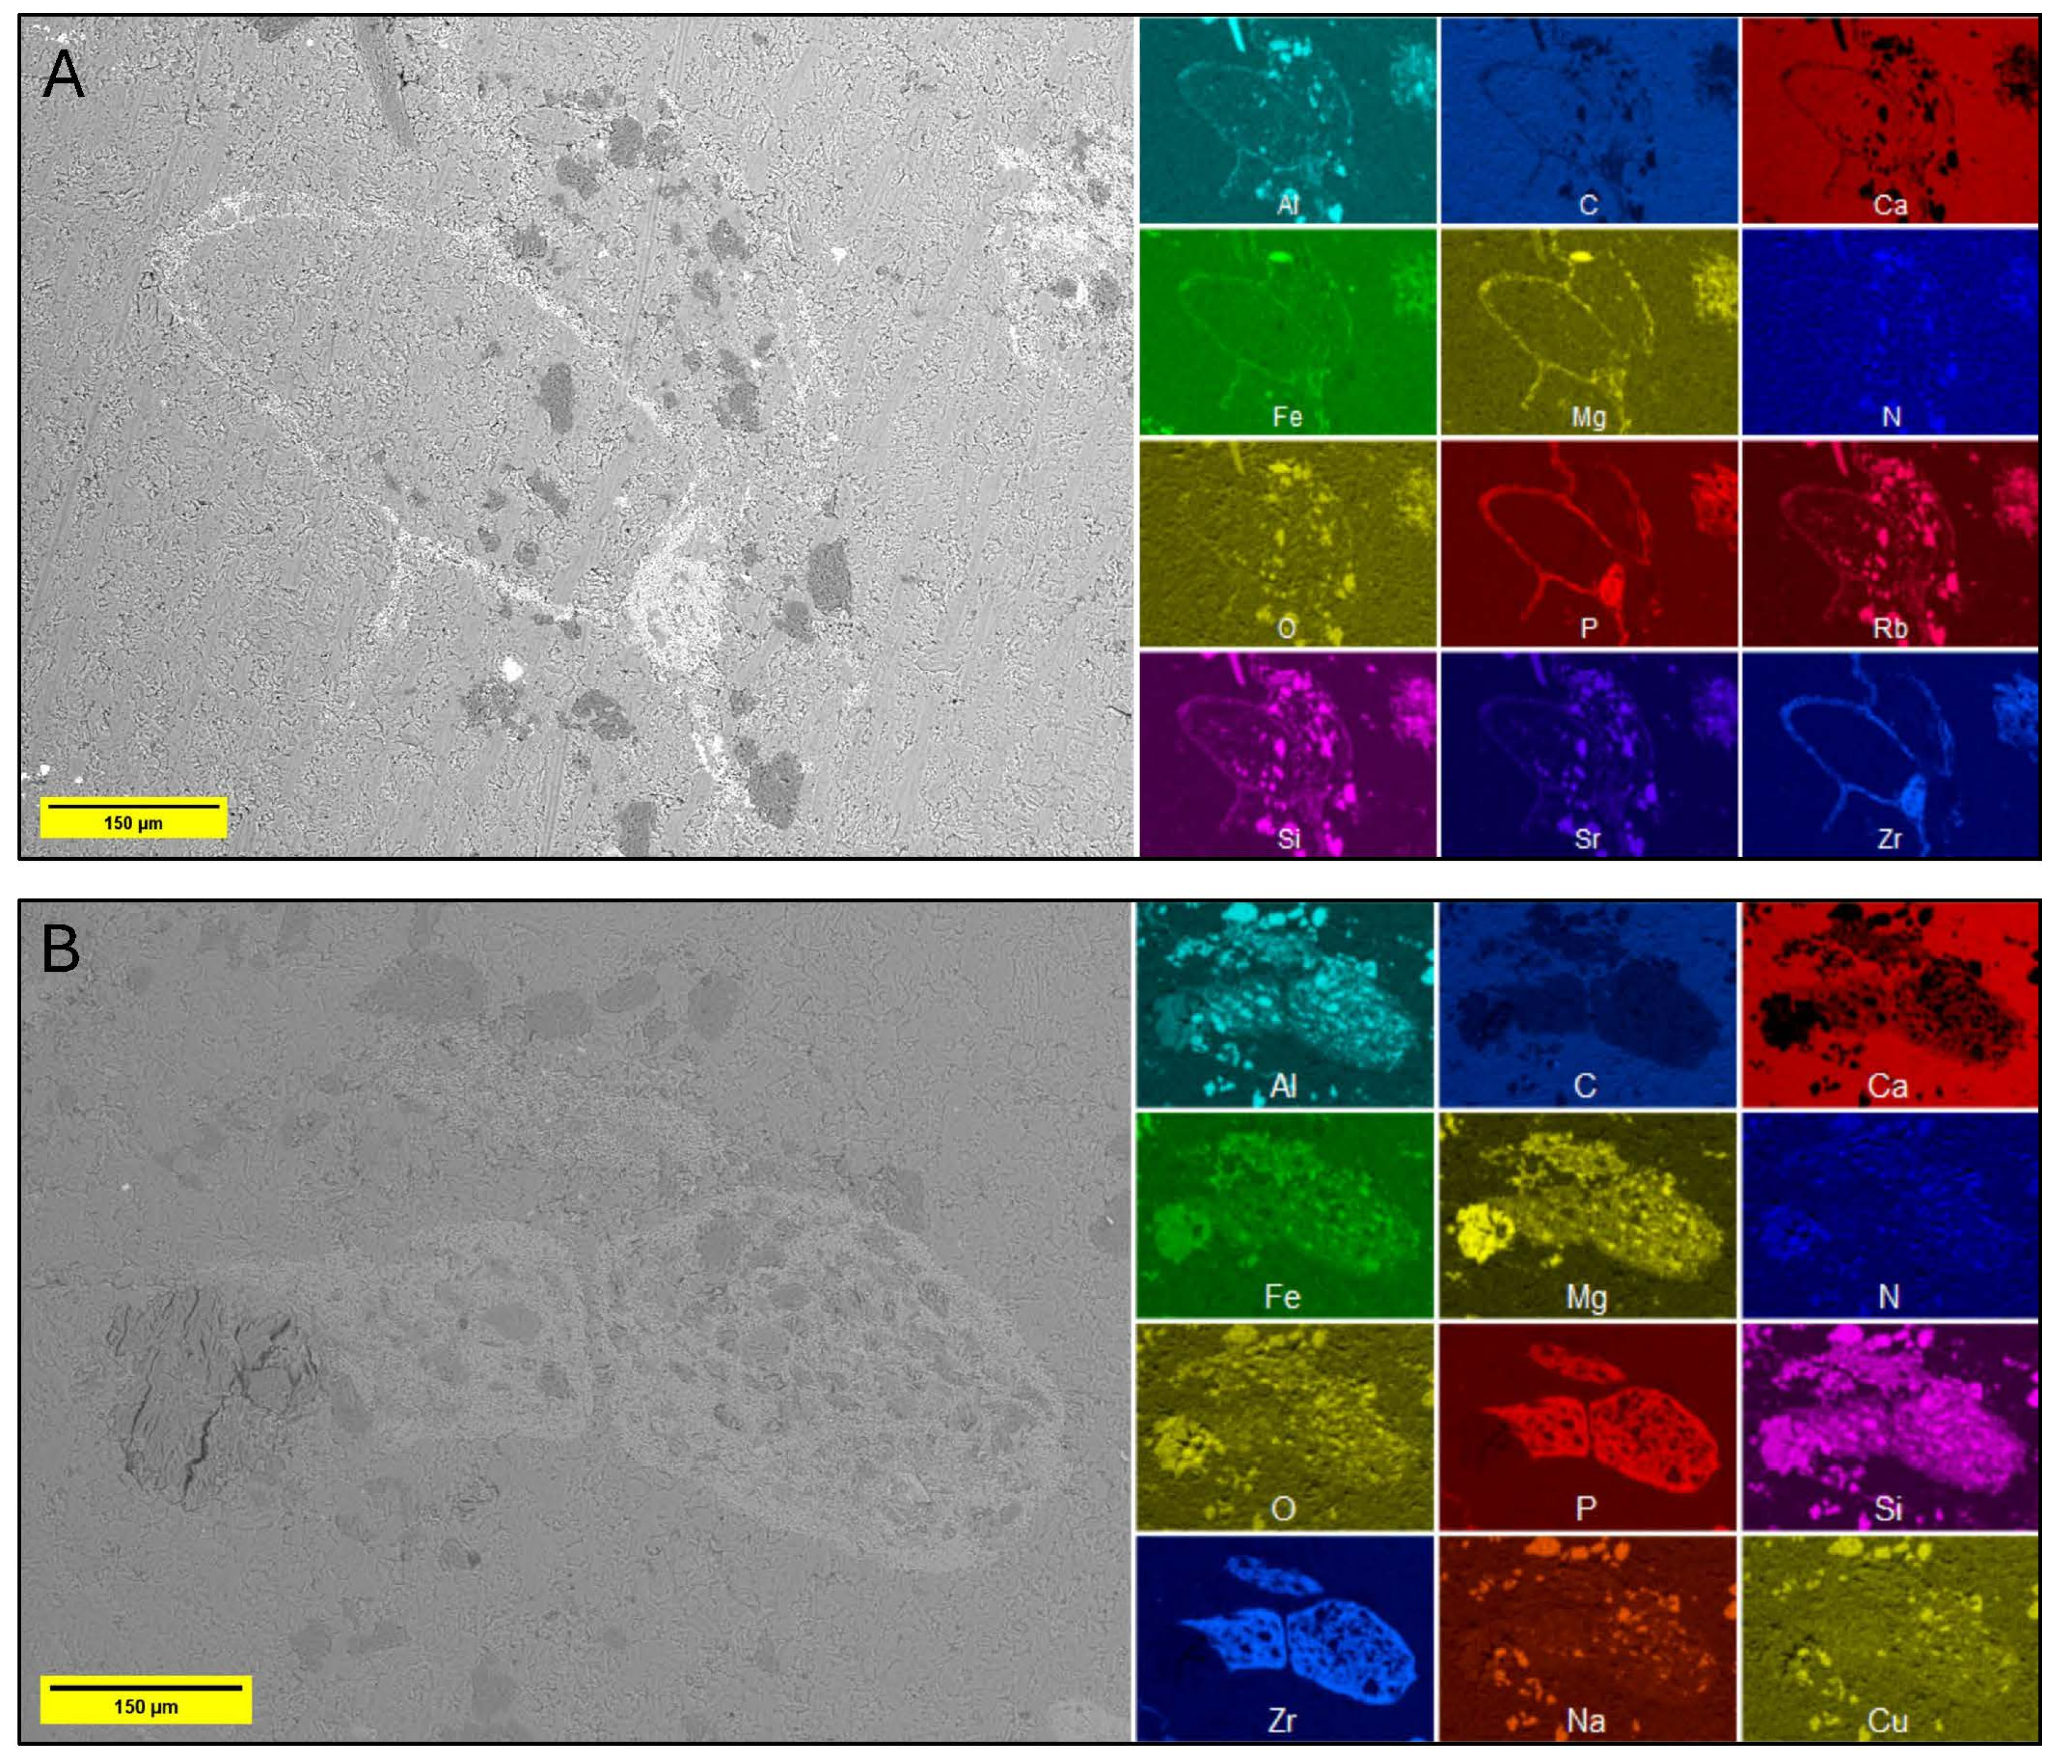
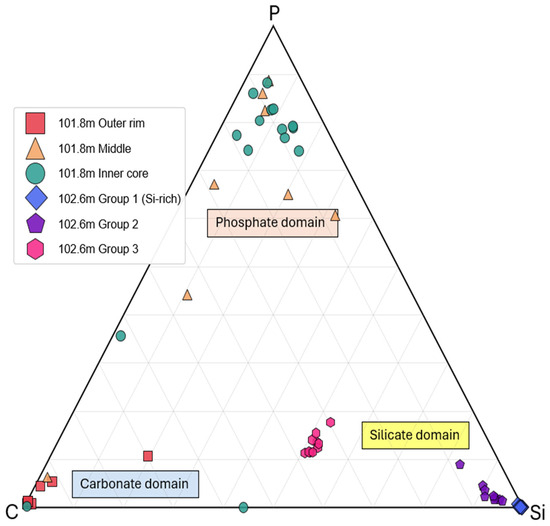
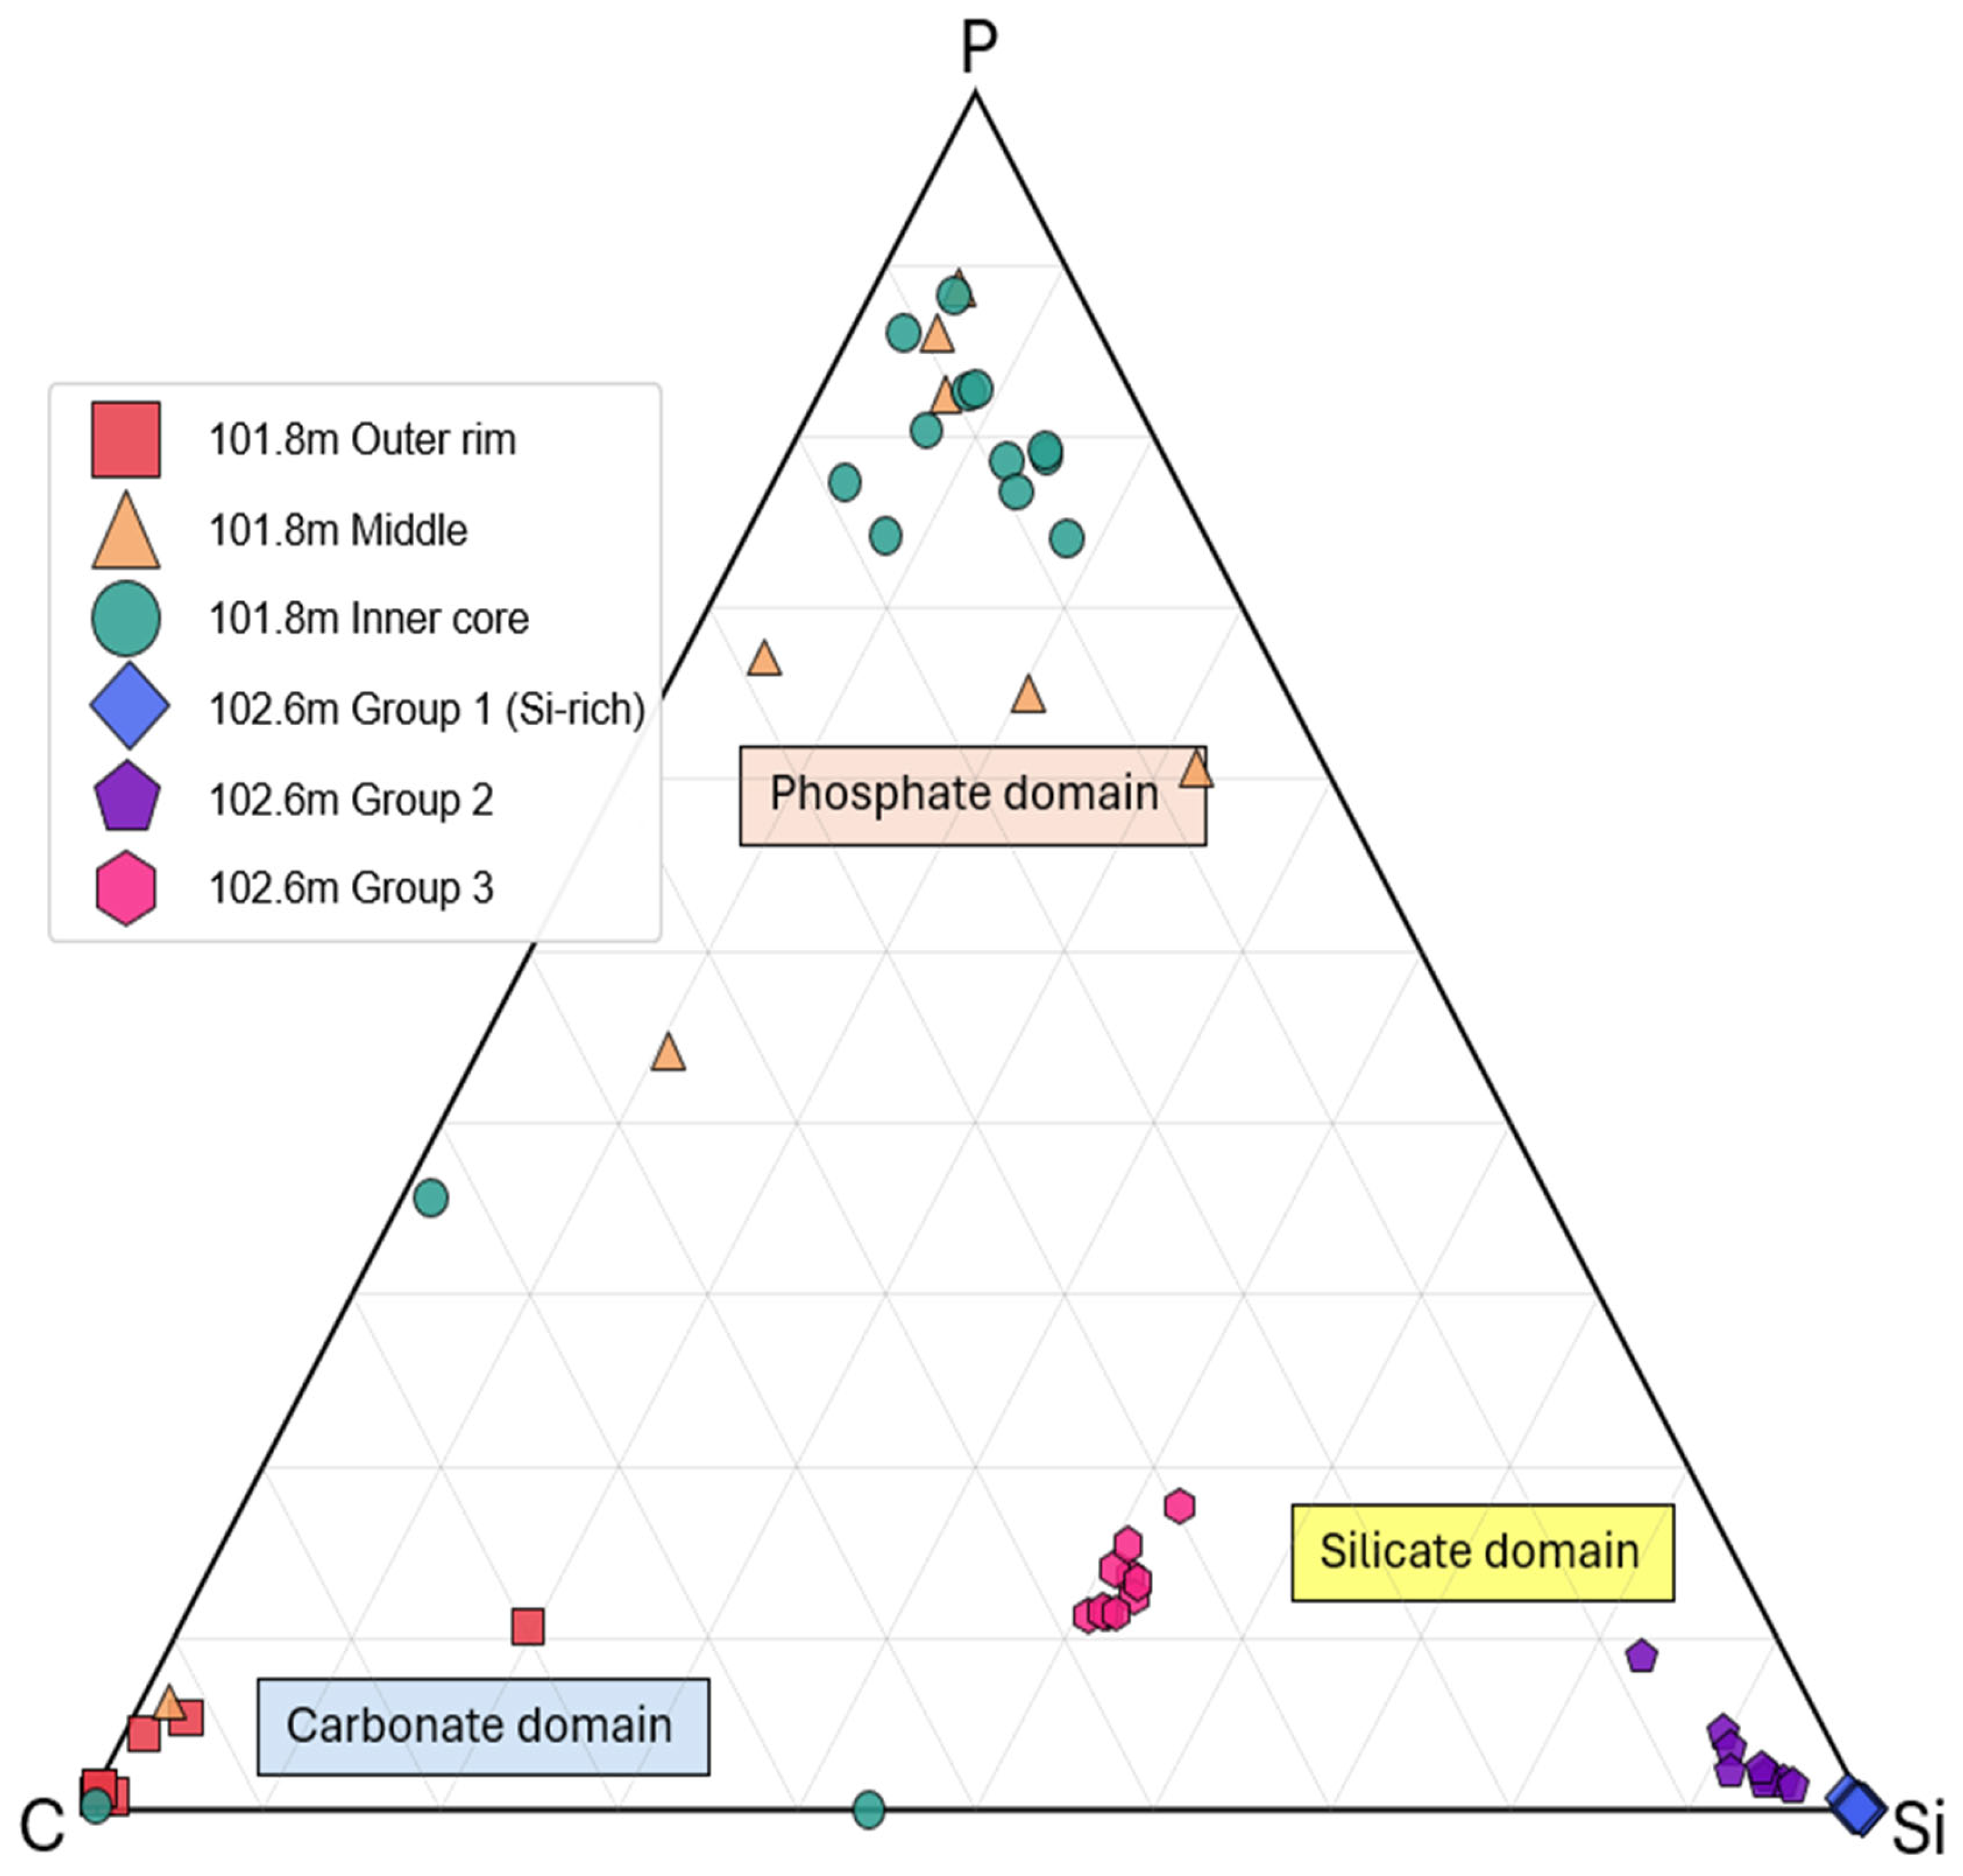
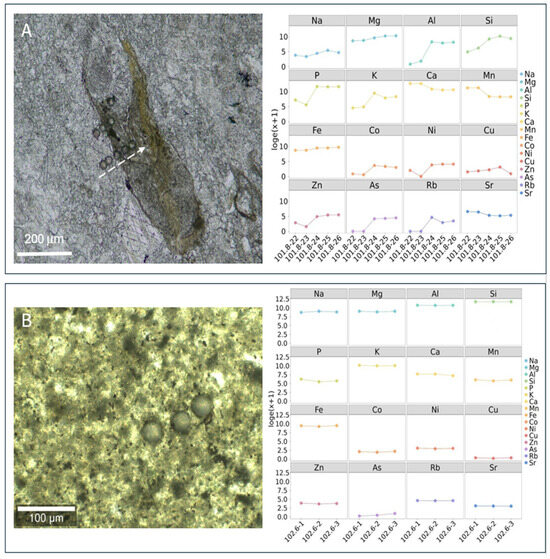
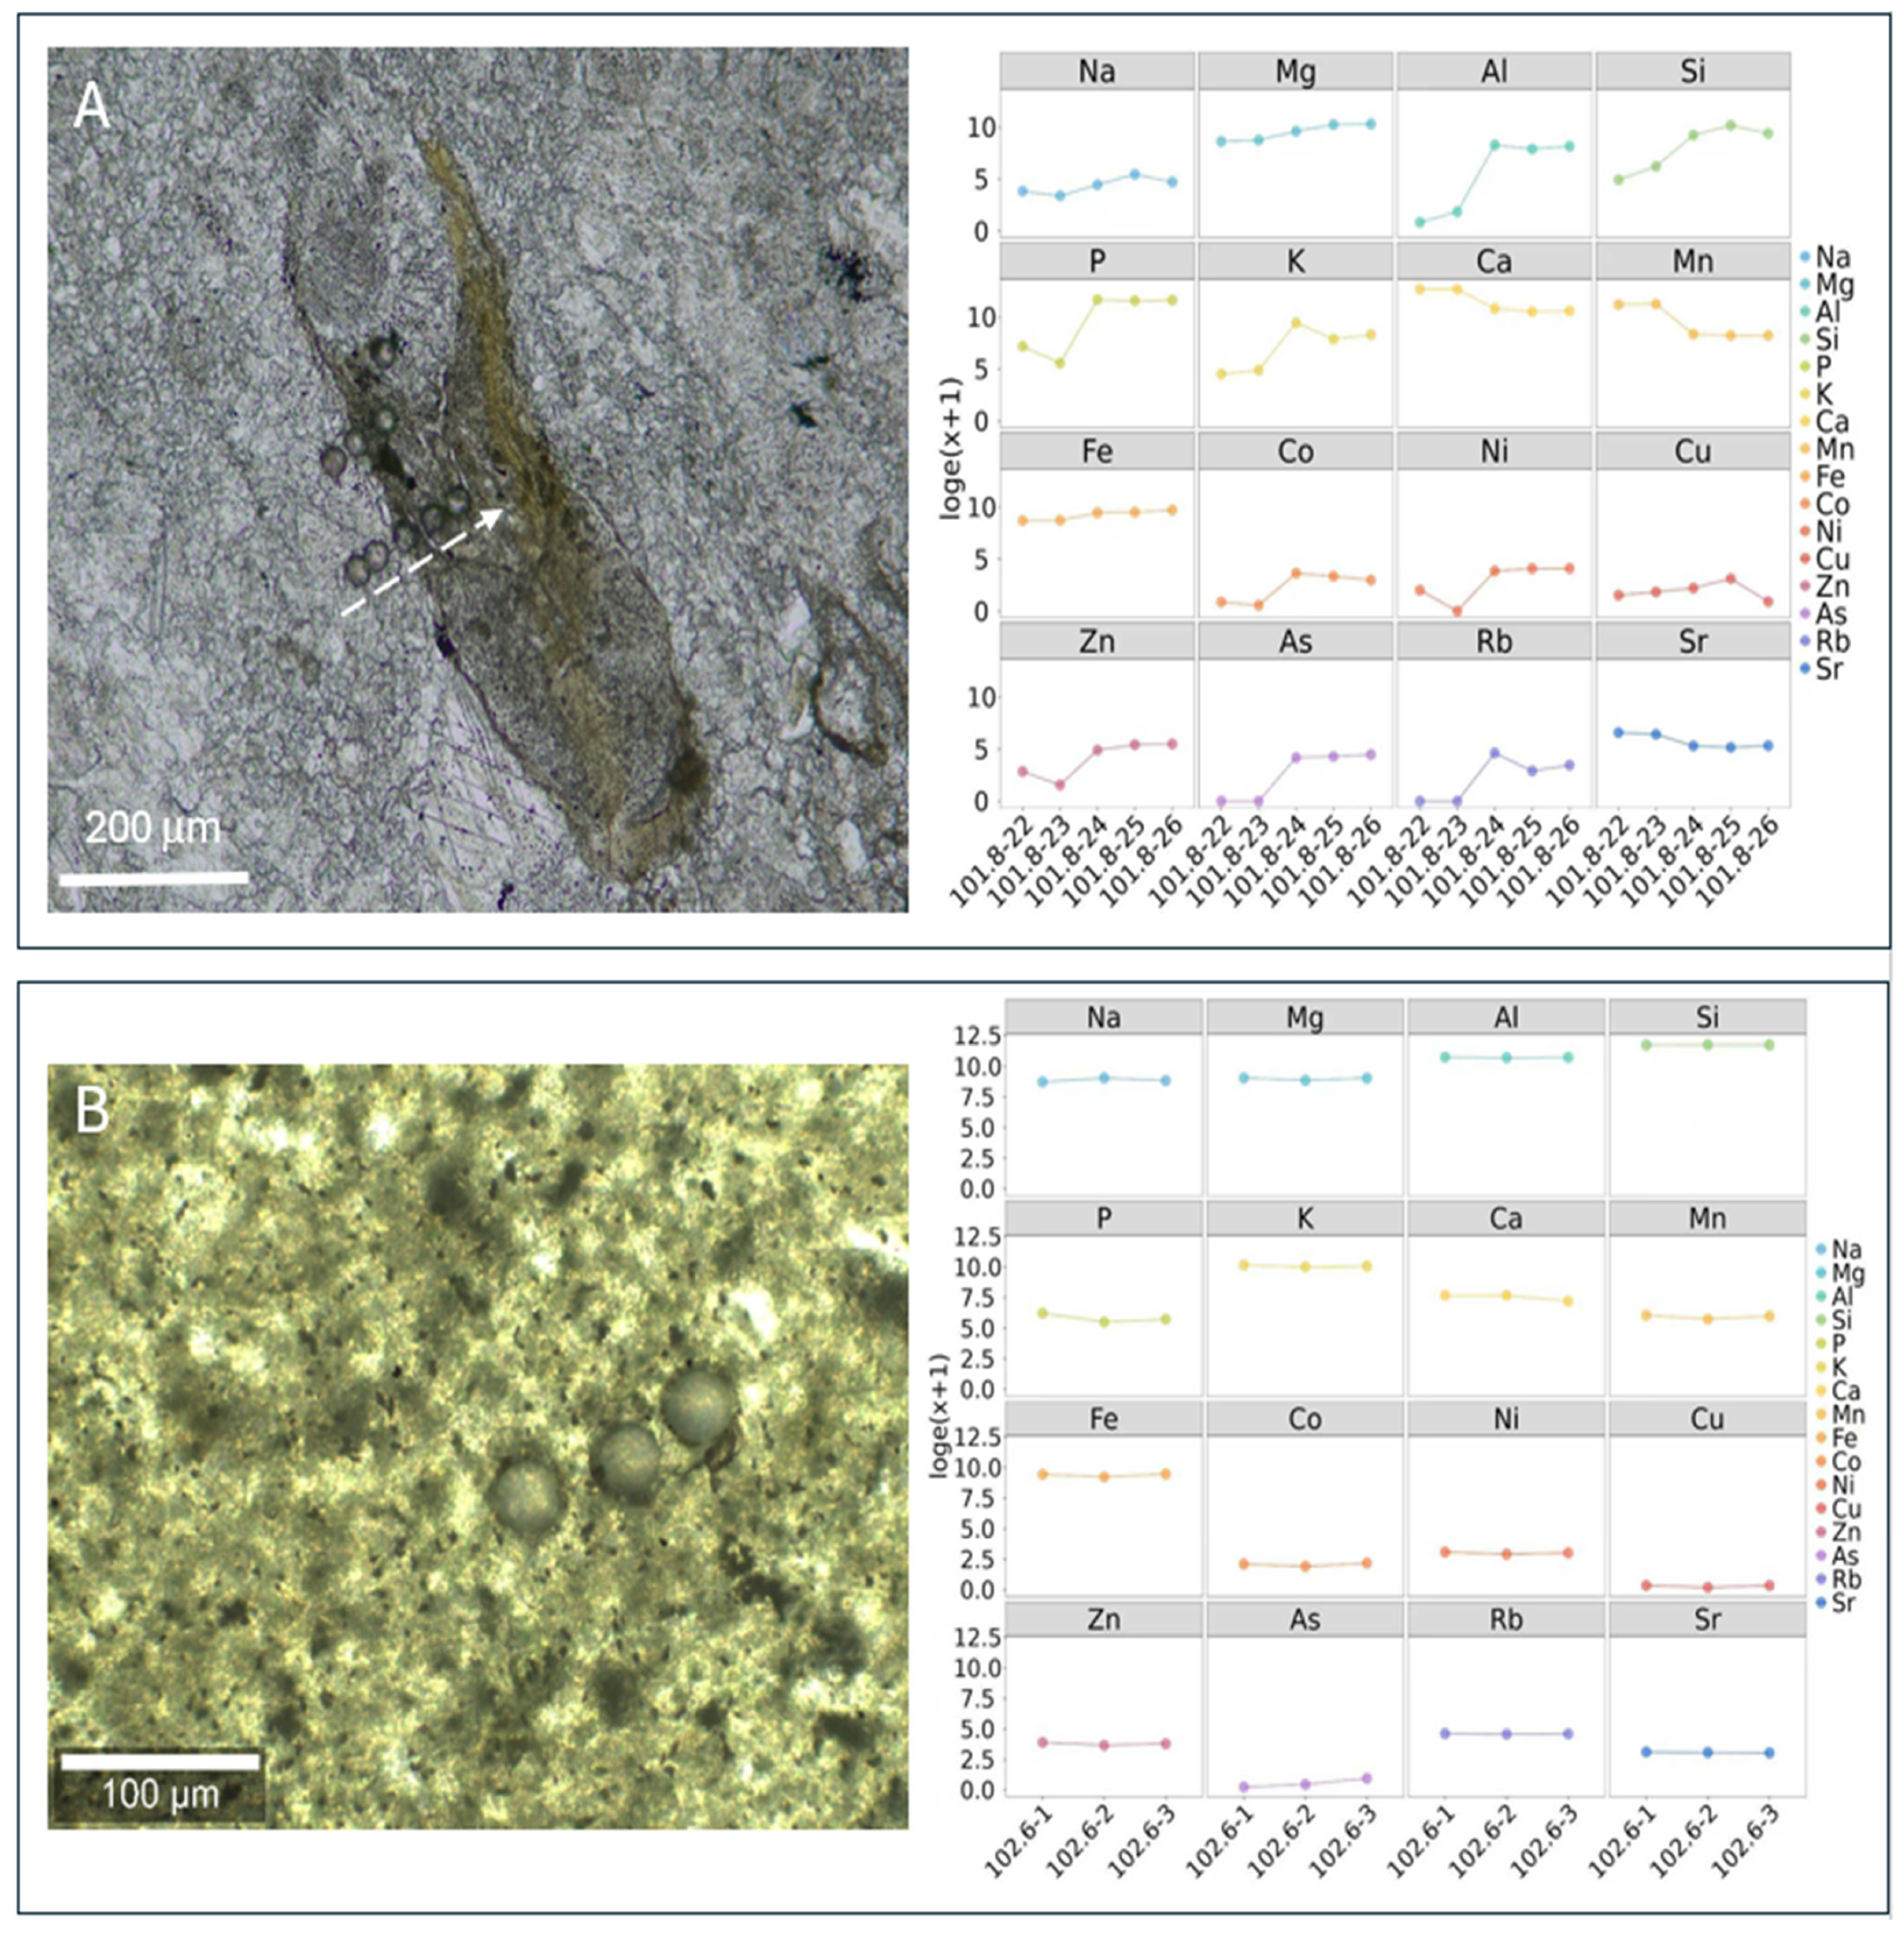
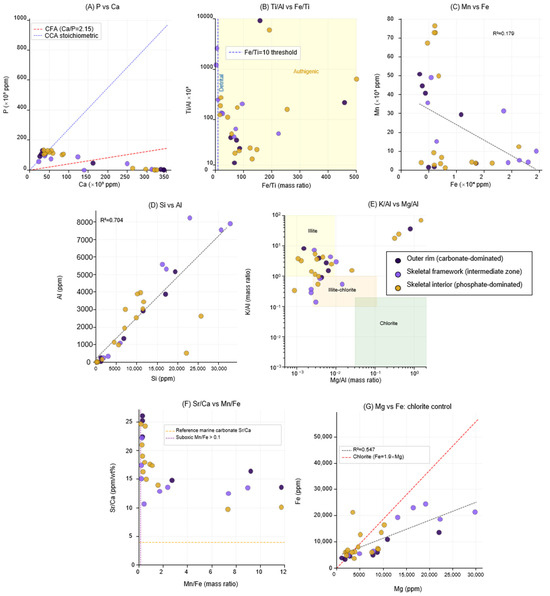
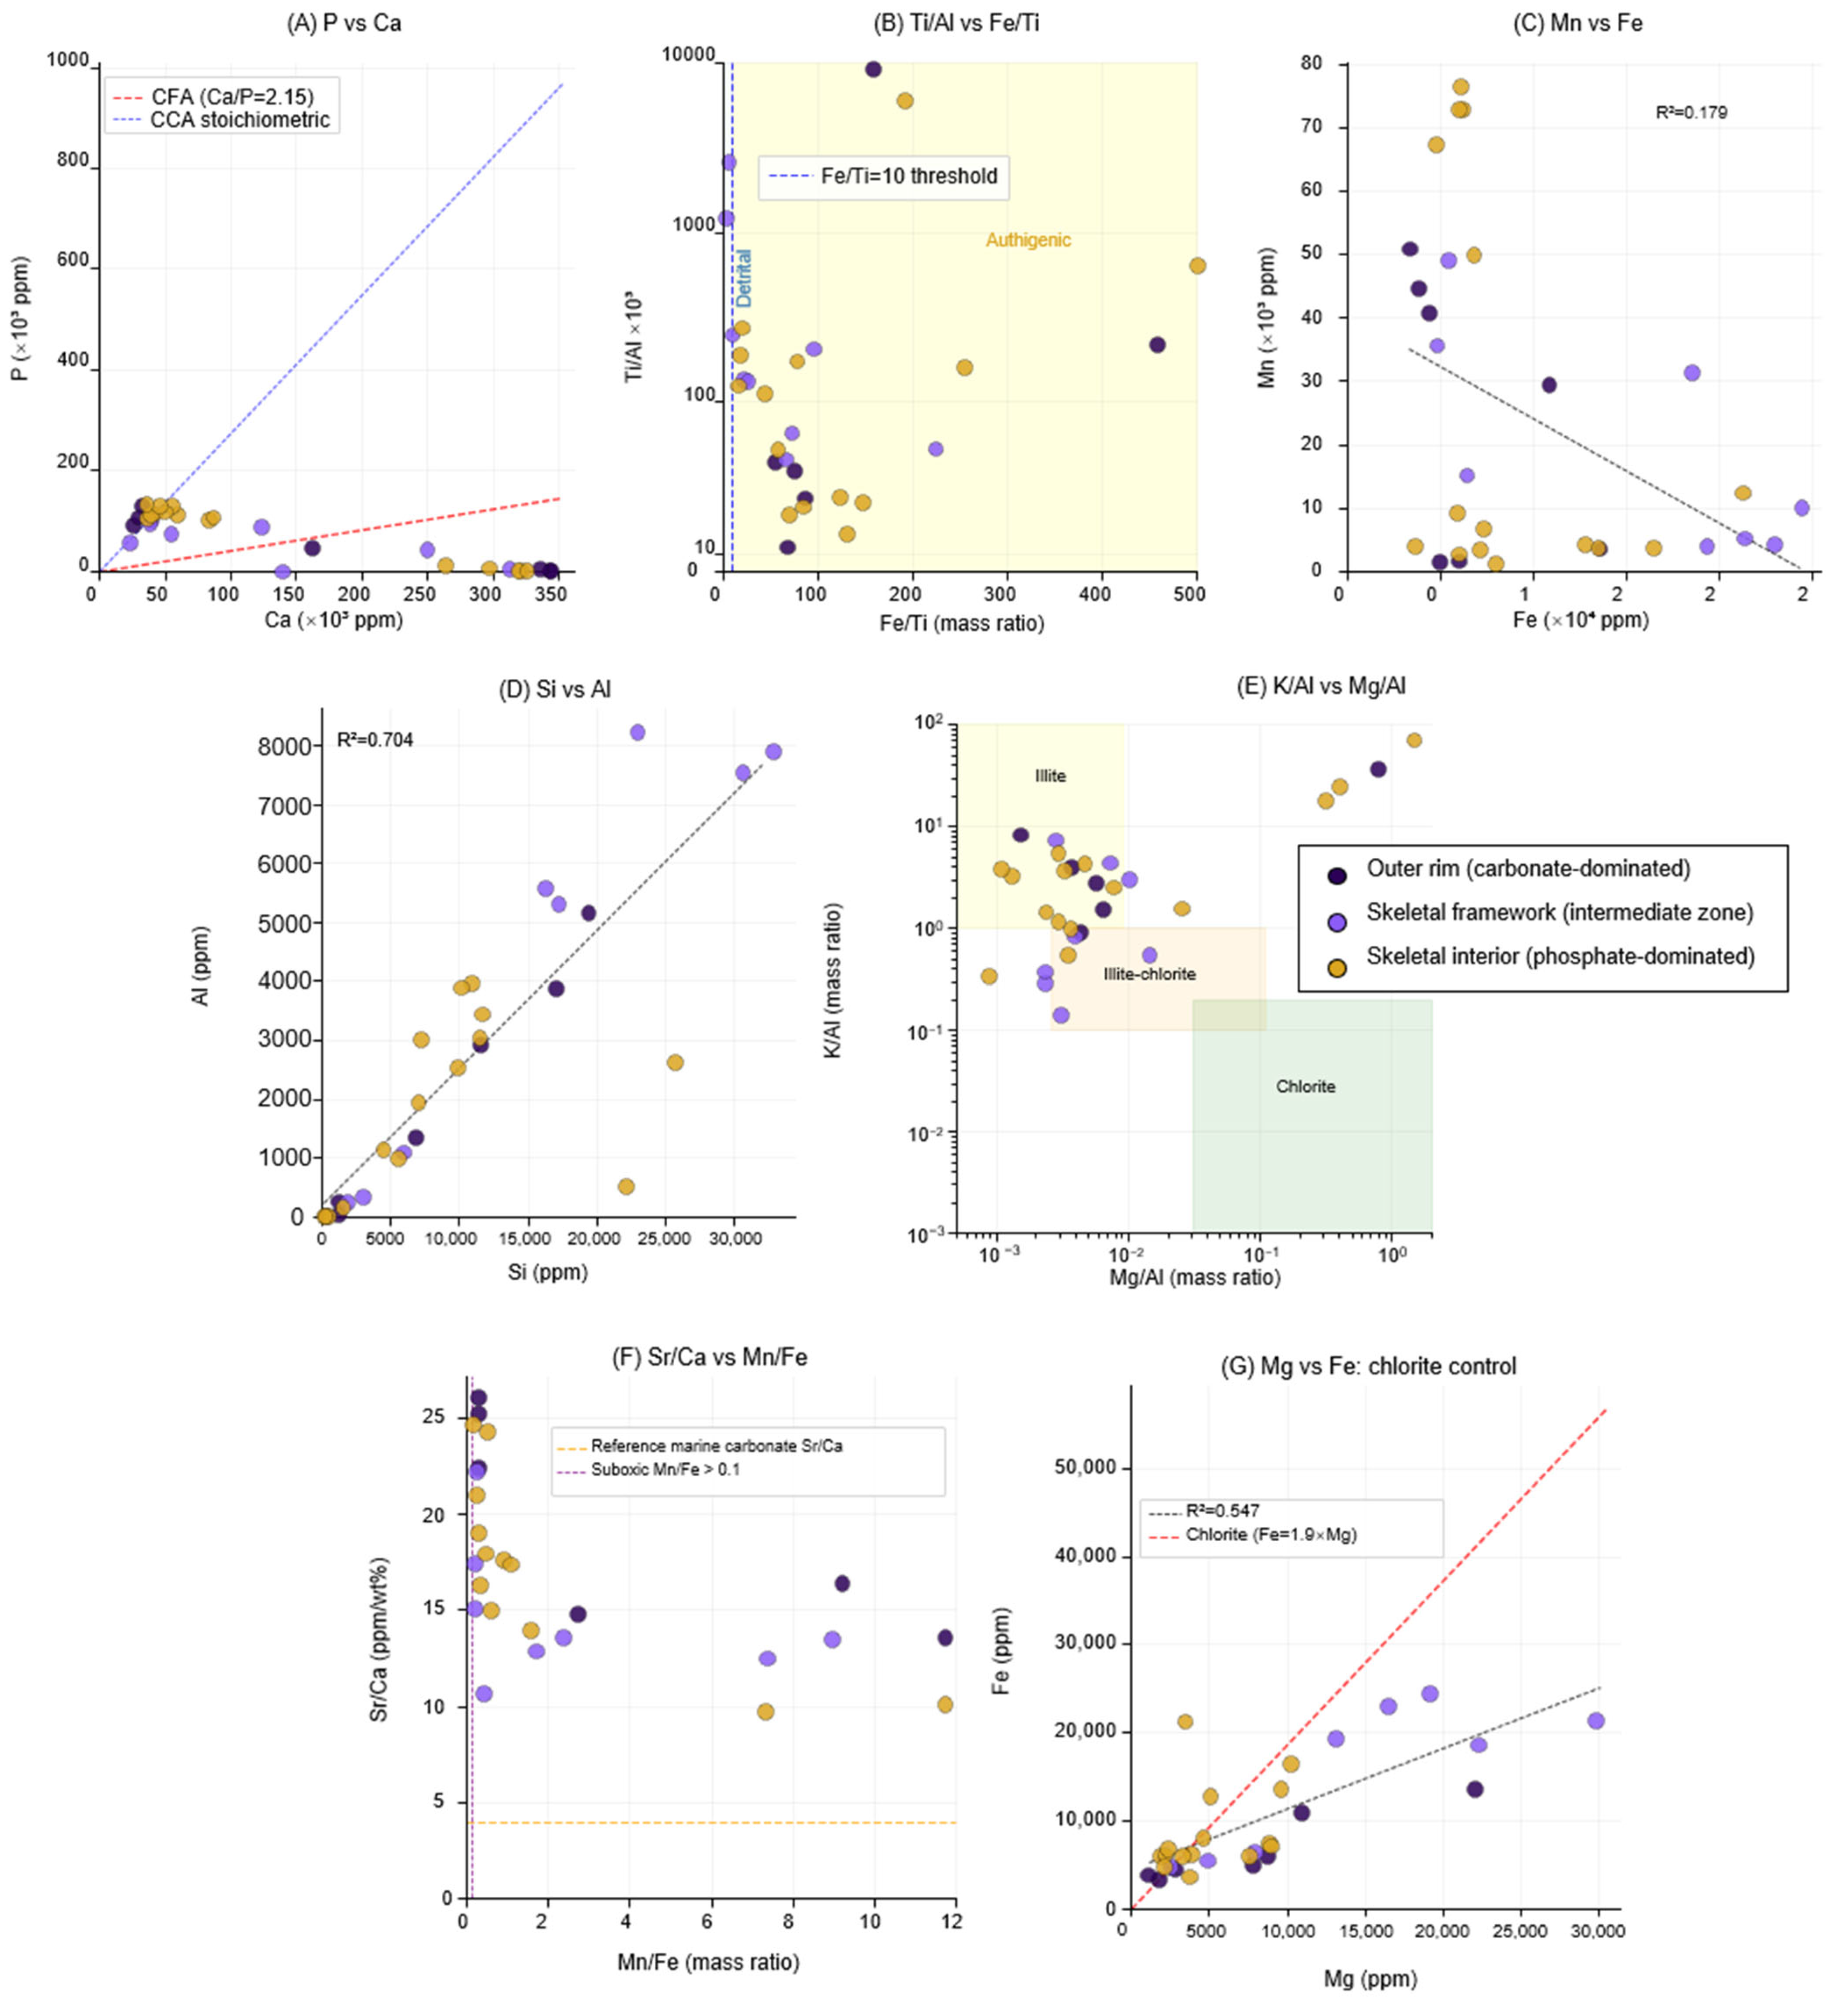
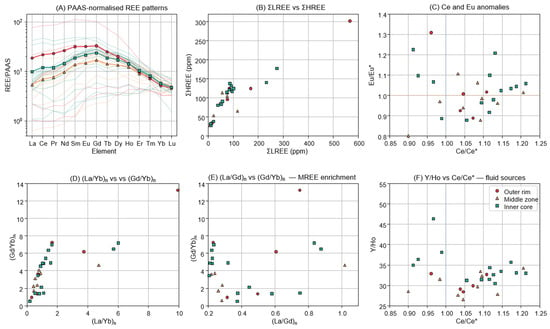
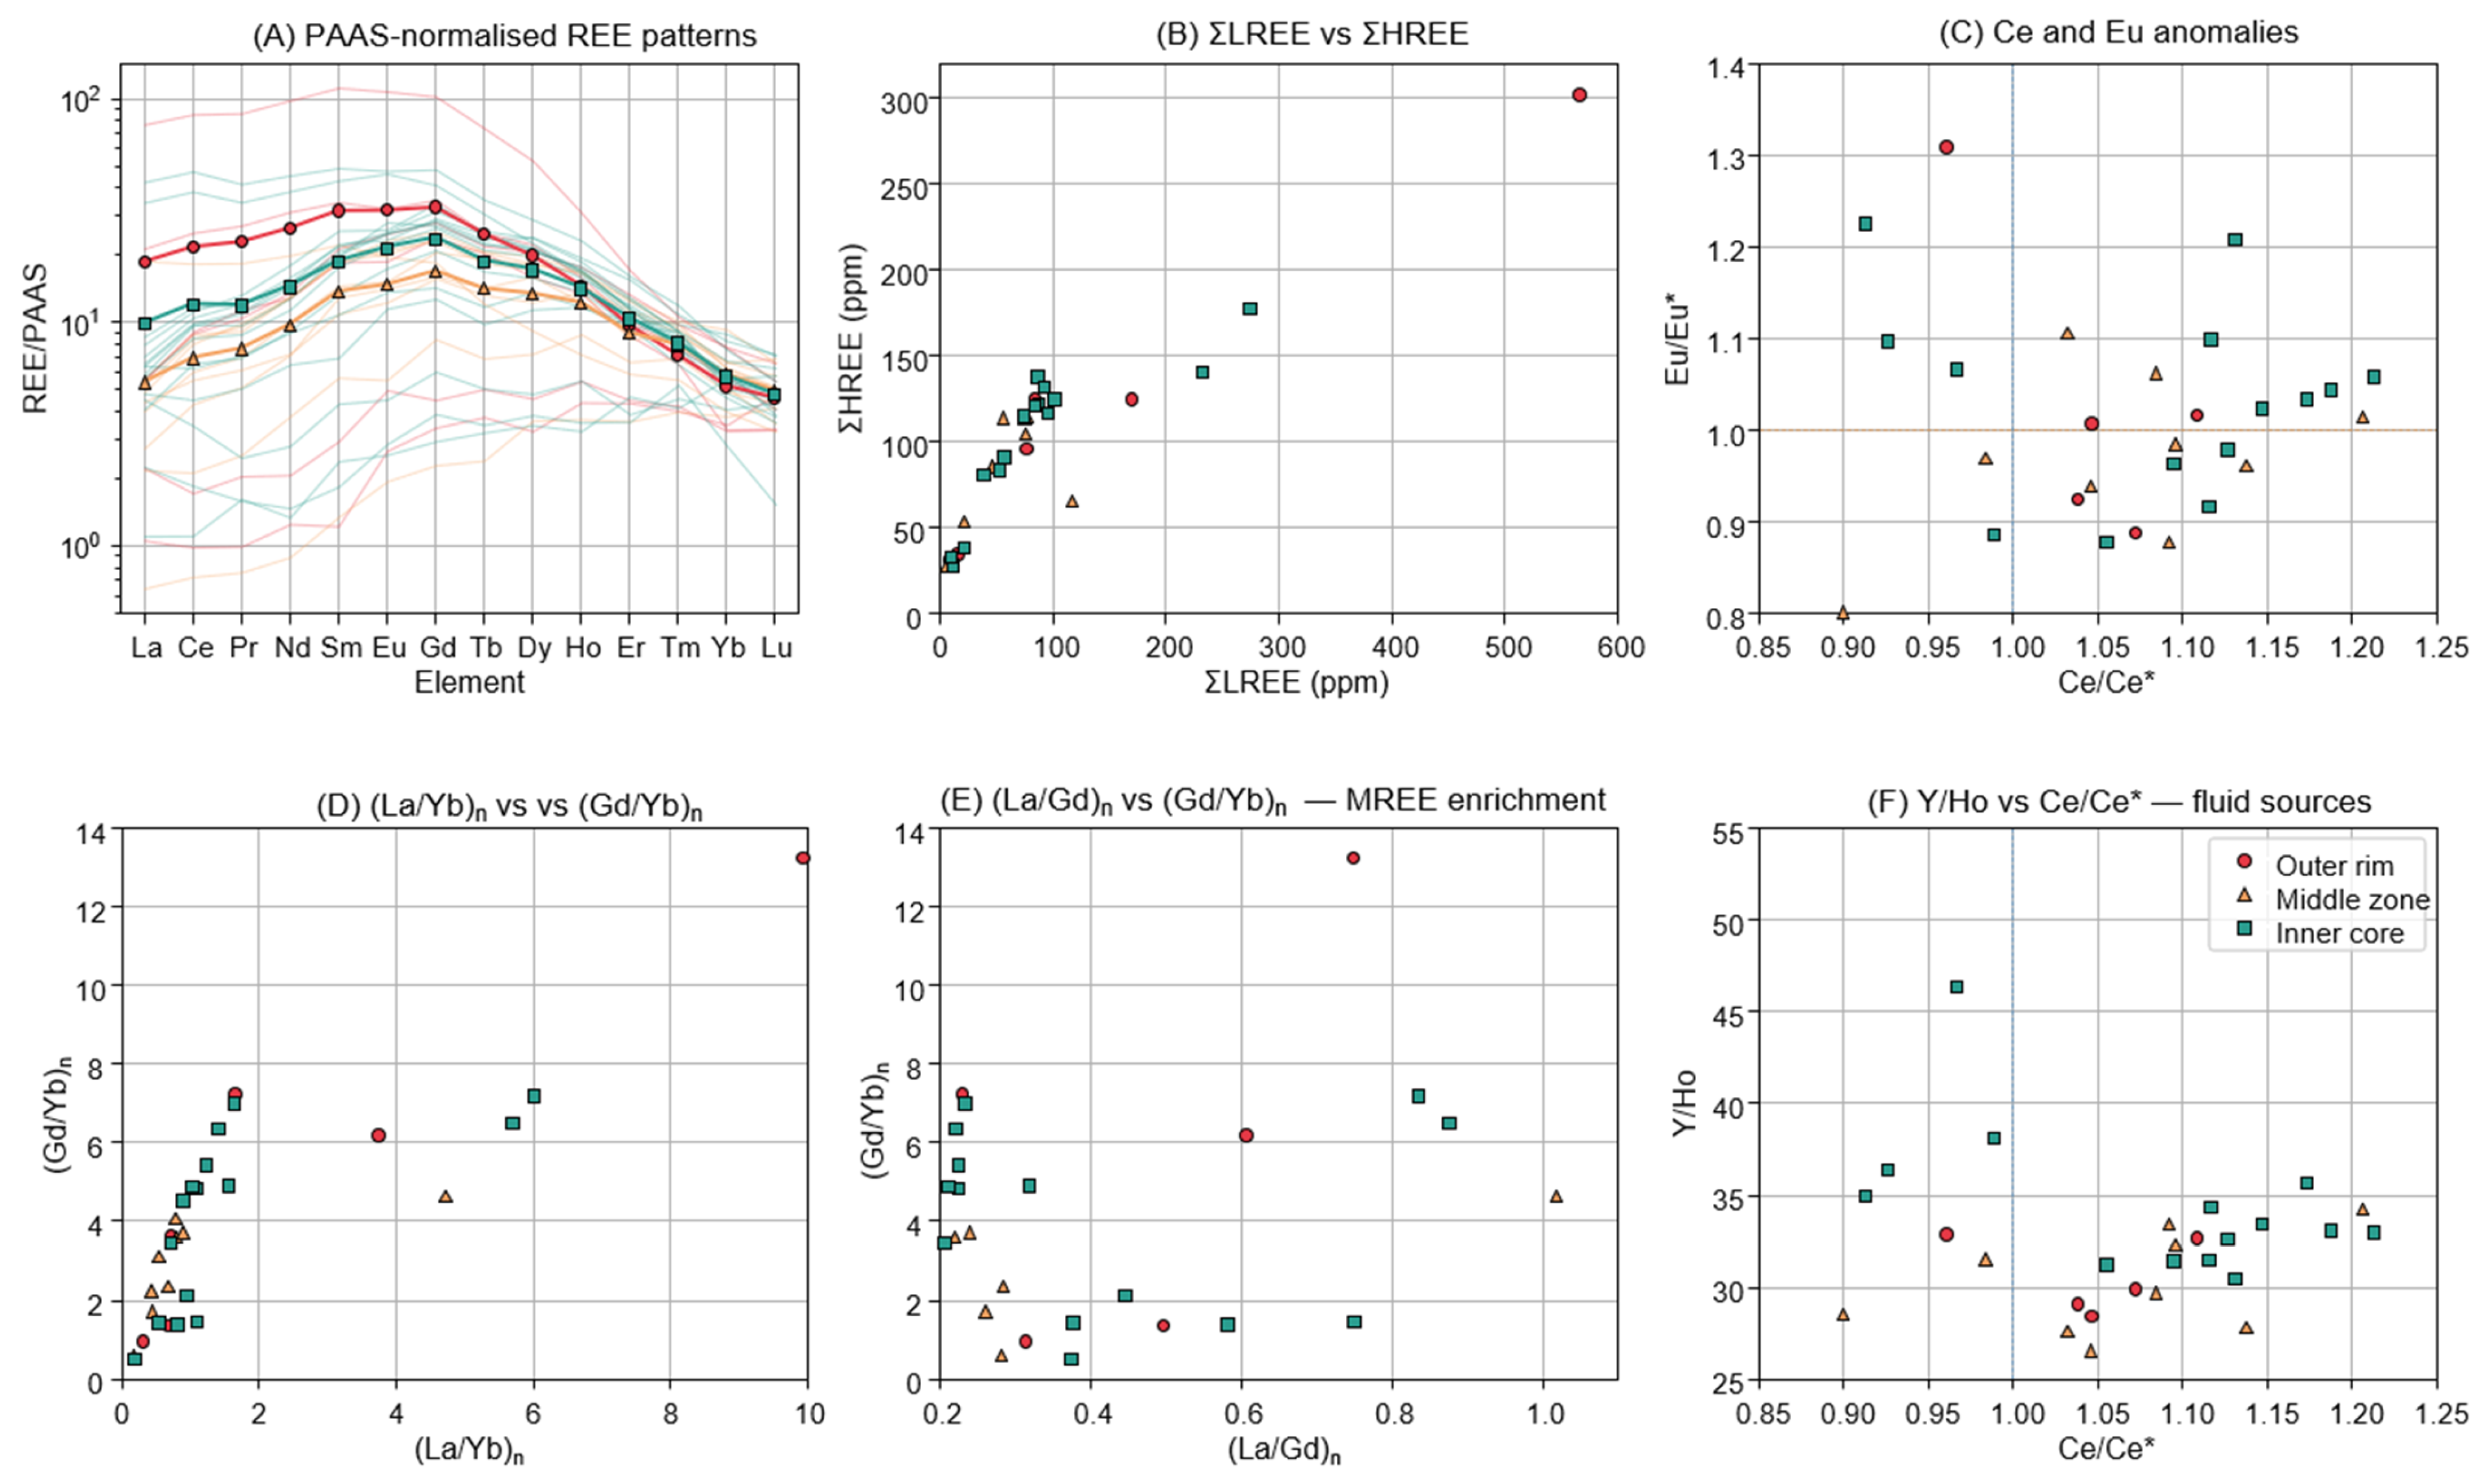
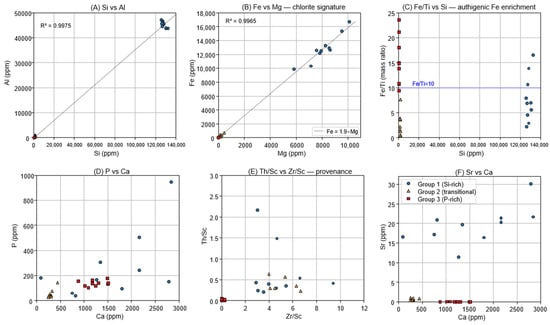
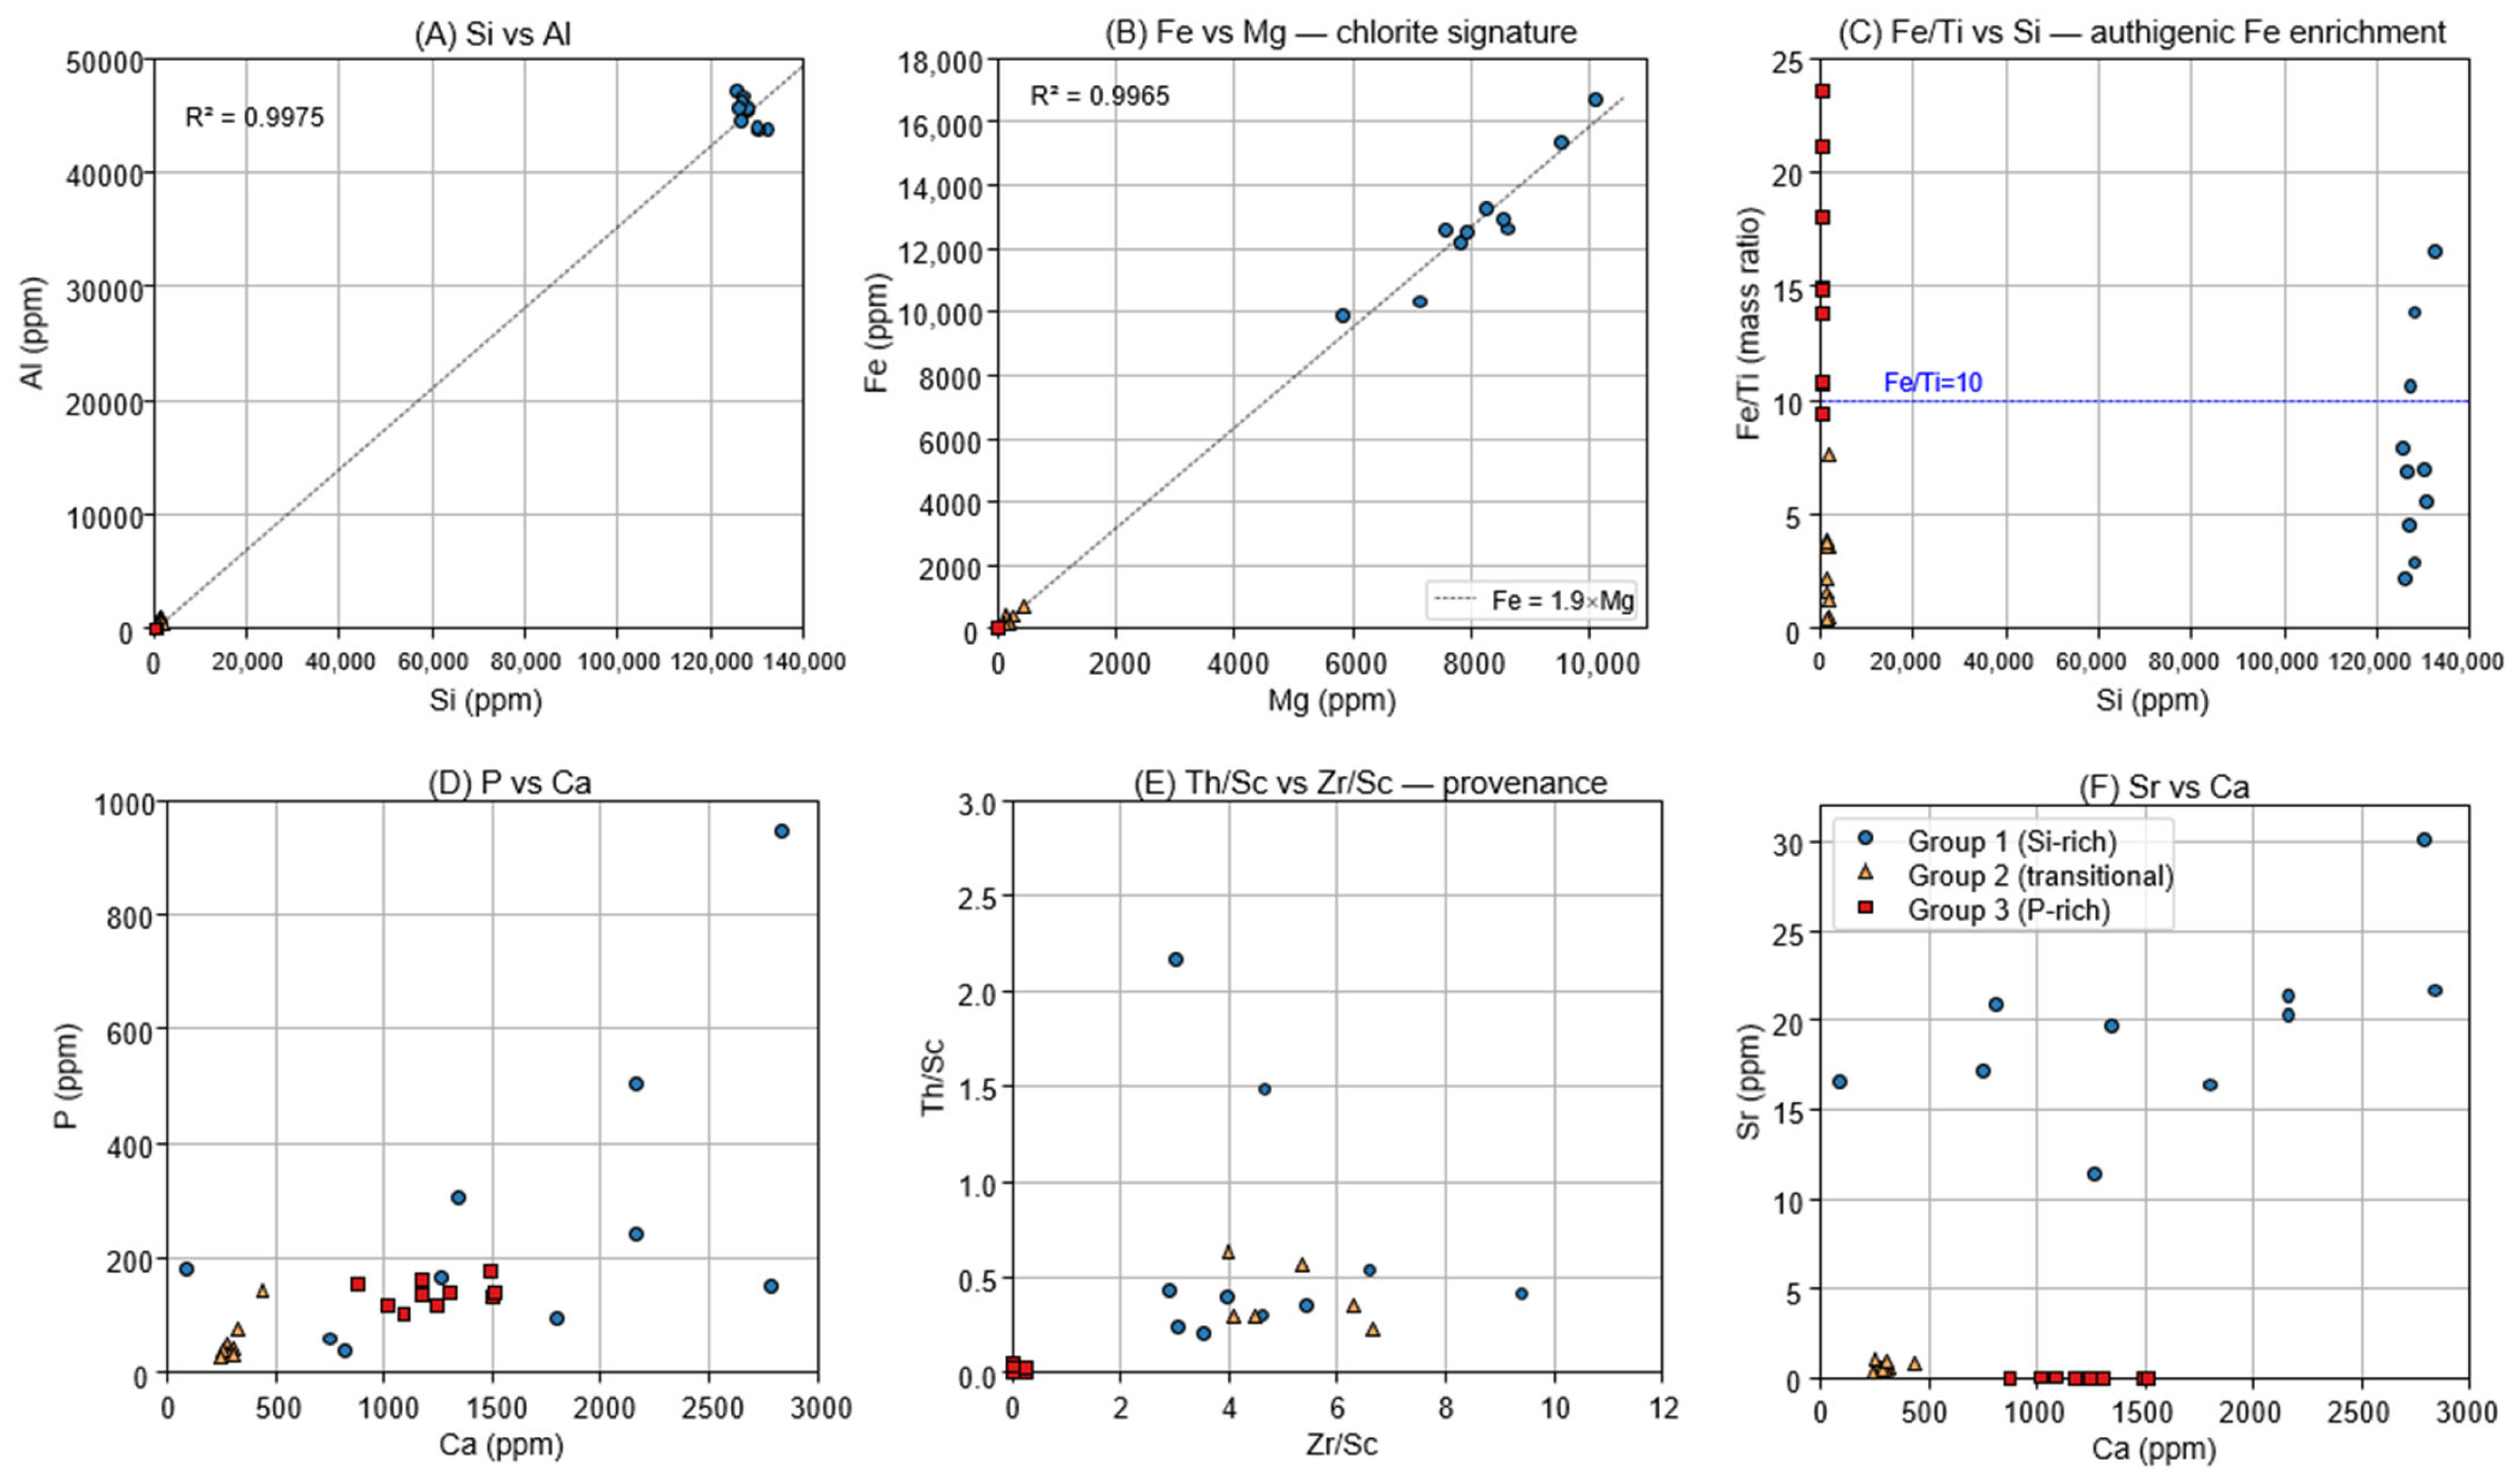
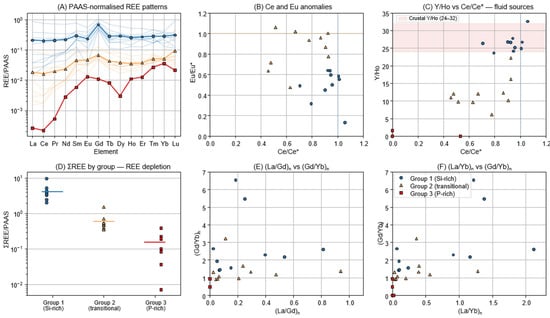
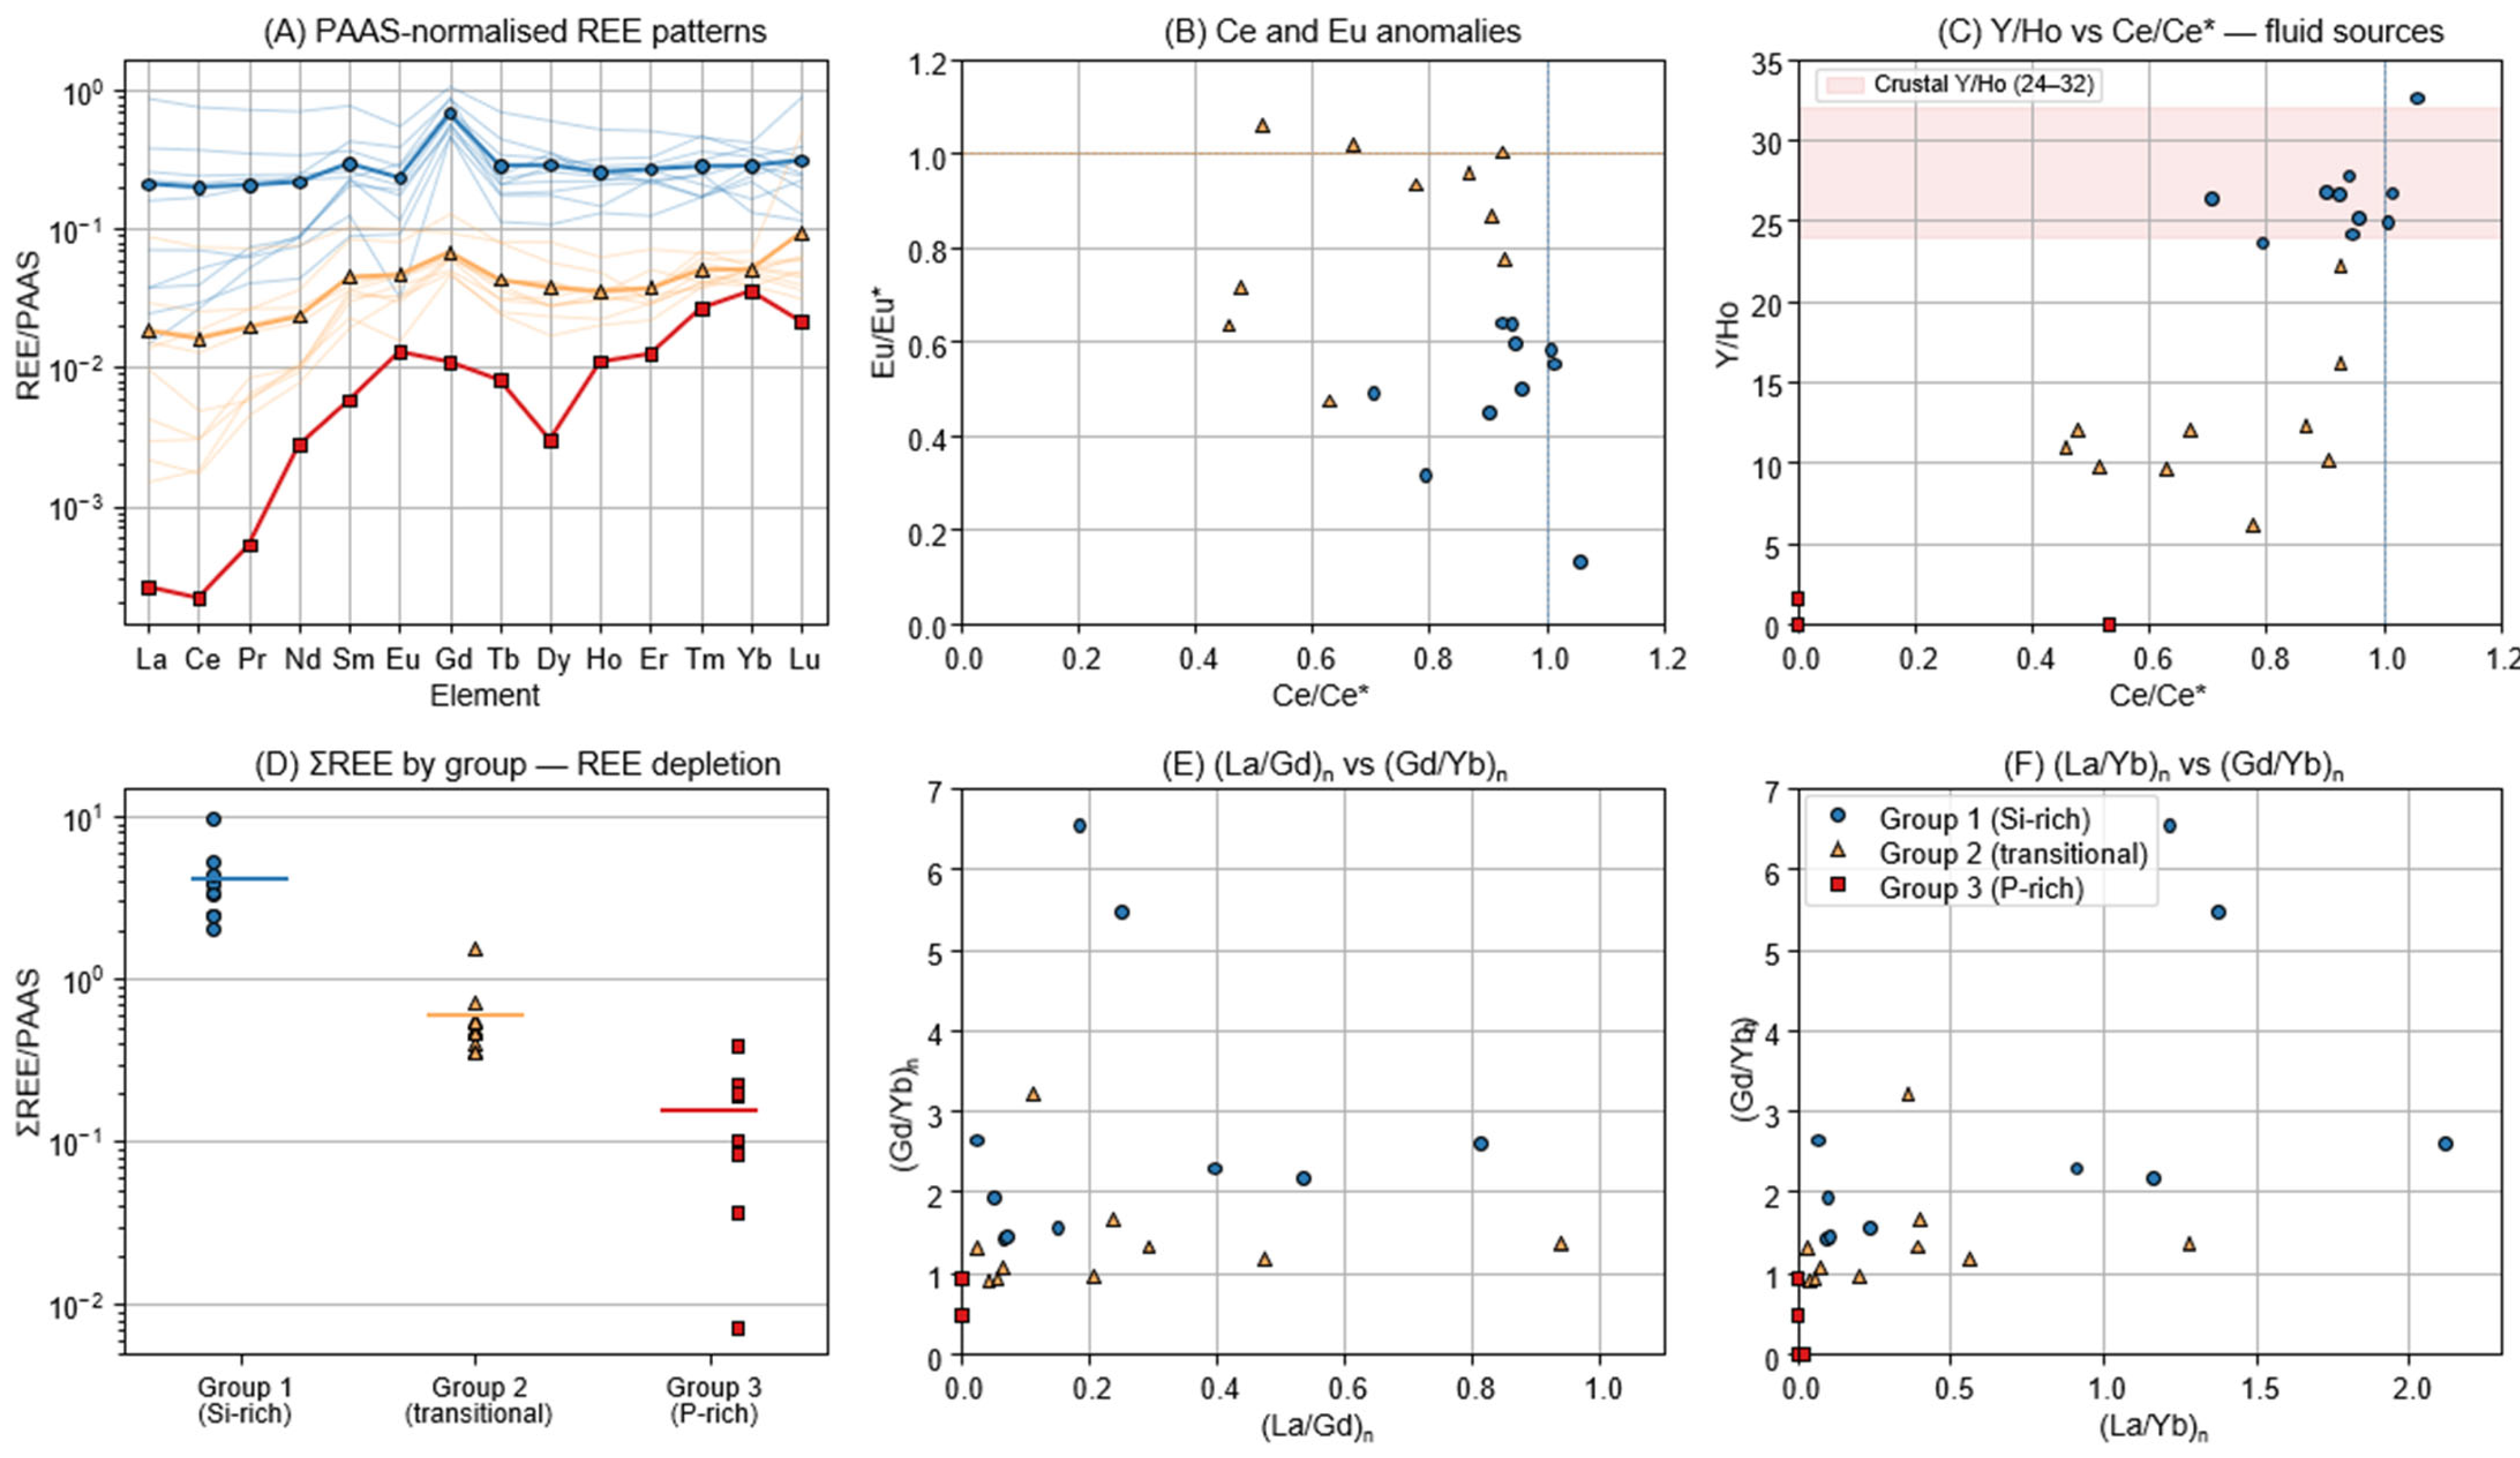
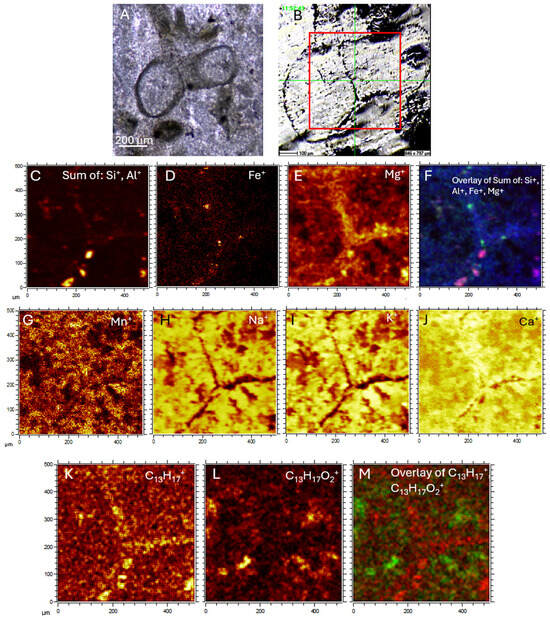
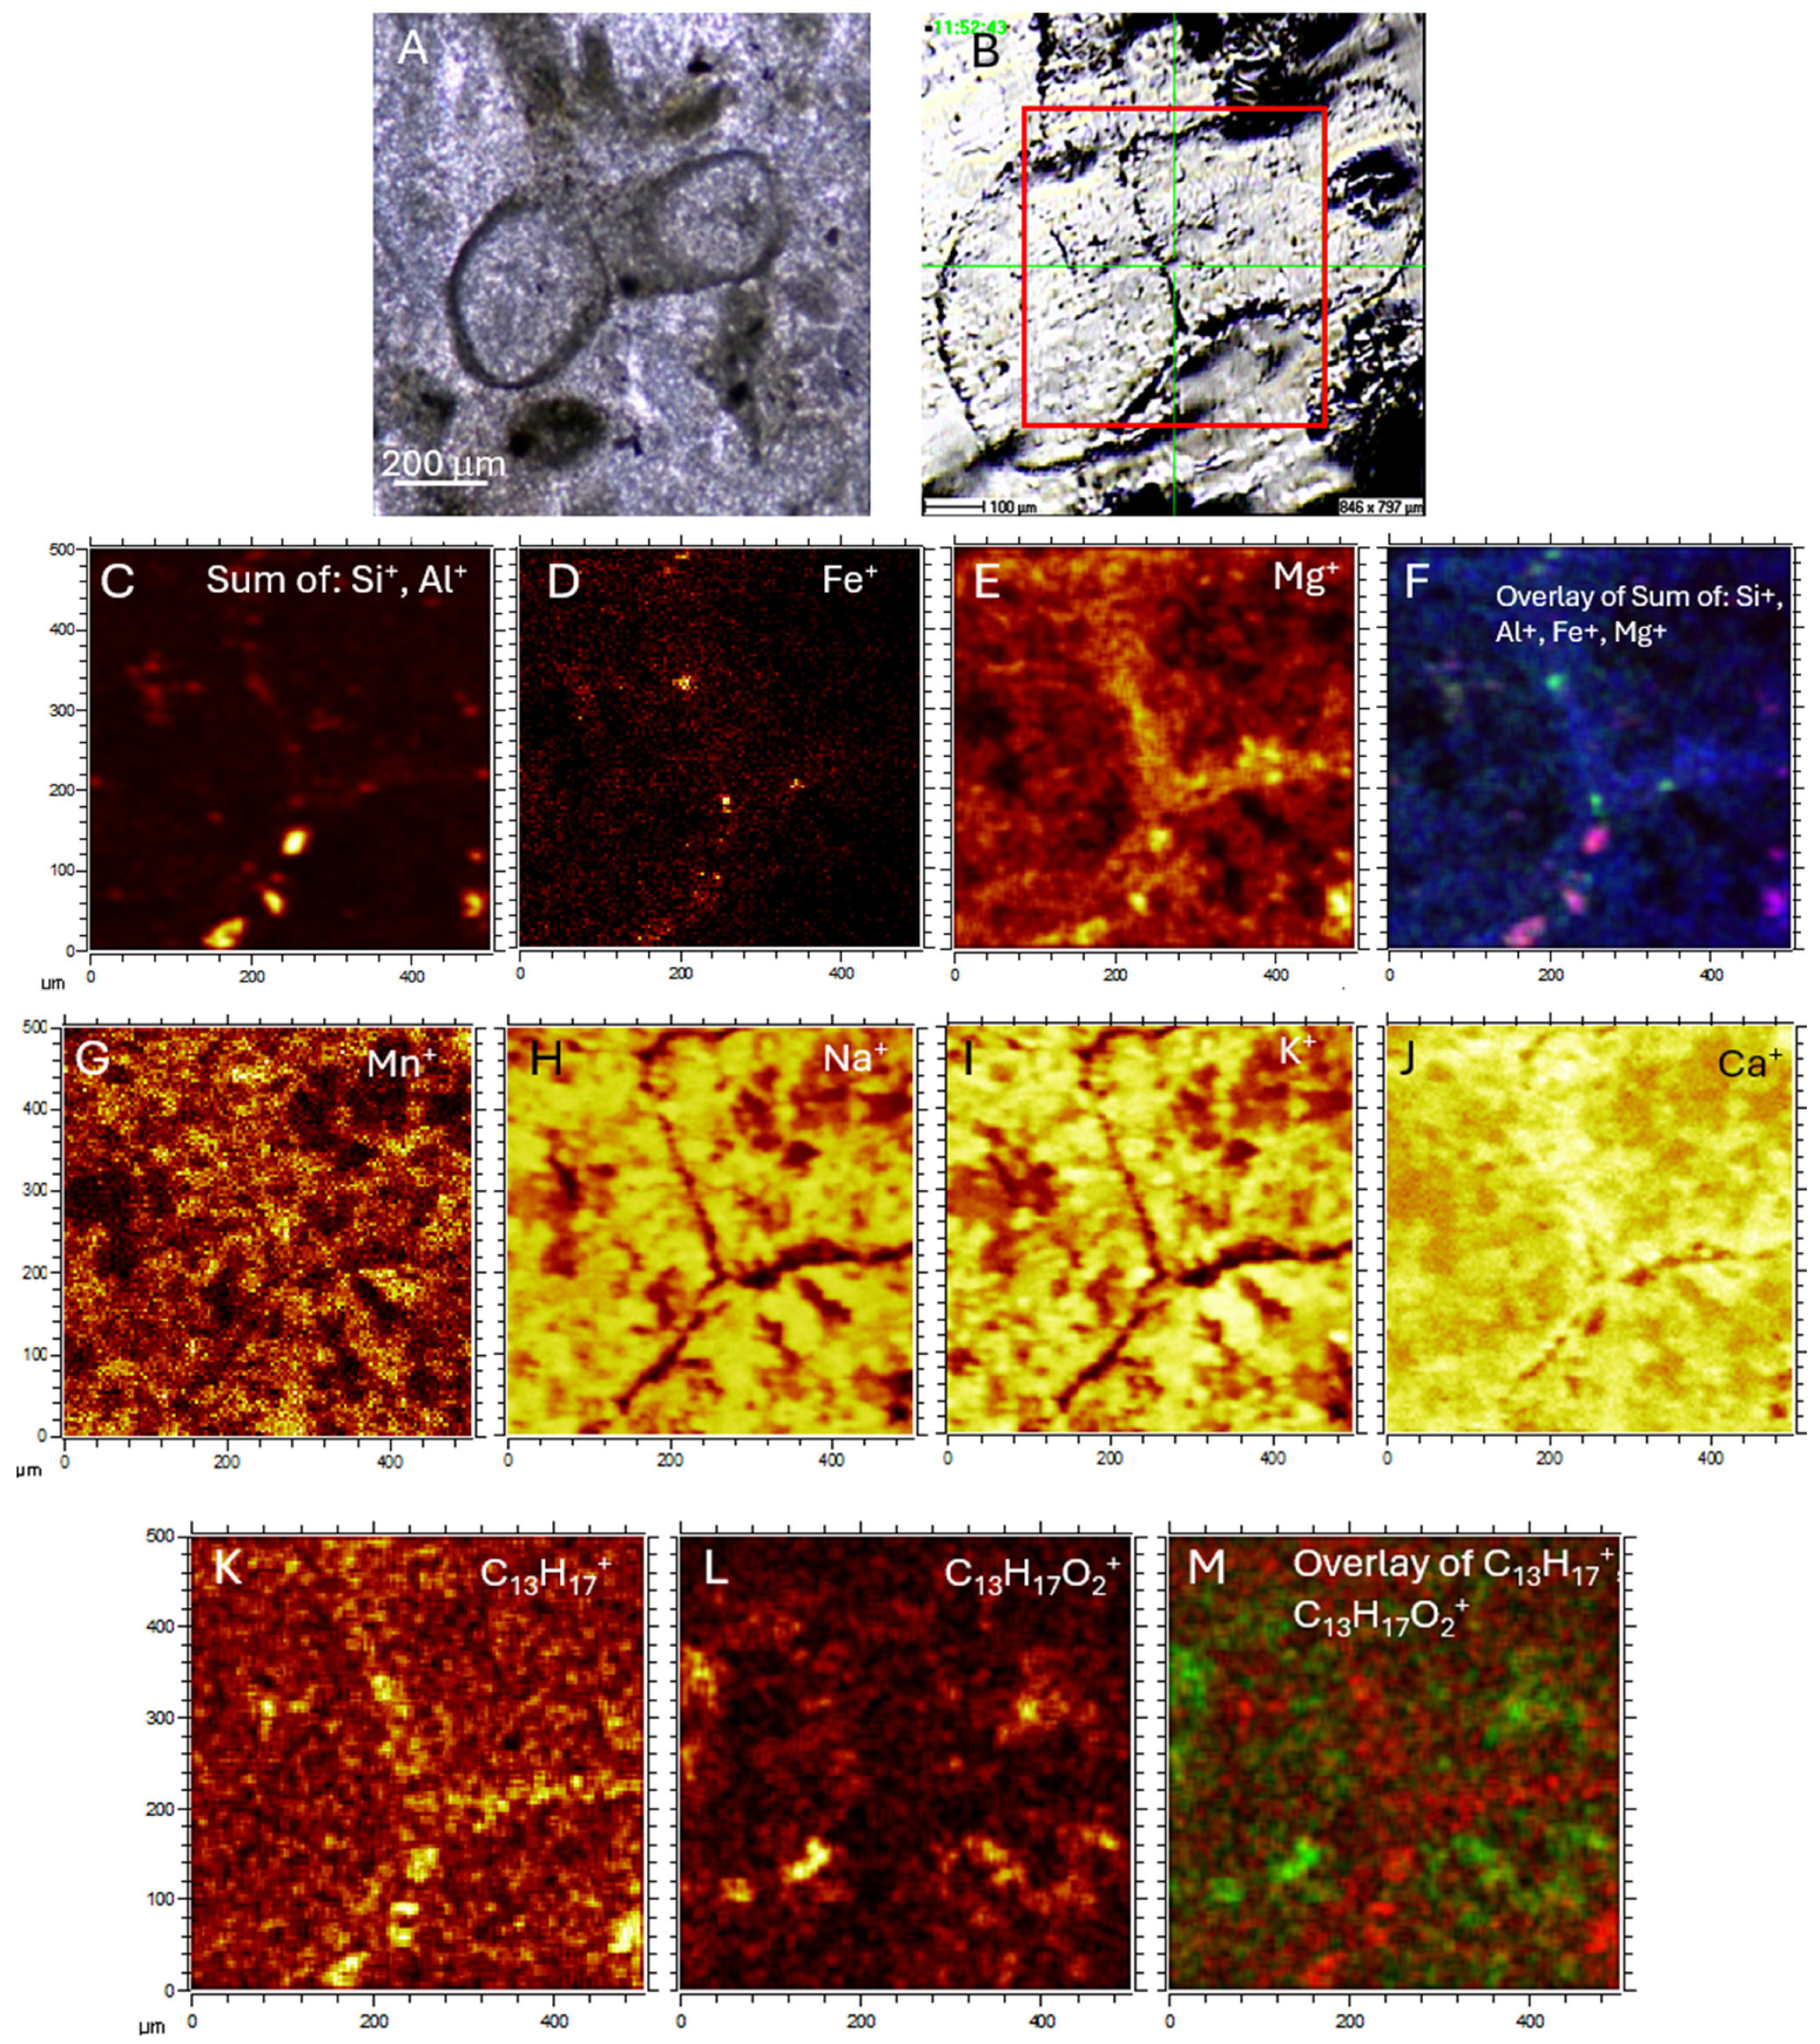
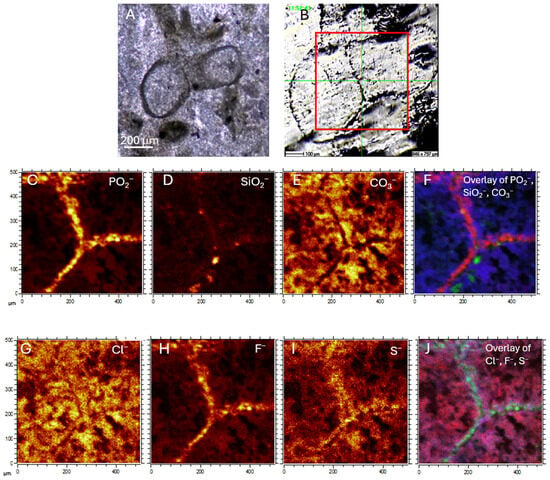
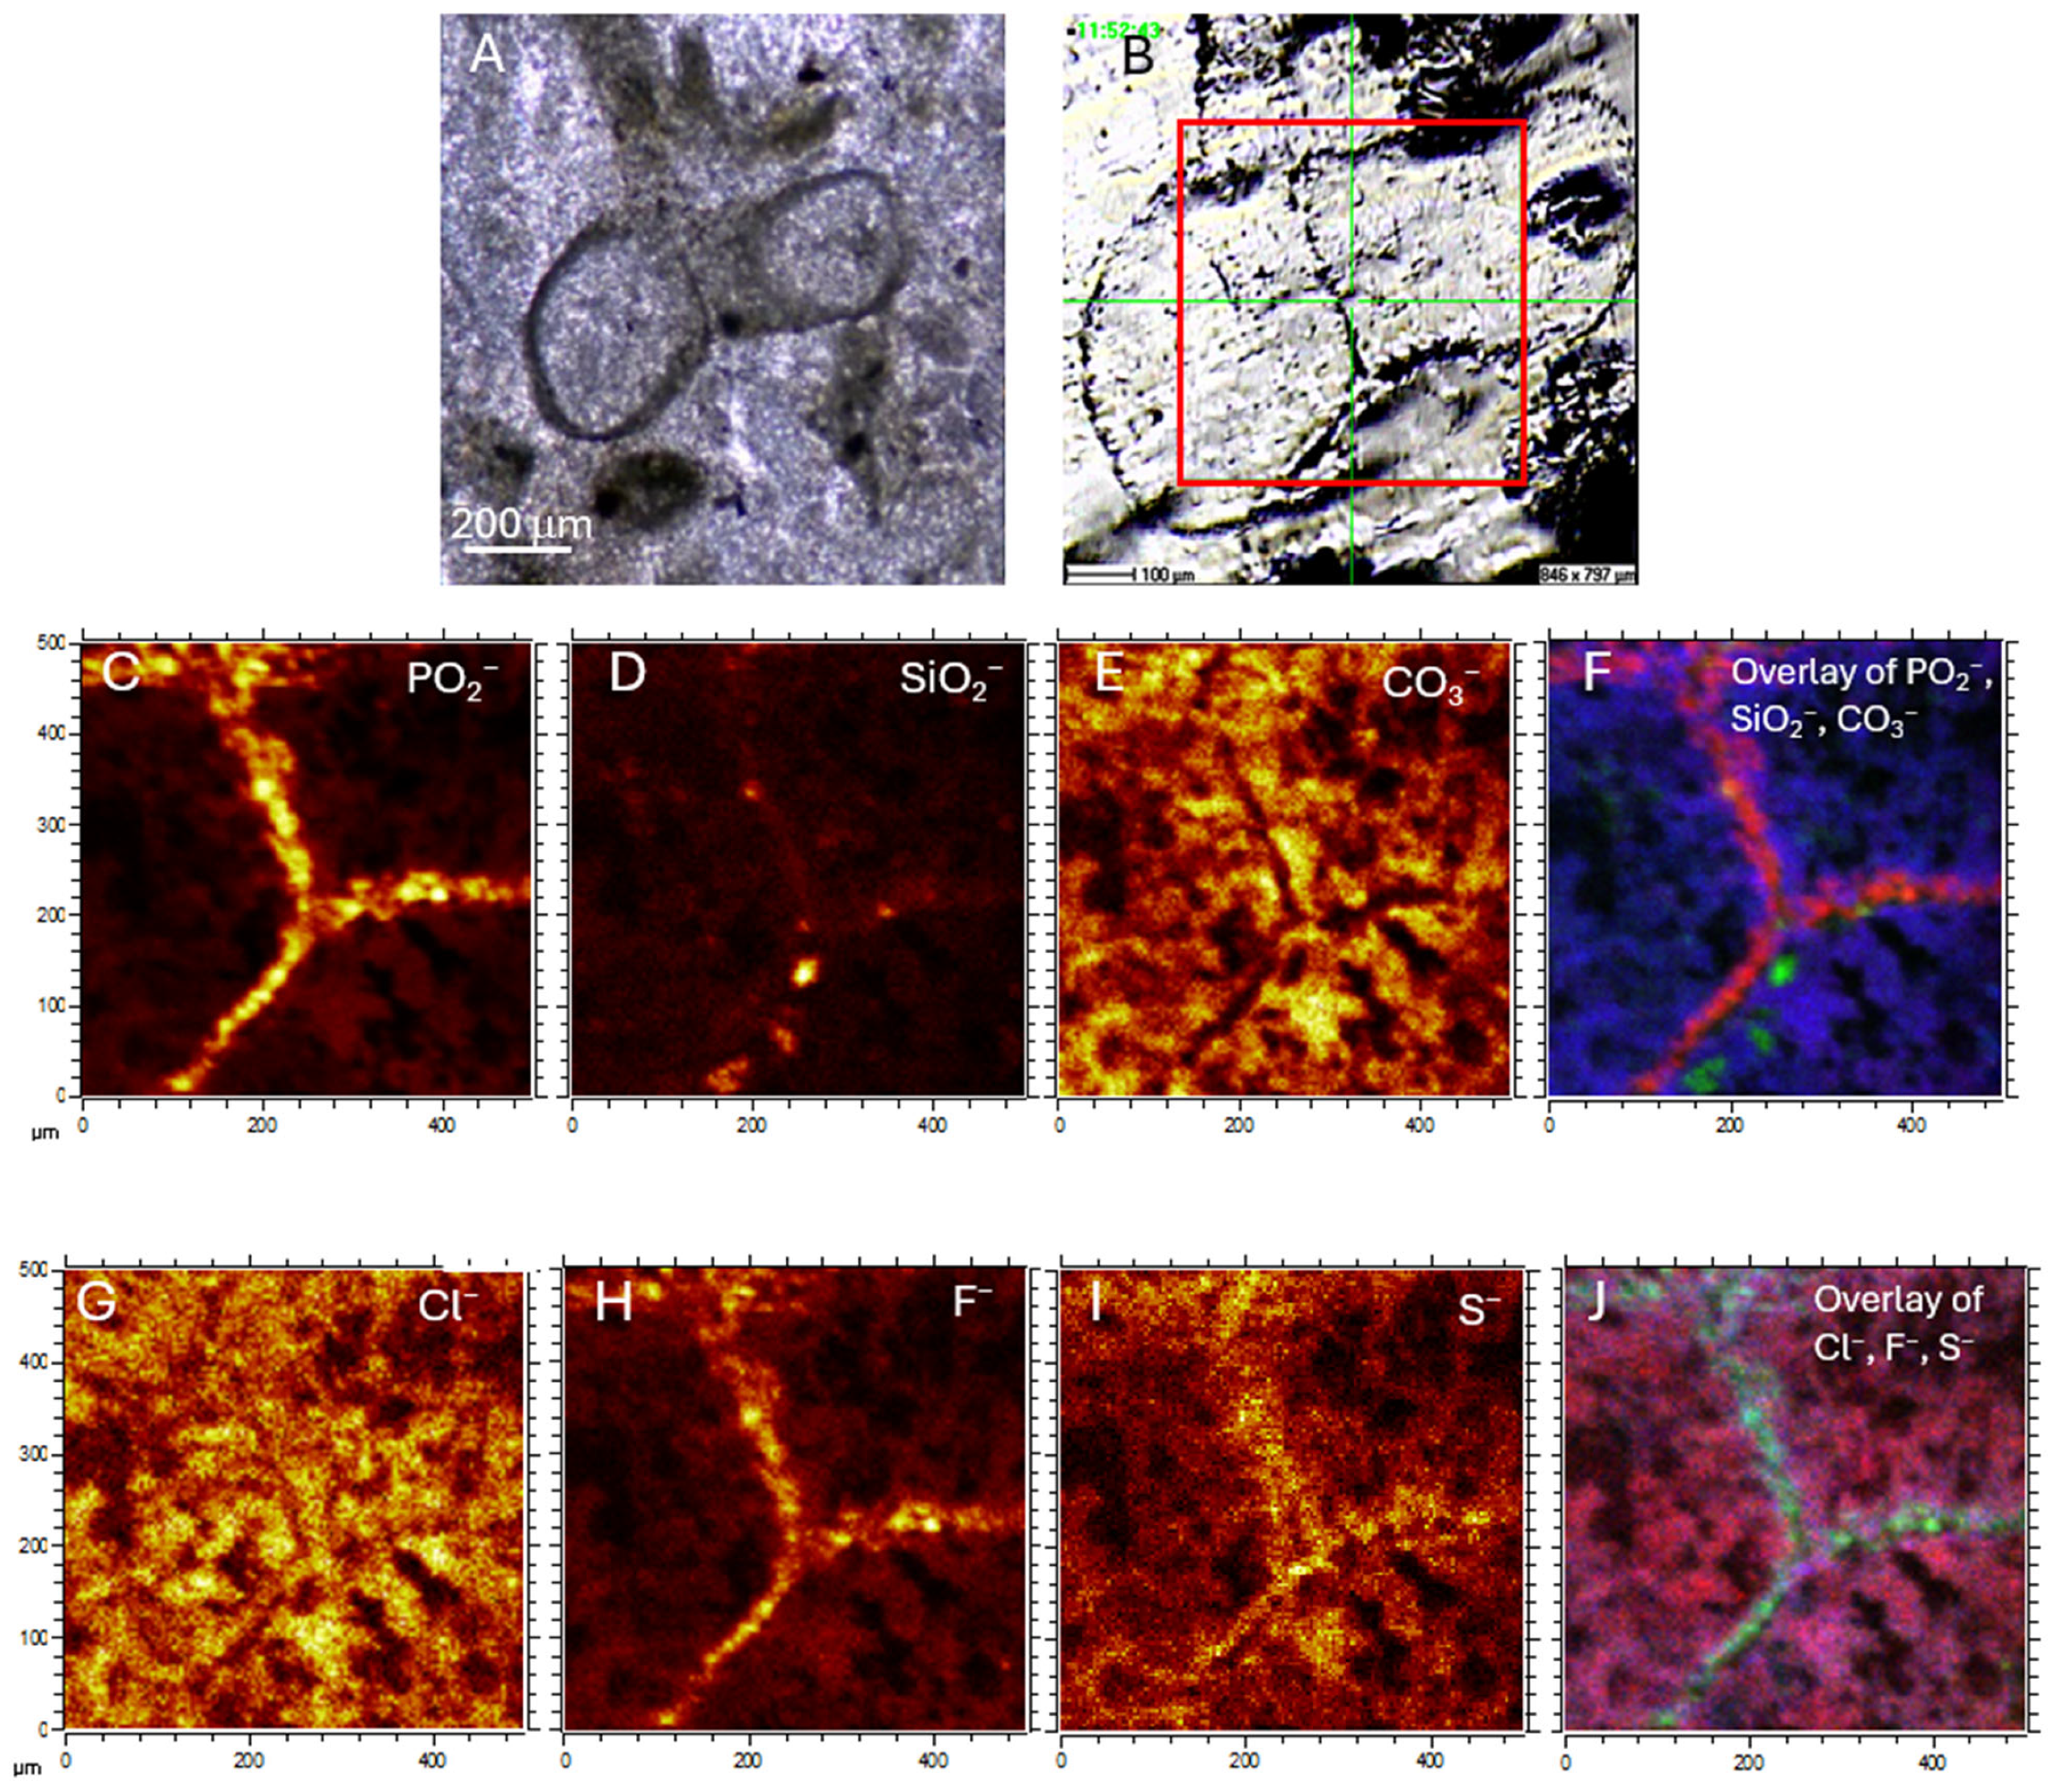
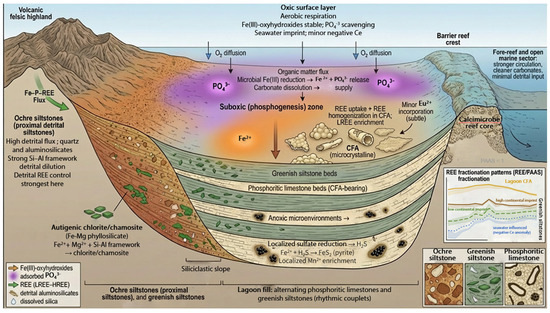
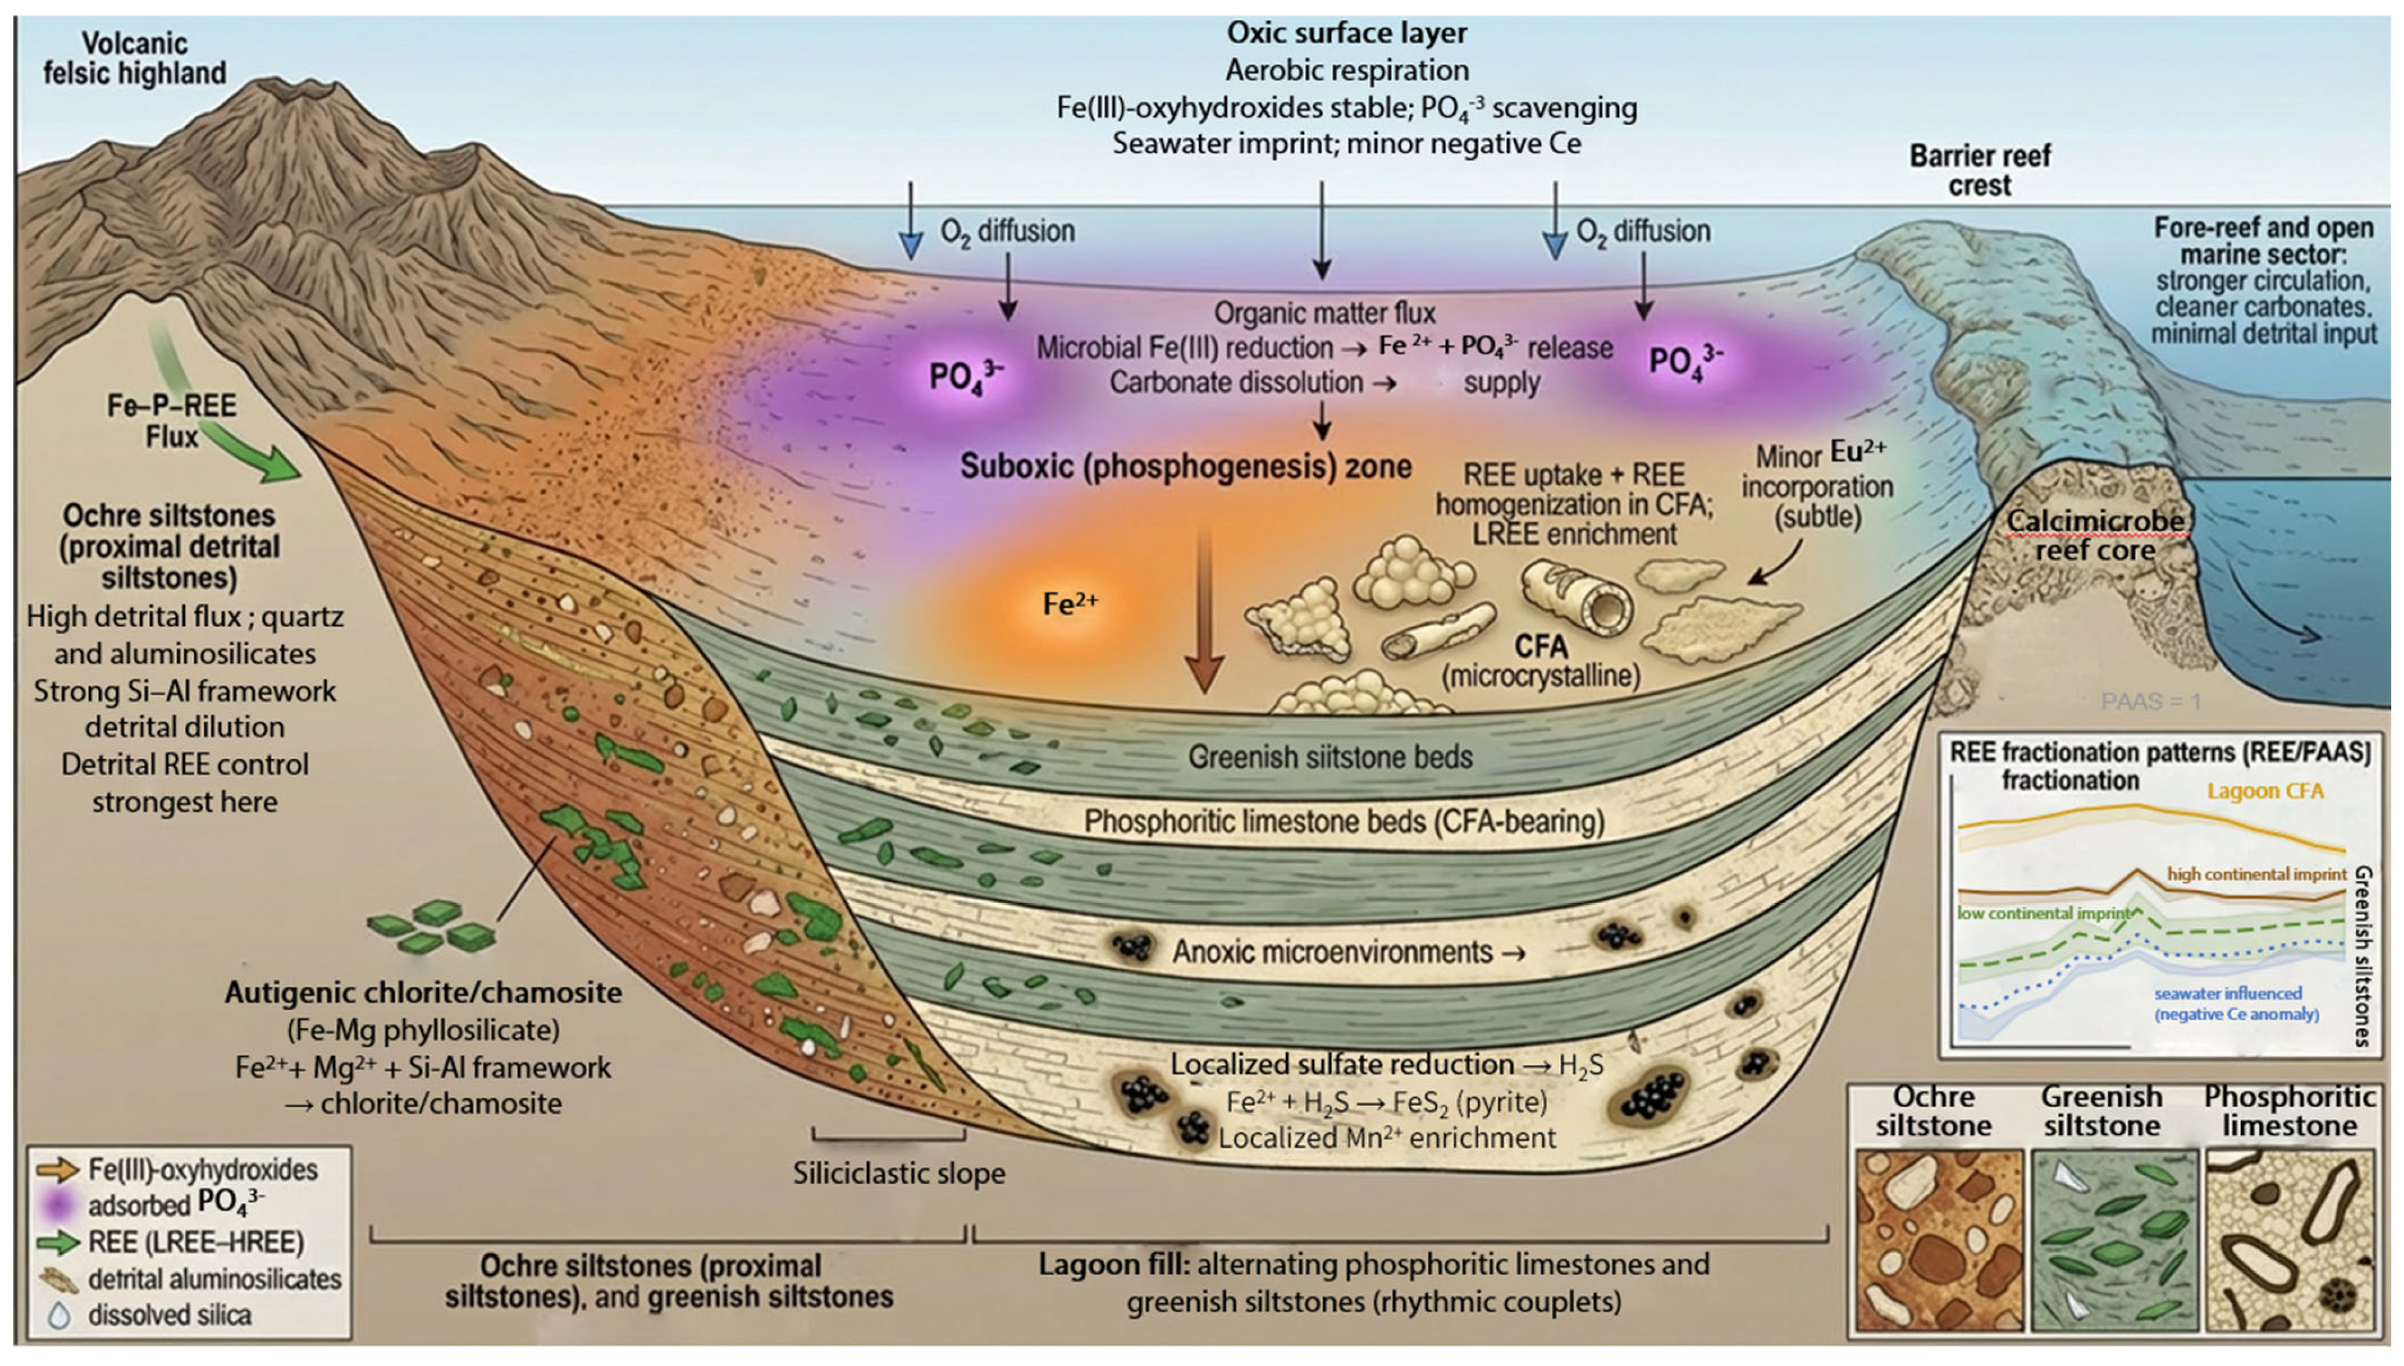
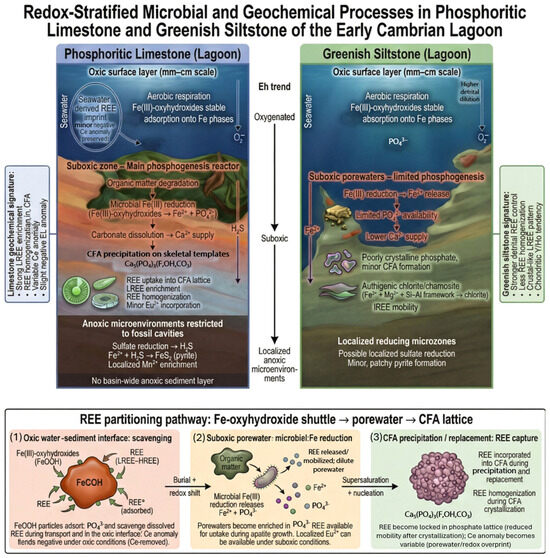
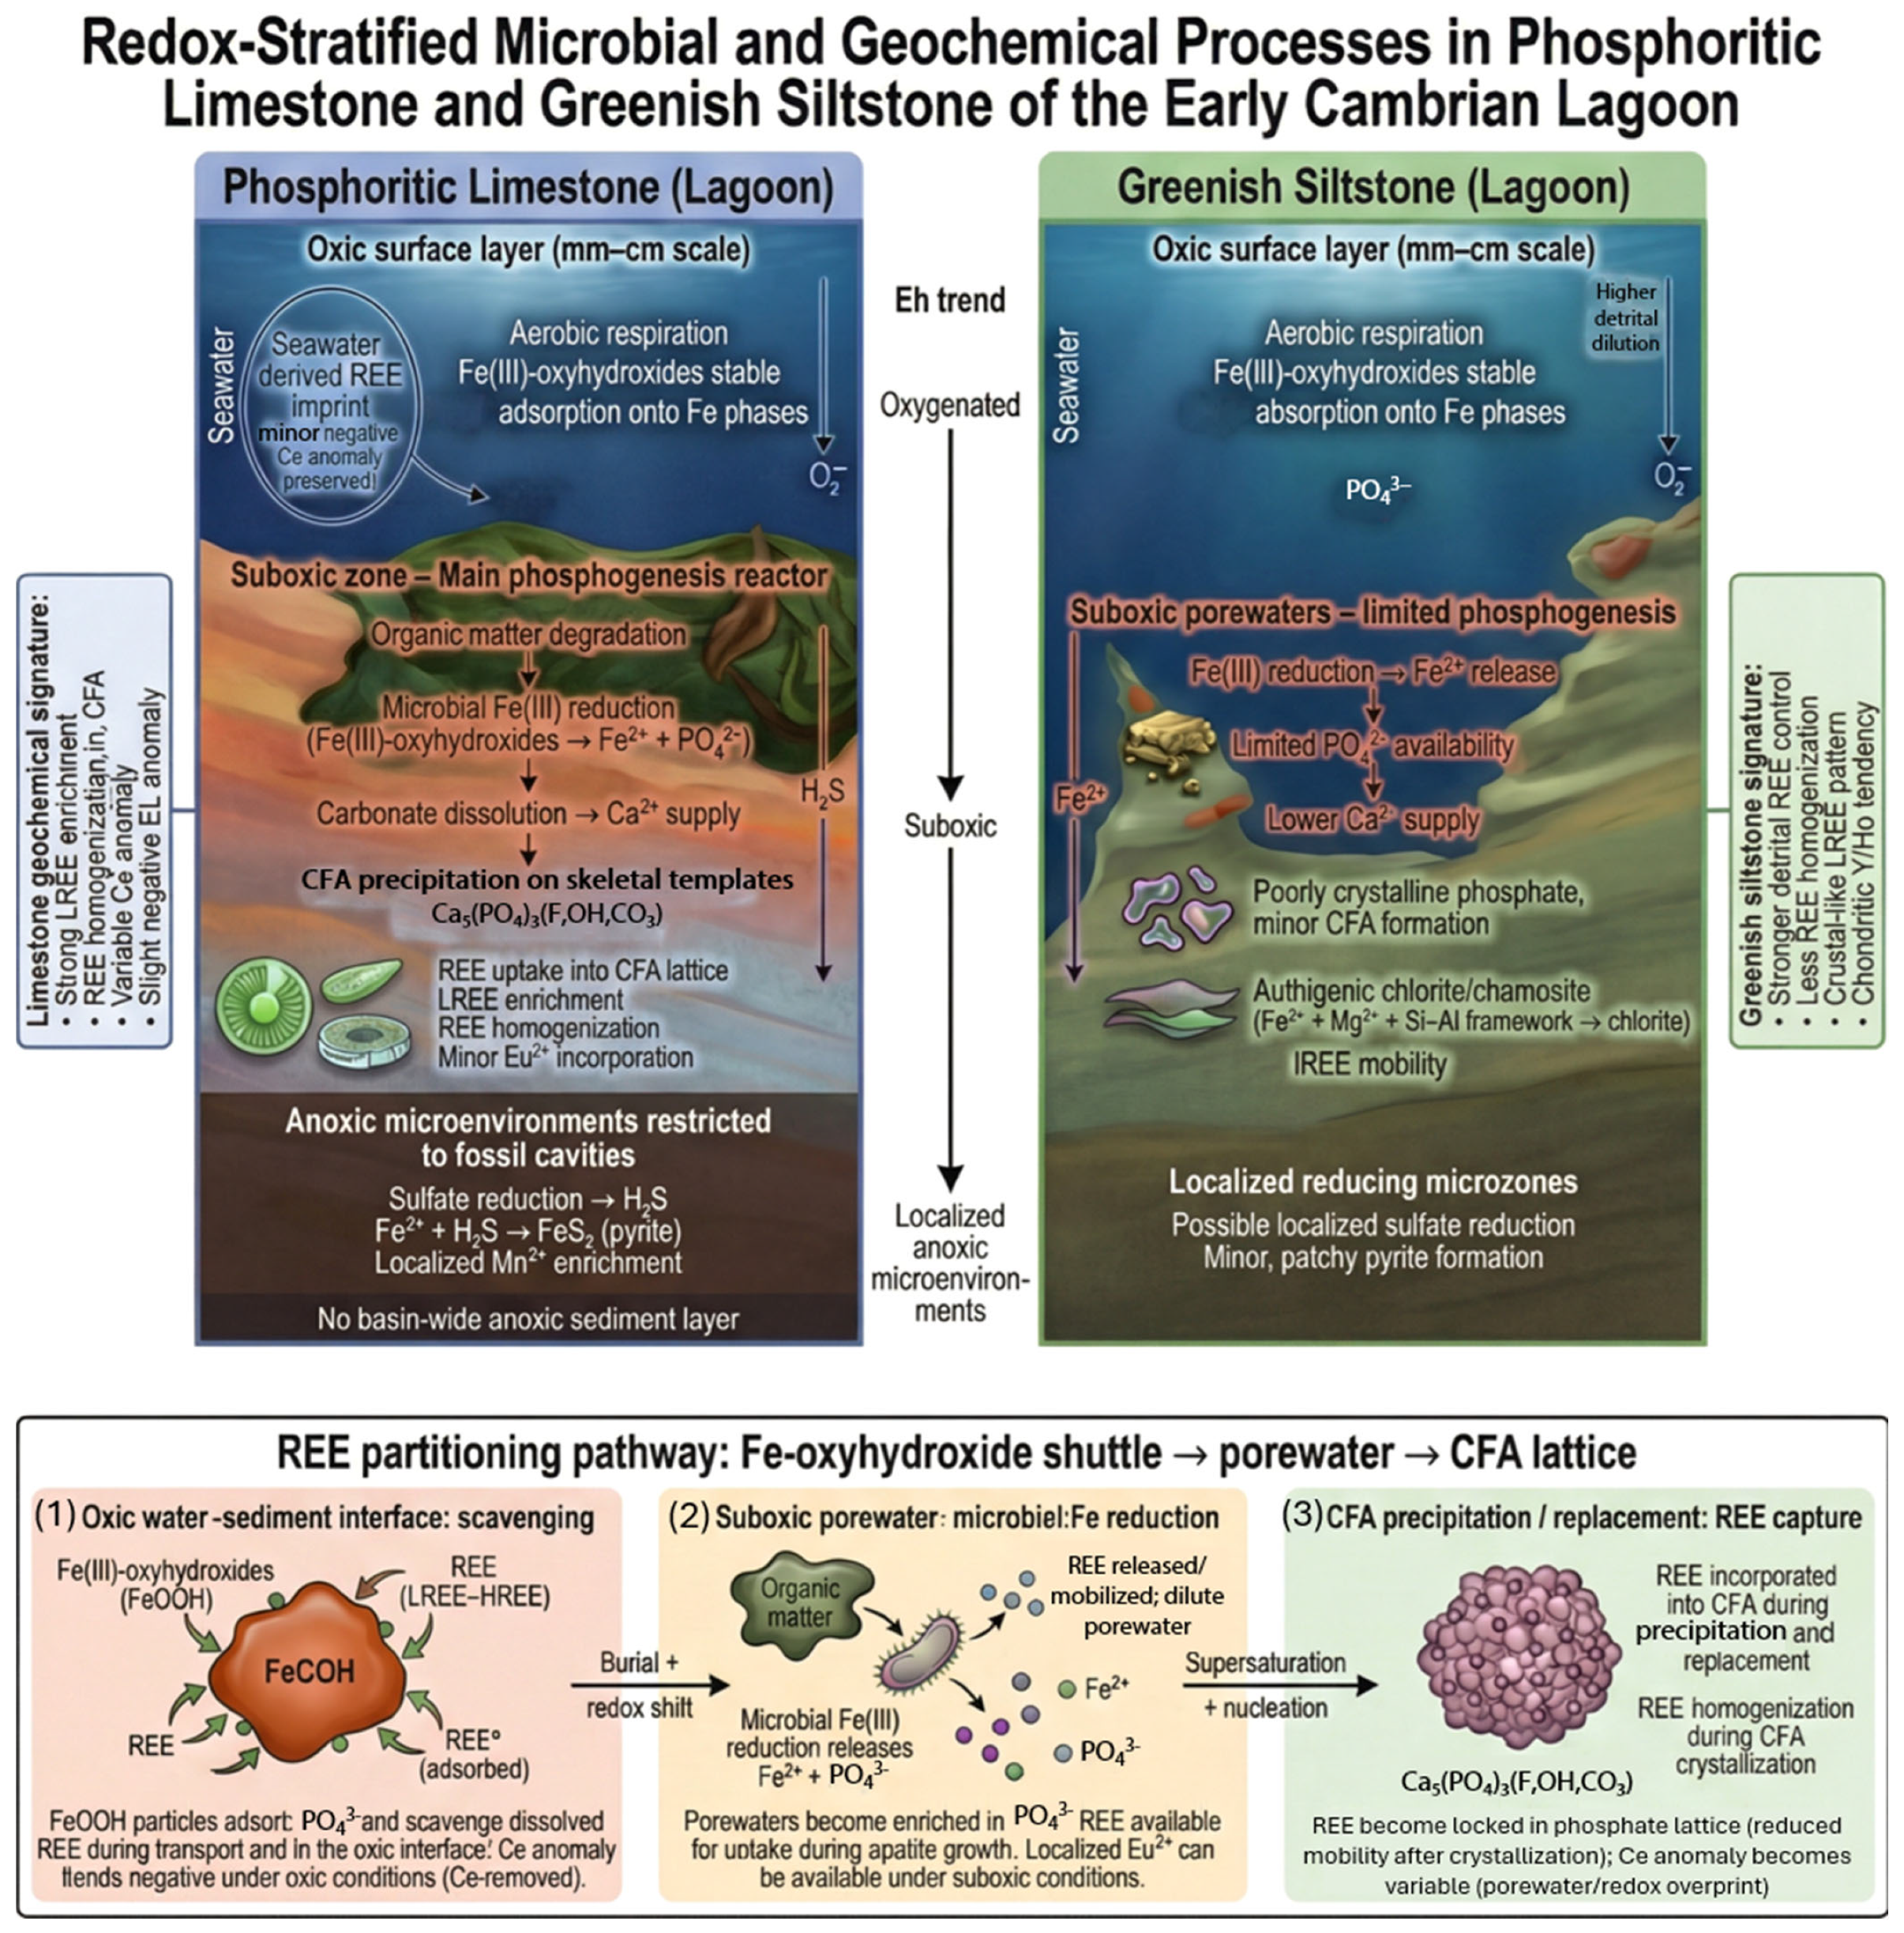
Disclaimer/Publisher’s Note: The statements, opinions and data contained in all publications are solely those of the individual author(s) and contributor(s) and not of MDPI and/or the editor(s). MDPI and/or the editor(s) disclaim responsibility for any injury to people or property resulting from any ideas, methods, instructions or products referred to in the content. |
© 2026 by the authors. Licensee MDPI, Basel, Switzerland. This article is an open access article distributed under the terms and conditions of the Creative Commons Attribution (CC BY) license.