Article

The Anisotropic Permeability Insights of Nano-Scale Pore Networks Evolution in the Overmature Shales

1
Qilicun Oil Production Plant, Yanchang Oilfield Co., Ltd., Yangchang 716000, China
2
Petrochemical Technology Service Branch of Liaohe Oilfield Company, PetroChina, Panjin 124010, China
3
Institute of Geomechanics, Chinese Academy of Geological Sciences, Beijing 100081, China
*
Author to whom correspondence should be addressed.
Minerals 2026, 16(3), 315; https://doi.org/10.3390/min16030315
Submission received: 5 February 2026 / Revised: 15 March 2026 / Accepted: 16 March 2026 / Published: 17 March 2026

Abstract

Permeability is affected by nanopores and pore structure, and anisotropic permeability is the result of shale lamination, orientation, and stratification of minerals. To understand the reasons for permeability anisotropy, the pore networks of over-mature shale has been studied. The mineral compositions, petrophysical properties, and pore structures of the Lower Cambrian Niutitang Formation shales were analyzed using subcritical gas adsorption, field-emission scanning electron microscopic, and X-ray micro-computed tomographic methods. Quartz, clay minerals, and carbonate are the dominant minerals in the shales. The bedding-parallel and bedding-perpendicular permeabilities are 1.25–46.21 × 10⁻² and 1.38–6.62 × 10⁻² mD, respectively. The anisotropy of permeability, which is the ratio between the bedding-parallel and bedding-perpendicular permeability, is 0.21–26.87. The micropore and Barrett–Joyner–Halenda pore volumes are 0.54–3.62 and 0.05–0.69 mL/100 g, respectively. The bedding-parallel permeability is correlated positively with the micropore and Barrett–Joyner–Halenda pore volumes. Thin-section observations indicate the shales exhibit a bedding-parallel alignment of phyllosilicate minerals and planar deformation bands. The scanning electron microscopy shows deformation of the lamination and parallel alignment of the clay minerals due to compaction or differential compaction over coarser-grained quartz grains. The scanning electron microscopy images and subcritical gas adsorption data indicate that the pore fracture system is parallel to bedding and formed after diagenesis. Furthermore, X-ray micro-computed tomographic analysis shows that the micro-fractures are also preferentially oriented, parallel to bedding.

1. Introduction

Permeability and its anisotropy are important parameters in the context of hydro-carbons production from shale, and they affect shale gas transportation from shale/mudstone to the wellbore [1]. The steady-state, pulse-decay, and pore-scale modeling methods are typically used to measure the permeability of shale [2,3,4,5], and permeability values obtained in laboratory tests vary by several orders of magnitude, from 10−17 to 10−22 m2 [6,7,8,9,10]. The anisotropy of permeability, which is the ratio between the bedding-parallel and bedding-perpendicular permeability, varies from 3 to 2500 [11,12,13].
In addition to being affected by the effective pressure, the permeability and its anisotropy are affected by the sedimentary depositional setting and diagenesis [14,15]. Differences in sediment deposition and diagenesis lead to wide variations in organic and inorganic components and their contents, mechanical and mineralogical transformations, and organic matter reactions [16,17,18]. The generation and evolution of pore networks that control the flow of shale gas are key to understanding permeability and its anisotropy.
In this paper, pore structural parameters in shale were investigated. Bedding-parallel and bedding-perpendicular permeabilities were determined using the steady-state method, and correlations between the evolution of the pore structure and anisotropy of permeability were examined.

2. Samples and Methods

2.1. Samples

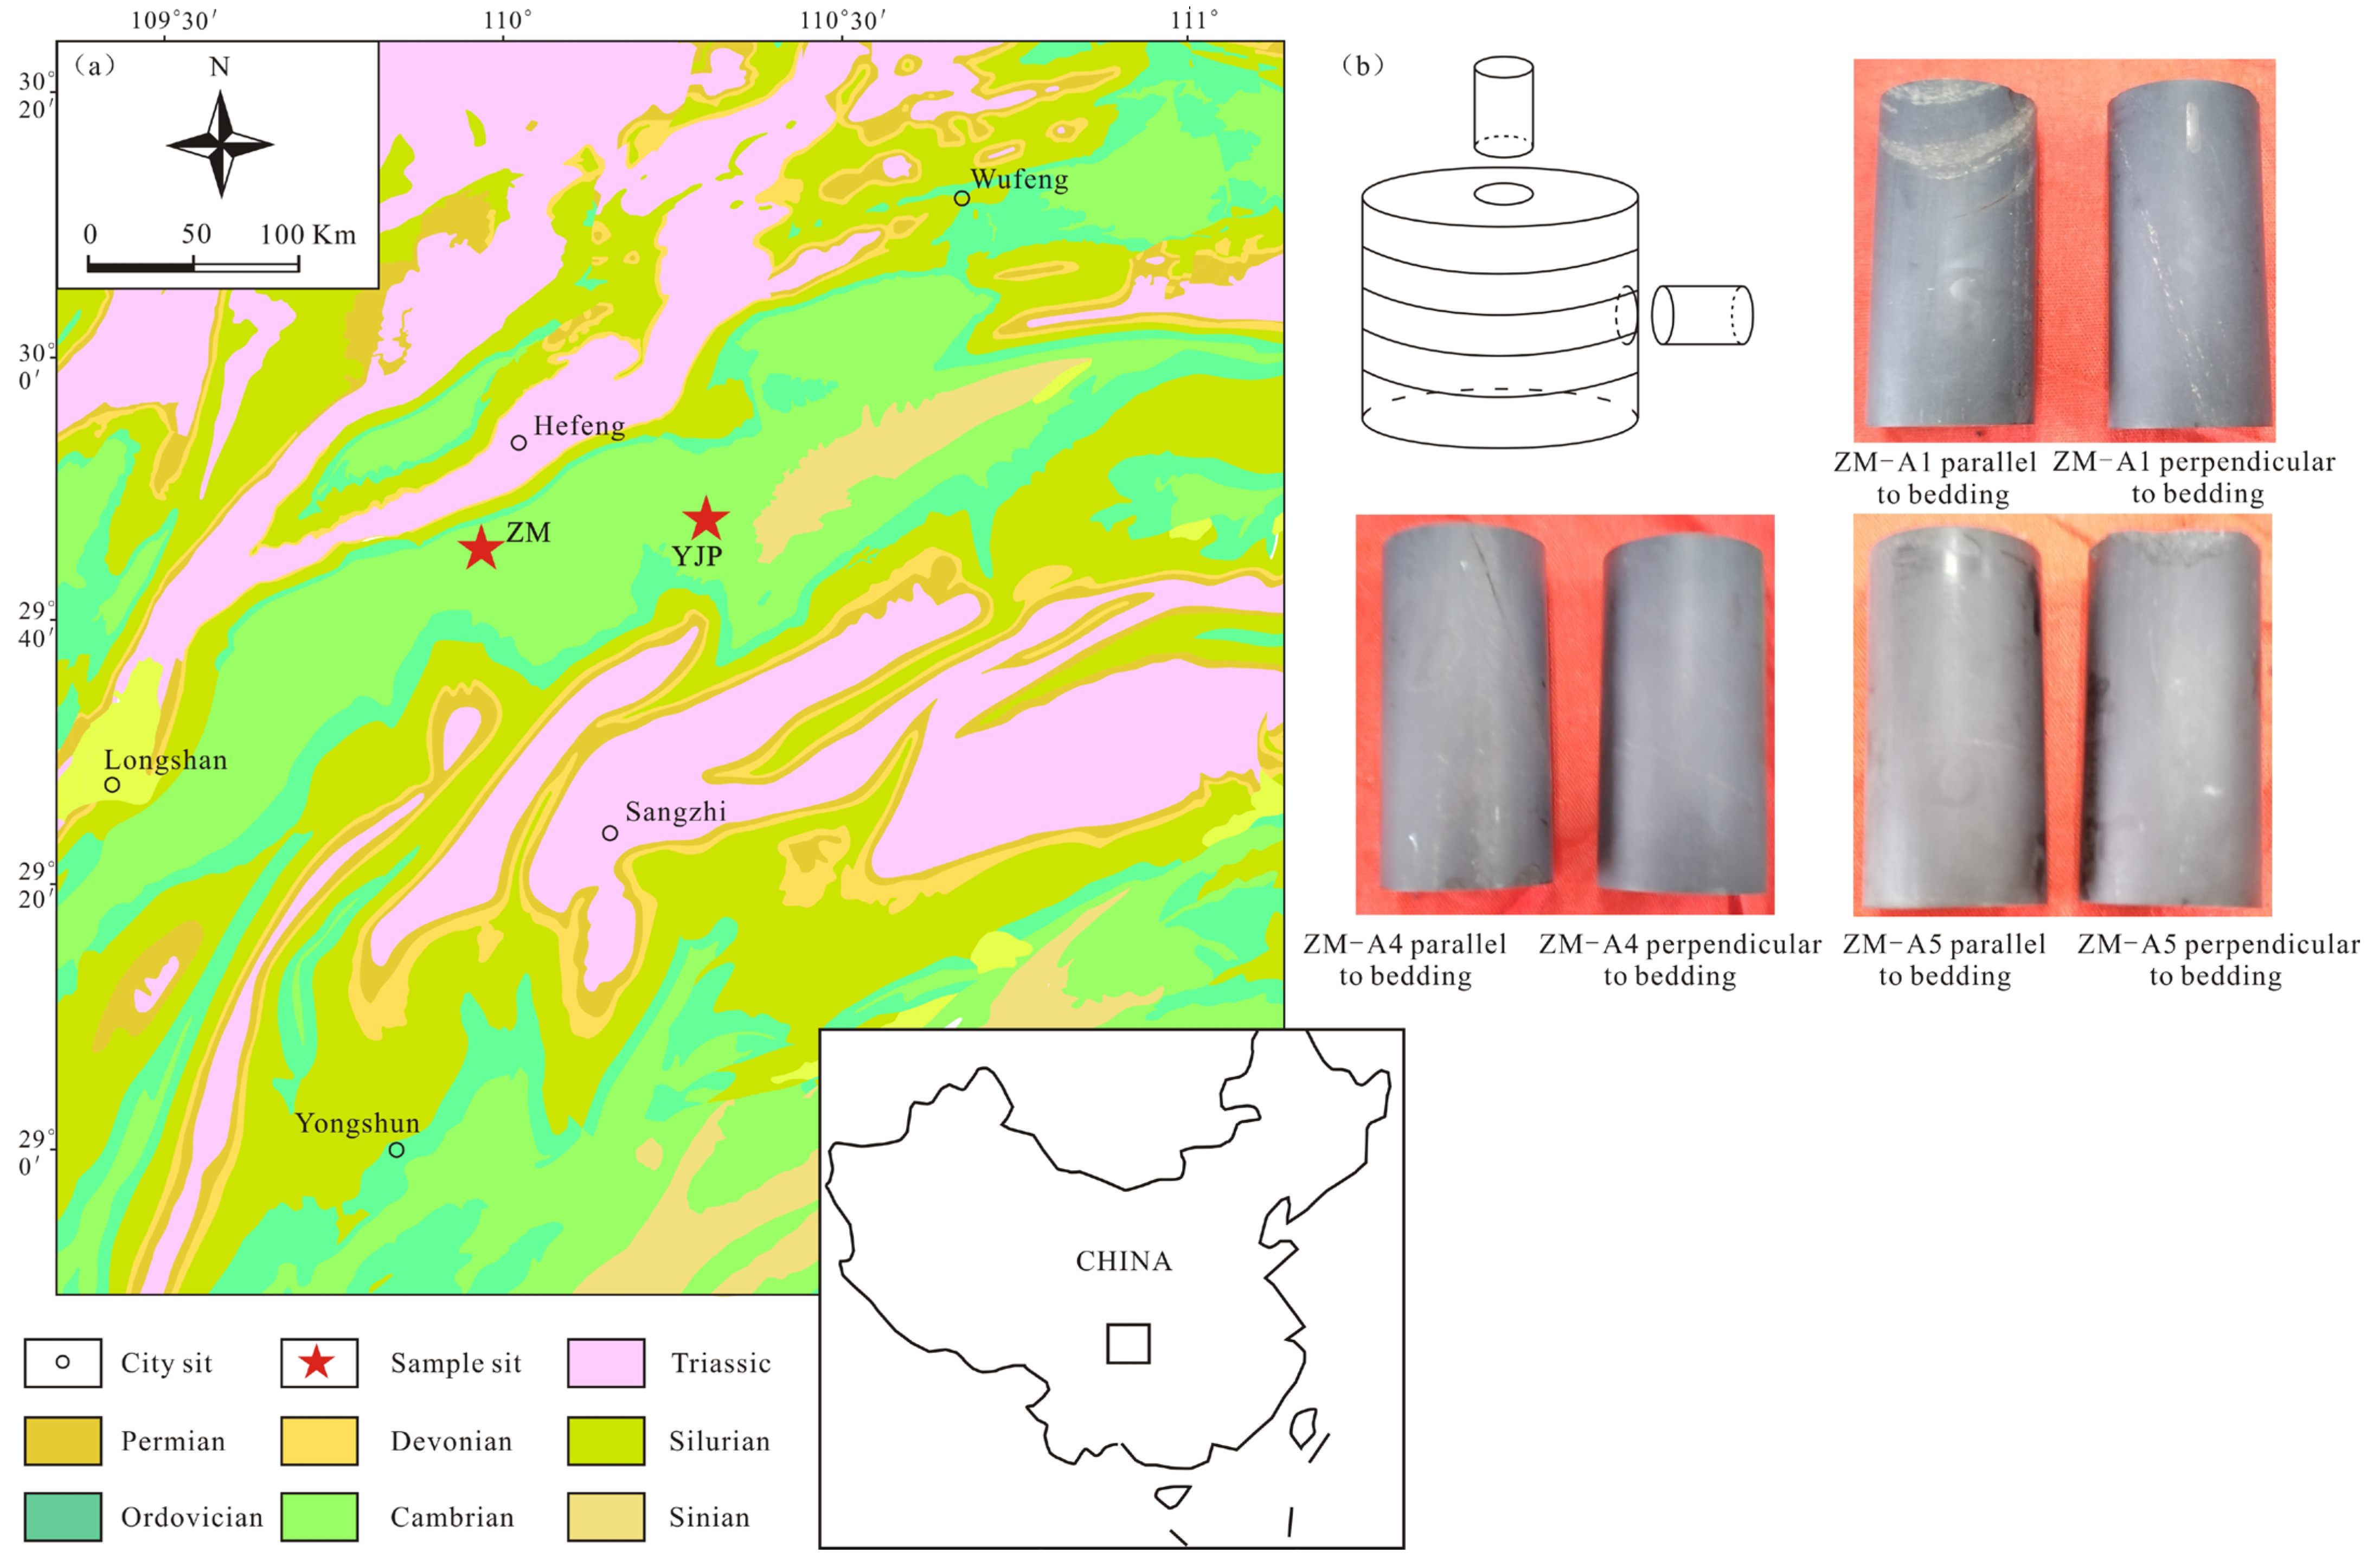
The lower Cambrian Niutitang Formation shale in China was deposited on a deep-water continental shelf, and is organic-rich and over-mature. In this study, 20 samples of shale were randomly collected from typical outcrops of the Niutitang Formation, comprising 13 samples of siliceous shale from the Zouma (ZM) out-crop section, and 7 samples of calcareous shale from the Yangjiaping (YJP) outcrop section. The ZM out-crop section is located in the Hefeng County, Hubei Province and the YJP out-crop section is located in the Sangzhi County, Hunan Province (Figure 1).
The shale samples were cylindrical drill cores with diameters and heights of 2.5 cm, which were extracted at different orientations (i.e., parallel and perpendicular to bedding) (Figure 1b). Unfortunately, only nine intact shale samples were successfully obtained, and the other samples were fragmented. Thin sections of the shale samples were cut both parallel and perpendicular to bedding.

2.2. Permeability and Mineralogical Analysis

The permeability was measured with an Ultra-PermTM 200 instrument (Ultra-PermTM 200, Core Laboratories, Houston, TX, USA) based on the steady-state method. Before the permeability measurements, the cylindrical plugs were dried for 24 h at 40 °C under vacuum. The permeability measurement procedures and parameters followed the Chinese Oil and Gas Industry Standard (SY/T) 5336-1996 [19], and the permeabilities parallel and perpendicular to the bedding were calculated using Darcy’s law. The nine samples were powdered to <200 mesh to obtain 20 g of each sample. The mineral compositions were determined with a TD-3500 X-ray diffractometer (TD-3500 XRD, Dandong Tongda Technology Co., Ltd., Dandong, China), and the mineral contents were calculated semi-quantitatively based on the areas under the major peaks.

2.3. Low-Pressure N2 and CO2 Adsorption

The nine shale samples (3–4 g of each) were degassed for 11 h at 110 °C under vacuum before the adsorption analysis. Low-pressure N2 adsorption was conducted with a Quad-rasorbTM SI Surface Area Analyzer (Quadrasorb SI, Quantachrome Instruments, Boynton Beach, FL, USA) at 77 K. The specific surface area and pore size distribution of the samples were estimated from the adsorption isotherm using the BET [20] and BJH [21] methods. The micropore surface area and volume were estimated using the Dubinin–Astakhov model based on CO2 adsorption at 273.15 K.

2.4. FE-SEM Image Method and X-Ray μ-Computed Tomography Analysis

The Ar ion-polished thin sections oriented parallel and perpendicular to bedding were observed using a Quanta FEG 450 field-emission scanning electron microscope (Quanta 450 FEG, FEI Company, Hillsboro, OR, USA). Minerals and organic matter are identified by EDS. In addition, a cylindrical plug (2 mm in diameter and 8 mm in height) was sampled from sample ZM-A3, perpendicular to bedding, after measurement of the permeability. Three-dimensional micrographs of the pore networks were obtained with a Zeiss Xradia 520 Versa X-ray micro-computed tomography instrument (Xradia 510 Versa, Carl Zeiss Company, Oberkochen, Germany) at the Key Laboratory of Shale Oil and Gas Geological Survey, Chinese Academy of Geological Sciences, Beijing, China. The three-dimensional micrographs were acquired with an X-ray source, accelerating voltage of 60 kV, and power of 5 W. The source–RA distance, detector–RA distance, and exposure time were 8.0 mm, 69.4 mm, and 3 s, respectively. The pixel size of the micrographs was 0.7 μm. The X-ray micro-computed tomography data were interpreted using Dragonfly Pro software.

3. Results

3.1. Mineralogical Compositions and Particle Alignment

The XRD analysis indicates that the clay mineral contents are 0.8%–19.7% (Table 1), lower than the contents of quartz and carbonate. The quartz contents have a wide range, from 12.4% for sample YJP-XY to 94% for sample ZM-A15. The carbonate (calcite and dolomite) contents vary from 71.4% for sample YJP-OX, to 86.8% for sample YJP-XY, and are very low in the other samples. The kaolinite relative contents vary from 2% to 30%, and the illite relative contents vary from 72% to 100%.
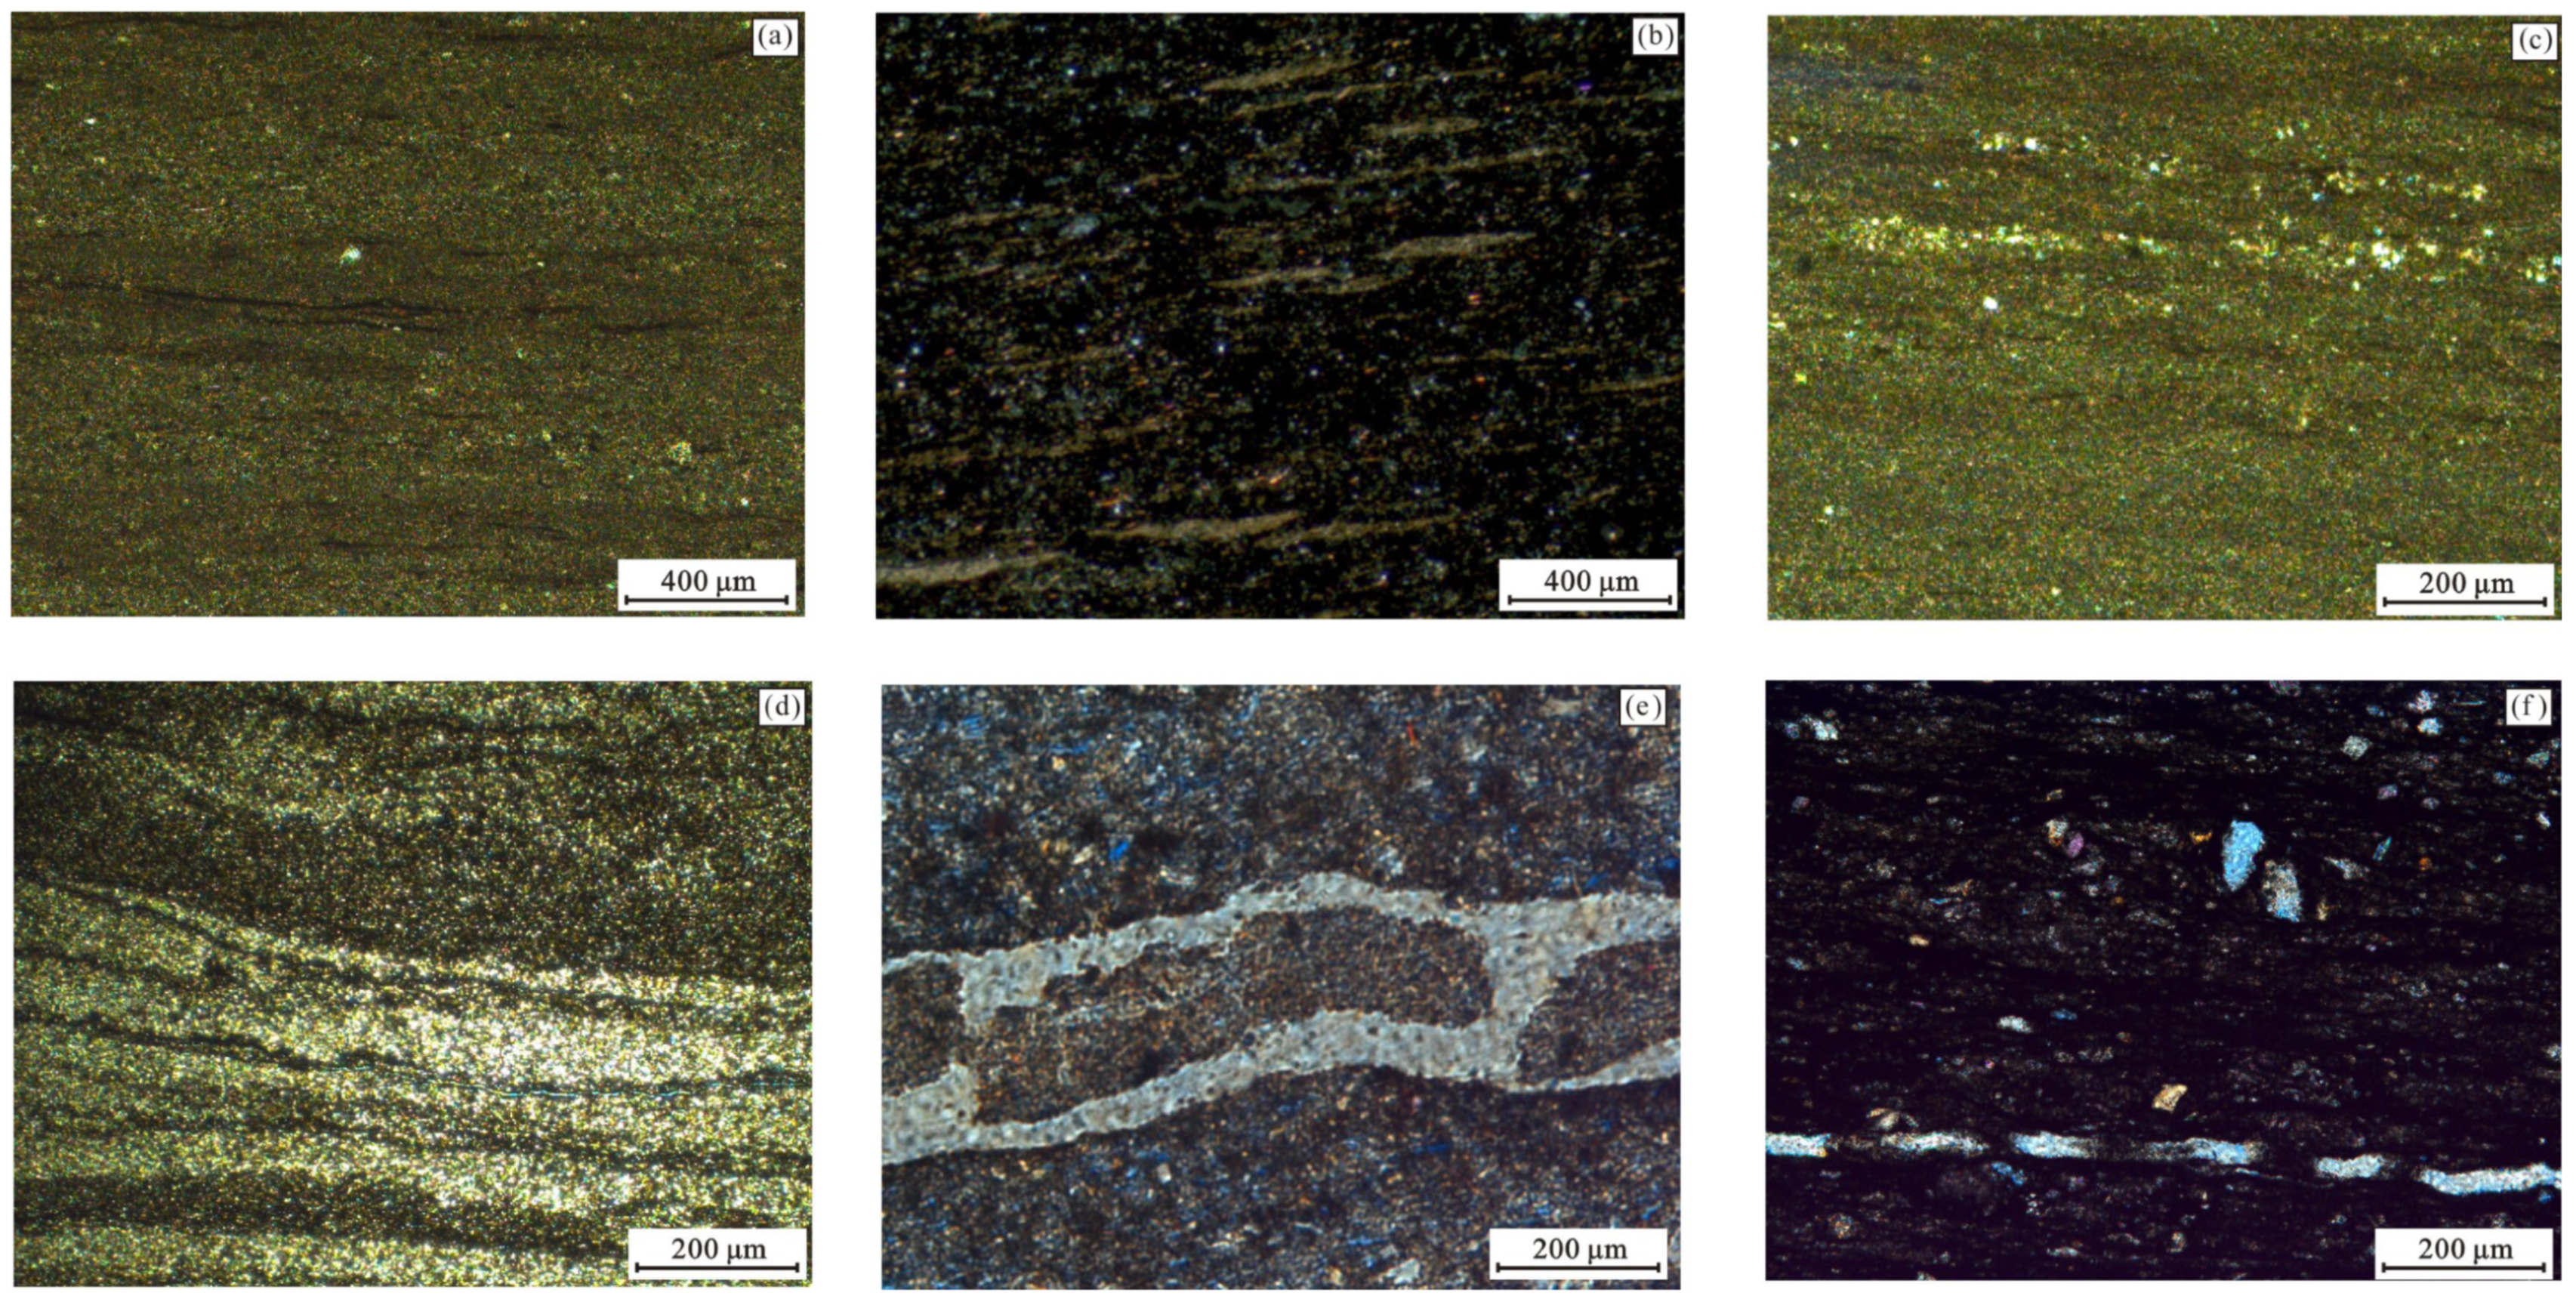
Phyllosilicate minerals are oriented parallel to bedding, and the samples contain planar deformation bands [22]. In contrast to the continuous bedding-parallel alignment of minerals in low-mature shales, the alignment in the over-mature Niuititang Formation shale is discontinuous and disrupted on the thin-section scale (Figure 2a–d). The lamination is caused by alternations in grain size and discontinuous organic matter, and lamination is enhanced by grain alignment. Over-mature shales have undergone complex post-depositional processes, including intense mechanical and chemical diagenesis. The lamination could be discontinuous and disrupted, resulting from the later diagenetic processes. The deformation bands in the samples are broadly sub-parallel to bedding, but sub-deformation bands vary in orientation and commonly intersect each other (Figure 2e,f).

3.2. Pore Microstructure and Anisotropic Permeability

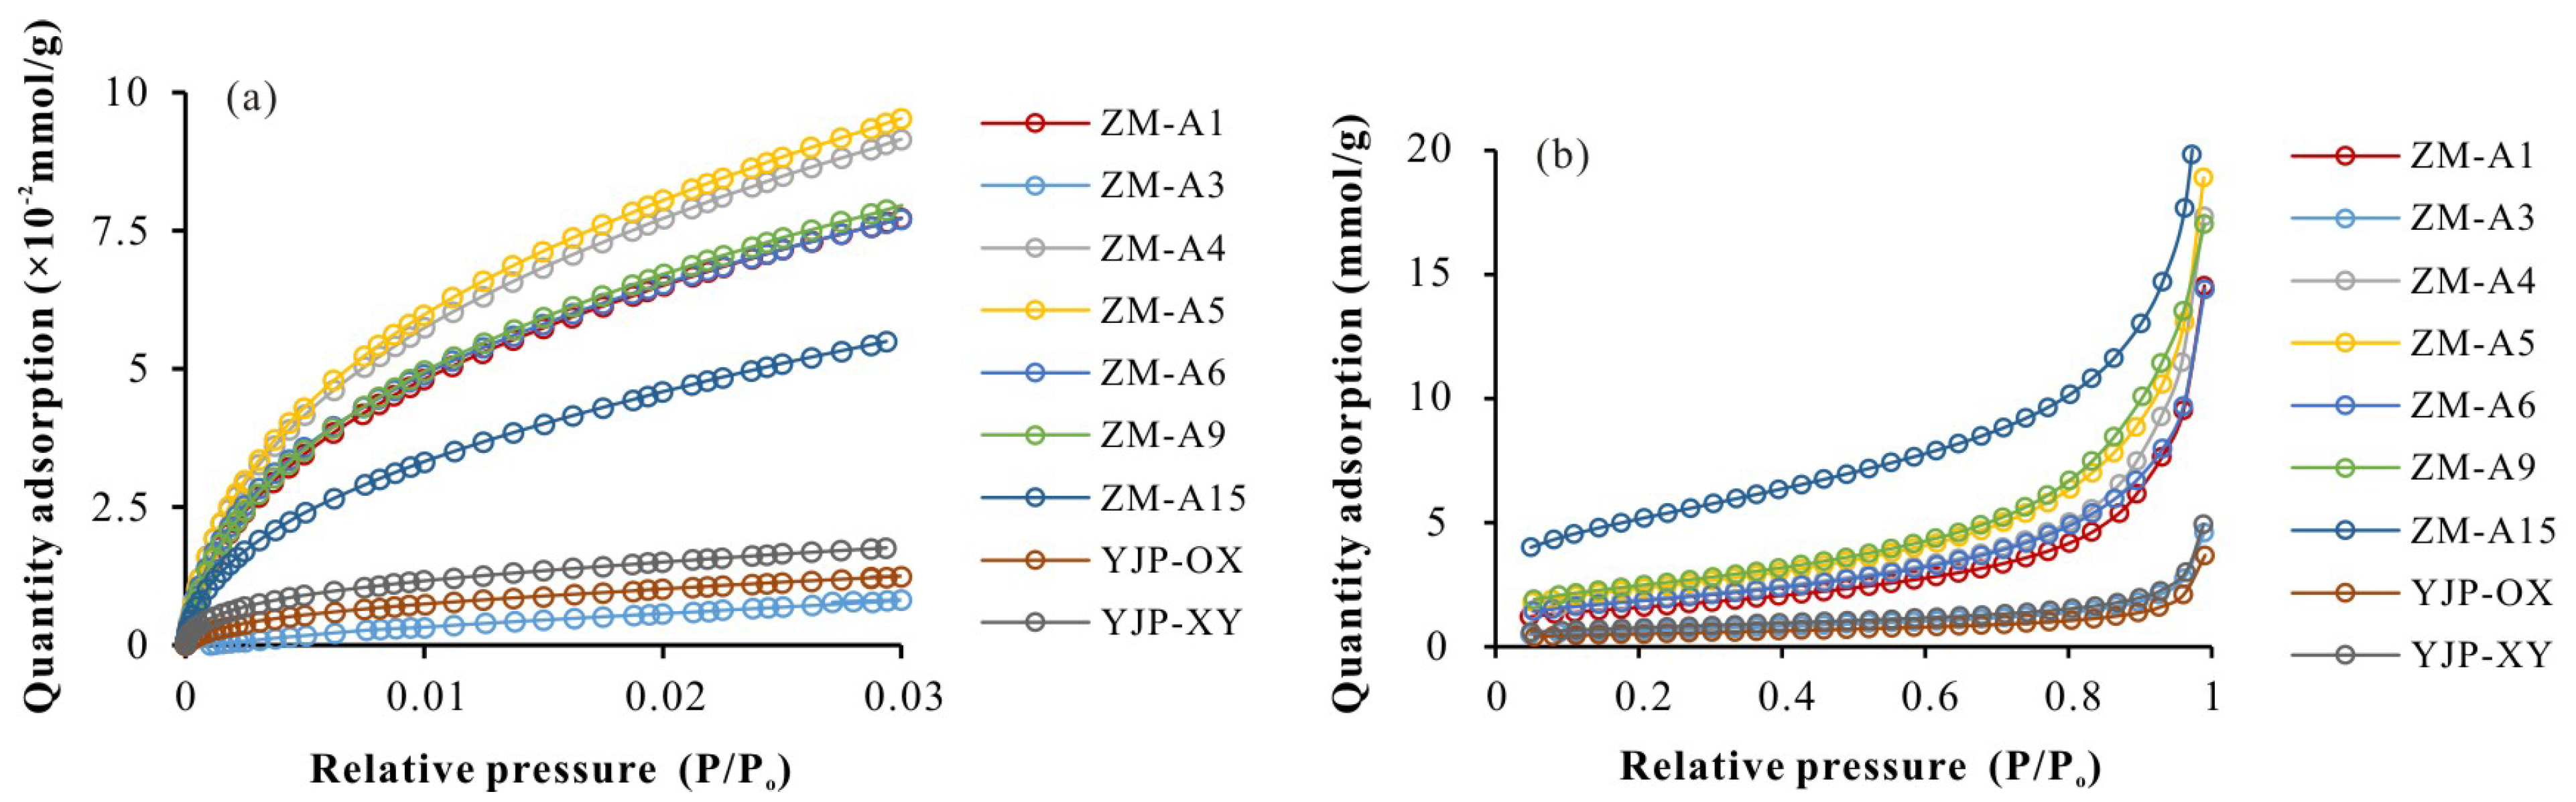
The low-pressure CO2 adsorption and N2 adsorption/desorption isotherms of the studied Cambrian over-mature shales are shown in Figure 3. All the CO2 adsorption isotherms are type I (Figure 3a), suggesting that micropores are dominant in the pore networks [23]. All the isotherms exhibit hysteresis loops, but with no limiting uptake at higher relative pressures based on the IUPAC classification (Figure 3b). The N2 adsorption varies between 4 and 17 mL/g at P/Po~1. The hysteresis loops are type III, indicative of slit-shaped pores formed within aggregates of plate-like particles.
The specific surface area (SBET) and pore volume (VBJH) calculated using the N2 ad-sorption isotherms with the BET and BJH models are 1.83–18.14 m2/g and 0.54–3.62 mL/100 g, respectively (Table 2). The micropore surface area (Smic) and volume (Vmic) determined using the CO2 adsorption isotherms and Dubinin–Astakhov model are 1.32–17.32 m2/g and 0.05–0.69 mL/100g, respectively. The calcareous shales (samples YJP-OX and YJP-XY) have a lower pore volume of micropores, mesopores, and macropores than the siliceous shales (i.e., the Zouma section samples).
The permeability parallel to bedding (KH) is 1.25–46.21 × 10⁻² mD, and permeability perpendicular to bedding (KV) is 1.38–6.62 × 10⁻² mD (Table 3). The bedding-parallel permeability is commonly one order of magnitude higher than the bedding-perpendicular permeability in the siliceous shales, whereas the opposite is the case for the calcareous shales.
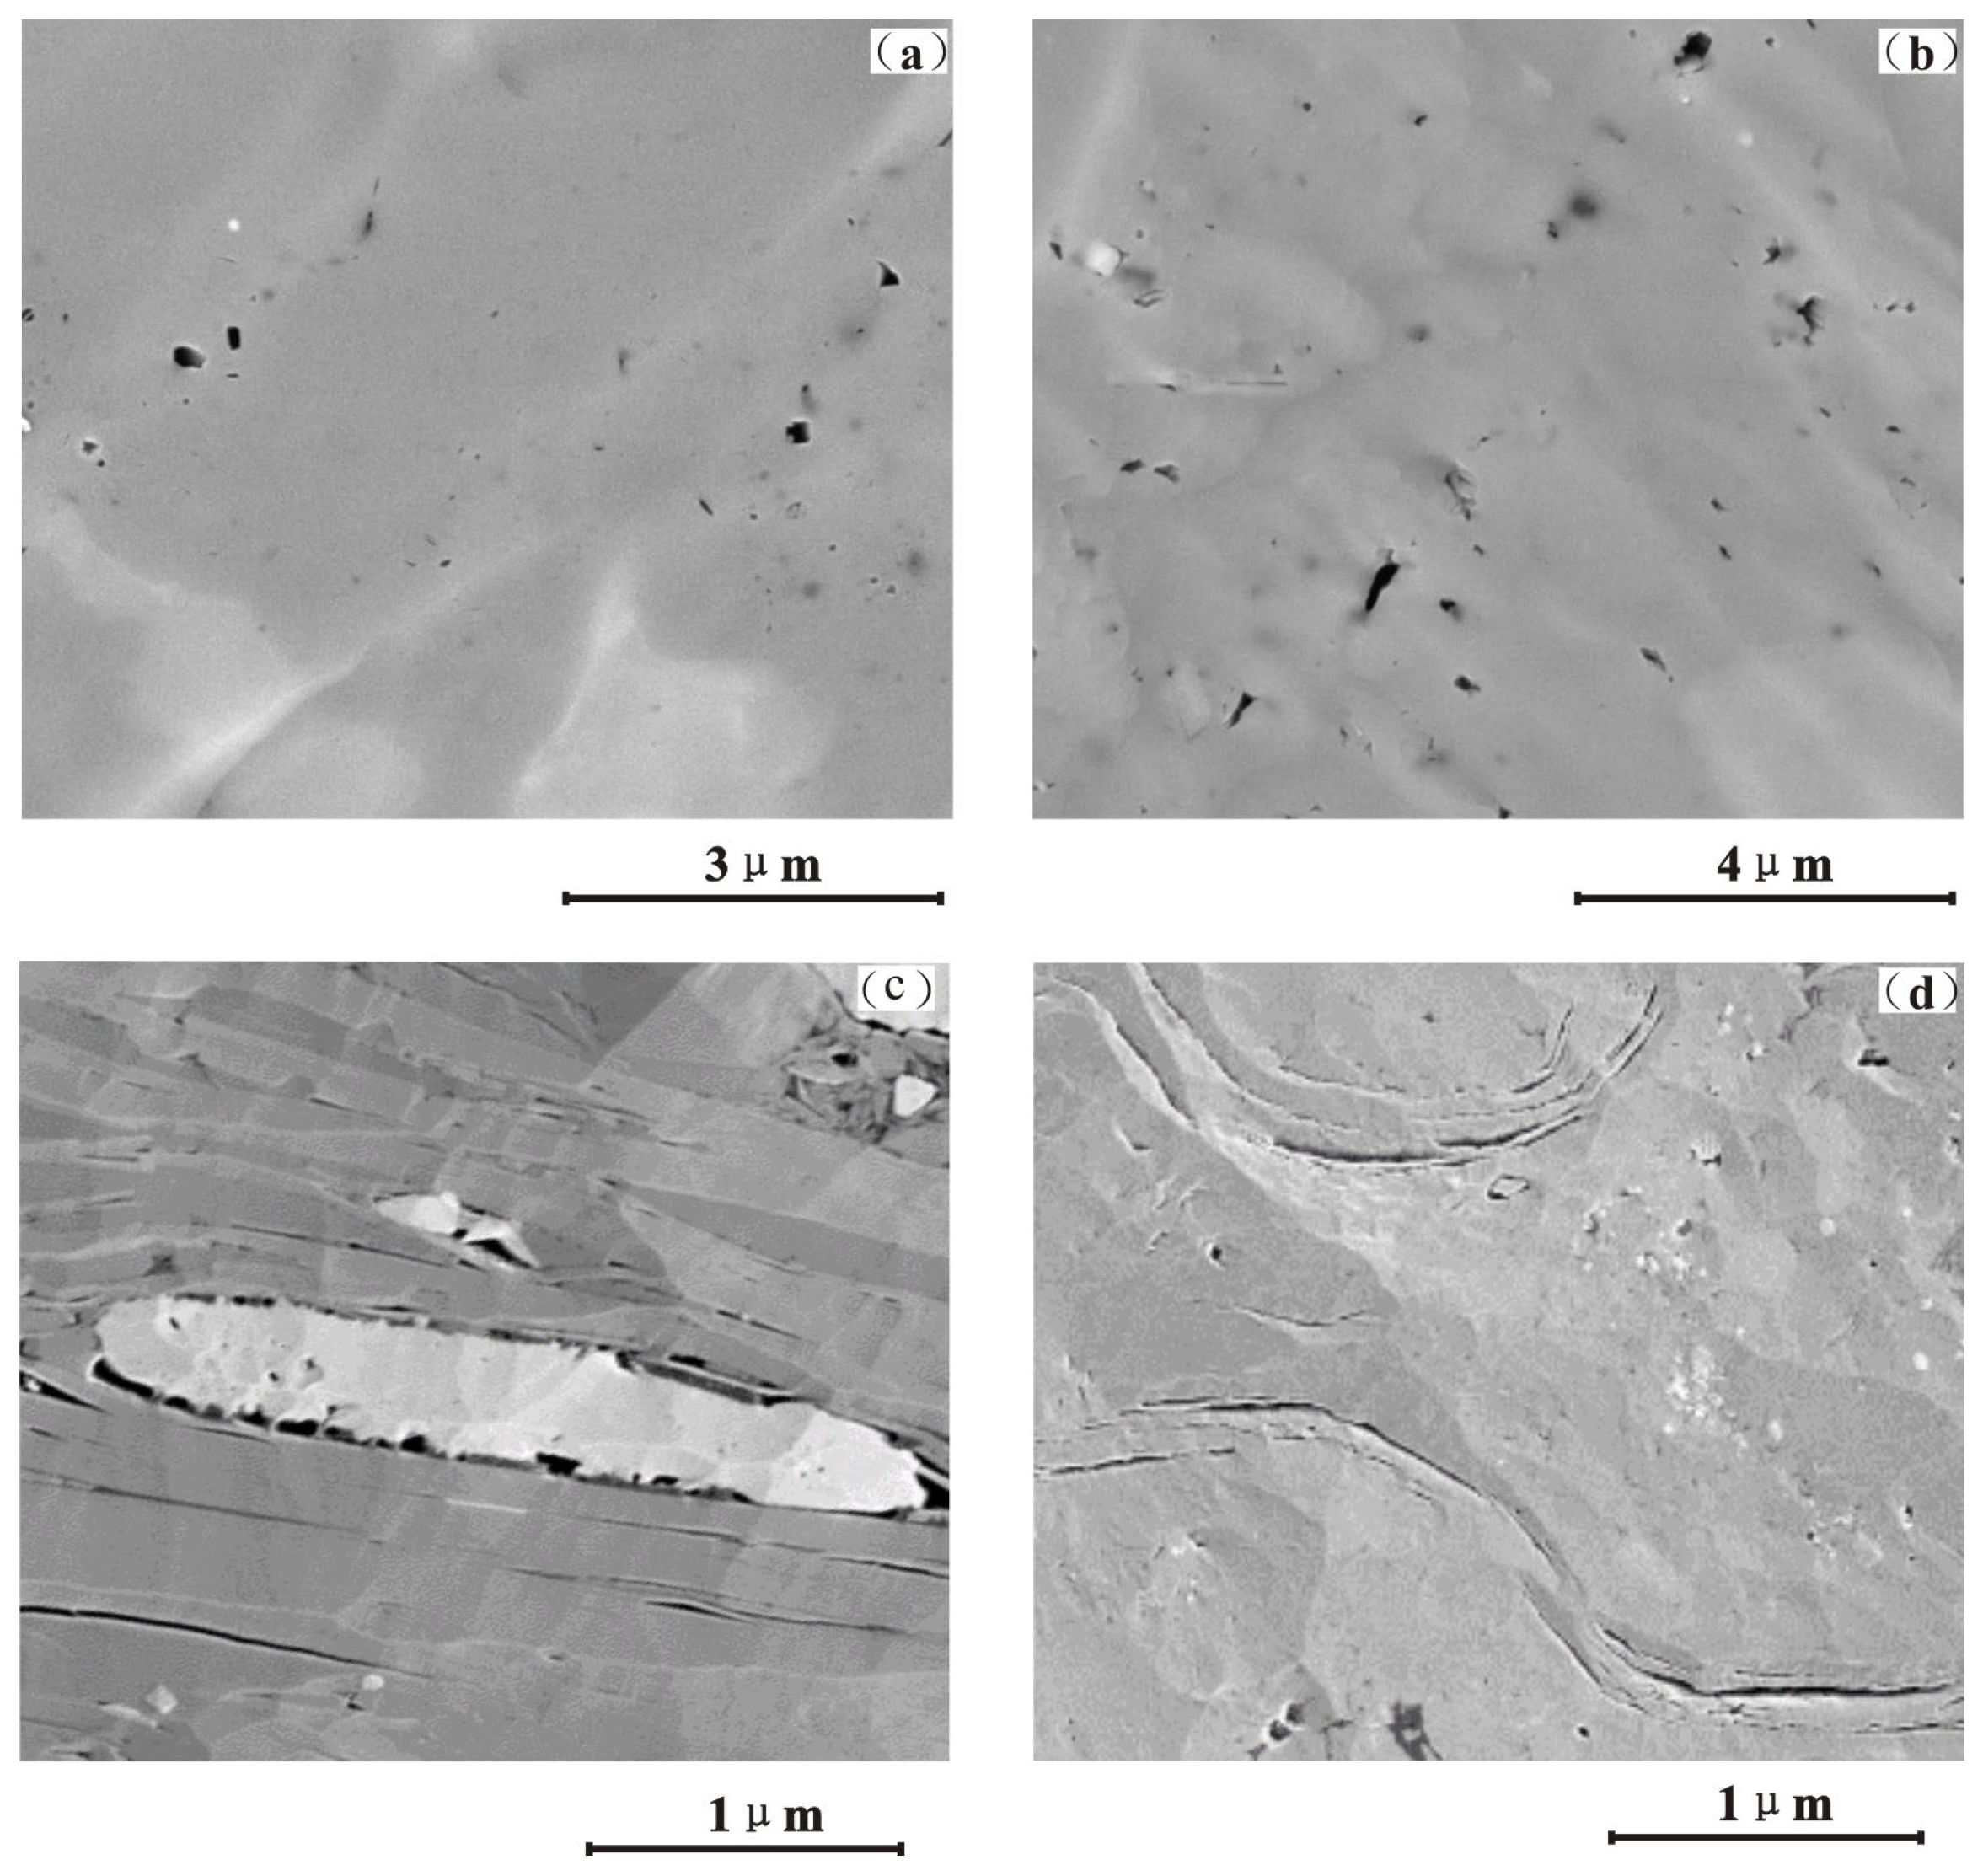
The FE-SEM images indicate that intragranular pores and bedding-perpendicular micro-fractures are dominant in the calcareous shales (Figure 4). The heterogeneity of the pore fracture networks results in a poor sorting coefficient for the pore throats [15], but the bedding-perpendicular micro-fractures control the permeability perpendicular to bedding in the calcareous shales. The ratio between the bedding-parallel and bedding perpendicular permeability (KH/KV), which is the anisotropy of permeability [14], is 0.21–26.87. The anisotropy of permeability of the calcareous shales is lower than that of the siliceous shales.

4. Discussion

The matrix-related pores include interparticle, intraparticle, organic matter, and fracture pores, based on the pore-type classification of shales [18]. FE-SEM images provide qualitative information regarding the mineral fabric, as well as the pore size and morphology [24]. The FE-SEM images of the Niutitang Formation over-mature shales were also used to examine the orientation of the shale micro-textures.
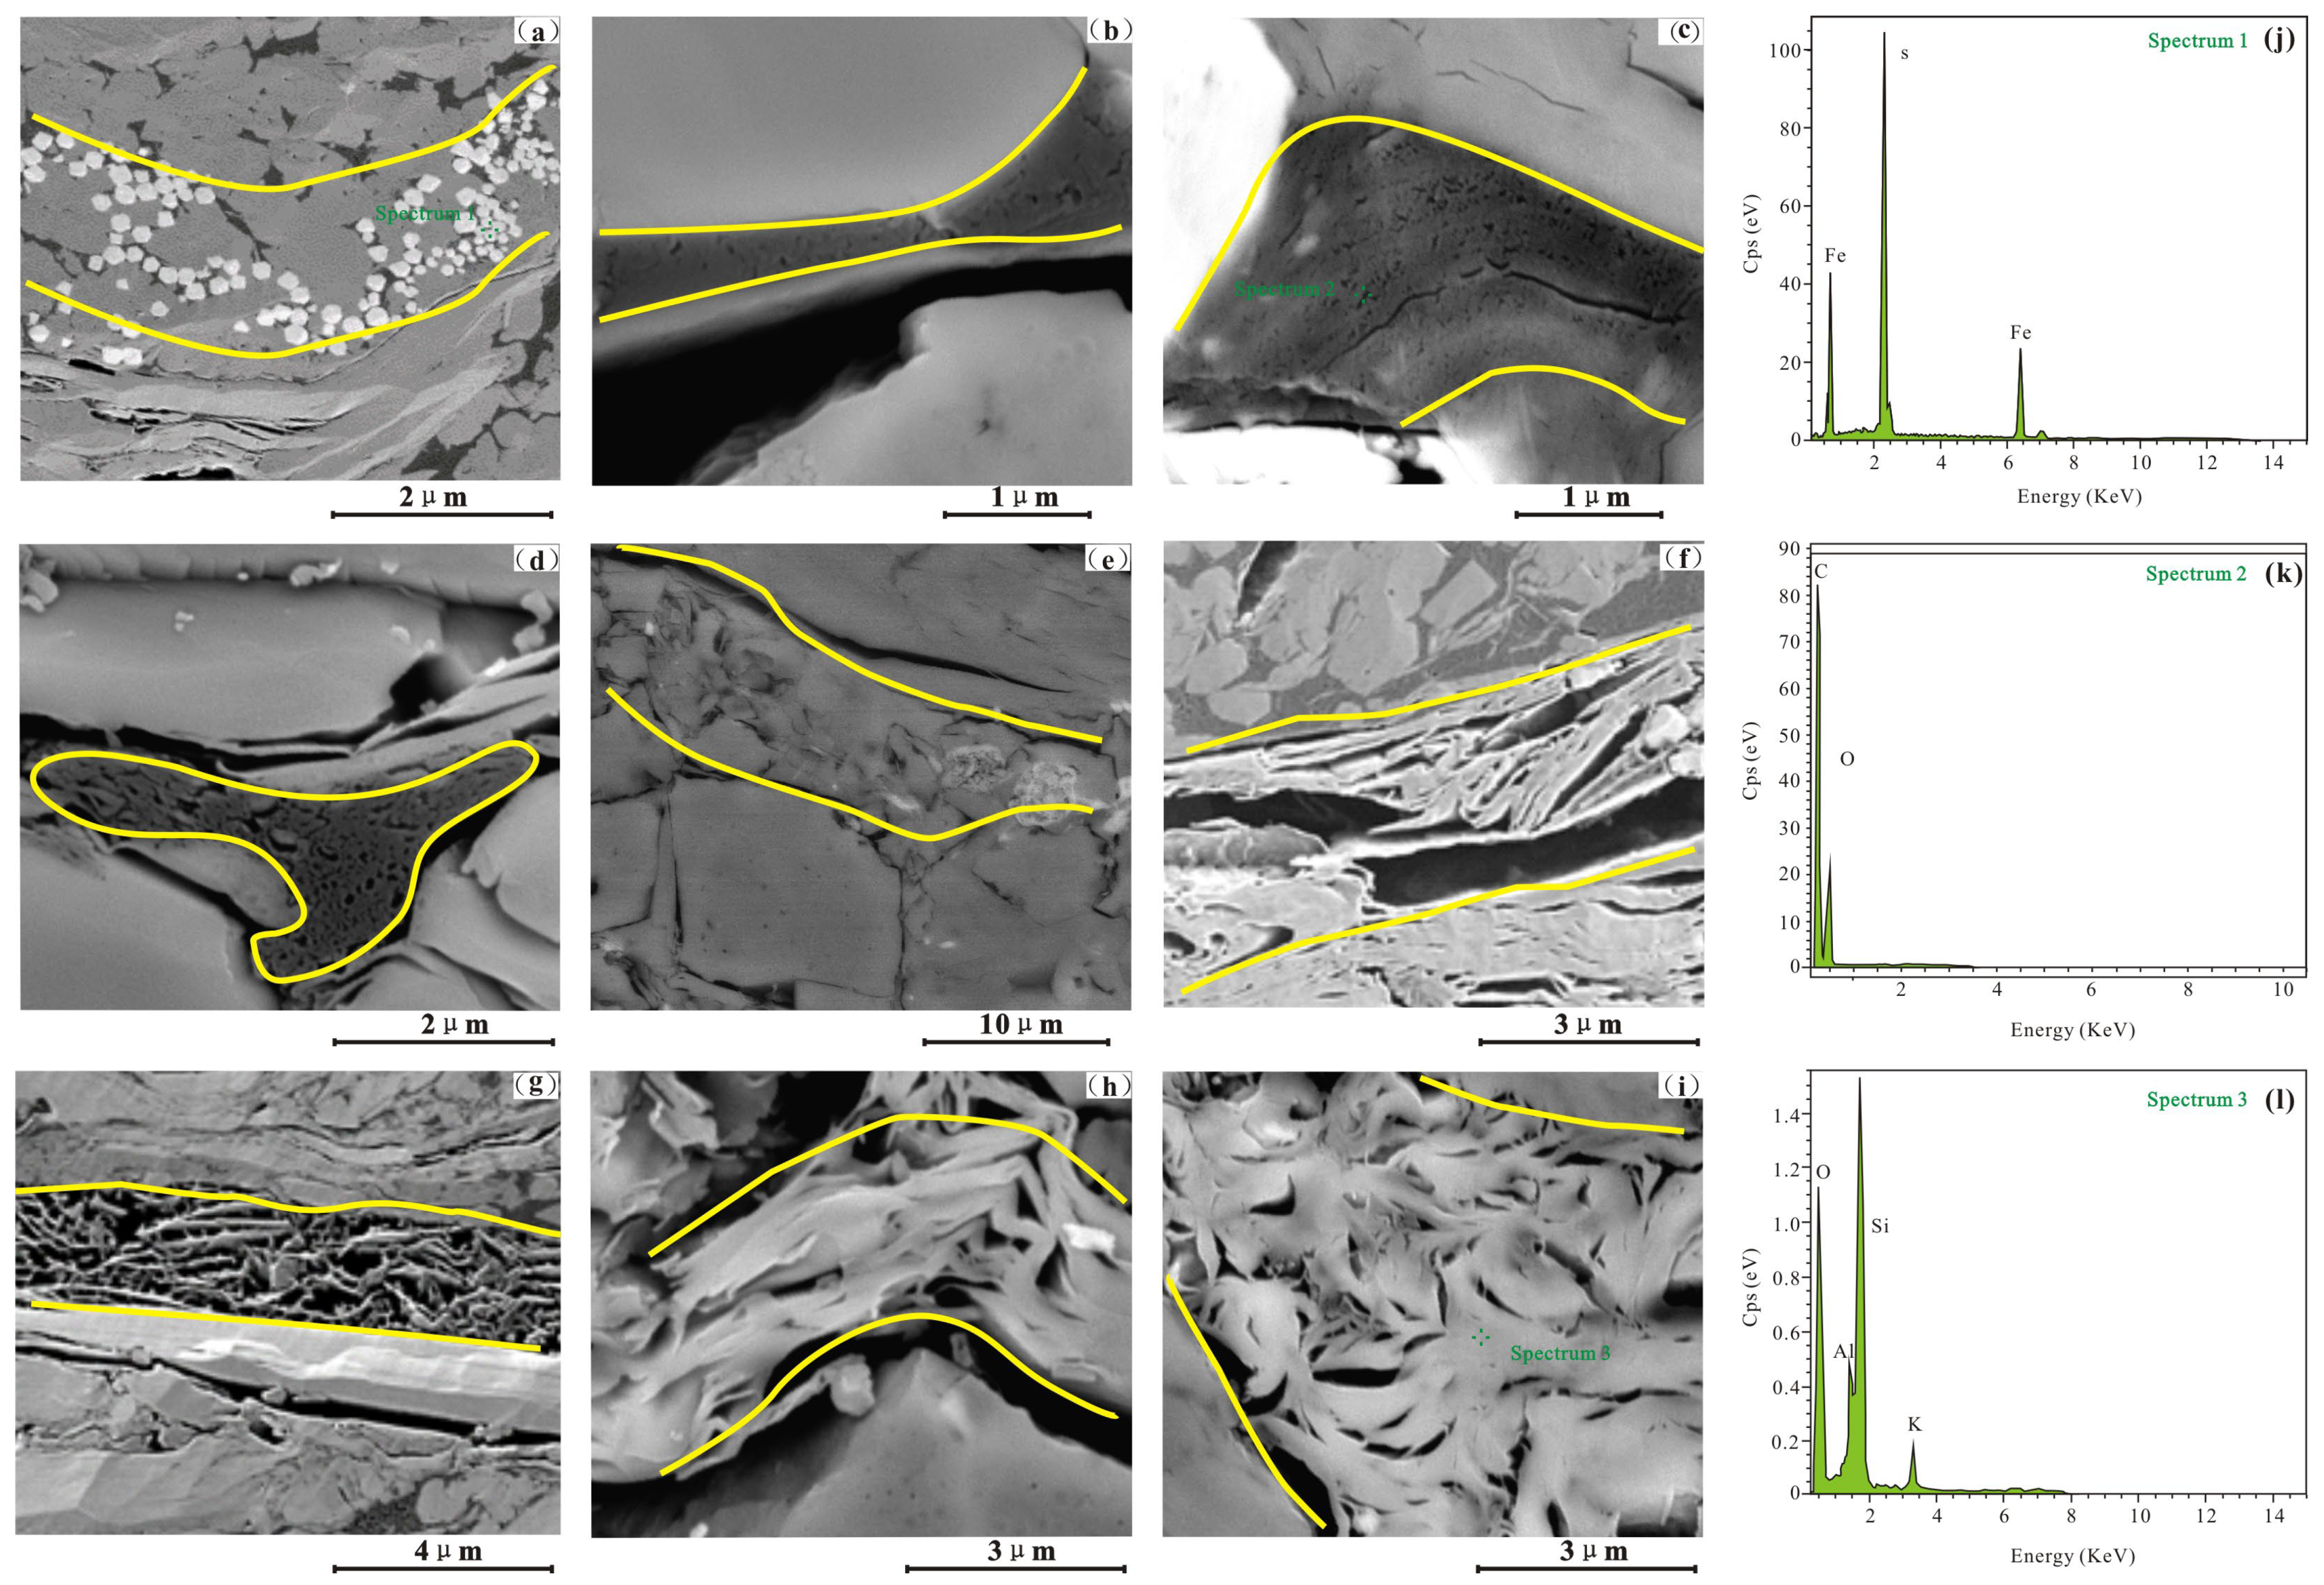
Intraparticle pores, particularly those in clay minerals, are (sub-)parallel to bedding in immature shales [25]. With increasing diagenesis, matrix grains exhibit a preferred orientation. The pyrite grains of this study form discontinuous clusters parallel to bedding (Figure 5a), which is identified by EDS (Figure 5j); the quartz grains are also oriented parallel to bedding due to deposition and diagenesis (Figure 5e). With increasing cementation and compaction, the rearrangement of ductile clay minerals is complex. The clay minerals, identified by EDS (Figure 5k), exhibit a preferred orientation parallel to bedding, because of the absence of rigid particles (Figure 5g) and, in some cases, the clay mineral sheets are parallel to each other, forming clusters of clay platelets that intersect bedding at a specific angle (Figure 5f). The clay minerals in the over-mature shales can be kinked around rigid particles (Figure 5h) or form clusters of flocculated clay minerals between rigid particles that are sub-parallel to bedding (Figure 5i). Due to diagenesis, the elongated intraparticle and interparticle pores related to clay minerals occur along the cleavage, parallel to the bedding pore networks [25]. The intraparticle pores in clay minerals and interparticle pores between clay minerals and quartz are deformed around the rigid grains.
Organic matter is randomly scattered throughout the shale samples (Figure 5b), which is identified by EDS (Figure 5l). The organic matter has undergone compaction and deformation, and is slightly deformed around the surrounding rigid particles, such as quartz and carbonate (Figure 5c,d). Bubble-like pores occur in the organic matter. Ambrose et al. [26] and Wan et al. [27] noted that organic matter pores in shale are oriented and form networks parallel to bedding.
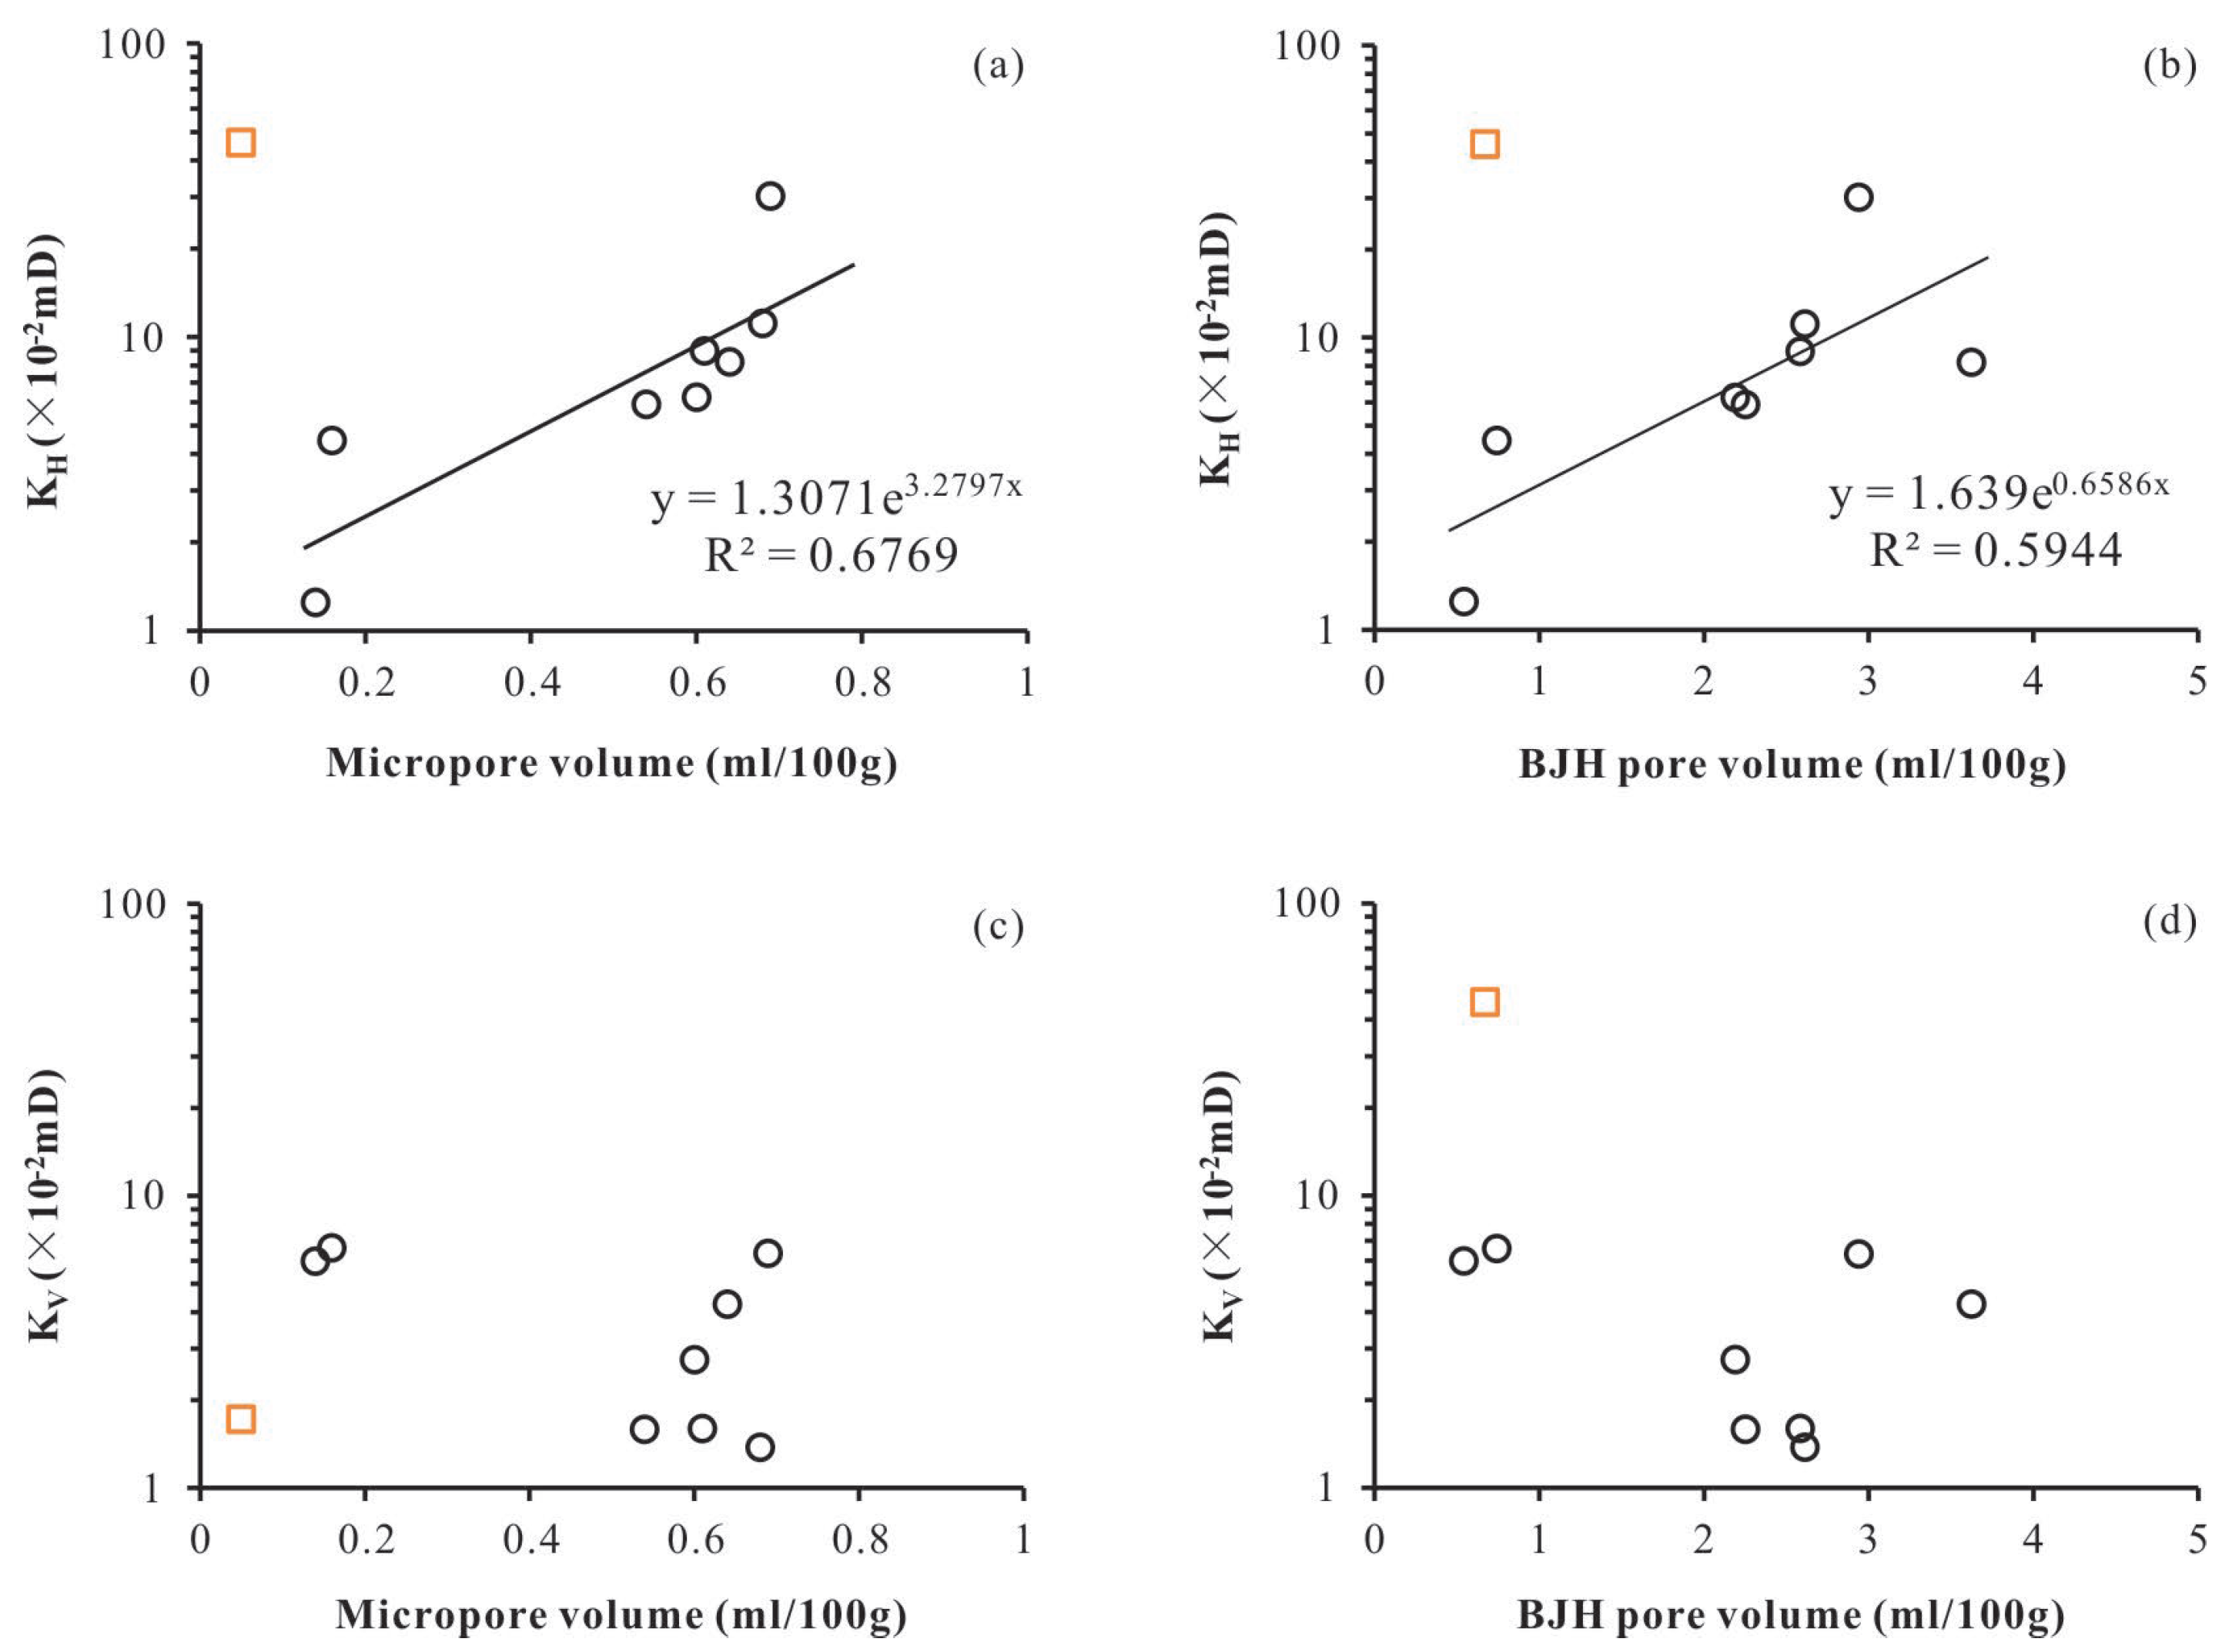
The correlations between pore structure parameters and permeability anisotropy are further discussed (Figure 6). The bedding-parallel permeability correlated positively with the micropore and BJH pore volumes, except for sample ZM-A3, whereas the bedding-perpendicular permeability exhibits no significant correlations with the micropore and BJH pore volumes. The correlations suggest that the bedding-parallel permeability results from the preferred bedding-parallel alignment of micropores, mesopores, and some macropores. Sample ZM-A3 has a smaller micropore volume (0.05 mL/100 g) and BJH pore volume (0.67 mL/100 g) compared with the other samples but has the highest bedding-parallel permeability (46.21 × 10⁻² mD).
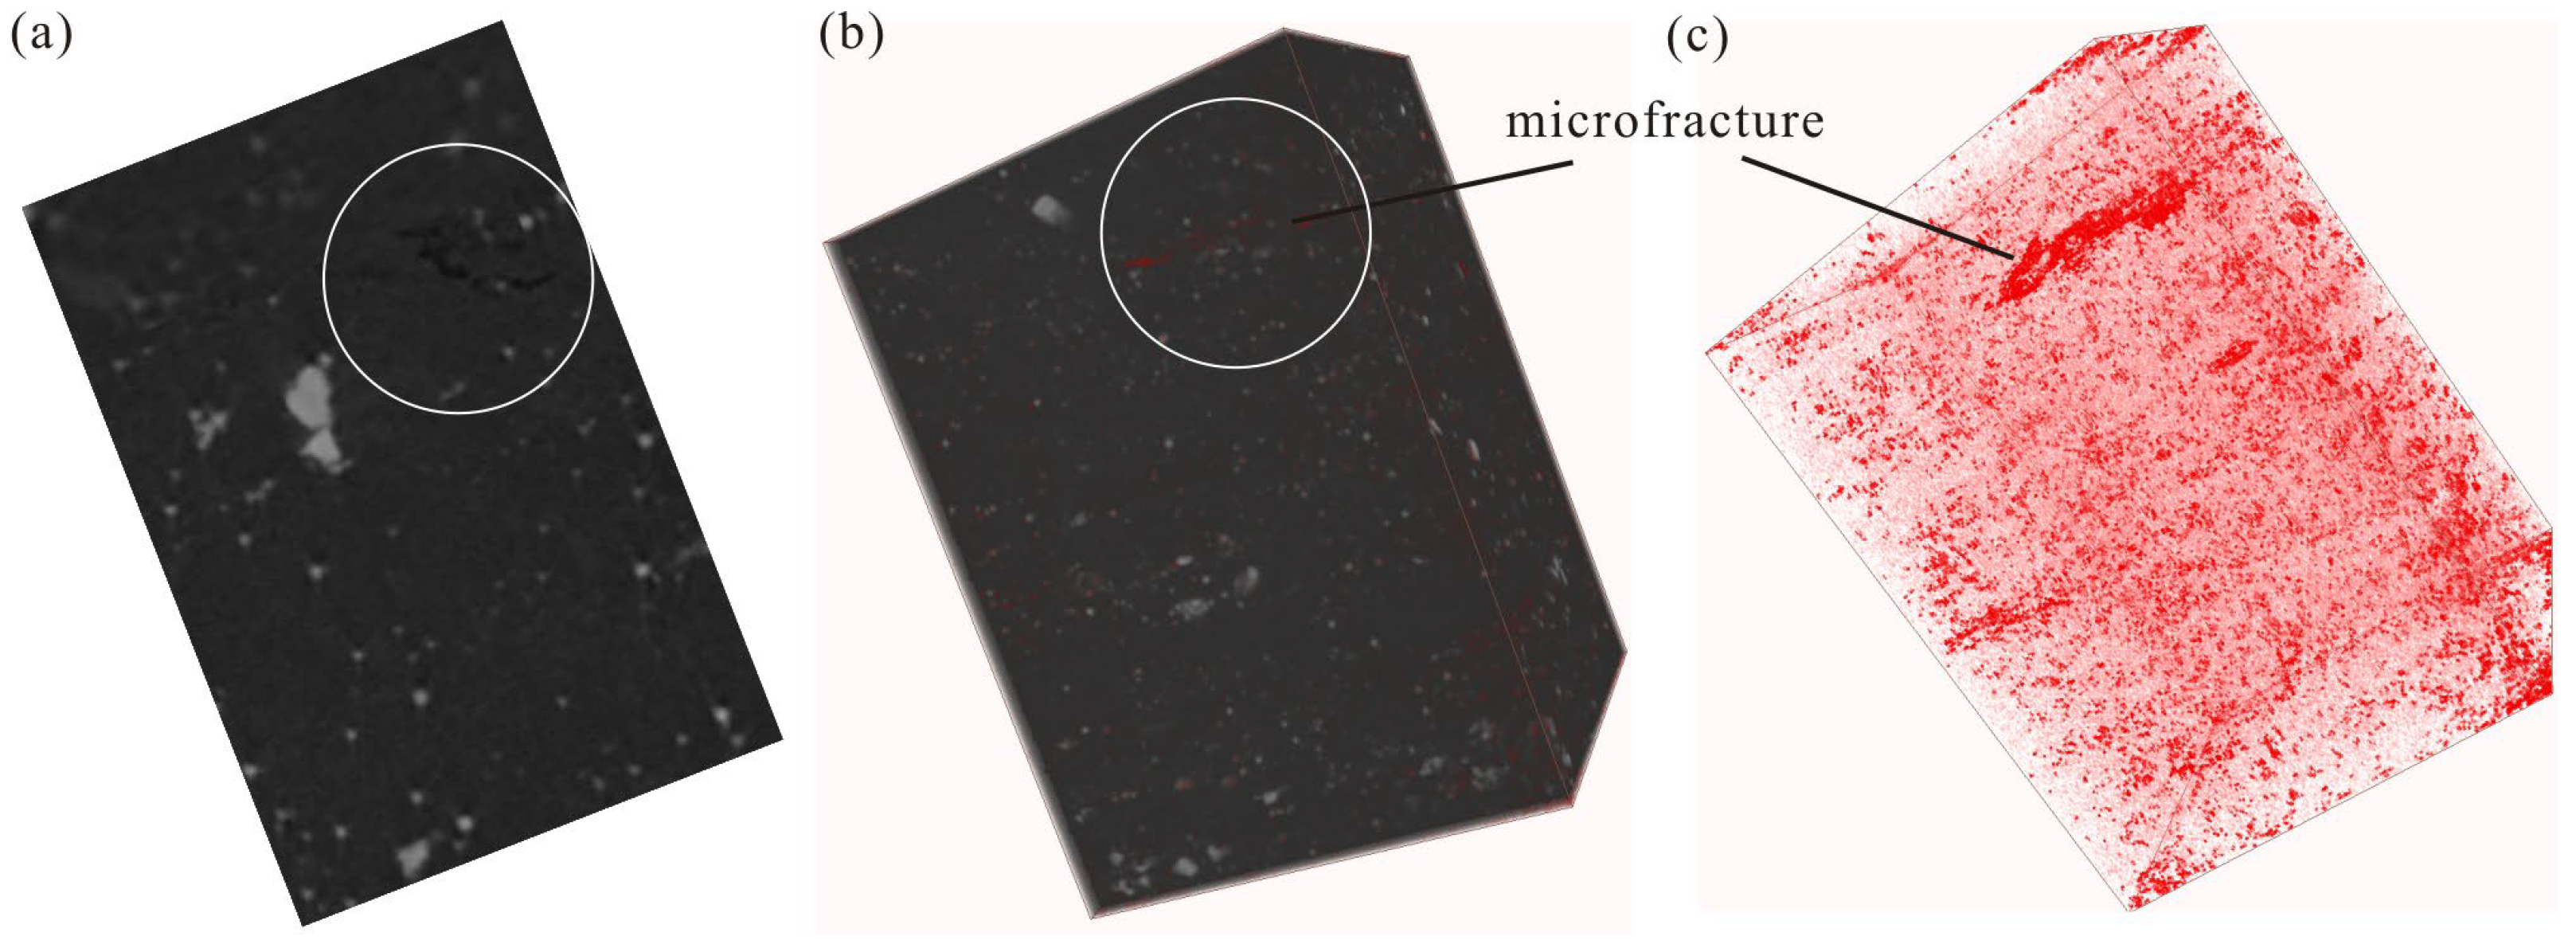
The pixel size of the X-ray micro-computed tomography is 0.7 μm, and thus, there is some noise that obscures the details of these images. However, the micrographs show the presence of micro-fractures in sample ZM-A3 (Figure 7a), although it is difficult to determine their spatial distribution. The three-dimensional characteristics of the micro-fractures were reconstructed and interpreted using Dragonfly software, showing the micro-fractures to be oriented preferentially parallel to bedding (Figure 7b,c). Xiao et al. (2016) and Wang et al. (2019) reported that thermal micro-fractures develop along bedding with increasing temperature [28,29], which leads to the development of anisotropy of permeability. Bedding-parallel micro-fractures increase the bedding-parallel permeability, and have no effect on the bedding-perpendicular permeability.
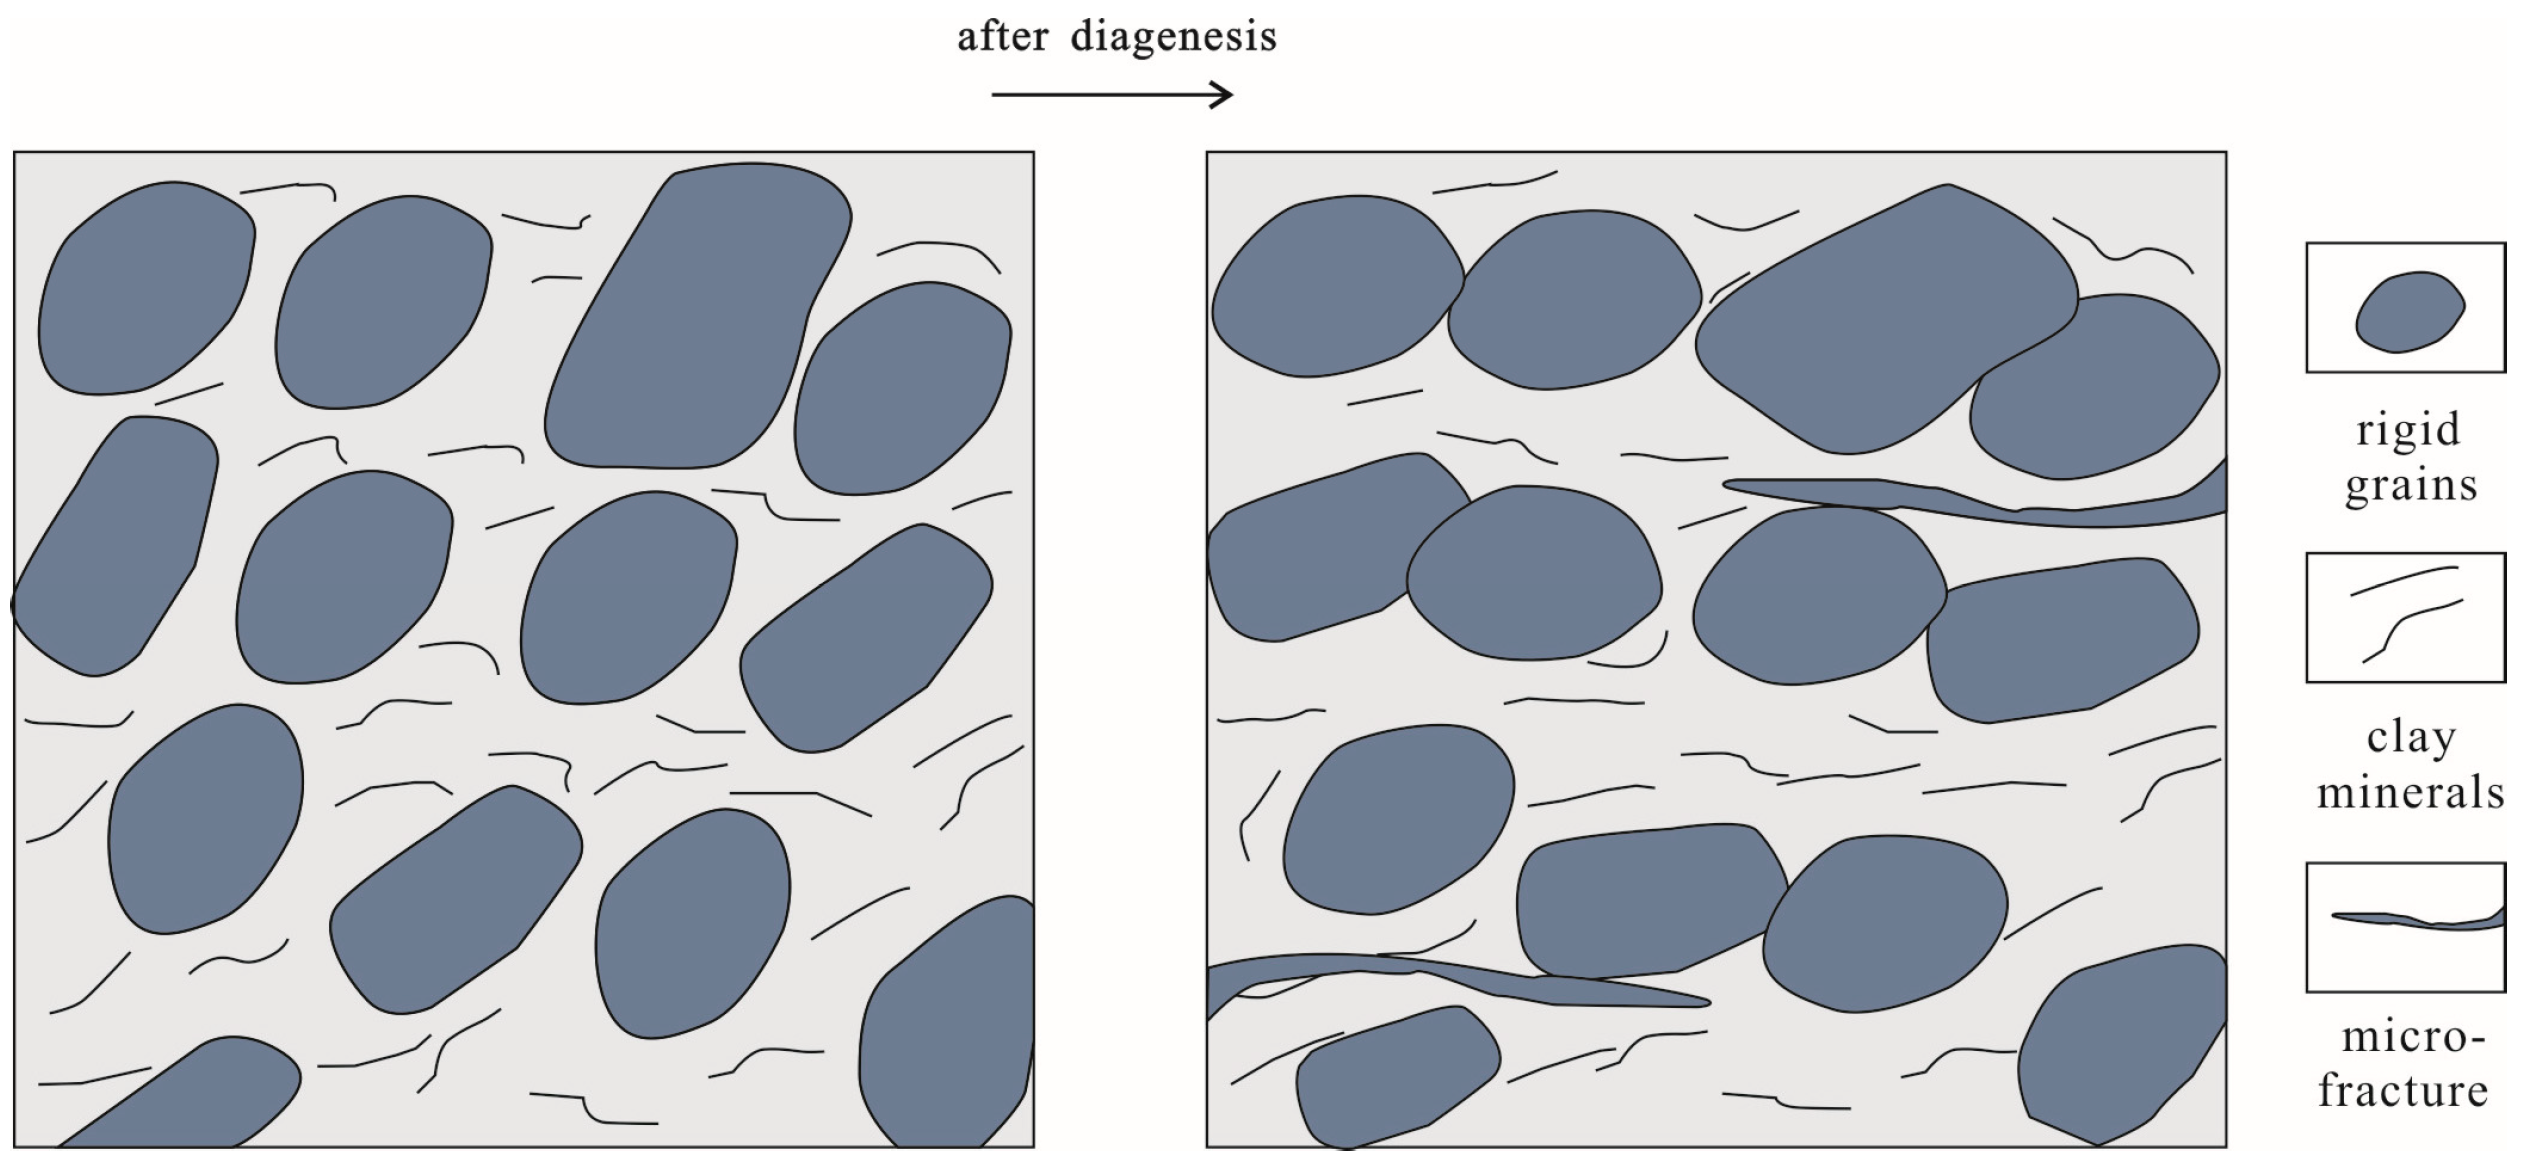
The SEM images and subcritical gas adsorption data indicate the pore fracture system in the over-mature shales is parallel to bedding (Figure 8). The preferred orientation of the pore fracture system leads to a decreasing tortuosity parallel to bedding, relative to that perpendicular to bedding, which results in the anisotropy of permeability.

5. Conclusions

(1)
The Niutitang Formation shale has quartz and carbonate contents of 12.4%–94.0% and 0%–86.8%, respectively. The minerals are oriented (sub-)parallel to bedding.
(2)
The bedding-parallel and bedding-perpendicular permeabilities are 1.25–46.21 × 10⁻² and 1.38–6.62 × 10⁻² mD, respectively. The anisotropy of permeability is 0.21–26.87 and is greater in the siliceous shales as compared with the calcareous shales.
(3)
The micropore and BJH pore volumes are 0.54–3.62 and 0.05–0.69 mL/100 g, respectively. The permeability parallel to bedding is correlated positively with the micropore and BJH pore volumes.

Author Contributions

Conceptualization, Y.T. and T.T.; methodology, Y.T. and T.T.; software, X.F.; validation, X.F.; formal analysis, X.B.; investigation, X.B.; resources, X.B.; data curation, X.B.; writing—original draft preparation, Y.T. and T.T.; writing—review and editing, L.Z.; visualization, Y.T.; supervision, Y.T.; project administration, T.T.; funding acquisition, T.T. All authors have read and agreed to the published version of the manuscript.

Funding

This research was funded by the China Geological Survey Project (Grant No. DD20240200605).

Data Availability Statement

Data are contained within the article.

Conflicts of Interest

Yanshuai Tang, Tianguo Tang and Xiujiang Fan are employees of Yanchang Oilfield Co., Ltd. Xiaohang Bao is an employee of Petrochemical Technology Service Branch of Liaohe Oilfield Company. The paper reflects the views of the scientists and not the company. The remaining author declares that the research was conducted in the absence of any commercial or financial relationships that could be construed as a potential conflict of interest.

References

  1. Bhandari, A.R.; Flemings, P.B.; Polito, P.J.; Cronin, M.B.; Bryant, S.L. Anisotropy and stress dependence of permeability in the Barnett Shale. Transp. Porous Med. 2015, 108, 393–411. [Google Scholar] [CrossRef]
  2. Metwally, Y.M.; Sondergeld, C.H. Measuring low permeabilities of gas-sands and shales using a pressure transmission technique. Int. J. Rock Mech. Min. Sci. 2011, 48, 1135–1144. [Google Scholar] [CrossRef]
  3. Clarkson, C.R.; Jensen, J.L.; Pedersen, P.K.; Freeman, M. Innovative methods for flow-unit and pore-structure analyses in a tight siltstone and shale gas reservoir. AAPG Bull. 2012, 96, 355–374. [Google Scholar] [CrossRef]
  4. Dewers, T.A.; Heath, J.; Ewy, R. Three-dimensional pore networks and transport properties of a shale gas formation determined from focused ion beam serial imaging. Int. J. Oil Gas Coal Technol. 2012, 5, 229–248. [Google Scholar] [CrossRef]
  5. Bertoncello, A.; Honarpour, M.M. Standards for characterization of rock properties in unconventional reservoirs: Fluid flow mechanism, quality control, and uncertainties. In Proceedings of the SPE Annual Technical Conference and Exhibition, New Orleans, LA, USA, 30 September–2 October 2013; p. SPE-166470-MS. [Google Scholar]
  6. Mokhtari, M.; Tutuncu, A.N. Characterization of anisotropy in the permeability of organic-rich shales. J. Pet. Sci. Eng. 2015, 133, 496–506. [Google Scholar] [CrossRef]
  7. Chalmers, G.R.; Bustin, R.M.; Power, I.M. Characterization of gas shale pore systems by porosimetry, pycnometry, surface area, and field emission scanning electron microscopy/transmission electron microscopy image analyses: Examples from the Barnett, Woodford, Haynesville, Marcellus, and Doig units. AAPG Bull. 2012, 96, 1099–1119. [Google Scholar] [CrossRef]
  8. Heller, R.; Vermylen, J.; Zoback, M. Experimental investigation of matrix permeability of gas shales. AAPG Bull. 2014, 98, 975–995. [Google Scholar] [CrossRef]
  9. Ghanizadeh, A.; Gasparik, M.; Amann-Hildenbrand, A.; Gensterblum, Y.; Krooss, B.M. Experimental study of fluid transport processes in the matrix system of the European organic-rich shales: I. Scandinavian Alum shale. Mar. Pet. Geol. 2014, 51, 79–99. [Google Scholar] [CrossRef]
  10. Zhang, W.; Wang, Q. Permeability anisotropy and gas slippage of shales from the Sichuan Basin in South China. Int. J. Coal Geol. 2018, 194, 22–32. [Google Scholar] [CrossRef]
  11. Pan, Z.J.; Ma, Y.; Connell, L.D.; Down, D.I.; Camilleri, M. Measuring anisotropic permeability using a cubic shale sample in a triaxial cell. J. Nat. Gas Sci. Eng. 2015, 26, 336–344. [Google Scholar] [CrossRef]
  12. Ma, Y.; Pan, Z.J.; Zhong, N.N.; Connell, L.D.; Down, D.I.; Lin, W.L.; Zhang, Y. Experimental study of anisotropic gas permeability and its relationship with fracture structure of Longmaxi Shales, Sichuan Basin, China. Fuel 2016, 180, 106–115. [Google Scholar] [CrossRef]
  13. Tan, Y.L.; Pan, Z.J.; Liu, J.S.; Wu, Y.T.; Haque, A.; Connell, L.D. Experimental study of permeability and its anisotropy for shale fracture supported with proppant. J. Nat. Gas Sci. Eng. 2017, 44, 250–264. [Google Scholar] [CrossRef]
  14. Adams, A.L.; Germaine, J.T.; Flemings, P.B.; Day-Stirrat, R.J. Stress induced permeability anisotropy of resedimented Boston Blue Clay. Water Resour. Res. 2013, 9, 6561–6571. [Google Scholar] [CrossRef]
  15. Xiong, F.Y.; Jiang, Z.X.; Tang, X.L.; Li, Z.; Bi, H.; Li, W.B.; Yang, P.P. Characteristics and origin of the heterogeneity of the Lower Silurian Longmaxi marine shale in southeastern Chongqing, SW China. J. Nat. Gas Sci. Eng. 2015, 27, 1389–1399. [Google Scholar] [CrossRef]
  16. Ross, D.J.K.; Bustin, R.M. Sediment geochemistry of the Lower Jurassic Gordondale Member, northeastern British Columbia. Bull. Can. Petrol. Geol. 2006, 54, 337–365. [Google Scholar] [CrossRef]
  17. Mondol, N.H.; Bjorlykke, K.; Jahren, J.; Hoeg, K. Experimental mechanical compaction of clay mineral aggregates—Changes in physical properties of mudstones during burial. Mar. Pet. Geol. 2007, 24, 289–311. [Google Scholar] [CrossRef]
  18. Loucks, R.G.; Reed, R.M.; Ruppel, S.C.; Hammes, U. Spectrum of pore types and networks in mudrocks and a descriptive classification for matrix-related mudrock pores. AAPG Bull. 2012, 96, 1071–1098. [Google Scholar] [CrossRef]
  19. SY/T 5336-1996; Method of Core Routine Analysis. Petroleum Industry Press: Beijing, China, 1996.
  20. Brunauer, S.; Emmett, P.H.; Teller, E. Adsorption of gases in multimolecular layers. J. Am. Chem. Soc. 1938, 60, 309–319. [Google Scholar] [CrossRef]
  21. Barrett, E.P.; Joyner, L.G.; Halenda, P.P. The determination of pore volume and area distributions in porous substances. I. Computations from nitrogen isotherms. J. Am. Chem. Soc. 1951, 73, 373–380. [Google Scholar] [CrossRef]
  22. Milliken, K.L.; Reed, R.M. Multiple causes of diagenetic fabric anisotropy in weakly consolidated mud, Nankai accretionary prism, IODP Expedition 316. J. Struct. Geol. 2010, 32, 1887–1898. [Google Scholar] [CrossRef]
  23. Sing, K.S.W.; Everett, D.H.; Haul, R.A.W.; Mescou, L.; Pierotti, R.A.; Rouquérol, J.; Siemieniewska, T. Reporting physisorption data for gas/solid systems with special reference to the determination of surface area and porosity. Pure Appl. Chem. 1985, 57, 603–619. [Google Scholar] [CrossRef]
  24. Loucks, R.G.; Reed, R.M.; Ruppel, S.C.; Jarvie, D.M. Morphology, genesis, and distribution of nanometer-scale pores in siliceous mudstones of the Mississippian Barnett shale. J. Sediment. Res. 2009, 79, 848–861. [Google Scholar] [CrossRef]
  25. Desbois, G.; Urai, J.L.; Kukla, P.A. Morphology of the pore space in claystones—Evidence from BIB/FIB ion beam sectioning and cryo-SEM observations. eEarth 2009, 4, 15–22. [Google Scholar] [CrossRef]
  26. Ambrose, R.J.; Hartman, R.C.; Diaz-Campos, M.; Akkutlu, I.Y.; Sondergeld, C.H. New pore-scale considerations for shale gas in place calculations. In Proceedings of the Society of Petroleum Engineers Unconventional Gas Conference, Pittsburgh, PA, USA, 23–25 February 2010; p. SPE-131772-MS. [Google Scholar]
  27. Wan, Y.; Pan, Z.J.; Tang, S.H.; Connell, L.D.; Down, D.D.; Camilleri, M. An experimental investigation of diffusivity and porosity anisotropy of a Chinese gas shale. J. Nat. Gas Sci. Eng. 2015, 23, 70–79. [Google Scholar] [CrossRef]
  28. Xiao, Y.; Lu, J.H.; Wang, C.P.; Peng, J. Experimental Study of High-Temperature Fracture Propagation in Anthracite and Destruction of Mudstone from Coalfield Using High-Resolution Microfocus X-ray Computed Tomography. Rock Mech. Rock Eng. 2016, 49, 3723–3734. [Google Scholar] [CrossRef]
  29. Wang, G.Y.; Dong, Y.; Zhao, Y.S.; Kang, Z.Q.; Zhao, J.; Huang, X.D. Experimental investigation on anisotropic permeability and its relationship with anisotropic thermal cracking of oil shale under high temperature and triaxial stress. Appl. Therm. Eng. 2019, 146, 718–725. [Google Scholar] [CrossRef]
Figure 1. Simplified geological map of the Middle Yangtze Platform and sampling methods and samples. (a) Simplified geological map of the studied area; (b) sampling methods and samples from Zouma (ZM) out-crop.
Minerals 16 00315 g001
Figure 2. Bedding-parallel phyllosilicate alignment and deformation bands of the shales. (a) Discontinuous organic matter; (b) Discontinuous quartz grains; (c) Discontinuous organic matter and pyrite grains; (d) Discontinuous quartz grains; (e) Deformation bands; (f) Discontinuous deformation bands.
Minerals 16 00315 g002
Figure 3. CO2 adsorption and N2 adsorption/desorption isotherms for the shale samples. (a) CO2 adsorption isotherms of the shales; (b) N2 adsorption isotherms of the shales.
Minerals 16 00315 g003
Figure 4. FE-SEM images showing the intragranular pores and perpendicular-bedding micro-fractures of calcareous shales. (a) Intragranular pores; (b) Intragranular pores; (c) Micro-fractures; (d) Deformed micro-fractures.
Minerals 16 00315 g004
Figure 5. FE-SEM images showing the siliceous shale mineral compositions and pore networks parallel to bedding. (a) Preferred orientation of pyrite grains, (bd) deformation of organic matter, (e) preferred orientation of quartz grains, (fi) preferred orientation and deformation of clay minerals, (jl) EDS images of pyrite, organic matter and clay minerals.
Minerals 16 00315 g005
Figure 6. Relationships between micropore volume, BJH pore volume, and parallel permeability and perpendicular permeability. (a) Micropore volume vs. KH; (b) BJH pore volume vs. KH; (c) Micropore volume vs. KV; (d) BJH pore volume vs. KV. The square symbol is for ZM-A3 and circular symbols are for other samples.
Minerals 16 00315 g006
Figure 7. Bedding-parallel micro-fractures identified by X-ray micro-computed tomographic analysis. (a) Original 3D micrographs of micro-fractures; (b) 3D micrographs of micro-fractures (red) and shale matrix minerals (other colors); (c) 3D micrographs of micro-fractures.
Minerals 16 00315 g007
Figure 8. Influence of diagenesis on pore-fracture system networks.
Minerals 16 00315 g008
Table 1. The mineralogical composition and clay mineral relative composition of shales.
Sample
ID
Mineralogical Composition (%)Clay Mineral Relative Composition (%)
QPlCHAPyClKaoliniteIllite
ZM-A190.6 0.2 9.2298
ZM-A380.61.5 17.9 100
ZM-A490.30.5 0.40.2 8.63070
ZM-A588.6 11.42872
ZM-A690.90.40.5 0.10.47.7694
ZM-A980.3 19.7 100
ZM-A1594.0 6.0 100
YJP-OX27.00.271.4 1.4 100
YJP-XY12.4 86.8 0.8 100
Q, quartz content; Pl, plagioclase content; C, carbonate (calcite + dolomite) content; H, hematite content; A, anhydrite content; Py, pyroxene content; Cl, clay content.
Table 2. Pore structure data obtained from the low-pressure CO2 adsorption and N2 adsorption/desorption isotherms.
Sample
ID
CO2 Isotherm AnalysesN2 Isotherm Analyses
Micropore Surface Area (m2/g)Micropore
Volume
(mL/100 g)
BET Surface
Area (m2/g)
BJH Pore Volume
(mL/100 g)
Average Pore
Diameter (nm)
ZM-A114.900.605.642.1916.0
ZM-A31.320.052.350.6712.2
ZM-A416.960.686.782.6115.8
ZM-A517.320.698.312.9414.1
ZM-A614.780.546.552.2513.6
ZM-A915.110.618.782.5812.0
ZM-A1514.380.6418.143.628.5
YJP-OX3.080.141.830.5412.5
YJP-XY3.810.162.620.7411.3
Table 3. The permeability and permeability anisotropy of the over-mature shales.
Sample IDKH (×10−2 mD)KV (×10−2 mD)KH/KV
ZM-A16.252.752.27
ZM-A346.211.7226.87
ZM-A411.191.388.11
ZM-A530.276.344.77
ZM-A65.91.593.71
ZM-A991.65.63
ZM-A158.254.261.94
YJP-OX1.255.990.21
YJP-XY4.466.620.67
Disclaimer/Publisher’s Note: The statements, opinions and data contained in all publications are solely those of the individual author(s) and contributor(s) and not of MDPI and/or the editor(s). MDPI and/or the editor(s) disclaim responsibility for any injury to people or property resulting from any ideas, methods, instructions or products referred to in the content.