Article

Performance of Electro-Geochemical Survey in Locating Hidden Lead–Zinc–Antimony Deposits: A Case Study of the Bancai Mining Area in Hechi, Guangxi


1
School of Earth Sciences, Guilin University of Technology, Guilin 541006, China
2
Guangxi Key Laboratory of Hidden Metal Mineral Exploration, Guilin 541006, China
*
Author to whom correspondence should be addressed.
Minerals 2026, 16(3), 314; https://doi.org/10.3390/min16030314
Submission received: 25 January 2026 / Revised: 13 March 2026 / Accepted: 14 March 2026 / Published: 17 March 2026
(This article belongs to the Special Issue Geochemical Exploration for Critical Mineral Resources, 2nd Edition)

Abstract

The demand for lead–zinc–antimony ore resources in China has increased steadily, while shallow deposits are approaching depletion, leading to intensified exploration for deep, concealed orebodies. Electro-geochemical surveys, as a penetrative geochemical exploration technique, are particularly effective in areas with thick overburden. In this study, the Bancai area in Hechi, Guangxi, was selected to evaluate the applicability of this method for concealed mineral exploration. Feasibility testing was conducted along the A4 profile over an engineering-controlled orebody. Distinct electro-geochemical anomalies were identified directly above the known orebody, showing strong spatial correspondence and favorable ore-indicating characteristics, confirming the effectiveness of the method in the study area. Based on the deposit’s geological characteristics, prospecting indicators were established by integrating geological features, electro-geochemical responses, and wall-rock alteration. A geological electro-geochemical prospecting model was constructed for the Bancai mining area and applied for deep exploration of the Bancai B block. By analyzing the spatial distribution of electro-geochemical anomalies and integrating geological conditions, mineralization potential, and related factors, three prospective target areas were delineated to provide guidance for subsequent explorations. Among these targets, Target Area III exhibits favorable structural conditions, well-developed calcite veins, and pronounced superposition of multi-element geochemical anomalies, indicating considerable potential for further mineral exploration.

1. Introduction

Lead, zinc, and antimony are non-ferrous metals that are extensively used globally in the fields of chemical engineering, metallurgy, national defense, and public health. These metals constitute a critical basis of the materials used for industrial upgrading and infrastructure development worldwide [1]. As global industrialization continues to advance, demand for zinc has risen steadily, placing growing pressure on the supply side. According to the latest forecast from the International Lead and Zinc Study Group (ILZSG), released in October 2025, the global demand for refined zinc is expected to grow by 1.1% in 2025, while supply is projected to increase by 2.7%. By 2026, demand growth is expected to stabilize at 1.0%, with supply growth also easing to 2.4%. Against this backdrop, the global refined zinc market is anticipated to remain in surplus in both 2025 and 2026 [2,3]. Regarding resource reserves, the latest data from the U.S. Geological Survey (USGS 2025) indicates that global proven reserves of lead, zinc, and antimony stand at approximately 95 million tons, 210 million tons, and 2.2 million tons, respectively [4,5]. This reflects the widespread problems of excessive exploitation, rapid resource consumption, and the low overall utilization rate across the globe; for example, most surface-exposed mines have already been fully explored. Additionally, it highlights the direct threat to global supply chain stability posed by the risk of resource depletion.
Under the progressive depletion of shallow resources and tightening supply–demand conditions, China maintains major advantages in Pb–Zn and Sb reserves, ranking second globally for Pb–Zn and first for Sb. However, constraints on shallow exploitable resources are increasing, requiring a shift toward deep, concealed targets to secure resource succession. Accordingly, prediction and exploration techniques for revealing concealed deposits have become a key research focus. As a penetrating geochemical exploration approach, electro-geochemical survey provides stronger penetration, high sensitivity, and broader adaptability than conventional soil and stream-sediment measurements, and multiple systems have been developed for this purpose [6,7,8,9,10]. These methods have achieved successful exploration results across diverse settings, including permafrost-covered regions [11], grasslands [12], forested areas and residual slope deposits [13,14], arid Gobi deserts, and Quaternary cover [15,16]. Such progress offers practical technical options for deep exploration beneath cover sequences. However, research on the systematic application of this technology in areas with complex tectonic control of mineralization, such as the Danchi ore-forming belt, still lags and targeted verification is urgently needed.
Considering these requirements and the technical background, the Bancai mining area in the Danchi mineral belt (northwest Guangxi) was selected as the study area for this research. This selection is primarily supported by the foundation of well-established mineralization and strong exploration support in the Wuxu mining field, making it a highly representative location. The Wuxu Mineralized Field is located at the southern end of the Danchi Polymetallic Mineralization Belt, and its deposits are typically hosted in well-defined stratigraphic units: the Lower Devonian Tangding Formation (Jianzhuopo Deposit), the Lower Devonian Tangding Formation and Middle Devonian Luofu Formation (Sanpaidong-Furongchang Deposit), and the Upper Devonian Liujiang Formation and Wuzhishan Formation (Shuiluo Deposit) [17,18,19]. The Jianzhuopo deposit is interpreted as a medium-to-low-temperature magmatic–hydrothermal deposit, with mineralizing fluids derived from magmatic–hydrothermal sources. Deposits across the field were formed by low-temperature hydrothermal filling. Previous work established six geoelectric and geochemical profiles south of Jianzhuopo and confirmed that the orebody distribution was consistent with integrated geoelectric–geochemical anomalies. Pb-Zn-Sb anomalies are characterized by their large extent, high intensity, and clear synchrony, and these interpretations have been verified by drilling, supporting the applicability of geoelectric and geochemical methods in this field [20,21].
The Bancai mining area lies in the core zone of the Wuxu mineral field and is controlled by a unified mineralization system. Shallow resources are largely exhausted, creating an urgent demand for deep exploration. The area is characterized by low mountains and hilly terrain, with surface cover dominated by Quaternary deposits and residual materials that show uneven thickness and strong permeability contrasts. Target orebodies are structurally controlled by faults, with strike lengths of 60–100 m and dip lengths of 80–145 m. The orebodies are deeply buried and vary in the scale of fault control, which increases exploration difficulty. In covered terrains, conventional geochemical exploration is strongly affected by interference and often fails to delineate anomalies related to deep orebodies. In contrast, electro-geochemical surveys, with demonstrated success in Quaternary-covered areas, are well-matched to the overburden conditions of this district and provide direct technical support for this study.
To investigate deep Pb–Zn–Sb resources in the Bancai mining area, we conducted deep exploration prediction using geoelectric and electro-geochemical surveys in the Bancai region, Jinchengjiang District, Hechi City, Guangxi. First, experimental work along the known A4 profile was used to verify the method effectiveness and characterize electro-geochemical anomalies. Second, a geological–electro-geochemical prospecting model was established by integrating the geological setting of the district. Following a known-to-unknown strategy, mineralization prediction was performed for the eastern concealed zone adjacent to known orebodies to systematically evaluate the effectiveness of electro-geochemical surveys in locating deep, concealed Pb–Zn–Sb deposits.

2. Geological Overview of the Study Area

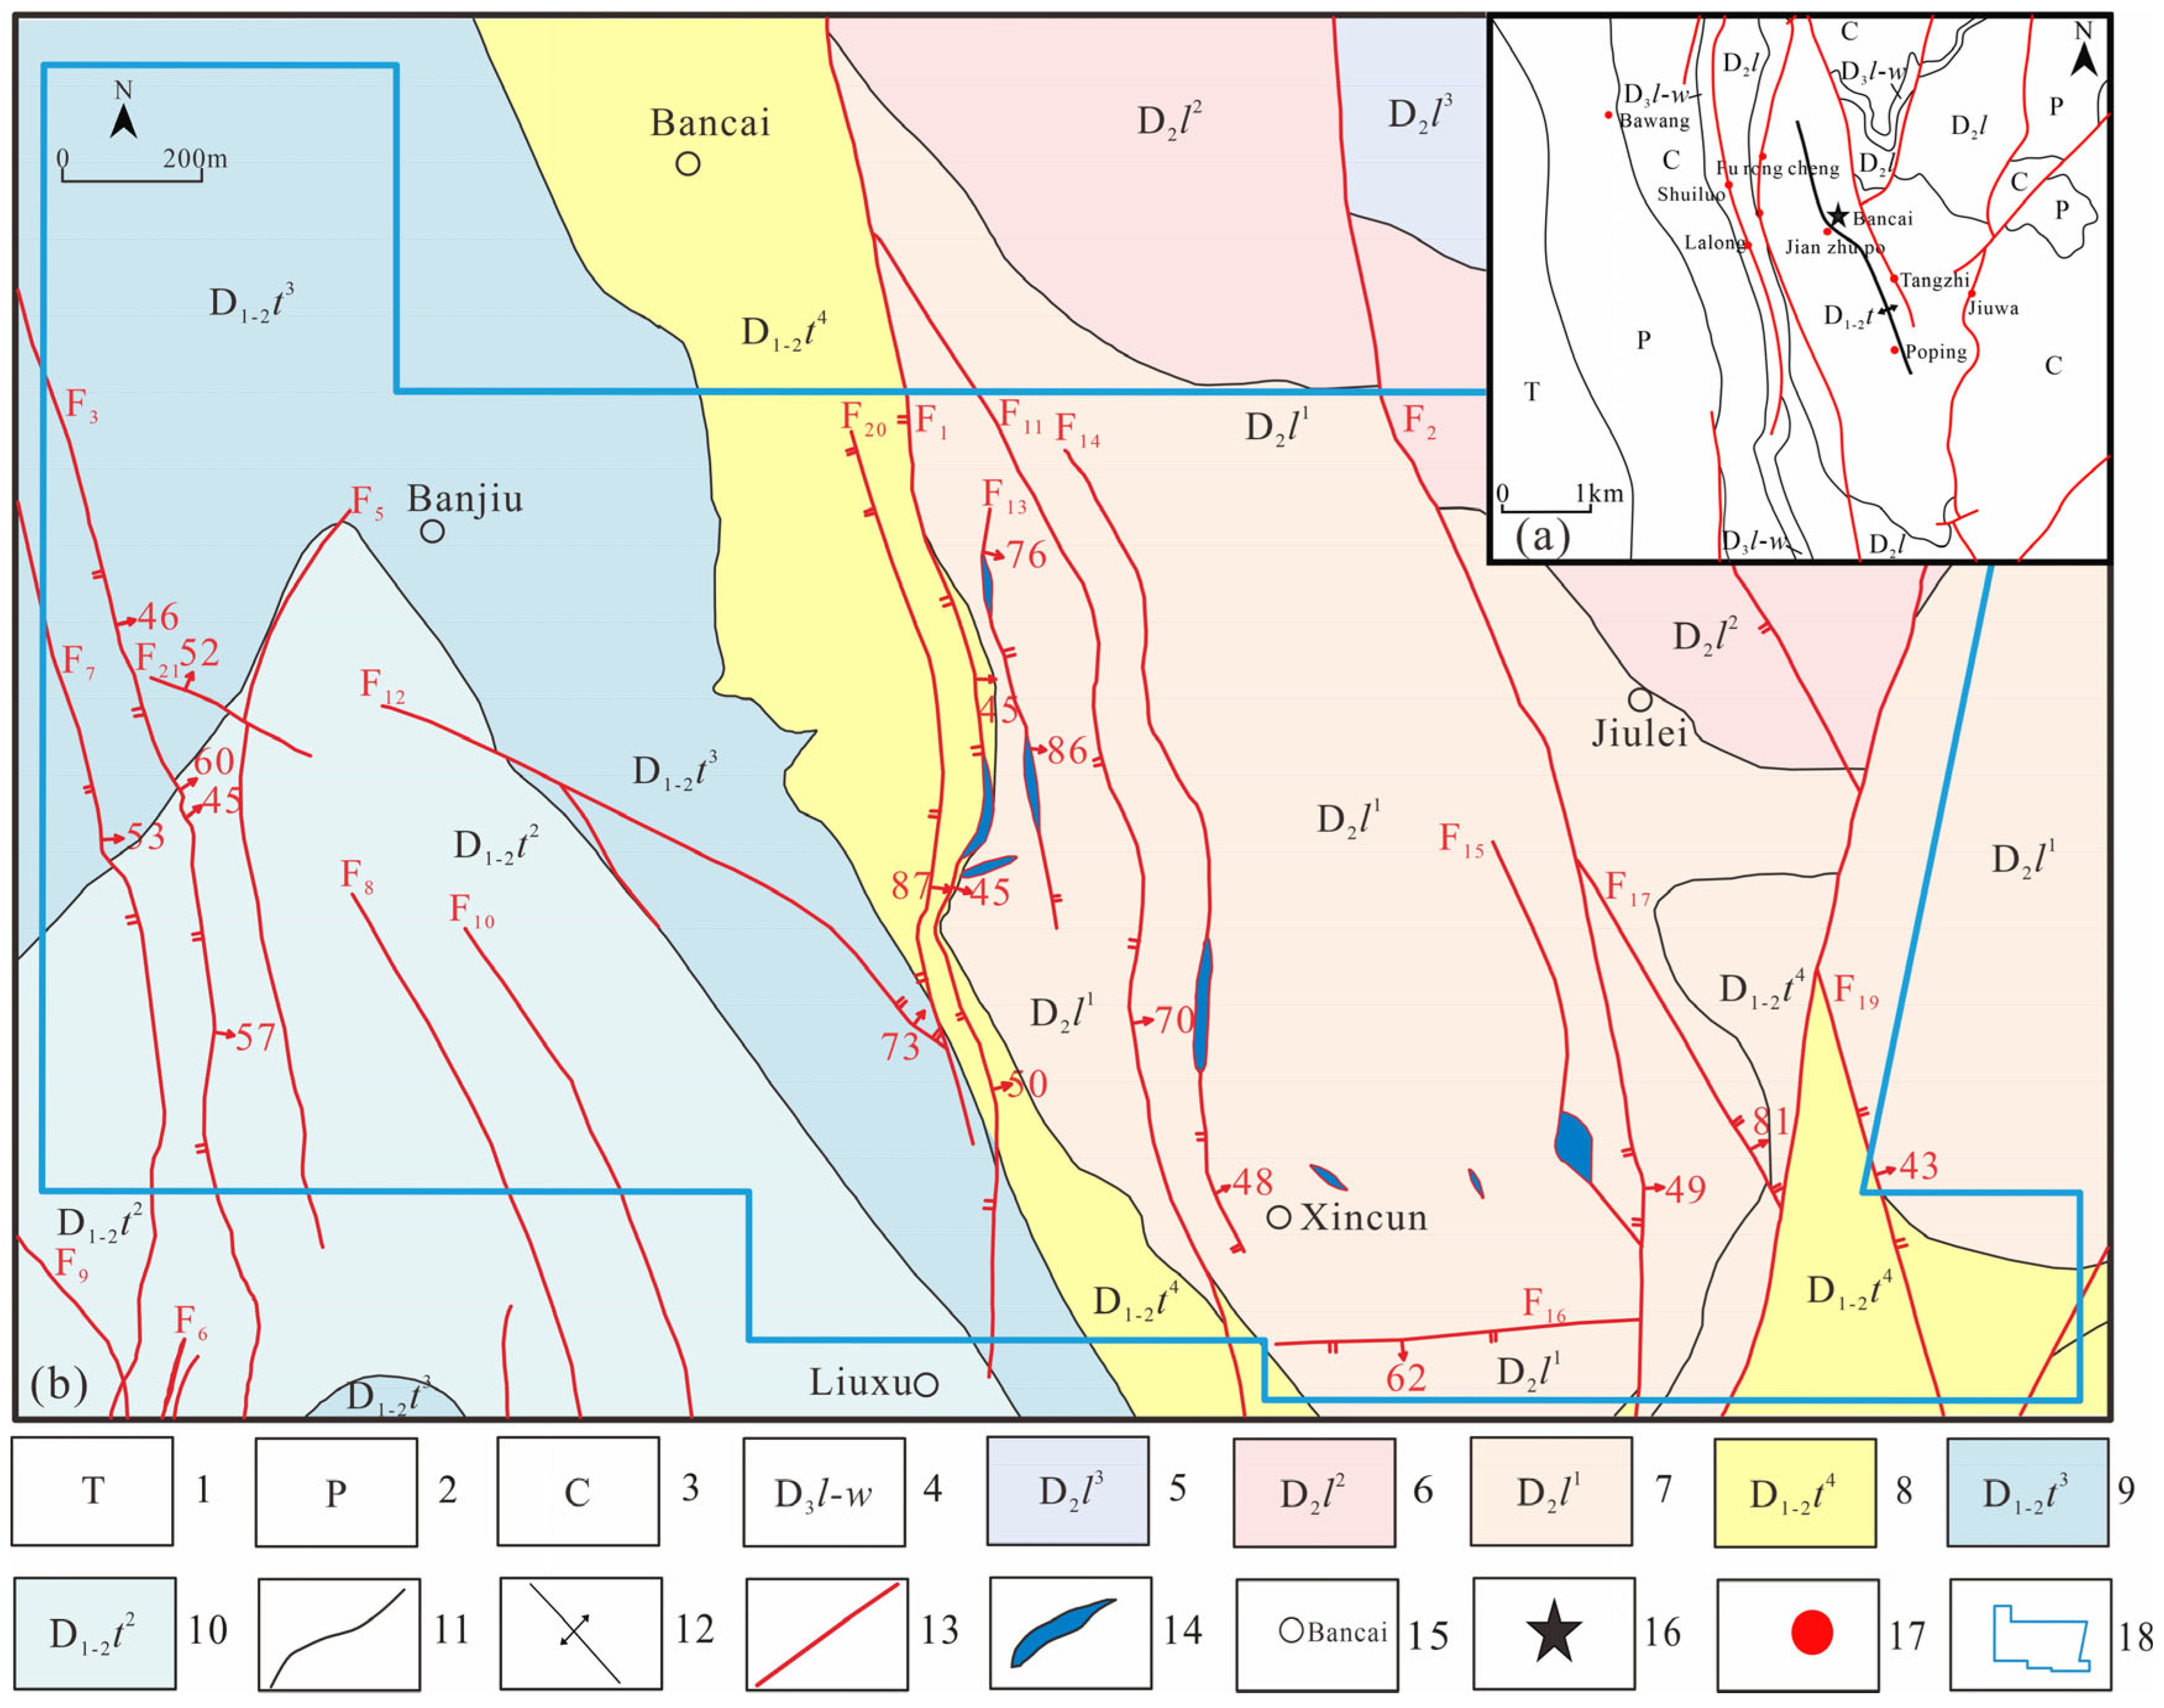
The Bancai lead–zinc–antimony mineralization area is situated within the Danchi polymetallic metallogenic belt, along the southern margin of the Jiangnan Landmass and the northern boundary of the Youjiang Regenerated geosyncline (Figure 1a). Tectonically, the area represents a composite zone influenced by both the Paleo-Tethys and Pacific tectonic systems, with structural deformation dominated by NW-NNW-trending folds and faults.
The study area occupies the northern segment of the Jianzhupo polymetallic deposit in the Wuxu mining field [22] (Figure 1a), situated on the inner side of the eastern wing of the Guangxi mountain-shaped structure front arc. The dominant structural orientation strikes NNW, locally modified by EW-trending Nanling structures in the north and superimposed by EEW-trending Neocathaysian structures in the northeastern sector.
The structural framework is characterized by well-developed NNW-trending folds and associated tension–torsional faults, together with near-EW-trending tension–torsional faults. From south to north, structural orientations change from NW to NNW and then return to NW, forming an overall inverse “S”-shaped pattern. This geometry indicates regional clockwise torsion [23] in the Wuxu area, and these faults exert primary control on endogenous hydrothermal mineralization. The Bancai deposit is located at the northern plunging end of the Wuxu anticline.
The strata exposed in the mining area mainly include sericite mudstone, banded mudstone, and silty mudstone of the Devonian Tangding Formation (D1–2t), Middle Devonian Luofu Formation (D2l), and Upper Carboniferous Nandan Formation (C2n), which constitute the principal ore-bearing horizons.
The major fold is the Wuxu anticline, which is accompanied by secondary folds on both limbs. Ore-bearing faults predominantly develop near the fold axis and along the eastern limb. Three principal ore-bearing faults (F3, F7, and F9) occur near the anticline axis, while additional major faults (F1, F2, and F4) and smaller secondary faults with parallel or oblique orientations develop on the eastern limb (Figure 1).
Figure 1. (a) Schematic diagram of tectonic location and mineral distribution in Wuxu Area, Hechi [24]; (b) geological map of the mining area. 1—Triassic, 2—Permian, 3—Carboniferous, 4—Upper Devonian Wuzhishan Formation and Liujiang Formation, 5—Upper Section of Middle Devonian Luofu Formation, 6—Middle Section of Middle Devonian Luofu Formation, 7—Lower Section of Middle Devonian Luofu Formation, 8—Fourth Section of Middle Devonian Tangding Formation, 9—Third Section of Middle Devonian Tangding Formation, 10—Second Section of Middle Devonian Tangding Formation, 11—stratigraphic boundary, 12—anticline axis, 13—fault, 14—calcite vein, 15—place name, 16—study area, 17—deposit (point), 18—study area scope.
Minerals 16 00314 g001

3. Sample Collection and Analytical Testing Methods

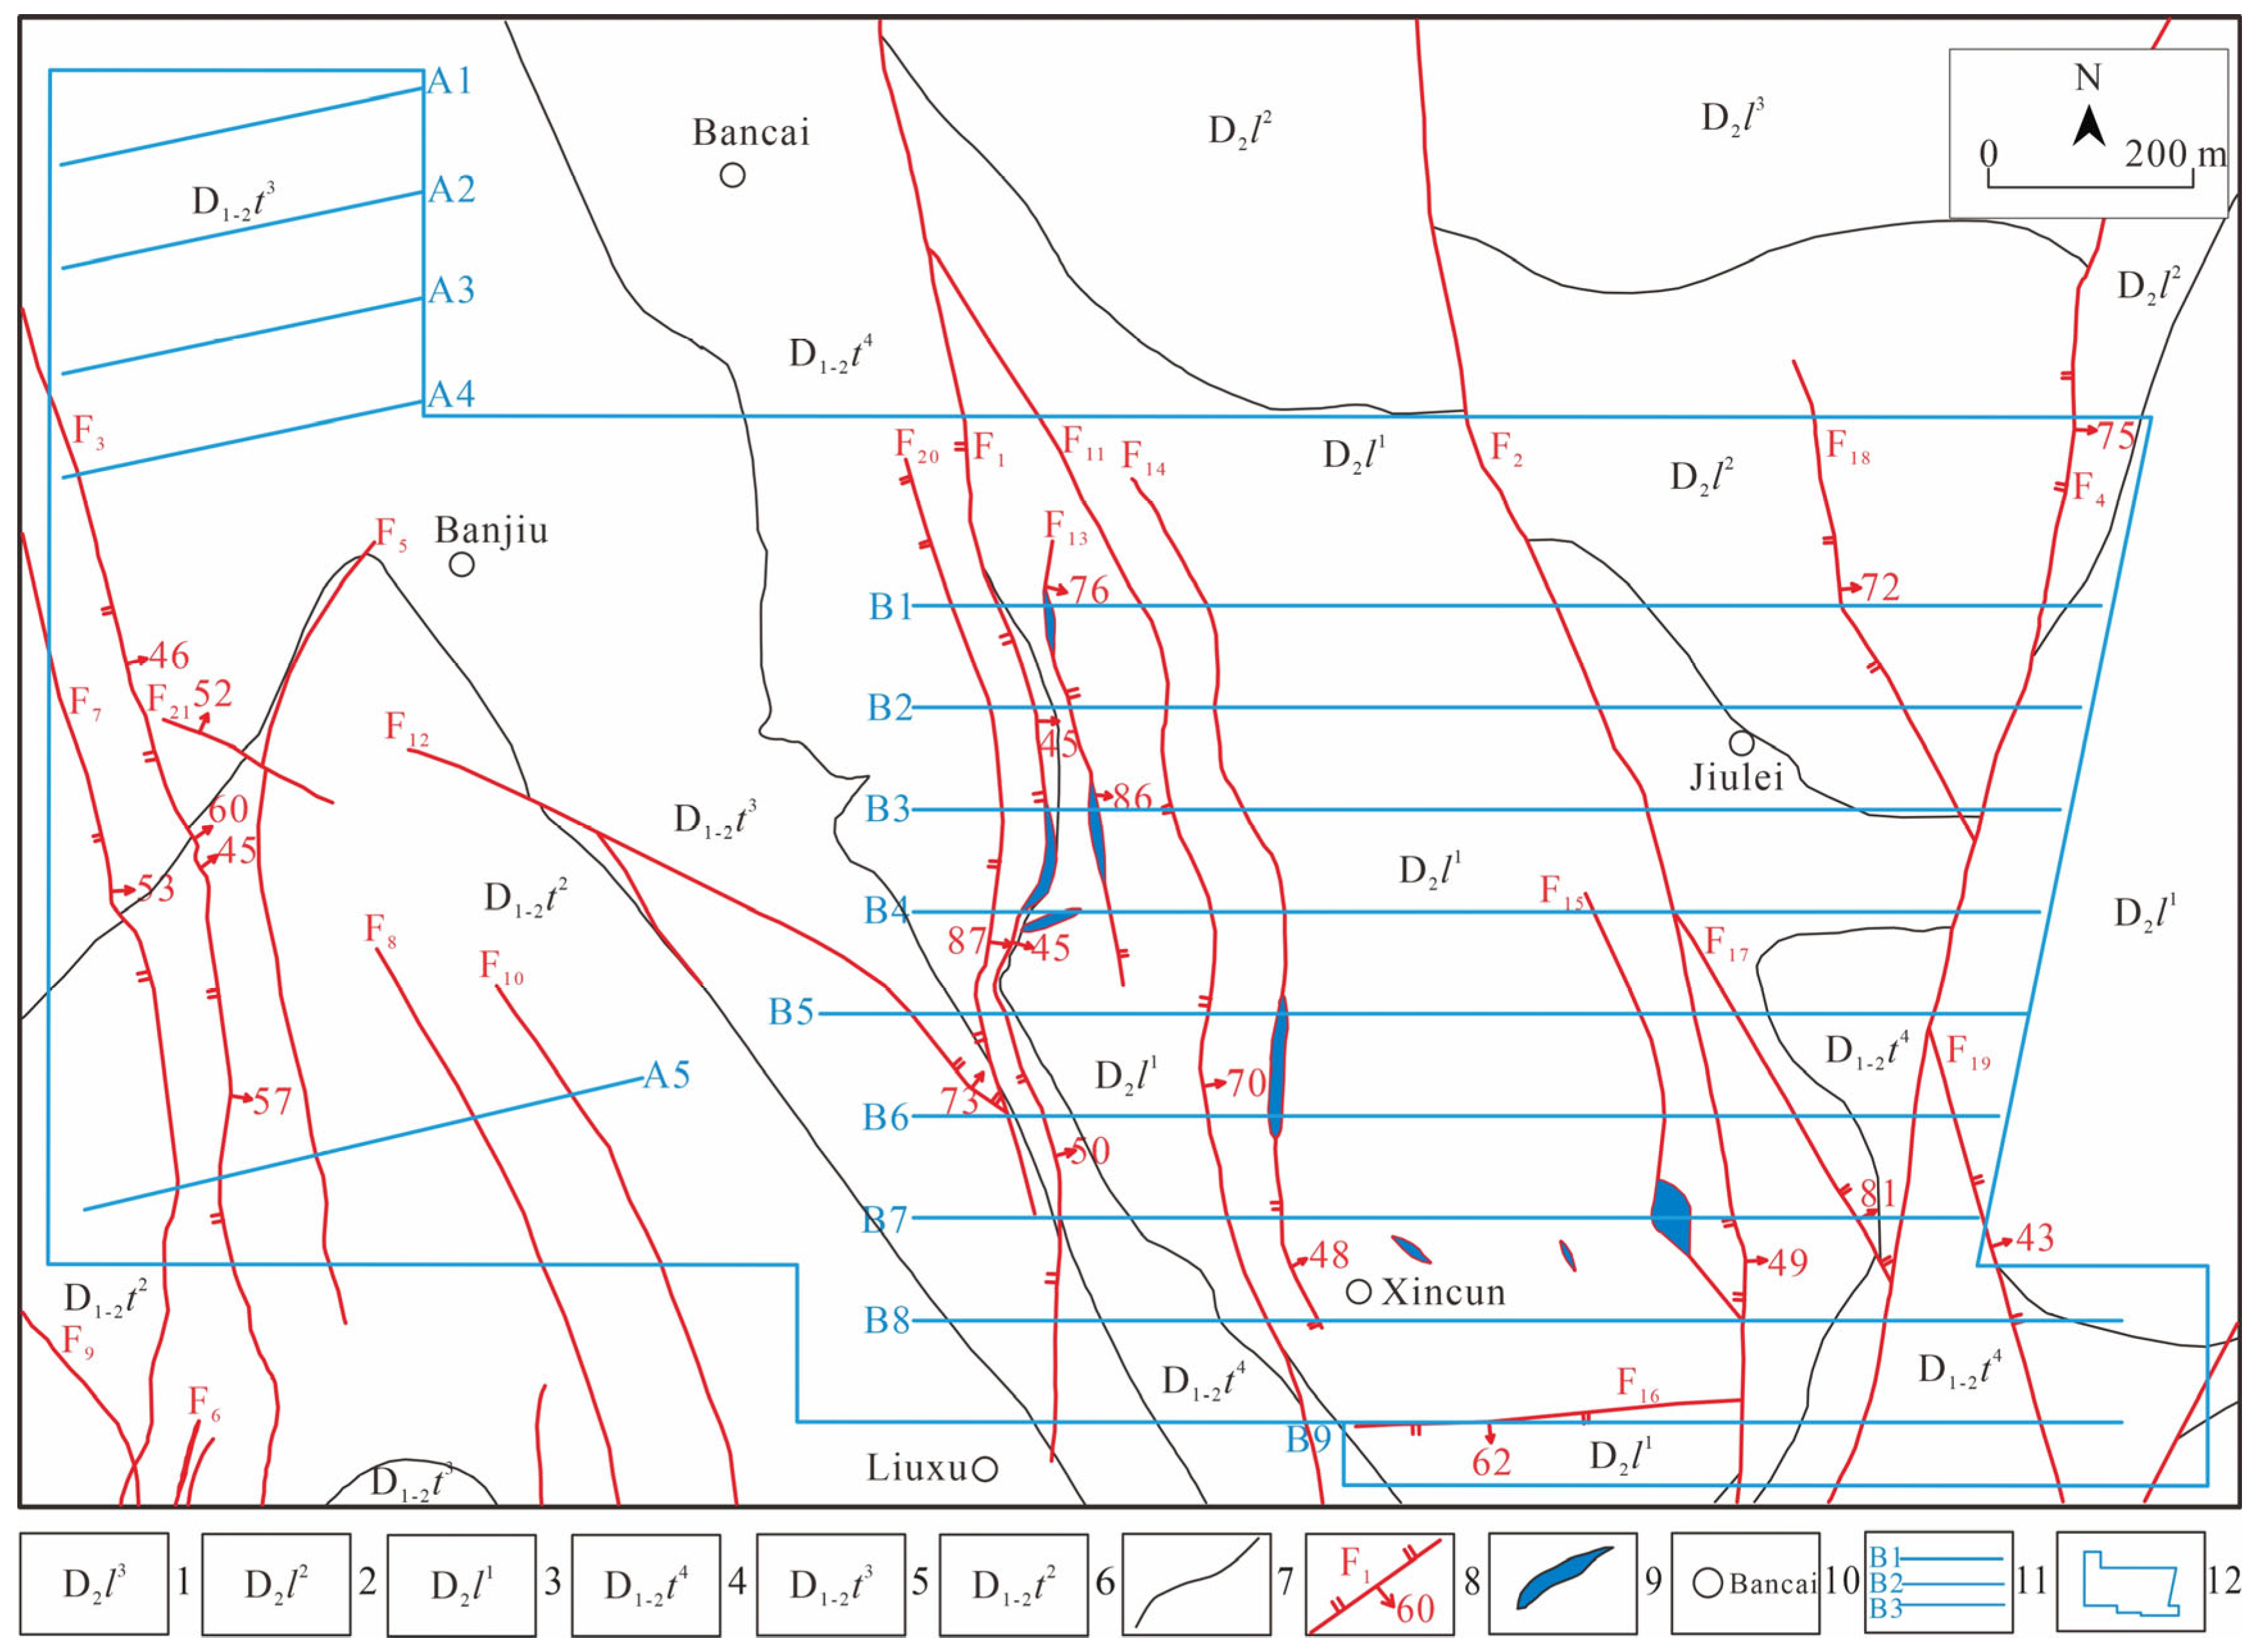
The field investigation in the Bancai Pb–Zn–Sb mining district was designed to evaluate the potential of finding concealed orebodies through the combined application of electro-geochemical approaches. Rather than applying the method uniformly from the outset, the survey layout was developed in accordance with the known geological framework and established mineralization patterns of the area. Fourteen rectangular grids were delineated (Figure 2), each spaced at 100 m × 200 m, resulting in 613 planned observation sites. Following the conventional exploration strategy of progressing from verified mineralized zones toward less constrained sectors, preliminary testing was first concentrated along the western A4 exploration line. This line coincides spatially with the previously confirmed No. 331 mineralized profile and includes drill hole ZK3311, providing a reliable reference for methodological assessment. Nineteen points were arranged at 20 m intervals along this section to evaluate signal responsiveness and anomaly stability. After the technical feasibility and anomaly reproducibility were verified, the survey was extended systematically across the entire mining area. In this way, the investigation simultaneously achieved two objectives: reconfirmation of known mineralized segments and predictive delineation of prospective zones beyond the limits of existing drilling control.
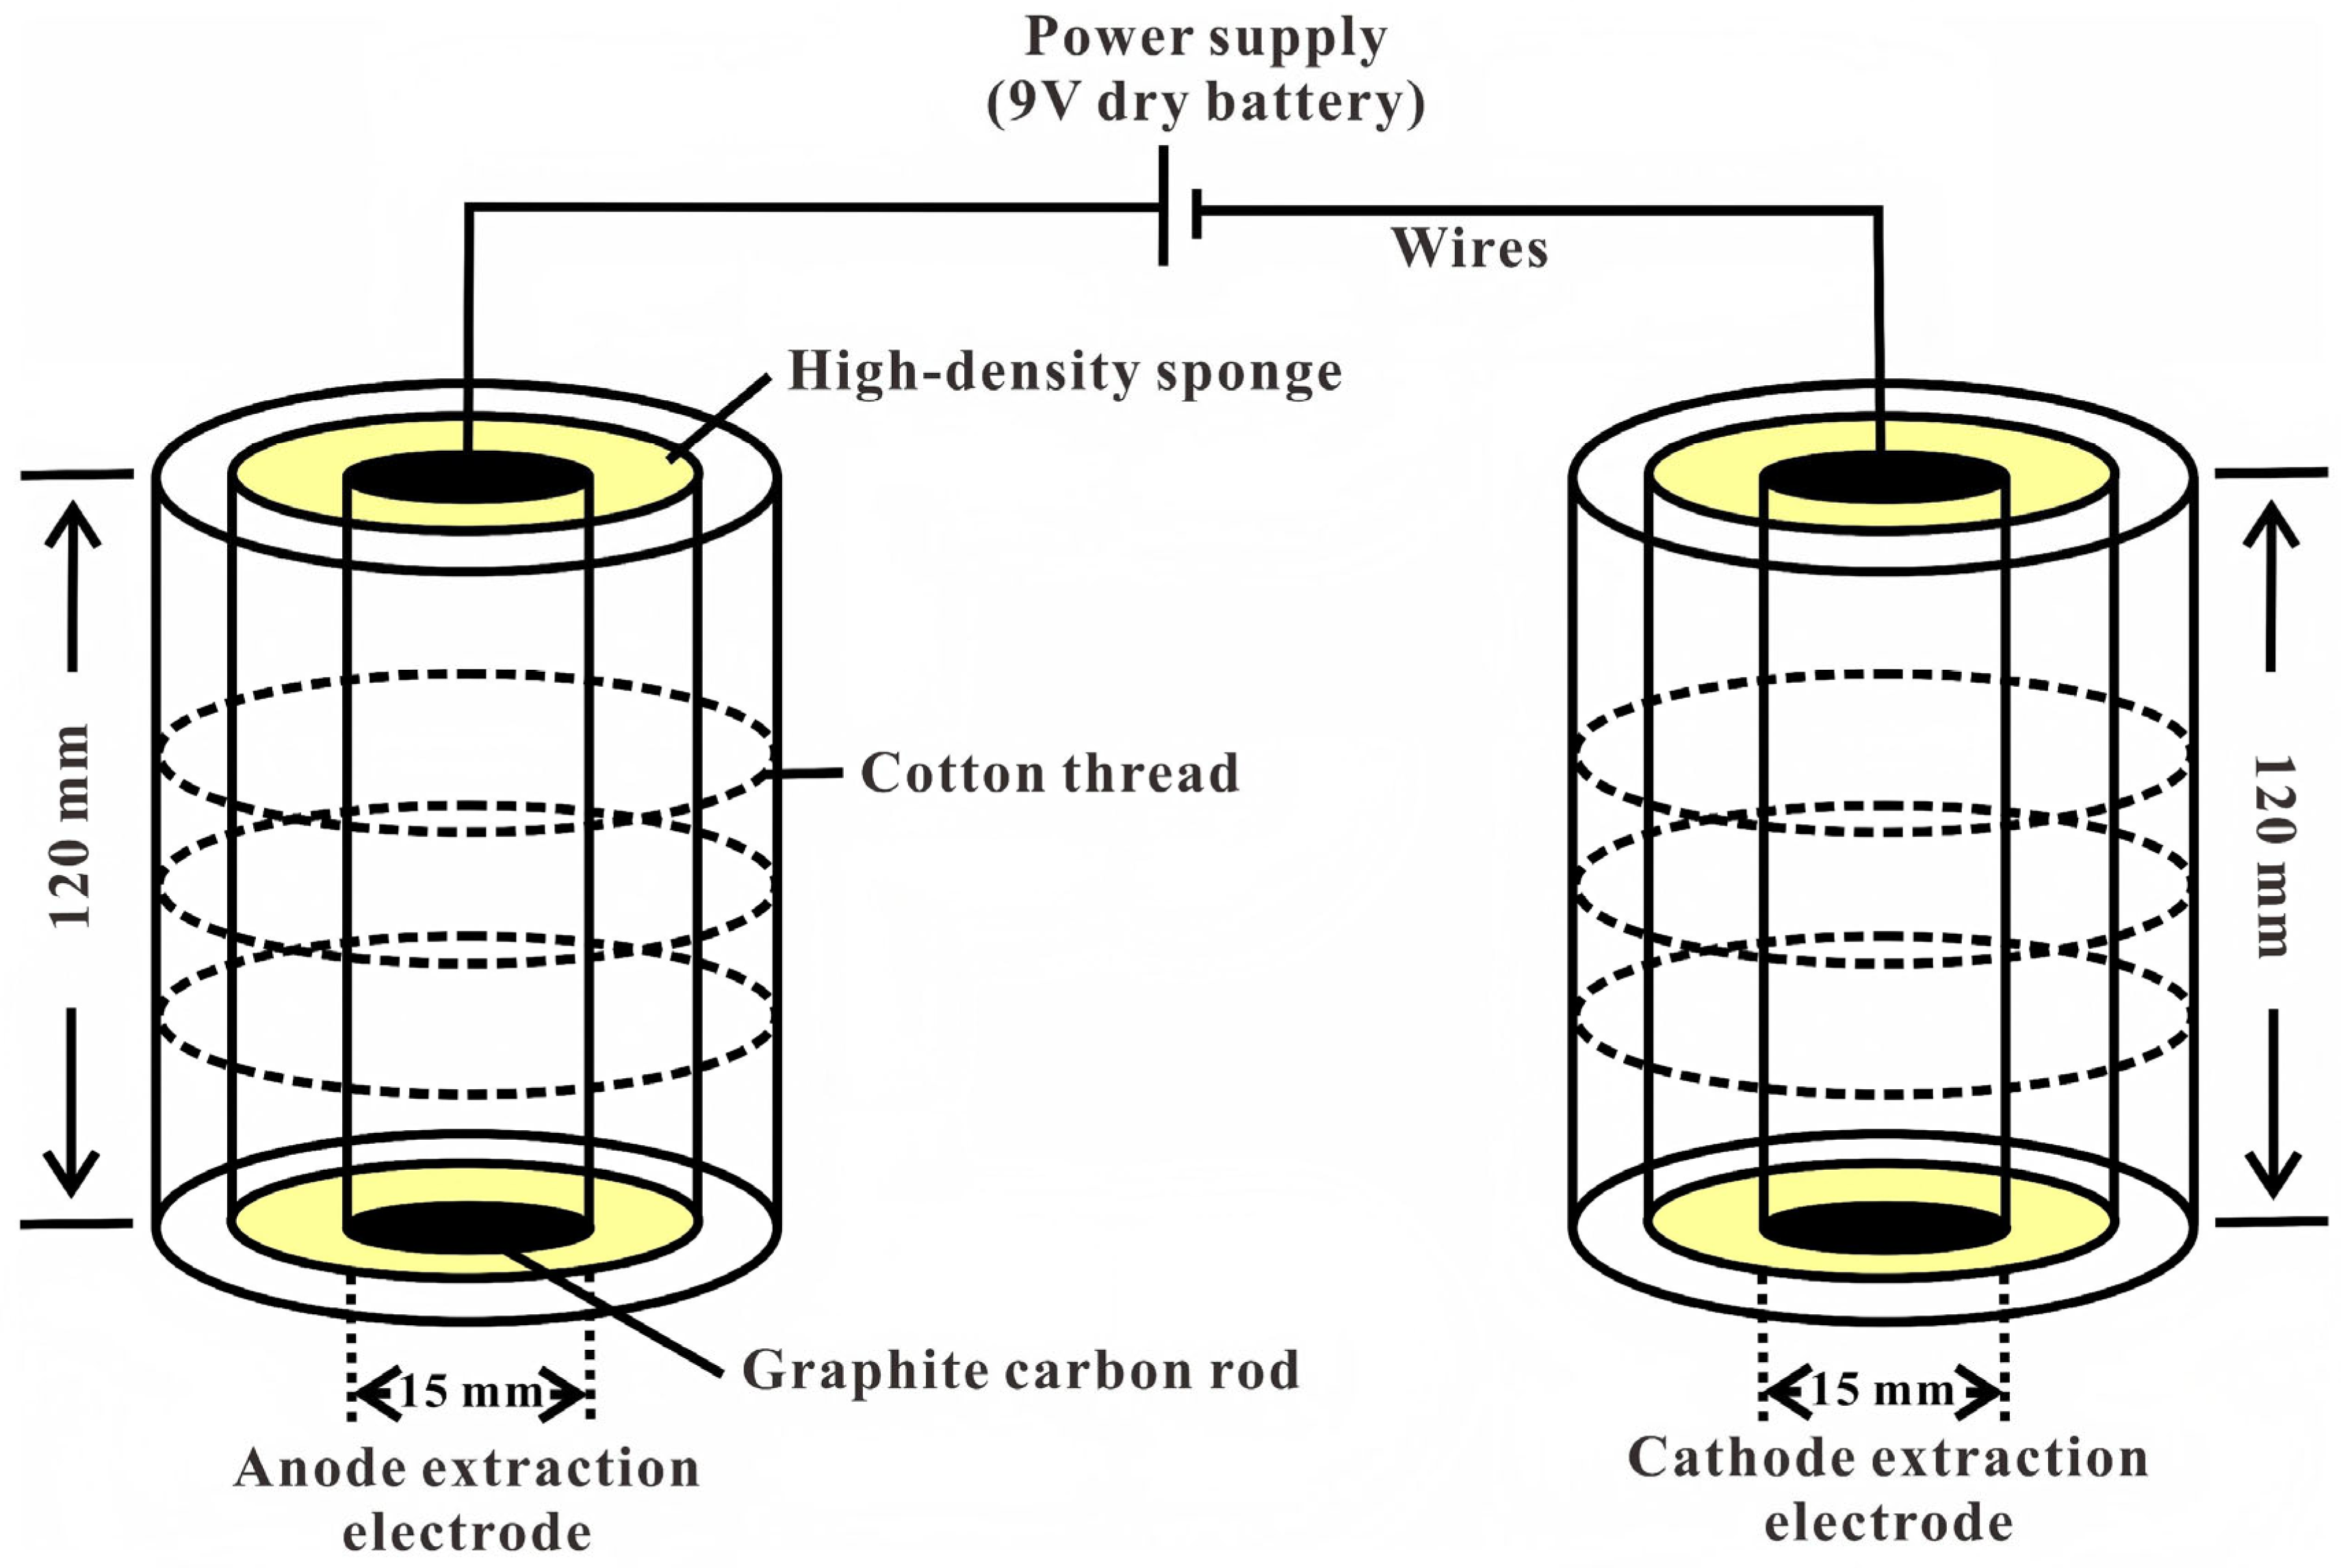
Sampling was carried out using a “low-voltage dipole” extraction system independently developed by the Institute of Hidden Ore Deposit Prediction, Guilin University of Technology. The apparatus operates on a 9 V dry battery and incorporates two highly conductive carbon electrodes wrapped in specially treated foam and filter material to enhance the ion adsorption efficiency (Figure 3). Under an applied electric field, mobile ions within the soil migrate directionally and are gradually enriched on the electrode surfaces. In the field, sampling locations were positioned with a handheld GPS device to ensure spatial accuracy. At each site, two pits approximately 50 cm in depth were excavated to reach the B-horizon soil layer and were spaced about 1 m apart. The paired electrodes were placed at the base of the pits and connected to the power source to establish a stable electric potential gradient. Prior to installation, the absorbers were saturated with a 15% dilute nitric acid solution to improve extraction performance. An additional 500 mL of the same solution was introduced into each pit (total 1000 mL) [25], followed by gentle mixing and backfilling to restore soil contact and maintain conductivity conditions. The system remained energized for 48 h to allow for sufficient ion migration and accumulation. Afterward, the electrodes were retrieved, the external foam coverings removed, and the samples sealed and labeled for subsequent laboratory analysis.
The collected foam adsorption samples were submitted to the Institute of Geophysical and Geochemical Exploration, Chinese Academy of Geological Sciences, for elemental determination. Considering the differing physicochemical properties and detection sensitivities required for specific trace elements, analytical techniques were selected accordingly. Sb concentrations were quantified using an atomic fluorescence spectrometry of the AFS-9700 model produced by Beijing Haiguang Instrument Co., Ltd., Beijing, China (AFS) due to its high sensitivity for hydride-forming elements. In contrast, Pb, Zn, Cd, Ag, Mo, Hg, and As were measured using an iCAP RQ ICP-MS, manufactured by Thermo Fisher Scientific, Waltham, MA, USA. Regarding this study’s implementation, a total of 579 valid measurement points were ultimately retained for interpretation, with 34 samples excluded due to procedural or quality considerations. Throughout field operations, strict control was maintained over critical parameters—including sampling depth, extraction solution concentration, and electrification duration—to reduce variability introduced by operational factors and ensure inter-site comparability. Laboratory analysis was conducted under a comprehensive quality control framework. In total, 28 duplicate samples and 2 procedural blanks were incorporated into the electro-geochemical foam analyses to monitor analytical precision and background interference, while 66 soil samples were randomly selected for independent ionic conductivity verification. Data reliability was assessed through consistency evaluation of duplicate pairs and correction based on blank baseline values. Prior to elemental determination, both ICP-MS and AFS instruments were calibrated using multi-point standard curves, and certified reference materials were periodically inserted during measurement to track instrumental stability. Following data acquisition, iterative statistical screening was applied to identify and remove anomalous values, thereby enhancing the robustness and overall credibility of the analytical results.

4. Feasibility Test Study

4.1. Principles and Influencing Factors of Electro-Geochemical Surveys

In recent decades, electro-geochemical techniques have emerged as an effective tool for probing concealed mineralization at depth. The method traces its conceptual origins to early geochemical extraction studies conducted in the former Soviet Union, but has since evolved into a more refined exploration approach with demonstrated success in a variety of metallogenic settings [6,27,28]. The underlying mechanism can be understood as a coupled electrochemical process operating within the near-surface environment. When an external electric field is imposed, metallic ions released through electrochemical dissolution respond to the potential gradient and migrate directionally through pore fluids and microfractures. Cations preferentially move toward the cathode, whereas anions drift toward the anode, leading to localized elemental enrichment at electrode sites. Over time, this selective accumulation generates measurable geoelectric anomalies that indirectly signal the presence of deeply buried orebodies [26,29]. Among the associated indicators, soil ionic conductivity (Con) provides a proxy for the concentration of dissolved ions in pore water and tends to increase in areas affected by hydrothermal alteration or structural fracturing. Similarly, anomalies in soil mercury release (RHg) reflect both the high mobility of Hg under low- to medium-temperature hydrothermal conditions and the upward migration of mineralizing fluids [16,30,31]. The geological framework of the Bancai mining district offers favorable conditions for the application of this method. Quaternary cover and fragmented sedimentary sequences overlie the ore-bearing structures [32,33,34], forming a heterogeneous medium in which clastic and karst landforms coexist. Such a setting facilitates ion transport along fractures and dissolution channels while limiting rapid groundwater flushing that might otherwise disperse geochemical signals. Since ion mobility is sensitive to moisture availability, extraction solutions were introduced during sampling to maintain a controlled and relatively stable water content, thereby enhancing the migration efficiency under the applied electric field. At a broader scale, faults act as the principal pathways for hydrothermal fluid ascent, and their electrical properties exert a strong influence on the geometry and intensity of resulting geoelectric anomalies within the mining area.

4.2. Geological Characteristics of the A4 Profile in the Study Area

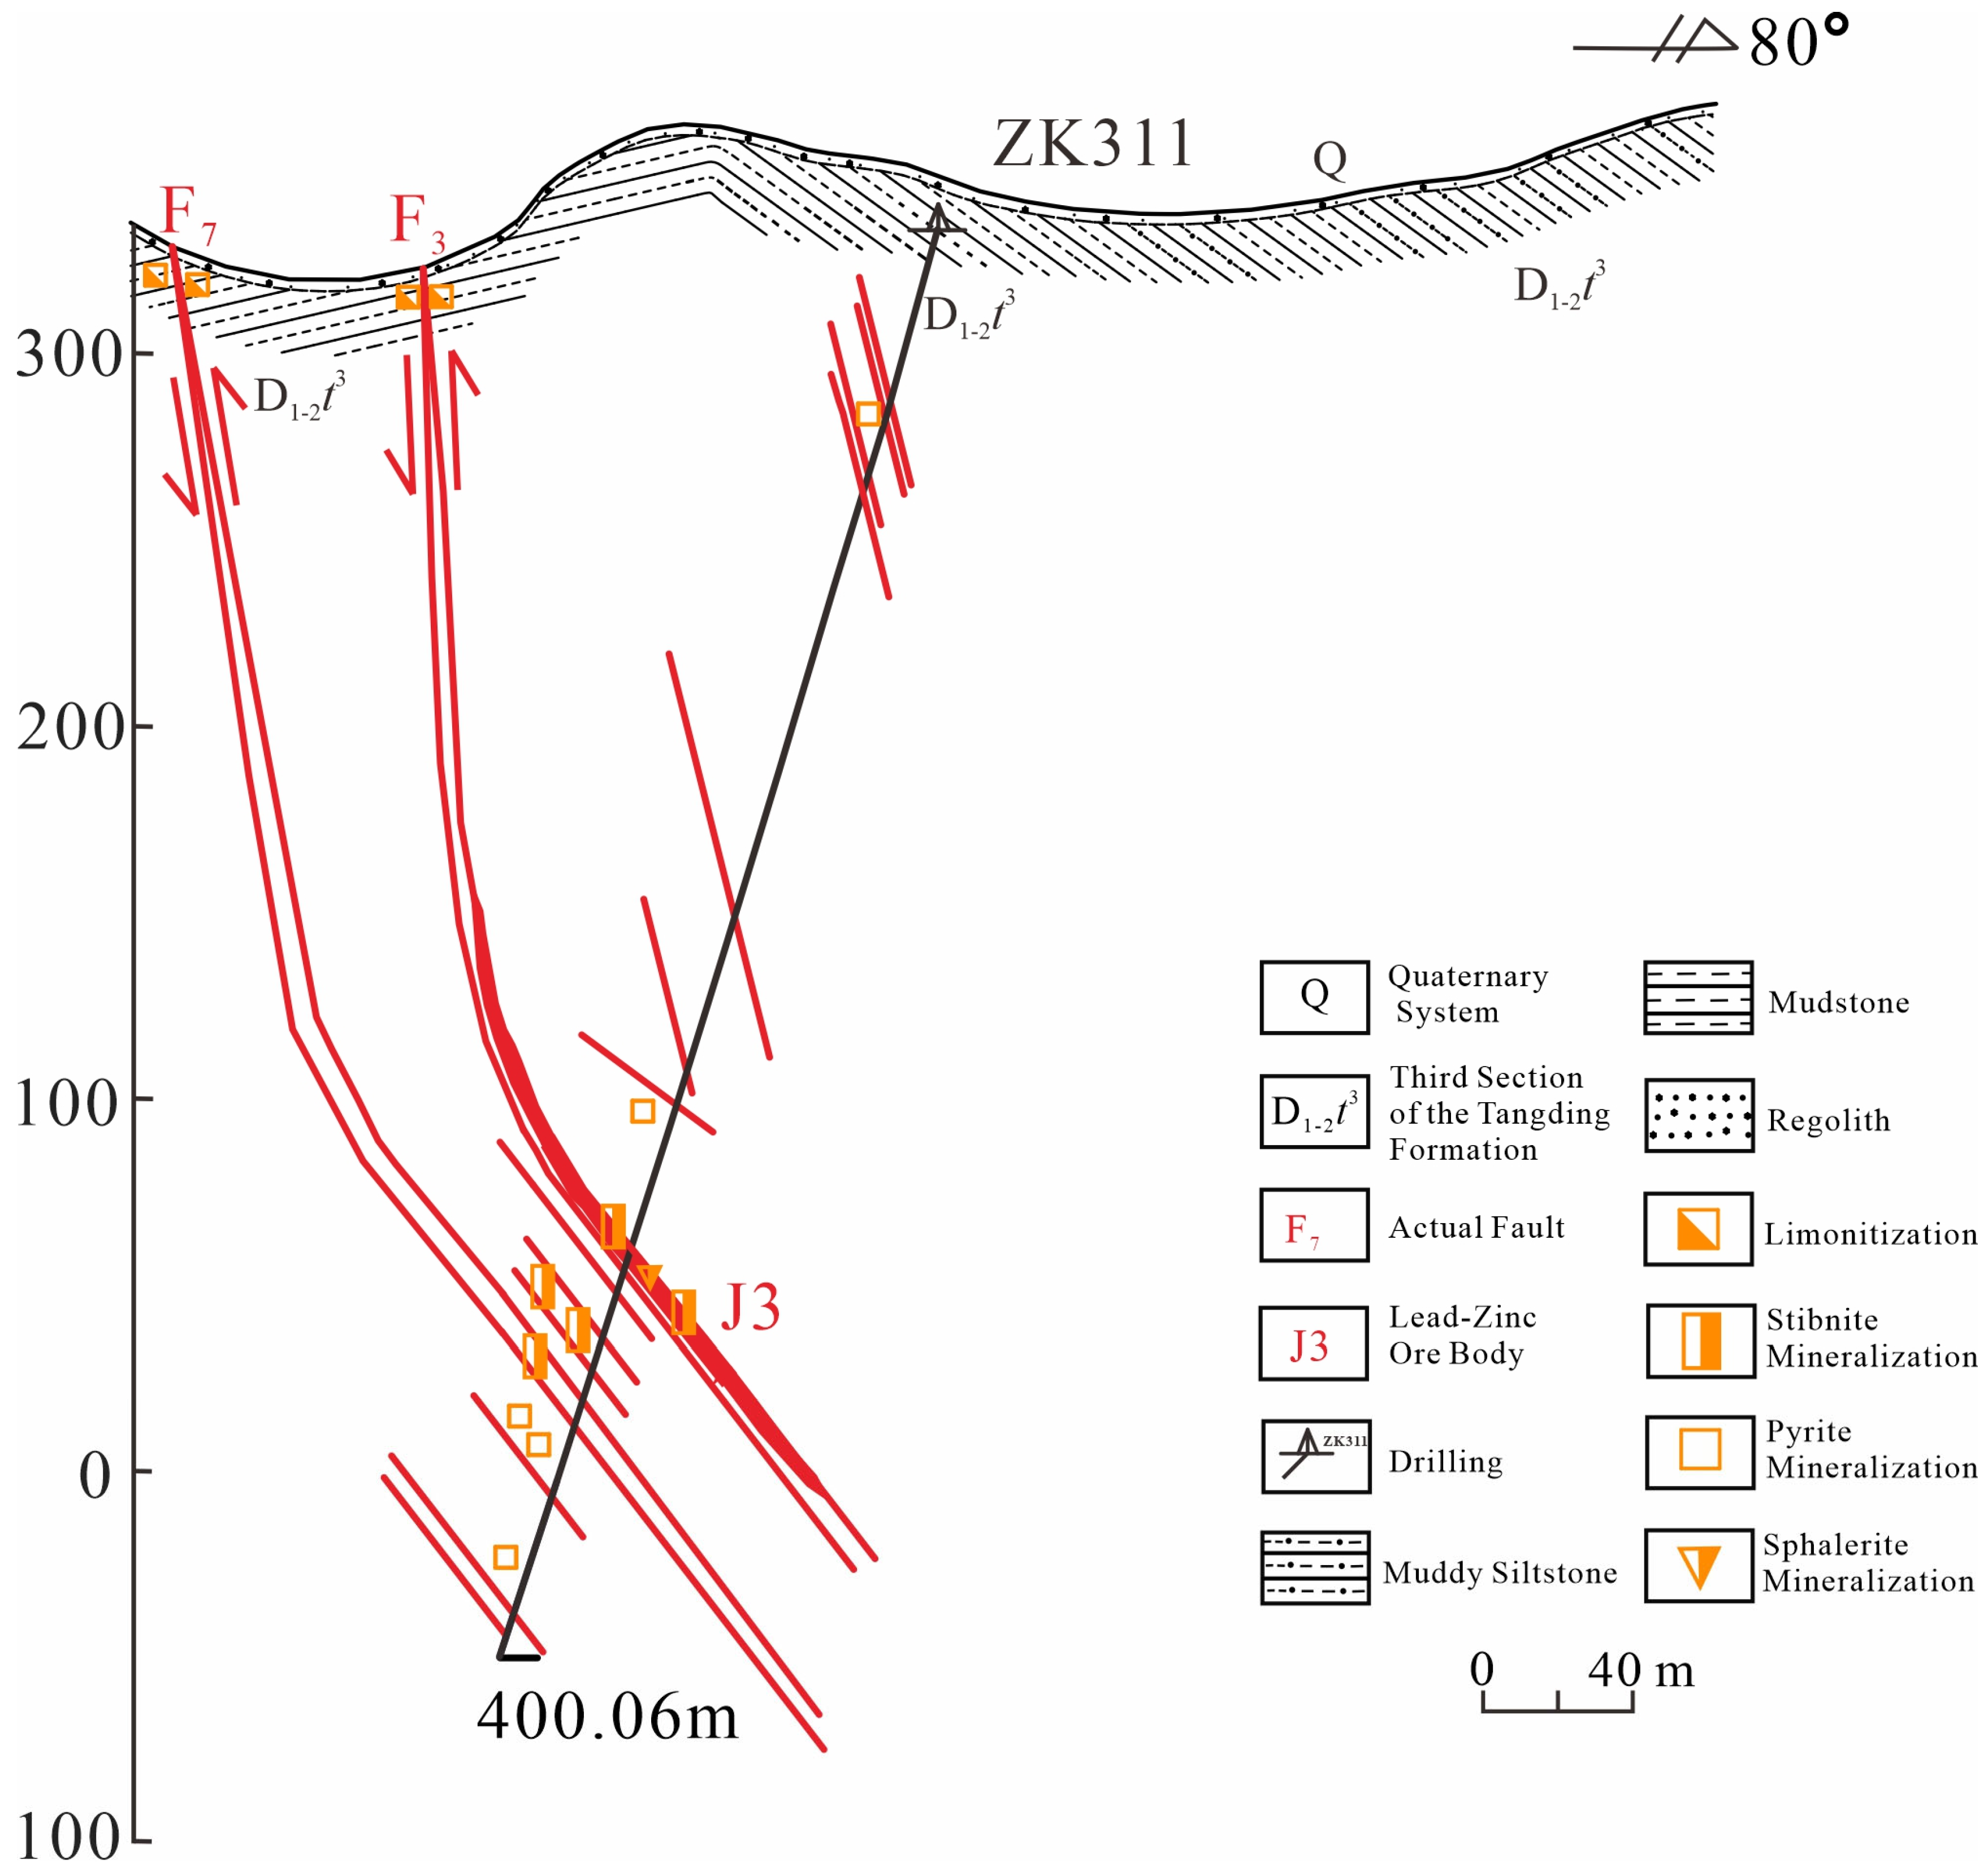
Section A4 is located in the northwestern part of the mining area, where the lead–zinc–antimony polymetallic orebody J3 has been delineated. Mineralization is strictly controlled by the F3 fault and occurs predominantly in vein-like forms. The orebody has a strike length of 60–100 m and a dip extent of 80–145 m, with thicknesses ranging from 0.36 to 4.88 m (with an average of 2.63 m). The average grades are Pb 0.61%, Zn 2.27%, Sb 0.58%, and Ag 16.4 g/t. The orebody is also associated with the F7 fault and several secondary structures. Host rocks are dominated by the third member of the Lower Devonian Tangding Formation (D1-2t3), consisting of thin- to thick-bedded mudstone interbedded with medium-bedded siltstone. Alteration types include silicification, carbonatization, sericitization, and pyritization, all closely related to mineralization (Figure 4). Ore textures are broadly disseminated, scattered, and finely vein-like, occurring within calcite veins, quartz veins, or mudstone fractures. The orebody exhibits a lotus-jointed geometry, characterized by repeated pinching and swelling along strike and dip.

4.3. Electro-Geochemical Anomaly Characteristics of Ore-Forming Elements Extracted by Electrochemical Methods from the A4 Profile of the Test Area

Although univariate anomaly analysis can identify independent anomaly zones of each element, it cannot reveal the coexisting combination relationships between multiple elements. Although bivariate correlation can reflect the degree of linear correlation between two elements, it is difficult to simultaneously analyze the internal structure of multiple elements and even more so to trace the deep geological processes that control the combination of elements [35]. Given the characteristics of polymetallic coexistence in the Bancai mining area, it is necessary to introduce multivariate statistical methods to explore the implicit mineralization information in the data from the perspective of element combinations.
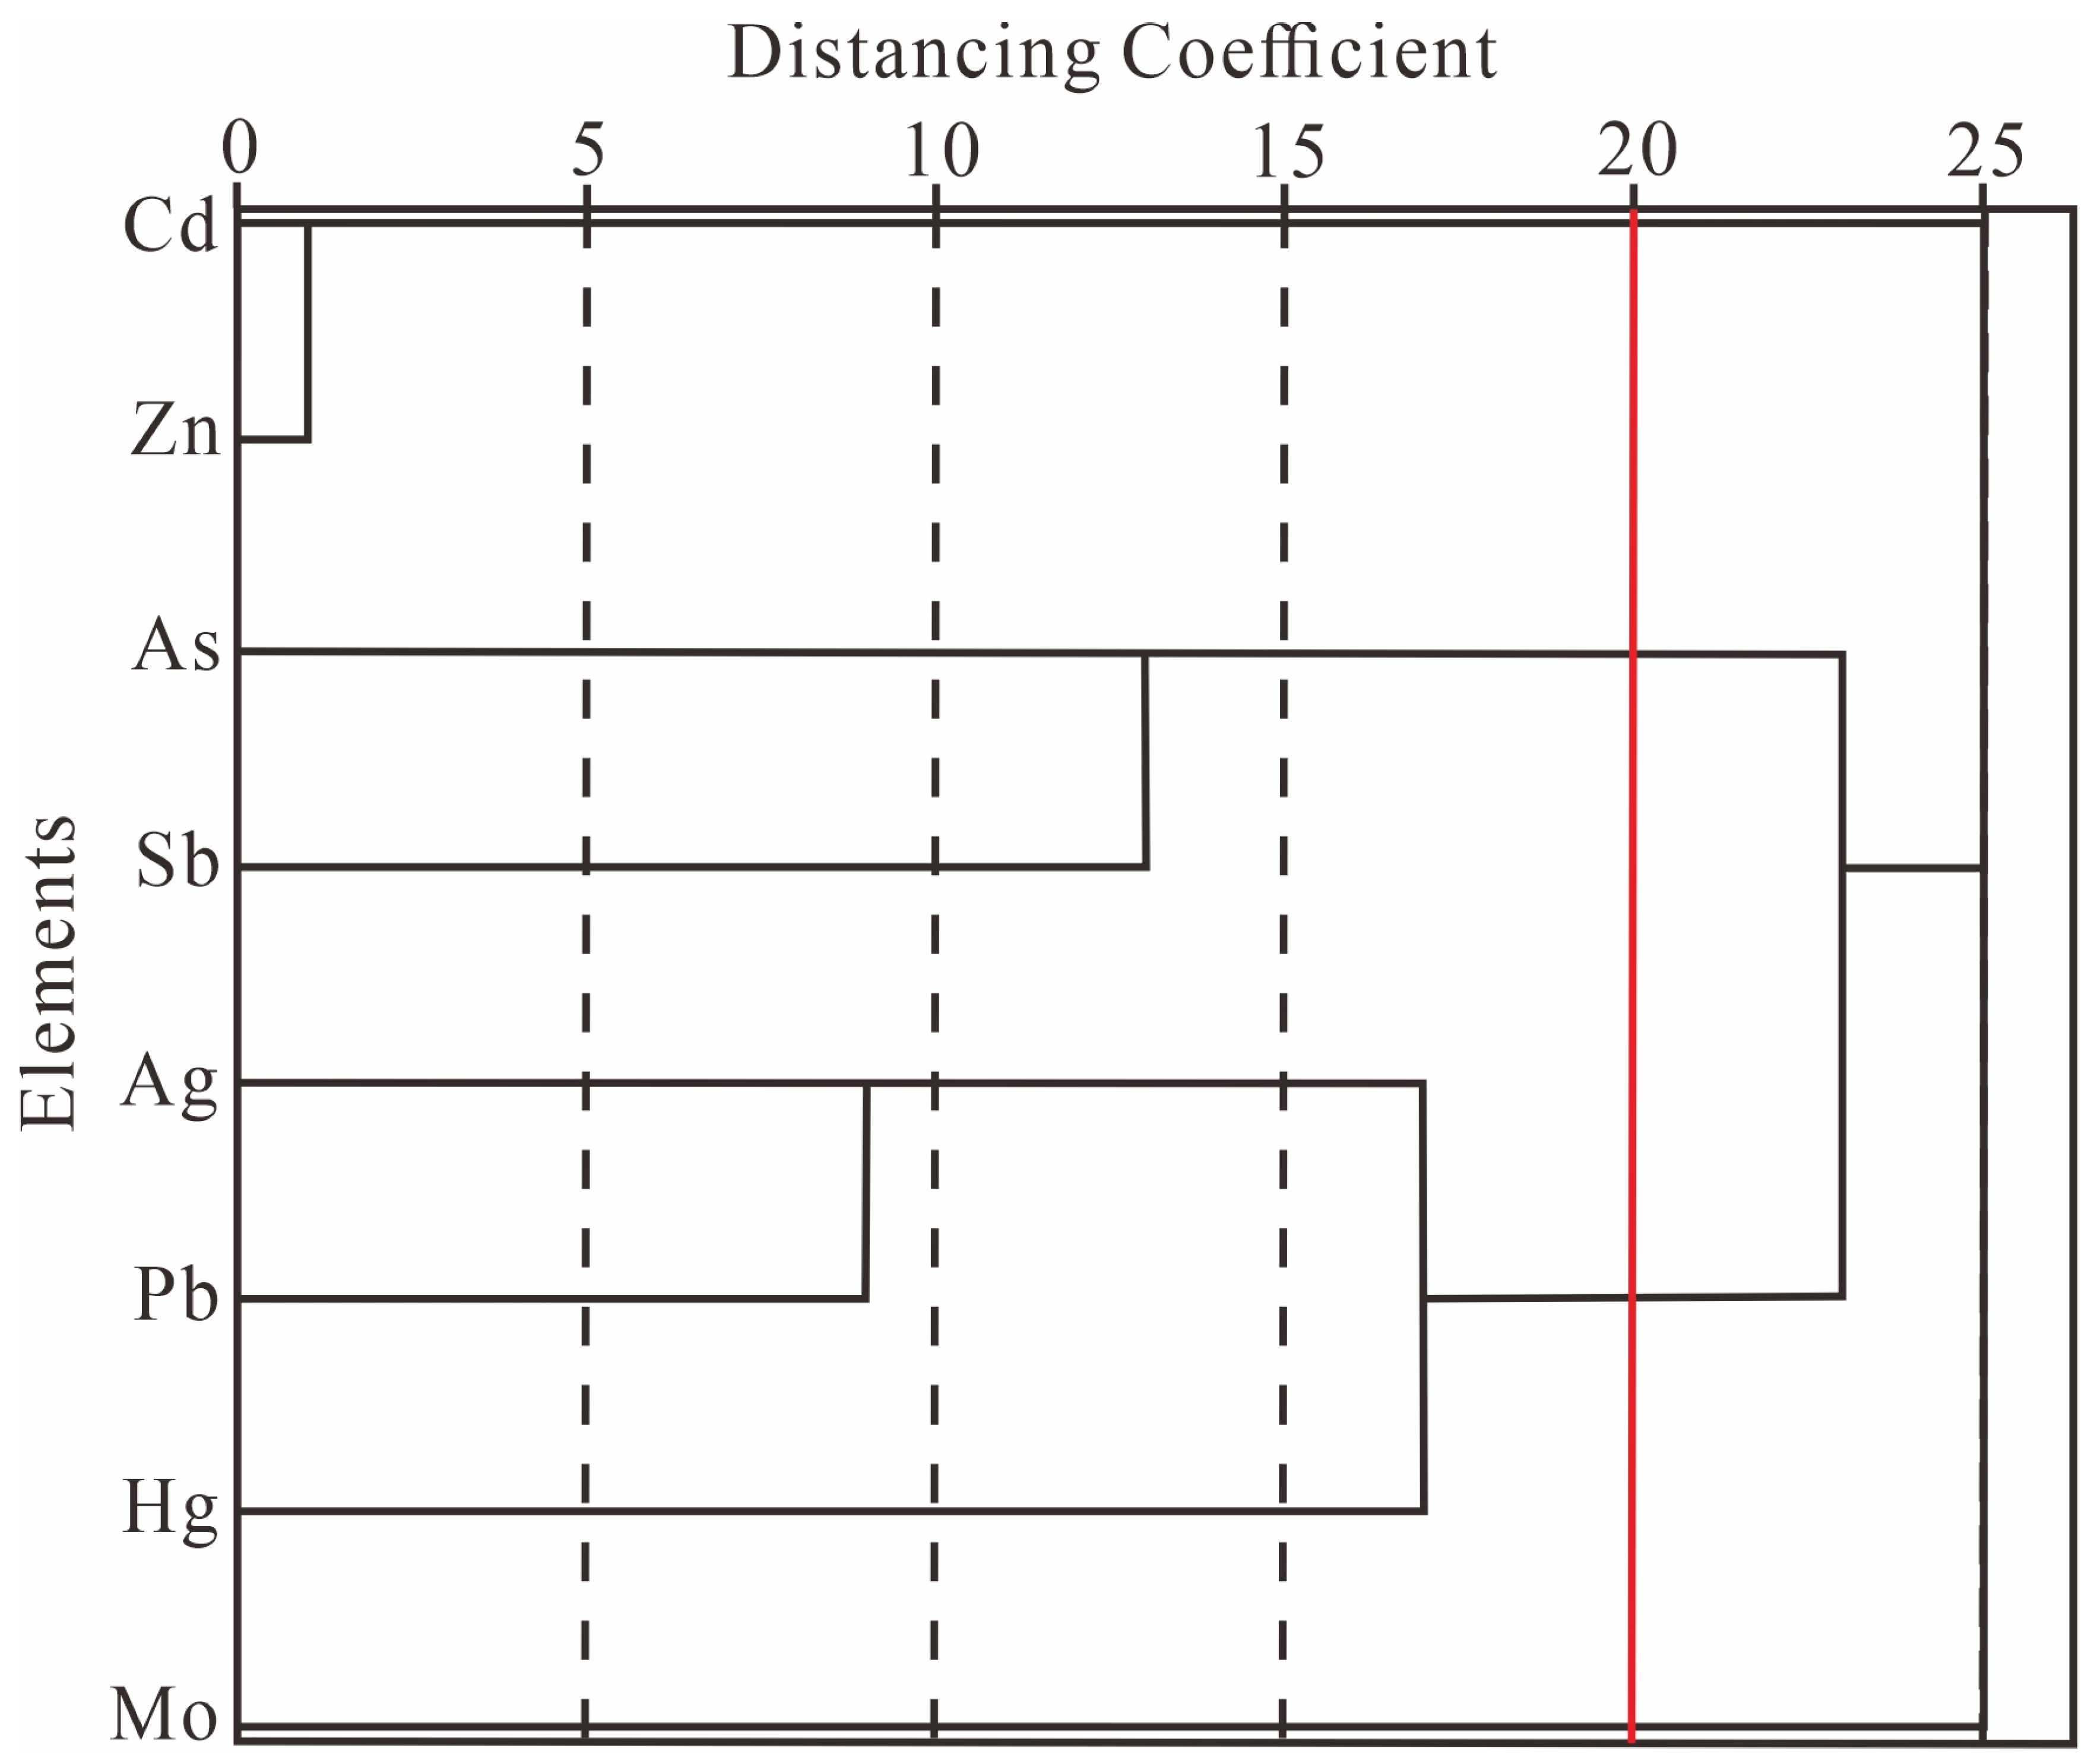
R-type cluster analysis is a method used to classify elements. It can be used to understand the natural combination relationship between the main ore-forming and related elements, and reveal the affinity between them. In contrast to bivariate correlation, which can only provide the correlation coefficient between two elements, cluster analysis visually presents the natural groupings of multiple elements in a dendrogram, answering the key question of which elements can naturally be categorized together. R-type factor analysis can achieve dimension reduction; group many elements into several element assemblages; and interpret diagenetic processes, mineralization, and geological–geochemical phenomena that exist in the study area from a geochemical perspective. By using factor assemblages instead of original variables, this approach more effectively reflects the intrinsic relationships between geological phenomena, while the correlations between the original variables remain largely unchanged. According to the R-type cluster analysis dendrogram (Figure 5), when the distance coefficient is set to 20, the eight analyzed elements can be classified into four distinct element assemblages: ① Cd–Zn, ② As–Sb, ③ Ag–Pb–Hg, and ④ Mo.
The results of the R-type factor analysis are consistent with those of the R-type cluster analysis and allow the elements to be classified into four factor assemblages: F1 (Cd–Zn), F2 (Ag–Pb–Hg), F3 (As–Sb), and F4 (Mo). The cumulative variance contribution of these four factors reaches 85.574%, indicating that they effectively represent the principal elemental information of the mining area (Table 1). Factors F1, F2, and F3 correspond to the main mineralization stage. The elements within these assemblages are predominantly medium- and low-temperature chalcophile elements that tend to form sulfides. These characteristics reflect, to a certain extent, medium-acidic magmatic activity, frequent tectonic movements, and multi-stage magmatic processes, which together provide favorable geological conditions for multi-stage mineralization in the study area. This interpretation is consistent with the tectonic setting of the Bancai area and clearly reflects the geochemical characteristics of lead–zinc–antimony mineralization [36,37,38]. Factor F4 consists solely of Mo, which is a high-temperature-tolerant element. Mo exhibits strong activity at temperatures above 420 °C and is capable of migrating and becoming enriched within hydrothermal fluids. Its precipitation occurs when the temperature decreases or when physicochemical conditions change, indicating an association with high-temperature magmatic mineralization.
The observed elemental assemblage can be more convincingly interpreted when considered within the broader geodynamic framework of the southern Danchi metallogenic belt, where the Bancai deposit is situated. The region is structurally dominated by north-northwest-trending faults that have long served as preferential conduits for hydrothermal fluid ascent. Historically, these structural corridors facilitated not only fluid migration but also localized mineral precipitation. At the same time, intermediate to acidic magmatic intrusions provided a sustained thermal and material source, contributing metals and driving fluid circulation. The superposition of these structural and magmatic processes gave rise to a complex evolutionary history characterized by multiple hydrothermal pulses. Early high-temperature magmatic–hydrothermal activity was subsequently overprinted by more extensive low- to medium-temperature mineralizing stages, ultimately producing the composite mineralization pattern documented in the district [39,40].
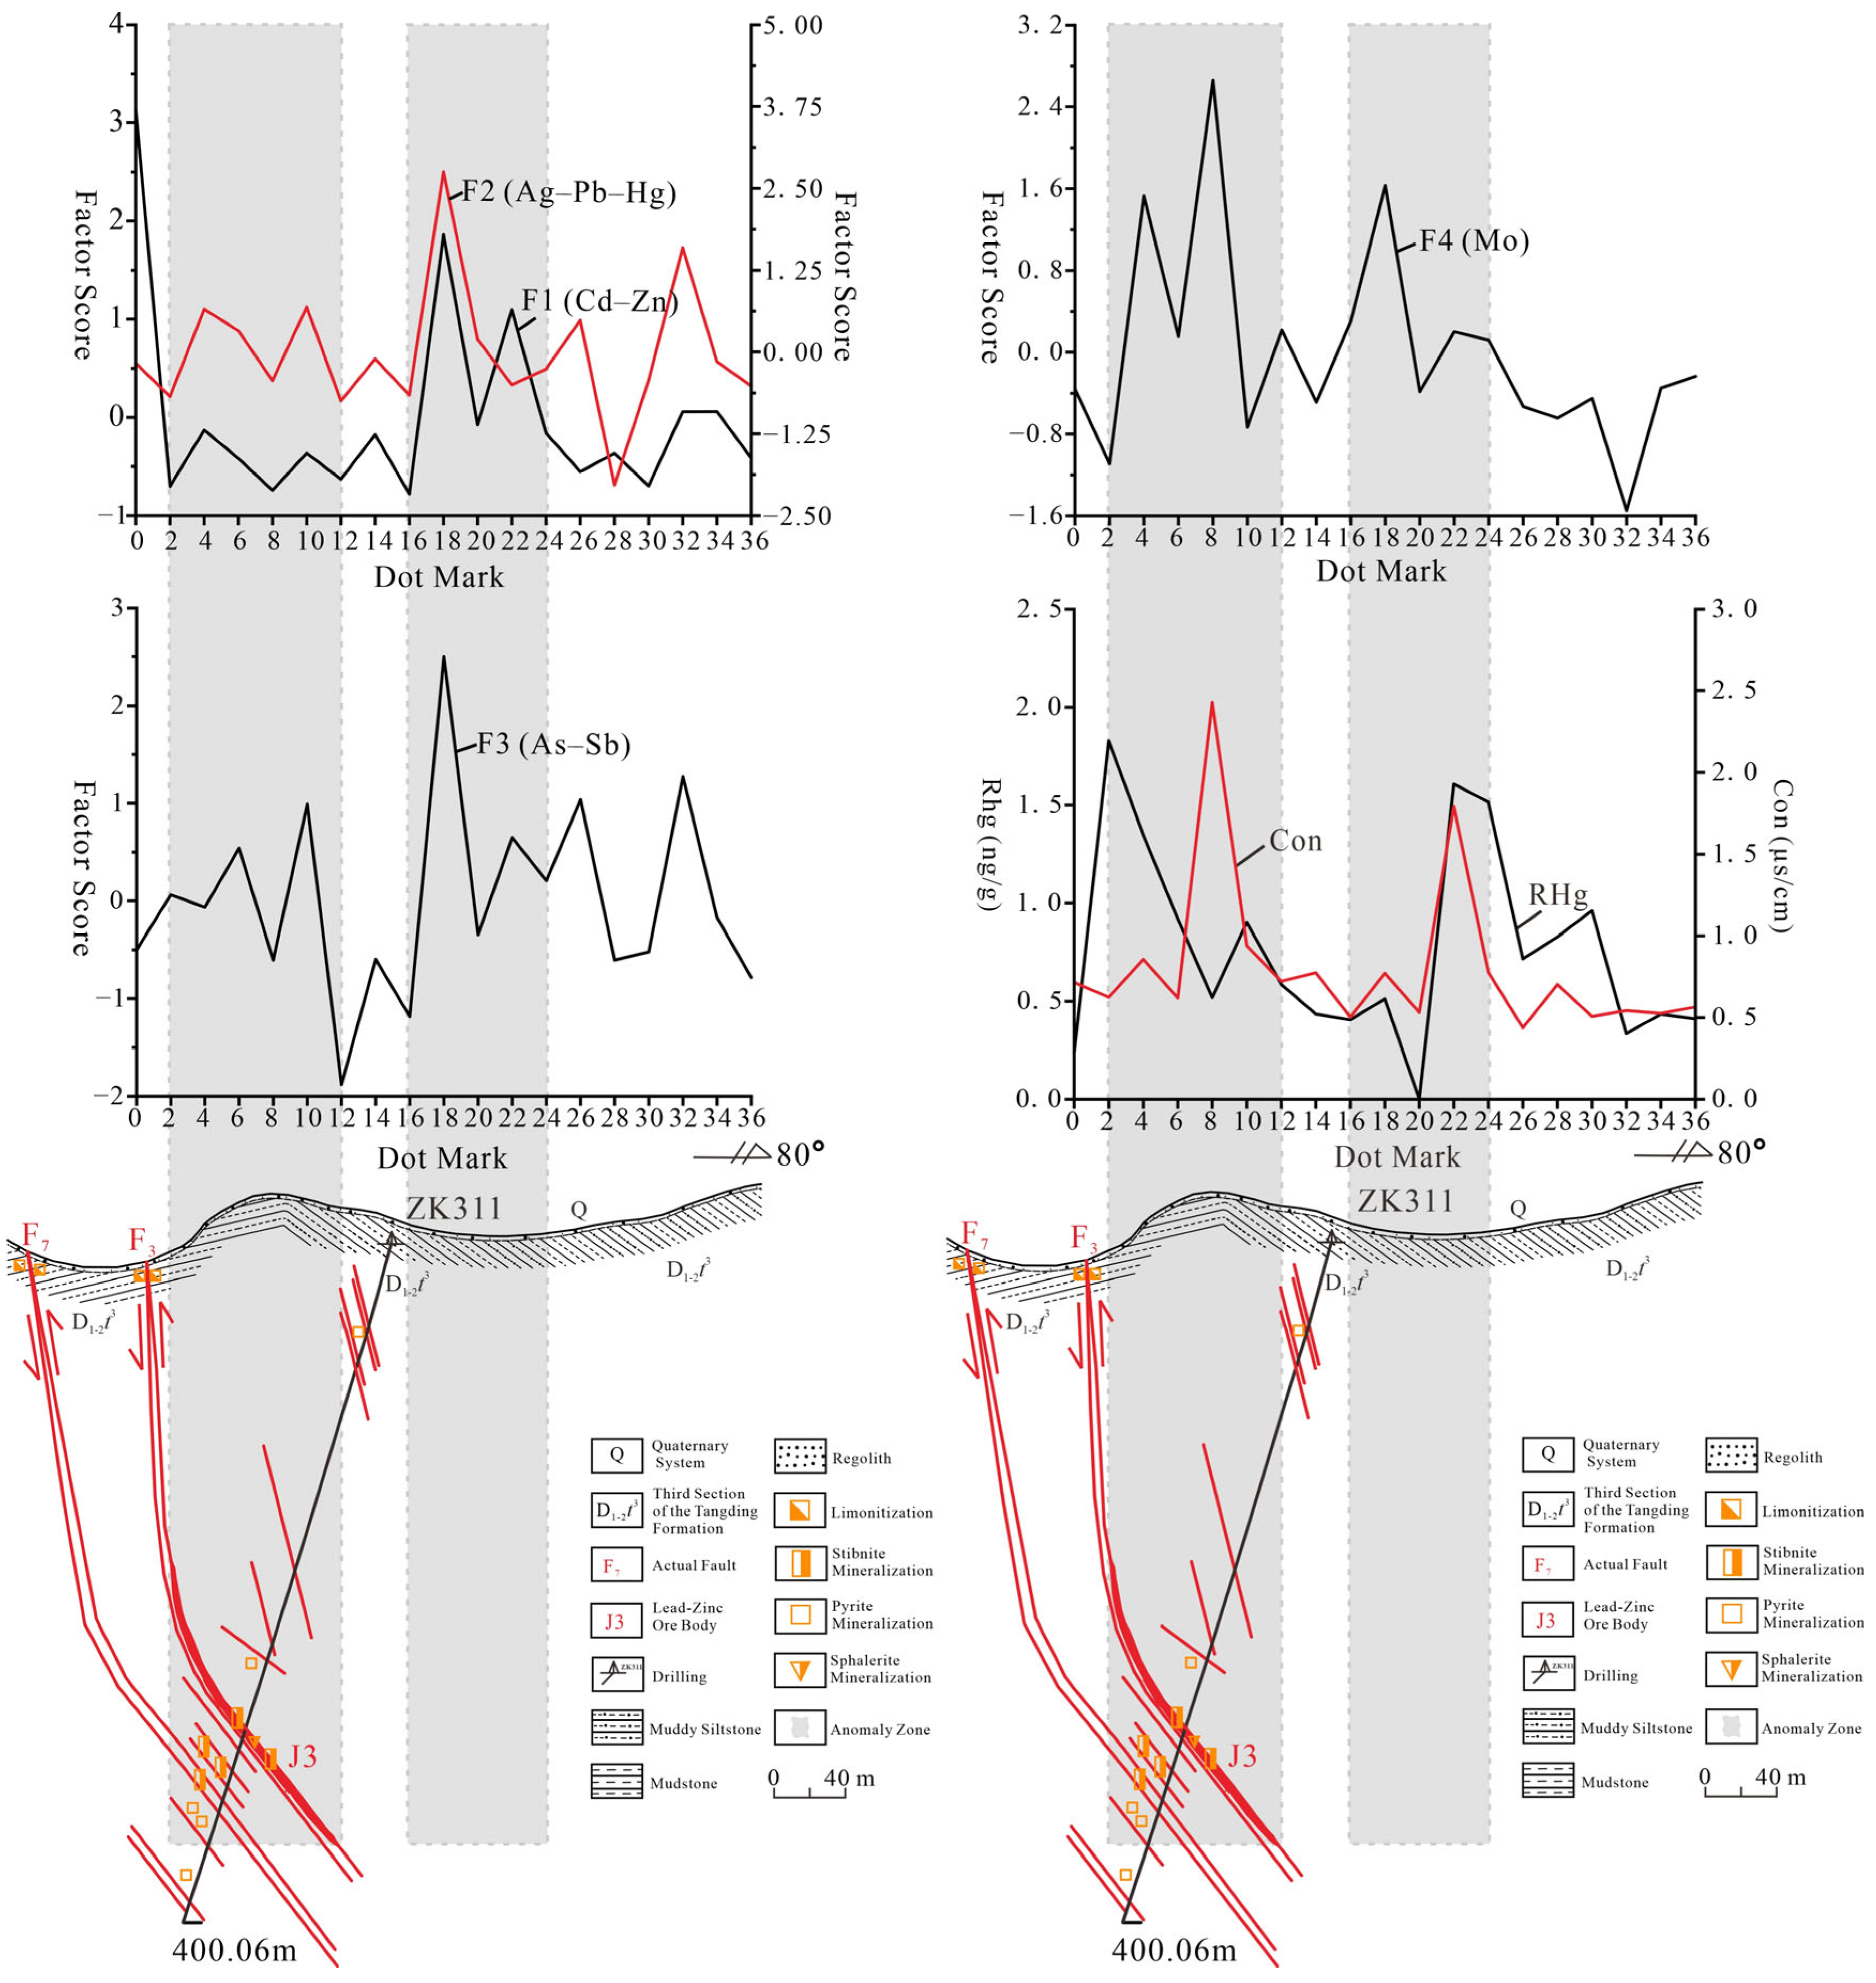
Based on the classified element assemblages, A4 cross-section geological and engineering control (Figure 4) and factor score profile anomaly profiles were generated using Origin 2020 and CorelDraw 2021 (Figure 6). The results are described as follows:
(1) All element assemblages display anomalous peaks in the profile. Distinct F1 (Cd–Zn) and F2 (Ag–Pb–Hg) anomalies, approximately 100 m wide, occur between points 2–12 above the J3 orebody, forming a characteristic “small double-peak” pattern. Under near-surface electrochemical conditions, the behavior of ore-forming elements is largely governed by their mineralogical occurrence and mobility characteristics. For example, the dissolution of sphalerite releases Zn2+ and Cd2+ into pore fluids, where both species tend to migrate in ionic or colloidal form [41,42]. Owing to their comparable ionic radii and geochemical affinities, their transport velocities are broadly similar, which explains the consistently strong positive correlation observed between Zn and Cd in the anomaly patterns. Pb displays a different but equally diagnostic association. As galena represents the principal Pb-bearing phase in the study area, and Ag is predominantly incorporated within the galena lattice, coupled Pb–Ag anomalies reflect their shared mineralogical source rather than independent enrichment processes [43]. Hg, in contrast, is distinguished by its low melting point and high volatility. In low- to medium-temperature hydrothermal systems, Hg can be readily mobilized and transported upward, either in vapor form through fumarolic activity or in dissolved form via groundwater circulation. This high mobility often produces dispersed but detectable surface signatures. This configuration reflects the steep, vein-like morphology of the orebody controlled by the F3 fault and shows strong spatial correspondence with the rich-grade mineralization already observed. Similarly, the F3 (As–Sb) and F4 (Mo) assemblages exhibit comparable double-peak anomalies over the same interval, collectively indicating the lower part of the concealed J3 lead–zinc–antimony orebody. As and Sb exhibit comparable behavior in tectonically active hydrothermal settings. Typically occurring as arsenopyrite and stibnite, respectively, both elements demonstrate strong fluid affinity and enhanced migration capacity along fractured zones. Their spatial concurrence in surface geochemical anomalies therefore provides a particularly sensitive indicator of Sb-related mineralization [44,45].
(2) A prominent single-peak anomaly of soil ionic conductivity (Con) is developed between points 2 and 12, with a maximum value of 1.551 μs/cm, approximately 1.5 times the background (1.012 μs/cm). Soil mercury release (RHg) shows an asymmetrical double-peak anomaly in the same interval, reaching 1.978 μs/cm (1.3 times the background of 1.484 μs/cm). Both anomalies exhibit good spatial agreement with the known orebody. The upward migration of Hg, facilitated by its low melting point, likely contributes to the formation of detectable surface anomalies.
(3) In the interval between points 16 and 24, beyond engineering control, anomalous responses are observed in the F1 (Cd–Zn), F2 (Ag–Pb–Hg), F3 (As–Sb), and F4 (Mo) assemblages, as well as in terms of soil ionic conductivity and mercury release. These anomalies can be attributed to a mineralized zone controlled by secondary faults on the western side of the F3 footwall, near the structural transition from NNW to NW at the plunging end of the Wuxu anticline. A NW-trending secondary fault (F12 branch), characterized as a tension–torsional structure, is developed in this area and is accompanied by silicification and pyritization, with stronger alteration than along the F3 main fault [22,46]. Acting as secondary conduits for ore-bearing fluids, these faults may facilitate upward element migration along fracture zones, generating surface anomalies away from the main orebody.
These observations are consistent with previous studies showing that soil ionic conductivity anomalies commonly coincide with electro-geochemical extraction anomalies, with low-value zones embedded within high-value conductivity anomalies. The A4 profile exhibits similar spatial coupling, indicating a close relationship between conductivity and electro-geochemical anomalies.
Overall, the feasibility test demonstrates that integrated electro-geochemical surveys effectively reflect the spatial distribution of deep, concealed orebodies and are suitable for the exploration of lead–zinc–antimony deposits in the study area. However, certain limitations remain. First, the coverage of the A4 section is insufficient, particularly along the western margin, which restricts the delineation of anomaly distribution patterns within mineralized zones. The restricted coverage constrains the accuracy of mineralization recognition and may lead to the omission of localized small-scale orebodies. Second, spatial heterogeneity in overburden moisture content and fracture permeability, as well as the influence of spatial heterogeneity on anomaly intensity, remains insufficiently explored. Further validation in multiple mining districts is still required to verify the universality of the proposed model.

5. Prospecting Markers and Prospecting Models

5.1. Prospecting Markers

Based on the electro-geochemical anomaly characteristics identified in the profile and regional metallogenic conditions, geological–electro-geochemical prospecting indicators for lead–zinc–antimony deposits in Bancai are comprehensively summarized as follows:
(1) Geological prospecting indicators: Geological indicators include stratigraphic, structural, and alteration characteristics. The Bancai deposit is hosted mainly in Devonian and Carboniferous strata, with the Lower Devonian Tangding Formation constituting the principal ore-bearing horizon. The second member of the Tangding Formation consists predominantly of thin-bedded mudstone with local sandstone and sandy mudstone intercalations, in which disseminated pyrite is widely developed and represents the primary ore-bearing layer. The third member is characterized by thin- to thick-bedded mudstone interlayered with argillaceous siltstone, displaying brownish-yellow weathering, spheroidal weathering structures, and local pyrite mineralization, forming an important mineralized horizon. Structurally, the mining area is located at the northern plunging end and northeastern limb of the Wuxu anticline. The Jianzhupo torsional fault zone, developed near the anticline axis, comprises a series of steeply dipping (60–80°) [47,48], torsional, and compressional faults, providing favorable pathways for mineralization. The alterations closely related to lead–zinc–antimony mineralization include pyritization, silicification, sphalerite and lead–zinc mineralization, and limonitization, followed by carbonatization and sericitization. Mineralization is generally more intense in zones of superimposed alteration [49].
(2) Electro-geochemical prospecting indicators: The electro-geochemical extraction results show that anomalous factor score ranges of F1 (Cd–Zn), F2 (Ag–Pb–Hg), and F3 (As–Sb) show strong spatial correspondence with known orebodies. These factors commonly exhibit diagnostic “single-peak” and “rabbit ear” anomaly patterns, effectively reflecting faults and orebodies. Moreover, these anomalies are spatially consistent with soil ionic conductivity and soil mercury release anomalies. Collectively, these indicators provide reliable evidence for deep, concealed lead–zinc–antimony mineralization and can be applied as effective prospecting markers.

5.2. Geological–Electro-Geochemical Prospecting Model

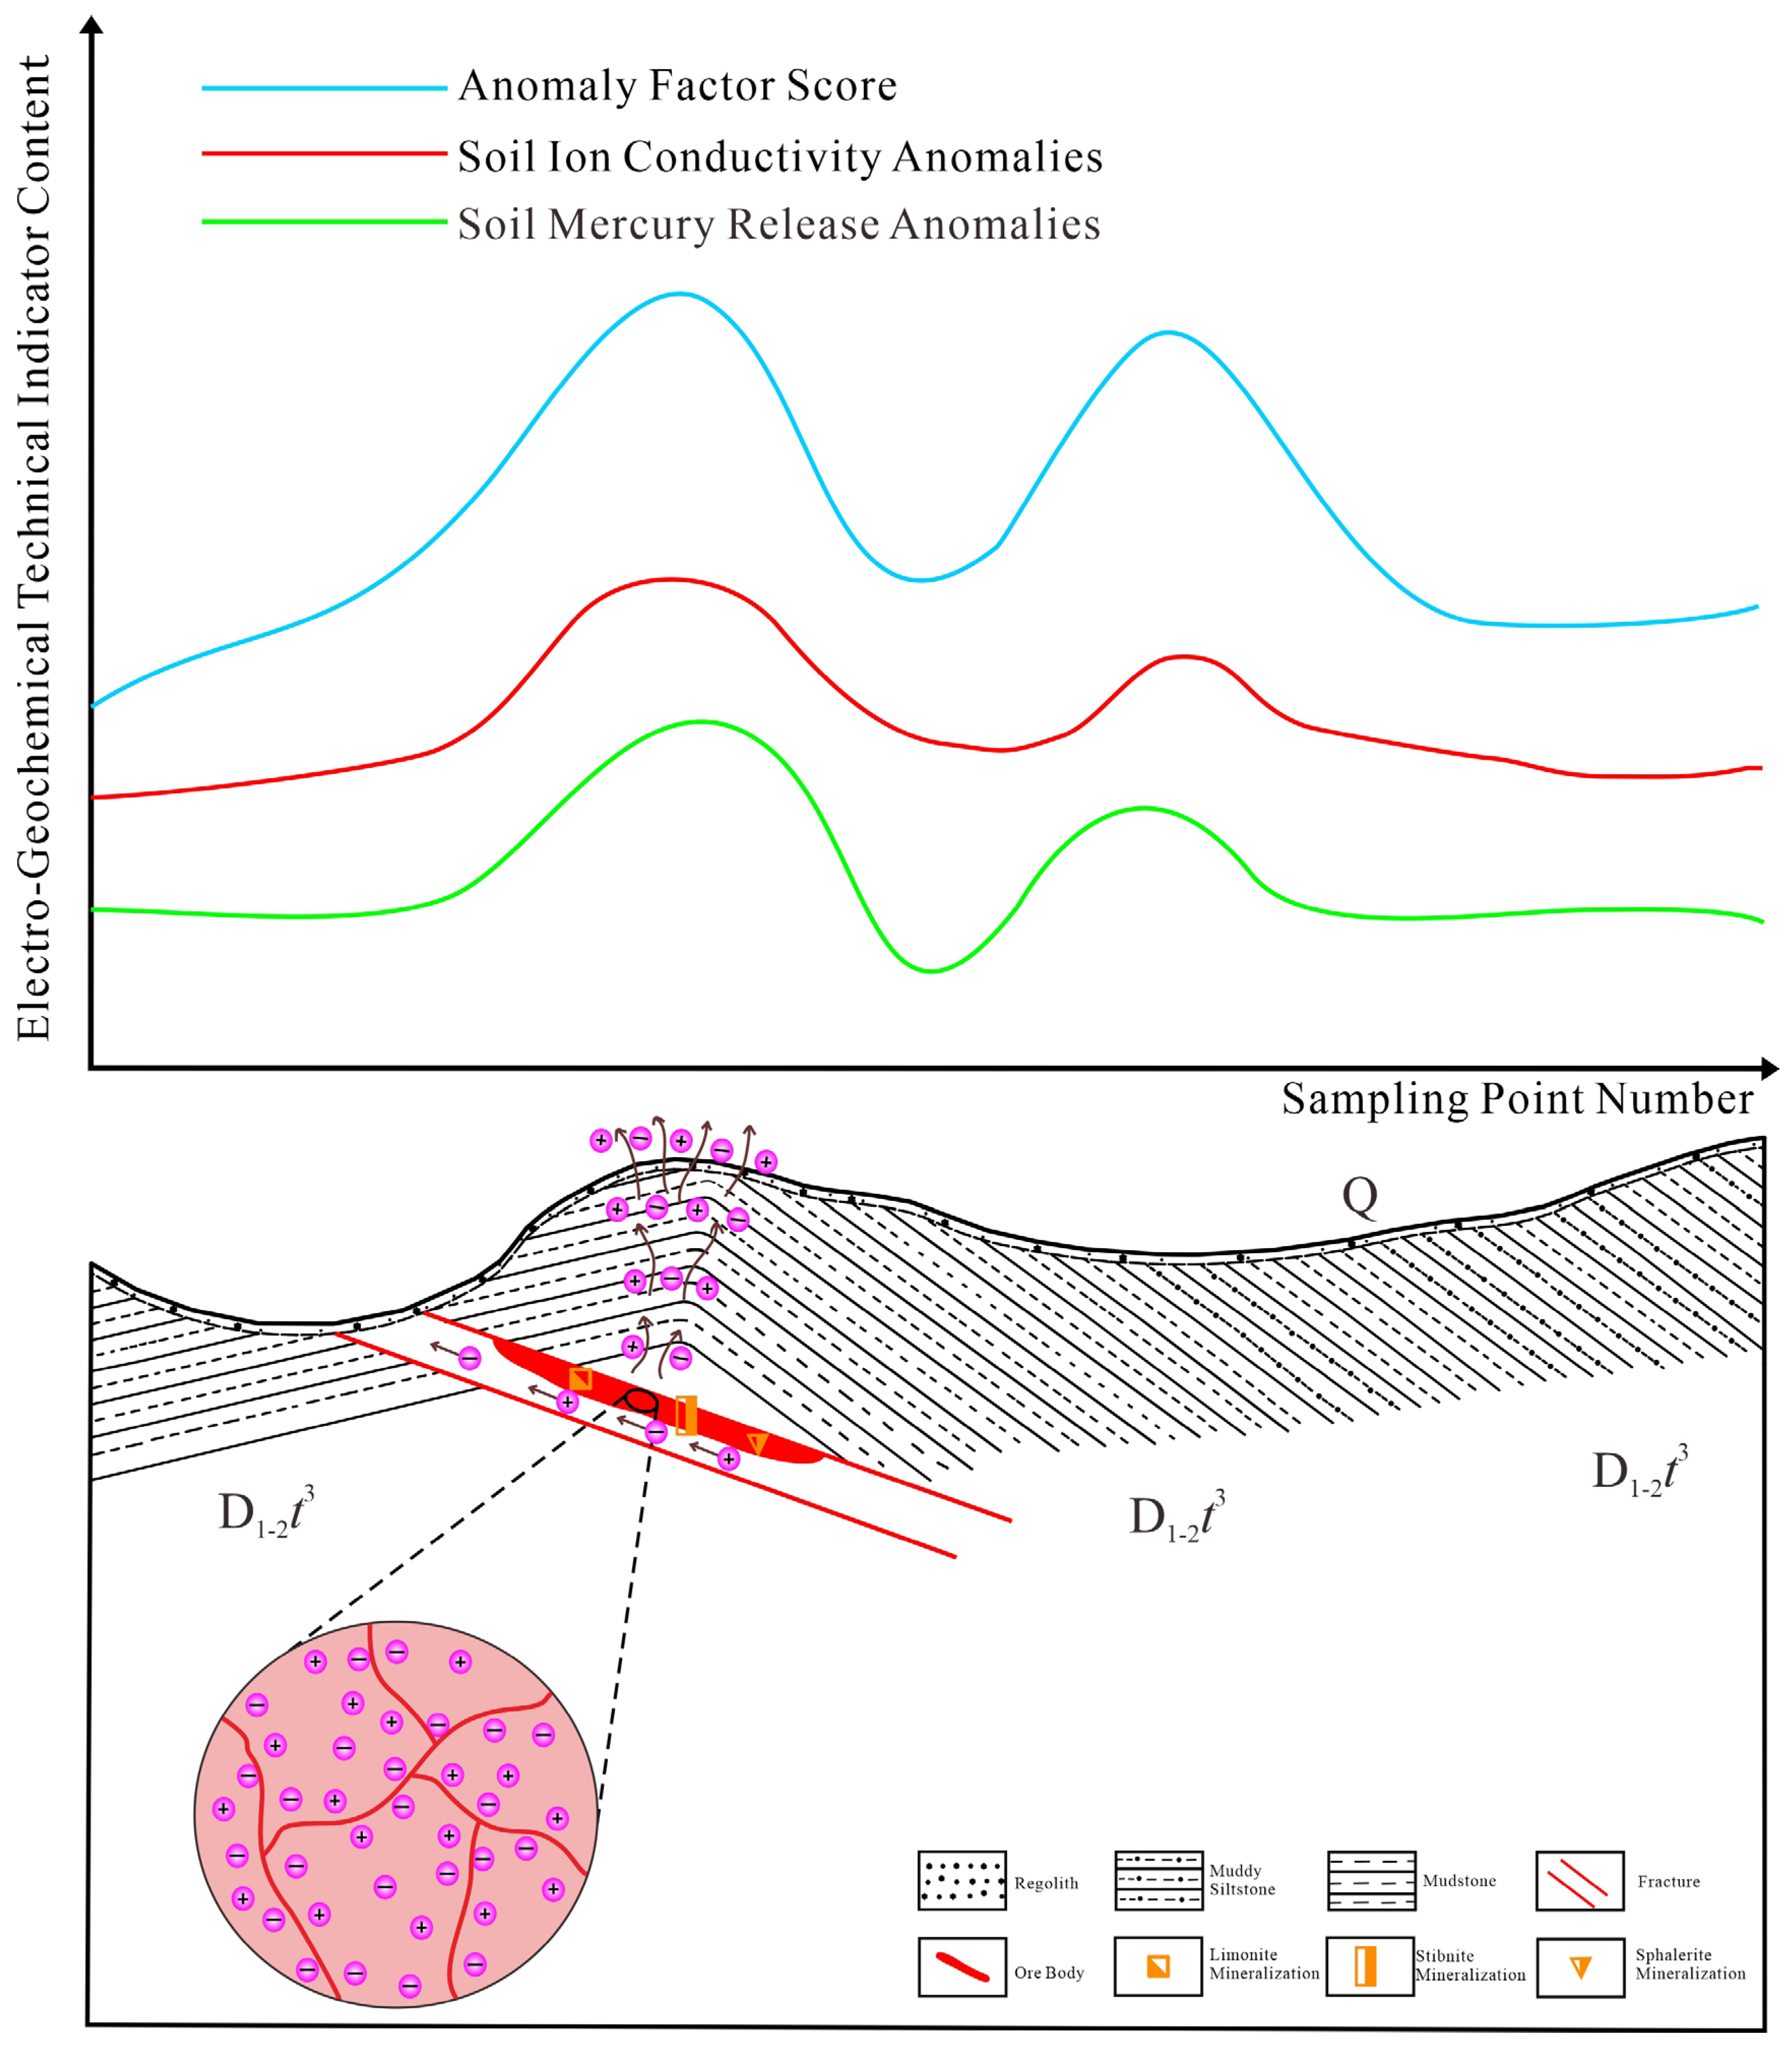
Based on the electro-geochemical extraction anomalies, soil ionic conductivity, and soil mercury release characteristics obtained from known profiles, geological quality-controlled mineralization indicators were systematically analyzed. On this basis, a geological–electro-geochemical prospecting model for concealed lead–zinc–antimony deposits was established (Figure 7), providing a foundation for deep exploration in the Bancai mining area.
(1) Deep, concealed lead–zinc–antimony orebodies commonly develop strong primary metal ion halos under the effects of geological processes [50,51]. Electro-geochemical surveys effectively capture ore-related ions migrating toward the surface. Consequently, anomalies of Cd, Pb, Zn, Ag, As, Sb, Hg, and Mo clearly indicate concealed mineralization. In particular, single-peak amplitudes of main factor scores derived from R-type factor analysis, especially F1 (Cd–Zn), F2 (Ag–Pb–Hg), and F3 (As–Sb), exhibit strong intensity, clear boundaries, and excellent spatial correspondence with known orebodies.
(2) According to the electro-geochemical halo formation mechanism, concealed orebodies undergo electrochemical dissolution under natural electric fields, generating soluble ions that migrate upward to form ore-related ion halos [28,34]. Soil ionic conductivity anomalies above concealed lead–zinc–antimony orebodies are typically expressed as broad-peak anomalies, providing an important indicator for mineral exploration in covered areas.
(3) Mercury exhibits strong volatility in hydrothermal systems and commonly occurs as native mercury or as components within Pb–Zn–As–Sb sulfides. During mineralization, mercury migrates upward along fractures in gaseous form, forming primary dispersion halos [52,53]. Under near-surface conditions, mercury released from sulfides penetrates to the surface and is adsorbed by soils, producing soil mercury release anomalies that serve as effective indicators of deep, concealed lead–zinc sulfide mineralization [54].

6. Prospecting Prediction

6.1. Characteristics of the Correlation Coefficient Matrix of Elements

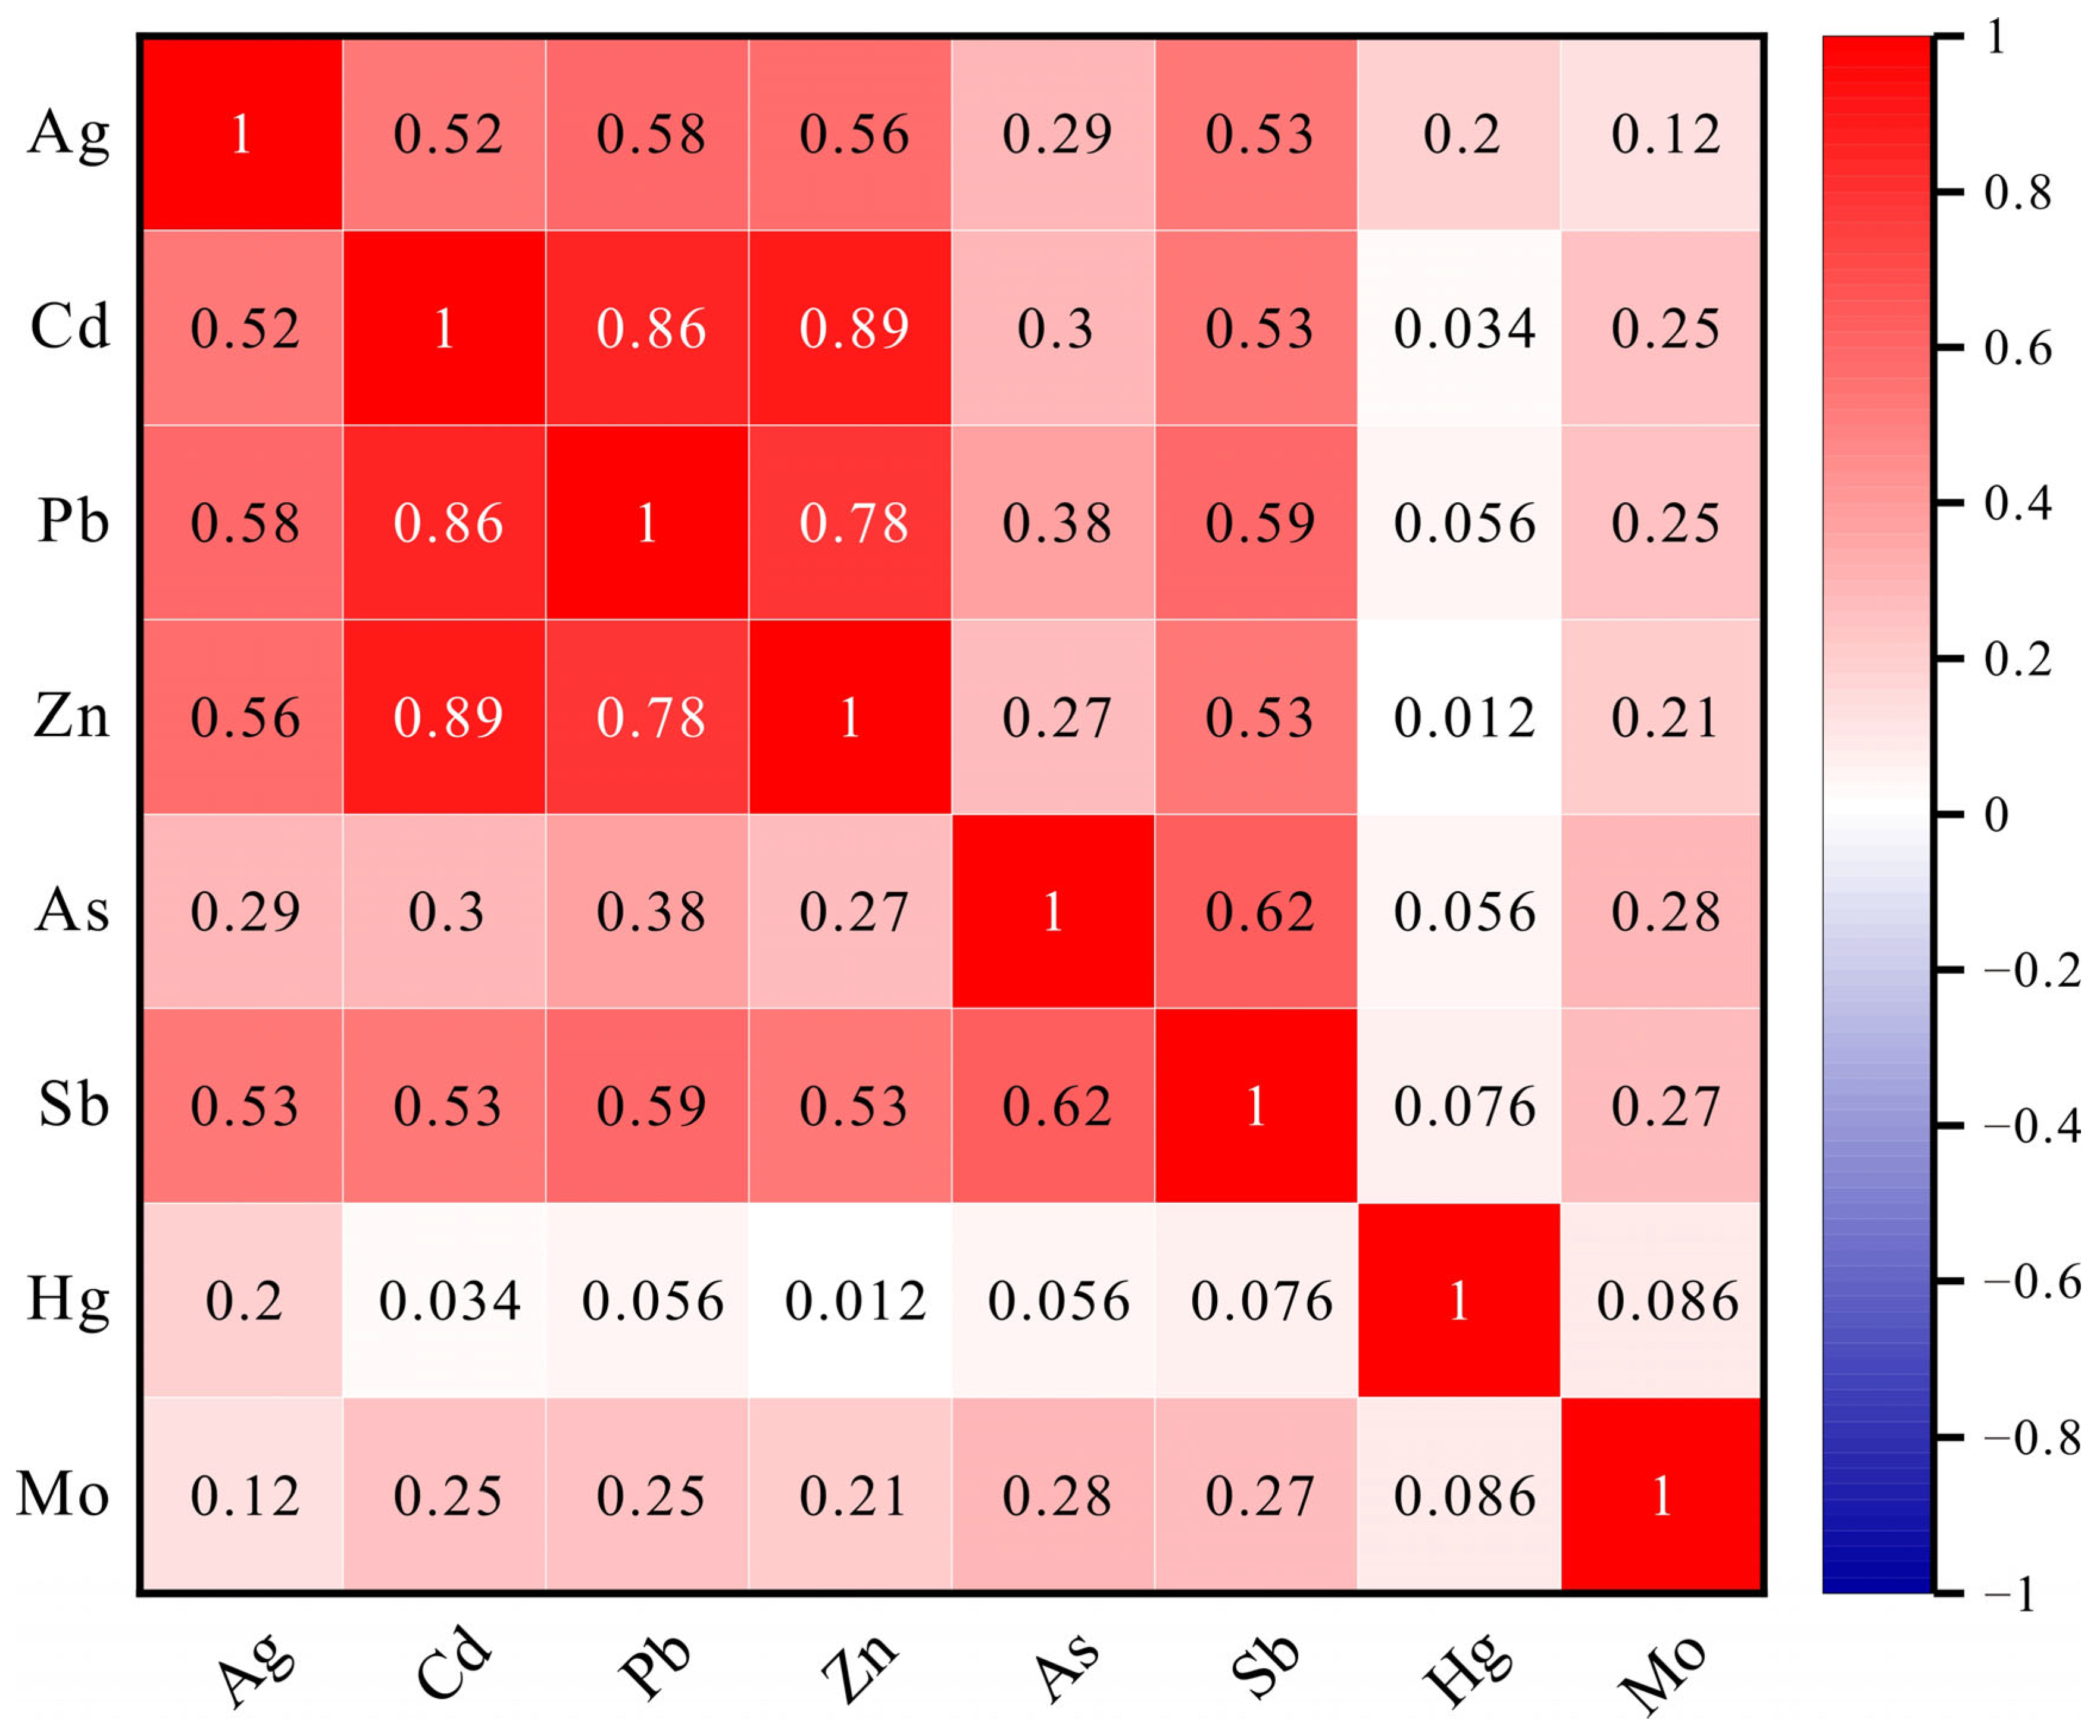
Based on the statistical relationships between the elements derived from the electro-geochemical survey, the data were reduced to several ore-forming element assemblages with clear geological significance. These assemblages provide clearer insights into the ore-forming processes of deep, concealed orebodies, as illustrated by the element correlation matrix (Figure 8). Strong positive correlations were observed between Cd, Zn, and Pb, with correlation coefficients of 0.86 for Cd–Zn, 0.86 for Cd–Pb, and 0.78 for Pb–Zn, representing a typical sulfide-associated element assemblage. Ag exhibits moderate positive correlations with Pb (0.58), Zn (0.56), Cd (0.52), and Sb (0.53), suggesting a close genetic relationship with the sulfide mineralization. In addition, As shows a moderately strong correlation with Sb (0.62). In contrast, Hg and Mo display weak correlations with all other analyzed elements.
The correlation coefficients of individual elements were further evaluated using R-type cluster analysis. Four element assemblages were identified: ① Cd–Zn, ② As–Sb, ③ Ag–Pb–Hg, and ④ Mo. Among these, the assemblages Cd–Zn, As–Sb, and Ag–Pb–Hg form a coherent group, which reflects medium- and low-temperature magmatic mineralization and represents the dominant mineralization stage in the study area. In contrast, the Mo assemblage is indicative of high-temperature magmatic mineralization [39,40,55].

Cluster Analysis and Factor Analysis for Cluster B

A prospecting prediction study was carried out in mining area B. R-cluster and R-type factor analyses were applied to 464 geo-electric extraction samples collected from profiles B1 to B9. The analytical results are consistent with those obtained from the known mineralized area.
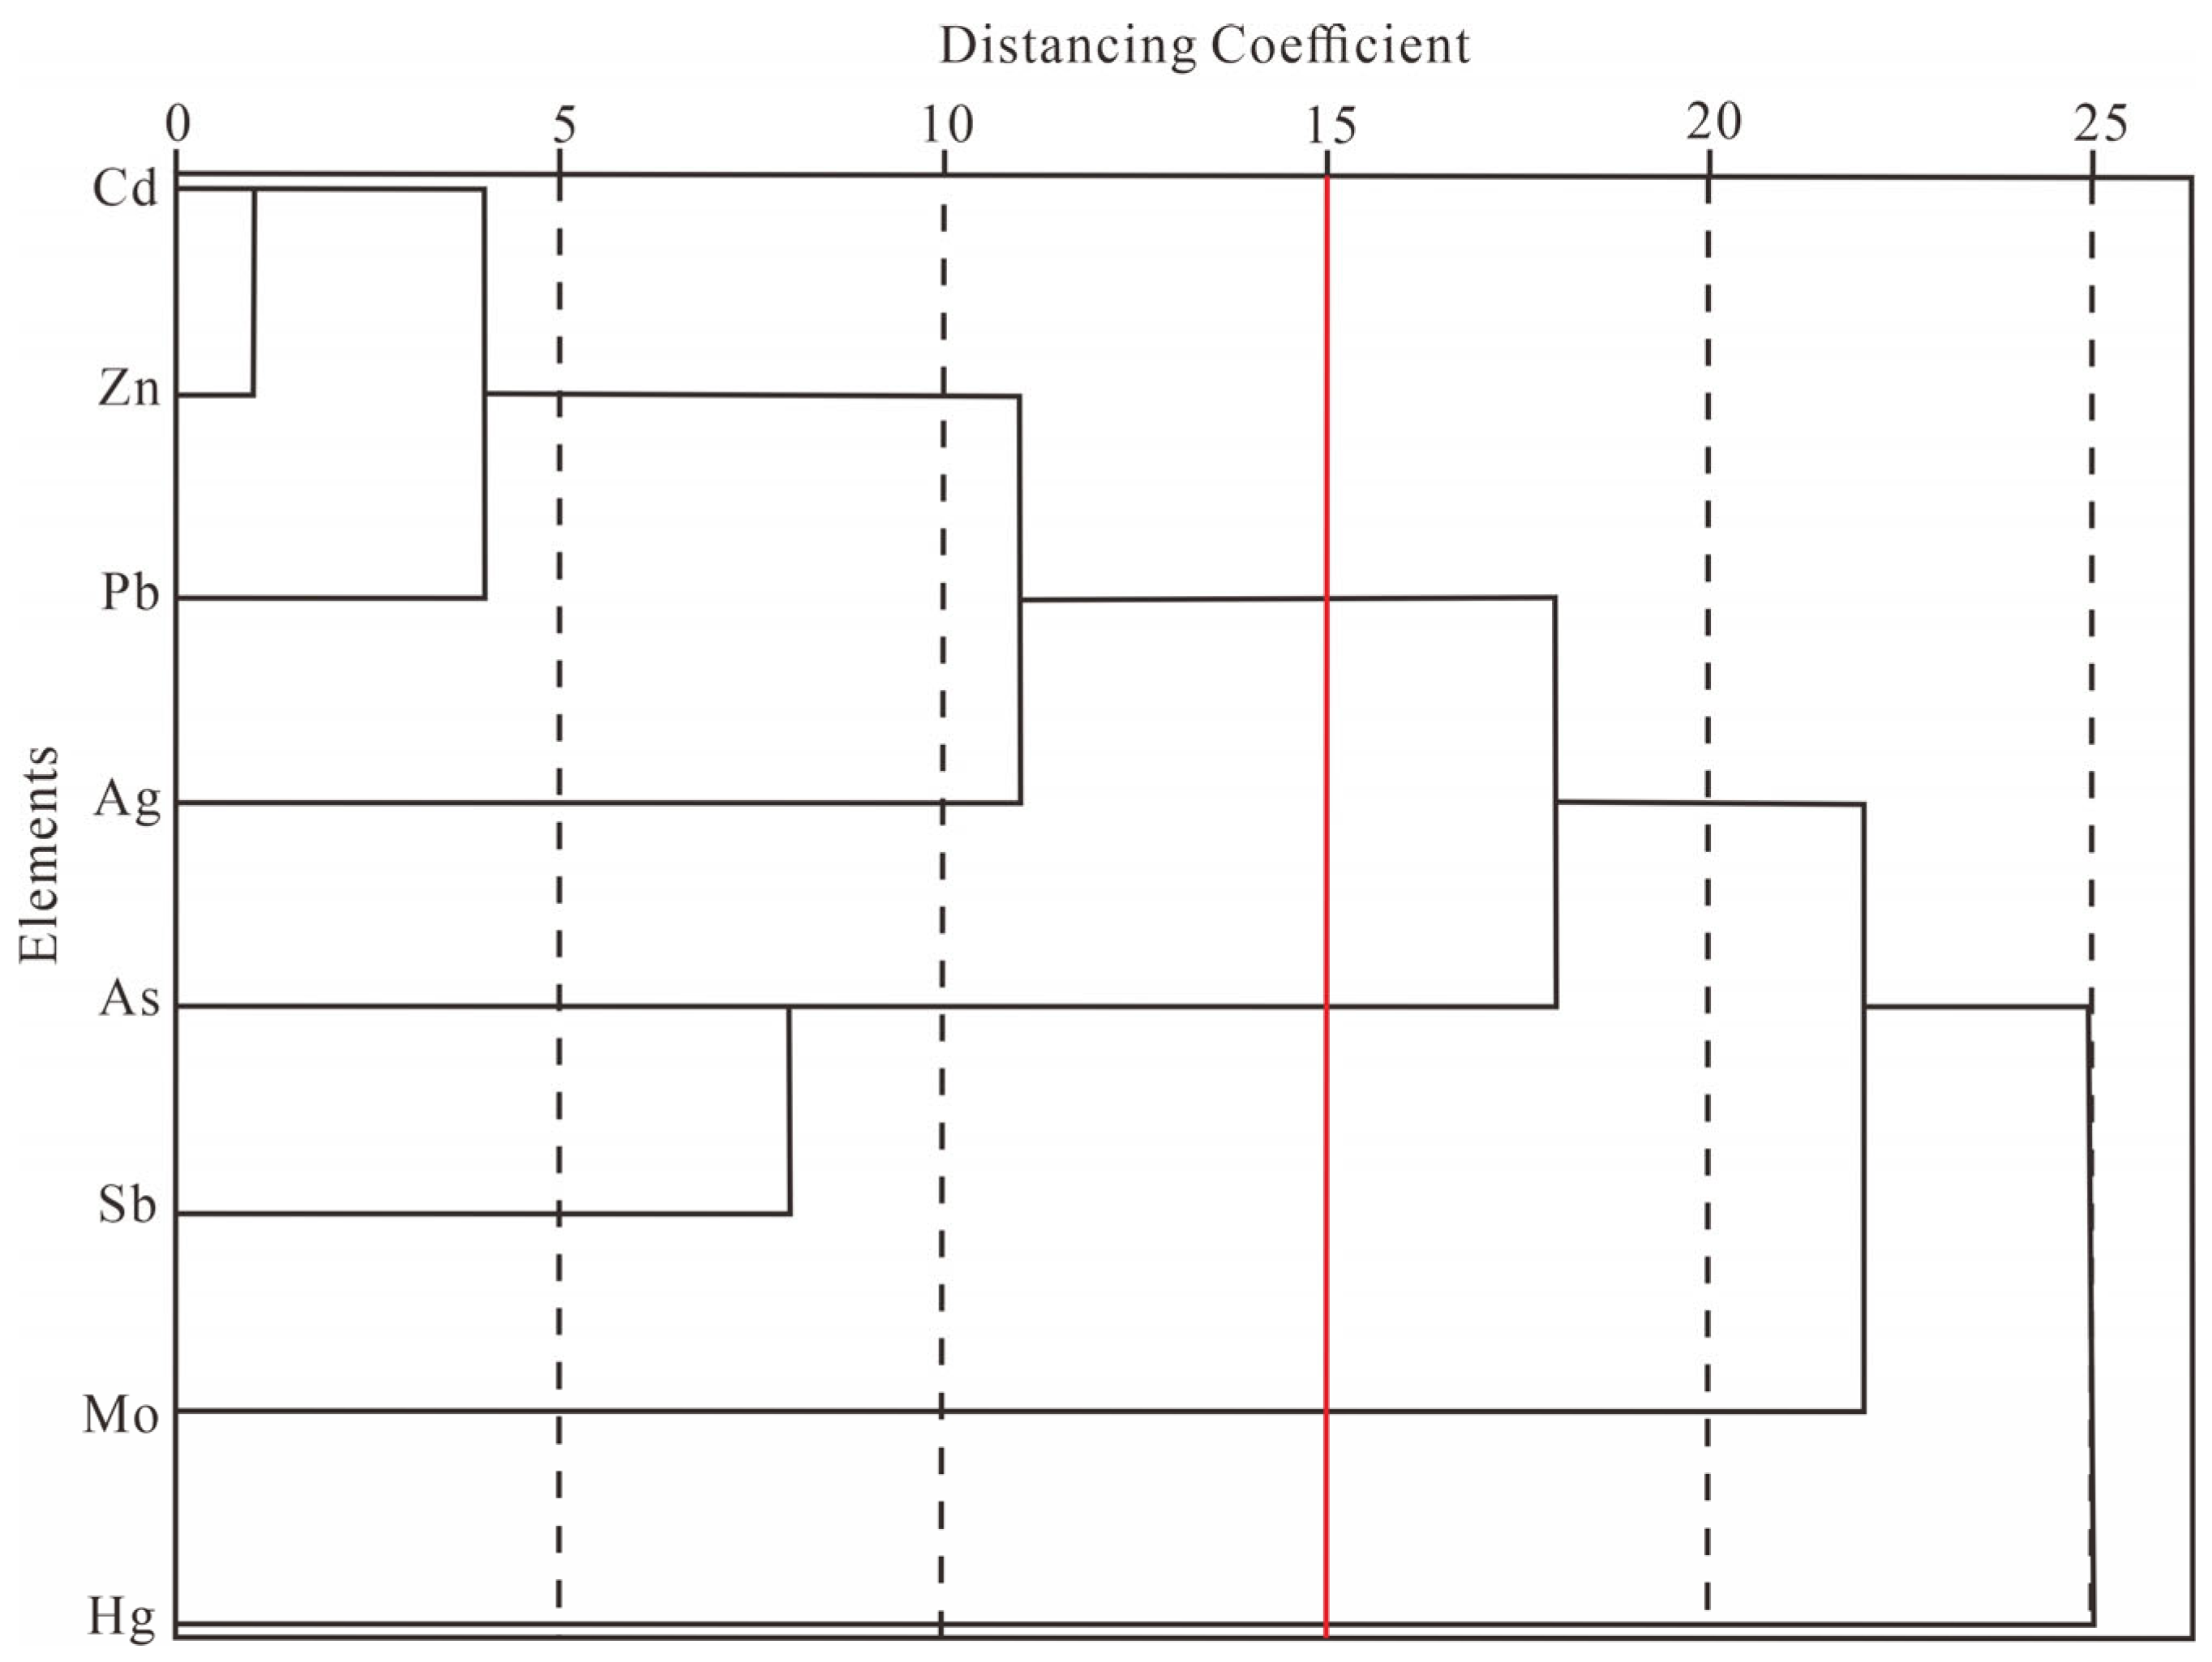
According to the R-type cluster analysis dendrogram (Figure 9), when the distance coefficient is set to 15, the eight analyzed elements can be classified into four distinct element assemblages: ① Cd–Zn–Pb–Ag, ② As–Sb, ③ Hg, and ④ Mo.
The results of the R-type factor analysis are consistent with those of the R-type cluster analysis and allow the elements to be classified into four factor assemblages: F1 (Cd–Zn–Pb–Ag), F2 (As–Sb), F3 (Hg), and F4 (Mo). The cumulative variance contribution of these four factors reaches 86.334%, indicating that they effectively represent the principal elemental information of the mining area (Table 2). These results are in good agreement with the mineralization stages and their indicative implications identified by factor analysis in Area A, supporting the uniformity of mineralization processes throughout the study area. This lends robust statistical support to the applicability of the geological–electro-geochemical prospecting model originally developed in Area A and Area B.
In summary, the element correlation coefficient matrices obtained in this study are generally consistent with the outcomes of the R-type cluster analysis in Zone B, yielding four distinct geochemical associations: ① Cd–Zn–Pb–Ag, ② As–Sb, ③ Hg, and ④ Mo. These groupings exhibit strong internal coherence, in good agreement with the clustering structure. The relatively low correlation of Hg and Mo with the main ore-forming element associations (Cd–Zn–Pb–Ag and As–Sb) clearly highlights the geochemical differences between primary ore-forming elements and auxiliary pathfinder elements.

6.2. Element Fractal Characteristics

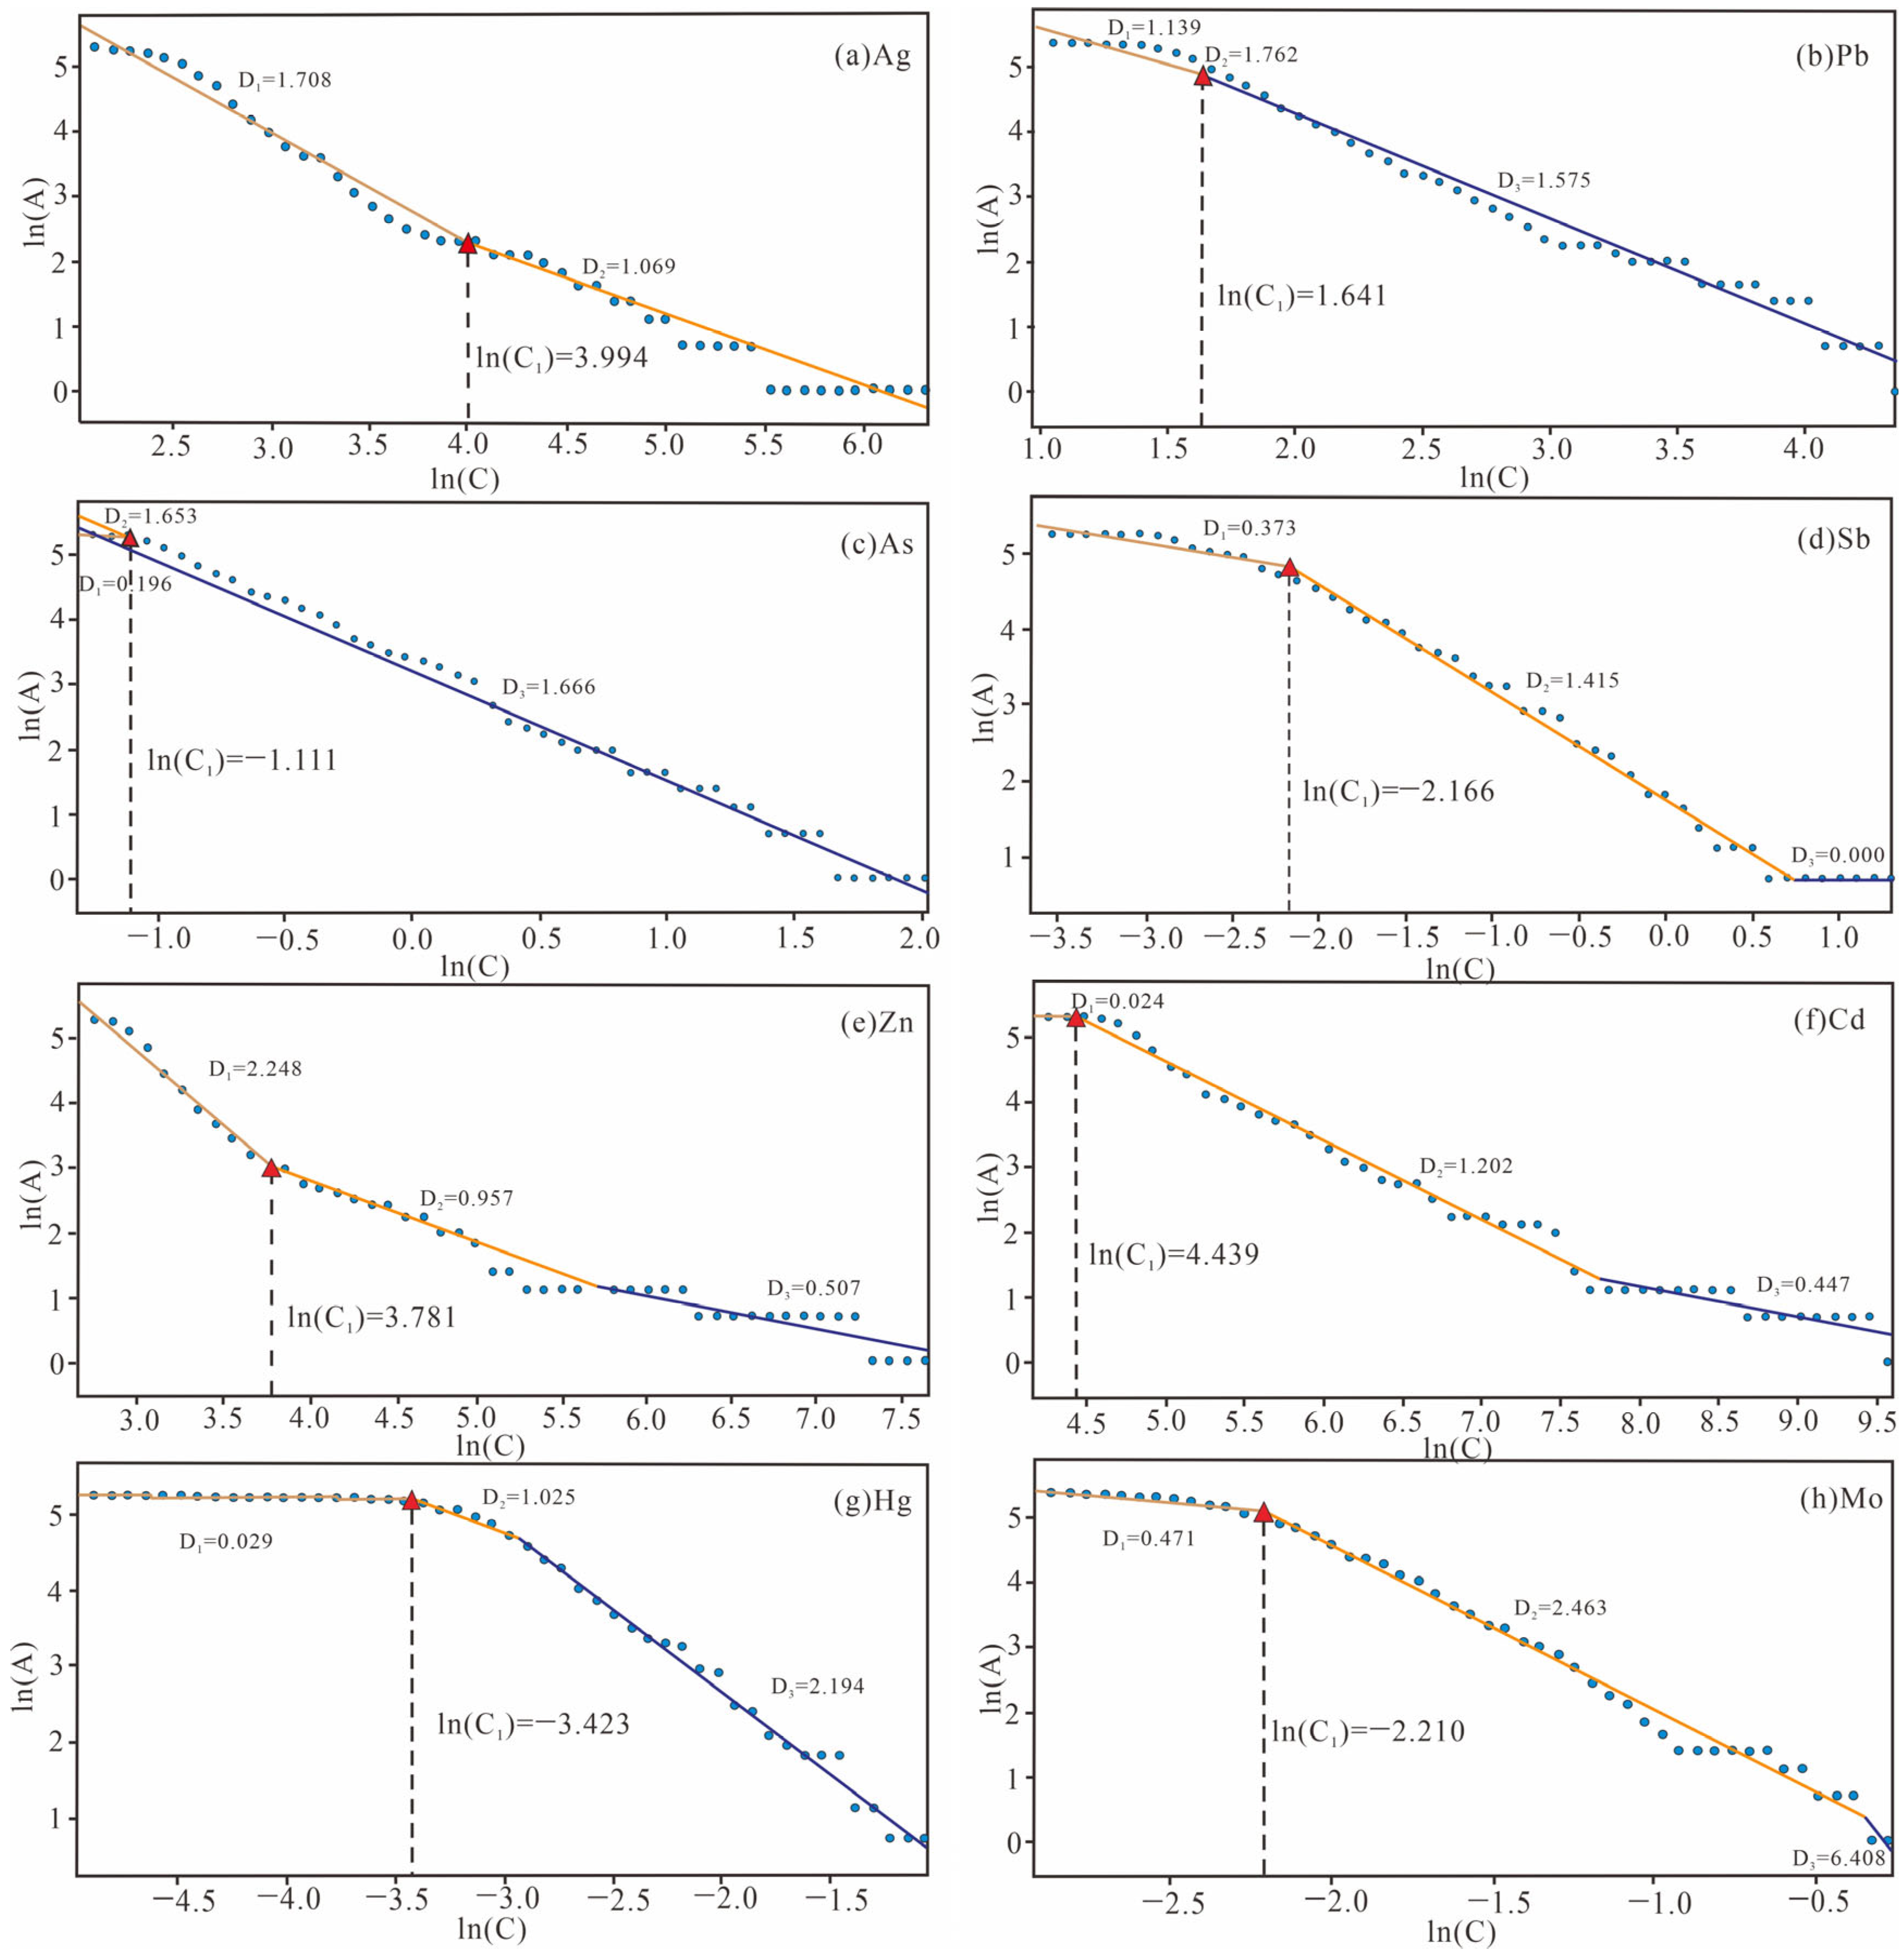
Since the 1980s, with the advancement of fractal models, numerous geochemists have posited that the elemental distribution within geochemical fields exhibits distinct fractal characteristics, adhering to a fractal distribution [56]. Given the divergent formation mechanisms underlying the background and anomalies of geochemical fields, they possess disparate fractal scaling properties. Consequently, the variation in fractal scales can be leveraged to determine the anomaly threshold of elements in geochemical fields [57]. The element content-area fractal model is capable of unraveling the spatial fractal structure of geochemical anomalies [58]. The slope of the straight line in the fractal plot denotes the fractal dimension. The value corresponding to the first inflection point in the plot (C1) is designated as the geochemical anomaly threshold (T) (Table 3), which facilitates the identification of elemental enrichment patterns. Furthermore, the similarity of fractal behaviors can be employed to demarcate mineralization stages and ascertain the primary ore-forming elements.
In general, a smaller D-value indicates a higher degree of elemental enrichment and a greater likelihood of mineralization through enrichment. The fractal analysis results (Figure 10) reveal the following: ① D1 values are generally small, with most being less than 1, signifying minor initial variations in elemental distribution and reflecting the low background values of elements in the study area. However, the D1 values of Ag, Pb, and Zn exceed 1, indicating relatively heterogeneous background distributions and an earlier onset of enrichment for these elements. ② The D3 values of Ag, Sb, Cd, and Zn show a significant reduction, implying that these elements have undergone local enrichment within the study area, and thus, represent the core elements of the region. The D2 values of As, Hg, and Mo are greater than 1.5, indicating weak enrichment intensity, which qualifies them as mineralization indicator elements.
Integrating the findings from the concentration-area fractal analysis with the known ore occurrences, actual geological structural context, R-mode cluster analysis, and factor analysis of the study area, it is concluded that Ag, Pb, Zn, Sb, and Cd are the primary ore-forming elements in the region, while As, Hg, and Mo can serve as favorable indicator elements for the exploration of lead–zinc–antimony deposits.

6.3. Characteristics of the Main Ore-Forming Elements

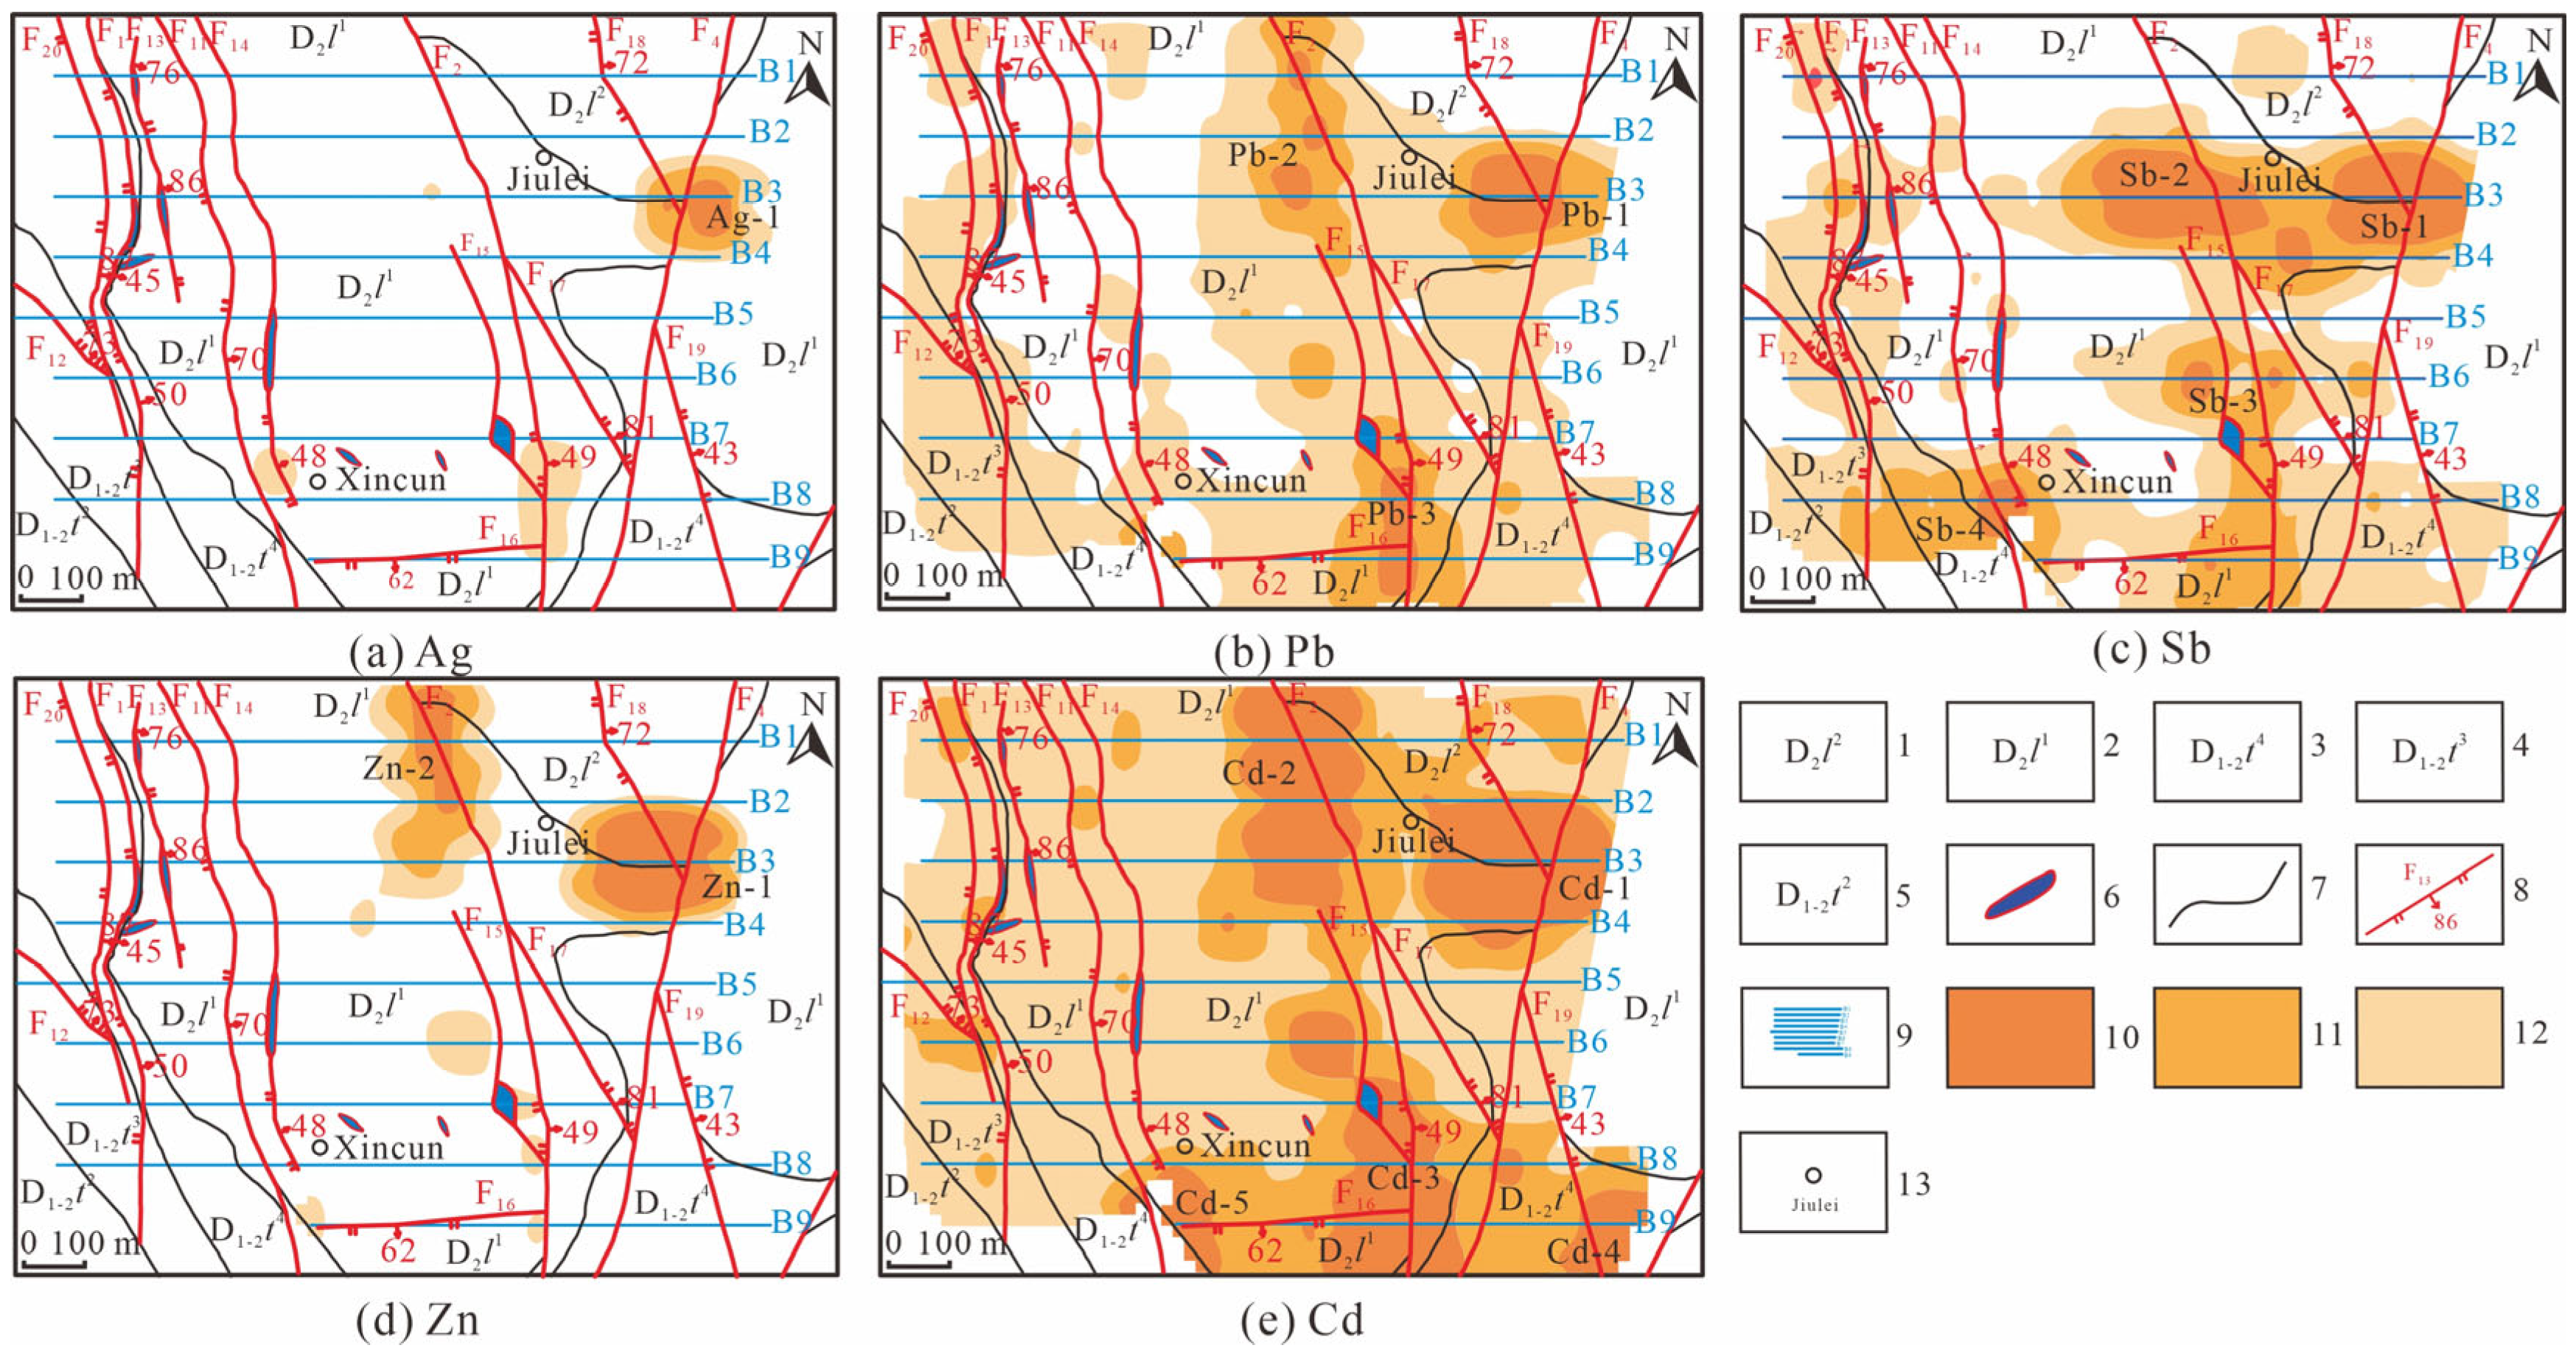
The main metal-forming elements were delineated using the multi-fractal method. The anomalies of Ag (Figure 11a), Pb (Figure 11b), Sb (Figure 11c), Zn (Figure 11d), and Cd (Figure 11e) were mainly distributed in the northern, eastern, and southern parts of the study area, showing an extension trend from the north–northwest direction.
(1) Ag anomalies: The Ag anomalies in the study area exhibit moderate development, primarily concentrated in the western part of Jiulei within the study area, and are hosted in the lower member of the Lower Devonian Luofu Formation (D2l1). One large-scale anomalous zone is identified. The Ag-1 anomaly is located in the western portion of the study area and features a single enrichment center; its overall morphology is irregular, resembling a “fried egg”, and it occurs at the intersection of the NNE-trending fault F4 and the NNW-trending fault F18.
(2) Pb anomalies: The study area exhibits well-developed Pb anomalies, occurring within the middle (D2l2) and lower (D2l1) members of the Devonian Luofu Formation, as well as the second member of the Tangding Formation (D1-2t4). Three distinct Pb-anomalous zones are identified—located east and west of Jiulei, and west of Xincun, respectively. The Pb-1, Pb-2, and Pb-3 anomalies display clear concentric zoning and extensive spatial coverage. Notably, the Pb-1 anomaly coincides precisely with the intersection of the NNE-trending fault F4 and the NNW-trending fault F18. At the Pb-3 anomaly site, calcite veins occur within fault F15, which intersects with fault F2.
(3) Sb anomalies: The study area exhibits well-developed Sb anomalies, predominantly hosted in the middle (D2l2) and lower (D2l1) members of the Devonian Luofu Formation. Four distinct Sb anomaly zones are identified: two located east and west of Jiulei, and two situated east and west of Xincun. Anomalies Sb-1, Sb-2, and Sb-3 display clear concentric zoning and relatively large spatial extents; in contrast, Sb-4 is an open (non-closed) anomaly. The centers of Sb-1 and Sb-2 coincide with the intersection of faults F4 and F18, and with fault F2, respectively. At the Sb-3 anomaly site, calcite veins occur within fault F15.
(4) Zn anomalies: Such anomalies in the study area exhibit moderate development and are primarily hosted within the Middle (D2l2) and Lower (D2l1) Members of the Devonian Luofu Formation. Two relatively large-scale Zn anomalies are identified. The Zn-1 anomaly is located in the western part of the study area and features a distinct enrichment center. Its overall morphology is irregular, resembling a “fried egg”, and it occurs at the intersection of the NNE-trending fault F4 and the NNW-trending fault F18. The Zn-2 anomaly lies west of Jiulei and displays clear concentric zoning of Zn concentration. It extends predominantly in the NNW direction, spatially aligned with fault F2.
(5) Cd anomalies: The study area exhibits excellent Cd anomalies, which are distributed within the Middle Luofu Formation (D2l2), Lower Luofu Formation (D2l1), and the Second Member of the Tangding Formation (D1-2t4) of the Devonian System. Three large-scale anomalous zones are identified. The Cd-1 anomaly is located in the western part of the study area, characterized by distinct concentric concentration zoning and an overall irregular “fried-egg” morphology. It occurs at the intersection of the NNE-trending fault F4 and the NNW-trending fault F18. The Cd-2 anomaly lies west of Jiulei, displaying clear concentration zoning and exhibiting a predominantly NNW-trending distribution aligned with fault F2. The Cd-3 anomaly is largely controlled by the NW-trending fault F15 and the NNW-trending fault F2, extending along both structures. It encompasses the intersection zone of faults F15 and F2 and coincides spatially with calcite veins. The Cd-4 and Cd-5 anomalies are relatively small in scale and remain open (not fully enclosed).
Ag-1, Pb-1, Sb-1, Zn-1, and Cd-1 anomalies exhibit strong spatial coincidence and are all concentrated at the intersection of the NNE-trending fault F4 and the NNW-trending fault F18. Similarly, Pb-3, Sb-3, and Cd-3 anomalies overlap significantly and occur at the junction of faults F15 and F2. These spatial associations indicate that the study area has been markedly influenced by tectonic activity. Furthermore, Pb-2, Sb-2, Zn-2, and Cd-2 anomalies also coincide closely and display a distinct NNW-trending distribution aligned with fault F2, further supporting tectonic control over the anomalous geochemical patterns.

6.4. Anomalous Characteristics of Element Factor Combinations

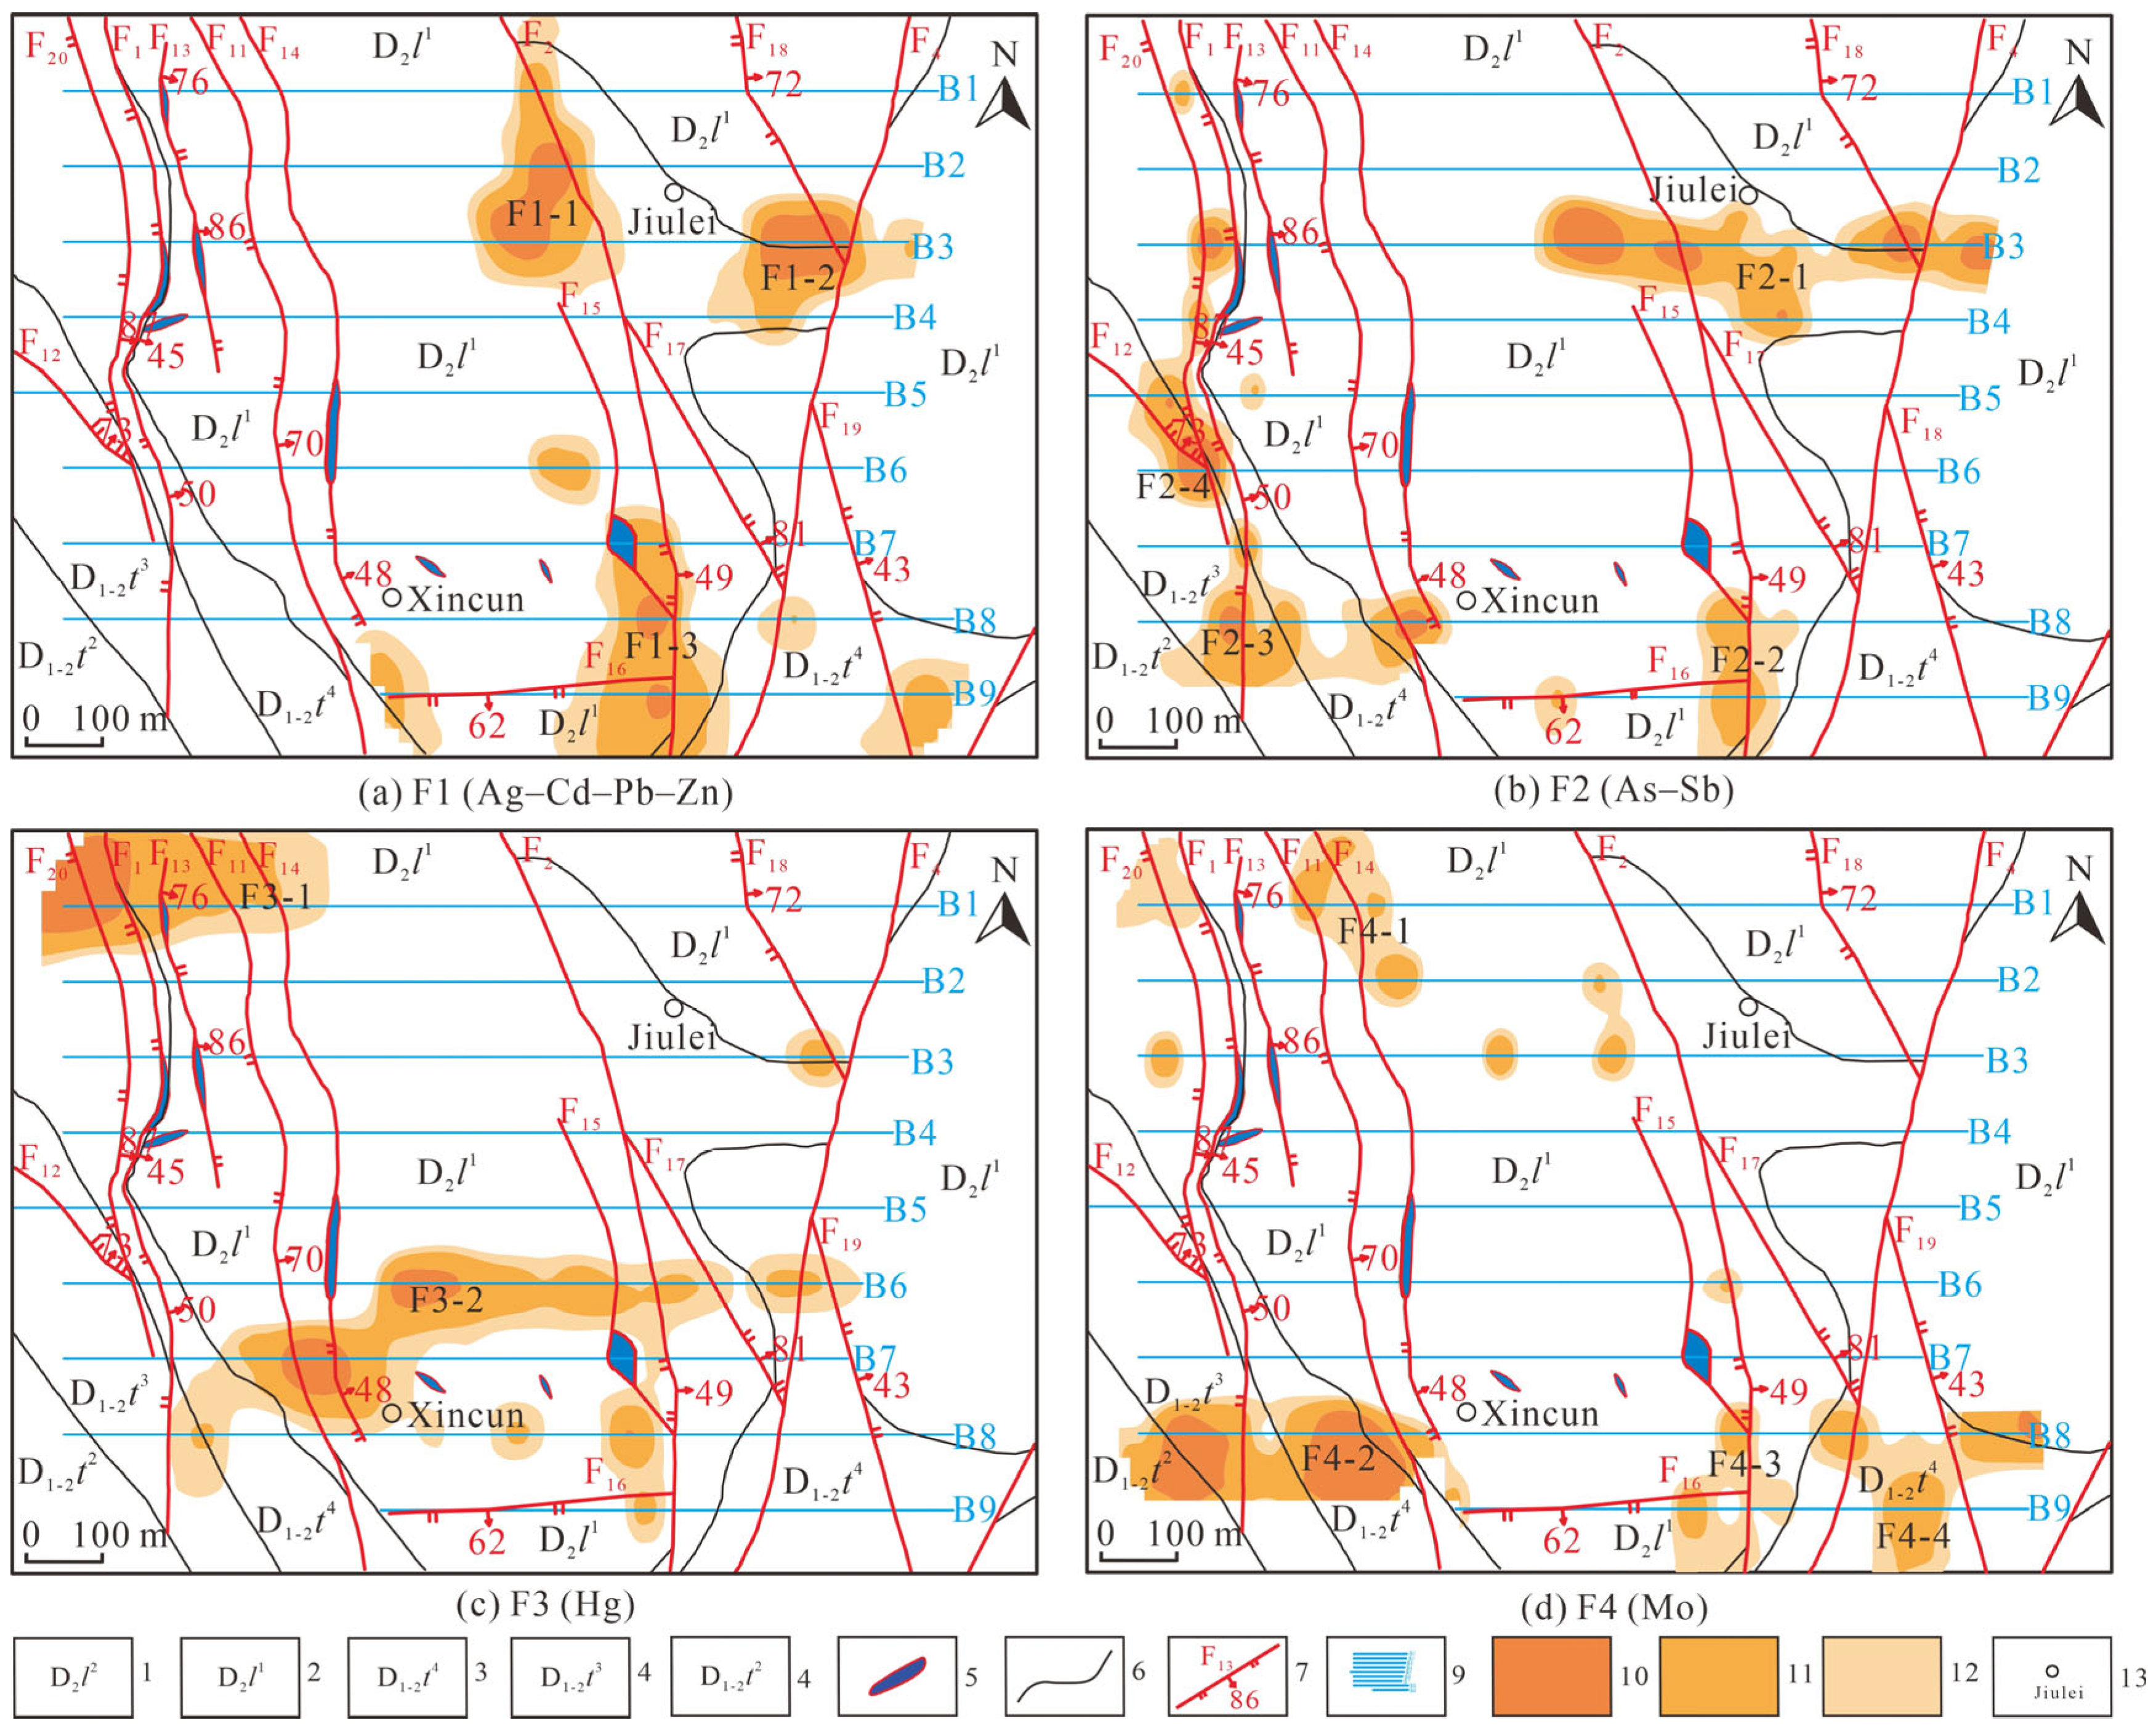
The planar distribution of element factor combination anomalies in the study area is shown in Figure 12.
Three F1 (Ag–Cd–Pb–Zn) anomalies were identified in the eastern area (Figure 12a), namely, F1-1 to F1-3. The F1-1 anomaly is morphologically intact but truncated by faults F2 and F15. The F1-2 anomaly occurs at the intersection of the NNW-trending F18 fault and the NE-trending F4 fault. The F1-3 anomaly is distributed within calcite veins along fault F15 near its intersection with fault F2 and extends along F15. The F1 assemblage represents medium- to low-temperature hydrothermal sulfide mineralization and corresponds to the principal Pb–Zn–Sb–Ag mineralization stage [36].
Four F2 (As–Sb) anomalies (F2-1 to F2-4) were delineated in the eastern area (Figure 12b). F2-1 is large and morphologically intact, with two anomaly centers near fault F15 and at the intersection of faults F14 and F18. F2-2 is located at the intersection of faults F2 and F15. F2-3 extends along faults F1, F20, and F12. F2-4 trends nearly north–south, with inner anomaly zones concentrated along fault F20 and at its intersection with fault F12. The F2 assemblage is associated with medium- to low-temperature hydrothermal activity and is strongly controlled by fault intersections, mainly within Devonian strata.
Two F3 (Hg) anomalies, F3-1 and F3-2, were identified (Figure 12c). The F3-2 anomaly is significantly larger in scale than the F3-1 anomaly and exhibits a generally east–west-oriented distribution. The anomaly is complete and enclosed, incorporating faults F2, F11, F14, F15, F17, and F19, and shows no clear tendency to extend along individual fault zones. The F3-1 anomaly intersects faults F1, F11, F13, F14, and F20 and displays spatial characteristics similar to those of the F3-2 anomaly, likewise lacking a distinct fault-controlled extension pattern.
Four F4 (Mo) anomalies (F4-1 to F4-4) were delineated (Figure 12d): the F4-1 anomaly extends along fault F14; the F4-2 anomaly is markedly larger than the others and exhibits an overall extension along fractures toward the SW direction, being morphologically intact but not enclosed; the F4-3 anomaly occurs at the intersection of the NNW-trending F2 fault and the NNE-trending F15 fault and shows extension along the NNW-trending fracture; the F4-4 anomaly encompasses faults F19 and F17 and extends in the NNW direction toward the intersection of fault F17 and the NE-trending F4 fault. The F4 factor assemblage is associated with high-temperature hydrothermal activity and is inferred to be related to multi-stage tectonic–magmatic processes.
Overall, the enrichment zones of the principal ore-forming element anomalies are mainly concentrated at the intersections of the NE-trending fault F4 and the NNW-trending fault F18, where prominent F1 and F2 factor combination anomalies, including the target minerals Pb, Zn, and Sb, are developed. Additional enrichment areas of element factor combination anomalies occur at the intersection of the NW-trending fault F15 and the NNW-trending fault F2, where the F1, F2, F3, and F4 anomalies are superimposed. These anomalies are not only concentrated at fault intersections but also show persistent extension along fault zones. Fault F2 is located west of Jiulei Village and traverses the mining area, where silicification, carbonatization, pyritization, and limonite mineralization are well-developed, with local occurrences of lead–zinc–antimony mineralization. Fault F15 is characterized by brecciation and locally developed calcite veins. The geoelectric extraction anomalies are predominantly distributed within and adjacent to the fault zones, indicating a close genetic relationship between mineralization and fault structures. Owing to the pronounced geoelectric extraction anomalies, these areas are regarded as important prospective targets for concealed lead–zinc deposit exploration and warrant further, thorough verification.

6.5. Target Area Delineation

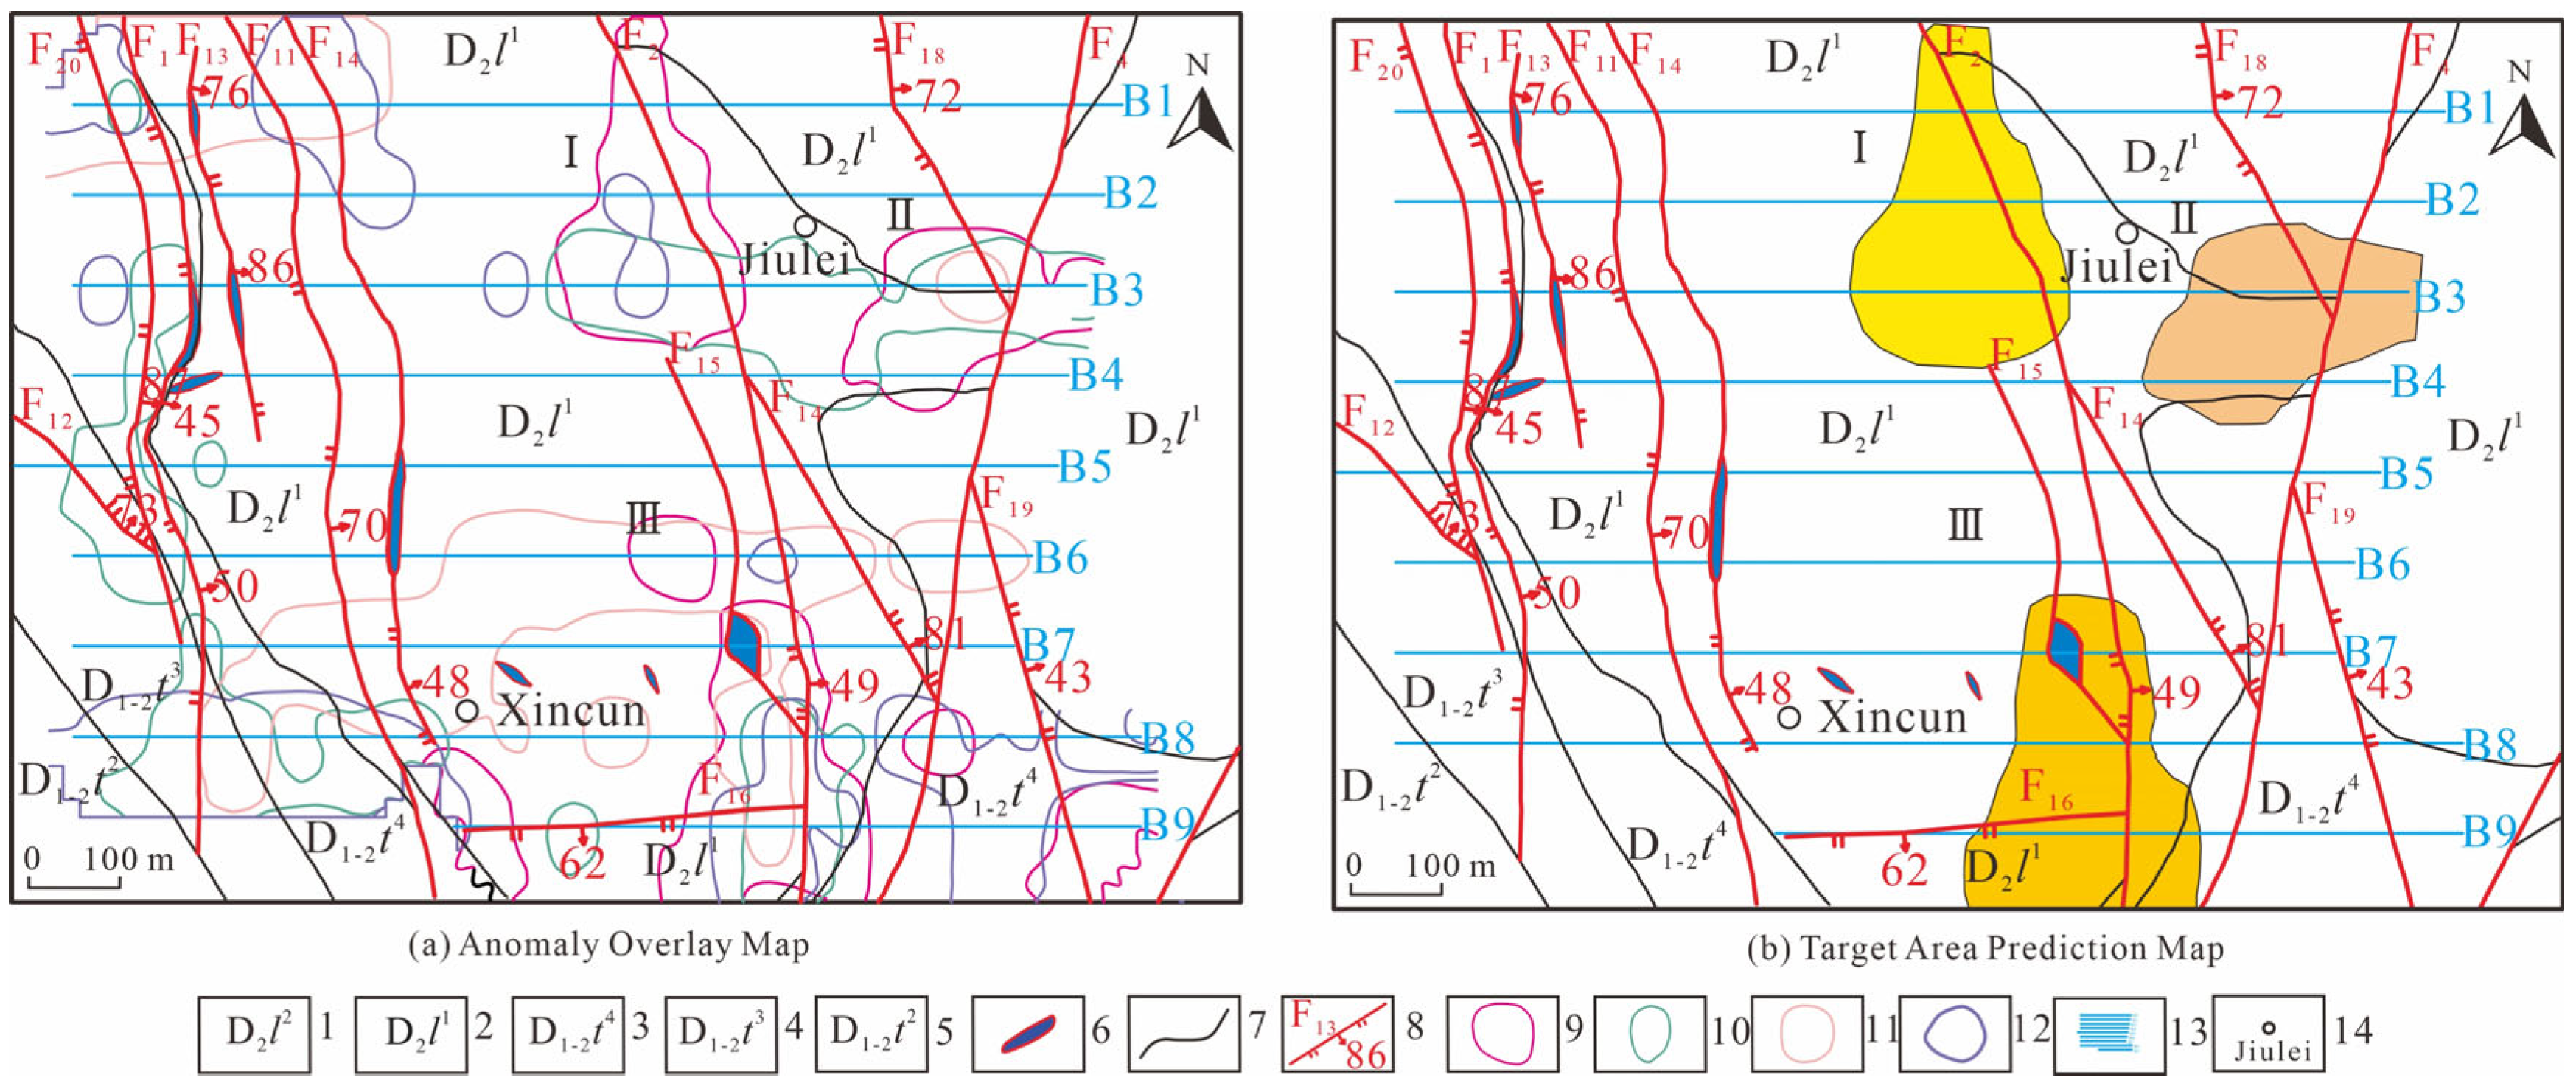
Based on the established geology–electro-geochemical prospecting model, three prospective target areas were delineated by integrating the geological mineralization background, ore-controlling factors, anomalous characteristics of element factor combinations, and the degree of overlap between different factors (Figure 13).
(1) Target Area I is located west of Jiulei within the study area. The exposed strata are mainly calcareous mudstone, sandy mudstone, and marl from the lower section of the Middle Devonian Luofu Formation. The Devonian Tangding Formation represents an important ore-bearing horizon in the Wuxu mineral field. The Wuxu anticline, which hosts the study area, experienced four stages of tectonic stress fields, including compression during the Indosinian period and extension during the Yanshanian period, both NEE-directed. This transition in stress regimes resulted in the development of alternating “tension–compression–tension” fluid migration pathways along the anticline axis. The hinge zones and secondary structures on the limbs of the Wuxu anticline exert strong control over the spatial distribution of orebodies and facilitate multi-stage enrichment of ore-forming materials [59]. Target Area I is influenced by the NNW-trending F2 fault zone, where tectonic conditions are favorable for mineralization. A comprehensive analysis of the F1, F2, and F3 element factor combinations derived from geoelectric extraction data indicates a high degree of anomaly correspondence, with pronounced enrichment of the main ore-forming elements. These characteristics suggest that Target Area I has potential for further exploration of concealed mineral deposits.
(2) Target Area II is situated east of Jiulei in the study area. The exposed lithologies are dominated by calcareous mudstone, sandy mudstone, and marl from the lower section of the Devonian Luofu Formation. This target area is located at the intersection of the NNW-trending F18 fault and the NE-trending F4 fault. A series of torsional faults developed in the core of the Wuxu anticline and exerted significant control over the distribution of endogenous hydrothermal mineralization in the Wuxu area [60]. Jiulei is positioned on the eastern limb of the Wuxu anticline, where fault-related alteration is well-established, comprising silicification, carbonatization, and surface limonite mineralization. Aeromagnetic surveys reveal distinct aeromagnetic anomalies on the eastern limb of the Wuxu anticline, while gravity data show positive anomalies in the same area, which correspond well with the F1, F2, and F3 factor anomalies [61]. Soil geochemical surveys also identify anomalous zones near Bancai and Jiulei that are highly consistent with the distribution of F1, F2, and F3 factor anomalies. Given the continuous development of anomalies along the Xincun F1 and F20 faults and the strong spatial overlap between the F1 and F2 factor anomalies [62], Target Area II is considered a favorable zone for concealed ore exploration.
(3) Target Area III is located east of Xincun in the study area. The exposed strata mainly comprise calcareous mudstone, sandy mudstone, and marl from the lower section of the Middle Devonian Luofu Formation. The structural framework of this target area is characterized by the development of NNW-trending F2 and F15 faults, as well as the EW-trending F16 fault. In particular, the target area is situated at the intersections of the NNW-trending F2 and F15 faults and of the NNW-trending F2 fault with the EW-trending F16 fault, reflecting favorable tectonic conditions for mineralization. Electro-geochemical integration indicates strong spatial overlap between the F1, F2, and F3 factor anomalies within this target area. In addition, calcite veins are exposed locally, accompanied by well-developed silicification, pyritization, and related alterations in the surrounding rocks. The spatial association between calcite veins and metal sulfide mineralization suggests the possible presence of deep, concealed orebodies. Accordingly, Target Area III is considered to have potential for mineralization and merits further exploration and verification.

7. Conclusions

With the gradual depletion of shallow lead–zinc–antimony resources in the Bancai mining District (Hechi, Guangxi), locating deep, concealed orebodies has become increasingly challenging. To address this issue, the application potential of the integrated electro-geochemical method in covered terrains was investigated. Based on the application of integrated electro-geochemical techniques for concealed lead–zinc–antimony deposit prospecting in the Bancai area (Guangxi), feasibility tests were carried out, a geological–electro-geochemical prospecting model was established, and the geological characteristics and mineralization background were systematically analyzed to assess the capability of the method for identifying concealed lead–zinc–antimony mineralization in the study area. On this basis, prospecting prediction research was conducted, leading to the following conclusions.
(1)
Feasibility testing along the known A4 section demonstrates that geoelectric extraction anomalies accurately delineate the spatial position of deep orebodies. Under the overburden conditions of the study area, the integrated electro-geochemical method yielded favorable results, and geochemical anomalies coincide spatially with the J3 orebody and the faults controlling the orebody. The anomaly characteristics are consistent with tectonic ore-controlling patterns, confirming the effectiveness of this method for the exploration of concealed mineralization.
(2)
On the basis of the geological characteristics of the Bancai mining area and the results of the feasibility tests, a set of prospecting indicators was established. These indicators are dominated by multi-element principal factor combinations, primarily F1, F2, and F3, supplemented by soil mercury release anomalies, soil ionic conductivity anomalies, and conventional geochemical prospecting indicators. Accordingly, a geological–electro-geochemical prospecting model was constructed, and fault intersections, multi-factor anomaly superposition, and strongly altered cores were identified as key exploration indicators for mineralization, providing a theoretical framework for subsequent exploration in the study area.
(3)
Integrated exploration of deep, concealed lead–zinc–antimony mineralization in the Bancai B mining area indicates the presence of three favorable prospecting targets, designated as Target Areas I, II, and III, owing to the intersection of multiple fault zones, the extensive development of calcite veins, and the superposition of multi-factor anomalies. Specifically, Target Area III exhibits favorable tectonic conditions and pronounced anomalous responses, suggesting significant potential for deep, concealed mineralization and warranting the prioritization of verification.

Author Contributions

H.Z.: Writing—review and editing, Writing—original draft. M.W.: Supervision, Conceptualization. W.G.: Supervision, Conceptualization. P.L.: Supervision, Conceptualization. Y.J.: Writing—review and editing, Supervision. X.Z.: Writing—review and editing. J.M.: Writing—review and editing. G.L.: Writing—review and editing. X.R.: Writing—review and editing. All authors have read and agreed to the published version of the manuscript.

Funding

This research was jointly funded by the Innovation Base of Metallogenic Prediction and prospecting in Central Asia Orogenic Belt (WZD-C-20240203) and the Guangxi Natural Science Foundation (2025GXNSFAA069927).

Data Availability Statement

The data presented in this study are available on request from the corresponding author.

Acknowledgments

The authors gratefully acknowledge Meirong Lei, Guangqiang Liao, and Jing Lu of Geological Team No. 7 for their substantial contributions to this research. As project leaders of the Bancai Mining Area initiative, they played a pivotal role in data acquisition, quality assurance, and the interpretation of geological features and anomalies. Their invaluable support during fieldwork and manuscript revision is also sincerely appreciated.

Conflicts of Interest

The authors declare that they have no known competing financial interests or personal relationships that could have appeared to influence the work reported in this paper.

References

  1. Mineral Commodity Summaries 2024. 1–216. Available online: https://pubs.usgs.gov/periodicals/mcs2024/mcs2024.pdf#page=9 (accessed on 13 March 2026).
  2. ILZSG: Global Markets for Refined Zinc and Lead Will Face Surpluses in 2026. Available online: https://energynews.oedigital.com/mineral-resources/2025/10/13/ilzsg-global-markets-for-refined-zinc-and-lead-will-face-surpluses-in-2026 (accessed on 22 February 2026).
  3. ILZSG: Global Refined Zinc and Lead Markets to Face Significant Supply Surplus in 2026—Shanghai Metals Market (SMM). Available online: https://news.metal.com/newscontent/103567122-ilzsg-global-refined-zinc-and-lead-markets-to-face-significant-supply-surplus-in-2026- (accessed on 22 February 2026).
  4. National Minerals Information Center. U.S. Geological Survey Mineral Commodity Summaries 2025 Data Release (Ver. 2.0, April 2025). 2025. Available online: https://www.sciencebase.gov/catalog/item/677eaf95d34e760b392c4970 (accessed on 13 March 2026).
  5. Mineral Commodity Summaries 2025. 2025. Available online: http://pubs.usgs.gov/periodicals/mcs2025/mcs2025.pdf (accessed on 13 March 2026).
  6. Kang, M.; Guo, H.; Zhu, W.; Luo, X.; Yang, J. The Improvement and Application of the Electrogeochemical Exploration Method. Appl. Sci. 2023, 13, 2735. [Google Scholar] [CrossRef] [Scilit]
  7. Sun, J.; Chen, Y.; Li, D. New Advances in Geochemical Exploration of Concealed Deposits. Adv. Earth Sci. 2011, 26, 822. [Google Scholar] [CrossRef]
  8. Hamilton, S.M. Electrochemical Mass-Transport in Overburden: A New Model to Account for the Formation of Selective Leach Geochemical Anomalies in Glacial Terrain. J. Geochem. Explor. 1998, 63, 155–172. [Google Scholar] [CrossRef] [Scilit]
  9. Jiang, T.; Cao, J.; Wu, Z.; Wu, Y.; Zeng, J.; Wang, Z. A TEM Study of Particles Carried by Ascending Gas Flows from the Bairendaba Lead-Zinc Deposit, Inner Mongolia, China. Ore Geol. Rev. 2019, 105, 18–27. [Google Scholar] [CrossRef] [Scilit]
  10. Govett, G.J.S.; Dunlop, A.C.; Atherden, P.R. Electrogeochemical Techniques in Deeply Weathered Terrain in Australia. J. Geochem. Explor. 1984, 21, 311–331. [Google Scholar] [CrossRef] [Scilit]
  11. Liu, P.; Luo, X.; Wen, M.; Zhang, J.; Duan, X. Using Electrogeochemical Approach to Explore Buried Gold Deposits in an Alpine Meadow-Covered Area. Acta Geochim. 2018, 37, 402–413. [Google Scholar] [CrossRef] [Scilit]
  12. Liu, Y.; Luo, X.; Liu, P.; Zheng, C.; Liu, G.; Song, B.; Song, G. Application of Integrated Geoelectrochemical Technology in Searching for Hidden Lead-Zinc Ore in the Guluqi Hill Mining Area and Its Surrounding Areas. Geol. Explor. 2018, 54, 1001–1012. [Google Scholar] [CrossRef]
  13. Liu, P.; Luo, X.; Wen, M.; Zhang, J.; Zheng, C.; Gao, W.; Ouyang, F. Geoelectrochemical Anomaly Prospecting for Uranium Deposits in Southeastern China. Appl. Geochem. 2018, 97, 226–237. [Google Scholar] [CrossRef] [Scilit]
  14. Zheng, C.; Liu, P.; Luo, X.; Wen, M.; Huang, W.; Liu, G.; Wu, X.; Chen, Z.; Albanese, S. Application of Compositional Data Analysis in Geochemical Exploration for Concealed Deposits: A Case Study of Ashele Copper-Zinc Deposit, Xinjiang, China. Appl. Geochem. 2021, 130, 104997. [Google Scholar] [CrossRef] [Scilit]
  15. Kang, M.; Ma, M.H. Research on the Application of the Chim Method in the Regional Exploration Stage—Taking the Jinwozi Gold Mining Area in Xinjiang as an Example. Gold Sci. Technol. 2008, 16, 6. [Google Scholar]
  16. Wang, G.; Luo, X.; Shan, J.; Tang, B.; Shi, S. Ground Electrochemical Method for Searching Hidden Gold Deposits in Quaternary Sedimentary Cover Areas: A Case Study from Fengyang Area, Anhui Province. J. Guilin Univ. Technol. 2010, 30, 52–55. [Google Scholar]
  17. Pi, Q.; Lu, D.; Yang, X.; Yu, H. The Occurrence and Enrichment of Scattered Indium: A Case Study of Dachang Ore Field in Guangxi, China. Earth Sci. 2019, 8, 303. [Google Scholar] [CrossRef] [Scilit]
  18. Wu, J.; Li, Z.; Zhu, M.; Huang, W.; Liao, J.; Zhang, J.; Liang, H. Genesis of the Beixiang Sb-Pb-Zn-Sn Deposit and Polymetallic Enrichment of the Danchi Sn-Polymetallic Ore Belt in Guangxi, SW China. Minerals 2022, 12, 1349. [Google Scholar] [CrossRef] [Scilit]
  19. Xiao, C.H.; Chen, Z.L.; Liu, X.C.; Wei, C.S.; Wu, Y.; Tang, Y.W.; Wang, X.Y. Structural Analysis, Mineralogy, and Cassiterite U–Pb Ages of the Wuxu Sb-Zn-Polymetallic District, Danchi Fold-and-Thrust Belt, South China. Ore Geol. Rev. J. Compr. Stud. Ore Genes. Ore Explor. 2022, 150, 105150. [Google Scholar] [CrossRef] [Scilit]
  20. Yu, Q.; Liu, W.; Ding, R.; Hu, Q.; Zhou, S. Geochemical Characteristics and Prospecting Prediction of the Huodong Zinc Mine in Guangxi. Miner. Explor. 2017, 8, 894–901. [Google Scholar]
  21. Liu, W.; Huang, L.; Ding, R.; Xu, W.; Hu, Q.; Zhou, S.; Zhao, Y. Comprehensive Information-based Prospecting Model for the Arrowzhuopu Sb-Precious Metal Deposit in the Wufeng Mining Field, Guangxi. China Geol. 2022, 49, 1250–1261. [Google Scholar]
  22. Zhang, J.; Huang, W.; Liang, H.; Wu, J.; Chen, X. Genesis of the Jianzhupo Sb–Pb–Zn–Ag Deposit and Formation of an Ore Shoot in the Wuxu Ore Field, Guangxi, South China. Ore Geol. Rev. 2018, 102, 654–665. [Google Scholar] [CrossRef] [Scilit]
  23. Wu, Y.; Yang, Z.; Zhou, C.; Gao, L.; Song, W.; Li, Q.; Zhang, Y.; Wen, H.; Zhu, C. LA–ICP–MS Analysis of Sulfides from the Jianzhupo Deposit, Guangxi Province, China: Insights into Element Incorporation Mechanisms and Ore Genesis. Ore Geol. Rev. 2023, 161, 105628. [Google Scholar] [CrossRef] [Scilit]
  24. Zhang, Y.; Xiao, C.-H.; Wei, C.-S.; Yu, S.-Q. Fluid Evolution and Mineralizing Process of the Bawang Fe-Zn-Sn Deposit, Danchi Fold-and-Thrust Belt, South China. Ore Geol. Rev. 2023, 163, 105772. [Google Scholar] [CrossRef] [Scilit]
  25. Yang, Q.; Gao, W.; Luo, X.; Liu, P.; Liang, M.; Liu, Y.; Shi, J.; Sun, Y. Geochemical Characteristics and Prospecting Prediction of a Multi-metallic Ore Deposit in the Southeastern Part of Laos. Geol. Explor. 2022, 58, 1128–1138. [Google Scholar]
  26. Jiang, Y.; Wen, M.; Sun, Y.; Liu, P.; Ma, Y.; Zhang, C.; Zhang, X. Effectiveness and Remediation Mechanisms of Geo-Electrochemical Technology for Arsenic Removal in Paddy Soil from Northern Guangxi. Toxics 2025, 13, 728. [Google Scholar] [CrossRef] [Scilit] [PubMed]
  27. Wei, Q.; Xianrong, L.; Shuyue, H.E. Comparative Study between the Geo-Electrochemical Method and Other Geo-Chemical Exploration Methods. Gold Sci. Technol. 2011, 19, 7–11. [Google Scholar]
  28. Sivenas, P.; Beales, F.W. Natural Geobatteries Associated with Sulphide Ore Deposits, II. Field Studies at the Viburnum Trend, Southeast Missouri, U.S.A. J. Geochem. Explor. 1982, 17, 145–160. [Google Scholar] [CrossRef] [Scilit]
  29. Ming, K.; Rong, L.X. Improvement and Applied Results of Geoelectrical Chemistry Methods. Geol. Prospect. 2003, 3, 5. [Google Scholar]
  30. Luo, X. Discussion on the Formation Mechanism of Anomalous Electrostatic Extraction of Ions. Geol. Explor. 1992, 50–52+58. Available online: https://kns.cnki.net/kcms2/article/abstract?v=zO3wb1M9ekyCjd5eenibHy5cDhfHO_-F7LSbQp2bDLeHyZQwPl1OmkZlpxpnvdUKm3He1Diq96BOXDxdk5RgHvuacvcB7qJVLiZ06Gf4kdMMHalpIYa0IZS2kJJ5SnPZSFrJeVr5dg-L-e-K0ekbPsU3lE5MeoiQIpc8u0IfV73nGwK-C2M2gQ==&uniplatform=NZKPT&language=CHS (accessed on 13 March 2026).
  31. Luo, X. Research on the Electrochemical Stratification Mechanism, Methods and Techniques, and Prospecting Applications. Doctoral Dissertation, Hefei University of Technology, Hefei, China, 2006. [Google Scholar] [CrossRef]
  32. Zhang, B.; Wang, X.; Han, Z.; Liu, H.; Liu, D.; Lu, Y.; Sun, B. Evidence of metal migration over concealed gold deposit in loess terrain and its prospecting significance. Appl. Geochem. 2022, 145, 105422. [Google Scholar] [CrossRef] [Scilit]
  33. Wang, Z.; Luo, X.; Wang, J.; Qiu, W.; Wang, G. Research on the Application of Electrochemical Geology Technology in Searching for Hidden Gold Mines in the Permafrost-covered Areas of the Qinghai-Xizang Plateau—Taking the Zha Jia Tong Niu Area in Qinghai Province as an Example. Mod. Min. 2012, 27, 50–52, 55. [Google Scholar]
  34. Cameron, E.M.; Hamilton, S.M.; Leybourne, M.I.; Hall, G.E.M.; McClenaghan, M.B. Finding Deeply Buried Deposits Using Geochemistry. Geochem. Explor. Environ. Anal. 2004, 4, 7–32. [Google Scholar] [CrossRef] [Scilit]
  35. Fan, S.; Wang, D.; Yang, B.; Ma, H.; Su, R.; Chen, L.; Su, P.; Hou, X.; Lv, H.; Xia, Z. Multivariate Statistical Analysis and S-a Multifractal Modeling of Lithogeochemical Data for Mineral Exploration: A Case Study from the Buerhantu Area, Hadamengou Gold Orefield, Inner Mongolia, China. Geosciences 2025, 15, 473. [Google Scholar] [CrossRef] [Scilit]
  36. Liu, W.; An, Y.; Hu, Q.; Zhou, S.; Li, L.; Tao, M. Analysis of Multi-stage Mineralization Characteristics of the Arrowzhuopu Lead-Zinc-Antimony Deposit in Wuxi Village, Hechi, Guangxi. Miner. Geol. 2015, 29, 215–220. [Google Scholar]
  37. Luo, Y.; Huang, Q.W. Geological Characteristics and Prospective Exploration of the Poping Sinter Zinc-Silver-Molybdenum Deposit in Hechi City, Guangxi. Geol. Surv. Res. 2009, 32, 41–47. [Google Scholar]
  38. Li, C.; Luo, X.; Tang, G.; Qiu, W.; Shang, Z.; Zhang, W.; Tang, R.; Sun, G. Geochemical Anomalies and Prospects for Mineral Exploration in Bajinbei Soil in Ejina Banner, Inner Mongolia. Geol. Explor. 2020, 56, 1170–1182. [Google Scholar]
  39. Zhao, Y.; Liang, Z.; Yin, Y.; Tang, Y.; Xu, L.; Huang, L.; Xu, W.; Kang, T.; Luo, D.; Wang, J. 3-D Spatial Distribution of Concealed Ore-Forming Granitoid Intrusion and Structures Determined by the CSAMT Survey of Wuxu Sb-Zn-Polymetallic Ore District, South China. Explor. Geophys. 2024, 55, 690–701. [Google Scholar] [CrossRef] [Scilit]
  40. Liu, J.; Chen, W.; Liu, Q. Sb-Bi Alloys and Ag-Cu-Pb-Sb-Bi Sulphosalts in the Jialong Cu-Sn Deposit in North Guangxi, South China. Minerals 2018, 8, 26. [Google Scholar] [CrossRef] [Scilit]
  41. Ryss, Y.; Goldberg, I. The Method of Partial Extraction of Metals (CHIM) for Exploration of Ore Deposits. Methods Tech. Explor. 1973, 84, 5–19. [Google Scholar]
  42. Rong, L.X.; Fa, Z.T. Feature and Forming Mechanism of Geo-Electrochemical Anomaly of the Hongqiling Copper-Nickel Deposit and Its Prediction, Jilin Province. J. Jiling Univ. 2004, 34, 304–308. [Google Scholar]
  43. Zhou, R.; Wu, J. Discriminating Geochemical Anomalies by Geological-Geochemical Method: A Case Study on Nagan Section of E’Dong Area in Wuxu Ore Field in Guangxi Province, China. Bulg. Chem. Commun. 2018, 49, 194–199. [Google Scholar]
  44. Smee, B.W. Laboratory and Field Evidence in Support of the Electrogeochemically Enhanced Migration of Ions through Glaciolacustrine Sediment. J. Geochem. Explor. 1983, 19, 277–304. [Google Scholar] [CrossRef] [Scilit]
  45. Goldberg, I.S. Vertical Migration of Elements from Mineral Deposits. J. Geochem. Explor. 1998, 61, 191–202. [Google Scholar] [CrossRef] [Scilit]
  46. Cheng, Y.S. Geological Characteristics of the Dafulou Tin–Polymetallic Sulfide Deposits in Guangxi, South China. Adv. Mater. Res. 2012, 455–456, 1350–1355. [Google Scholar] [CrossRef] [Scilit]
  47. Yang, J.; Li, D.; Zhang, D.; Li, S.; Li, X.; Lu, X. Geochemical Characteristics of Indicator Elements and Prospecting Criteria for the Danchi Polymetallic Mineralized Belt of the Dachang Tin Field. In Geology of Tin Deposits in Asia and the Pacific; Hutchison, C.S., Ed.; Springer: Berlin/Heidelberg, Germany, 1988; pp. 339–350. ISBN 978-3-642-72767-2. [Google Scholar]
  48. Peng, Z.; Watanabe, M.; Hoshino, K. Overview of Tin-Bearing Polymetallic Mineralization in the Dachang Ore Field, Guangxi, China. Shigen-Chishitsu 1997, 47, 331–340. [Google Scholar] [CrossRef]
  49. Tanelli, G.; Lattanzi, P. The Cassiterite-Polymetallic Sulfide Deposits of Dachang (Guangxi, People’s Republic of China). Miner. Depos. 1985, 20, 102–106. [Google Scholar] [CrossRef] [Scilit]
  50. Beus, A.; Grigorian, S.V. Geochemical Exploration Methods for Mineral Deposits. 1977. Available online: https://www.researchgate.net/publication/236538915_Geochemical_Exploration_Methods_for_Mineral_Deposits (accessed on 13 March 2026).
  51. Luo, X. Research and Effects of Various New Methods for Discovering Concealed Minerals. Geol. Explor. 1995, 44–49. Available online: https://kns.cnki.net/kcms2/article/abstract?v=zO3wb1M9ekwk1HyVbAtHvFe9XVuZGCG0TUg4pr1dVCen29FYt73HVBGhc-_fkqzAbomY6sfgVBg_PjK6C8MmclN0xWMbpOp_KAZpfmXcxgvLCuqxN0giCkOYkVHwrBNOeMLqcygKCARXjTmZa9pivfLrN7W3e_QeU_ywlzoiDCIJhWZ7TRYZqg==&uniplatform=NZKPT&language=CHS (accessed on 13 March 2026).
  52. Petersen, U. Geochemistry of Hydrothermal Ore Deposits. J. Geol. 1968, 76, 606. [Google Scholar] [CrossRef] [Scilit]
  53. Luo, X. On the Formation Mechanism of the Electrical Extraction Ion Anomalies. Geol. Prospect. 1992. [Google Scholar]
  54. Zhang, X.; Wen, M.; Luo, Q.; Ma, Y.; Jiang, Y.; Jiang, Y.; Ye, W.; Zhang, J. Research on the Prediction of Concealed Uranium Deposits Using Geo-Electrochemical Integrated Technology in the Guangzitian Area, Northern Guangxi, China. Appl. Sci. 2025, 15, 7426. [Google Scholar] [CrossRef] [Scilit]
  55. Closs, L.G. Introduction to Exploration Geochemistry. Earth Sci. Rev. 1980, 16, 373–374. [Google Scholar] [CrossRef] [Scilit]
  56. Turcotte, D.L. A Fractal Approach to the Relationship between Ore Grade and Tonnage. Econ. Geol. 1986, 81, 1528–1532. [Google Scholar] [CrossRef] [Scilit]
  57. Cheng, Q.; Agterberg, F.P.; Ballantyne, S.B. The Separation of Geochemical Anomalies from Background by Fractal Methods. J. Geochem. Explor. 1994, 51, 109–130. [Google Scholar] [CrossRef] [Scilit]
  58. Daya, A.A.; Afzal, P. A Comparative Study of Concentration-Area (C-a) and Spectrum-Area (S-a) Fractal Models for Separating Geochemical Anomalies in Shorabhaji Region, NW Iran. Arab. J. Geosci. 2015, 8, 8263–8275. [Google Scholar] [CrossRef] [Scilit]
  59. Zhang, C. Discussion on the Structural Stress Field Division and Force Source of the Wufeng Mining Area in Hechi, Guangxi. Guangxi Geol. 2000, 7–10. [Google Scholar]
  60. Hu, Q.; Hao, B.; Liu, W.; Xu, W. Analysis of Metallogenic Geological Characteristics and Prospecting Potential of Lead-Zinc-Antimony Multi-metallic Ore Deposit in Wuxui Mining Field, Hechi, Guangxi. Miner. Geol. 2020, 34, 666–672, 709. [Google Scholar] [CrossRef]
  61. Tan, J.; Xu, W.; Zhao, Y.; Luo, D.; Zhao, J.; Zhong, Y.; Tao, M. Metallogenic Model and Prospecting Prediction of Multi-metallic Minerals in Wuxui Mining Field, Guangxi. Chin. Min. Ind. 2024, 33, 508–514. [Google Scholar]
  62. Zhao, Y.; Huang, L.; Tang, Y.; Wang, J.; Wu, X.; Liu, W. Exploration and Prospecting Prediction of Hidden Rock Bodies in the Deep Part of the Wuxui Antimony-Polymetallic Ore Field. Miner. Geol. 2020, 34, 109–114. [Google Scholar] [CrossRef]
Figure 2. Layout of the electro-geochemical integrated technology survey lines in the Bancai mining area. 1—Upper Section of the Luofu Formation of the Middle Devonian, 2—Middle Section of the Luofu Formation of the Middle Devonian, 3—Lower Section of the Luofu Formation of the Middle Devonian, 4—Fourth Section of the Tangding Formation of the Middle Devonian, 5—Third Section of the Tangding Formation of the Middle Devonian, 6—Second Section of the Tangding Formation of the Middle Devonian, 7—stratigraphic boundary, 8—measured faults, 9—calcite veins, 10—place names, 11—schematic diagram of electro-geochemical survey layout, 12—scope of the study area.
Minerals 16 00314 g002
Figure 3. Schematic illustration of the electro-geochemical system setup [26].
Minerals 16 00314 g003
Figure 4. Geological Cross-Section of A4 Exploration Line.
Minerals 16 00314 g004
Figure 5. Cluster Analysis Phylogenetic Tree for Region A, Type R.
Minerals 16 00314 g005
Figure 6. Comprehensive overview of characteristics of electro-geochemical extraction in the observed A4 section in the Bancai mining area.
Minerals 16 00314 g006
Figure 7. Geological–electro-geochemical prospecting model diagram.
Minerals 16 00314 g007
Figure 8. Correlation coefficient matrix.
Minerals 16 00314 g008
Figure 9. Cluster Analysis Phylogenetic Tree for Cluster R in Zone B.
Minerals 16 00314 g009
Figure 10. Elemental Content-Area Fractal Diagram.
Minerals 16 00314 g010
Figure 11. Map of major ore-forming element anomalies. 1–Middle Section of Luofu Formation, 2—Lower Section of Luofu Formation, 3—Fourth Section of Tangding Formation, 4—Third Section of Tangding Formation, 5—Second Section of Tangding Formation, 6—stratigraphic boundary, 7—measured reverse fault and its number, 8—calcite vein outcrop, 9—schematic diagram of electro-geochemical survey layout, 10—inner anomaly zone, 11—middle anomaly zone, 12—outer anomaly zone, 13—place name.
Minerals 16 00314 g011
Figure 12. Anomalous element combinations in the Bancai mining area. 1—Middle Section of Luofu Formation, 2—Lower Section of Luofu Formation, 3—Fourth Section of Tangding Formation, 4—Third Section of Tangding Formation, 5—Second Section of Tangding Formation, 6—stratigraphic boundary, 7—measured reverse fault and its number, 8—calcite vein outcrop, 9—schematic diagram of electro-geochemical survey layout, 10—inner anomaly zone, 11—middle anomaly zone, 12—outer anomaly zone, 13—place name.
Minerals 16 00314 g012
Figure 13. Anomaly overlay map and predicted prospecting target areas. 1—Middle Section of the Luofu Formation, 2—Lower Section of the Luofu Formation, 3—Fourth Section of the Tangding Formation, 4—Third Section of the Tangding Formation, 5—Second Section of the Tangding Formation, 6—stratigraphic boundary, 7—measured reverse faults and their numbers, 8—calcite vein outcrops, 9—F1 (Ag–Cd–Pb–Zn) Element Factor Anomaly, 10—F2 (As–Sb) Element Factor Anomaly, 11—F3 (Hg) Element Factor Anomaly, 12—F4 (Mo) Element Factor Anomaly, 13—Geophysical Extraction Survey Grid Layout, 14—place names.
Minerals 16 00314 g013
Table 1. Orthogonal Rotation Factor Load Matrix and Cumulative Factor Variance Contribution for Zone A.
ElementsF1F2F3F4
Ag0.6330.8300.0500.198
As0.6000.5000.6290.087
Cd0.9640.3520.1530.185
Hg0.1220.8840.3170.229
Mo0.1230.214−0.160.996
Pb0.5100.6550.3640.284
Sb0.1170.2350.962−0.13
Zn0.9810.2950.1440.115
variance contribution rate/%45.92615.81414.2209.613
cumulative variance contribution rate/%45.92661.74075.96085.574
Table 2. Orthogonal Rotation Factor Load Matrix and Cumulative Factor Variance Contribution for Zone B.
ElementsF1F2F3F4
Ag0.6550.3290.321−0.147
As0.1130.916−0.0010.161
Cd0.9320.132−0.0280.148
Hg0.0120.0140.9760.064
Mo0.1300.1640.0160.959
Pb0.8750.2620.0550.120
Sb0.4730.757−0.0350.070
Zn0.9260.1250.1440.088
variance contribution rate/%39.69220.60213.29912.741
cumulative variance contribution rate/%39.69260.29473.59386.334
Table 3. Elemental Fractal Statistics.
ElementFractal DimensionLn (C1)T
D1D2D3
Ag1.7081.0690.9283.99454.288
Pb1.1391.7621.5751.6415.160
As0.1961.6531.666−1.1110.329
Sb0.3731.4150.000−2.1660.115
Zn2.2480.9570.5073.78143.866
Cd0.0241.2020.4474.43984.666
Hg0.0291.0252.194−3.4230.033
Mo0.4712.4636.408−2.2100.110
Disclaimer/Publisher’s Note: The statements, opinions and data contained in all publications are solely those of the individual author(s) and contributor(s) and not of MDPI and/or the editor(s). MDPI and/or the editor(s) disclaim responsibility for any injury to people or property resulting from any ideas, methods, instructions or products referred to in the content.